
Submitted:
28 May 2025
Posted:
28 May 2025
You are already at the latest version
Abstract
This study proposes a vision-based framework to support autonomous vehicles (AVs) in maintaining stable lane-keeping by assessing the condition of lane markings. Unlike existing infrastructure standards focused on human visibility, this study addresses the need for criteria suited to sensor-based AV environments. Using real driving data from urban expressways in Seoul, a YOLOv5-based lane detection algorithm was developed and enhanced through multi-label annotation and data augmentation. The model achieved a mean average precision (mAP) of 97.4% and demonstrated strong generalization on external datasets such as KITTI and TuSimple. For lane condition assessment, a pixel occupancy–based method was applied, combined with Canny edge detection and morphological operations. A threshold of 80%-pixel occupancy was used to classify lanes as intact or worn. The proposed framework reliably detected lane degradation under various road and lighting conditions. These results suggest that quantitative, image-based indicators can complement traditional standards and guide AV-oriented infrastructure policy. Limitations include lack of adverse weather data and dataset-specific threshold sensitivity.
Keywords:
Maintenance Standards
; Lane Identification and Assessment
; Lane Degradation Evaluation
; Pixel Occupancy
; Framework
1. Introduction
Roads, as one of the core components of transportation infrastructure, play a critical role in enabling spatial mobility necessary for human socio-economic activities and thus contribute significantly to societal development and economic growth [1]. Due to the frequent movement of vehicles and pedestrians on roads, various facilities—such as traffic control devices and highway safety installations—are implemented to ensure efficient traffic flow and to minimize social losses caused by traffic crashes. To ensure these facilities function properly and fulfill their intended purpose, most countries have established national and/or local government standards that prescribe installation methods and maintenance procedures. Road authorities are responsible for the construction and management of roadways in accordance with these standards.
Current standards for the installation of roadway facilities have primarily been established to ensure that human drivers of conventional vehicles can perceive roadway conditions and respond safely while driving. In other words, these standards were formulated under the assumption that human drivers are directly operating the vehicle. However, the rapid advancement of autonomous driving technologies presents new challenges to the traditional systems of installation and maintenance of roadway infrastructure. Given that autonomous vehicles (AVs) rely on a wide range of sensors and artificial intelligence technologies to perceive the road environment and make driving decisions without human intervention, future roadway facility standards may need to adopt a fundamentally different approach that aligns with the autonomous driving environment [2]. For example, one of the key functions of autonomous driving, the Lane Keeping Assistance System (LKAS), enables vehicles to maintain lane position without driver intervention by recognizing lane markings through on-board devices such as cameras and LiDAR sensors [3,4,5]. For such functionality to operate properly, the shape and condition of the lane markings must be well-maintained. Otherwise, the autonomous vehicle (AV) may fail to recognize the lane accurately, increasing the risk of unintentional lane departure and subsequent collisions with surrounding vehicles or roadside facilities.
However, current standards for the installation of longitudinal pavement markings are primarily based on retroreflectivity performance, which is intended to ensure nighttime visibility for human drivers under manual driving conditions [6]. Thus, whether these standards are appropriate for autonomous driving environments remains uncertain. According to prior research, a significant portion of disengagement cases in Advanced Driver Assistance Systems (ADAS) has been attributed to environmental factors, such as degraded lane markings [7]. Given that autonomous vehicles (AVs) rely on onboard sensors to recognize the shape of lane markings to identify the traveled way, it can be argued that, in autonomous environments, the shape of the markings is more critical than their visibility. Therefore, lane marking installation and maintenance standards for AVs should incorporate criteria regarding lane shape in addition to retroreflectivity performance. However, no formal research has yet addressed this issue.
Numerous studies have been conducted to improve the lane detection capabilities of autonomous vehicles (AVs), which are essential for the proper functioning of autonomous driving systems [8,9]. However, most of these efforts have focused on enhancing the lane recognition performance of the vehicle itself. Given that lane departure accidents still occur, it is difficult to conclude that AV technology has yet reached a level of complete reliability. Therefore, the realization of a fully autonomous driving environment—capable of standalone operation—will require not only advances in vehicle-based technologies but also concurrent support from road infrastructure systems.
This study aims to advance autonomous driving by providing infrastructural support that helps vehicles maintain lane positioning more reliably. It focuses on developing a digital image analysis–based method to quantitatively assess whether the condition of road lane markings affects AV operations. The proposed framework integrates two core algorithms: one for identifying lane markings among various pavement markings, and another for determining whether they are degraded (faded or not). Unlike prior work, degradation is assessed using a quantitative threshold based on pixel occupancy, offering a more objective criterion. The findings are expected to inform future installation standards that account for both retroreflectivity and geometric integrity.
This article is a revised and expanded version of a paper titled “Development of a Lane Identification and Assessment Framework for Maintenance Using AI Techniques”, presented at the 16th ITS European Congress, Seville, Spain, 19–21 May 2025 [10].
2. Literature Review
Research on lane markings can largely be categorized into two major objectives: improving lane detection accuracy and evaluating lane degradation. Studies targeting detection accuracy mainly focus on precise identification and tracking of lane markers. A real-time lane modeling and tracking method using distance transform techniques has shown reliable performance in relatively simple urban environments [11].
Among CNN-based approaches, a representative example is the end-to-end learning method for autonomous driving, in which steering angles are predicted directly from road images to maintain lane position [12]. Another study introduced a Spatial CNN that not only recognizes lane markers but also contributes to scene understanding [13]. A combined method using CNN and RANSAC was proposed to improve the robustness of lane detection [14], while a deep learning model based on OverFeat showed effective recognition of lanes and vehicles in highway environments [15]. These studies primarily focused on improving detection accuracy and achieving real-time performance. The YOLO (You Only Look Once) algorithm, developed by Redmon et al., provides real-time object detection and has been widely used in autonomous driving applications [16]. Roy and Bhaduri proposed a YOLOv5 model with a transformer-based head to classify damaged and intact lane markings using improved augmentation techniques [17]. Swain and Tripathy further extended YOLO techniques to detect lanes in complex multi-lane environments under diverse conditions [18].
Studies focusing on assessing lane degradation have increasingly adopted segmentation-based models, which are critical in this domain. For example, an encoder–decoder architecture using DeepLabv3+ has been proposed to analyze lane markings at the pixel level and evaluate their deterioration [19]. A semantic segmentation method based on generative adversarial networks (GANs) has also been developed for lane detection tasks [20]. Furthermore, an instance segmentation approach demonstrated high accuracy in identifying lanes under complex conditions [21]. In addition, ENet, a lightweight segmentation network, was introduced to enable real-time detection [22].
However, most previous studies on lane maintenance have notable limitations. First, they did not provide a consistent, quantitative criterion for evaluating the condition of lane markings [19,20,21]. Second, it remains challenging to objectively assess degradation under complex road environments or various weather conditions [13,18,22]. Lastly, labeling-based damage assessments often reflect the subjective judgment of researchers, leading to inconsistency [15,17,21].
3. Data Preparation
3.1. Data Collection Equipment
To collect training data necessary for the development of lane identification and condition assessment algorithms, four main devices were utilized: cameras mounted both inside and outside the vehicle, an internal GPS system, and a mobile application.
Cameras were installed in two vehicles equipped with Level 2 to 2.5 autonomous driving features. An in-vehicle camera (Figure 1a) was used to collect data related to the operation status of the LKAS, as displayed on the vehicle’s instrument panel. Additionally, two external cameras were mounted on the vehicle roof (Figure 1c) to capture front and rear views during LKAS disengagement events. A mobile device equipped with an application (Figure 1b) was also installed inside the vehicle to record the GPS coordinates and reasons for LKAS disengagement.
3.2. Field Data Collection
Data were collected over a one-year period from October 2021 to October 2022 on seven major urban expressways in Seoul, South Korea, characterized by uninterrupted traffic flow. These included key corridors such as the Olympic Expressway (Olympic-daero), Riverside Expressway (Gangbyeonbuk-ro), Western Arterial Road (Seobu-gansun-ro), Eastern Arterial Road (Dongbu-gansun-ro), Inner Ring Road (Naebu-sunhwan-ro), Northern Arterial Road (Bukbu-gansun-ro), and Gangnam Circular Road (Gangnam Sunhwan-ro). During this period, a total of 896 driving sessions were conducted, resulting in an accumulated survey distance of 20,172 kilometers. Data collection was carried out under diverse traffic and environmental conditions, including morning and evening peak hours, nighttime periods, and adverse weather scenarios, to capture a comprehensive range of operational contexts.
3.3. Data Pre-Processing
Through field investigations, three distinct types of data were collected: (1) in-vehicle video footage capturing the status of LKAS disengagement, recorded via the camera installed inside the vehicle (refer to Figure 1a); (2) the reasons for autonomous driving disengagement, documented through a mobile application; and (3) forward-facing video footage recorded by an external camera mounted on the vehicle during the survey period (Figure 1c). To construct the training dataset, these heterogeneous data sources were synchronized based on date and time and subsequently merged into a unified dataset. Data integration was performed using the Python “pandas” library.
The primary objective of this study is to develop an algorithm that identifies lane markings among various objects in image data and determines whether the LKAS remains engaged based on the recognized lanes. To achieve this, images corresponding to LKAS disengagement moments were extracted from the integrated dataset and used as training samples. Extraction involved manually synchronizing timestamps between the LKAS disengagement database and recorded video footage, followed by frame selection at relevant time points. During the field survey, 1,595 LKAS disengagement events were recorded, of which 244 were related to lane detection issues. From these, segments where LKAS was disengaged for over one second were selected, and frames were extracted at 10 frames per second, yielding 330 images. The image extraction process is illustrated in Figure 2.
4. Framework Development and Validation
Figure 3 illustrates the overall workflow of the study, including data preparation, lane identification algorithm development, and lane condition assessment algorithm development. In this study, a YOLO-based object detection model was employed to detect lane markings and other roadway elements, and a methodology was proposed to evaluate the condition of identified lanes. The research process consists of three main stages: data preparation (Section I; see Chapter 3), development of the lane identification algorithm (Sections II–IV; addressed in Section 4.1), and development of the lane condition assessment algorithm (Section V; described in Section 4.2).
4.1. Lane Identification Algorithm Development
In the early phase of this study, a single-label annotation approach was applied for lane classification; however, the resulting model exhibited relatively low accuracy metrics. To address this limitation, a multi-label annotation method was introduced, which led to improved performance in both lane detection and classification, enabling more precise lane identification. According to previous research, the application of multi-label annotation can enhance the object differentiation capability of trained models compared to single-label methods [23]. This study incorporated that approach to more effectively distinguish lanes from other objects in the roadway environment.
Based on the experimental results, a refined labeling scheme was established to clearly distinguish lane markings from other roadway elements, as illustrated in Figure 4. The labeling criteria were designed to minimize confusion between lanes and other components on the road. Specifically, regions with white backgrounds containing text were labeled as “road markings,” those containing dashed lines were labeled as “safety zones,” regions with arrows were labeled as “arrows,” and areas that did not include any text, dashed lines, or arrows were labeled as “lanes.” This multi-labeling strategy was implemented to improve the reliability of lane detection and reduce false positives.
In the initial experiments, training the model using the originally labeled images resulted in relatively low accuracy metrics. To address this limitation, a multi-labeling technique was applied alongside data augmentation to improve the model’s robustness against various types of noise and environmental variations, prevent overfitting, and ensure consistent performance on new datasets. Similar effects have been observed in previous studies, where data augmentation was shown to effectively enhance the generalization capability of deep learning models [24].
Various data augmentation techniques—such as brightness adjustment, rotation, scaling, and random cropping—were applied to reflect diverse road conditions, increasing the training dataset to 3,304 images. Figure 5 shows sample outputs generated by the augmentation algorithm.
After the training image dataset was constructed, the lane identification algorithm based on YOLOv5 was designed with the structure shown in Figure 6. The algorithm follows a sequential process from input to output.
In the input stage, the trained images are fed into the model. In the backbone stage, the model generates an optimal weight file (best weight file) through training, while simultaneously evaluating performance metrics such as the confusion matrix, recall, precision, and object and class loss. In the neck stage, the verified best weight file is used to assess the lane detection accuracy on new images. The head stage utilizes the outputs from the neck to detect the type and location of lanes. Finally, in the output stage, the model produces the lane identification results, including lane classes and positional information.
The performance of object detection using the YOLOv5 algorithm was evaluated using standard metrics, including precision, recall, mean average precision (mAP), and intersection over union (IoU). Precision, as defined in Equation (1), measures the proportion of correctly predicted positive instances among all instances predicted as positive. Recall (Equation (2)) refers to the proportion of actual positive instances that were correctly identified by the model. The mean average precision, or mAP, defined in Equation (3), is the average of precision values across all levels of recall and is commonly interpreted as the area under the precision–recall curve. Finally, the model applies non-maximum suppression (NMS) based on intersection over union (IoU) to select the most accurate bounding box predictions. IoU, shown in Equation (4), quantifies the degree of overlap between the predicted bounding box and the ground truth.
Training was conducted in a high-performance computing environment equipped with a 13th-generation Intel® Core™ i9-13900HK processor and an NVIDIA GeForce RTX 4080 GPU. The dataset was split into 80% for training and 20% for validation. The XL model was trained for 100 epochs, with a confidence threshold set at 0.4 and an IoU threshold set at 0.45. As shown in Figure 7, the confusion matrix analysis indicated object recognition accuracy ranging from 93% to 100%. Additionally, both object and class loss rates were low, and the model achieved a mean average precision (mAP) of 97.4%, demonstrating excellent performance.
To evaluate the reliability of the training results, the performance of YOLOv5 was compared with that of CNN (ResNet34) and other YOLO versions. Figure 8 presents the confusion matrices for YOLOv5 and CNN (ResNet34) after additional training. YOLOv5 achieved the highest performance, with a recall of 94.0%, a precision of 98.3%, and a mean average precision (mAP) of 97.4%, demonstrating a significant improvement in model accuracy. Furthermore, YOLOv5 outperformed CNN (ResNet34), which achieved a precision of 97.0% and an mAP of 96.0%, with object recognition accuracy ranging from 43% to 99%. Additionally, YOLOv5 surpassed YOLOv10 in performance, suggesting that simpler algorithms may be more effective when working with smaller datasets.
4.2. Lane Assessment Algorithm Development
The YOLO algorithm is one of the most widely used computer vision techniques due to its lightweight architecture and fast, accurate object detection capabilities. However, as its primary focus lies in object detection and classification, it has limited capacity to quantitatively assess object condition, importance, or risk level. This limitation reduces its applicability in decision-making processes that require such evaluations. To address this issue, the present study proposes an extended lane evaluation algorithm based on the YOLO framework, which incorporates a quantitative assessment process and explicit evaluation criteria.
The proposed lane evaluation algorithm is built upon the previously developed lane identification algorithm, with an additional process integrated into the head section of the model to assess the degree of lane degradation. The structure of this algorithm is illustrated in Figure 9. The development of the lane evaluation algorithm includes three key steps: the implementation of image processing techniques, the establishment of quantitative indicators for distinguishing between intact and degraded lane markings, and the classification of each lane as either normal or worn.
To develop the image processing techniques, it was necessary to extract individual lane images from the training data. In the original training images, both intact and worn lane markings were labeled together with the background, requiring separation from surrounding visual elements. To address this, approximately 1,600 lane images containing background elements were extracted from the training dataset. The extraction process and resulting samples are presented in Figure 10.
In the lane condition verification process, different image processing techniques are applied depending on the condition of the lane markings. For intact lanes, edge-filling is performed to ensure continuity without gaps, followed by the calculation of pixel occupancy. In contrast, for degraded lanes, edge extraction, secondary Canny edge detection, and morphological operations are used to remove noise and restore the lane area before computing the pixel occupancy ratio. This process is illustrated in Figure 11.
Figure 12 shows the analysis results for intact and worn lane markings. In intact lanes, few internal pixels were detected in the first Canny edge detection, indicating good condition. In worn lanes, many internal pixels appeared initially but were removed through a second Canny detection and morphological operations, resulting in a low final pixel occupancy.
Figure 13 illustrates the pixel occupancy distribution for intact and worn lane markings, based on the lane evaluation algorithm shown in Figure 13. The analysis showed that intact lanes had pixel occupancy between 80.2% and 100.0%, while worn lanes ranged from 53.1% to 79.8%. Based on this, lanes with occupancy above 80% were classified as intact, and those below 80% as worn. This threshold enables a quantitative assessment of lane degradation and supports consistent evaluation across various road environments.
4.3. Performance Validation and Framework Development
To evaluate the generalization performance of the lane identification algorithm, accuracy was tested on new images. Six arterial road images were selected from each of the KITTI and TuSimple datasets. As shown in Figure 14, the average intersection-over-union (AIoU) ranged from 0.64 to 0.92, reflecting the accuracy of the predicted object locations.
Figure 15 presents the results of lane condition assessment. While most intact and worn lanes were accurately classified, several issues were identified. First, non-lane areas were occasionally misclassified as worn lanes. Second, lanes located farther from the image center were sometimes misclassified due to reduced resolution. Third, in twilight conditions, decreased brightness led to false identification of intact lanes as worn.
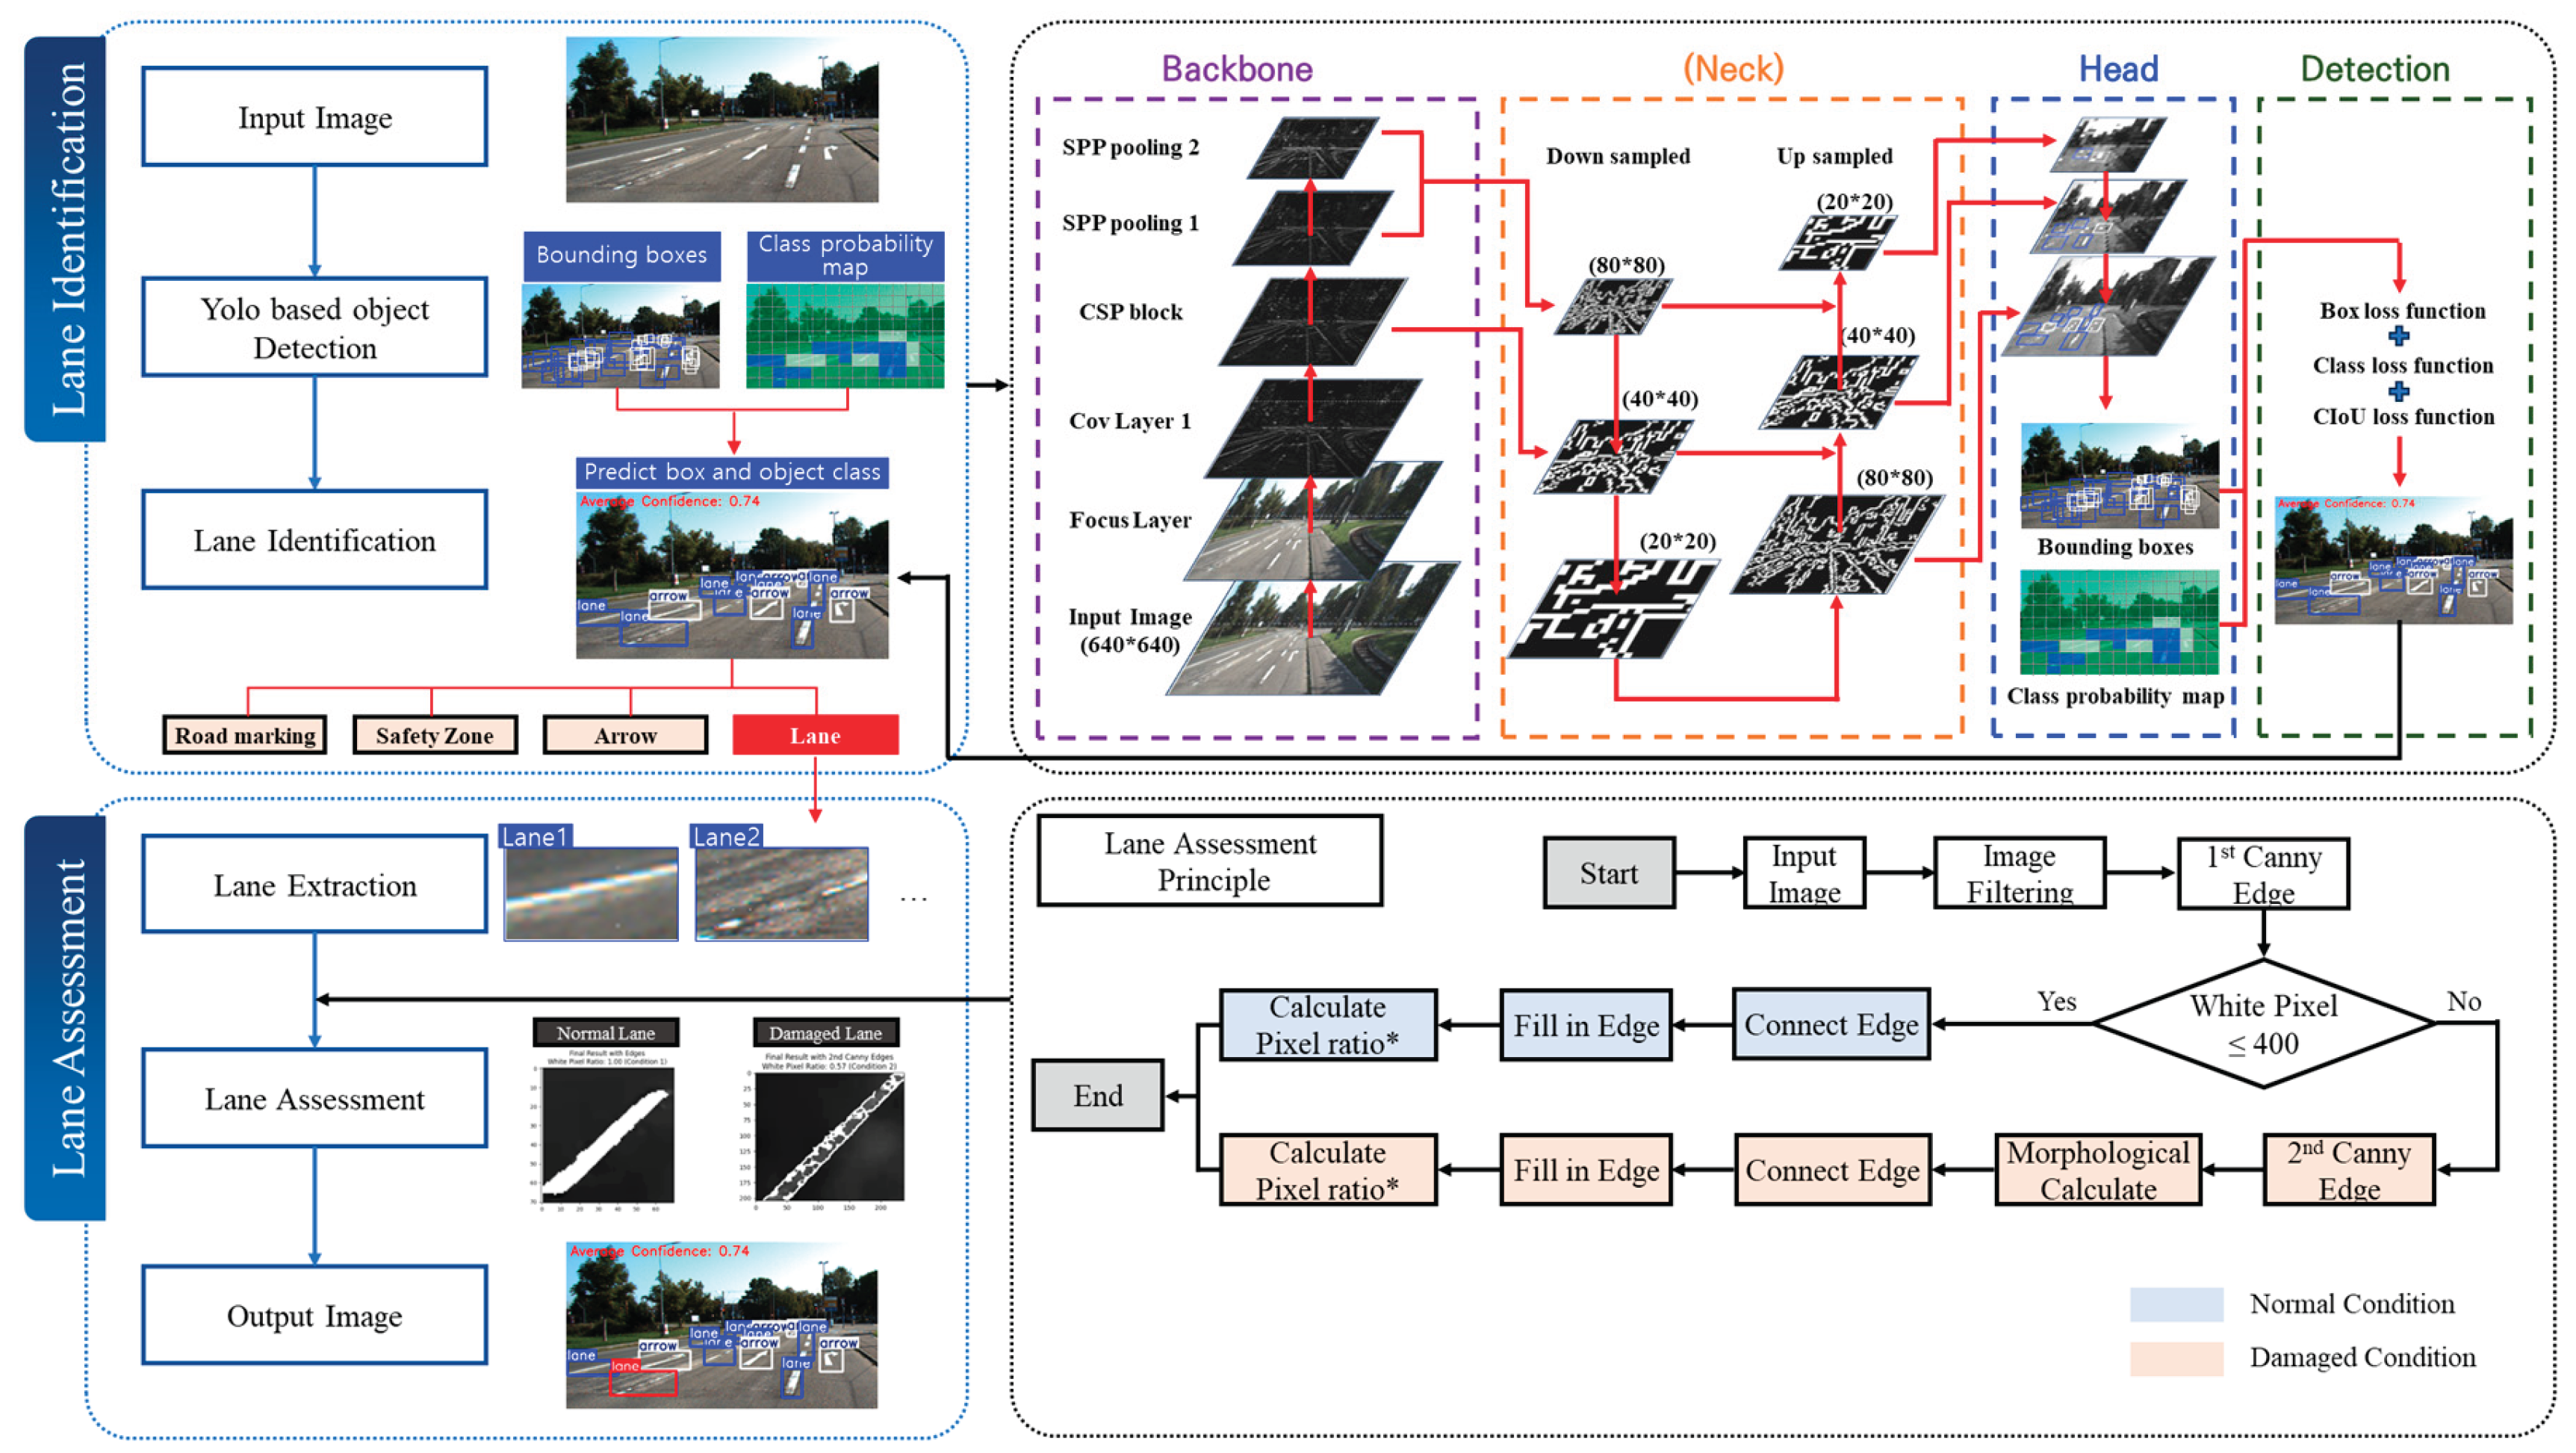
Figure 16 illustrates the structure of the lane identification and assessment framework developed in this study. The framework consists of two main stages: lane identification and lane assessment. In the identification stage, a YOLO-based object detection model is used to detect road elements, including lanes, from the input image and classify lane objects. In the assessment stage, each detected lane is individually analyzed. Pixel occupancy is calculated, and Canny edge detection along with morphological operations is applied to determine whether the lane is in a normal condition. This approach enables reliable lane detection and evaluation under diverse road conditions and generates an output image containing both the detected lanes and their condition status.
5. Conclusions
This study proposed a vision-based framework for lane identification and condition assessment to support the stable lane-keeping functionality of autonomous vehicles (AVs). Unlike conventional road standards focused on human perception and nighttime visibility, the proposed framework addresses the need for evaluation criteria suited to sensor-based AV driving environments by focusing on the geometric integrity of lane markings.
A YOLOv5-based lane detection algorithm was developed using real-world driving data collected from major urban expressways in Seoul. Multi-label annotation and data augmentation techniques were employed to enhance the model’s accuracy and generalization. The trained model achieved a mean average precision (mAP) of 97.4%, and its performance was validated on external datasets such as KITTI and TuSimple, confirming its robustness. Based on the detection results, a lane condition assessment algorithm was constructed using pixel occupancy analysis combined with edge and morphological operations. A threshold of 80%-pixel occupancy was introduced to distinguish between intact and worn lanes, and this criterion was shown to perform reliably under various road and lighting conditions.
The findings suggest that AI-based evaluation techniques can complement existing visibility-based standards and support the development of AV-compatible lane maintenance policies by providing quantitative, interpretable criteria. The framework is also applicable in real-world conditions, offering both technical feasibility and policy relevance.
However, several limitations should be noted. The training data were limited to urban expressways and typical day/night scenarios, lacking adverse weather or rural road conditions. Additionally, the 80%-pixel occupancy threshold was derived from the characteristics of the training dataset and may vary depending on lane material, color, and brightness contrast. Its generalizability should be validated with diverse datasets and environments.
Despite these constraints, the proposed framework provides a practical foundation for future infrastructure standards in autonomous driving. Continued research should focus on extending environmental diversity in the data and refining evaluation thresholds to ensure broader applicability and consistency.
Author Contributions
Conceptualization, D.K.; data curation, H.N. and J.K.; formal analysis, H.N.; methodology, H.N.; project administration, H.N.; supervision, H.N.; validation, H.N.; visualization, H.N.; writing—original draft preparation, H.N.; writing—review and editing, H.N., D.K., and C.L. All authors have read and agreed to the published version of the manuscript.
Funding
This research received no external funding.
Data Availability Statement
The data used to support the findings of this study are available from the corresponding author upon request.
Acknowledgments
Not applicable.
Conflicts of Interest
The authors declare no conflicts of interest.
References
- World Road Association (PIARC). The Contribution of Road Transport to Sustainability and Economic Development: A PIARC Special Project; World Road Association (PIARC): Nanterre, France, 2020. [Google Scholar]
- Grigorescu, S.; Trasnea, B.; Cocias, T.; Macesanu, G. A Survey of Deep Learning Techniques for Autonomous Driving. J. Field Robot. 2019, 37, 362–386. [Google Scholar] [CrossRef]
- Em, P.P.; Hossen, J.; Fitrian, I.; Wong, E.K. Vision-Based Lane Departure Warning Framework. Heliyon. 2019, 5, e02169. [Google Scholar] [CrossRef]
- Paek, D.; Kong, S.-H.; Wijaya, K.T. K-Lane: Lidar Lane Dataset and Benchmark for Urban Roads and Highways. arXiv. 2021, arXiv:2110.11048. https://arxiv.org/abs/2110.11048.
- Yadav, S.; Kumar, S.N.T.; Rajalakshmi, P. Vehicle Detection and Tracking Using Radar for Lane Keep Assist Systems. In Proceedings of the 2023 IEEE 97th Vehicular Technology Conference (VTC2023-Spring), Florence, Italy, 20–23 June 2023. [Google Scholar] [CrossRef]
- Federal Highway Administration (FHWA). Manual on Uniform Traffic Control Devices for Streets and Highways, 11th ed.; U.S. Department of Transportation: Washington, DC, USA, 2023. [Google Scholar]
- California Department of Motor Vehicles (DMV). Disengagement Reports; 2024. Available online: https://www.dmv.ca.gov/portal/vehicle-industry-services/autonomous-vehicles/disengagement-reports/ (accessed on 29 July 2024).
- Tang, J.; Li, S.; Liu, P. A Review of Lane Detection Methods Based on Deep Learning. Pattern Recognit. 2021, 111, 107623. [Google Scholar] [CrossRef]
- Mamun, A.A.; Ping, E.P.; Hossen, J.; Tahabilder, A.; Jahan, B. A Comprehensive Review on Lane Marking Detection Using Deep Neural Networks. Sensors. 2022, 22, 7682. [Google Scholar] [CrossRef] [PubMed]
- Na, H.; Kim, D.; Kang, J.; Lee, C. Development of a Lane Identification and Assessment Framework for Maintenance Using AI Techniques. In Proceedings of the 16th ITS European Congress, Seville, Spain, 19–21 May 2025. [Google Scholar]
- Aly, M. Real-Time Detection of Lane Markers in Urban Streets. In Proceedings of the 2008 IEEE Intelligent Vehicles Symposium, Eindhoven, The Netherlands, 4–6 June 2008; pp. 7–12. [Google Scholar]
- Bojarski, M.; Testa, D.; Dworakowski, D.; Firner, B.; Flepp, B.; Goyal, P.; Jackel, L.D.; Muller, U. End-to-End Learning for Self-Driving Cars. arXiv. 2016, arXiv:1604.07316. [Google Scholar] [CrossRef]
- Pan, X.; Shi, J.; Luo, P.; Wang, X.; Tang, X. Spatial As Deep: Spatial CNN for Traffic Scene Understanding. In Proceedings of the 32nd AAAI Conference on Artificial Intelligence, New Orleans, LA, USA, 2–7 February 2018. [Google Scholar]
- Kim, J.; Lee, M. Robust Lane Detection Based on Convolutional Neural Network and Random Sample Consensus. In Neural Information Processing: 21st International Conference, ICONIP 2014; Springer: Cham, Switzerland, 2014; pp. 454–461. [Google Scholar] [CrossRef]
- Huval, B.; Wang, T.; Tandon, S.; Kiske, J.; Song, W.; Pazhayampallil, J.; Andriluka, M.; Rajpurkar, P.; Migimatsu, T.; Cheng-Yue, R.; Mujica, F.; Coates, A.; Ng, A.Y. An Empirical Evaluation of Deep Learning on Highway Driving. arXiv. 2015, arXiv:1504.01716. [Google Scholar] [CrossRef]
- Redmon, J.; Divvala, S.; Girshick, R.; Farhadi, A. You Only Look Once: Unified, Real-Time Object Detection. In Proceedings of the IEEE Conference on Computer Vision and Pattern Recognition (CVPR), Las Vegas, NV, USA, 27–30 June 2016; pp. 779–788. [Google Scholar] [CrossRef]
- Roy, A.M.; Bhaduri, J. A Computer Vision Enabled Damage Detection Model with Improved YOLOv5 Based on Transformer Prediction Head. arXiv. 2023, arXiv:2303.04275. https://arxiv.org/abs/2303.04275.
- Swain, S.; Tripathy, A.K. Real-Time Lane Detection for Autonomous Vehicles Using YOLOv5 Segmentation Model. J. Auton. Veh. Technol. 2024, 12, 718–728. [Google Scholar]
- Chen, L.-C.; Papandreou, G.; Kokkinos, I.; Murphy, K.; Yuille, A.L. DeepLabv3+: Encoder-Decoder with Atrous Separable Convolution for Semantic Image Segmentation. In Proceedings of the European Conference on Computer Vision (ECCV), Munich, Germany, 8–14 September 2018; pp. 801–818. [Google Scholar] [CrossRef]
- Ghafoorian, M.; Nugteren, C.; Baka, N.; Booij, O.; Hofmann, M. EL-GAN: Embedding Loss Driven Generative Adversarial Networks for Lane Detection. arXiv. 2018, arXiv:1806.05525. https://arxiv.org/abs/1806.05525.
- Neven, D.; De Brabandere, B.; Georgoulis, S.; Proesmans, M.; Van Gool, L. Towards End-to-End Lane Detection: An Instance Segmentation Approach. Mach. Vis. Appl. 2018, 29, 1281–1293. [Google Scholar]
- Paszke, A.; Chaurasia, A.; Kim, S.; Culurciello, E. ENet: A Deep Neural Network Architecture for Real-Time Semantic Segmentation. arXiv. 2016, arXiv:1606.02147. https://arxiv.org/abs/1606.02147.
- Peng, J.; Bu, X.; Sun, M.; Zhang, Z.; Tan, T.; Yan, J. Large-Scale Object Detection in the Wild from Imbalanced Multi-Labels. arXiv. 2020, arXiv:2005.08455. [Google Scholar] [CrossRef]
- Yun, S.; Han, D.; Oh, S.J.; Chun, S.; Choe, J.; Yoo, Y. CutMix: Regularization Strategy to Train Strong Classifiers with Localizable Features. In Proceedings of the IEEE/CVF International Conference on Computer Vision (ICCV), Seoul, Republic of Korea, 27 October–2 November 2019; pp. 6022–6031. [Google Scholar] [CrossRef]
Figure 1.
Devices installed for data collection: (a) an in-vehicle camera used to capture the activation status of the LKAS; (b) a mobile application installed to record the GPS coordinates and reasons for LKAS disengagement; (c) external cameras mounted to capture front and rear views of the vehicle.
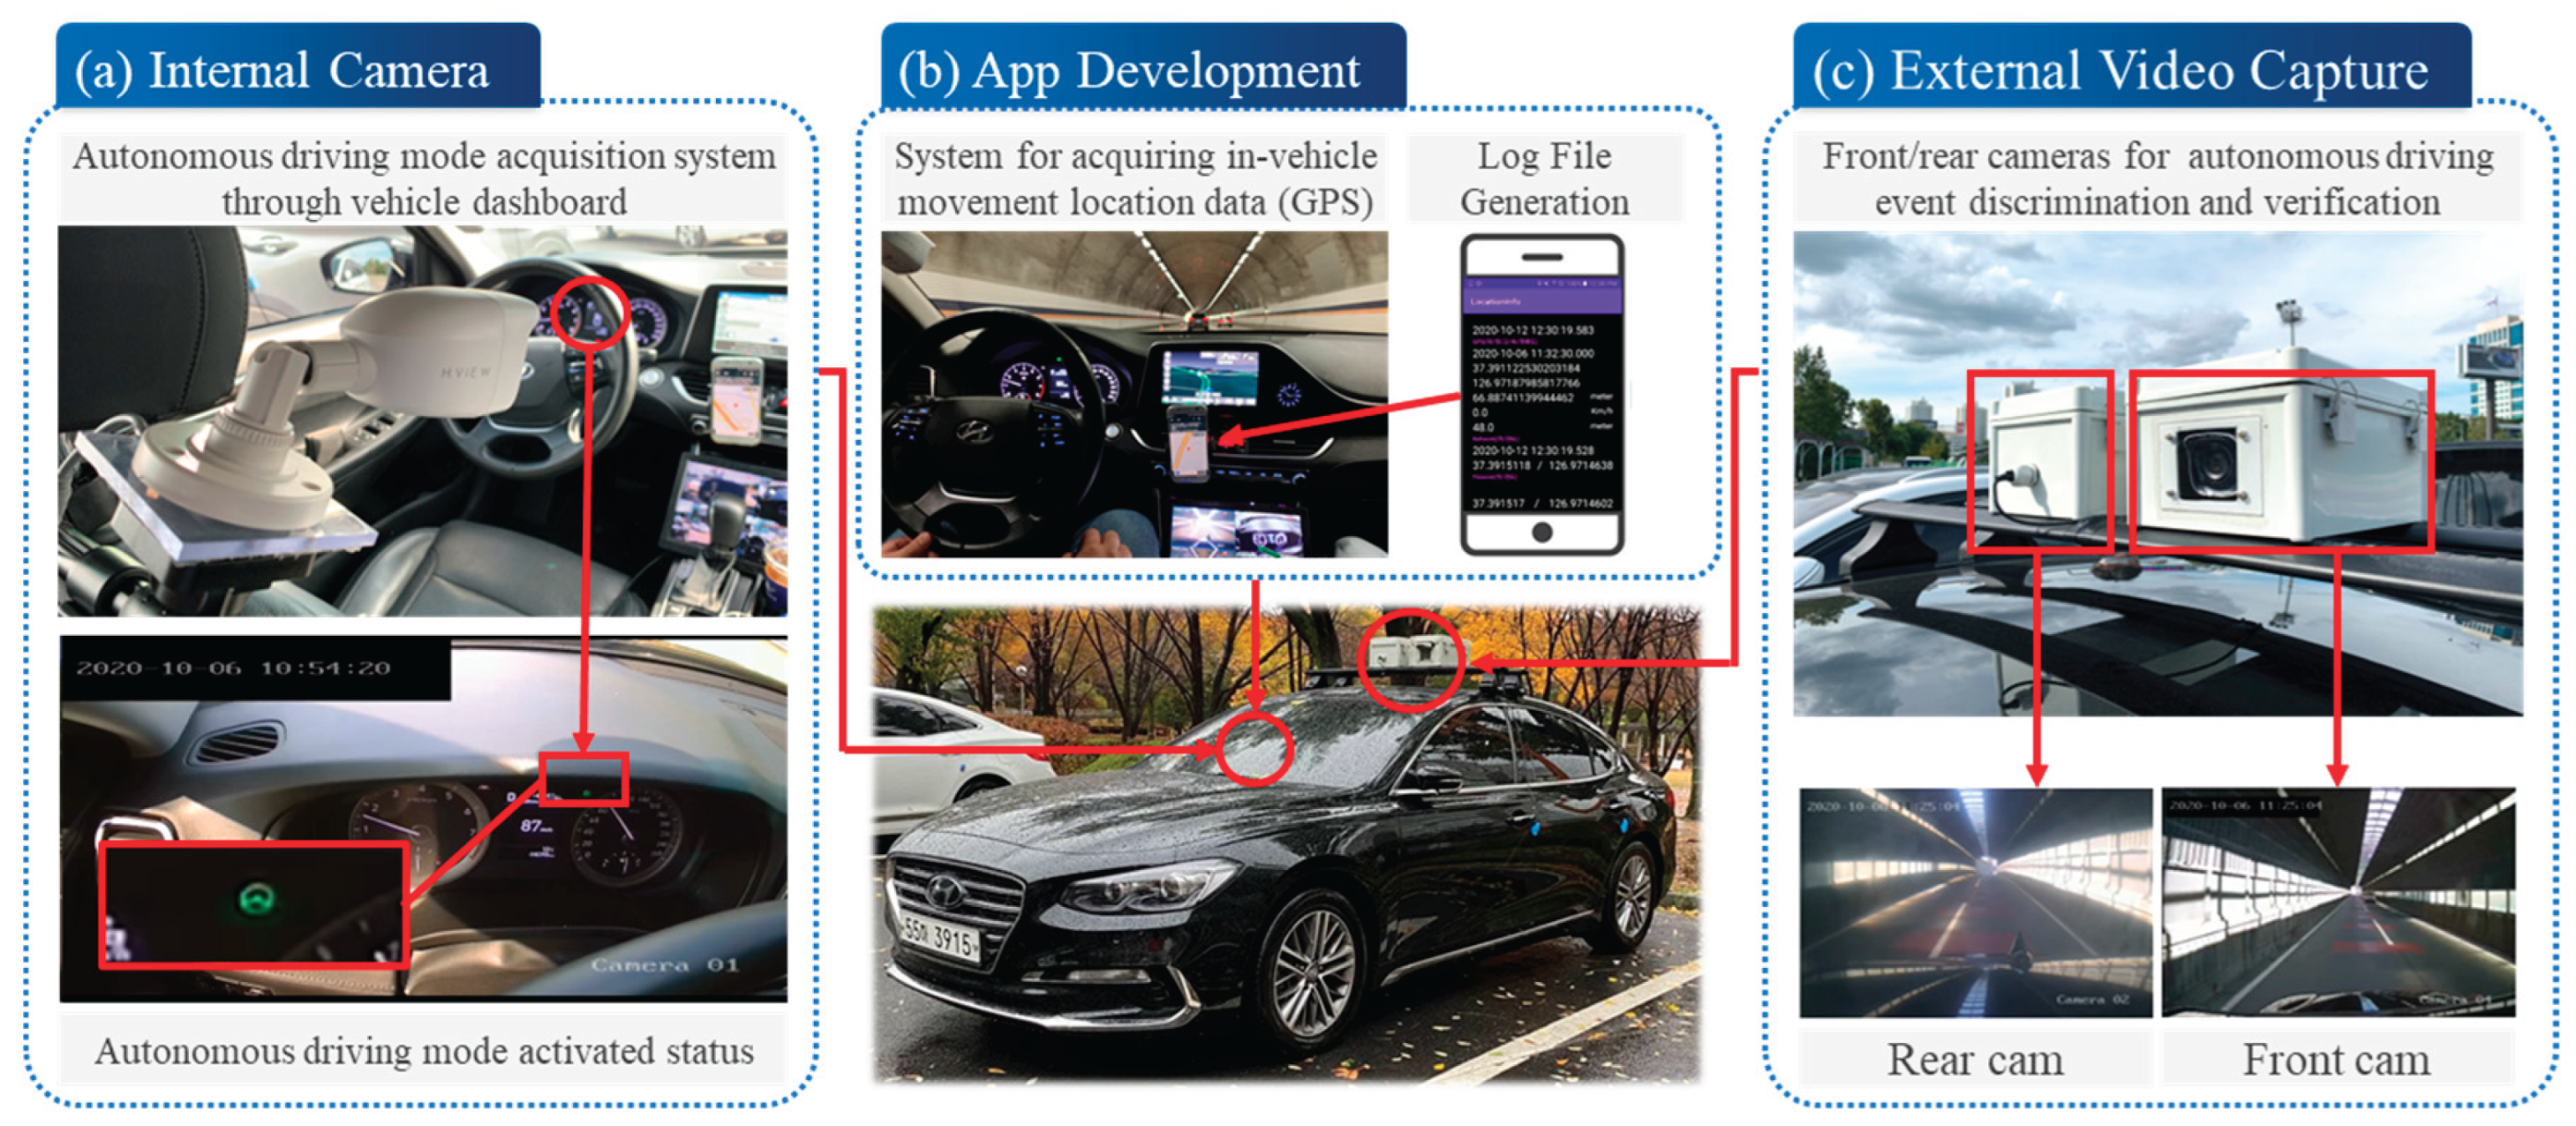
Figure 2.
Matched internal DB with external videos.
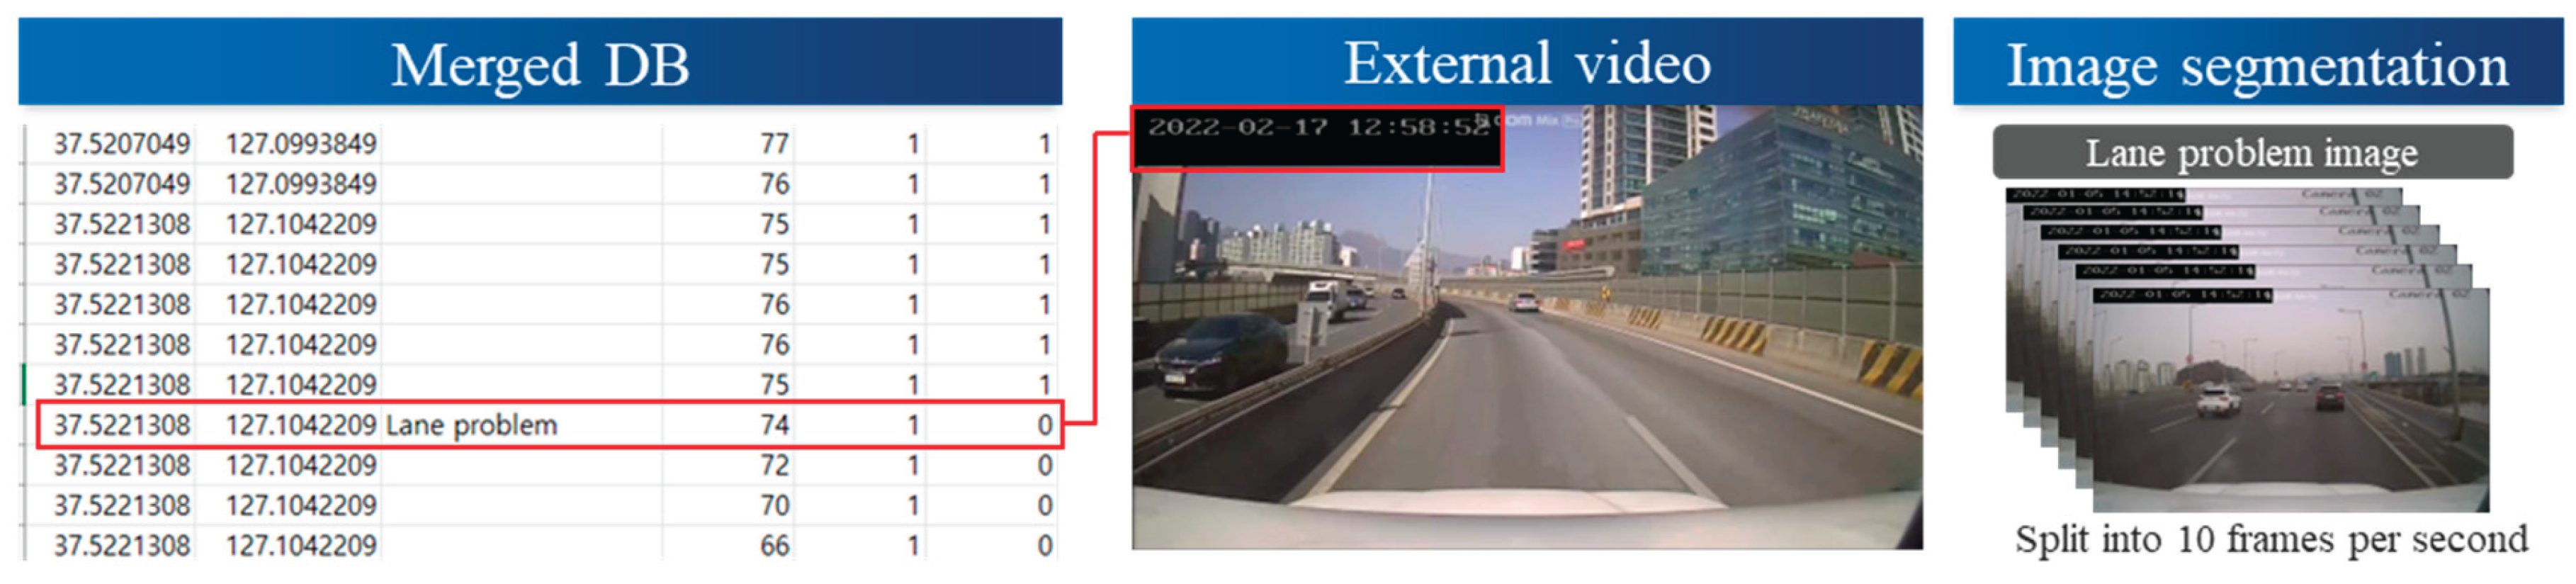
Figure 3.
YOLO-Based Lane Identification and Assessment Process.
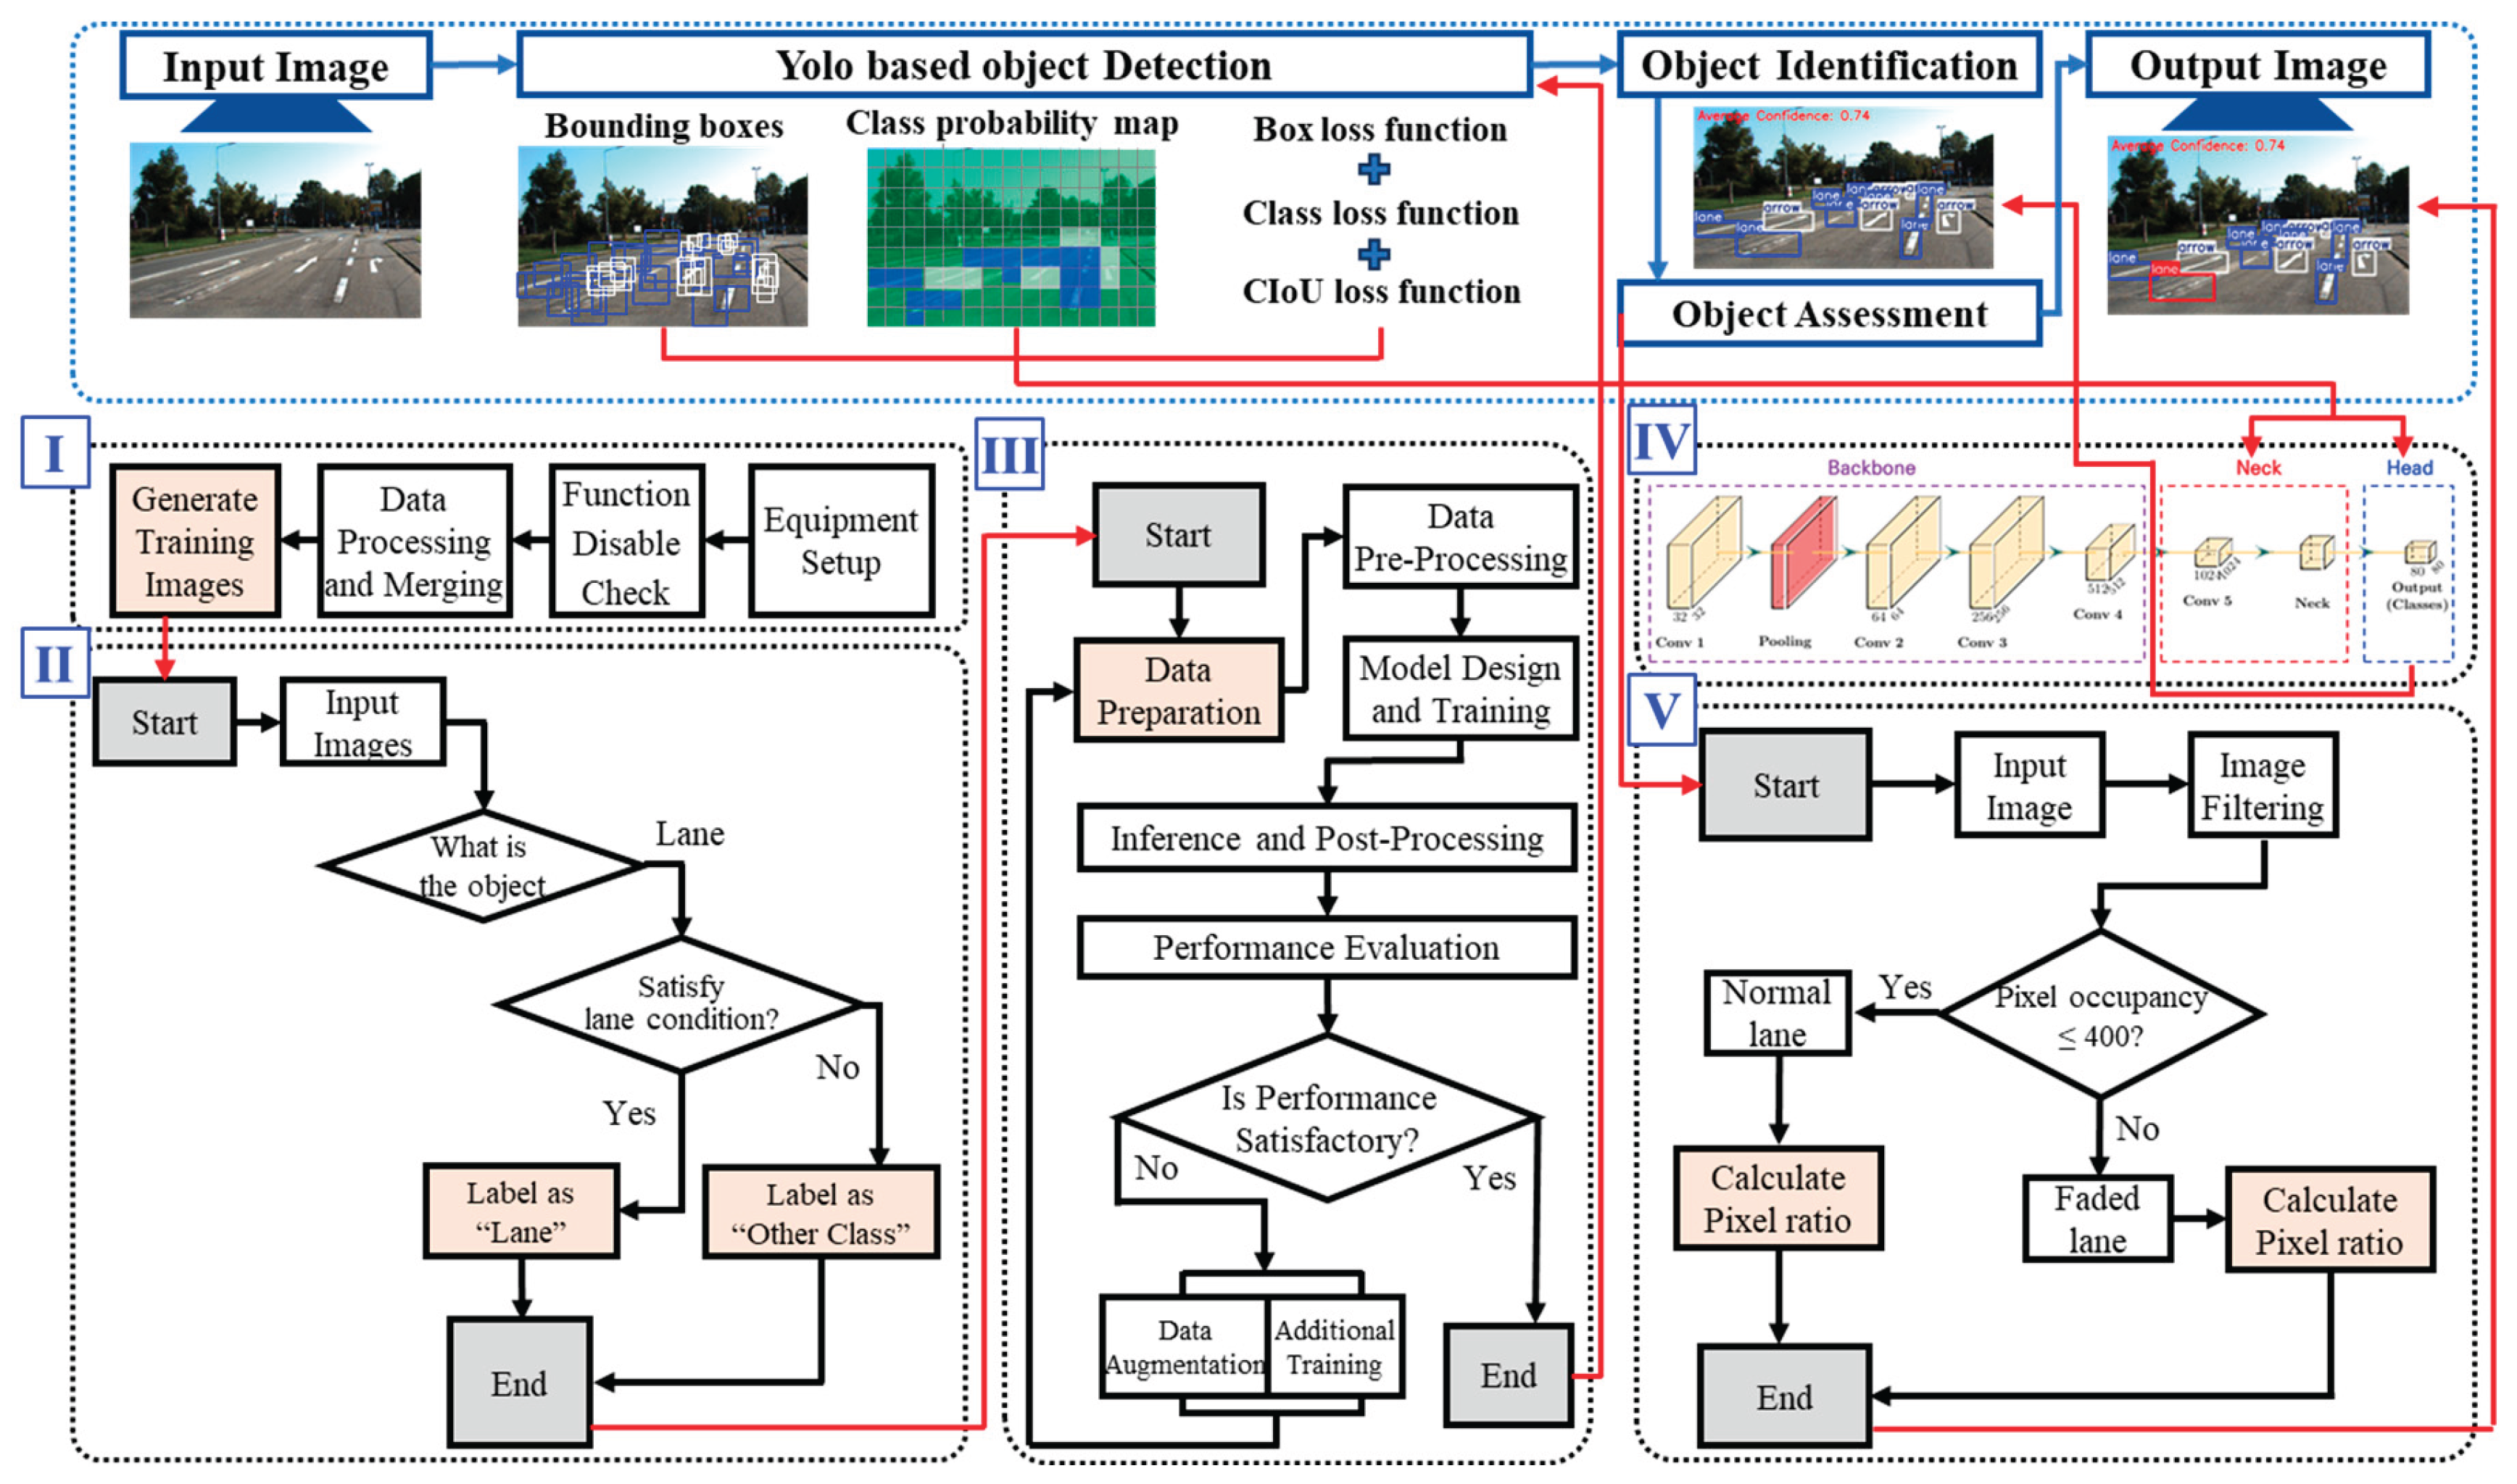
Figure 4.
Image’s Labeling Principle (Left) and Examples (Right)

Figure 5.
Data Augmentation Algorithm (Left) and Results (Right).
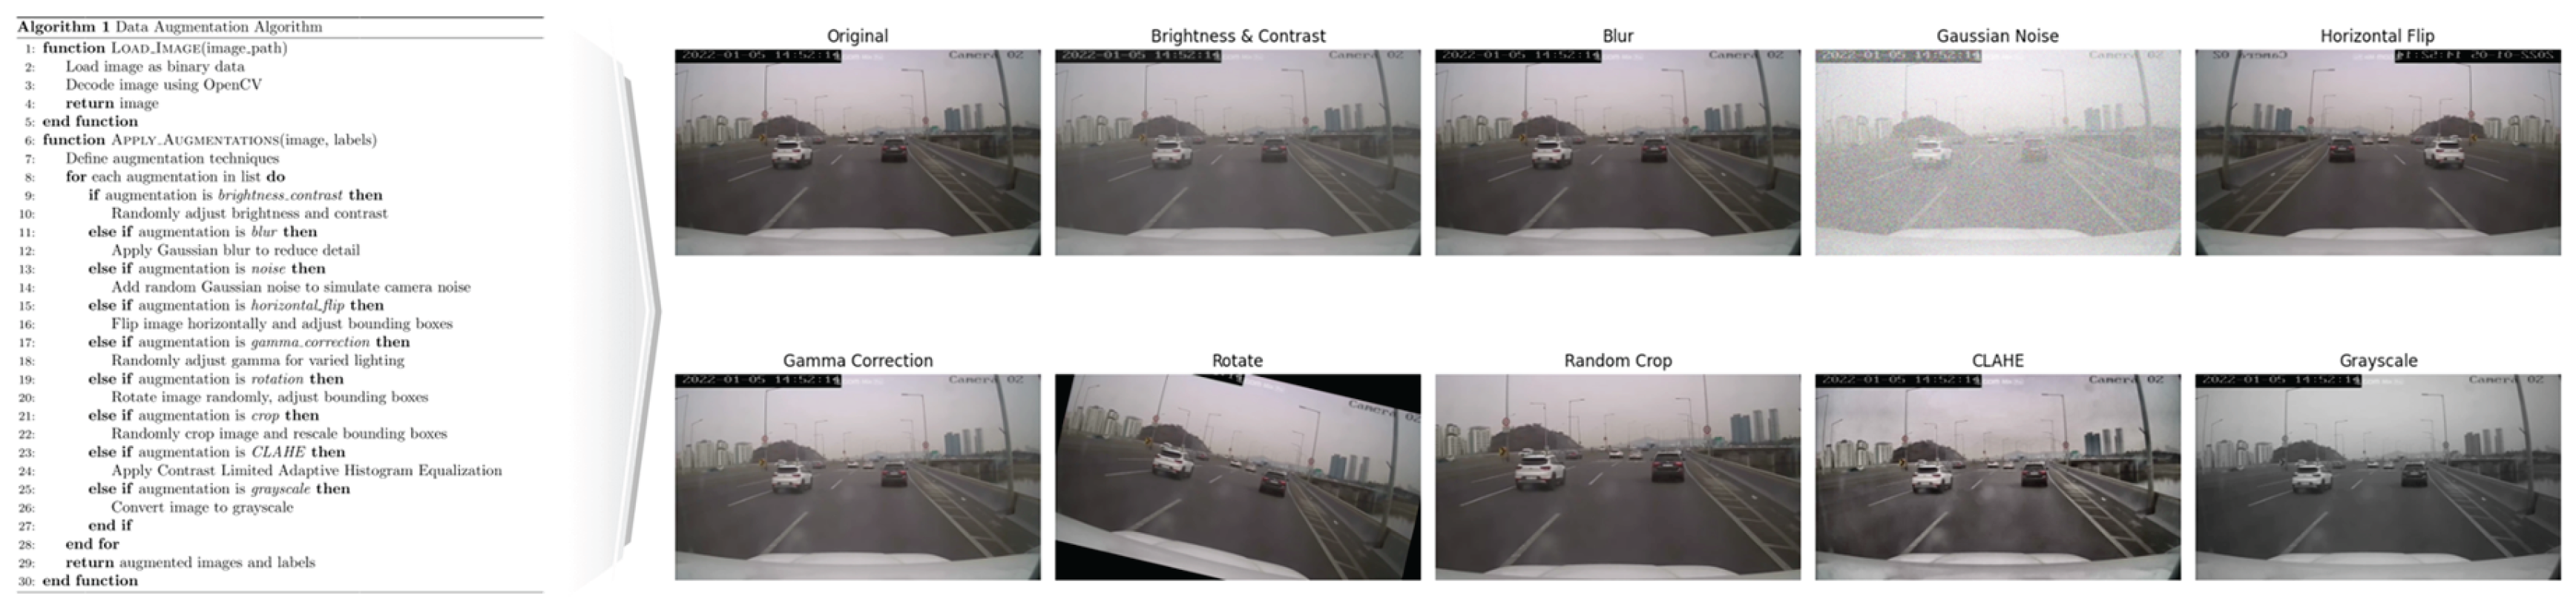
Figure 6.
Structure of the Lane Identification Algorithm (YOLOv5).
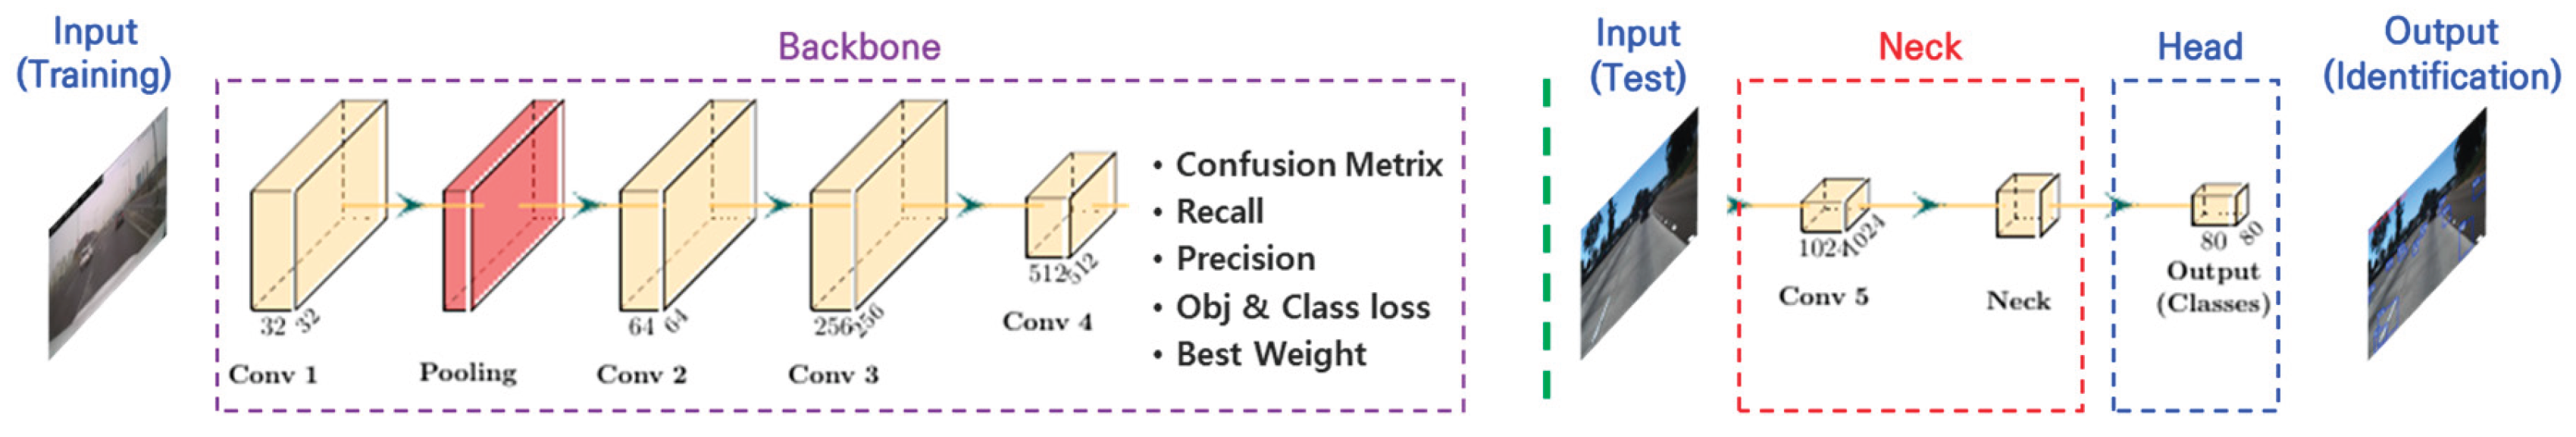
Figure 7.
Structure of the Lane Identification Algorithm (YOLOv5)
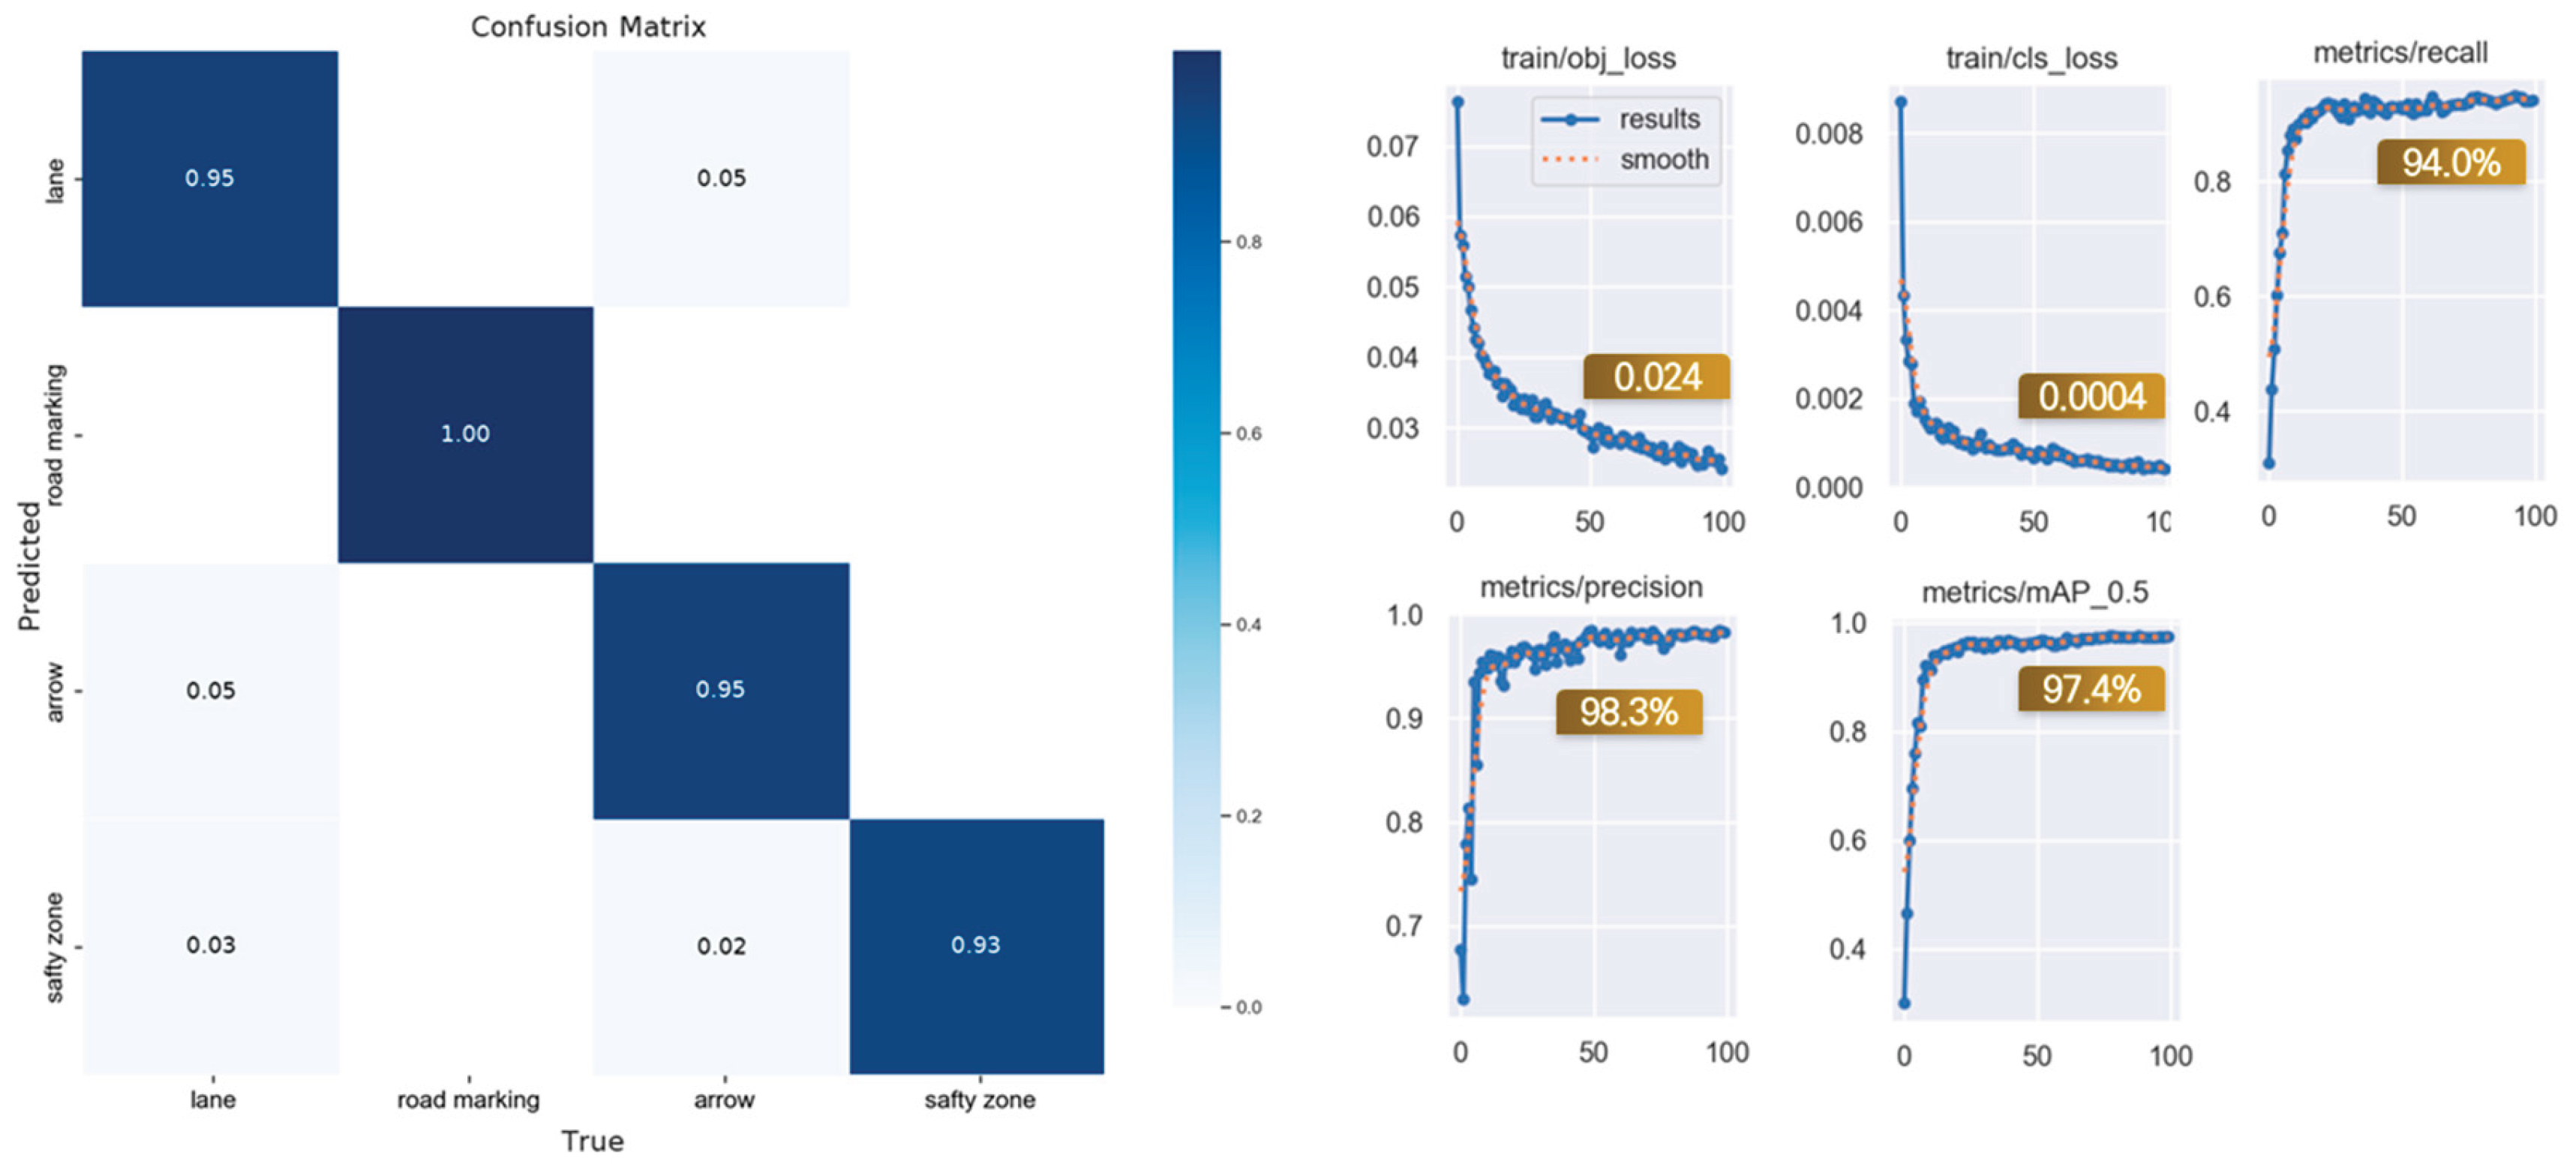
Figure 8.
(Left) Comparison Analysis Results / (Right) CNN Confusion Matrix.
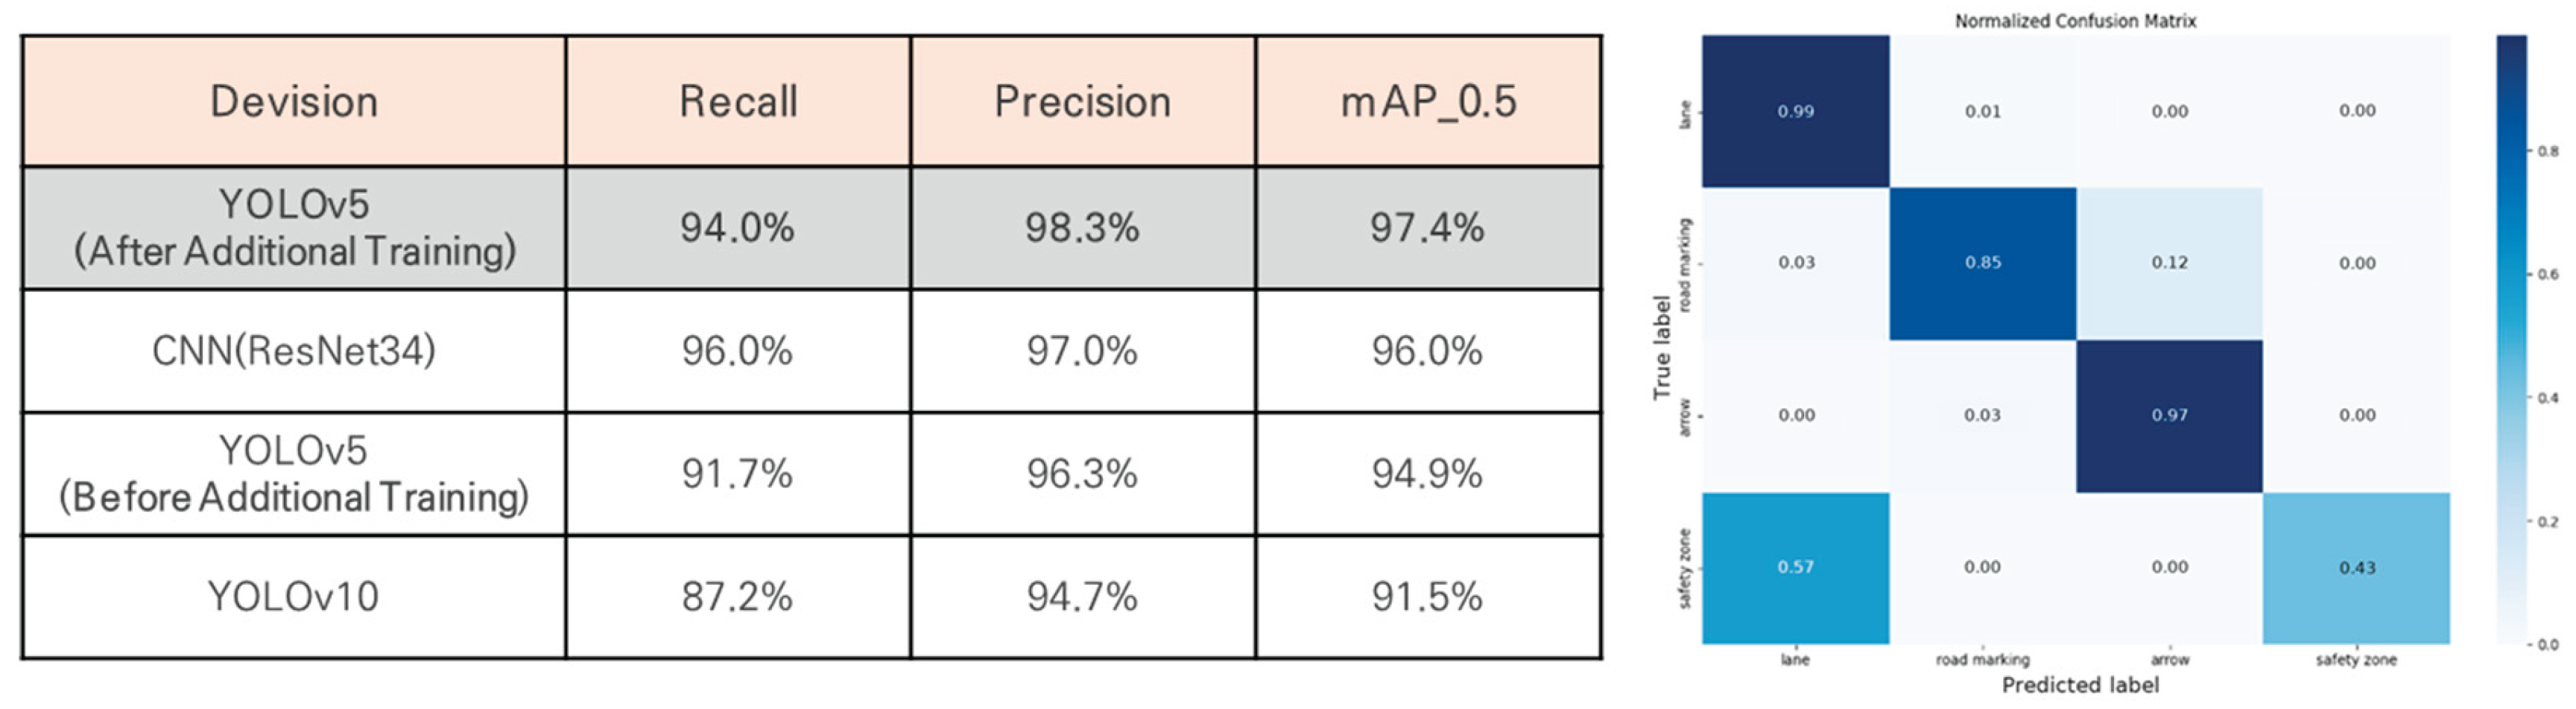
Figure 9.
Structure of the Lane Assessment Algorithm.
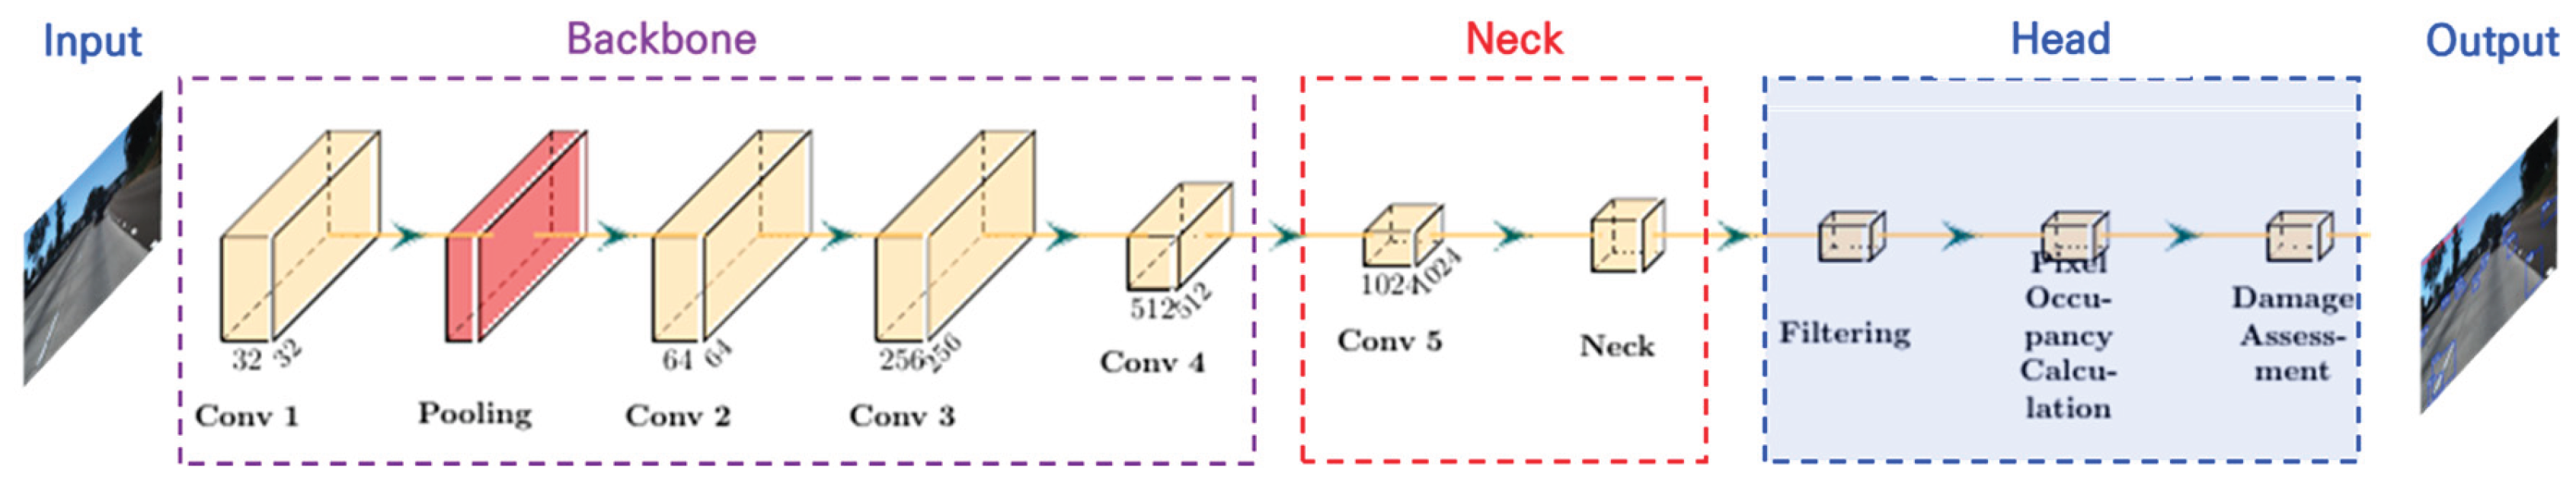
Figure 10.
Results of normal and faded lane extraction.
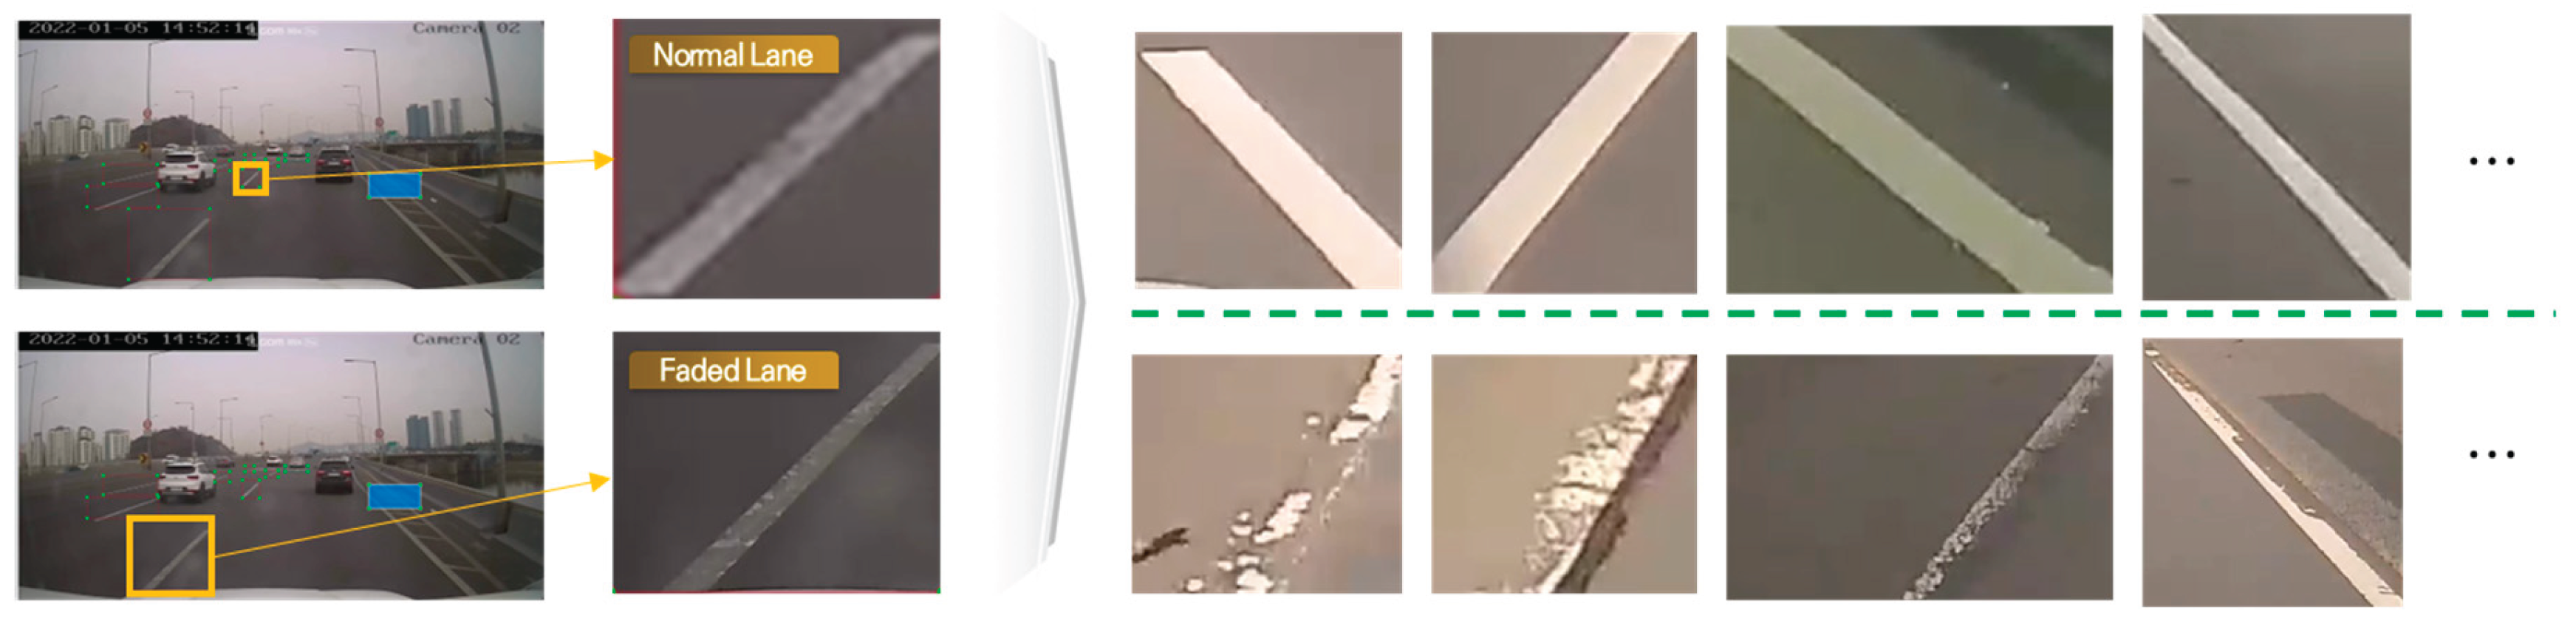
Figure 11.
Lane Condition Evaluation Algorithm: Concept and Process.
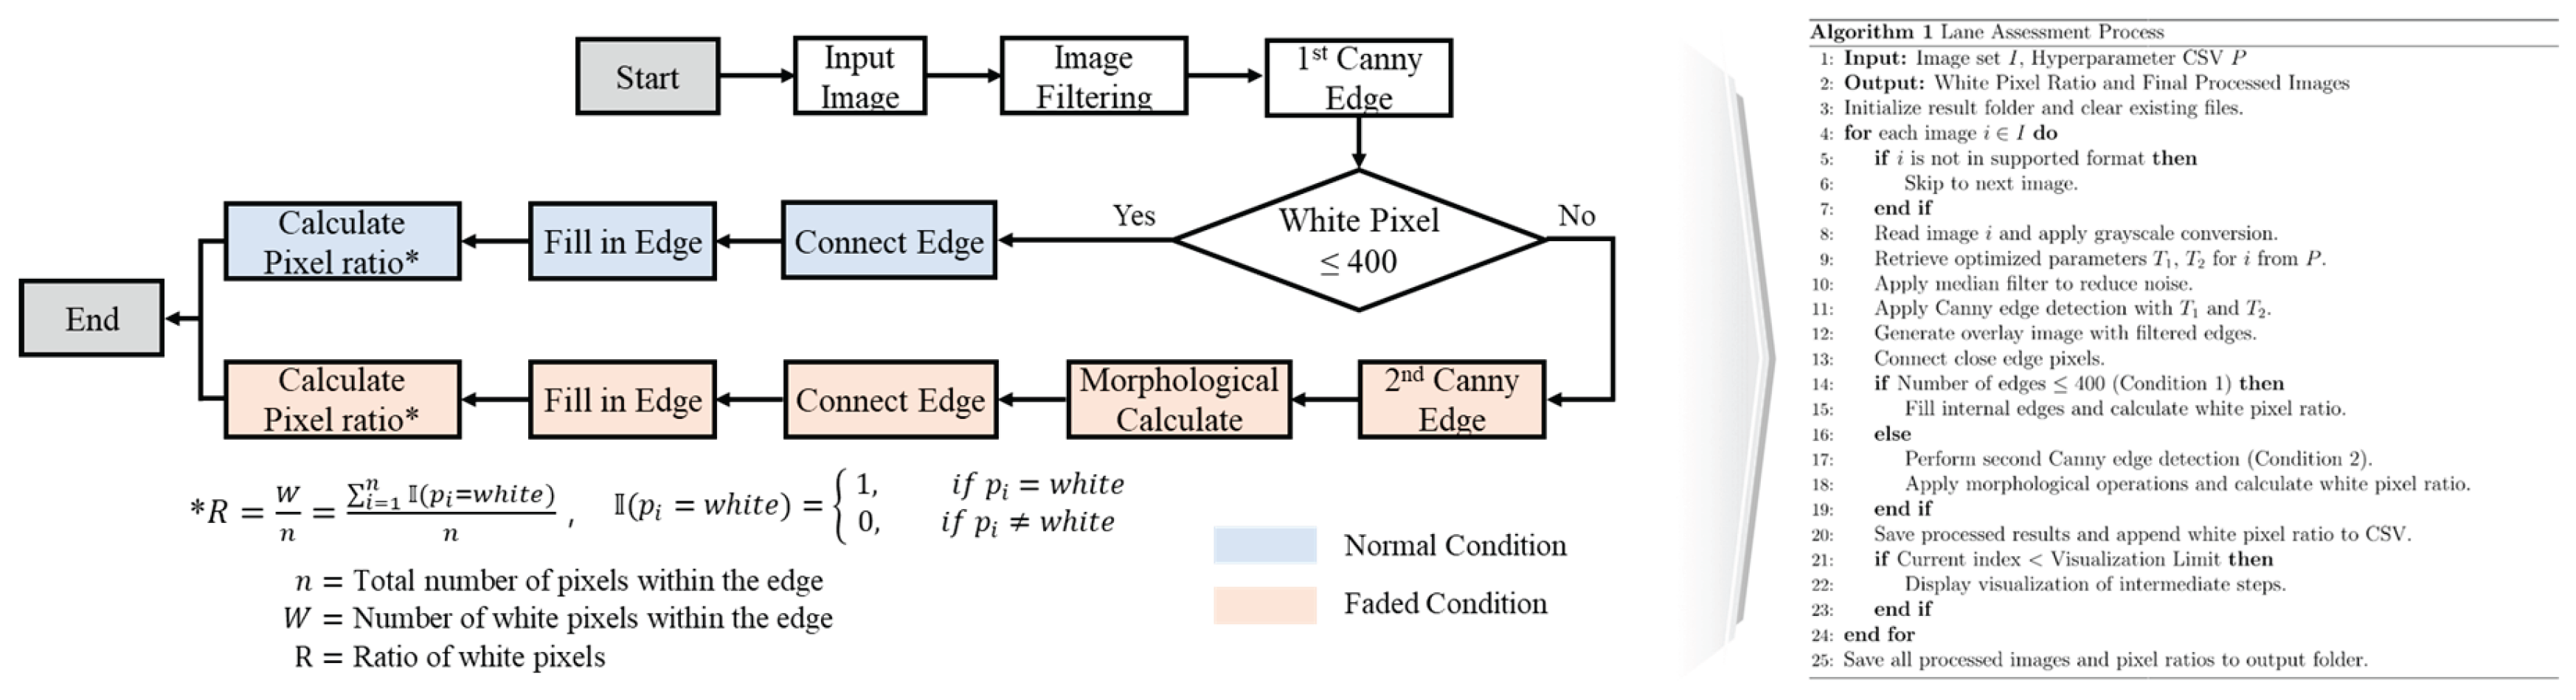
Figure 12.
Analysis Results of Normal and Faded Lanes.
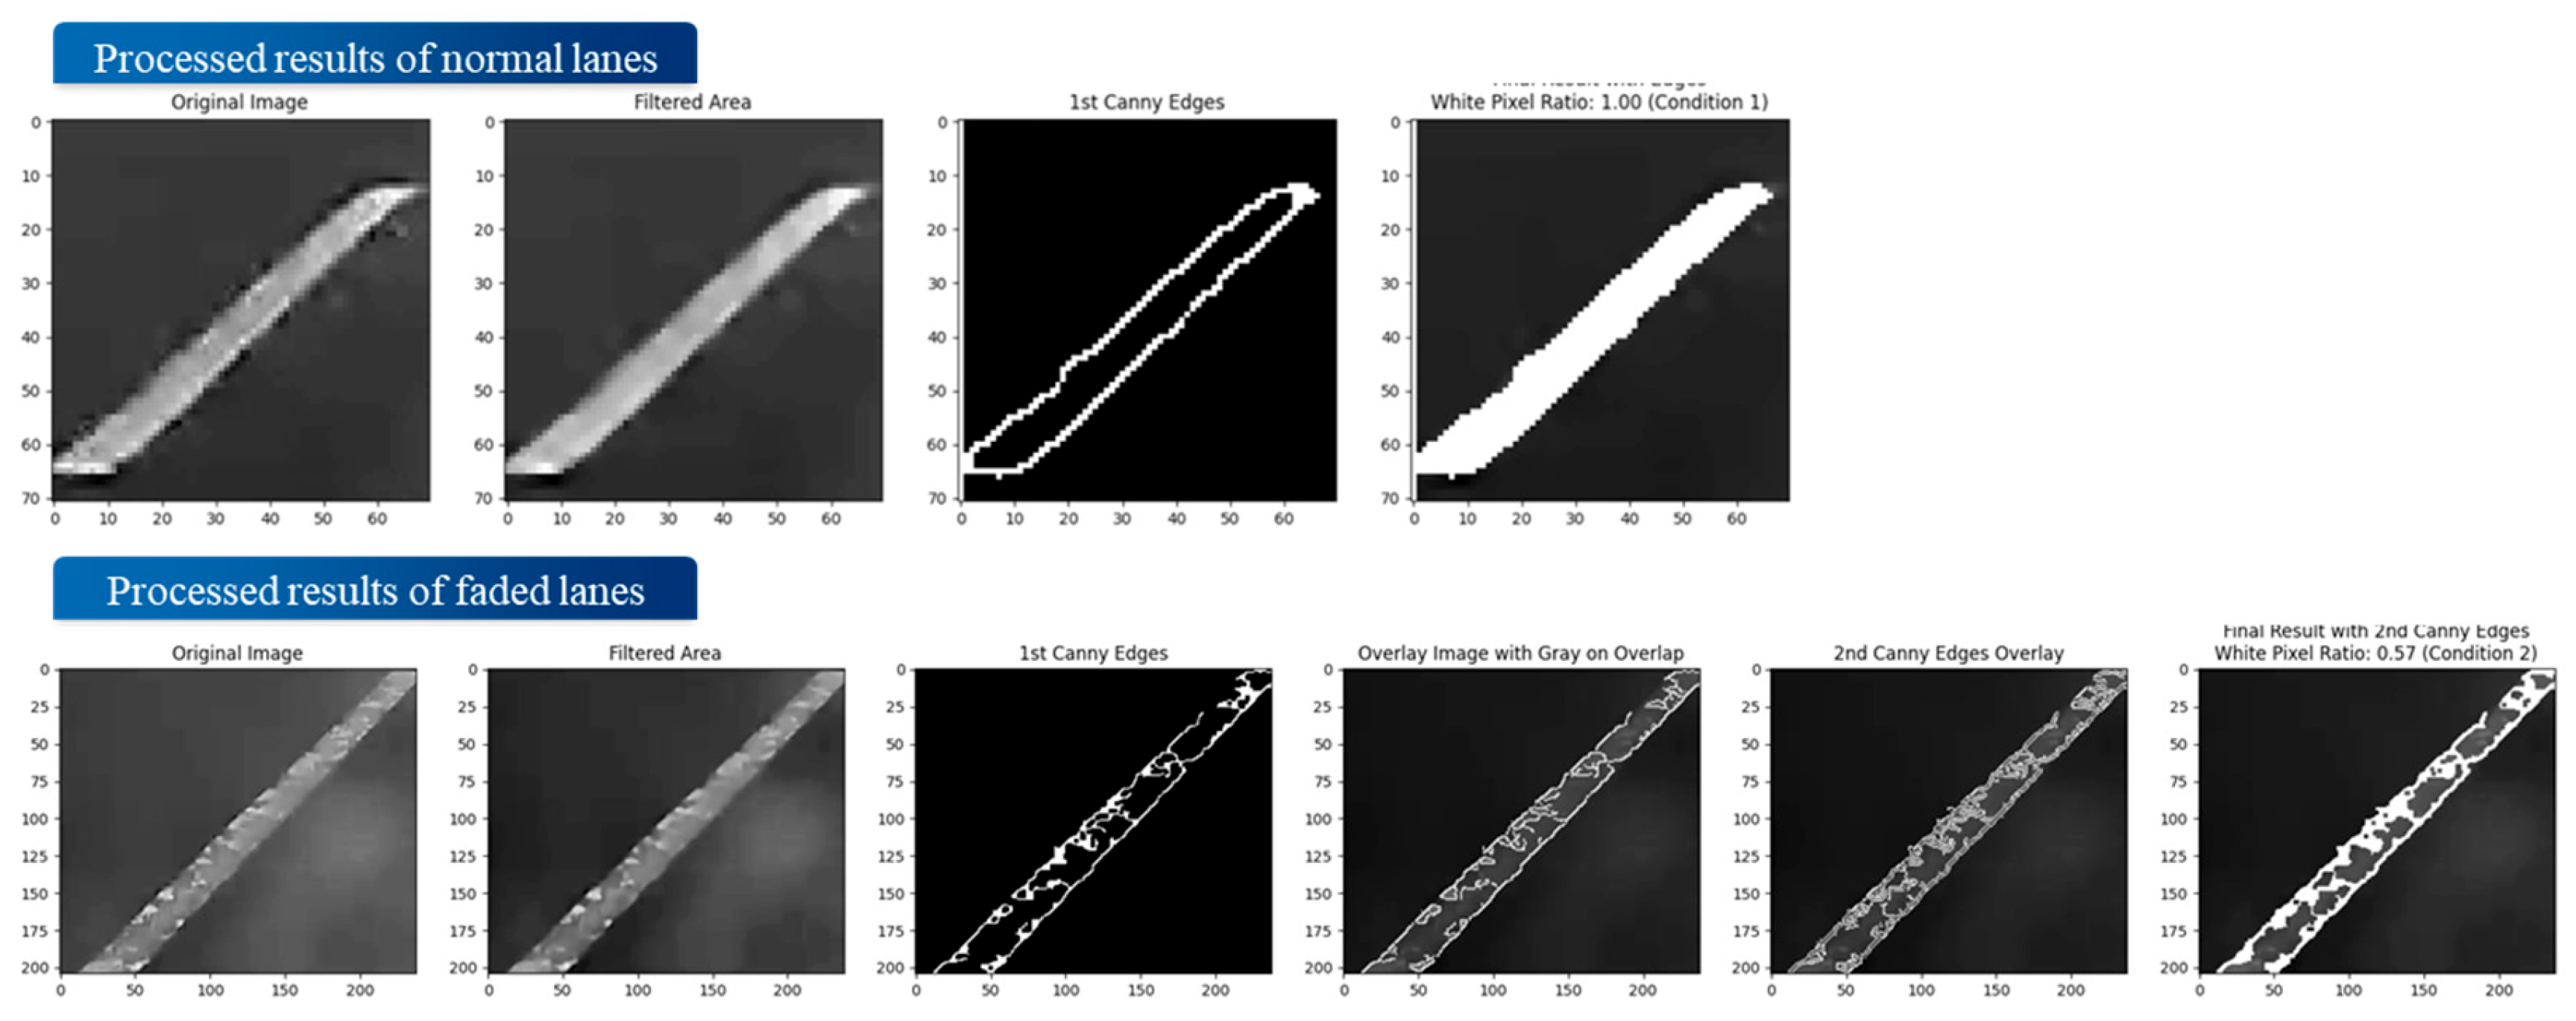
Figure 13.
Analysis Results of Normal and Faded Lanes.
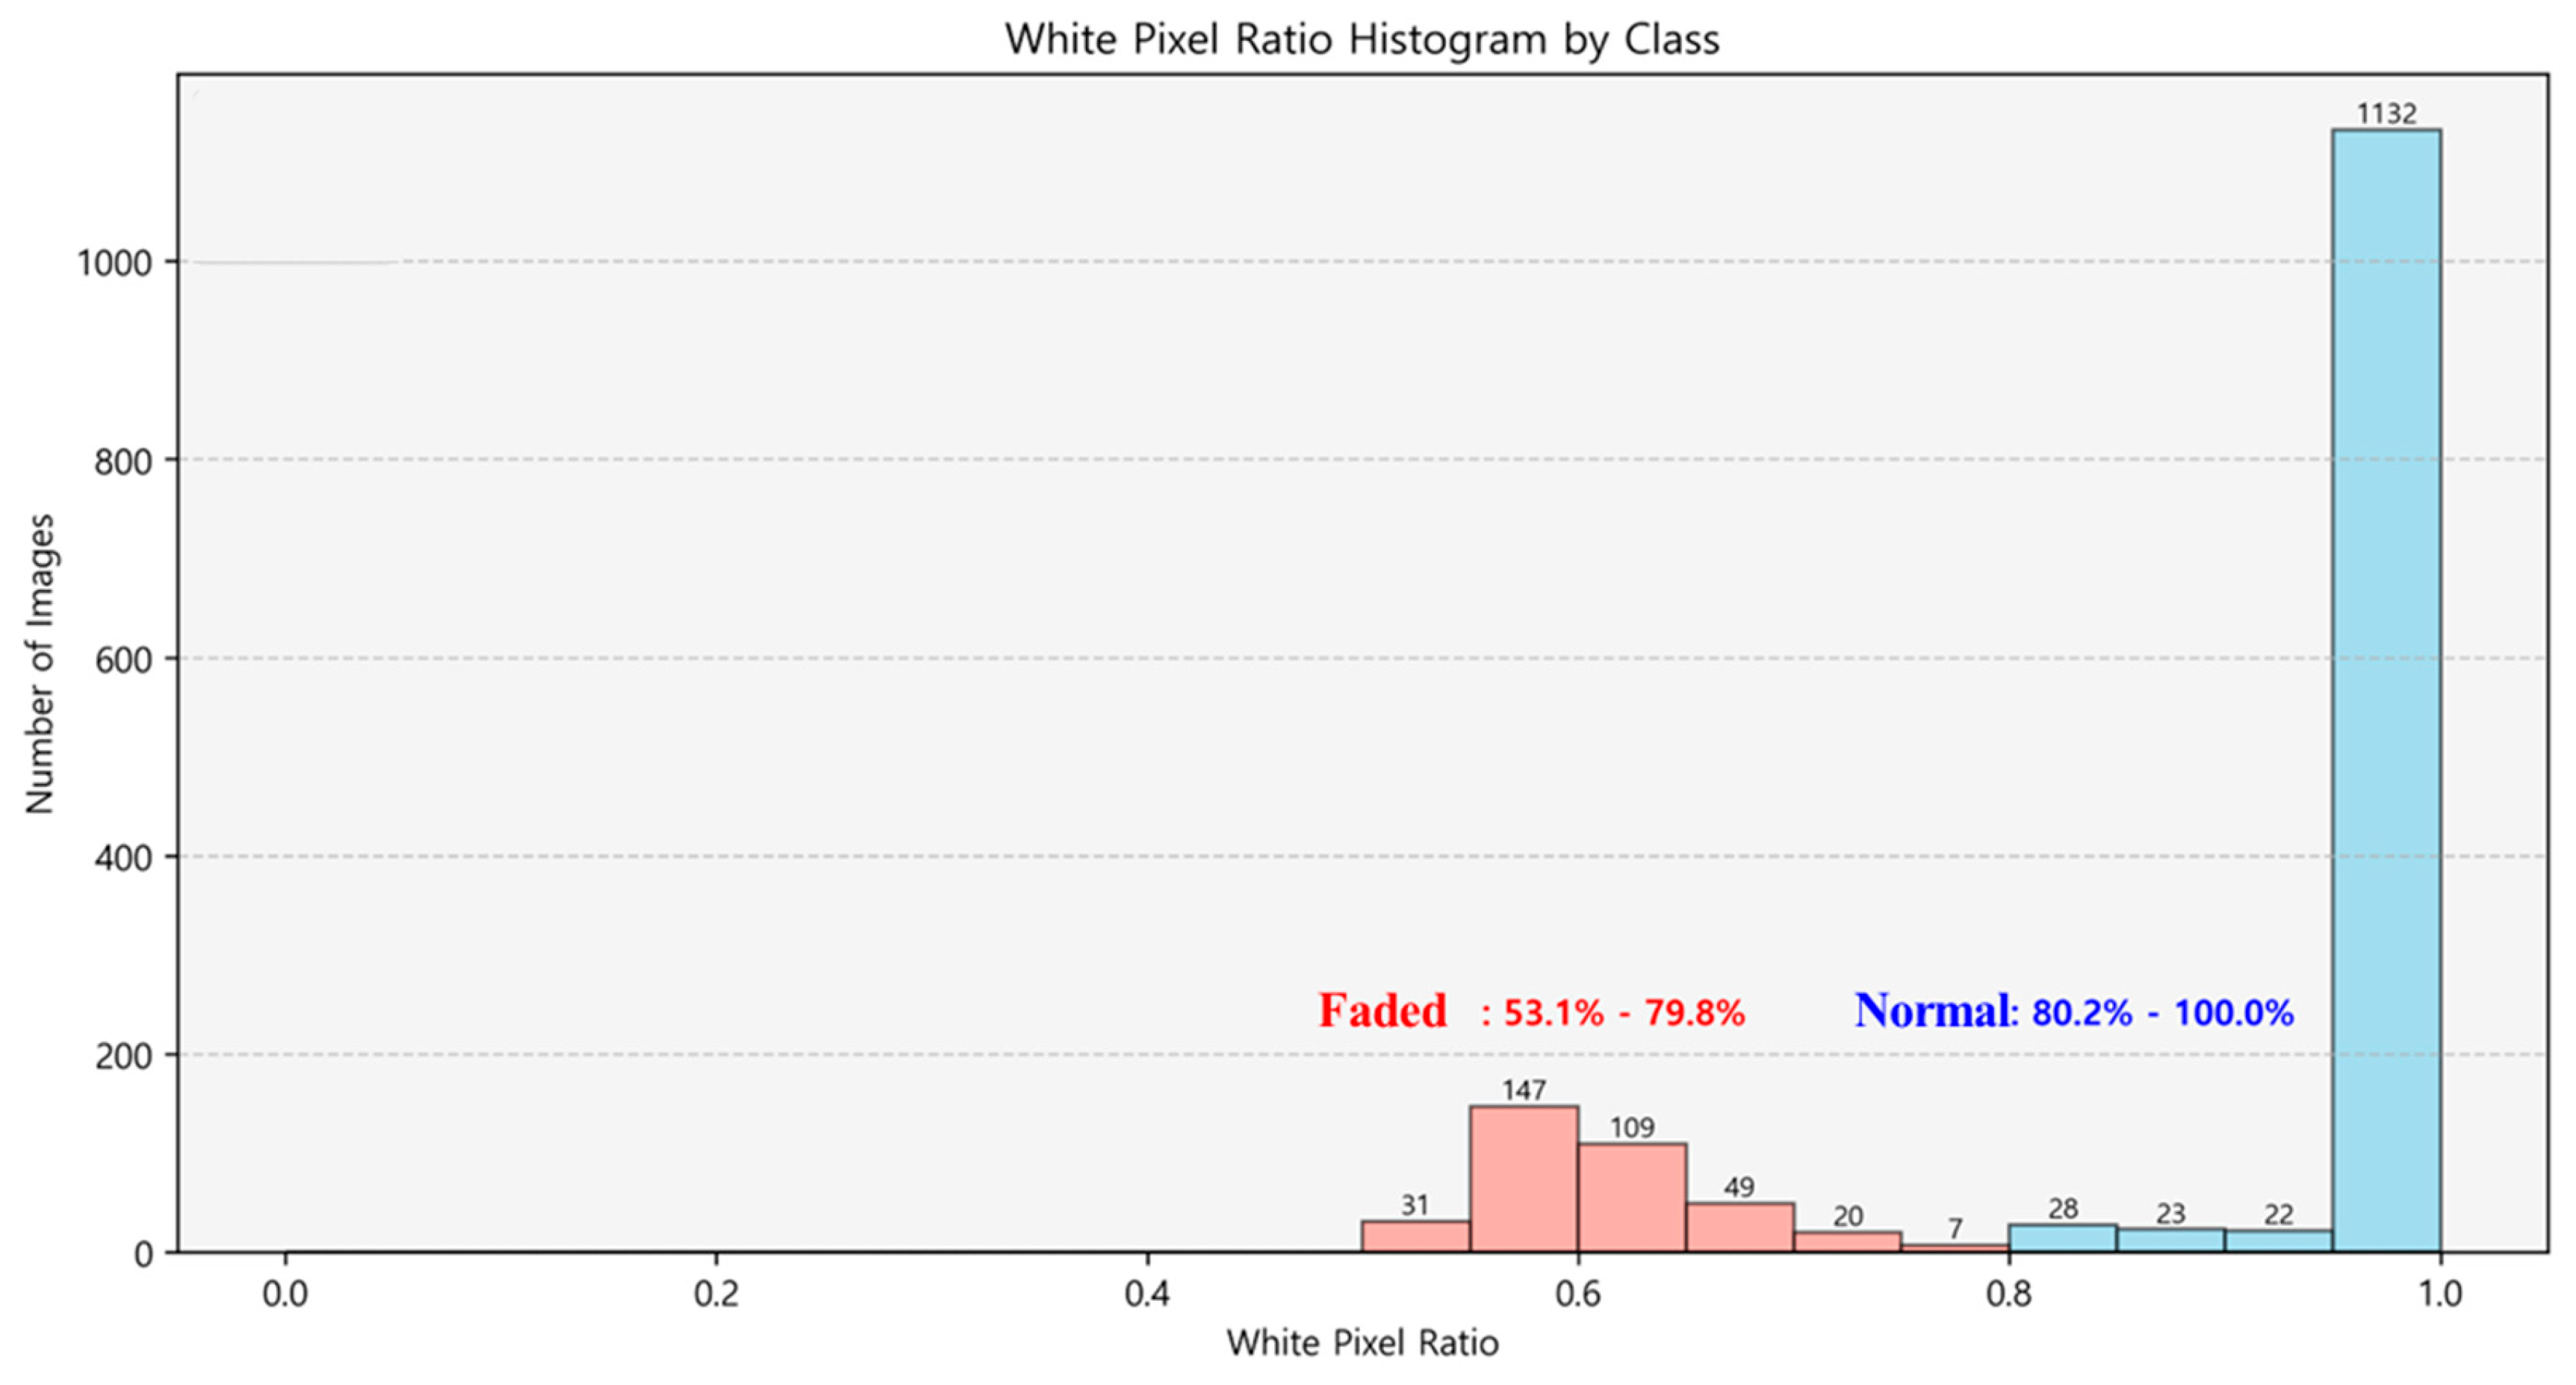
Figure 14.
Average IOU analysis results per image.
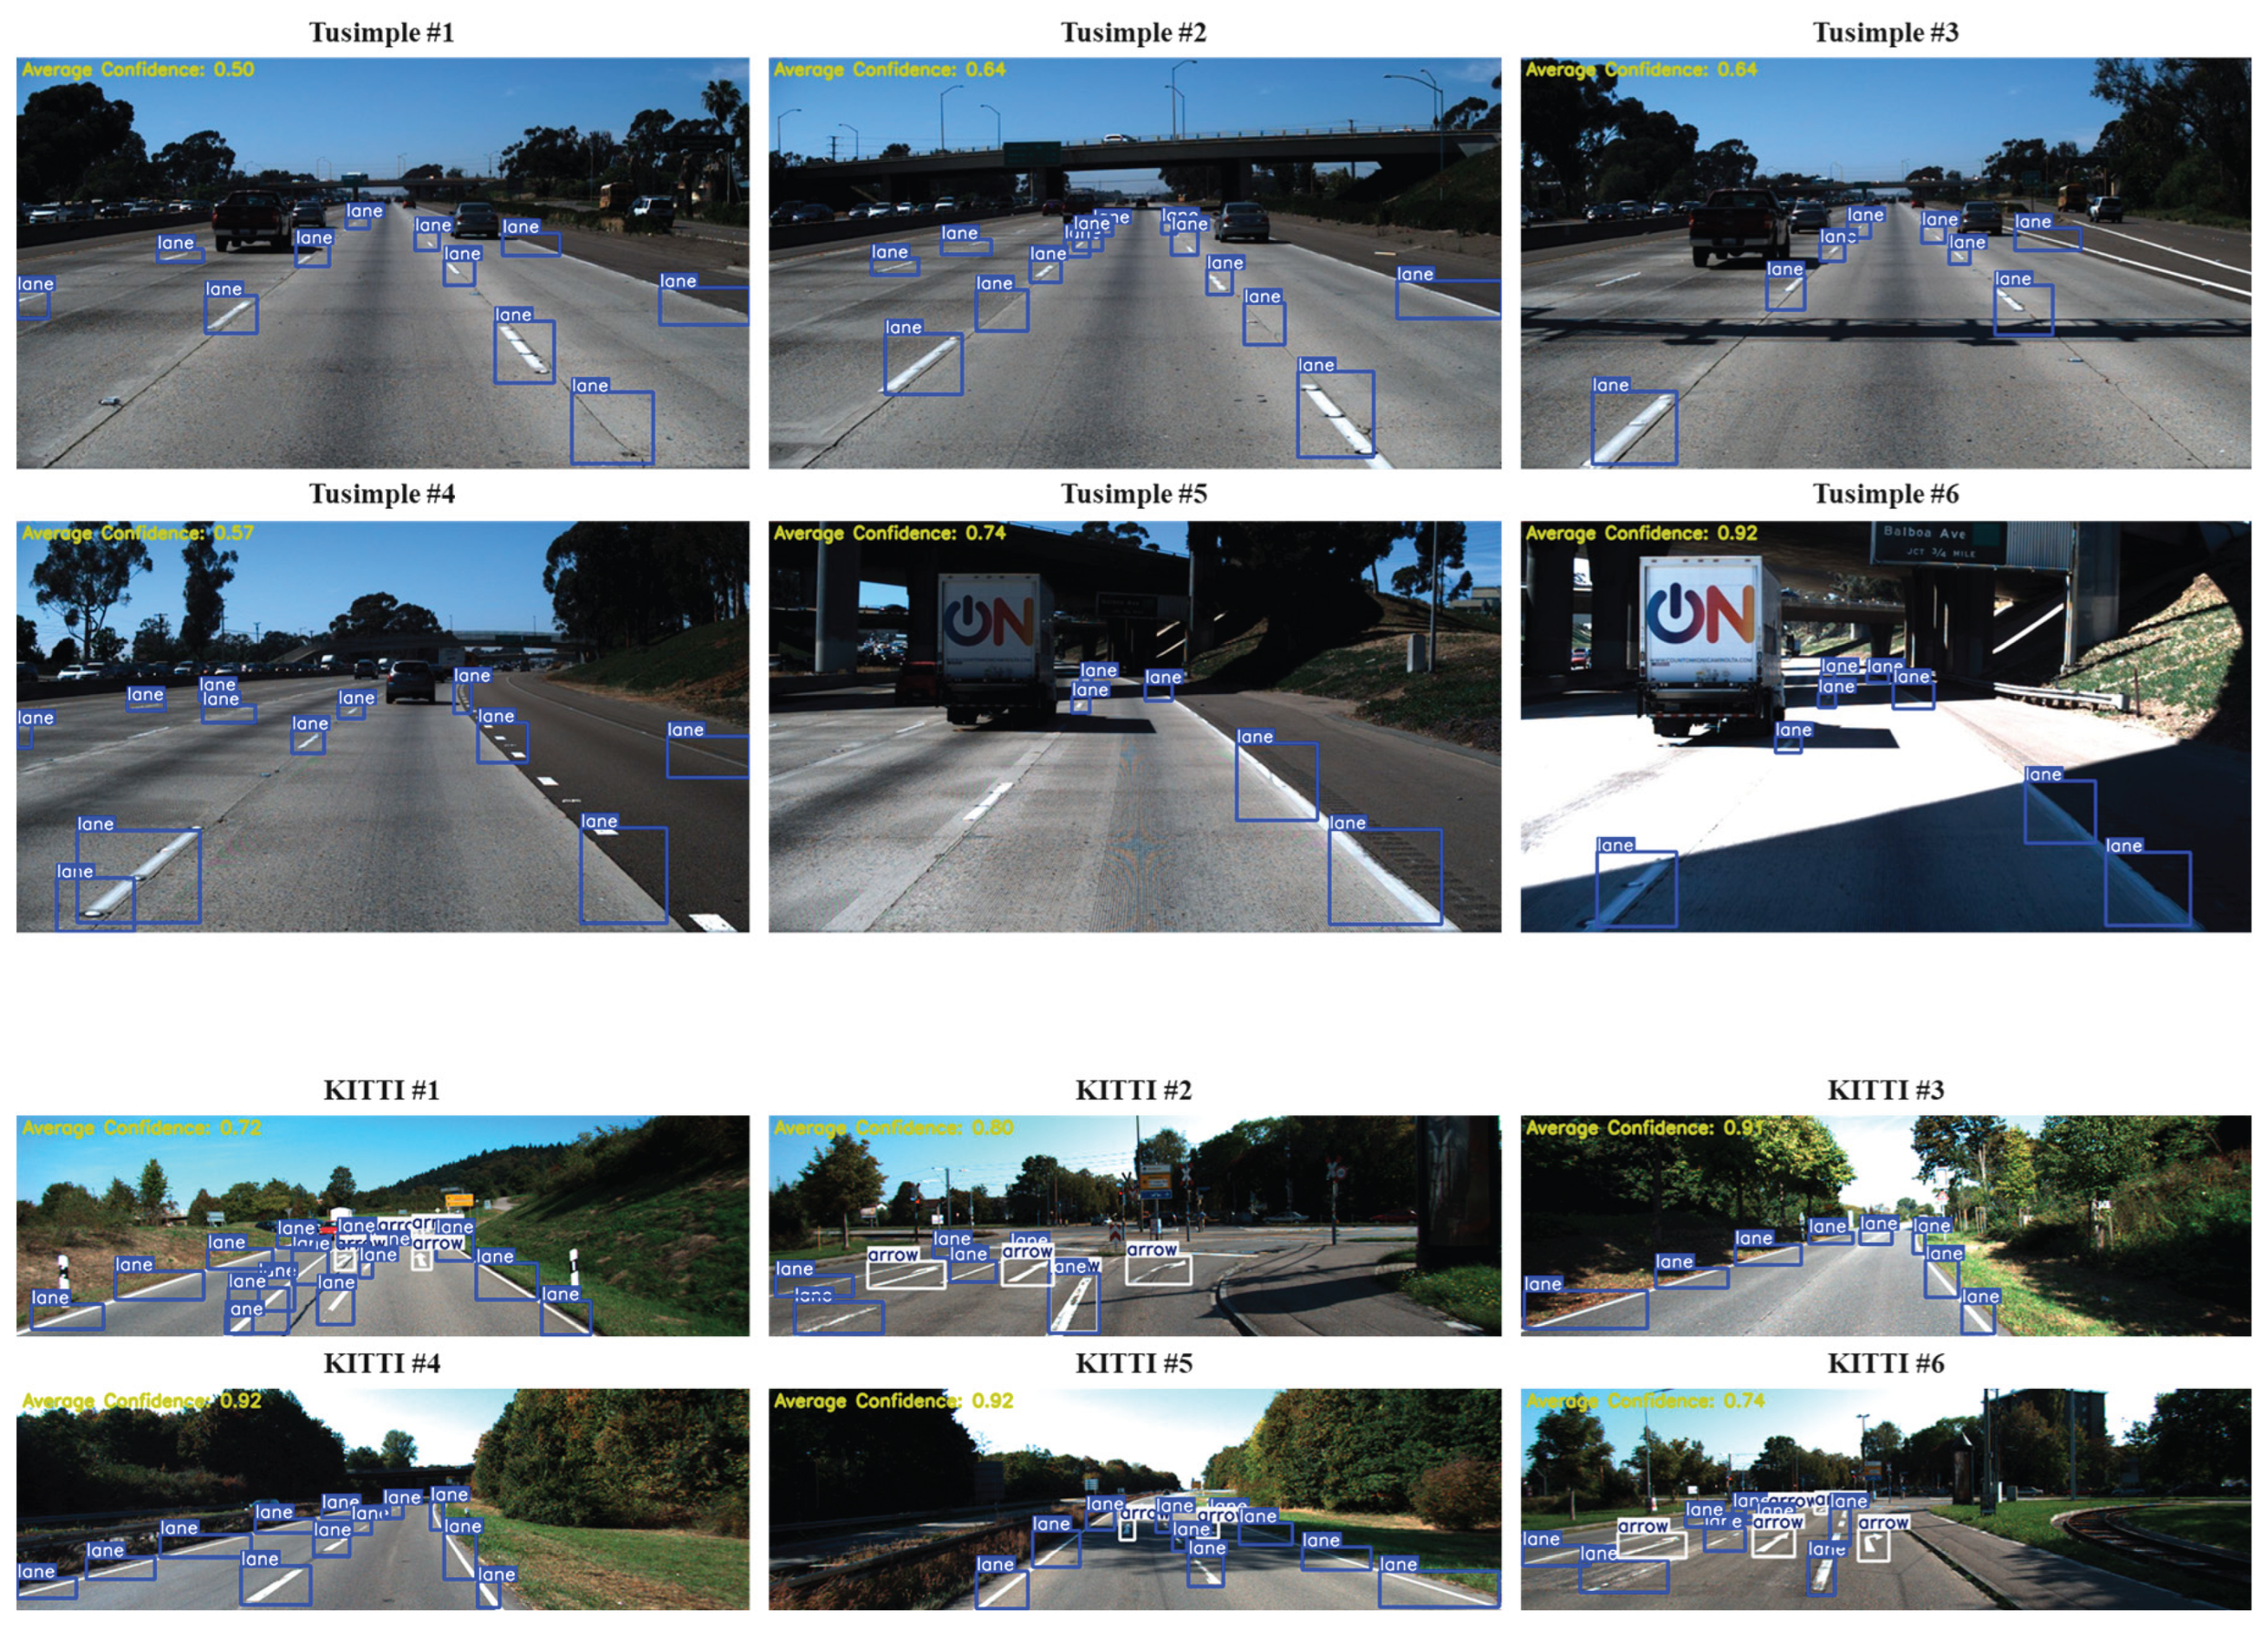
Figure 15.
Analysis Results of Normal and Faded Lanes.
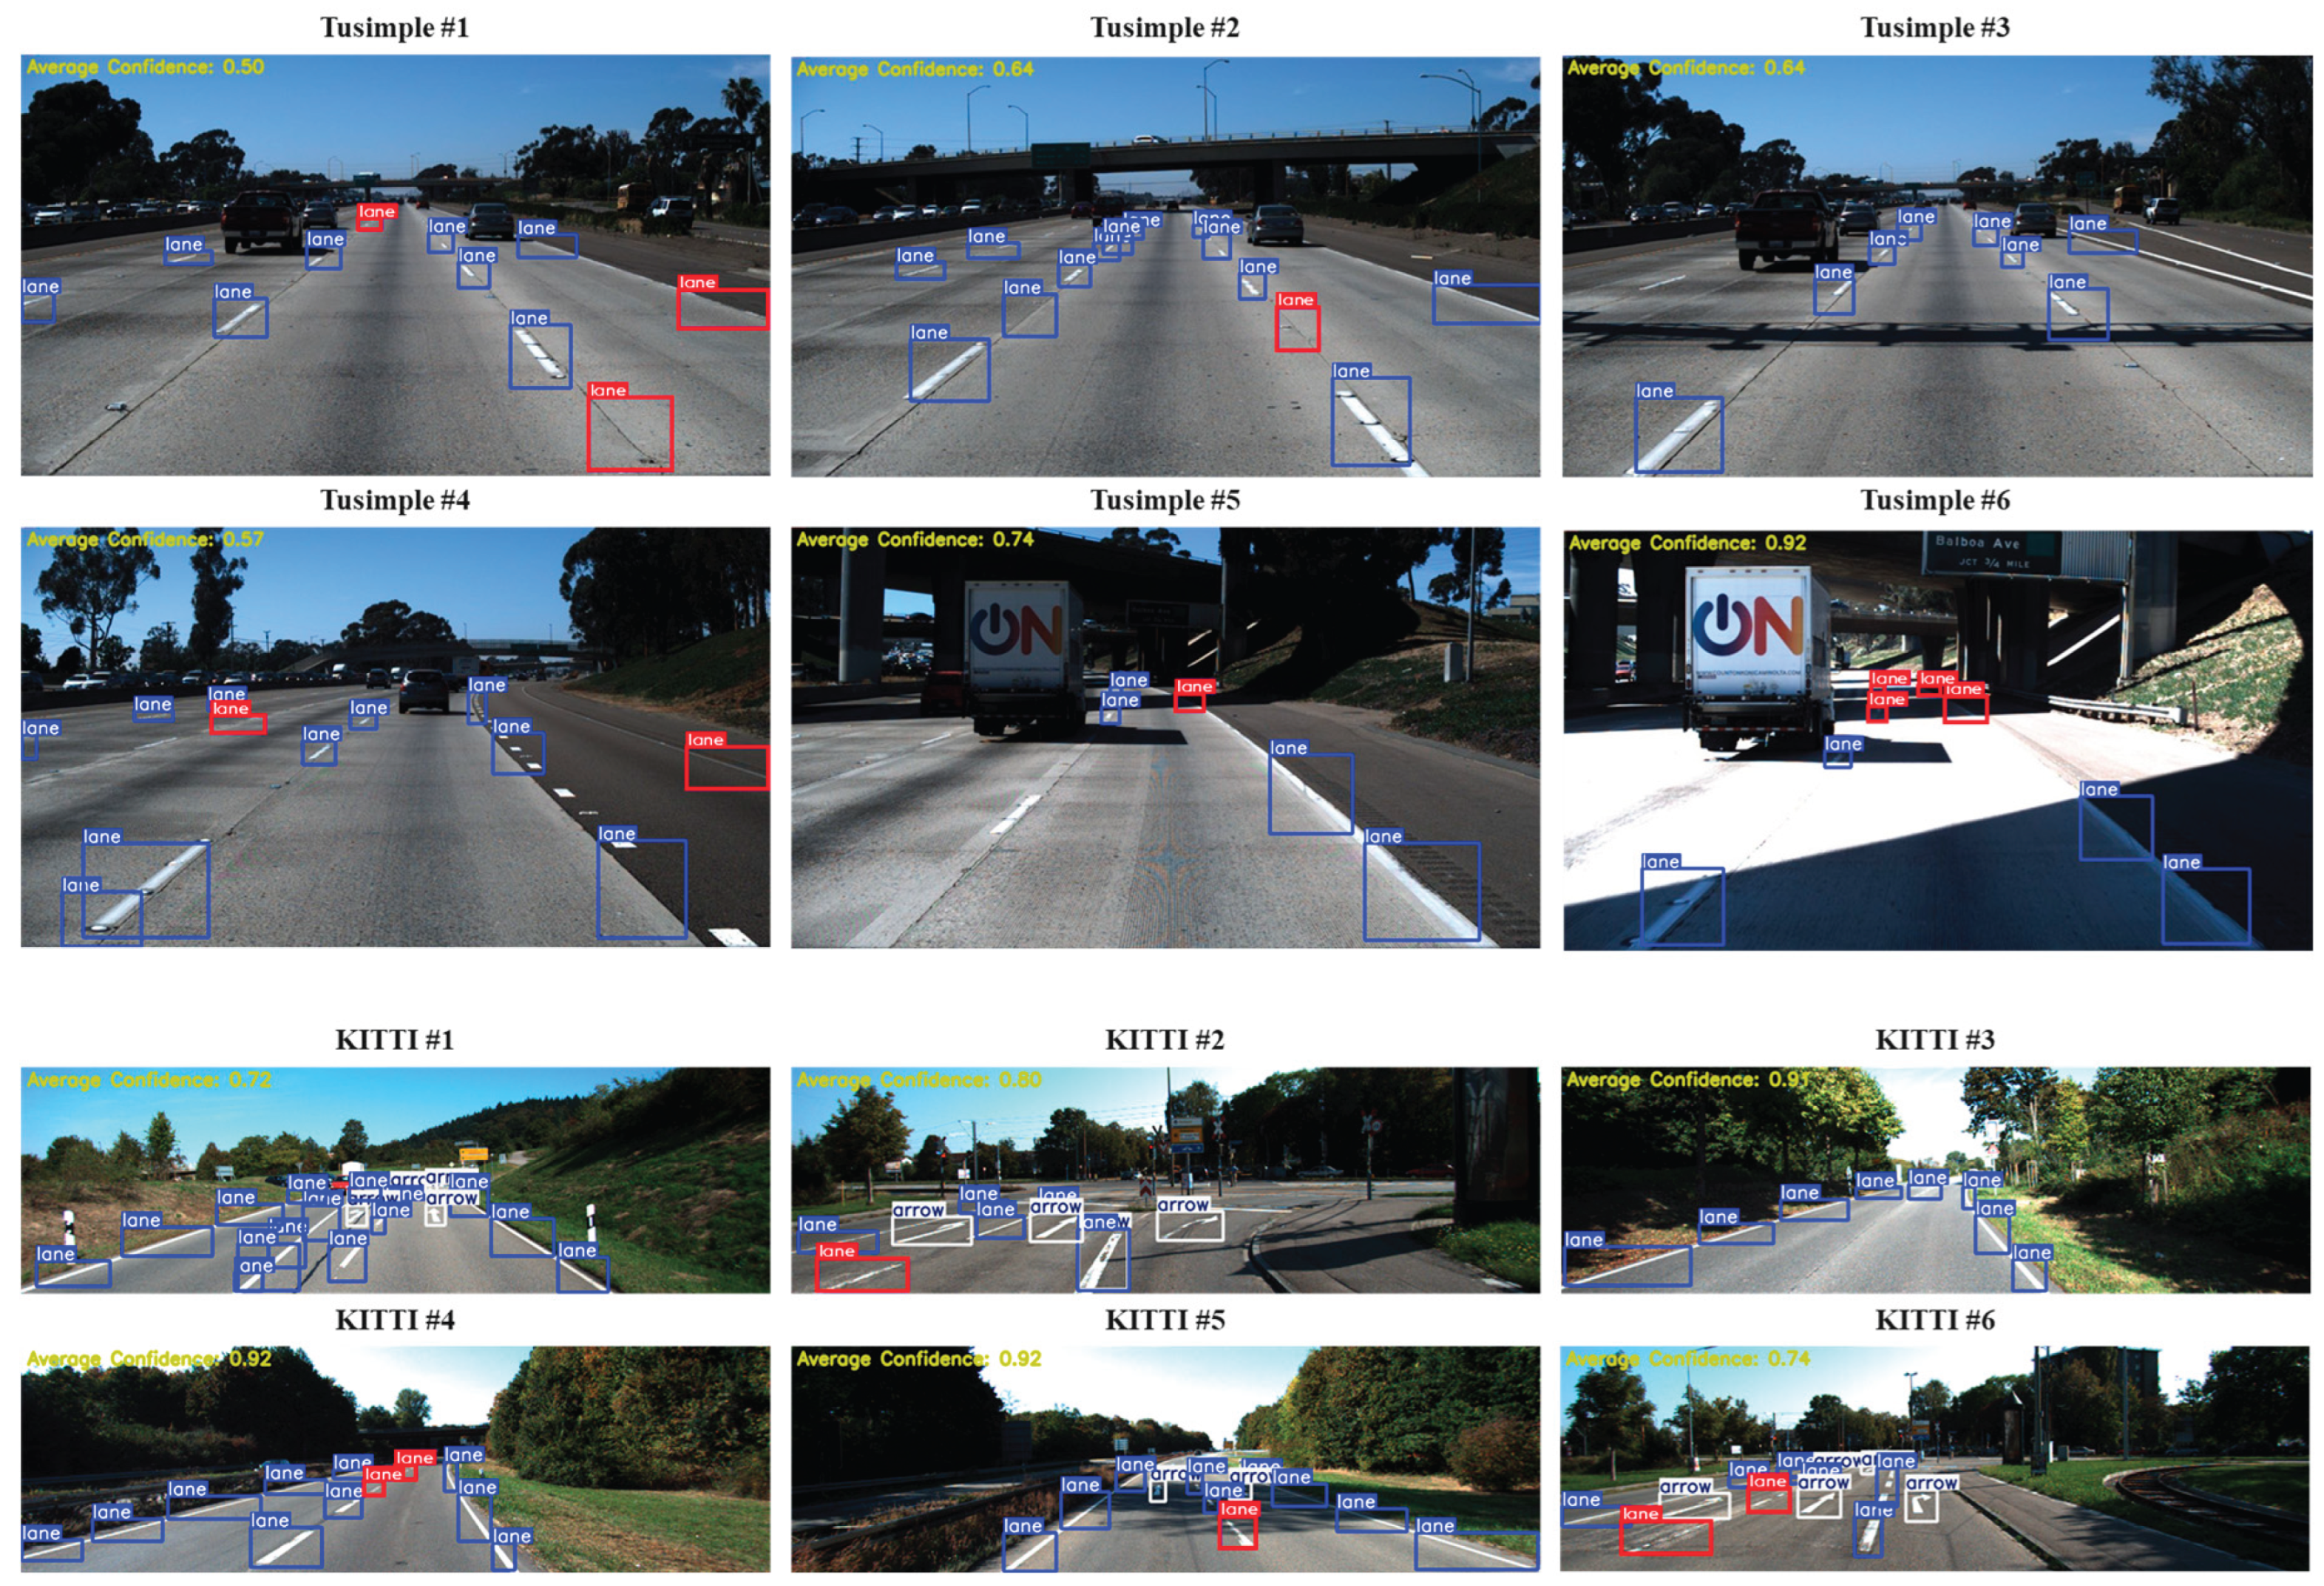
Figure 16.
Lane Identification and Assessment Framework.
Disclaimer/Publisher’s Note: The statements, opinions and data contained in all publications are solely those of the individual author(s) and contributor(s) and not of MDPI and/or the editor(s). MDPI and/or the editor(s) disclaim responsibility for any injury to people or property resulting from any ideas, methods, instructions or products referred to in the content. |
© 2025 by the authors. Licensee MDPI, Basel, Switzerland. This article is an open access article distributed under the terms and conditions of the Creative Commons Attribution (CC BY) license (http://creativecommons.org/licenses/by/4.0/).
Copyright: This open access article is published under a Creative Commons CC BY 4.0 license, which permit the free download, distribution, and reuse, provided that the author and preprint are cited in any reuse.


