
Submitted:
26 May 2025
Posted:
28 May 2025
You are already at the latest version
Abstract
A detailed examination of the effect of annealing on the structure of the high-entropy alloy Al0.5CoCrCuFeNi was carried out using different methods of electron microscopy and X-ray structural analysis techniques. Numerical estimates of the dislocation density 5·1015 m-2, the mean size of the ordered (crystalline) domains 18 nm and lattice micro strain 3·10-3 were obtained through Williamson–Hall analysis of XRD patterns. The estimates of the dislocation density was found to correlate with the estimates of the total length of dislocation segments per unit volume which effectively interacts with elastic vibrations of the sample 4·1013 m-2, as determined from acoustic relaxation measurements. This is consistent with the idea that a significant portion of dislocations are concentrated in grain boundaries, and only dislocation segments located inside grains and having a favorable orientation with respect to the direction of sound wave propagation can effectively interact with cyclic deformation of the sample.
Keywords:
high entropy alloy Al0.5CoCrCuFeNi
; electron microscopy and X-ray structural analysis
; dislocation structure
, the mean size of the ordered (crystalline) domains and lattice micro strain were obtained through Williamson–Hall analysis of XRD patterns. The estimates of the dislocation density was found to correlate with the estimates of the total length of dislocation segments per unit volume which effectively interacts with elastic vibrations of the sample , as determined from acoustic relaxation measurements [1]. This is consistent with the idea that a significant portion of dislocations are concentrated in grain boundaries, and only dislocation segments located inside grains and having a favorable orientation with respect to the direction of sound wave propagation can effectively interact with cyclic deformation of the sample.
Introduction
Multicomponent high-entropy alloys (HEA) – metal systems of five or more components with a concentration close to equiatomic. Such alloys are characterized by increased values of the entropy of mixing , compared to traditional multicomponent alloys, which explains their name. The explanation for the increased value of entropy in HEA is based on the concept of thermodynamics that the entropy of mixing between soluble components is maximum when these components are in equiatomic concentration and increases with increasing number of components. The change in Gibbs free energy when mixing HEA components is determined by the relation: , where is the change in enthalpy of the system, is the temperature.
Thus, the contribution of the entropy of mixing during the formation of HEAs reduces the free energy, as a result of which the probability of the formation of substitutional solid solutions with simple crystal lattices in them significantly increases. Such lattices are significantly distorted, since they are formed by atoms of dissimilar elements with different electronic structures and sizes.
Thanks to these features of the atomic structure of HEAs, their properties compare favorably with the properties of traditional alloys: they have a favorable combination of strength and ductility, and high resistance to thermal and mechanical influences. Multicomponent high-entropy alloys (HEAs) have garnered significant interest, as the concept of high mixing entropy enables the creation of advanced materials with unique combinations of mechanical and functional properties that cannot be attained through conventional microalloying centered on a single dominant element.
One of the typical HEA with an fcc lattice is the Al0.5CoCrCuFeNi [2] which is ideal for producing complex and high-performance components through additive manufacturing techniques, such as powder bed fusion (PBF) and selective laser melting (SLM). It enables the production of intricate designs with exceptional mechanical properties and dimensional accuracy. Al0.5CoCrCuFeNi alloy is utilized in the aerospace industry for manufacturing lightweight and high-strength components, such as turbine blades, structural parts, and aerospace fasteners. Its excellent combination of mechanical strength and corrosion resistance contributes to improved performance and fuel efficiency. It can be used to fabricate components for gas turbines, nuclear reactors, and battery materials, benefiting from its exceptional thermal and chemical stability. Al0.5CoCrCuFeNi HEA exhibits biocompatibility and corrosion resistance, making it suitable for biomedical applications. It is used in the production of orthopedic implants, dental prosthetics, and surgical instruments, where its mechanical strength and resistance to wear and corrosion are crucial.
Mechanical and acoustic properties of the Al0.5CoCrCuFeNi HEA at temperatures T<300 K have been studied in detail in [1,3,4,5,6,7]. However, currently known studies [2,8] of its structure are still incomplete and require continuation. In this publication, we will consider data from different methods of electron microscopy and X-ray structural analysis.
Studied Samples
The initial ingot of the multicomponent alloy, composed of Al (4.46 wt.%), Co (19.48 wt.%), Cu (21.01 wt.%), Cr (17.18 wt.%), Ni (19.4 wt.%), and Fe (18.46 wt.%), was produced by remelting high-purity (≈99.9%) components on a copper water-cooled hearth in an arc furnace, utilizing a non-consumable tungsten electrode. The remelting process was conducted in a purified argon atmosphere. To achieve a uniform distribution of elements, the alloy underwent five remelting cycles, with periodic turnover on the hearth.
The alloy was studied in two structural states: (I) - initial cast; (II) - after high-temperature annealing in vacuum at 1250 K for 6 hours. Annealing was carried out in a vacuum; after annealing, the samples were cooled together with the furnace (the cooling rate to 770 K was 4-5 degrees/min).
The metallographic analysis presented in Figure 1 reveals that the microstructure of the alloy in the initial state (I) exhibits a characteristic dendritic pattern, consisting primarily of a dense body of dendrites as the main structural component, along with interdendritic spaces. Such crystallographic texture inevitably forms when creating blanks from alloys using the argon-arc method with directed heat removal.
The elemental composition of the obtained ingots was studied by energy dispersive X-ray spectroscopy (EDS). Two samples (A and B) cut from different neighbouring regions of the ingot of the high-entropy alloy Al0.5CoCuNiFe in structural state (II) were examined.
Figure 2 shows the results of determining the elemental composition of the alloy under study. The electron microscopy imaging of the sample and its elemental composition were studied using Field Emission Scanning Electron Microscope (FE-SEM) FEI Nova NanoSEM 230 along with energy dispersive X-ray spectrometer (EDAX Genesis XM4).
It was found that the composition of the two samples studied differs slightly. These data correlate with the presence of dendritic structure (see Figure 1) and may indicate the presence of noticeable differences in the elemental chemical composition of dendrites and interdendritic spaces.
Dendritic Structure of the High-Entropy Alloy Al0.5CoCuNiFe
X-ray studies of the dendritic structure were carried out on a DRON-2 serial diffractometer in FeKα radiation using a selectively absorbing manganese filter. According to X-ray diffraction (XRD) data, the branches of dendrites and interdendritic regions had two different face-centered cubic (fcc) crystal structures with very close lattice parameters, while the ratio of the intensities of diffraction reflections indicates the presence of a predominant crystallite orientation in the samples. Taking into account the ratio of the intensities of diffraction reflections in XRD patterns and the estimation of the volume fraction of phases according to metallography data, dendrites correspond to a phase with a lower lattice parameter fcc1 and interdendritic region corresponds to a phase, which has a larger lattice parameter fcc2. The results of X-ray studies are shown in Figure 3 and Table 1.
Data of scanning electron microscopy using an X-ray microanalyser (see Figure 4 and Table 2) show that the elemental composition of dendrites and interdendritic spaces is significantly different.
The dendrites composition (points 4, 5, 6 in Figure 4) is enriched in iron, chromium, and cobalt by more than 20 at.% of each element and depleted in copper and aluminium less than 10 at.%. The interdendritic spaces (points 1, 2, 3 in Figure 4) are enriched in copper up to 65 at.% and contain a small amount (less than 4 at.%) of iron, chromium, and cobalt. The aluminium content in the interdendritic spaces is greater (about 15 at.%), which leads to an increase in the fcc lattice parameter. In addition, at the boundary between dendrites and interdendritic region, separate spaces are observed (points 7, 9, 10 in Figure 4) to be close in composition to the interdendritic region, but containing less copper and a higher amount of nickel, iron, chromium, and cobalt.
The diffraction pattern of the sample after annealing at 1250 K for 6 h (see Figure 3b and Table 3) showed the presence of two fcc phases (fcc1 and fcc2), as well as traces of the bcc phase (type B2).
Thus, it was established that annealing leads to a significant change in the alloy structure and the chemical composition of the structural regions (see Figure 5 and Table 4).
The composition of the dendritic regions (points 3, 4 in Figure 5) remains virtually unchanged, whereas in the interdendritic regions (points 1, 2 in Figure 5) the content of copper and aluminum decreases and the content of the remaining elements increases. Also, mainly at the boundaries between the dendritic and interdendritic regions, bcc phase particles (points 5, 6 in Figure 5) are formed, enriched in nickel (≈30%), aluminum (>20%) and copper (>20%).
The elevated concentration of copper in the interdendritic region can be attributed to its relatively high enthalpy of mixing with iron (13 kJ/mol), cobalt (10 kJ/mol) and nickel (4 kJ/mol). This indicates that copper has a low affinity for forming solutions with most of the matrix elements in the system [9,10]. Additionally, relatively low melting point of copper likely plays a role in this distribution. The differences in melting points also explain why chromium exhibits the most pronounced variation in concentration between dendritic and interdendritic regions. Among all elements in the system, chromium possesses the highest melting point (2180 K), which is significantly greater than that of iron (1811 K), cobalt (1768 K), nickel (1728 K), copper (1358 K), and aluminium (933 K). As a result, Cr-rich regions are capable of solidifying from the melt at the highest temperature.
The distinctive behavior of nickel stems from its solubility in both phases. With a melting point comparable to iron and cobalt, nickel differs from copper in that it does not exhibit a positive enthalpy of mixing with cobalt, chromium or iron, allowing it to integrate readily into the dendritic phase. Additionally, nickel is fully soluble in copper, which results in its higher concentration in the interdendritic region compared to cobalt, chromium or iron.
Dislocation Structure of the High-Entropy Alloy Al0.5CoCuNiFe
XRD measurements were carried out using a PANalytical X'pert Pro diffractometer (Almelo, Netherlands) at the Institute of Low Temperatures and Structural Research of the Polish Academy of Sciences. XRD patterns were recorded at room temperature in Bragg-Brentano geometry over 2θ range: from 30° to 120°, with a Cu-Kα anode radiation.
Figure 6 presents XRD patterns obtained from two different adjacent regions (A and B) of the alloy sample in structural state (II). The most characteristic reflections are marked with the corresponding Miller indices.
Table 5 summarizes the results of diffraction patterns processing. It was found that the XRD patterns contain reflections from a fcc lattice with an average lattice parameter of .
As can be seen, all reflections have a fairly large width at half peak height (greater than 0.5° in 2). The obtaining reflections set was approximated by the Lorentz function. The Bragg peak experimental breadth is a combination of both instrument and sample-dependent effects [11] To remove these aberrations, it is needed to assemble a diffraction pattern from the line broadening of a standard material to determine the instrumental broadening. The instrument-corrected physical value of the full width at half maximum (FWHM) corresponding to the diffraction peak of the studied alloy was estimated using the relation:
where is the experimental value of the FWHM of the XRD reflex; is the instrumental value of the FWHM of the X-ray reflection, it was determined based on the instrumental standards for crystallite size estimation.
It’s well known that is affected by not only particle size but also mechanical stresses that arise due to defects in a crystal structure. According to the Williamson-Hall model [12,14] broadening is determined by the additive contribution of crystallite size and the lattice microstrain :
As is generally accepted, the contribution to broadening of crystallite size is determined by the Debye–Scherrer equation [13]:
is the X-ray wavelength; K is a dimensionless shape factor, with a value close to 1 [13], D is the mean size of the ordered (crystalline) domains, which may be smaller or equal to the grain size, which may be smaller or equal to the particle size (crystallite size); is the Bragg angle.
Crystal imperfections and distortion of strain-induced peak broadening within the uniform deformation model are related by :
where is the mean square lattice micro strain. Thus
There is an extraordinary property of Eq. (5) which has the dependency on the diffraction angle . Debye-Scherrer equation follows only a dependency but not as Williamson-Hall model. Therefore, both crystallite size and strain can be estimated by plotting
gainst
in radian and in degree) for all the peaks and fitting the best line, the intercept and slope the fitting line are and
respectively. Figure 7 shows the Williamson–Hall plot for the specimens of the high-entropy alloy Al0.5CoCuNiFe.
The Williamson–Hall analysis leads to the following empirical estimates: mean size of the ordered crystalline domains (particle size) , and ; lattice micro strain , and .
Both of these parameters, obtained from Williamson–Hall analysis, may be used for calculating the dislocation density [14]. The dislocation density calculated from the particle size will be determined by the ratio:
where is the number of dislocations per block face, the value of n must be determined or assumed. For our calculation we take ; this value gives a minimum density of edge dislocations and could be applied to a structural state in which the dislocations may be very nearly random [13].
The dislocation density calculated from the strain broadening is
the coefficient lies in the range 2 to 25. For the broadening by a screw dislocation [14] for fcc lattice with Burgers vector b along [110]. Eq. (7) can be applied to the experimental results only if the interaction factor is known or assumed. The interaction factor [14], assuming that each dislocation aligns with the edge of a block. In this case, the dislocations are maximally separated, minimizing their interaction. Relations (6) and (7) lead to the following empirical estimates: ,
;
For the case , the average value of the dislocation density will be determined as the geometric mean:
Which leads to the following estimates for the studied samples of the high-entropy alloy Al0.5CoCuNiFe: , and . The obtained estimates correlate with the estimates of the density of dislocations effectively interacting with the elastic vibrations of the sample, which were determined by the method of resonance mechanical spectroscopy in [1].
Conclusion
A detailed examination of the structure of the high-entropy alloy Al0.5CoCrCuFeNi at room temperature was carried out using different methods of electron microscopy and X-ray structural analysis techniques.
It was found that the initial ingots of the studied alloy have a dendritic structure, which is formed during the creation of ingots by the argon-arc method with directed heat removal. The chemical composition and structure of dendrites and interdendritic region, as well as their evolution during annealing, were studied. It was observed that the composition of dendritic regions remains virtually unchanged, whereas in the interdendritic regions, the concentrations of copper and aluminum decrease while the content of other elements increases. Predominantly at the boundaries between dendritic and interdendritic regions, areas enriched with Ni, Al, and Cu tend to form. Additionally, due to structural-phase transformations, the bcc phase is released within the fcc matrix.
Numerical estimates of the dislocation density , the mean size of the ordered (crystalline) domains
and lattice micro strain were obtained through Williamson–Hall analysis of XRD patterns. The obtained estimates correlate with the estimates of the density of dislocations effectively interacting with the elastic vibrations of the sample, which were determined by the method of resonance mechanical spectroscopy.
Acknowledgments
The authors are grateful to Dr. M.A. Tikhonovsky for the samples provided for research and valuable discussions. The authors thank Dr. Damian Szymański for conducting Al0.5CoCuNiFe alloy elemental composition measurement. This work was partly supported by the NRFU (Grant 2023.03/0012); Projects No.0122U001504 and No.0124U000272 NAS of Ukraine and internship within the framework of scientific cooperation between the National Academy of Sciences of Ukraine and the Polish Academy of Sciences.
References
- Natsik, V.D.; Semerenko; Y. O.; Tabachnikova, E.D. Dislocation mechanisms of acoustic relaxation and plastic deformation of a high-entropy alloy Al0.5CoCrCuFeNi under moderate to deep cooling conditions: Experiment and theory (Review). Low Temp. Phys. 2025, 51, 282–299. [Google Scholar] [CrossRef]
- Tsai, C.-W.; Tsai, M.-H.; Yeh, J.-W.; Yang, C.-C. Effect of temperature on mechanical properties of Al0.5CoCrCuFeNi wrought alloy. J. Alloys Compd. 2010, 490, 160–165. [Google Scholar] [CrossRef]
- Laktionova, M.O.; Tabachnikova, O.D.; Tang, Z. Liaw, P.;. Mechanical properties of the high-entropy alloy Al0.5CoCrCuFeNi at temperatures of 4.2–300 K. Low Temp. Phys. 2013, 39, 630–632. [Google Scholar] [CrossRef]
- Semerenko, Y.O.; Tabachnikova, O.D.; Tikhonovska, T.M.; Kolodiy, I.V.; Tortika, O.S.; Shumilin, S.E.; Laktionova, M.O. Temperature Dependence of the Acoustic and Mechanical Properties of Cast and Annealed High-Entropy Al0.5CoCuCrNiFe Alloy. Metallofiz. Noveishie Tekhnol. 2015, 37, 1527–1538. (in Russian). [Google Scholar] [CrossRef]
- Tabachnikova, E.D.; Laktionova, M.A.; Semerenko, Y.A.; Shumilin, S.E.; Podolskiy, A.V.; Tikhonovsky, M.A.; Miskuf, J.; Csach, K. Mechanical properties of Al0.5CoCrCuFeNi high entropy alloy in different structural states in temperature range 0.5–300 K. Low Temp. Phys. 2017, 43, 1108–1118. [Google Scholar] [CrossRef]
- Semerenko, Y.A.; Natsik, V.D. Low temperature peak of internal friction in high entropy Al0.5CoCrCuFeNi alloy. Low Temp. Phys. 2020, 46, 78–86. [Google Scholar] [CrossRef]
- Semerenko, Y.; Natsik, V.; Tabachnikova, E.D.; Huang, Y.; Langdon, T.G. Mechanisms of Low-Temperature Dislocation Motion in High-Entropy Al0.5CoCrCuFeNi Alloy. Metals 2024, 14, 778. [Google Scholar] [CrossRef]
- Pickering, E.J.; Stone, H.J.; Jones, N.G. Fine-scale precipitation in the high-entropy alloy Al0.5CrFeCoNiCu. Mat. Sci. Eng. 2015, A645, 65–71. [Google Scholar] [CrossRef]
- Hsu, Y.J.; Chiang, W.C.; Wu, J.K. Corrosion behavior of FeCoNiCrCux high-entropy alloys in 3.5% sodium chloride solution. Mater. Chem. Phys. 2005, 92, 112–117. [Google Scholar] [CrossRef]
- Novak, T.G.; Vora, H.D.; Mishra, R.S.; Young, M.L.; Dahotre, N.B. Synthesis of Al0.5CoCrCuFeNi and Al0.5CoCrFeMnNi High-Entropy Alloys by Laser Melting. Metall Mater. Trans. 2014, 45, 1603–1607. [Google Scholar] [CrossRef]
- Mirkin, L.I. Handbook of X-Ray Analysis of Polycrystalline Material; Consultants Bureau: New York, 1964; 731p. [Google Scholar]
- Williamson, G.K.; Hall, W.H. X-ray line broadening from filed aluminium and wolfram. Acta Met. 1953, 1, 22–31. [Google Scholar] [CrossRef]
- Patterson, A. The Scherrer Formula for X-Ray Particle Size Determination. Phys. Rev. 1939, 56, 978–982. [Google Scholar] [CrossRef]
- Williamson, G.K.; Smallman, R.E.; III. Dislocation densities in some annealed and cold-worked metals from measurements on the X-ray Debye-Scherrer spectrum. Phil. Mag. 1956, 1, 34–46. [Google Scholar] [CrossRef]
Figure 1.
Microstructure of a sample of high-entropy alloy Al0.5CoCuCrNiFe in the initial cast state (I). The inset shows the structure on a larger scale.
Figure 1.
Microstructure of a sample of high-entropy alloy Al0.5CoCuCrNiFe in the initial cast state (I). The inset shows the structure on a larger scale.
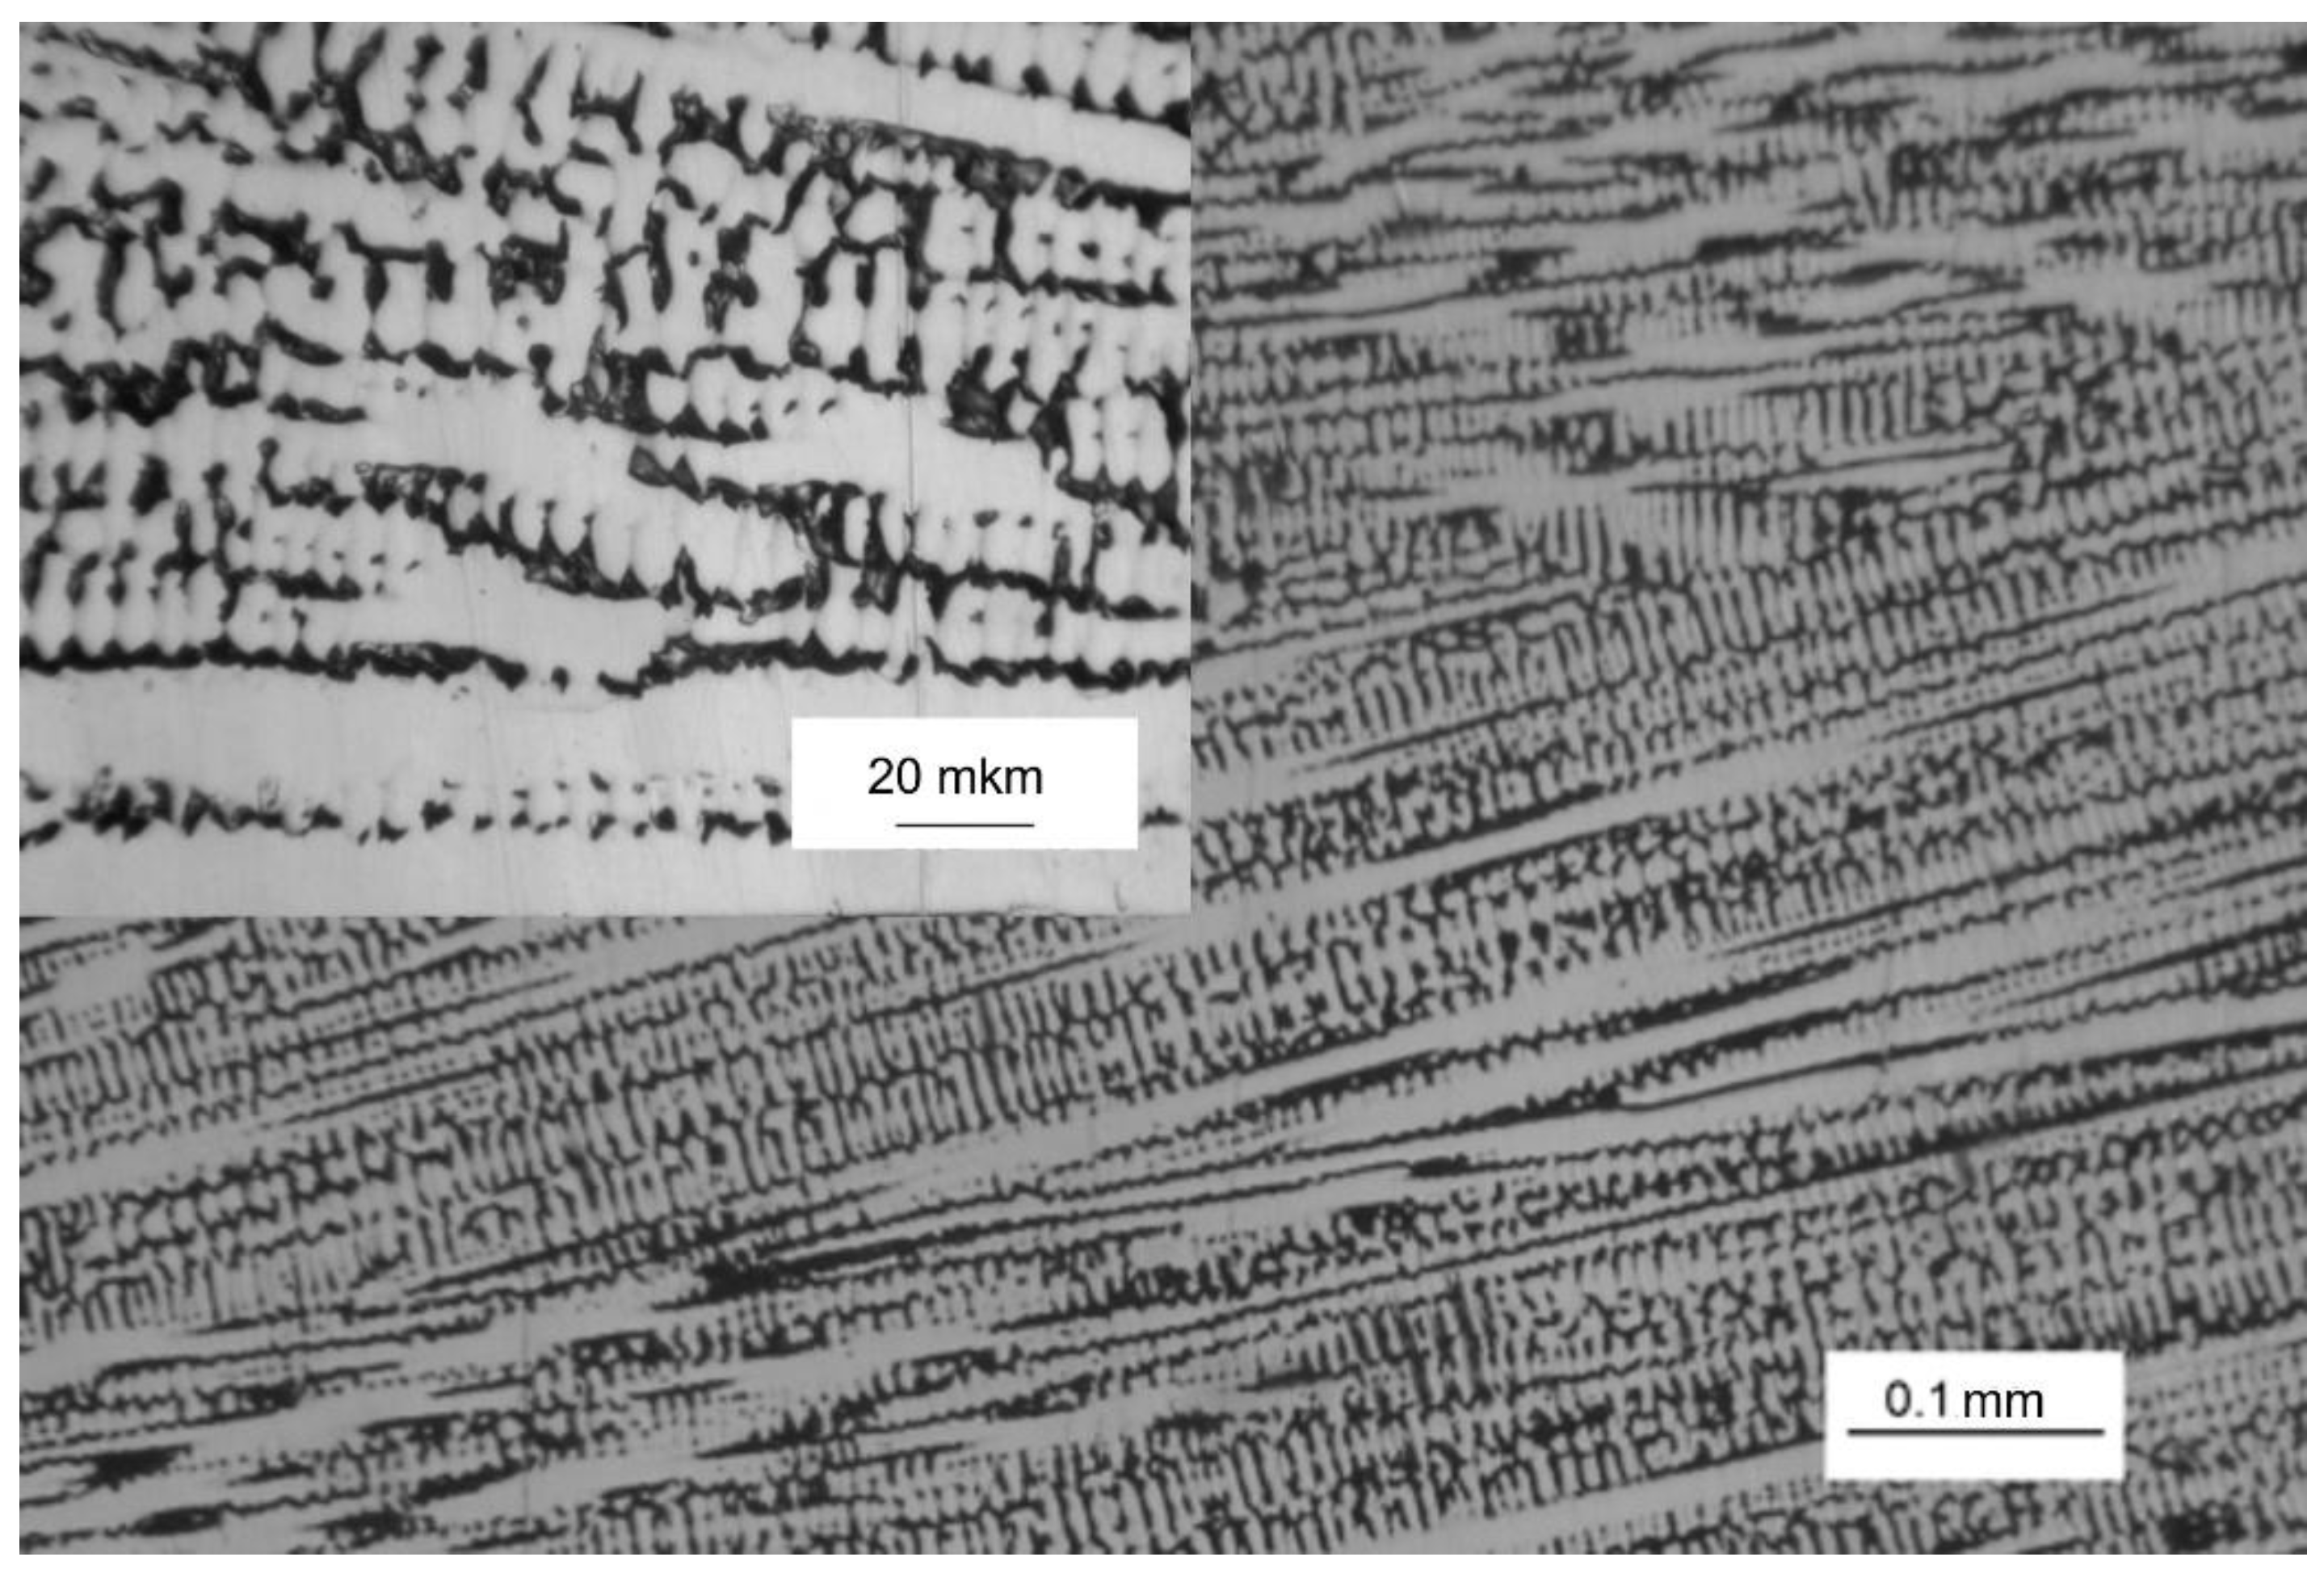
Figure 2.
The EDS patterns for the high-entropy alloy Al0.5CoCuNiFe in structural state (II): a, b - pattern for two different regions of the ingot (A and B, respectively).
Figure 2.
The EDS patterns for the high-entropy alloy Al0.5CoCuNiFe in structural state (II): a, b - pattern for two different regions of the ingot (A and B, respectively).


Figure 3.
X-ray diffraction patterns of the high-entropy alloy Al0.5CoCuCrNiFe: a) initial cast state (I); b) after annealing at 1250 K for 6 hours - state (II).
Figure 3.
X-ray diffraction patterns of the high-entropy alloy Al0.5CoCuCrNiFe: a) initial cast state (I); b) after annealing at 1250 K for 6 hours - state (II).
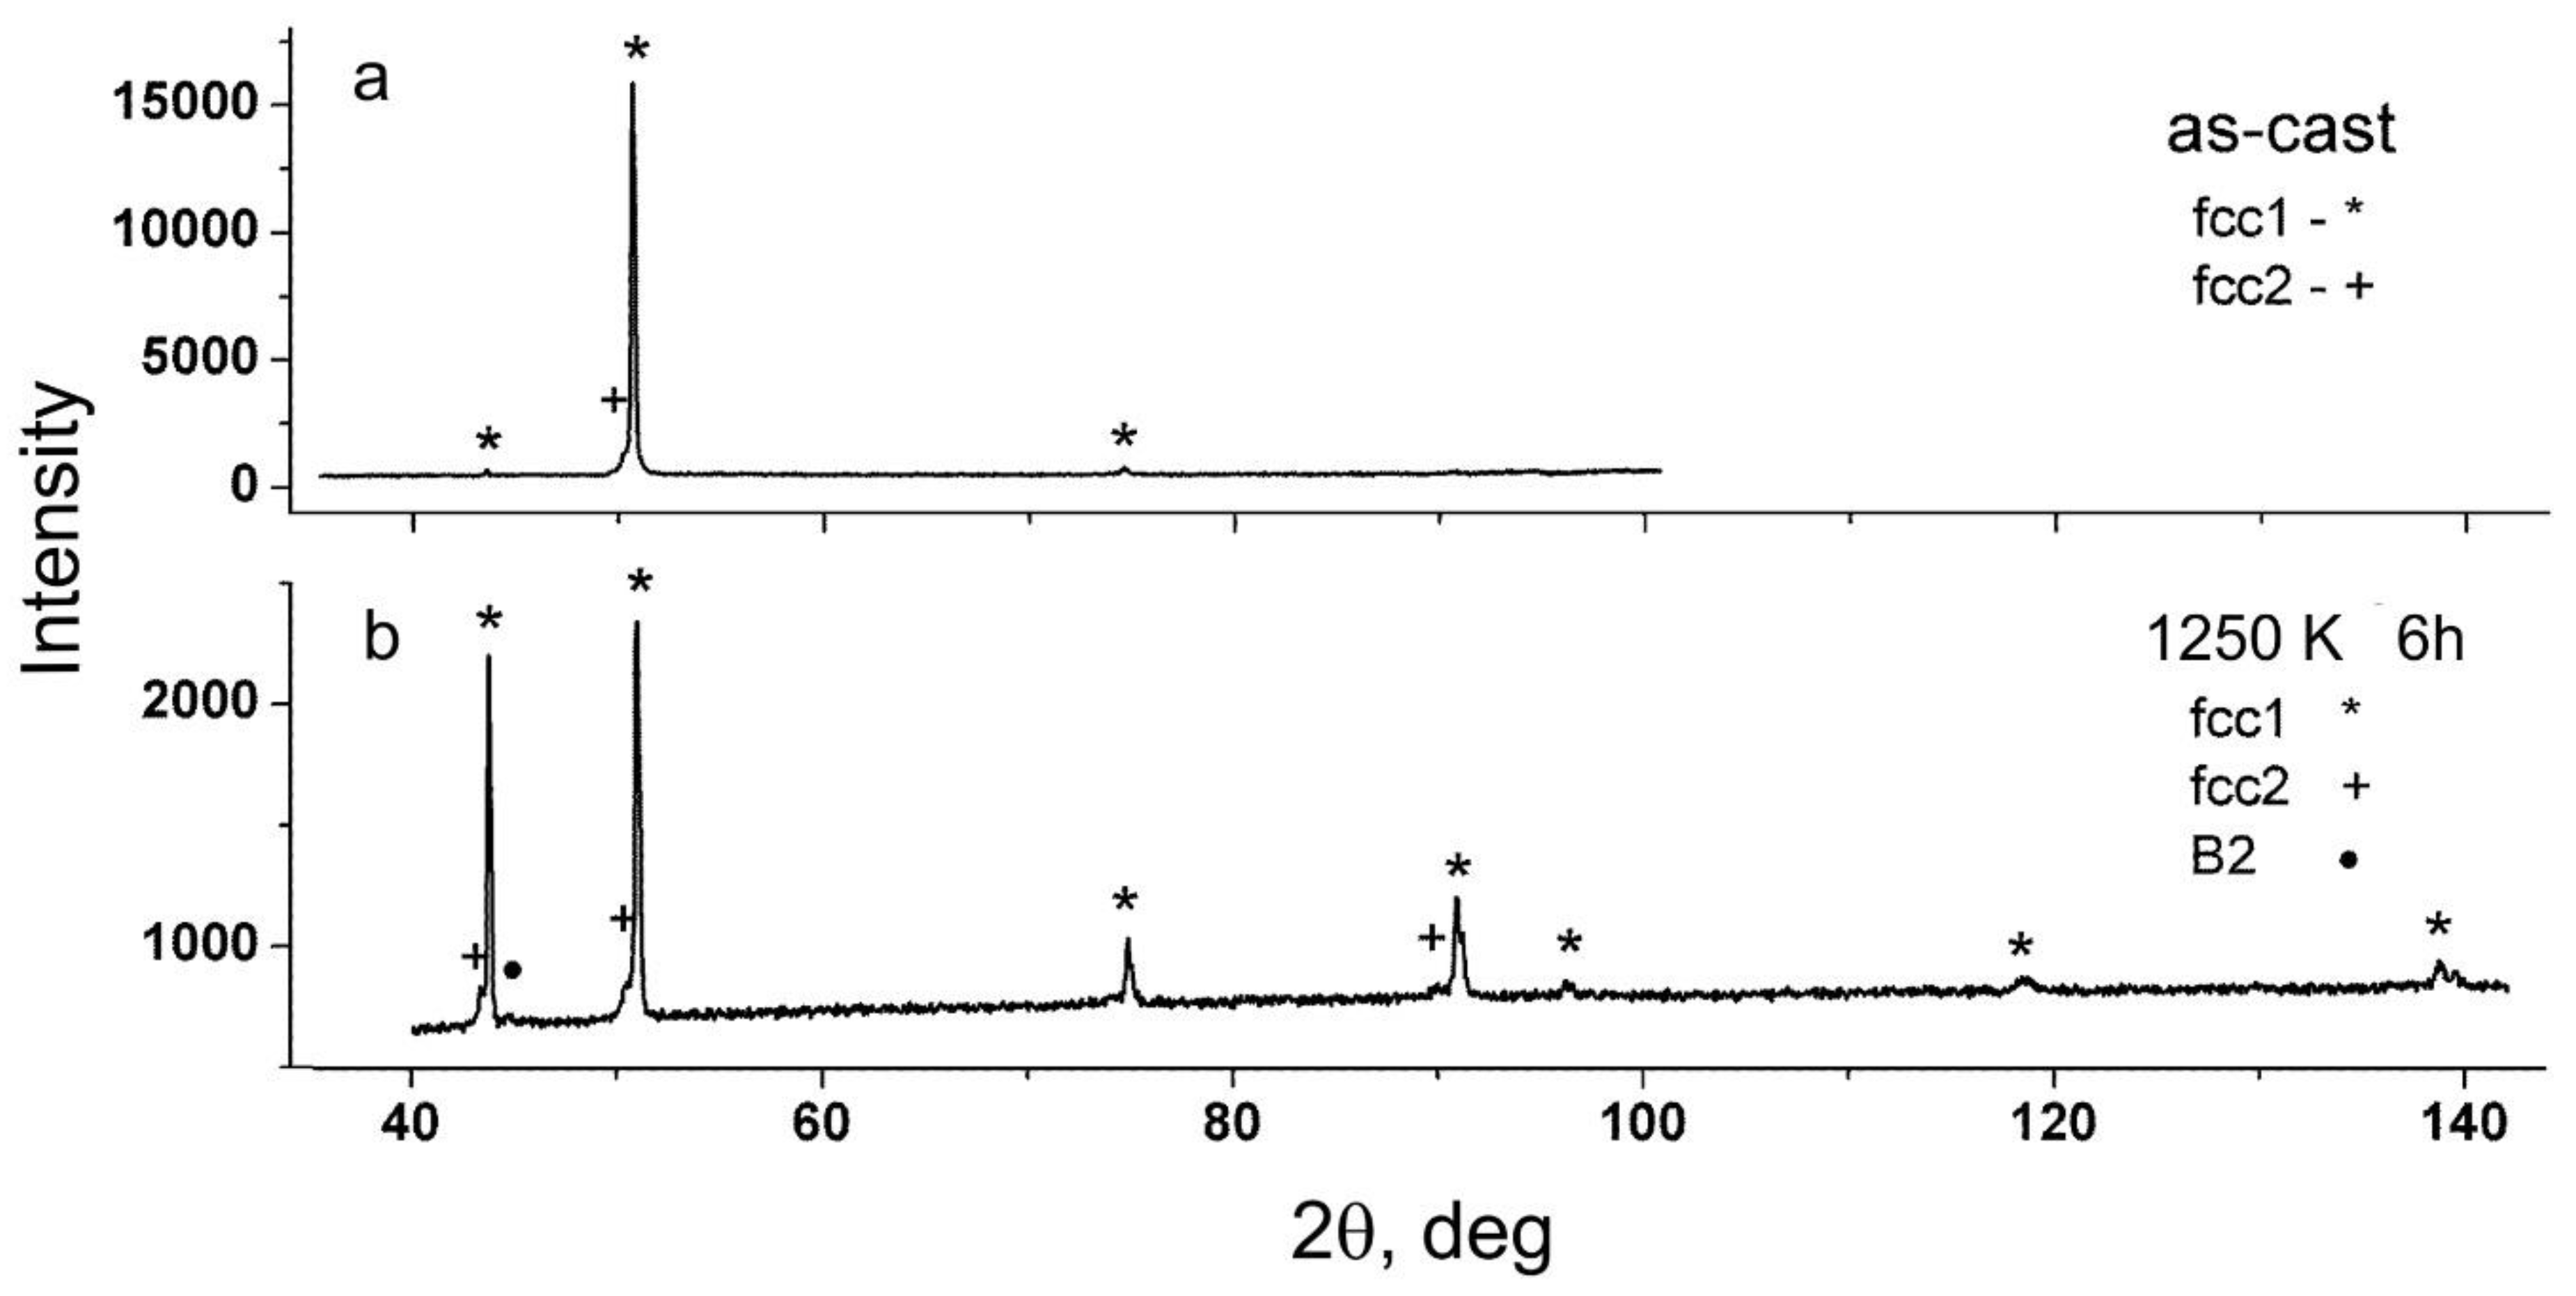
Figure 4.
The data of scanning electron microscopy using an X-ray microanalyser for Al0.5CoCuCrNiFe HEA in the initial cast state (I).
Figure 4.
The data of scanning electron microscopy using an X-ray microanalyser for Al0.5CoCuCrNiFe HEA in the initial cast state (I).
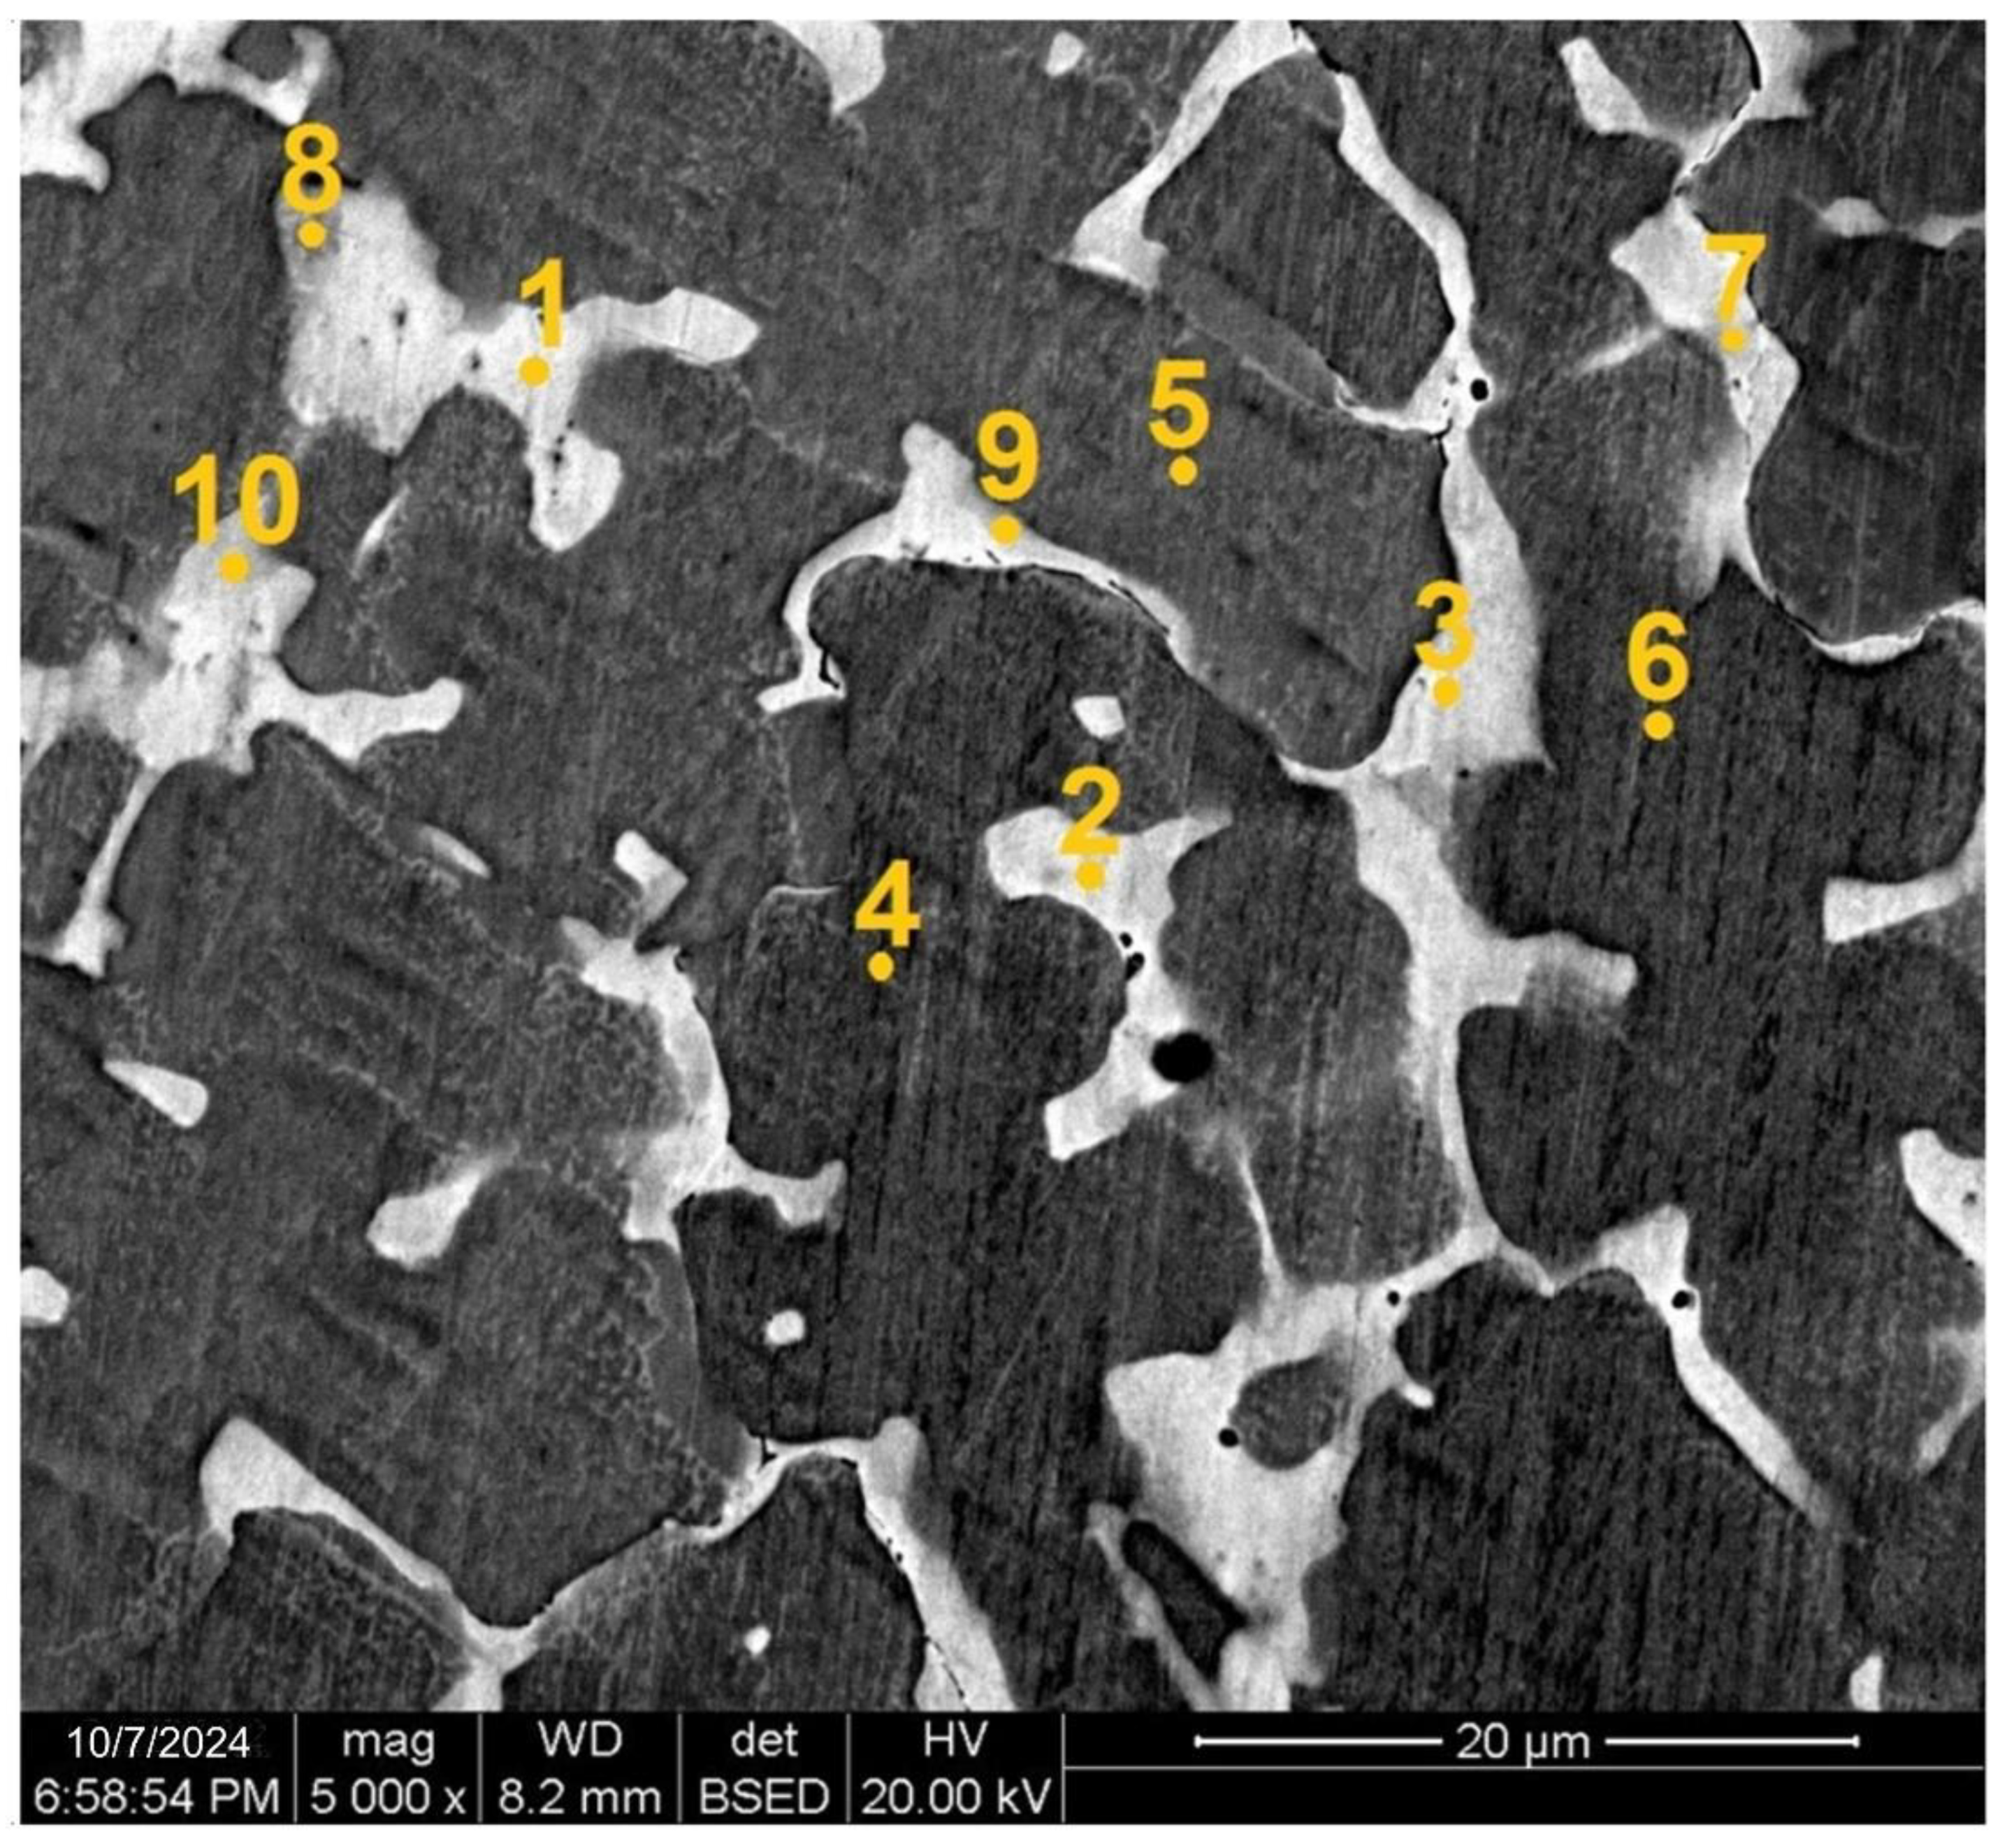
Figure 5.
The data of scanning electron microscopy using an x-ray microanalyser for Al0.5CoCuCrNiFe HEA in the state (II).
Figure 5.
The data of scanning electron microscopy using an x-ray microanalyser for Al0.5CoCuCrNiFe HEA in the state (II).
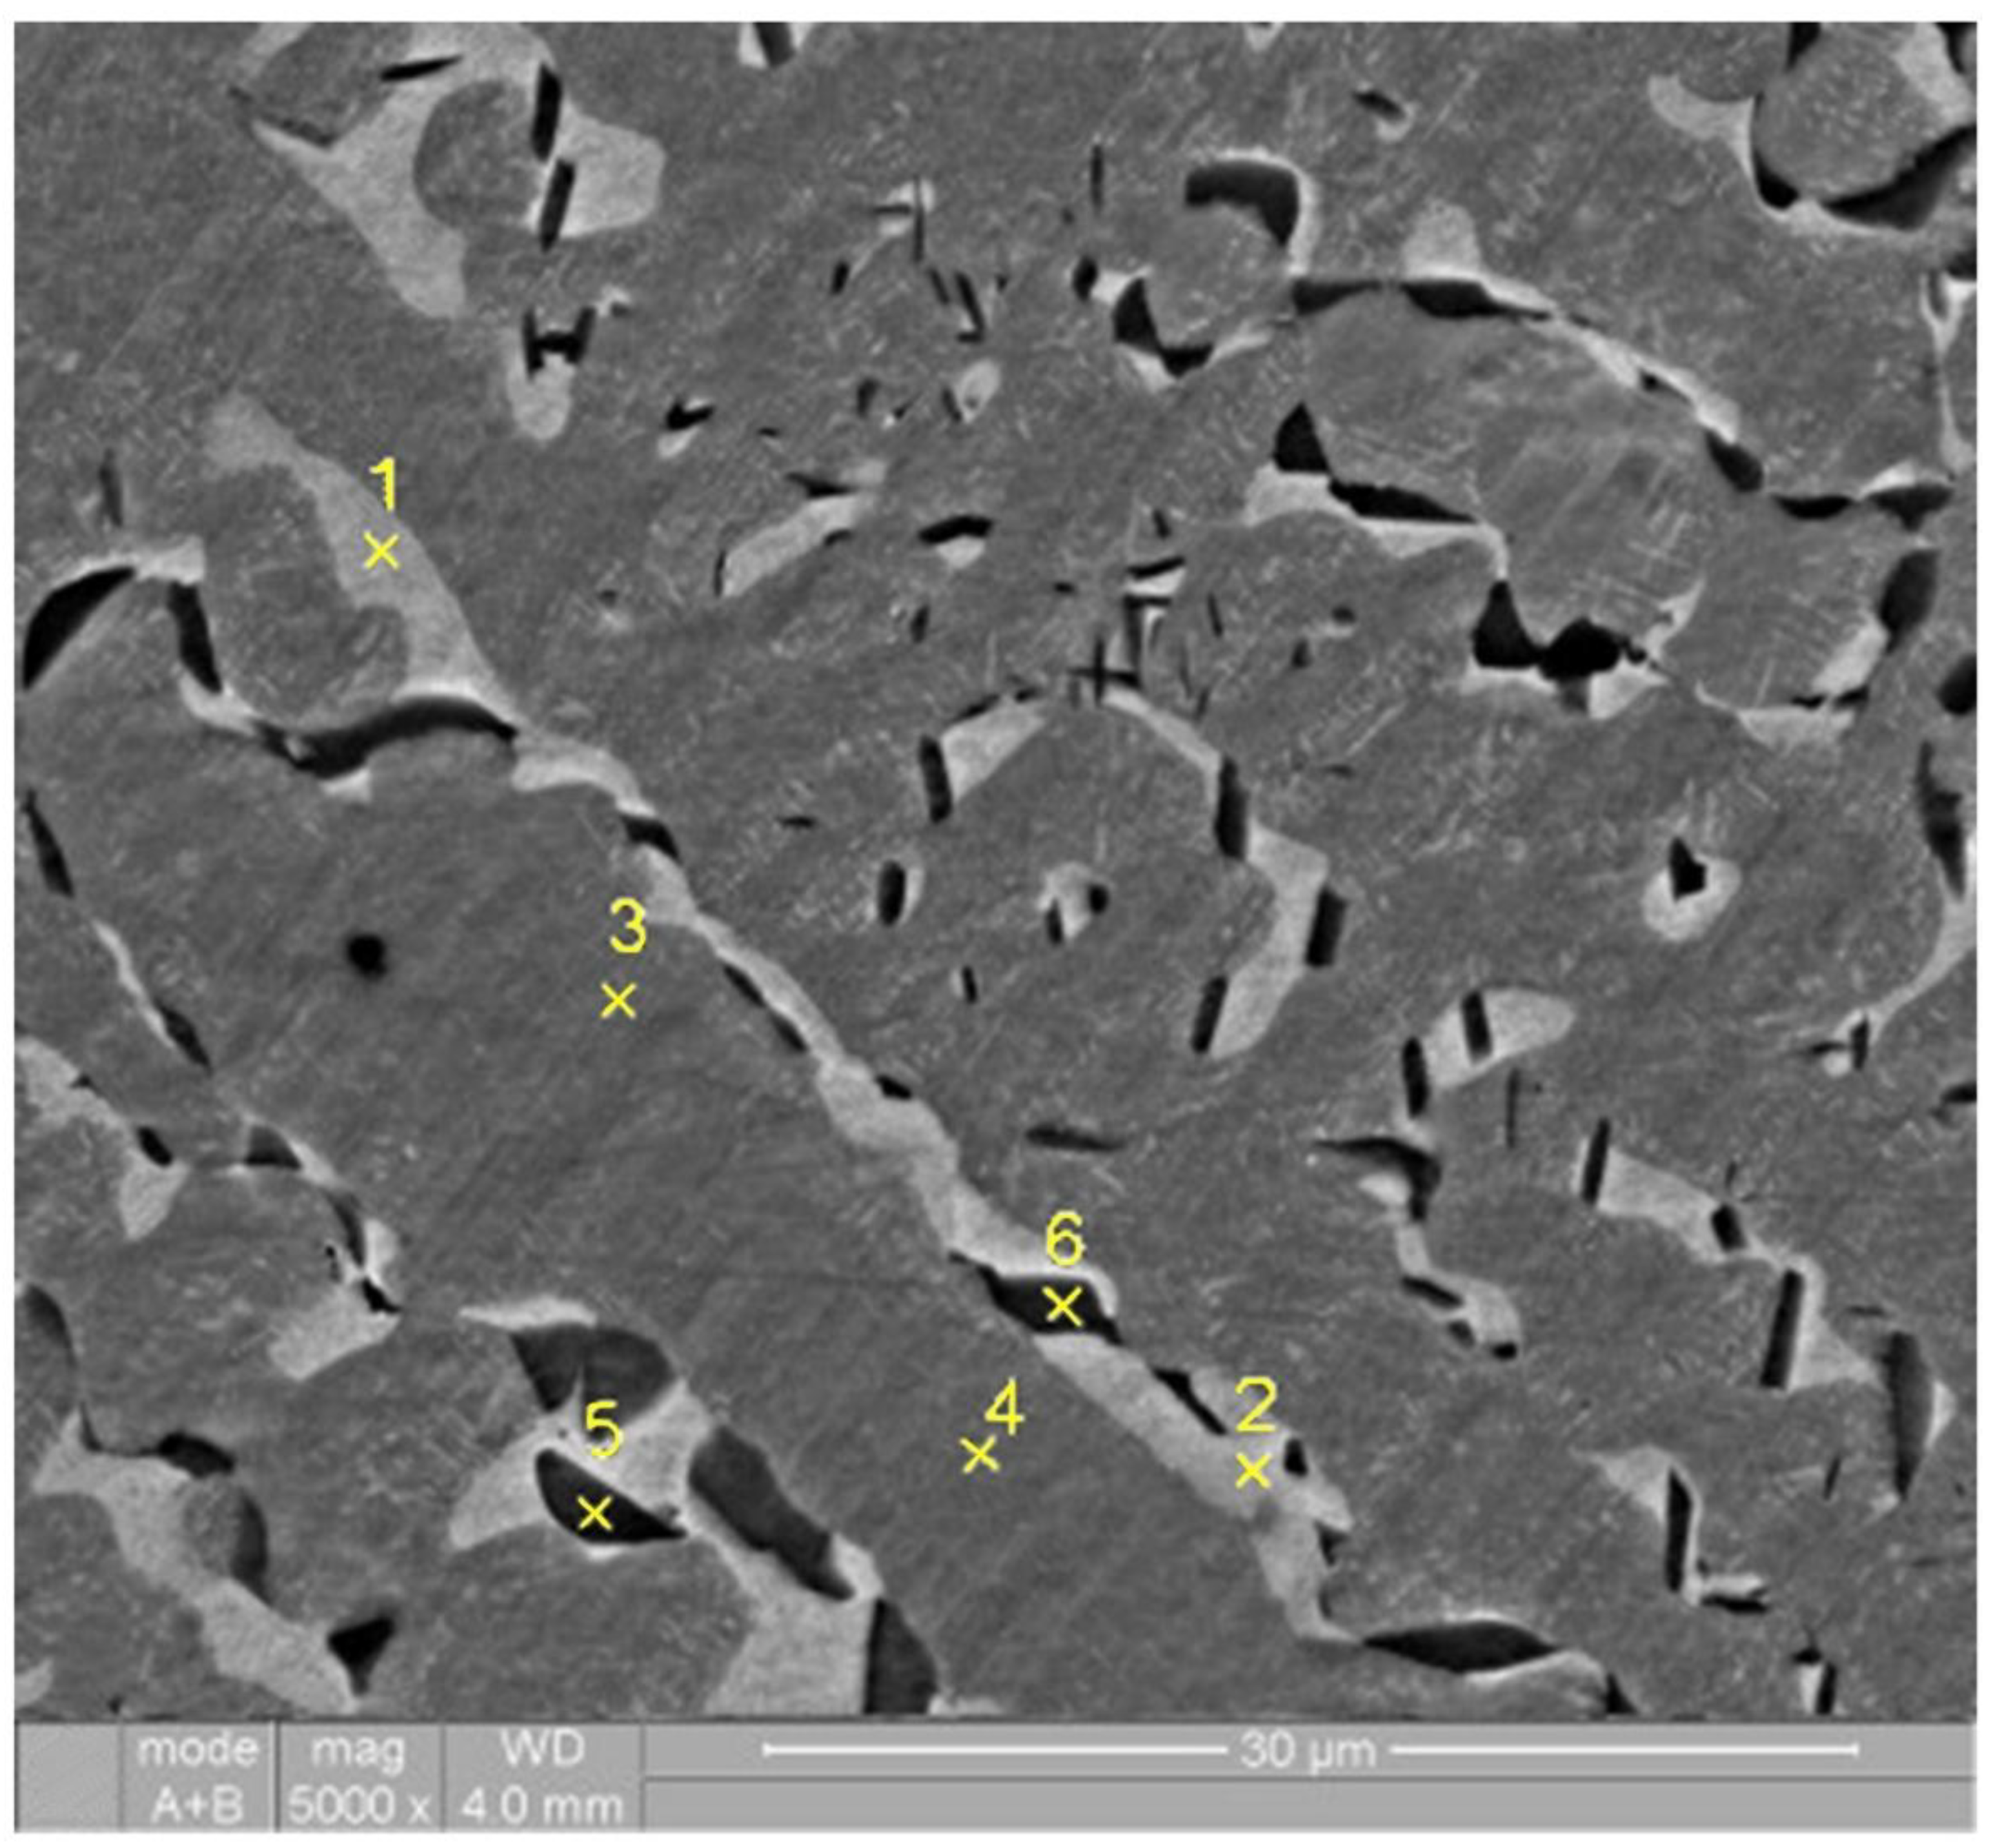
Figure 6.
The XRD patterns of two samples (A and B) cut from different adjacent regions of a high-entropy alloy Al0.5CoCuNiFe sample in structural state (II): a, b - pattern for two different regions (A and B, respectively).
Figure 6.
The XRD patterns of two samples (A and B) cut from different adjacent regions of a high-entropy alloy Al0.5CoCuNiFe sample in structural state (II): a, b - pattern for two different regions (A and B, respectively).


Figure 7.
Williamson–Hall plot for the specimens of the high-entropy alloy Al0.5CoCuNiFe: a) is the part A of the sample; b) is the part B.
Figure 7.
Williamson–Hall plot for the specimens of the high-entropy alloy Al0.5CoCuNiFe: a) is the part A of the sample; b) is the part B.
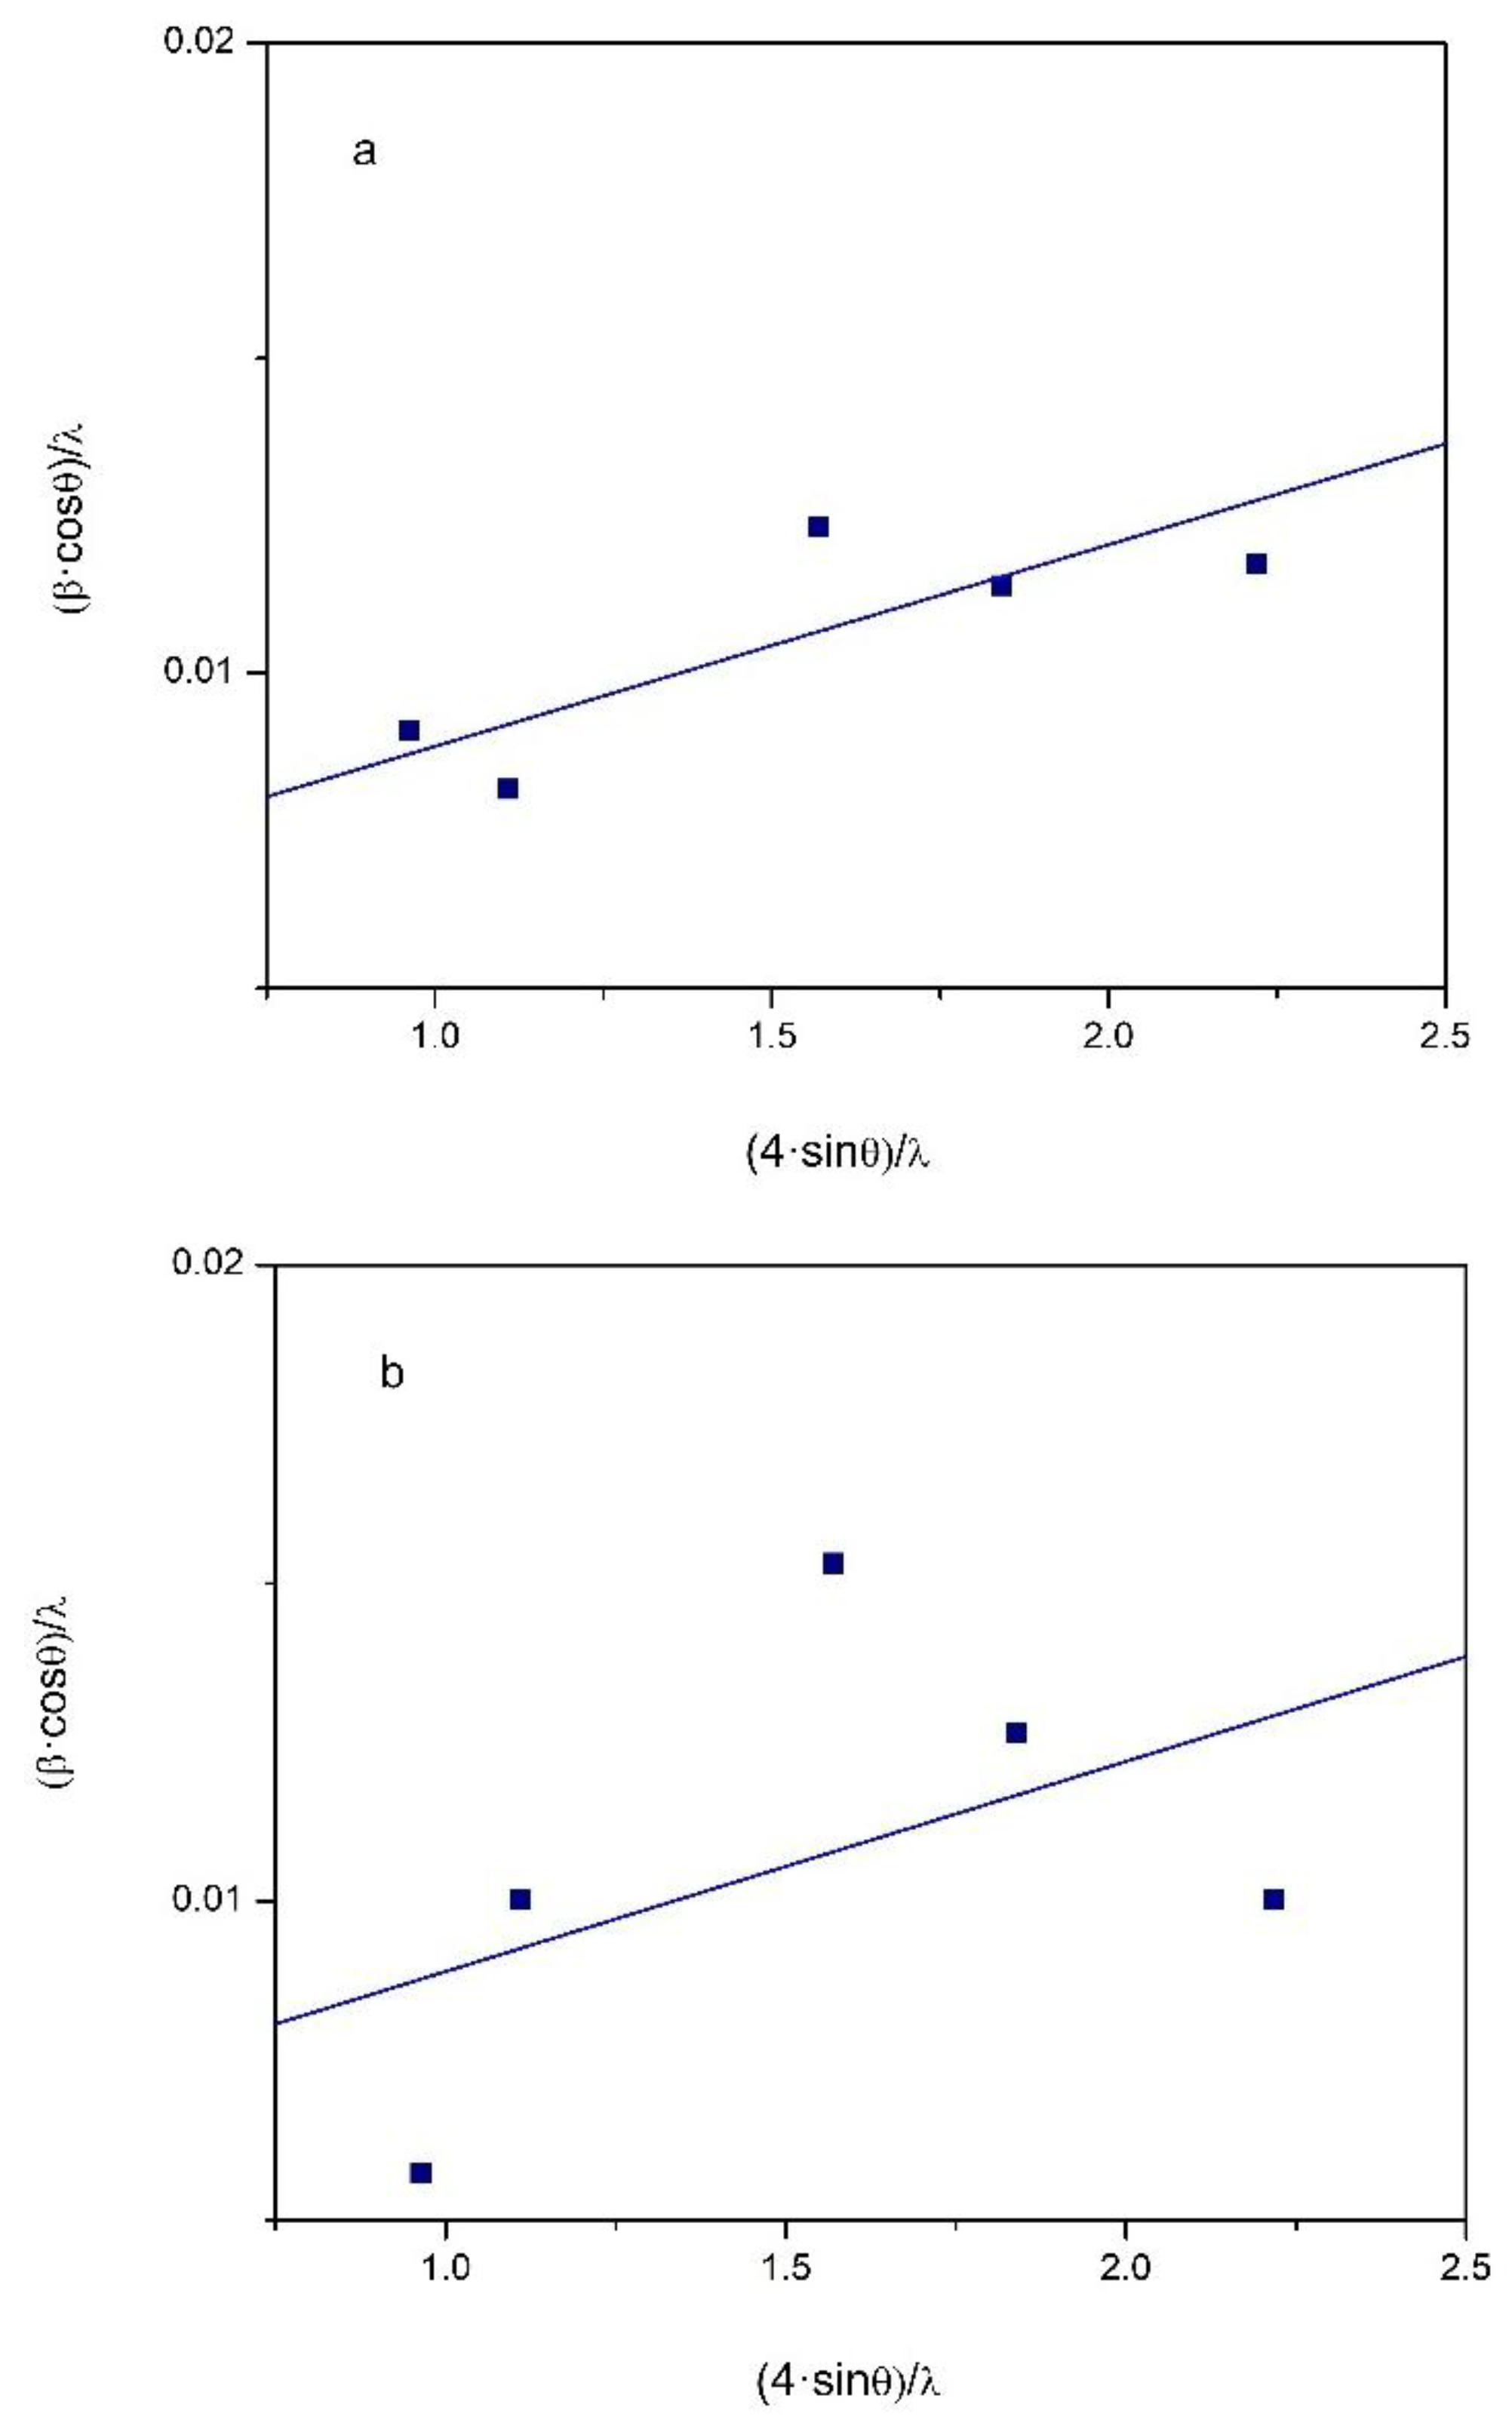

Table 1.
X-ray diffraction data of the Al0.5CoCuCrNiFe HEA in the initial cast state (I).
| Phase | Miller indices, hkl |
2θ angle, deg° |
Intensity, imp/sec |
Lattice parameter a, Å |
| fcc1 | 111 | 55.573 | 194.6 | 3.596 |
| 200 | 65.079 | 14438.7 | ||
| 220 | 99.183 | 220.0 | ||
| fcc2 | 200 | 64.568 | 791.0 | 3.625 |
Table 2.
Chemical composition of high-entropy alloy Al0.5CrCuNiFeCo in the initial cast state (I) according to X-ray microanalysis data.
Table 2.
Chemical composition of high-entropy alloy Al0.5CrCuNiFeCo in the initial cast state (I) according to X-ray microanalysis data.
| region | point of scanning | chemical element | |||||
|---|---|---|---|---|---|---|---|
| Al, at % |
Cr, at % |
Fe, at % |
Co, at % |
Ni, at % |
Cu, at % |
||
| interdendritic region, fcc2 |
1 | 14.61 | 3.18 | 3.66 | 3.92 | 10.08 | 64.55 |
| 2 | 14.30 | 2.69 | 3.29 | 3.50 | 8.81 | 67.40 | |
| 3 | 14.61 | 3.38 | 4.02 | 4.38 | 11.25 | 62.37 | |
| 7 | 15.27 | 7.46 | 7.85 | 7.96 | 15.98 | 45.47 | |
| 9 | 15.66 | 8.23 | 7.86 | 7.80 | 14.06 | 46.38 | |
| 10 | 16.42 | 5.73 | 6.24 | 6.43 | 15.45 | 49.72 | |
| 8 | 13.98 | 13.55 | 13.58 | 13.45 | 19.21 | 26.23 | |
| dendrites, fcc1 |
4 | 8.78 | 21.74 | 21.13 | 20.61 | 17.83 | 9.91 |
| 5 | 7.81 | 22.59 | 22.25 | 21.67 | 16.84 | 8.83 | |
| 6 | 7.92 | 22.60 | 22.12 | 21.28 | 17.03 | 9.05 | |
Table 3.
X-ray diffraction data of the Al0.5CoCuCrNiFe HEA in the state (II).
| Phase | Miller indices, hkl |
2θ angle, deg° |
Intensity, imp/sec |
Lattice parameter a, Å |
|---|---|---|---|---|
| fcc1 | 111 | 43.672 | 1551.5 | 3.588 |
| 200 | 50.873 | 1619.0 | ||
| 220 | 74.789 | 249.5 | ||
| 311 | 90.814 | 351.7 | ||
| 222 | 96.113 | 68.7 | ||
| 400 | 118.334 | 46.7 | ||
| 331 | 138.696 | 92.2 | ||
| fcc2 | 111 | 43.250 | 139.2 | 3.620 |
| 220 | 50.390 | 123.1 | ||
| 311 | 89.784 | 45.8 | ||
| bcc | 110 | 44.610 | 42.0 | 2.870 |
Table 4.
Chemical composition of high-entropy alloy Al0.5CrCuNiFeCo in the state (II) according to X-ray microanalysis data.
Table 4.
Chemical composition of high-entropy alloy Al0.5CrCuNiFeCo in the state (II) according to X-ray microanalysis data.
| region | point of scanning | chemical element | |||||
|---|---|---|---|---|---|---|---|
| Al, at % |
Cr, at % |
Fe, at % |
Co, at % |
Ni, at % |
Cu, at % |
||
| interdendritic region, fcc2 |
1 | 8.92 | 6.39 | 6.37 | 6.28 | 15.48 | 56.56 |
| 2 | 7.51 | 6.21 | 5.88 | 5.79 | 12.55 | 62.05 | |
| bcc (type B2) |
5 | 21.07 | 6.34 | 8.99 | 11.31 | 30.03 | 22.26 |
| 6 | 21.44 | 7.03 | 8.32 | 10.09 | 25.23 | 27.88 | |
| dendrites, fcc1 |
3 | 5.99 | 22.39 | 21.48 | 20.58 | 18.17 | 10.79 |
| 4 | 6.04 | 21.72 | 21.22 | 20.64 | 18.84 | 11.54 | |
Table 5.
The result of XRD patterns analysis of the high-entropy alloy Al0.5CoCuNiFe.
| sample | Miller indices, hkl |
angle, deg | Interplanar spacing d, Å |
FWHM, degrees |
Intensity, imp/sec | Area | Average lattice parameter a, Å |
|---|---|---|---|---|---|---|---|
|
A see Figure 6а |
111 | 43.507 | 2.078 | 0.61 | 8774 | 7890.76 | 3.604 |
| 200 | 50.580 | 1.803 | 0.55 | 11139 | 9634.35 | ||
| 220 | 74.340 | 1.275 | 1.10 | 615 | 1116.99 | ||
| 311 | 90.270 | 1.087 | 0.98 | 2518 | 3973.00 | ||
| 400 | 117.540 | 0.900 | 1.10 | 685 | 1134.59 | ||
|
B see Figure 6b |
111 | 43.560 | 2.076 | 0.57 | 11146 | 9074.80 | 3.606 |
| 200 | 50.560 | 1.804 | 0.68 | 4998 | 5363.54 | ||
| 220 | 74.420 | 1.274 | 1.09 | 1082 | 1772.99 | ||
| 311 | 90.220 | 1.087 | 1.08 | 2506 | 4241.30 | ||
| 222 | 95.480 | 1.040 | 1.80 | 309 | 590.32 | ||
| 400 | 117.30 | 0.902 | 1.38 | 197 | 496.60 |
Disclaimer/Publisher’s Note: The statements, opinions and data contained in all publications are solely those of the individual author(s) and contributor(s) and not of MDPI and/or the editor(s). MDPI and/or the editor(s) disclaim responsibility for any injury to people or property resulting from any ideas, methods, instructions or products referred to in the content. |
© 2025 by the authors. Licensee MDPI, Basel, Switzerland. This article is an open access article distributed under the terms and conditions of the Creative Commons Attribution (CC BY) license (http://creativecommons.org/licenses/by/4.0/).
Copyright: This open access article is published under a Creative Commons CC BY 4.0 license, which permit the free download, distribution, and reuse, provided that the author and preprint are cited in any reuse.


