
Submitted:
27 May 2025
Posted:
28 May 2025
You are already at the latest version
Abstract
Yersinia pestis Ail (attachment invasion locus protein) is an outer membrane β-barrel made up of a cylindrical, anti-parallel β-sheet with a hydrophobic peripheral and a hydrophilic center. It has a diverse set of functions that facilitate successful resistance to defense mechanisms of the host organism in the process of host-pathogen interactions. Among them are inhibition of the complement bactericidal activity, attachment and Yersinia outer proteins delivery to host tissue, prevention of polymorphonuclear leukocytes recruitment to the lymph nodes, and inhibition of the inflammatory response. However, previous studies have all focused almost exclusively on a single Ail isoform. Here, we analyze and discuss the polymorphisms of Y. pestis Ail, their potential influence on structural dynamics as well as intrinsic disorder predisposition of this protein. The natural polymorphism is restricted to functionally important loops. We use molecular dynamics simulations and intrinsic disorder predictions to assess how these polymorphisms affect Ail conformational dynamics, revealing that minor sequence divergences correlate with distinst dynamic profiles indicating isoform-specific modulation of Ail function.
Keywords:
Yersinia pestis
; pathogenicity
; Ail
; polymorphism
; protein structure
; in silico characterization
1. Introduction
Yersinia pestis is a category A select agent that can be found in populations of more than 200 species of wild rodents and was responsible for the deaths of more than 200 million people during multiple plague pandemics [1,2,3]. During evolution, different phylogenetic groups of this bacterial pathogen adapted to the effective circulation in the ecosystems of different natural plague foci due to the allele polymorphisms of the genes coding for some pathogenicity factors and housekeeping genes. Polymorphisms of genes encoding the synthesis of capsular antigen F1 (CaF1) [4,5], V antigen [6], plasminogen activator Pla [7,8], and lipopolysaccharide [9] have been studied in quite detail. However, much less attention has been paid to the Y. pestis Ail protein, which has been found to be an important virulence factor during plague infection [10]. The Y. pestis Ail is involved in bacterial autoaggregation [11], adhesion to and internalization into host cells [12,13,14], Yersinia outer proteins (Yop) delivery [11], serum resistance [15,16], and inhibition of inflammatory response [17].
It has been believed that the Ail protein is highly conserved within Y. pestis species [10], but it was recently shown that different isoforms of Ail are characteristic of different phylogenetic groups of the microbe [18] circulating in populations of different species of voles in natural plague foci located in different countries of Eurasia [18,19]. The straightforward way to perform their comparative study would be to collect strains with the all variants of the ail gene in one laboratory, construct their knockout mutants, and then cross-complement the mutations. However, while scientists can freely exchange genetic information with each other, exchange with strain specimens of category A select agent is limited [20]. Another way to conduct a comparative assessment of Ail isoforms is to synthesize allelic genes in vitro and use these synthesized genes to complement Δail mutations. Unfortunately, to construct representative sets of isogenic strains, including wild-type isolates with different ail alleles, their Δail derivatives, as well as cross-complemented ones, it is also necessary to overcome almost insurmountable export control restrictions. Thus, today in silico study of the properties of Ail isoforms offers the most accessible means of their comparative assessment.
In the current work, the primary sequences of Ail proteins from 84 strains of Y. pestis were aligned and compared in order to characterize their natural polymorphisms. Analysis of polymorphisms of Y. pestis ail gene with the help of multiple sequence alignment allowed us to identify nine natural isoforms of the ail gene in different Y. pestis strains. Then, these nine Ail isoforms were subjected to extensive molecular dynamics simulations and structural-dynamic characterization to understand the effect of sequence polymorphisms on intrinsic disorder propensity, structural and dynamic aspects of the Y. pestis Ail variants.
2. Results and Discussion
2.1. Evolutionary Aspects of Ail Polymorphism
Analyzing Y. pestis Ail polymorphism via multiple sequence alignment nine natural isoforms of Ail were found in different strains of Y. pestis showing a very high degree of sequence homology (98.32%). Figure 1 illustrates this observation by showing results of the multiple sequence alignment of these proteins using the MEGA11 [21].
Analysis of data shown in Figure 1 illustrates that Yersinia Ail can exist in nine isoforms:
1—The ancestral isoform (found in Y. pseudotuberculosis IP 32953 as well as in Y. pestis 0.PE7 and 0.PE4A);
2—The microti isoform caucasica (found in Y. pestis subsp. microti bv. caucasica, 0.PE2);
3—The microti isoform angola (found in Y. pestis strain Angola, 0.PE3);
4—The microti isoform 0.PE4B/ 0.PE4С var1 (found in Y. pestis subsp. microti bv. talassica, altaica and hissarica, 0.PE4B and bv. qinghaiensis (0.PE4C);
5—The microti isoform 0.PE4С var2 (found in some strains Y. pestis subsp. microti bv. xilingolensis, 0.PE4C);
6—The microti isoform 0.PE4С var3 (found in some strains Y. pestis subsp. microti bv. xilingolensis, 0.PE4C);
7—The pestis-microti isoform (found in Y. pestis subsp. microti bv. ulegeica, 0.PE5 and Y. pestis subsp. pestis except SNP- types 0.ANT1, 2.ANT);
8—The pestis isoform 0.ANT1 (found in Y. pestis subsp. pestis 0.ANT1);
9—The pestis isoform 2.ANT (found in Y. pestis subsp. pestis 2.ANT).
To further illustrate the peculiarities of Ail microevolution, the phylogenetic relationships of different Yersinia Ail isoforms are shown in Figure 2. This Y. pestis phylogeny scheme was adapted from the SNP-based phylogenetic tree generated using SplitsTree4 (http://www.splitstree.org/) [22]. Analysis of the Y. pestis whole-genome sequences available from GenBank/EMBL/DDBJ was performed using Wombac 2.0 (Bacterial core Genome SNPs for Phylogenomic Trees from NGS Reads and / or draft genomes; http://www.mybiosoftware.com/wombac-1–1-bacterial-core-genome-snps-phy logenomic-trees-ngs-reads-andor-draft-genomes.html).
Figure 2 shows that Y. pestis 0.PE7 has the identical Ail of Y. pseudotuberculosis IP 32953. Y. pseudotuberculosis IP32953 (O:1b) is traditionally used in Y. pestis phylogenetic studies as the closest out-group representative of the mutual progenitor belonging to O:1b [23]. Y. pestis 0.PE7 is the oldest currently existing branch of Yersinia pestis bacteria. Probably, the same Ail isoform had the ancestor of Y. pestis. The second branch seceded from Y. pestis tree is subsp. microti bv. caucasica, all of its representatives have Ail of the microti isoform caucasica characterized by additional S insertion at position 134. This change is in the extracellular loop 3 (EL 3) that is involved in binding vitronectin, factor H, C4BP, as well as maintaining the Y. pestis serum resistance phenotype (Figure 1) [11,24,25]. Third Ail isoform belongs to unique strain Angola of Y. pestis (0.PE3) and has changes F80L and R136I, K138E in extracellular loop 2 and 3. SNP-type 0.PE4 is the most polymorphic group of Y. pestis by the presence of Ail isoforms. Distal branch 0.PE4A has the identical Ail of Y. pseudotuberculosis IP 32953. SNP-groups 0.PE4B and 0.PE4C has polymorphism F80V. Y. pestis subsp. microti bv. xilingolensis acquired additional polymorphism. Part of them has D85G, another has D85Y change. All of these polymorphisms are in extracellular loop 2 of Ail (Figure 1 and Figure 2).
All of Y. pestis subsp. pestis and the most distant Y. pestis subsp. microti of the root bv. ulegeica has V126F change in the extracellular loop 3 of Ail. SNP-groups 0.ANT1 and 2.ANT have additional polymorphism. The pestis isoform 0.ANT1 has Y46D in extracellular loop 1 of Ail. Thes Y. pestis isoform 2.ANT has S128P in extracellular loop 3 of Ail.
2.2. Structural and Dynamic Aspects of Ail Variants
We now employ MD simulations to explore structural and dynamic aspects of the Ail variants. Each construct is simulated (in triplicate) in a bilayer membrane patch with lipid composition identical to the Gram-negative outer membrane model composition used in the experimental setup. Figure 3a shows the experimentally determined structure of the Y. pestis Ail protein [26], whereas Figure 3b shows the MD simulation box utilized in this study.
Figure 4a shows the root-mean-square deviation (RMSD) values for all the Ail protein constructs analyzed in this study. RMSD values derived from the individual MD simulation replicas are seen to exhibit some variation, for some constructs more than others. We use the RMSD values to quantify the extent to which the protein structure deviates from its initial starting point, with higher values reflecting greater deviation. The two strains that appear consistently deviating more than the rest based on mean RMSD values (across replicas) are 0.ANT1 and 0.PE4_Microtus_91001. Curiously, in comparison with the reference strain IP_32953, both of these are strain variants with multiple rather than single substitutions. To explore whether the mean RMSD values correlate with sequence deviation from the reference strain, we computed the percent-identity value after multiple sequence alignment against the reference strain, IP_32953. The results indicate correlation between mean RMSD and percent identity to the reference (Figure 4b). The Pearson’s r value for the correlation is -0.52, indicating moderate negative correlation (Figure 4b). Therefore, more severe mutations from the reference might lead to increased flexibility or alternate conformational states. Such structural flexibility is likely functionally significant as it can affect the protein’s ability to interact with extracellular molecules.
To further elucidate the possibility of varying structural flexibility among Ail variants, we computed the root-mean-square fluctuations (RMSF) from the MD simulations. Our analysis revealed that the core of the β-barrel structure is stable across all variants, with backbone RMSF values consistently near or below 1Å (Figure 5). This is noteworthy, since engineered variants of Ail usually aims to introduce mutations in the core of the β-barrel [27], in contrast to where natural variation is seen (Figure 1 and Figure 2). The extracellular loops exhibits significantly greater flexibility, as is evident from the RMSF line plots (Figure 5). The regions corresponding to the extracellular loops ECL1-4 are highlighted in the RMSF plots, allowing for comparative analyses.
We then asked whether the maximum RMSF values for individual ECLs can be connected to the evolutionary variations in their sequences. Discerning such connections directly from the RMSF line plots (Figure 5) is challenging. To address this, we performed a correlation analysis (Figure 6). When comparing the maximum RMSF values of each loop to the percent sequence identity relative to the reference strain, we see significant variation among strains. Yet, only some of this variation correlated with the sequence deviation. Specifically, we see that there is negligent or weak correlation between the maximum RMSF values for ECL1, ECL2, and ECL3, which have Pearson’s r values of 0.00, -0.20, 0.25, respectively.
Surprisingly, ECL4 displayed a strong negative correlation with the sequence identity, with a Pearson’s r of -0.77. This is unexpected, since the sequence of ECL4 is conserved across all variants tested (Figure 1). A plausible explanation is that the flexibilities and conformational dynamics of the other loops (ECL1-3) can influence the behavior of the ECL4. The smaller size of ECL4 further makes it more sensitive to such effects. This point is further emphasized by comparing the numerics of the maximum RMSF values e.g., by inspecting the heat-map plot (Figure 6b).
The text continues here (Figure 2 and Table 2).
We also explored the radius-of-gyration (RGYR) for the Ail constructs to assess global structural differences induced by sequence polymorphism (Figure 7a). Despite the restricted nature of mutations in the Ail variants, a moderate positive correlation was observed between the sequence identity and average RGYR values, with a Pearson’s r of 0.43 (Figure 7b). This suggests that even subtle sequence variations can influence the overall compactness of the Ail structure.
2.3. Intrinsic Disorder Aspects of Ail Variants
Intrinsic disorder and structural flexibility are known to have important functional implications, and all proteomes analyzed so far invariantly contain noticeable proportions of intrinsically disordered proteins (IDPs) and hybrid proteins containing ordered domains and functional intrinsically disordered regions (IDRs) [28,29,30,31]. IDPs/IDRs have multiple crucial biological functions that complement the order-based protein functionality [32,33]. Although due to their membrane surroundings, transmembrane proteins are typically considered as mostly ordered proteins, many of them are known to contain functionally important IDRs [34,35,36,37,38].
To understand the effect of sequence polymorphism on intrinsic disorder propensity of Yersinia Ail protein, a set of established disorder predictors was used in this study, such as members of the PONDR® family [39,40,41] and IUPred [42]. Since for the individual Yersinia Ail isoforms the outputs of these disorder predictors generally agree (see Supplementary Materials, Figure S1), and since PONDR® VSL2 [43] is one of the more accurate stand-alone disorder predictors [43,44,45], in the subsequent studies we utilized the outputs of the PONDR® VSL2 predictor.
Figure 8a shows that the Yersinia Ail protein is predicted to have several IDRs (i.e., regions with the disorder scores above 0.5) and flexible regions (i.e., regions with disorder cores between 0.15 and 0.5) positions of which typically correspond to loops of the protein (cf. Figures 1, 5, and 8a). Amino acid substitutions found in different isoforms of the Yersinia Ail protein have some effect on the local intrinsic disorder propensity of this protein as shown by Figure 8a representing overlaid disorder profiles of nine isoforms. To better see the polymorphism-induced changes in intrinsic disorder propensity, Figure 8b represents “disorder difference spectra” calculated using the per-residue disorder outputs of the PONDR® VSL2 as a simple difference between the per-residue disorder propensities calculated for individual Ail isoforms and the per-residue disorder propensities calculated for the ancestral Yersinia Ail isoform found in Y. pseudotuberculosis IP 32953 as well as in Y. pestis 0.PE7 and 0.PE4A. In such representation, positive peaks show regions, for which local intrinsic disorder propensity is increased relative to the ancestral isoform, whereas negative peaks shows regions with reduced local disorder propensity. Polymorphisms caused some increase in the overall disorder predisposition of 0.ANT1, 0.PE2, 0.PE3_Angola, 0.PE4B, and 0.PE4_Xilingolensis, whereas isoforms co92, 0.ANT, and 0.PE4_microtus_91001 are somewhat less disordered than the ancestral Yersinia Ail isoforms. In most cases, individual isoforms have major peaks of same sign. The exceptions are given by 0.PE2 and 0.PE3_Angola, which have noticeable positive and negative peaks.
Figure S1 shows that there is generally a good agreement between the disorder propensities predicted by PONDR® VSL2 and structural flexibility evaluated in terms of RMSF. Here, regions with high RMSF are typically located within regions with high disorder score. Therefore, it seems that the structural flexibility of many Ail regions is somehow encoded in their intrinsic disorder propensity. Furthermore, major “dips” in the PONDR® VSL2 plot typically correspond to the segments of predicted secondary structure, whereas predicted IDRs and flexible regions mostly coincide with the Ail loops. This is further evidenced by comparing the PONDR® VSL2 disorder profiles (Figure 8a) and per-residue RMSF plots (Figure 8c). Curiously, Figure 8d shows that polymorphisms have more pronounced and diversified effects of local structural flexibility than on intrinsic disorder propensity. This plot contains “difference RMSF spectra” calculated by subtracting RMSF profile generated for the ancestral Yersinia Ail isoform from the RMSF profiles of individual isoforms. It is clearly seen that mutations cause both increase and decrease in the local flexibility.
Figure 8e represents the global correlation of the mean RMSF values calculated for all Yersinia Ail isoforms and their corresponding mean PONDR® VSL2 scores, whereas Figure 8f shows correlation between the total RMSF differences of the individual Ail isoforms relative to the ancestral Yersinia Ail isoform and their corresponding total PONDR® VSL2 score differences. These plots show a bit counterintuitive negative correlations, suggesting that mutations causing increase in the overall disorder propensities of isoforms are linked to the decreased overall structural flexibility.
Finally, to illustrate experimentally observed conformational dynamics of the of the Yersinia pestis outer membrane protein Ail, Figure 9 shows NMR solution structure of this protein in lipid bilayer nanodiscs and demonstrates that several its regions are characterized by high structural flexibility. This is evidenced by the structural fuzziness of the extracellular loops, where each of the included structural models have own structure non-overlapping with the loop structures of other models (see bottom side of Figure 9a,c). Therefore, these data indicate that the results of our computational analyses of the Ail structural dynamics are supported by the results of previously published NMR experiments [26].
3. Materials and Methods
Data on genomes of 84 Y. pestis strains representing main phylogenetic groups were used in this study as a source of amino acid sequences of Ail isoforms. They were SNP-groups, 0.ANT-4.ANT (17), 2.MED (5), 1.ORI (3), 1.IN (3) belonging to subsp. pestis; and 0.PE2 (18), 0.PE3 (1), 0.PE4 (29), 0.PE5 (5), 0.PE7 (2) from subsp. microti. The geographic position and background data for the phylogenetic groups were documented in previous publications [46,47,48]. First, sequence of the outer membrane protein adhesion invasion locus (Ail) from 84 strains, representatives of 17 Y. pestis phylogenetic groups, were aligned using the MEGA11 [21] to characterize their natural polymorphism. We also used Ail isoform of Y. pseudotuberculosis IP 32953. According to recent studies Y. pseudotuberculosis О:1b is the evolutionary ancestral of Y. pestis [23].
3.1. Multiple Sequence Alignment
Based on the sequence similarity, it was found that the Y. pestis Ail naturally exists in nine isoforms. First form is the identical to Ail of Y. pseudotuberculosis IP 32953 and are found in genomes of strains from 0.PE7 and 0.PE4A SNP-groups. Second isoform found in Y. pestis subsp. microti bv. caucasica (0.PE2). Third Ail isoform belongs to unique Y. pestis strain Angola (0.PE3). The strains of bv. hissarica / bv. altaica / bv. talassica (0.PE4B) and bv. qinghaiensis (0.PE4C) have Ail fourth isoform. Fifth and sixth forms of Ail have the representatives of Y. pestis subsp. microti bv. xilingolensis (0.PE4C). Seventh Ail isoform is the most represented among sequenced Y. pestis genomes. The strains belonged to Y. pestis subsp. pestis bv. antiqua (0.ANT2, 0.ANT3, 1.ANT, 3.ANT, 4.ANT), medievalis (2.MED), orientalis (1.ORI), and SNP-group 1.IN as well as Y. pestis subsp. microti bv. ulegeica have the identical isoform of Ail. Unlike others Y. pestis subsp. pestis SNP-groups 0.ANT1 and 2.ANT have different Ail isoforms, eighth and ninth forms respectively.
3.2. Molecular Dynamics Simulations
Constructs corresponding to the nine unique isoforms were characterized using molecular dynamics simulations. The Yersinia pestis outer membrane protein Ail resolved by NMR in phospholipid bilayer nanodiscs was used as structural template (PDB ID: 5VJ8, residues 27-182) [26] with the mutations corresponding to the various isoforms introduced in silico. The proteins were embedded in a bilayer membrane with a lipid ratio equivalent to that of used in the NMR study [26], namely a DMPC:DMPG ratio of 75:25. Protonation states were determined using PROPKA-3.0 [49] and the relative orientation of the proteins were found by using PPM 3.0 [50]. The systems were subsequently solvated by TIP3P water [51] and 150 mM KCl salt using the CHARMM-GUI builder [52,53]. The CHARMM36m force field [54] was using to describe proteins, lipids and ions. The standard CHARMM-GUI protocol for minimization and relaxation were employed. Each of the nine constructs were then subjected to molecular dynamic (MD) simulation for 3 × 600 ns (triplicate) in the NPT ensemble by initializing independent velocity distributions, totaling 27 systems and 16.2 μs. The target pressure (1 atm) and temperature (T=303.15 °K) were maintained using a Monte Carlo barostat [55] (coupling frequency of 100 steps) and the Langevin thermostat [56] (friction coefficient of 1 ps-1), respectively. Long-range electrostatic forces were calculated using the particle mesh Ewald (PME) method with a grid spacing of approximately 1 Å and 5th-order B-splines for interpolation [57]. Electrostatic forces were switched starting at 10 Å and switched entirely off by 12 Å. Periodic boundary conditions were applied in the X-,Y-, and Z-directions. All MD simulations were performed using OpenMM 7 [58]. An integration time step of 2.0 fs was used for the velocity Verlet algorithm. The lengths of all bonds that involve a hydrogen atom were constrained. Figure S2 in Supplementary Materials represents Root Mean Square Deviation (RMSD) for the various Ail constructs across three replicates of MD simulation, whereas Figure S3 shows corresponding Root Mean Square Fluctuation (RMSF) for the various Ail constructs.
3.3. Evaluation of the Effect of Polymorphism on the Intrinsic Disorder Predisposition
The effect of polymorphism on the intrinsic disorder predisposition of the Yersinia outer membrane protein Ail was evaluated out using a set of predictors from the PONDR® family, PONDR-FIT, PONDR® VLXT, and PONDR® VSL2 servers [39,40,41] as well as by the IUPred algorithm [42]. The outputs of these tools were combined using the RIDAO web platform that generates an integral disorder profile of an individual query protein [59]. Since the results of all predictors were generally in a good agreement with each other, the effect of natural polymorphism on the local intrinsic propensity of the Yersinia outer membrane protein Ail was investigated using PONDR® VSL2. We also analyzed the effect of sequence polymorphism on intrinsic disorder propensity of this protein using PONDR® VSL2 in the form “difference disorder spectra”, which were calculated by subtracting the per-residue disorder propensities calculated for the ancestral Yersinia Ail isoform found in Y. pseudotuberculosis IP 32953 as well as in Y. pestis 0.PE7 and 0.PE4A (see below) from the per-residue disorder propensities calculated by the PONDR® VSL2 for eight different Yersinia Ail isoforms described below.
4. Conclusions
The currently existing strains of Y. pestis can be divided into two groups that differ fundamentally in their pathogenicity for humans [19]. The phylogenetically more ancient and conditionally pathogenic for men representatives of the subspecies microti are characterized by a significant diversity of amino acid sequences of their pathogenicity factors such as capsular antigen F1 [4,5], V antigen [6], plasminogen activator Pla [7,8], and lipopolysaccharide [9]. A similar situation is observed in the case of Ail, where comparative analysis of sequence variants across 81 Y. pestis strains revealed polymorphisms located in the extracellular loops. These polymorphisms were correlated to measurable differences in dynamic and structural properties as revealed by molecular dynamics simulations and intrinsic order predictions. It could be speculated that the evolution of Ail into the pestis-microti isoform, as well as into the pestis isoforms 0.ANT1 and 2.ANT, is the main reason for the change in the host specificity of this phylogenetic group of Y. pestis towards pathogenicity for humans. However, it is more likely that the high human pathogenicity of the pestis subspecies strains is the result of a change in the structural and functional organization of not just one protein, but a whole complex of pathogenicity factors. Thus, Ail variation likely represents but one side of a broader evolutionary adaptation shaping host specificity in Y. pestis.
Supplementary Materials
The following supporting information can be downloaded at the website of this paper posted on Preprints.org, Figure S1: Intrinsic disorder profiles generated for nine isoforms of the Yersinia Ail protein; Figure S2: Root Mean Square Deviation (RMSD) for the various Ail constructs across three replicates of MD simulation; Figure S3: Root Mean Square Fluctuation (RMSF) for the various Ail constructs.
Author Contributions
Conceptualization, A.P.A. and V.N.U.; methodology, J.M., S.V.D., A.P.A., and V.N.U.; software, J.M..; validation, J.M., A.A.K., S.V.D., A.P.A., and V.N.U.; formal analysis, J.M.; investigation, J.M., A.A.K., S.V.D., A.P.A., and V.N.U.; data curation, J.M., A.A.K., S.V.D., A.P.A., and V.N.U.; writing—original draft preparation, J.M., A.A.K., S.V.D., A.P.A., and V.N.U.; writing—review and editing, J.M., A.A.K., S.V.D., A.P.A., and V.N.U.; visualization, J.M., A.A.K., S.V.D., A.P.A., and V.N.U.; supervision, A.P.A. and V.N.U. All authors have read and agreed to the published version of the manuscript.
Funding
The work by A.A.K, S.V.D., A.P.A. is a contribution to the sectoral research program of Rospotrebnadzor for 2021–2025 “Scientific support for epidemiological surveillance and sanitary supervision in the Russian Federation: creation of new technologies, means and methods for control and prevention of infectious and parasitic diseases.”
Institutional Review Board Statement
Not applicable.
Informed Consent Statement
Not applicable.
Data Availability Statement
Data are contained within the article and Supplementary Materials.
Acknowledgments
The authors wish to acknowledge the computational resources provided by the Advanced Computing Resources at the University of South Florida
Conflicts of Interest
The authors declare no conflicts of interest. The funders had no role in the design of the study; in the collection, analyses, or interpretation of data; in the writing of the manuscript; or in the decision to publish the results.
Abbreviations
The following abbreviations are used in this manuscript:
| Ail | Attachment invasion locus protein |
| CaF1 | Capsular antigen F1 |
| ECL | Extracellular loop |
| IDP | Intrinsically disordered protein |
| IDR | Intrinsically disordered region |
| MD | Molecular dynamics |
| Pla | Plasminogen activator |
| RMSD | Root Mean Square Deviations |
| RMSF | Root Mean Square Fluctuation |
| SNP | Single nucleotide polymeorphism |
| Yop | Yersinia outer protein |
References
- Anisimov, A.P.; Lindler, L.E.; Pier, G.B. Intraspecific diversity of Yersinia pestis. Clin Microbiol Rev 2004, 17, 434–464. [Google Scholar] [CrossRef] [PubMed]
- Anisimov, A.P.; Lindler, L.E.; Pier, G.B. Intraspecific diversity of Yersinia pestis (Correction). Clin Microbiol Rev 2004, 17, 695. [Google Scholar] [CrossRef] [PubMed]
- Gage, K.L.; Kosoy, M.Y. Natural history of plague: Perspectives from more than a century of research. Annu Rev Entomol 2005, 50, 505–528. [Google Scholar] [CrossRef] [PubMed]
- Kopylov, P.K.; Platonov, M.E.; Ablamunits, V.G.; Kombarova, T.I.; Ivanov, S.A.; Kadnikova, L.A.; Somov, A.N.; Dentovskaya, S.V.; Uversky, V.N.; Anisimov, A.P. Yersinia pestis Caf1 Protein: Effect of Sequence Polymorphism on Intrinsic Disorder Propensity, Serological Cross-Reactivity and Cross-Protectivity of Isoforms. Plos One 2016, 11. [Google Scholar] [CrossRef]
- Revazishvili, T.; Rajanna, C.; Bakanidze, L.; Tsertsvadze, N.; Imnadze, P.; O’Connell, K.; Kreger, A.; Stine, O.C.; Morris, J.G.; Sulakvelidze, A. Characterisation of Yersinia pestis isolates from natural foci of plague in the Republic of Georgia, and their relationship to Y. pestis isolates from other countries. Clin Microbiol Infec 2008, 14, 429–436. [Google Scholar] [CrossRef]
- Anisimov, A.P.; Dentovskaya, S.V.; Panfertsev, E.A.; Svetoch, T.E.; Kopylov, P.K.; Segelke, B.W.; Zemla, A.; Telepnev, M.V.; Motin, V.L. Amino acid and structural variability of Yersinia pestis LcrV protein. Infect Genet Evol 2010, 10, 137–145. [Google Scholar] [CrossRef]
- Dentovskaya, S.V.; Platonov, M.E.; Svetoch, T.E.; Kopylov, P.K.; Kombarova, T.I.; Ivanov, S.A.; Shaikhutdinova, R.Z.; Kolombet, L.V.; Chauhan, S.; Ablamunits, V.G.; et al. Two Isoforms of Yersinia pestis Plasminogen Activator Pla: Intraspecies Distribution, Intrinsic Disorder Propensity, and Contribution to Virulence. Plos One 2016, 11. [Google Scholar] [CrossRef]
- Haiko, J.; Kukkonen, M.; Ravantti, J.J.; Westerlund-Wikström, B.; Korhonen, T.K. The Single Substitution I259T, Conserved in the Plasminogen Activator Pla of Pandemic Yersinia pestis Branches, Enhances Fibrinolytic Activity. J Bacteriol 2009, 191, 4758–4766. [Google Scholar] [CrossRef]
- Knirel, Y.A.; Anisimov, A.P.; Kislichkina, A.A.; Kondakova, A.N.; Bystrova, O.V.; Vagaiskaya, A.S.; Shatalin, K.Y.; Shashkov, A.S.; Dentovskaya, S.V. Lipopolysaccharide of the Yersinia pseudotuberculosis Complex. Biomolecules 2021, 11. [Google Scholar] [CrossRef]
- Kolodziejek, A.M.; Hovde, C.J.; Minnich, S.A. Contributions of Yersinia pestis outer membrane protein Ail to plague pathogenesis. Curr Opin Infect Dis 2022, 35, 188–195. [Google Scholar] [CrossRef]
- Tsang, T.M.; Wiese, J.S.; Alhabeil, J.A.; Usselman, L.D.; Thomson, J.J.; Matti, R.; Kronshage, M.; Maricic, N.; Williams, S.; Sleiman, N.H.; et al. Defining the Ail Ligand-Binding Surface: Hydrophobic Residues in Two Extracellular Loops Mediate Cell and Extracellular Matrix Binding To Facilitate Yop Delivery. Infect Immun 2017, 85. [Google Scholar] [CrossRef] [PubMed]
- Tsang, T.M.; Wiese, J.S.; Felek, S.; Kronshage, M.; Krukonis, E.S. Ail proteins of Yersinia pestis and Y. pseudotuberculosis have different cell binding and invasion activities. Plos One 2013, 8, e83621. [Google Scholar] [CrossRef] [PubMed]
- Yamashita, S.; Lukacik, P.; Barnard, T.J.; Noinaj, N.; Felek, S.; Tsang, T.M.; Krukonis, E.S.; Hinnebusch, B.J.; Buchanan, S.K. Structural insights into Ail-mediated adhesion in Yersinia pestis. Structure 2011, 19, 1672–1682. [Google Scholar] [CrossRef] [PubMed]
- Eichelberger, K.R.; Sepulveda, V.E.; Ford, J.; Selitsky, S.R.; Mieczkowski, P.A.; Parker, J.S.; Goldman, W.E. Tn-Seq Analysis Identifies Genes Important for Yersinia pestis Adherence during Primary Pneumonic Plague. mSphere 2020, 5. [Google Scholar] [CrossRef]
- Bartra, S.S.; Styer, K.L.; O’Bryant, D.M.; Nilles, M.L.; Hinnebusch, B.J.; Aballay, A.; Plano, G.V. Resistance of Yersinia pestis to complement-dependent killing is mediated by the Ail outer membrane protein. Infect Immun 2008, 76, 612–622. [Google Scholar] [CrossRef]
- Kolodziejek, A.M.; Sinclair, D.J.; Seo, K.S.; Schnider, D.R.; Deobald, C.F.; Rohde, H.N.; Viall, A.K.; Minnich, S.S.; Hovde, C.J.; Minnich, S.A.; et al. Phenotypic characterization of OmpX, an Ail homologue of Yersinia pestis KIM. Microbiology (Reading) 2007, 153, 2941–2951. [Google Scholar] [CrossRef]
- Hinnebusch, B.J.; Jarrett, C.O.; Callison, J.A.; Gardner, D.; Buchanan, S.K.; Plano, G.V. Role of the Yersinia pestis Ail protein in preventing a protective polymorphonuclear leukocyte response during bubonic plague. Infect Immun 2011, 79, 4984–4989. [Google Scholar] [CrossRef]
- Eroshenko, G.A.; Odinokov, G.N.; Kukleva, L.M.; Krasnov, Y.M.; Kutyrev, V.V. Sequence analysis of the yadA, inv, and ail genes and their expression in the main and nonmain Yersinia pestis subspecies and Yersinia pseudotuberculosis. Russ J Genet+ 2010, 46, 645–651. [Google Scholar] [CrossRef]
- Kislichkina, A.A.; Platonov, M.E.; Vagaiskaya, A.S.; Bogun, A.G.; Dentovskaya, S.V.; Anisimov, A.P. Rational Taxonomy of Yersinia pestis. Mol Genet Microbiol+ 2019, 34, 110–117. [Google Scholar] [CrossRef]
- Kanetake, M. Balancing Innovation, Development, and Security: Dual-Use Concepts in Export Control Laws. N. Craik, C. Jefferies, S. Seck, and T. Stephens (eds.) Global Environmental Change and Innovation in International Law 2018, Cambridge University Press, Available at SSRN: https://ssrn.com/abstract=3148437.
- Tamura, K.; Stecher, G.; Kumar, S. MEGA11 Molecular Evolutionary Genetics Analysis Version 11. Mol Biol Evol 2021, 38, 3022–3027. [Google Scholar] [CrossRef]
- Huson, D.H.; Bryant, D. Application of phylogenetic networks in evolutionary studies. Mol Biol Evol 2006, 23, 254–267. [Google Scholar] [CrossRef] [PubMed]
- Skurnik, M.; Peippo, A.; Ervelä, E. Characterization of the O-antigen gene clusters of Yersinia pseudotuberculosis and the cryptic O-antigen gene cluster of Yersinia pestis shows that the plague bacillus is most closely related to and has evolved from Y. pseudotuberculosis serotype O:1b. Mol Microbiol 2000, 37, 316–330. [Google Scholar] [CrossRef]
- Thomson, J.J.; Plecha, S.C.; Krukonis, E.S. Ail provides multiple mechanisms of serum resistance to Yersinia pestis. Mol Microbiol 2019, 111, 82–95. [Google Scholar] [CrossRef]
- Singh, C.; Lee, H.; Tian, Y.; Schesser Bartra, S.; Hower, S.; Fujimoto, L.M.; Yao, Y.; Ivanov, S.A.; Shaikhutdinova, R.Z.; Anisimov, A.P.; et al. Mutually constructive roles of Ail and LPS in Yersinia pestis serum survival. Mol Microbiol 2020, 114, 510–520. [Google Scholar] [CrossRef] [PubMed]
- Dutta, S.K.; Yao, Y.; Marassi, F.M. Structural Insights into the Yersinia pestis Outer Membrane Protein Ail in Lipid Bilayers. J Phys Chem B 2017, 121, 7561–7570. [Google Scholar] [CrossRef]
- George, A.; Ravi, R.; Tiwari, P.B.; Srivastava, S.R.; Jain, V.; Mahalakshmi, R. Engineering a Hyperstable Yersinia pestis Outer Membrane Protein Ail Using Thermodynamic Design. J Am Chem Soc 2022, 144, 1545–1555. [Google Scholar] [CrossRef] [PubMed]
- Dunker, A.K.; Obradovic, Z.; Romero, P.; Garner, E.C.; Brown, C.J. Intrinsic protein disorder in complete genomes. Genome Inform Ser Workshop Genome Inform 2000, 11, 161–171. [Google Scholar]
- Peng, Z.; Yan, J.; Fan, X.; Mizianty, M.J.; Xue, B.; Wang, K.; Hu, G.; Uversky, V.N.; Kurgan, L. Exceptionally abundant exceptions: comprehensive characterization of intrinsic disorder in all domains of life. Cell Mol Life Sci 2015, 72, 137–151. [Google Scholar] [CrossRef]
- Ward, J.J.; Sodhi, J.S.; McGuffin, L.J.; Buxton, B.F.; Jones, D.T. Prediction and functional analysis of native disorder in proteins from the three kingdoms of life. J Mol Biol 2004, 337, 635–645. [Google Scholar] [CrossRef]
- Xue, B.; Dunker, A.K.; Uversky, V.N. Orderly order in protein intrinsic disorder distribution: disorder in 3500 proteomes from viruses and the three domains of life. Journal of Biomolecular Structure & Dynamics 2012, 30, 137–149. [Google Scholar] [CrossRef]
- van der Lee, R.; Buljan, M.; Lang, B.; Weatheritt, R.J.; Daughdrill, G.W.; Dunker, A.K.; Fuxreiter, M.; Gough, J.; Gsponer, J.; Jones, D.T.; et al. Classification of intrinsically disordered regions and proteins. Chem Rev 2014, 114, 6589–6631. [Google Scholar] [CrossRef] [PubMed]
- Oldfield, C.J.; Dunker, A.K. Intrinsically disordered proteins and intrinsically disordered protein regions. Annu Rev Biochem 2014, 83, 553–584. [Google Scholar] [CrossRef]
- Burgi, J.; Xue, B.; Uversky, V.N.; van der Goot, F.G. Intrinsic Disorder in Transmembrane Proteins: Roles in Signaling and Topology Prediction. Plos One 2016, 11, e0158594. [Google Scholar] [CrossRef] [PubMed]
- De Biasio, A.; Guarnaccia, C.; Popovic, M.; Uversky, V.N.; Pintar, A.; Pongor, S. Prevalence of intrinsic disorder in the intracellular region of human single-pass type I proteins: the case of the notch ligand Delta-4. J Proteome Res 2008, 7, 2496–2506. [Google Scholar] [CrossRef] [PubMed]
- Sigalov, A.B.; Aivazian, D.A.; Uversky, V.N.; Stern, L.J. Lipid-binding activity of intrinsically unstructured cytoplasmic domains of multichain immune recognition receptor signaling subunits. Biochemistry 2006, 45, 15731–15739. [Google Scholar] [CrossRef]
- Xue, B.; Li, L.; Meroueh, S.O.; Uversky, V.N.; Dunker, A.K. Analysis of structured and intrinsically disordered regions of transmembrane proteins. Mol Biosyst 2009, 5, 1688–1702. [Google Scholar] [CrossRef]
- Fonin, A.V.; Darling, A.L.; Kuznetsova, I.M.; Turoverov, K.K.; Uversky, V.N. Multi-functionality of proteins involved in GPCR and G protein signaling: making sense of structure-function continuum with intrinsic disorder-based proteoforms. Cell Mol Life Sci 2019, 76, 4461–4492. [Google Scholar] [CrossRef]
- Xue, B.; Dunbrack, R.L.; Williams, R.W.; Dunker, A.K.; Uversky, V.N. PONDR-FIT: a meta-predictor of intrinsically disordered amino acids. Biochim Biophys Acta 2010, 1804, 996–1010. [Google Scholar] [CrossRef] [PubMed]
- Romero, P.; Obradovic, Z.; Li, X.; Garner, E.C.; Brown, C.J.; Dunker, A.K. Sequence complexity of disordered protein. Proteins 2001, 42, 38–48. [Google Scholar] [CrossRef]
- Obradovic, Z.; Peng, K.; Vucetic, S.; Radivojac, P.; Dunker, A.K. Exploiting heterogeneous sequence properties improves prediction of protein disorder. Proteins 2005, 61 Suppl 7, 176–182. [Google Scholar] [CrossRef]
- Dosztanyi, Z.; Csizmok, V.; Tompa, P.; Simon, I. IUPred: web server for the prediction of intrinsically unstructured regions of proteins based on estimated energy content. Bioinformatics 2005, 21, 3433–3434. [Google Scholar] [CrossRef]
- Peng, K.; Vucetic, S.; Radivojac, P.; Brown, C.J.; Dunker, A.K.; Obradovic, Z. Optimizing long intrinsic disorder predictors with protein evolutionary information. Journal of bioinformatics and computational biology 2005, 3, 35–60. [Google Scholar] [CrossRef]
- Peng, Z.L.; Kurgan, L. Comprehensive comparative assessment of in-silico predictors of disordered regions. Current protein & peptide science 2012, 13, 6–18. [Google Scholar] [CrossRef]
- Fan, X.; Kurgan, L. Accurate prediction of disorder in protein chains with a comprehensive and empirically designed consensus. J Biomol Struct Dyn 2014, 32, 448–464. [Google Scholar] [CrossRef]
- Platonov, M.E.; Evseeva, V.V.; Dentovskaya, S.V.; Anisimov, A.P. Molecular typing of Yersinia pestis. Mol Genet Microbiol+ 2013, 28, 41–51. [Google Scholar] [CrossRef]
- Kislichkina, A.A.; Bogun, A.G.; Kadnikova, L.A.; Maiskaya, N.V.; Platonov, M.E.; Anisimov, N.V.; Galkina, E.V.; Anisimov, A.P. Nineteen Whole-Genome Assemblies of Yersinia pestis subsp. microtus, Including Representatives of Biovars caucasica, talassica, hissarica, altaica, xilingolensis, and ulegeica. Genome Announcements 2015, 3. [Google Scholar] [CrossRef] [PubMed]
- Cui, Y.; Yu, C.; Yan, Y.; Li, D.; Li, Y.; Jombart, T.; Weinert, L.A.; Wang, Z.; Guo, Z.; Xu, L.; et al. Historical variations in mutation rate in an epidemic pathogen, Yersinia pestis. Proc Natl Acad Sci U S A 2013, 110, 577–582. [Google Scholar] [CrossRef] [PubMed]
- Olsson, M.H.M.; Sondergaard, C.R.; Rostkowski, M.; Jensen, J.H. PROPKA3: Consistent Treatment of Internal and Surface Residues in Empirical pKa Predictions. J Chem Theory Comput 2011, 7, 525–537. [Google Scholar] [CrossRef]
- Lomize, A.L.; Todd, S.C.; Pogozheva, I.D. Spatial arrangement of proteins in planar and curved membranes by PPM 3.0. Protein Sci 2022, 31, 209–220. [Google Scholar] [CrossRef]
- Jorgensen, W.L.; Chandrasekhar, J.; Madura, J.D.; Impey, R.W.; Klein, M.L. Comparison of Simple Potential Functions for Simulating Liquid Water. J Chem Phys 1983, 79, 926–935. [Google Scholar] [CrossRef]
- Jo, S.; Kim, T.; Iyer, V.G.; Im, W. CHARMM-GUI: a web-based graphical user interface for CHARMM. J Comput Chem 2008, 29, 1859–1865. [Google Scholar] [CrossRef] [PubMed]
- Feng, S.S.; Park, S.; Choi, Y.K.; Im, W. CHARMM-GUI Membrane Builder: Past, Current, and Future Developments and Applications. J Chem Theory Comput 2023, 19, 2161–2185. [Google Scholar] [CrossRef]
- Huang, J.; Rauscher, S.; Nawrocki, G.; Ran, T.; Feig, M.; de Groot, B.L.; Grubmuller, H.; MacKerell, A.D., Jr. CHARMM36m: an improved force field for folded and intrinsically disordered proteins. Nat Methods 2017, 14, 71–73. [Google Scholar] [CrossRef] [PubMed]
- Aqvist, J.; Wennerstrom, P.; Nervall, M.; Bjelic, S.; Brandsdal, B.O. Molecular dynamics simulations of water and biomolecules with a Monte Carlo constant pressure algorithm. Chem Phys Lett 2004, 384, 288–294. [Google Scholar] [CrossRef]
- Izaguirre, J.A.; Sweet, C.R.; Pande, V.S. Multiscale dynamics of macromolecules using normal mode Langevin. Pac Symp Biocomput 2010, 240–251. [Google Scholar] [CrossRef]
- Essmann, U.; Perera, L.; Berkowitz, M.L.; Darden, T.; Lee, H.; Pedersen, L.G. A Smooth Particle Mesh Ewald Method. J Chem Phys 1995, 103, 8577–8593. [Google Scholar] [CrossRef]
- Eastman, P.; Swails, J.; Chodera, J.D.; McGibbon, R.T.; Zhao, Y.; Beauchamp, K.A.; Wang, L.P.; Simmonett, A.C.; Harrigan, M.P.; Stern, C.D.; et al. OpenMM 7: Rapid development of high performance algorithms for molecular dynamics. PLoS Comput Biol 2017, 13, e1005659. [Google Scholar] [CrossRef]
- Dayhoff, G.W., 2nd; Uversky, V.N. Rapid prediction and analysis of protein intrinsic disorder. Protein Sci 2022, 31, e4496. [Google Scholar] [CrossRef]
Figure 1.
Multiple sequence alignment by MEGA11 of the Ail from Y. pseudotuberculosis IP 32953 (NCBI GenPept ID: WP_011192817) and 8 polymorphism-containing Ail randomly selected from 81 Y. pestis strains under study. Notes: Here, a period (.) shows positions containing the same residues, a dash (-) shows position containing the insertion/deletion. Amino acids known to be involved in LPS interactions (3) and serum resistance phenotypes (1–3) are indicated by asterisks. Also, the indicated amino acids comprise the extracellular loops (ELs).

Figure 2.
Y. pestis SNP-based phylogenies’ scheme. Ail isoforms: the ancestral type—black, the microti type caucasica—blue, the microti type angola—orange, the microti type 0.PE4B/0.PE4С var1—purple, the microti type 0.PE4С var2—yellow, the microti type 0.PE4С var3—grey, the pestis-microti type—green, the pestis type 0.ANT1—brown, the pestis type 2.ANT—red.
Figure 3.
(a) Structure of the Y. pestis Ail protein shown as ribbon diagram colored from the N terminus in blue to the C terminus in red (PDB ID: 5VJ8) [26]. The structure was resolved by NMR in nanodiscs. The names of the β-strands making up the β-barrel as indicated, as are the four extracellular loops (ECL1-4). (b) The MD simulation box. The protein is shown as ribbon diagram in purple, membrane lipids as sticks in cyan, ions as spheres in tan (K+) or cyan (Cl-), and water as the translucent blob.
Figure 4.
(a) Root Mean Square Deviation (RMSD) for the various Ail constructs across three replicates of MD simulation. The bar plot shows the mean RMSD values (Å) for the individual simulations of the constructs (Replica 1, 2, and 3). Constructs are labeled along the X-axis, indicating their identifier tag and the Y-axis represents the RMSD mean value (Å). Error bars denote the standard deviation of the RMSD values for each replicate as estimated by block averaging. (b) Correlation between sequence deviation from the reference construct and the Root Mean Square Deviation (RMSD) for the various Ail constructs. The scatter plot shows the triplicate-averaged RMSD values (Å) for the constructs against the percent-identity after alignment with the reference strain construct. Points are labeled according to their identifier tag. A trend line (red dashed line) shows the correlation with Pearson’s r computed and shown in the legend.
Figure 5.
Root Mean Square Fluctuation (RMSF) for the various Ail constructs. The line plot shows the mean RMSF values (Å) for the simulations of the constructs. Data corresponding to the three replicas are averaged to compute the average RMSF and the shaded regions display the standard error. The X-axis shows the residue numbers and the Y-axis represents the RMSF value (Å).
Figure 6.
(a) Correlation between sequence deviation from the reference construct and the Root Mean Square Fluctuation (RMSF) for the various Ail constructs. The scatter plot shows the triplicate-averaged max RMSF values corresponding to the loop regions (ECL 1-4) (Å) for the constructs against the percent-identity after alignment with the reference strain construct. A trend line (red dashed line) shows the correlation with Pearson’s r computed and shown in the legend. (b) Correlation between sequence deviation from the reference construct and the Root Mean Square Fluctuation (RMSF) for the various Ail constructs. The heatmap plot shows the triplicate-averaged max RMSF values corresponding to the loop regions (ECL 1-4) (Å) for the constructs.
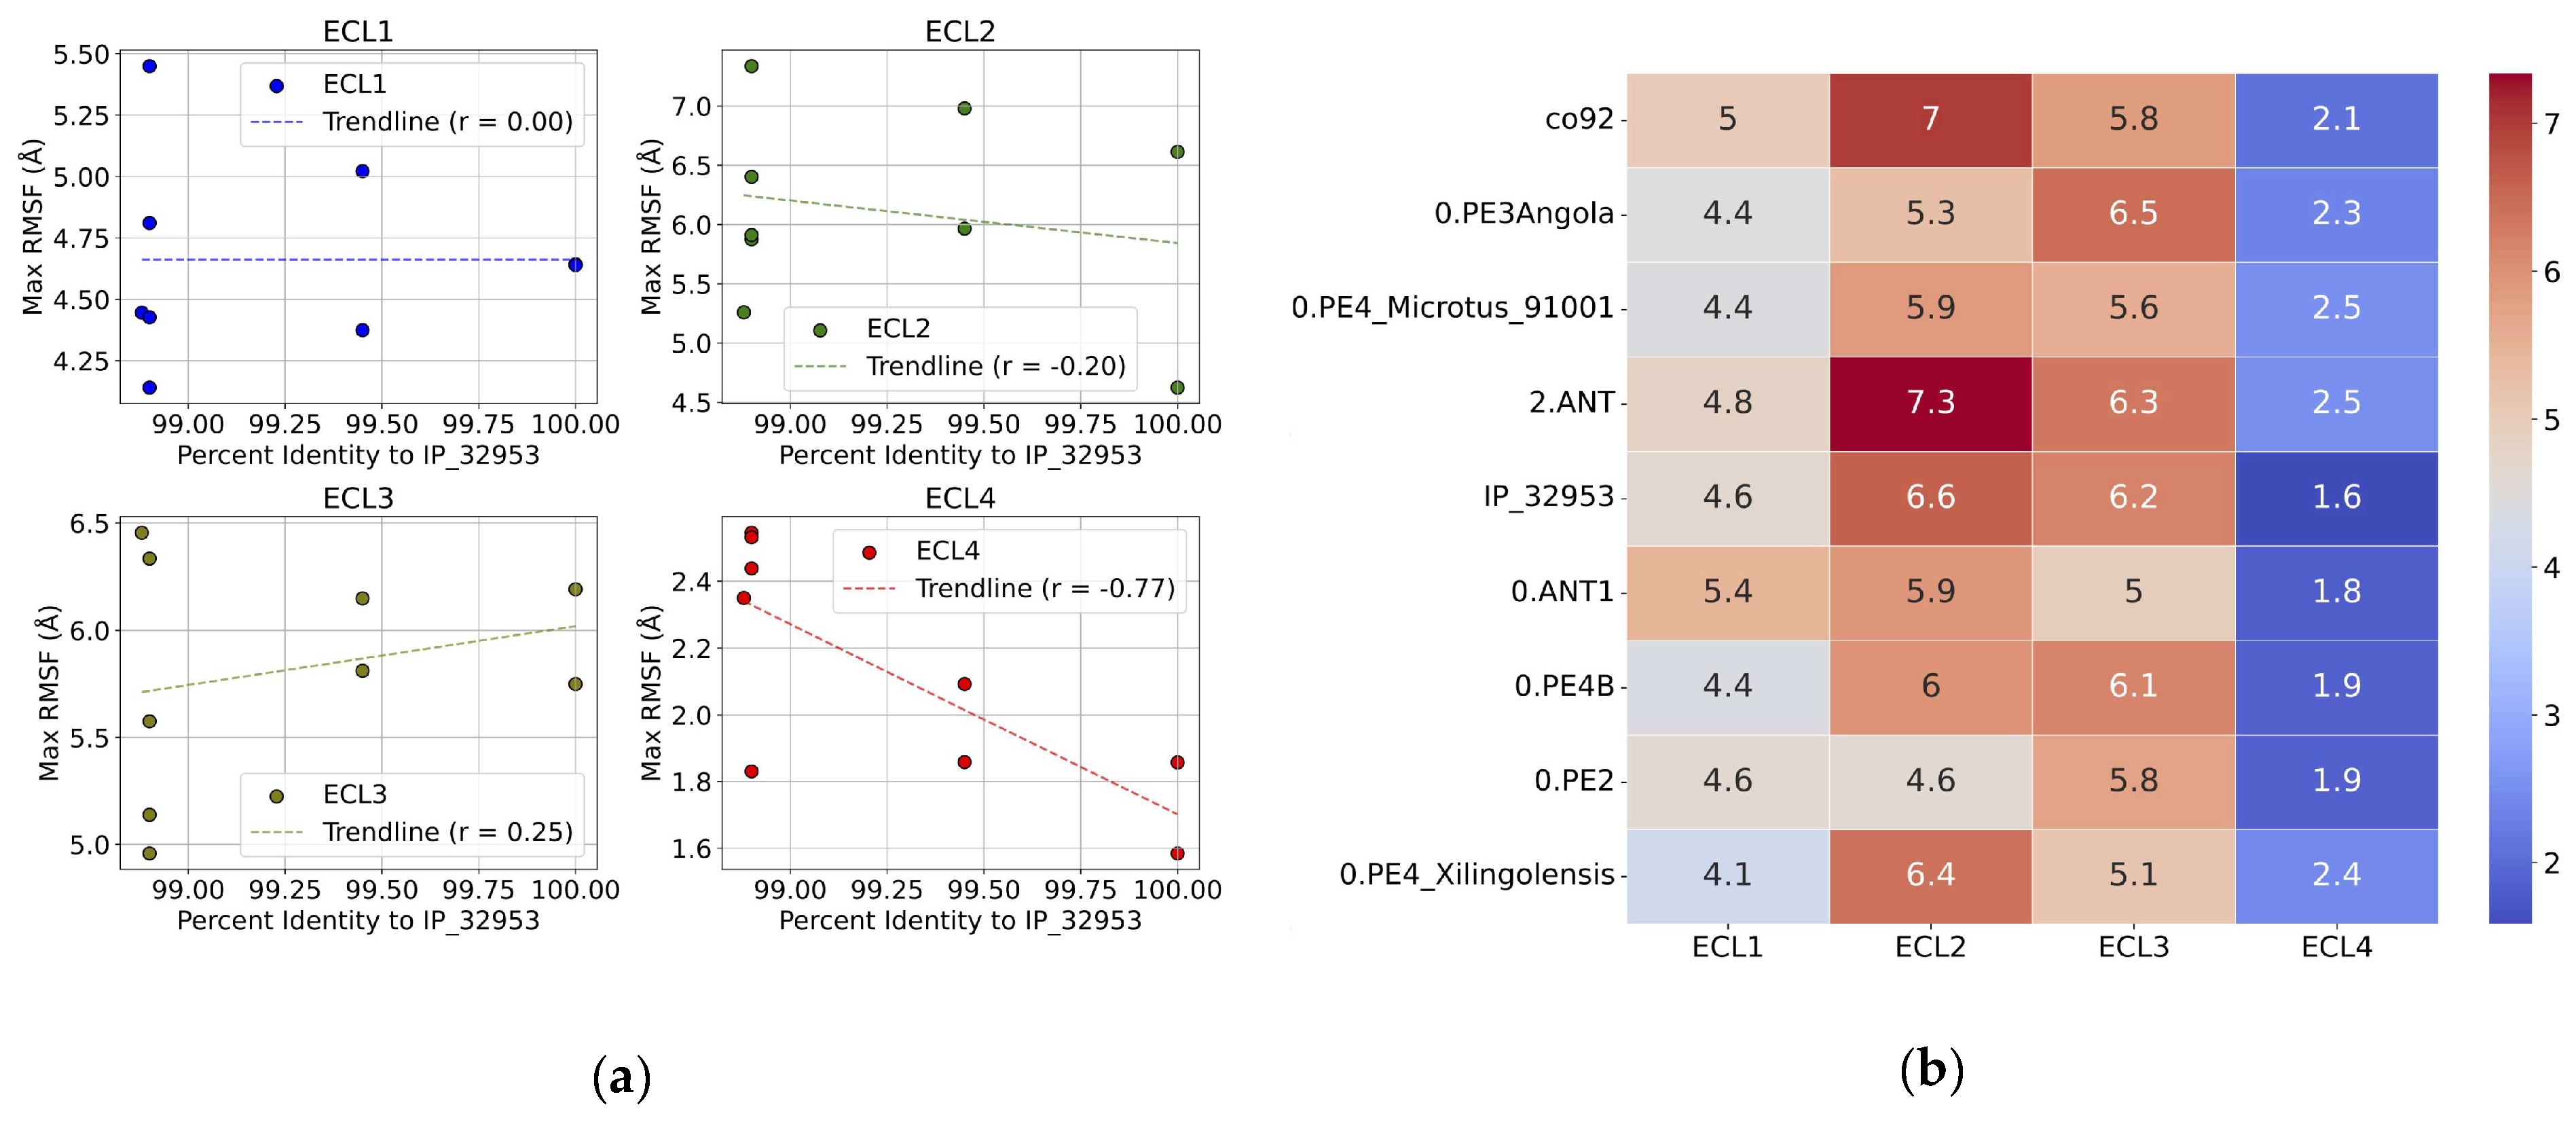
Figure 7.
(a) Radius of gyration (RGYR) for the various Ail constructs across three replicates of MD simulation. The bar plot shows the mean RGYR values (Å) for the individual simulations of the constructs (Replica 1, 2, and 3). Constructs are labeled along the X-axis, indicating their identifier tag and the Y-axis represents the RGYR mean value (Å). Error bars denote the standard deviation of the RGYR values for each replicate as estimated by block averaging. (b) Correlation between sequence deviation from the reference construct and the Radius of Gyration (RGYR) for the various Ail constructs. The scatter plot shows the triplicate-averaged RGYR values (Å) for the constructs against the percent-identity after alignment with the reference strain construct. Points are labeled according to their identifier tag. A trend line (red dashed line) shows the correlation with Pearson’s r computed and shown in the legend.
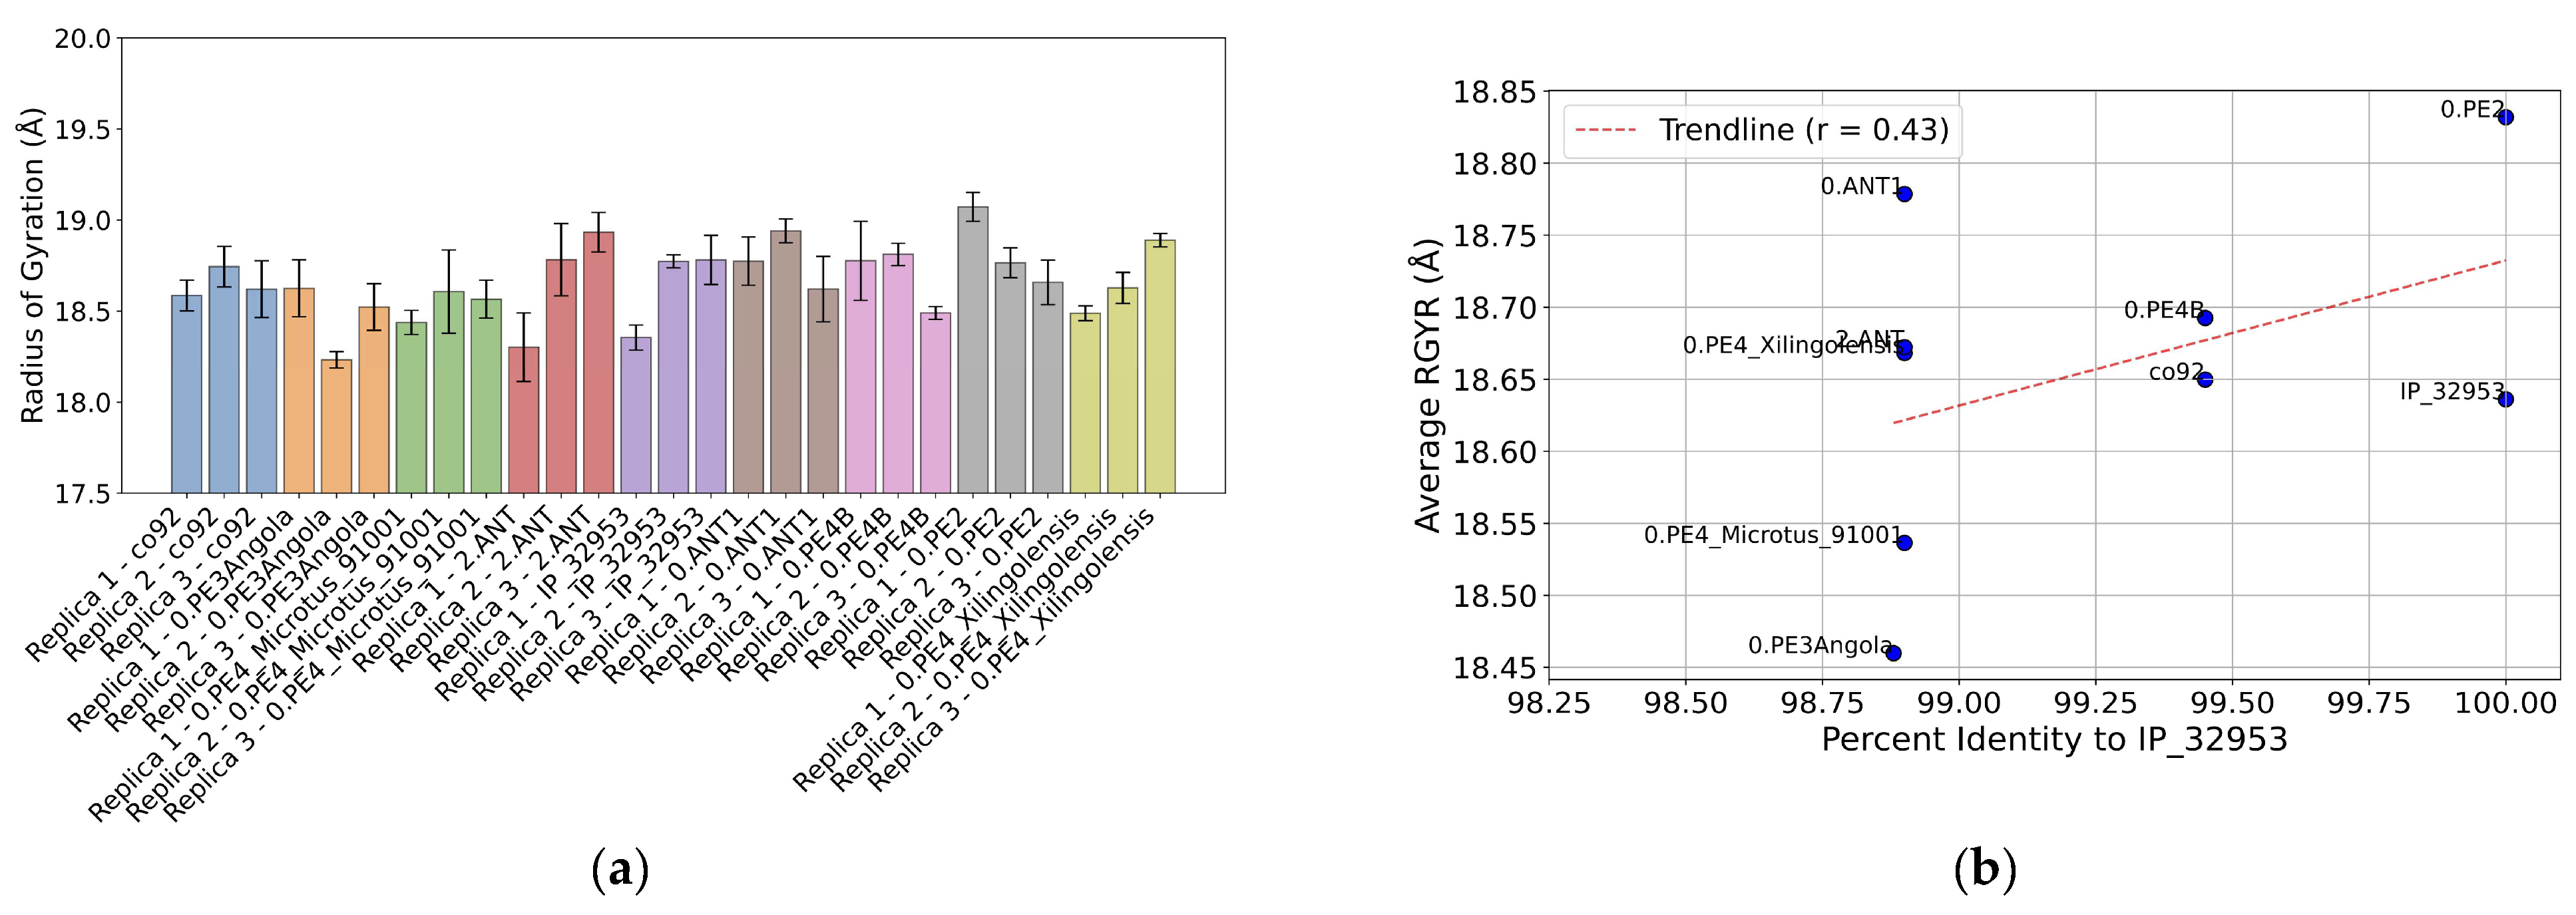
Figure 8.
Analysis of the effect of natural polymorphism on intrinsic disorder propensity of the Yersinia Ail protein. (a) Overlaid per-residue intrinsic disorder profiles generated for nine isoforms of Ail by PONDR® VSL2. (b) “Difference disorder spectra” calculated by subtracting the per-residue disorder propensities calculated for the ancestral Yersinia Ail isoform from the per-residue disorder propensities calculated for individual Ail isoforms. (c) Overlaid RMSF profiles calculated for nine Ail isoforms based on the results of MD simulations. (d) “Difference RMSF spectra” calculated by subtracting RMSF profile generated for the ancestral Yersinia Ail isoform from the RMSF profiles of individual isoforms. (e) Dependence of mean RMSF on mean PONDR® VSL2 score for nine Yersinia Ail isoforms. (f) Dependence of total RMSF difference on total PONDR® VSL2 score difference calculated from the corresponding “difference RMSF spectra” and “difference disorder spectra” shown in plots B and D.
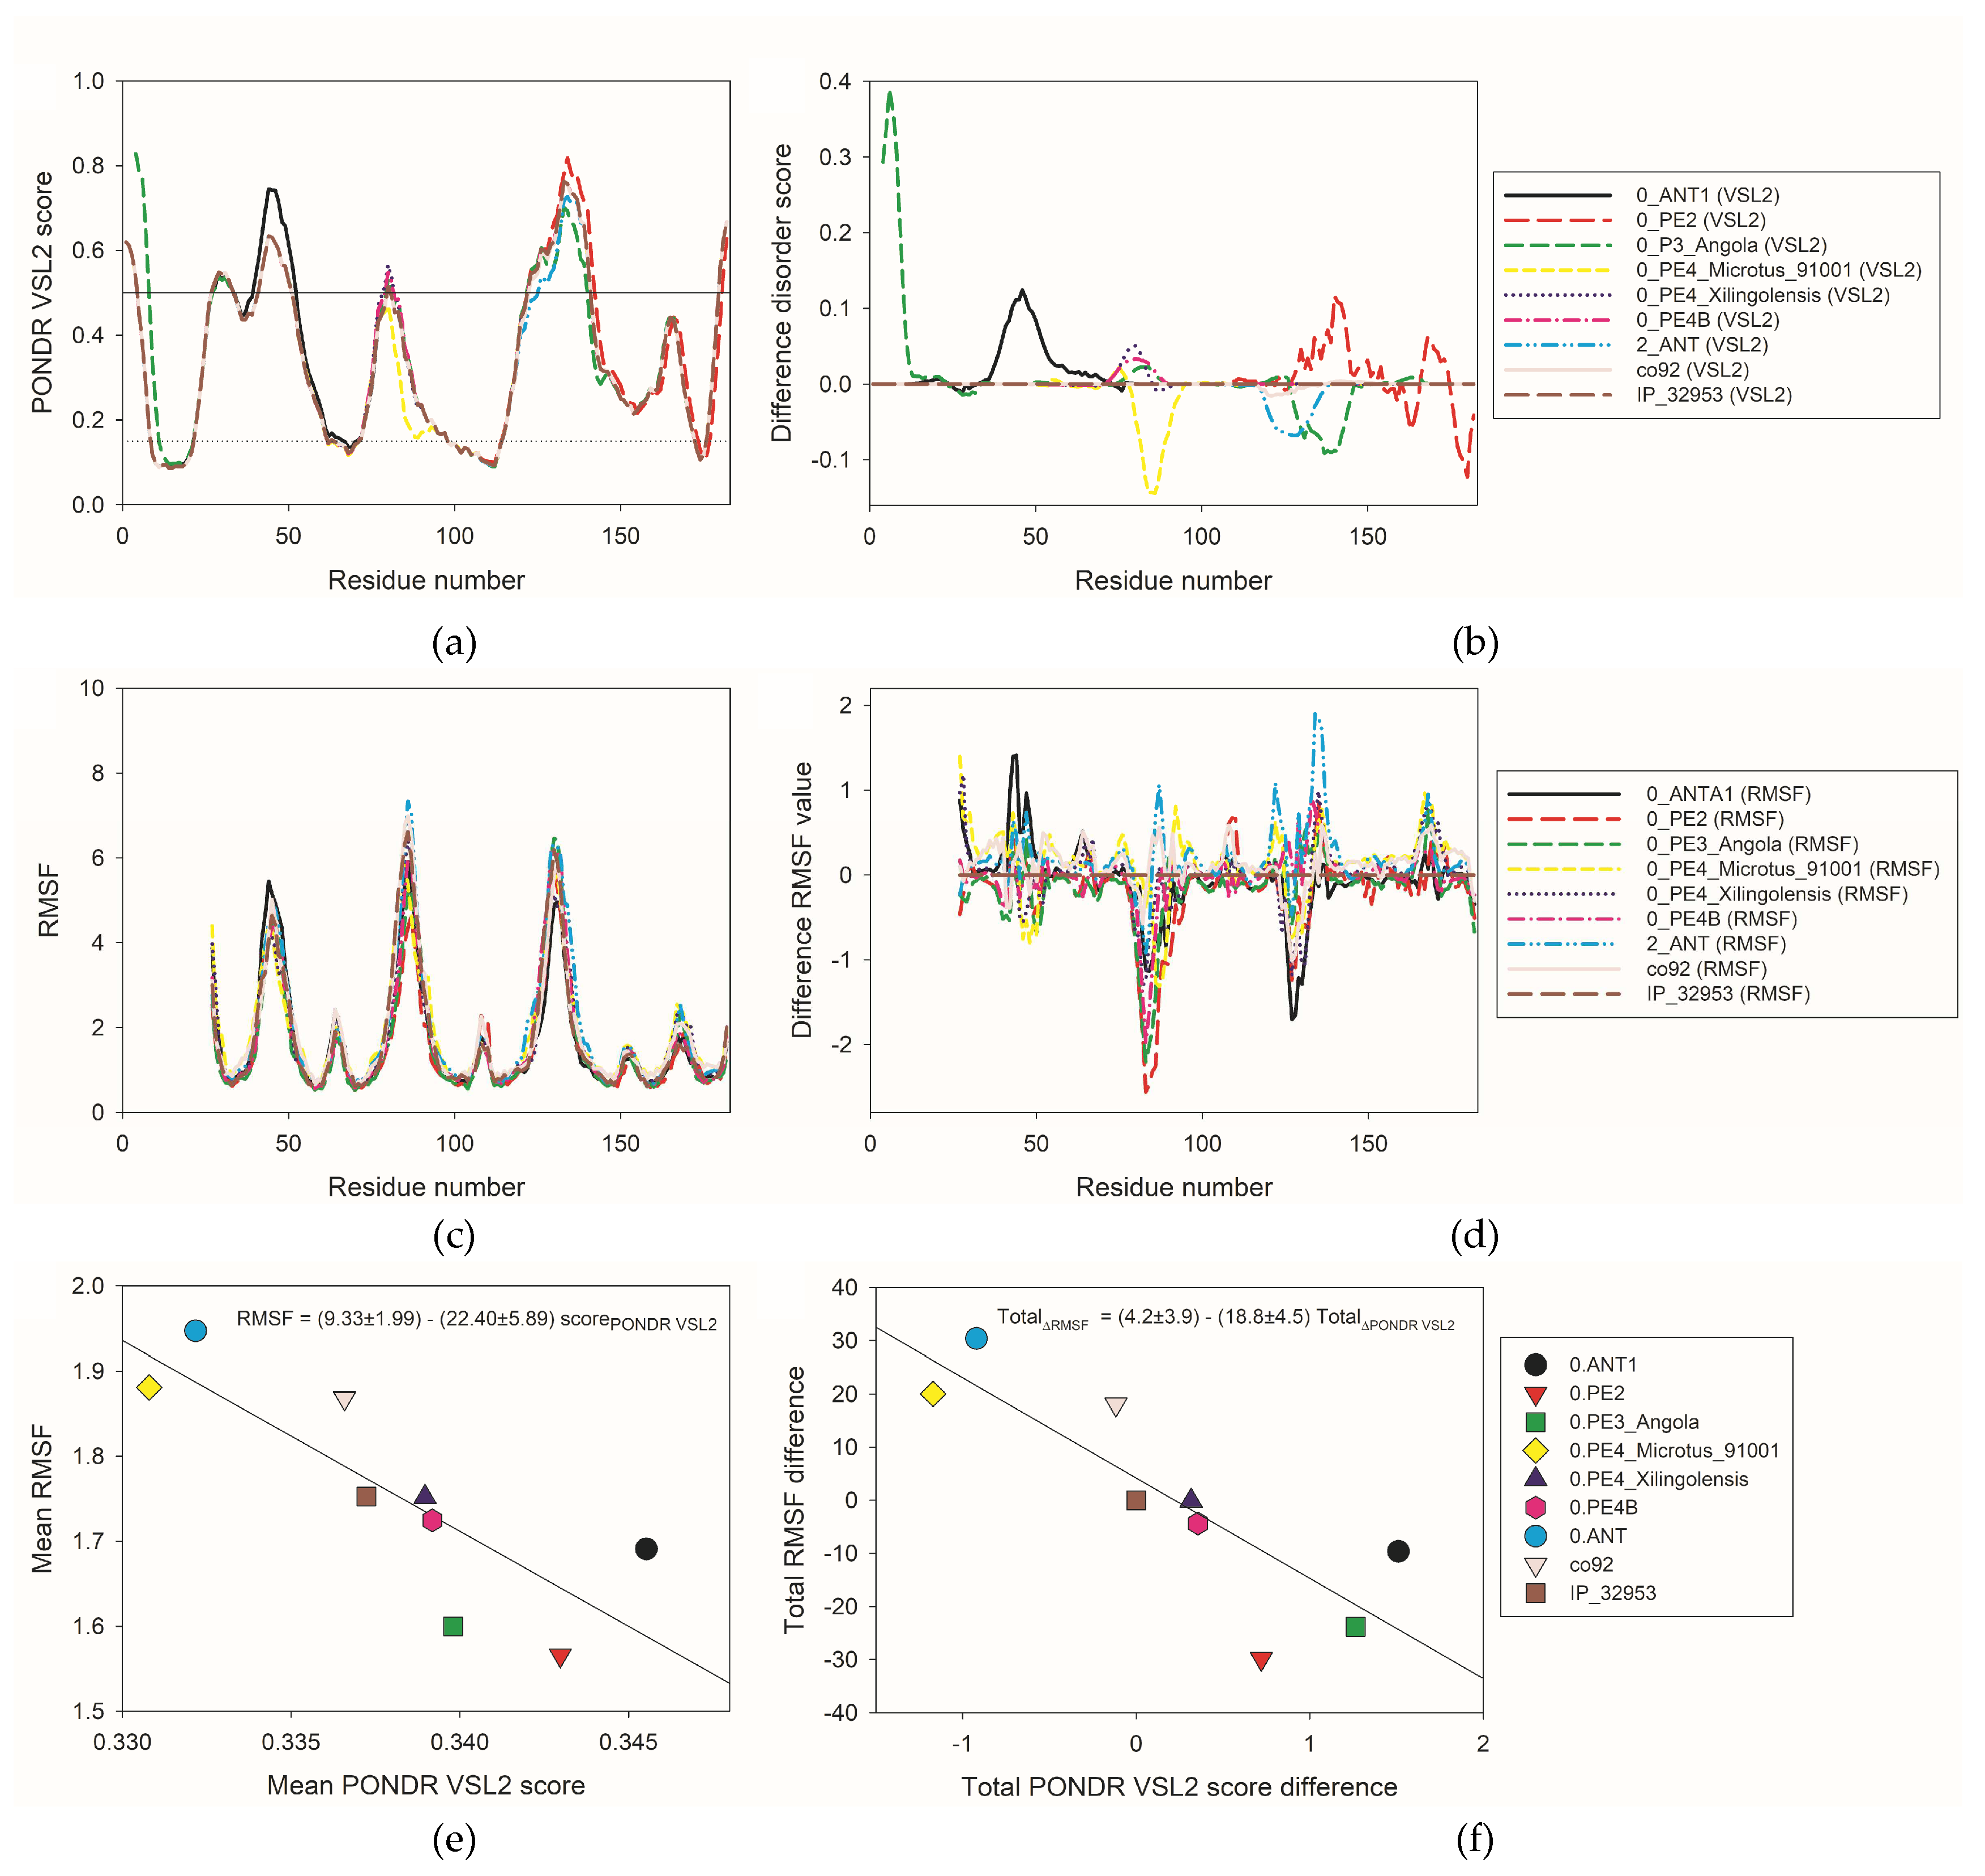
Figure 9.
NMR solution structure of the Yersinia pestis outer membrane protein Ail in lipid bilayer nanodiscs (PDB ID: 5VJ8) [26]. (a) Side view. (b) Top view. (c) Bottom view. Note that the lipid bilayers are not shown. Plots represent 10 overlaid models.
Figure 9.
NMR solution structure of the Yersinia pestis outer membrane protein Ail in lipid bilayer nanodiscs (PDB ID: 5VJ8) [26]. (a) Side view. (b) Top view. (c) Bottom view. Note that the lipid bilayers are not shown. Plots represent 10 overlaid models.
Disclaimer/Publisher’s Note: The statements, opinions and data contained in all publications are solely those of the individual author(s) and contributor(s) and not of MDPI and/or the editor(s). MDPI and/or the editor(s) disclaim responsibility for any injury to people or property resulting from any ideas, methods, instructions or products referred to in the content. |
© 2025 by the authors. Licensee MDPI, Basel, Switzerland. This article is an open access article distributed under the terms and conditions of the Creative Commons Attribution (CC BY) license (http://creativecommons.org/licenses/by/4.0/).
Copyright: This open access article is published under a Creative Commons CC BY 4.0 license, which permit the free download, distribution, and reuse, provided that the author and preprint are cited in any reuse.


