
Submitted:
27 May 2025
Posted:
27 May 2025
You are already at the latest version
Abstract
Blood iron levels are related to many health conditions, affecting hundreds of millions of individuals worldwide. To aid in the prevention and treatment of iron-related disorders, previous research has developed a low-cost, accurate point-of-care method for measuring iron from a single finger-prick blood sample. This study builds upon that work by introducing an improved imaging method that accurately reads sensor images irrespective of variations in environmental illumination and camera quality. Smartphone cameras were used as analytical tools, demonstrating an average coefficient of variation of 5.13% across different phone models, and absorbance results were found to be improved by 8.80% compared to the method in previous study. The proposed method successfully enhances iron detection accuracy under diverse lighting conditions, paving the way for smartphone-based sensing of other colorimetric reactions involving various analytes.
Keywords:
biosensors
; image color analysis
; iron detection
; chemical sensors
; smartphone-based detection
; vertical flow assay
; point-of-care sensor
1. Introduction
Iron metabolism plays a crucial role in maintaining human health [1]. Abnormal iron levels can lead to severe complications, including brain and liver damage [2]. Iron deficiency, the leading nutritional disorder globally, results from a lack of or dysfunctional red blood cells, ultimately causing anemia [3]. On the other hand, iron overload can lead to hemochromatosis, where excessive iron accumulates in body tissues [4].
Given that 40% of children and 30% of reproductive-age women suffer from anemia, while approximately 16 million Americans experience iron overload [5,6], a cost-effective and rapid iron monitoring method is essential. Prior research has introduced a point-of-care sensor capable of measuring iron biomarkers from whole blood via colorimetric chemistry [7,8]. However, existing methods require a specific phone model and controlled sensing conditions, such as consistent light intensity, capturing angle, and distance. These limitations are not unique to iron sensing and are commonly encountered in other smartphone-based colorimetric detection platforms.
Recent advancements in smartphone-based colorimetric detection have significantly enhanced point-of-care diagnostics and environmental monitoring. Balbach et al. developed Colourine, a smartphone app for urinalysis test strips that converts RGB data to HSV to reduce lighting interference; however, pre-calibration is required to establish baseline colors under specific lighting conditions [9]. Krishnan et al. introduced a nanoparticle-based miRNA detection platform with lab-comparable accuracy, though calibration with lab spectrophotometers is needed for each smartphone model [10]. Mutlu et al. explored machine learning for pH detection, requiring multiple pH values to be tested under various lighting conditions to train the model [11].
Despite these innovations, existing methods still require pre-calibration to address lighting variability and device-specific differences. Building on previous work in iron sensing, this study aims to overcome these challenges by introducing a more adaptable method that eliminates the need for pre-calibration while ensuring accurate colorimetric detection under varying environmental conditions.
2. Materials and Methods
2.1. Sensor Fabrication
The proposed design of the iron sensor consists of four different membrane layers designed for blood separation, with the fourth layer impregnated with capturing reagents for the iron-based chemical reaction. The four membranes used for sensors in previous publication include: general nylon membrane, fiberglass membrane, asymmetric polysulfone membrane, and hydrophilic nylon membrane [7]. On the side of the sensing area is the reference area which comprises white blotting paper, ensuring a stable reference for color analysis. The design of the sensor strip is illustrated in Figure 1.
The top and bottom sensor frames were 3D printed using an Ultimaker3 3D-printer and the membrane layers were laser cut using Universal Laser Systems laser cutter in 6 by 6 mm squares [7]. All membranes were assembled between the top and bottom sensor frames, the ready-to-run sensors were individually packed and sealed with desiccant in aluminized Mylar bags. Calibration was conducted using a series of iron standards prepared from iron (III) nitrate nonahydrate (INN) crystals. All samples underwent spectrophotometric analysis in triplicates where the apparatus was in absorbance mode with an endpoint analysis of 590 nm [7,8].
According to a previous publication, the proposed colorimetric reaction chemistry involves two reagents: Reagent A, composed of 200 mM citric acid, 34 mM ascorbic acid, and 100 mM thiourea; and Reagent B, containing 6 mM ferene. These reagents are mixed with the iron-containing sample in a final volume ratio of 3:1:1 (Reagent A:Reagent B:Sample). Various reagent ratios and base chemical concentrations were evaluated in the previous study, and the selected 3:1:1 ratio was found to yield the most sensitive, consistent, and accurate results [8].
2.2. Sensor Testing
For use, the sensor is oriented so the sensor reading side is placed face down on a flat surface, then the liquid sample is inserted into the sampling port on the opposite side. After 10 minutes, the sensor is flipped with sensor reading side face up and an image of the sensor is taken for colorimetric analysis. All RGB analysis is completed though ImageJ (National Institutes of Health, Bethesda, MD, USA), an image processing software. The absorbance signals from red, green, and blue (RGB) components are calculated by the following equation:
where I is the intensity returned from RGB component deconvolution of the colors.
2.3. Sensor’s Reading Correction Method
As described in previous work, a key limitation was that the white reference area performed poorly under varying lighting conditions, necessitating the use of a dedicated detection unit for accurate sensor signal assessment. To address this issue, the present study incorporated a three-reference-cell system into the sensor design, consisting of low, medium, and high blue intensity reference cells (as shown in Figure 2a). The RGB values of these cells, captured under controlled lighting conditions, serve as reference controls for subsequent image correction. The corrected absorbance value for the sensing area is given by the slope of the correlation plot between the absorbance of uncontrolled and controlled conditions (illustration of this correlation plot is shown in Figure 2b). The corrected absorbance value can be found by the following equation:
where Abssensing is the absorbance value of the sensing area of the sensor (under uncontrolled conditions) and “Correlation Slope AbsBlue Ref“ is the slope of the plot of uncontrolled lighting values against the previously mentioned controls. The corrected absorbance values were then compared to the gold standard laboratory spectrophotometric method for accuracy analysis.
Other color palettes including gray, green, and red were also tested for use as reference cells. However, after comparing different colors for use in these reference cells, it was found that varying intensities of blue had the lowest coefficient of variation and thus gave the most accurate readings.
2.4. Phone Models Used for Sensor Imaging
The smartphone models used in this study were: 1- iPhone XR (Apple Inc., Cupertino, CA, USA), 2- Samsung Galaxy S10+ (Samsung Electronics Co., Ltd., Suwon, South Korea), 3- Samsung Note 8 (Samsung Electronics Co., Ltd., Suwon, South Korea). The Samsung Galaxy S10+ was used to capture images under controlled lighting conditions within a light box, while all three phones were employed to capture sensor images under variable lighting conditions in different areas of the laboratory.
3. Results and Discussion
Figure 3 shows the relationship between absorbance values and iron values from the spectrophotometer reference method. The measurements were obtained at 590 nm, and each sample was replicated 3 times for each iron concentration.
Five sensors were tested using iron standards at concentrations of 0, 50, 100, 150, and 300 μg/dL. As shown in Figure 4a–e, the absorbance correlation plots illustrate varying slopes, which reflect differences in ambient lighting conditions during image capture. These slopes were used in Equation 2 to correct for lighting variability and obtain normalized absorbance values. The corrected values were subsequently compared to the known concentrations of the iron standards, as shown in Figure 5a-b. Intercept corrections were applied to account for systematic offsets observed between different phone models. After applying these corrections, the sensor readings across different phone models demonstrated strong agreement with the spectrophotometric reference, yielding an average coefficient of variation of 5.13%, indicating good reproducibility despite the variation in hardware and environmental lighting.
Figure 5a showcases sensor images captured under both controlled and uncontrolled lighting conditions using three different smartphone models (iPhone XR, Samsung Galaxy S10+, and Samsung Note 8). The pictures indicate significant variations in color perception due to environmental lighting and device-specific image processing. However, applying the correction method using the three-reference-cell system significantly improves the accuracy of iron concentration readings.
As seen in Figure 5b and 5c, the concentrations suggested from the sensor correlate well with the spectrophotometer data. Sensor measurements for normal clinical blood iron range (60 – 170 μg/dL) display a good match of the uncontrolled compared to the controlled sensors. With the absorbance correction method, the results were found to be improved by 8.80% compared to the old method that did not apply the three-reference-cell correction system.
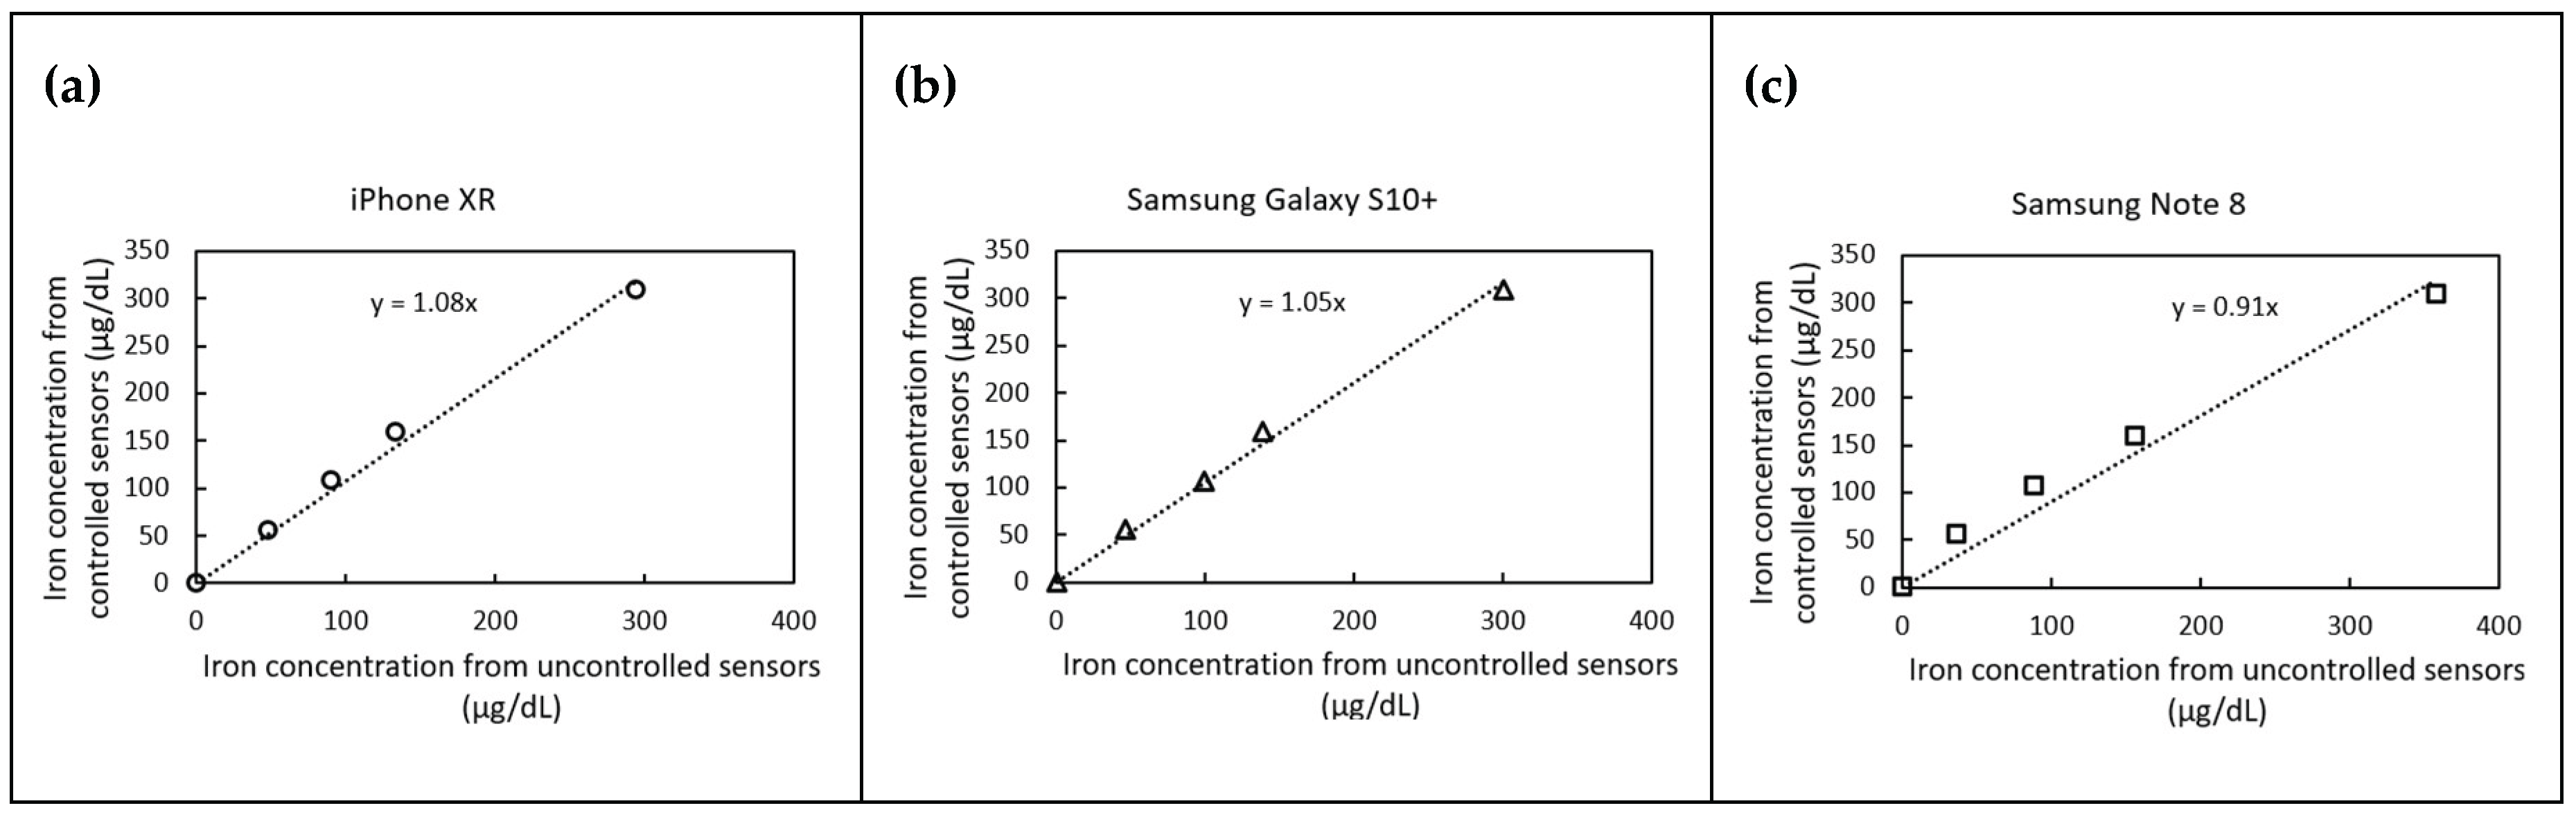
Figure 6 presents correlation plots of predicted iron concentrations under controlled and uncontrolled lighting conditions for three different smartphone models. The iPhone XR and Samsung Galaxy S10+ slightly overestimated iron concentrations by 8% and 5%, respectively, while the Samsung Note 8 underestimated concentrations by 9%. Despite these variations, the proposed correction method effectively normalizes the results, bringing them within an acceptable margin of error (10% as user reference).
These findings underscore the robustness of the correction method, demonstrating its ability to standardize measurements across different phone models and lighting conditions. The improved accuracy of iron detection using a smartphone-based system presents significant implications for point-of-care diagnostics, particularly in low-resource settings where laboratory spectrophotometers may not be readily available.
4. Conclusions
This study successfully developed and validated an enhanced color detection method for smartphone-based colorimetric iron sensors. The incorporation of three reference cells for RGB color analysis significantly improved the reliability of the sensor readings, making them less dependent on environmental lighting conditions and phone model variations. This approach holds promise for future applications in colorimetric sensing for various analytes, broadening the potential of smartphone-based diagnostic tools.
Author Contributions
Conceptualization: N.A.N., A.H. and E.F.; methodology: N.A.N., A.H. and E.F.; hardware and software: N.A.N, A.H., E.M., A.Ma., D.R. and A.S.; validation: N.A.N., A.H. and EF; formal analysis: N.A.N and A.H.; investigation: N.A.N, A.H., E.M., A.Ma., D.R. and E.F.; resources: A.Mo., M.M., N.D., N.O., A.S., G.R. and E.F.; manuscript preparation: N.A.N., A.H. and E.F.; project supervision: A.Mo., M.M., N.D., N.O., A.S., G.R. and E.F.; project administration: A.S., G.R. and E.F.; funding acquisition: NSF, APC, and ASU’s Plus Alliance. All authors have read and agreed to the published version of the manuscript.
Funding
This research was funded by the National Science Foundation (NSF), grant number 2107439. The article processing charge (APC) was funded by Gregory Raupp.
Acknowledgments
The authors would like to thank the funding institutions and acknowledge the collaborative guidance and infrastructure support from Arizona State University (ASU) and Dublin City University (DCU), including the Biodesign Institute, the Insight Centre for Data Analytics, and the IRES program.
Conflicts of Interest
The authors declare no conflict of interest.
References
- Kaplan, L.A.; Pesce, A.J.; Kazmierczak, S.C. (2003). Clinical chemistry : theory, analysis, correlation.
- Beutler, E.; Hoffbrand, A.V.; Cook, J.D. Iron deficiency and overload. Hematology 2003, 2003, 40–61. [Google Scholar] [CrossRef] [PubMed]
- Stevens, G.A.; Finucane, M.M.; De-Regil, L.M.; Paciorek, C.J.; Flaxman, S.R.; Branca, F.; Peña-Rosas, J.P.; Bhutta, Z.A.; Ezzati, M. Global, regional, and national trends in haemoglobin concentration and prevalence of total and severe anaemia in children and pregnant and non-pregnant women for 1995–2011: a systematic analysis of population-representative data. The Lancet Global Health 2013, 1, e16–e25. [Google Scholar] [CrossRef] [PubMed]
- Pietrangelo, A. Iron and the liver. Liver International 2016, 36(S1), 116–123. [Google Scholar] [CrossRef] [PubMed]
- Safiri, S.; Kolahi, A.-A.; Noori, M.; Nejadghaderi, S.A.; Karamzad, N.; Bragazzi, N.L.; Sullman, M.J.M.; Abdollahi, M.; Collins, G.S.; Kaufman, J.S.; Grieger, J.A. Burden of anemia and its underlying causes in 204 countries and territories, 1990-2019: results from the Global Burden of Disease Study 2019. Journal of Hematology and Oncology 2021, 14, 185–185. [Google Scholar] [CrossRef] [PubMed]
- McDowell, L.A.; Kudaravalli, P.; Sticco, K.L. Iron Overload. StatPearls. 2022.
- Serhan, M.; Jackemeyer, D.; Abi Karam, K.; Chakravadhanula, K.; Sprowls, M.; Cay-Durgun, P.; Forzani, E. A novel vertical flow assay for point of care measurement of iron from whole blood. Analyst (London) 2021, 146, 1633–1641. [Google Scholar] [CrossRef] [PubMed]
- Serhan, M.; Jackemeyer, D.; Long, M.; Sprowls, M.; Perez, I.D.; Maret, W.; Chen, F.; Tao, N.; Forzani, E. Total iron measurement in human serum with a novel smartphone-based assay. IEEE Journal of Translational Engineering in Health and Medicine 2020, 8, 1–1. [Google Scholar] [CrossRef] [PubMed]
- Balbach, S.; Jiang, N.; Moreddu, R.; Dong, X.; Kurz, W.; Wang, C.; Dong, J.; Yin, Y.; Butt, H.; Brischwein, M.; Hayden, O.; Jakobi, M.; Tasoglu, S.; Koch, A.W.; Yetisen, A.K. Smartphone-based colorimetric detection system for portable health tracking. Analytical Methods 2021, 13, 4361–4369. [Google Scholar] [CrossRef] [PubMed]
- Krishnan, T.; Wang, H.-N.; Vo-Dinh, T. Smartphone-Based Device for Colorimetric Detection of MicroRNA Biomarkers Using Nanoparticle-Based Assay. Sensors (Basel, Switzerland) 2021, 21, 8044. [Google Scholar] [CrossRef] [PubMed]
- Mutlu, A.Y.; Kl, ç.; V; Özdemir GKak Bayram, A. ; Horzum, N.; Solmaz, M.E. Smartphone-based colorimetric detection via machine learning. Analyst (London) 2017, 142, 2434–2441. [Google Scholar] [CrossRef] [PubMed]
Figure 1.
Schematic representation of the sensor design, illustrating the top three membrane layers responsible for sample preconditioning (e.g., separation of cells from plasma or particles from liquid) and the bottom membrane dedicated to colorimetric sensing via embedded chemical reagents.
Figure 1.
Schematic representation of the sensor design, illustrating the top three membrane layers responsible for sample preconditioning (e.g., separation of cells from plasma or particles from liquid) and the bottom membrane dedicated to colorimetric sensing via embedded chemical reagents.
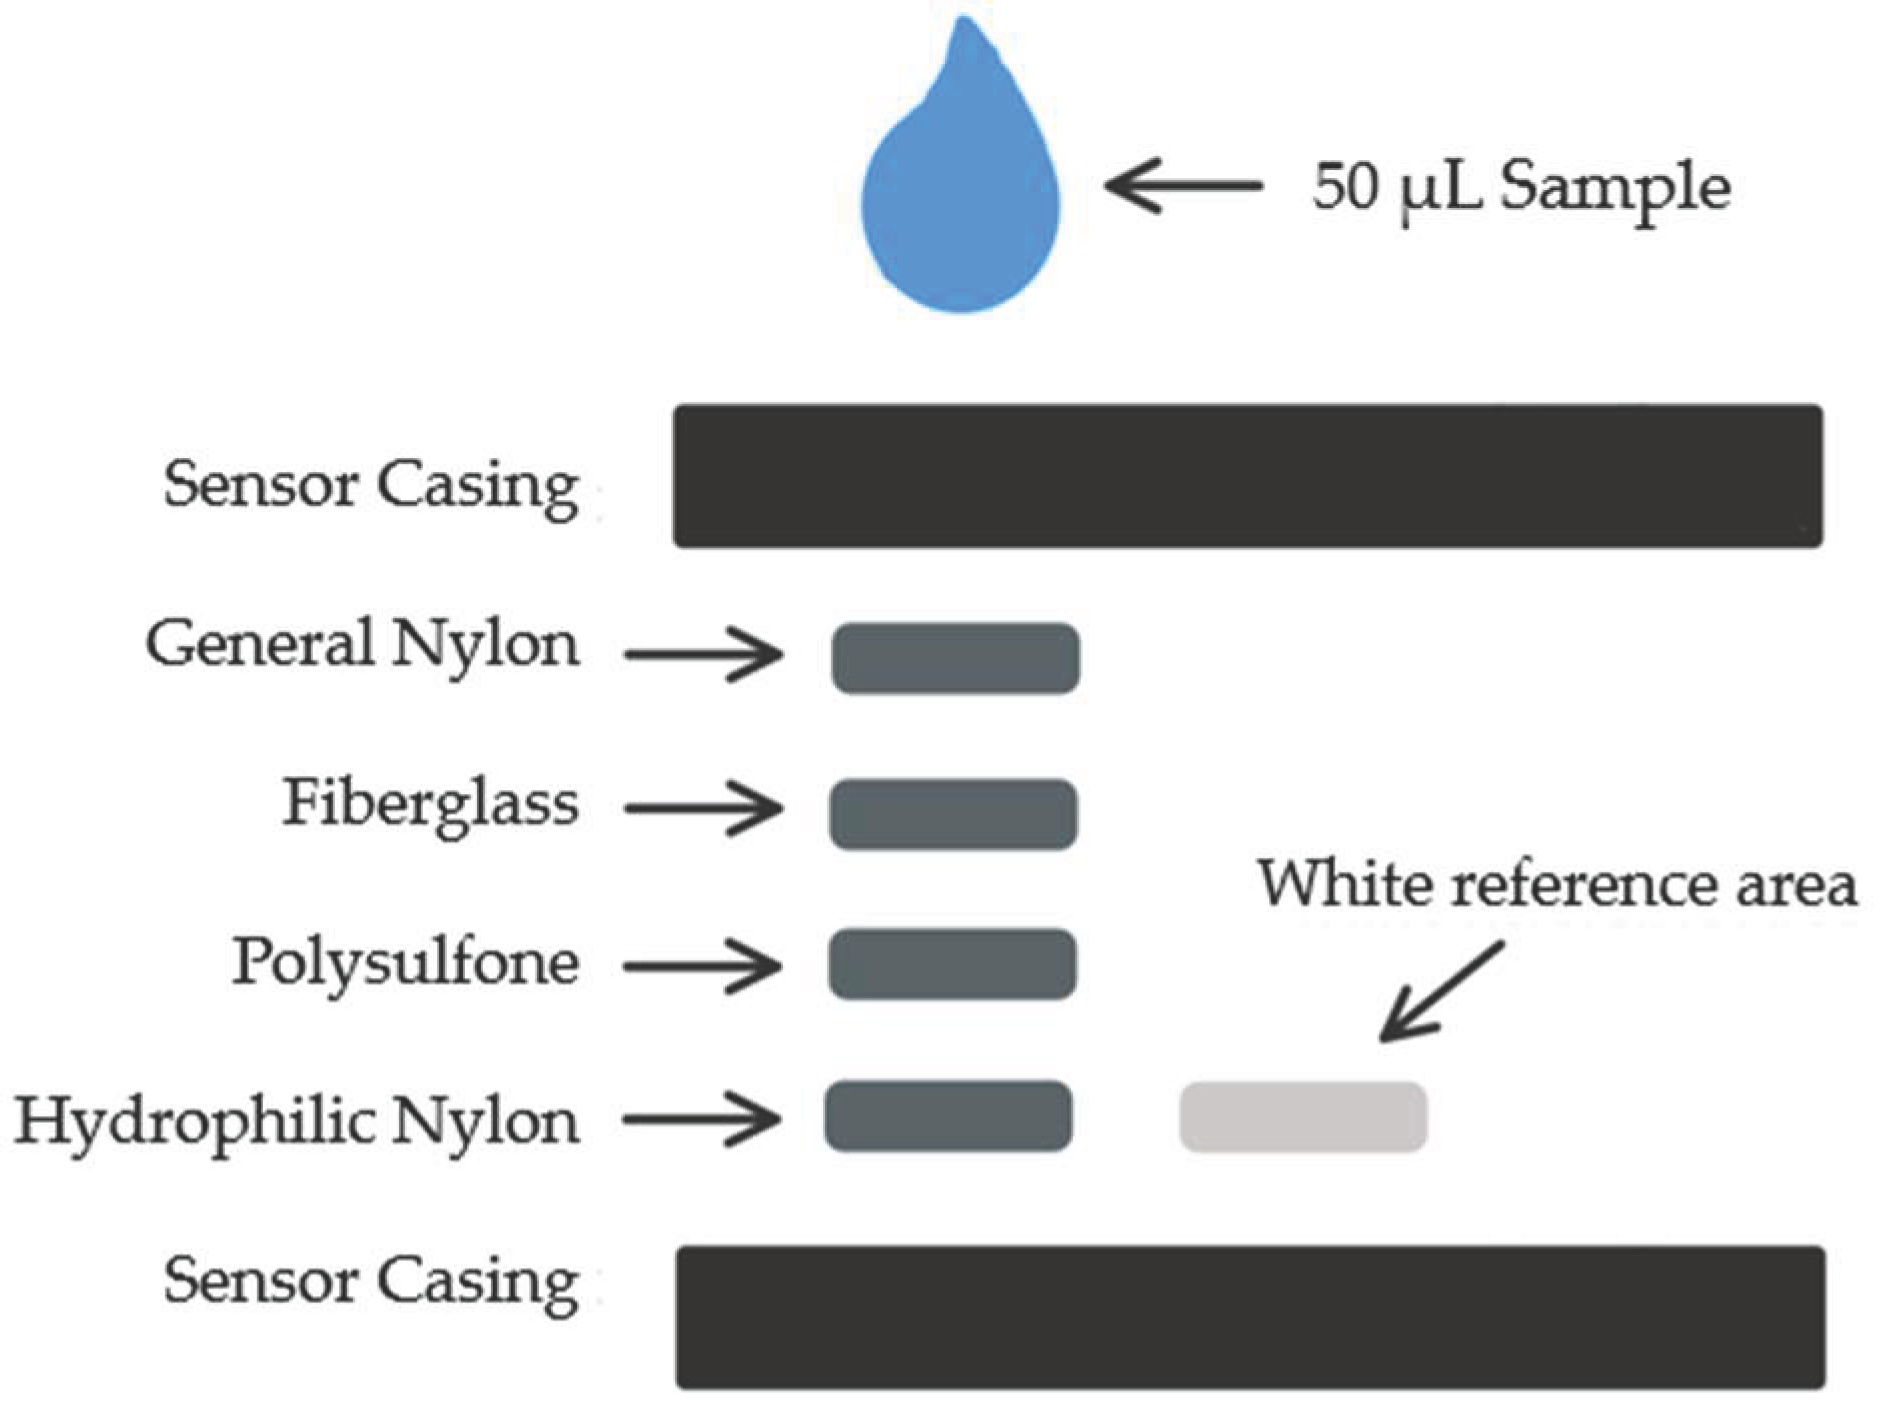
Figure 2.
(a) Top view of sensor with 3 reference cells; (b) Illustration of the correlation plot of the uncontrolled vs. controlled absorbance from three reference cells.
Figure 2.
(a) Top view of sensor with 3 reference cells; (b) Illustration of the correlation plot of the uncontrolled vs. controlled absorbance from three reference cells.
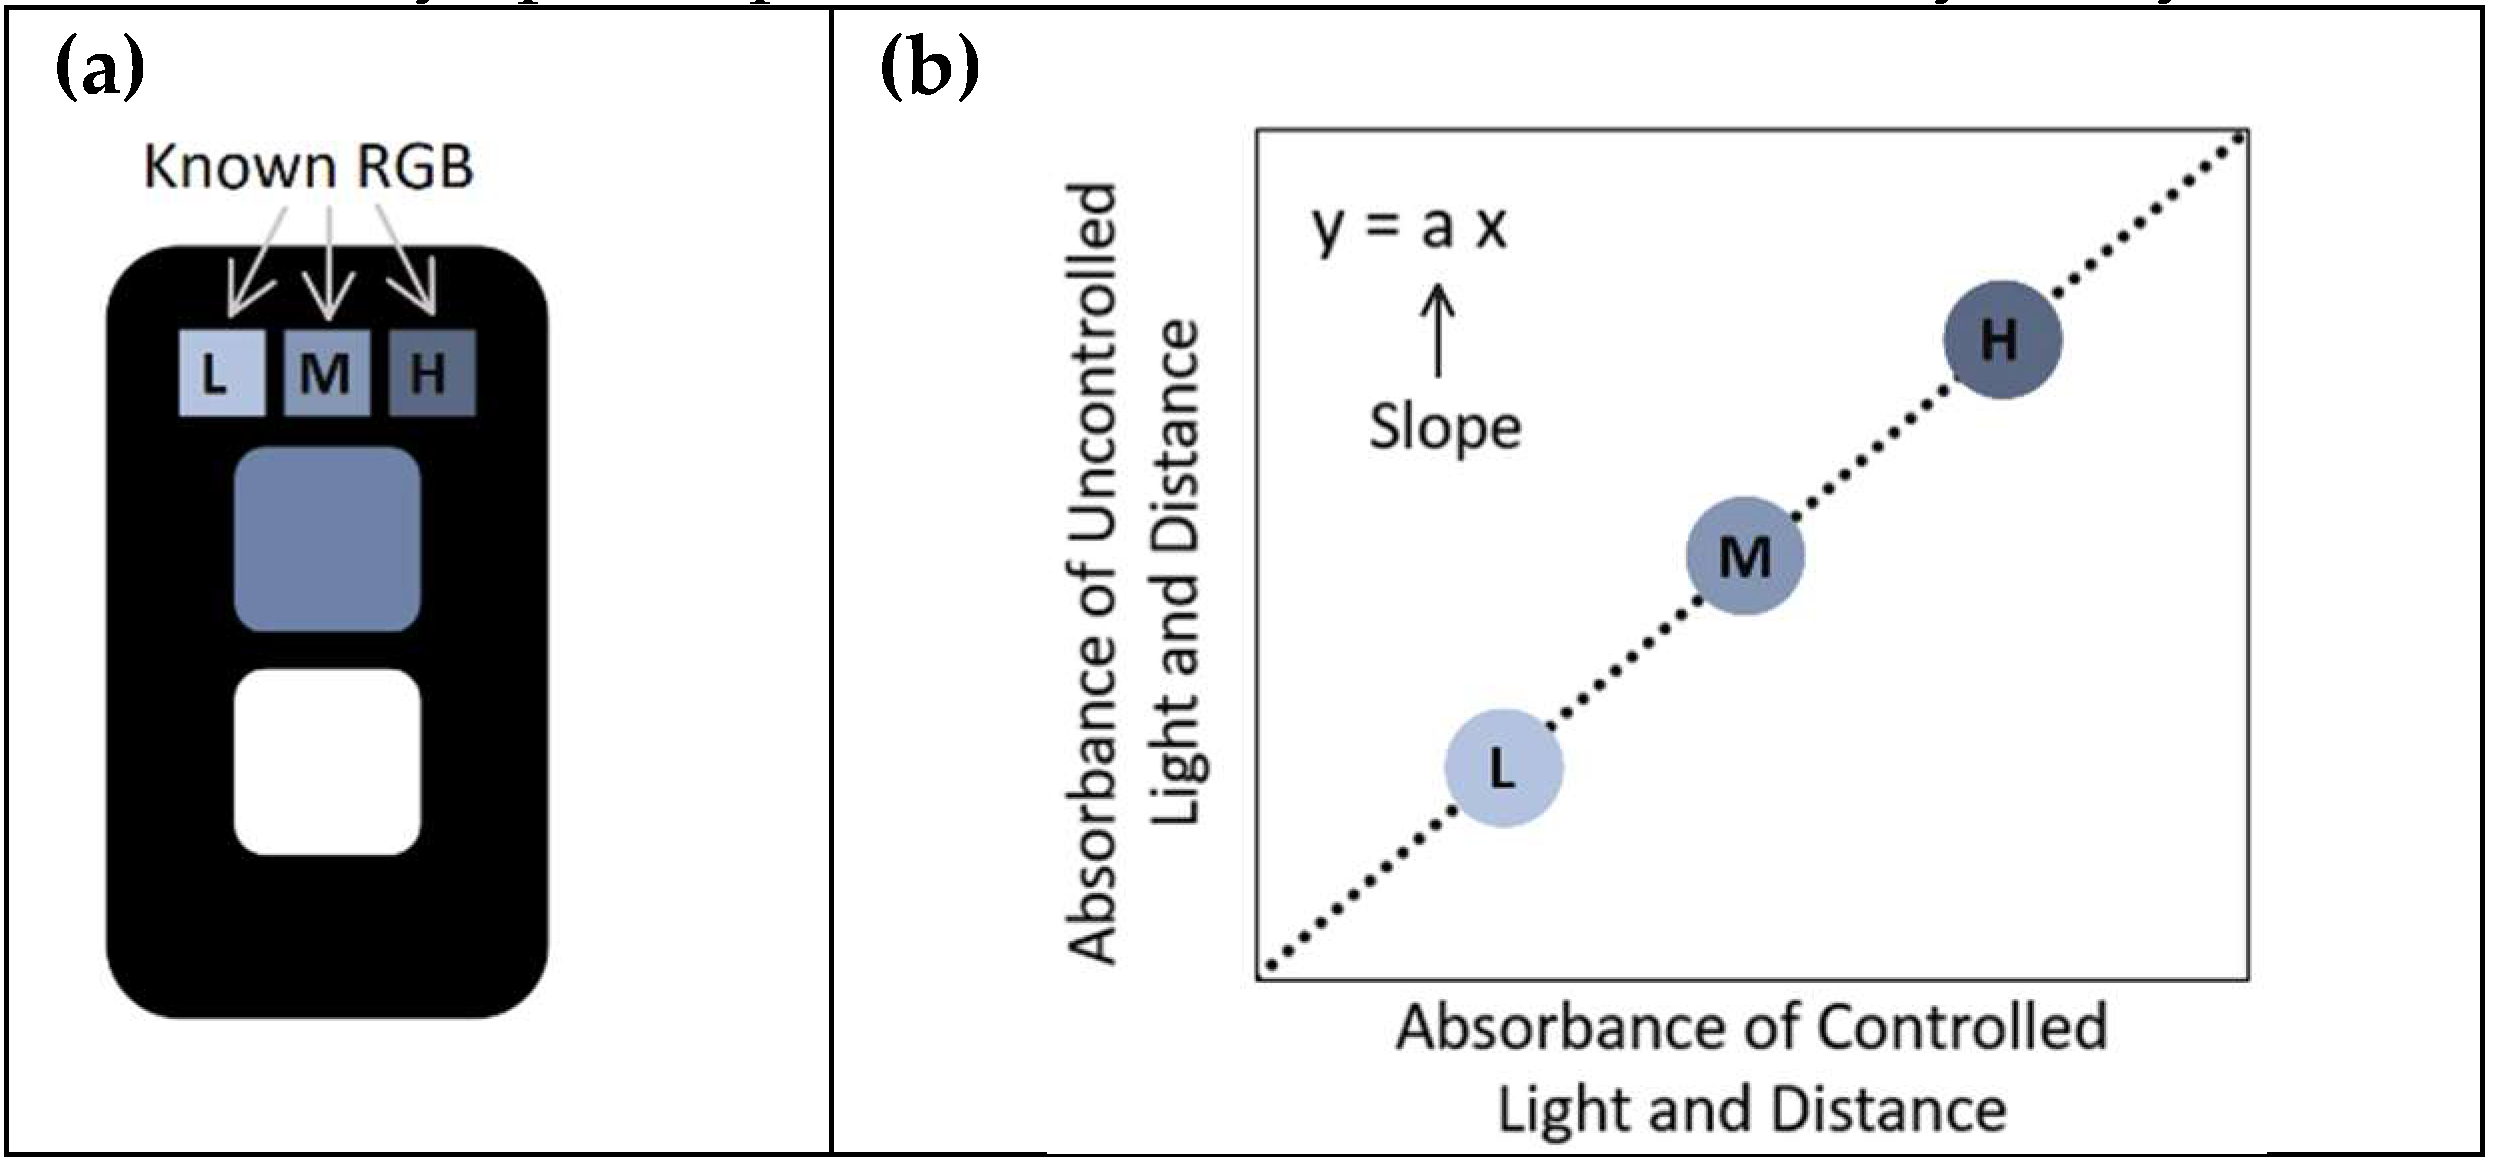
Figure 3.
Spectrophotometric calibration curve for iron (III) nitrate nonahydrate (INN) at concentrations of 0, 50, 100, 150, 300, and 500 μg/dL. The coefficients of variation for these concentrations were 1.4%, 2.9%, 1.0%, 1.8%, 1.0%, 2.9%, and 1.4%, respectively. Error bars are included but not visible due to their minimal size.
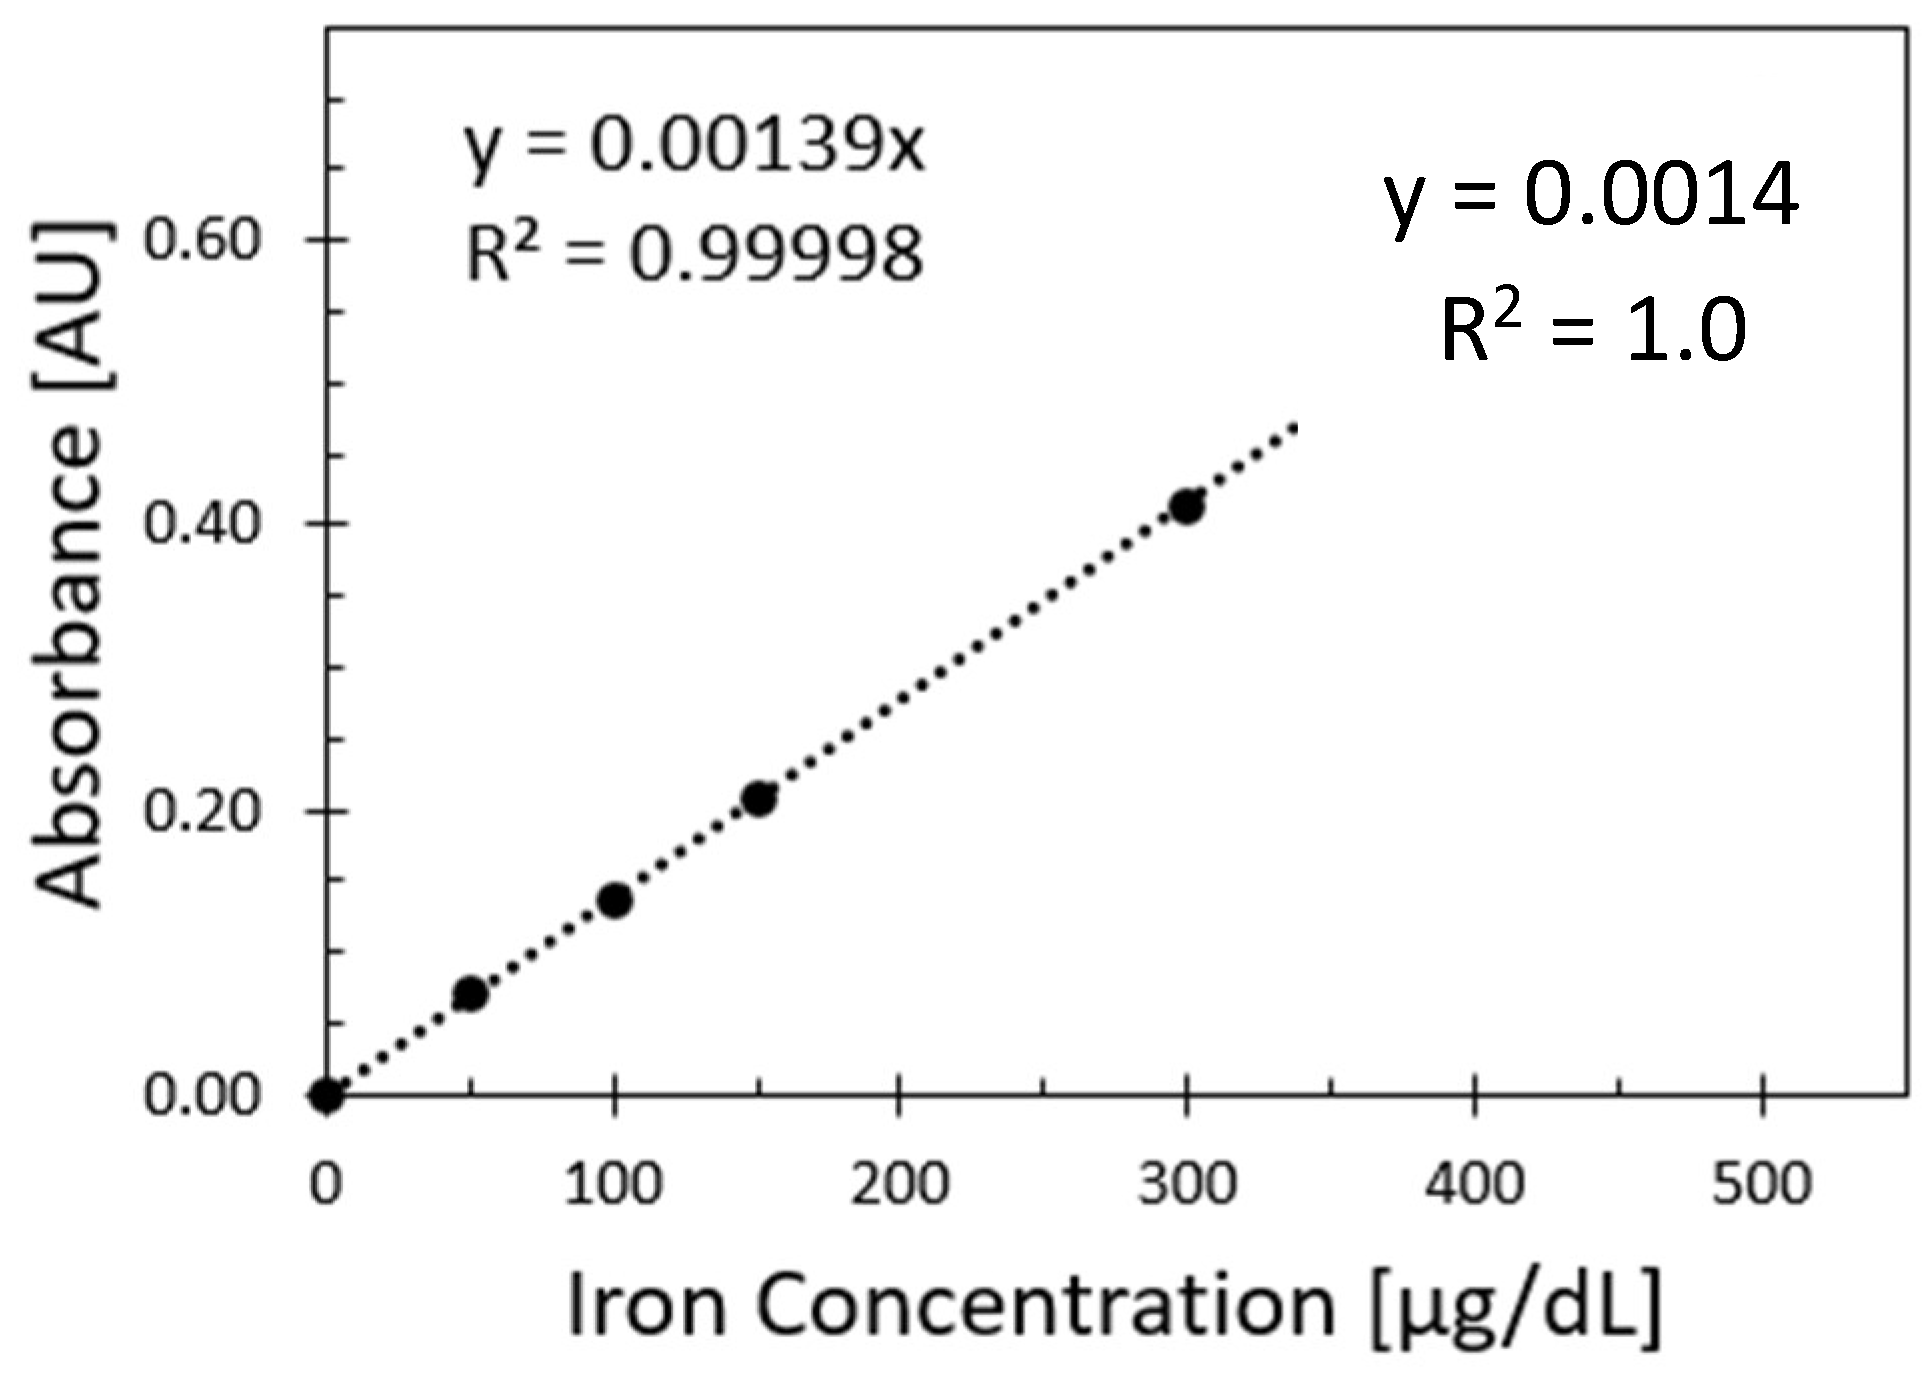
Figure 4.
Absorbance correlation plots between sensors under uncontrolled and controlled conditions for iron concentrations: (a) 0 μg/dL; (b) 50 μg/dL; (c) 100 μg/dL; (d) 150 μg/dL; and (e) 300 μg/dL.
Figure 4.
Absorbance correlation plots between sensors under uncontrolled and controlled conditions for iron concentrations: (a) 0 μg/dL; (b) 50 μg/dL; (c) 100 μg/dL; (d) 150 μg/dL; and (e) 300 μg/dL.
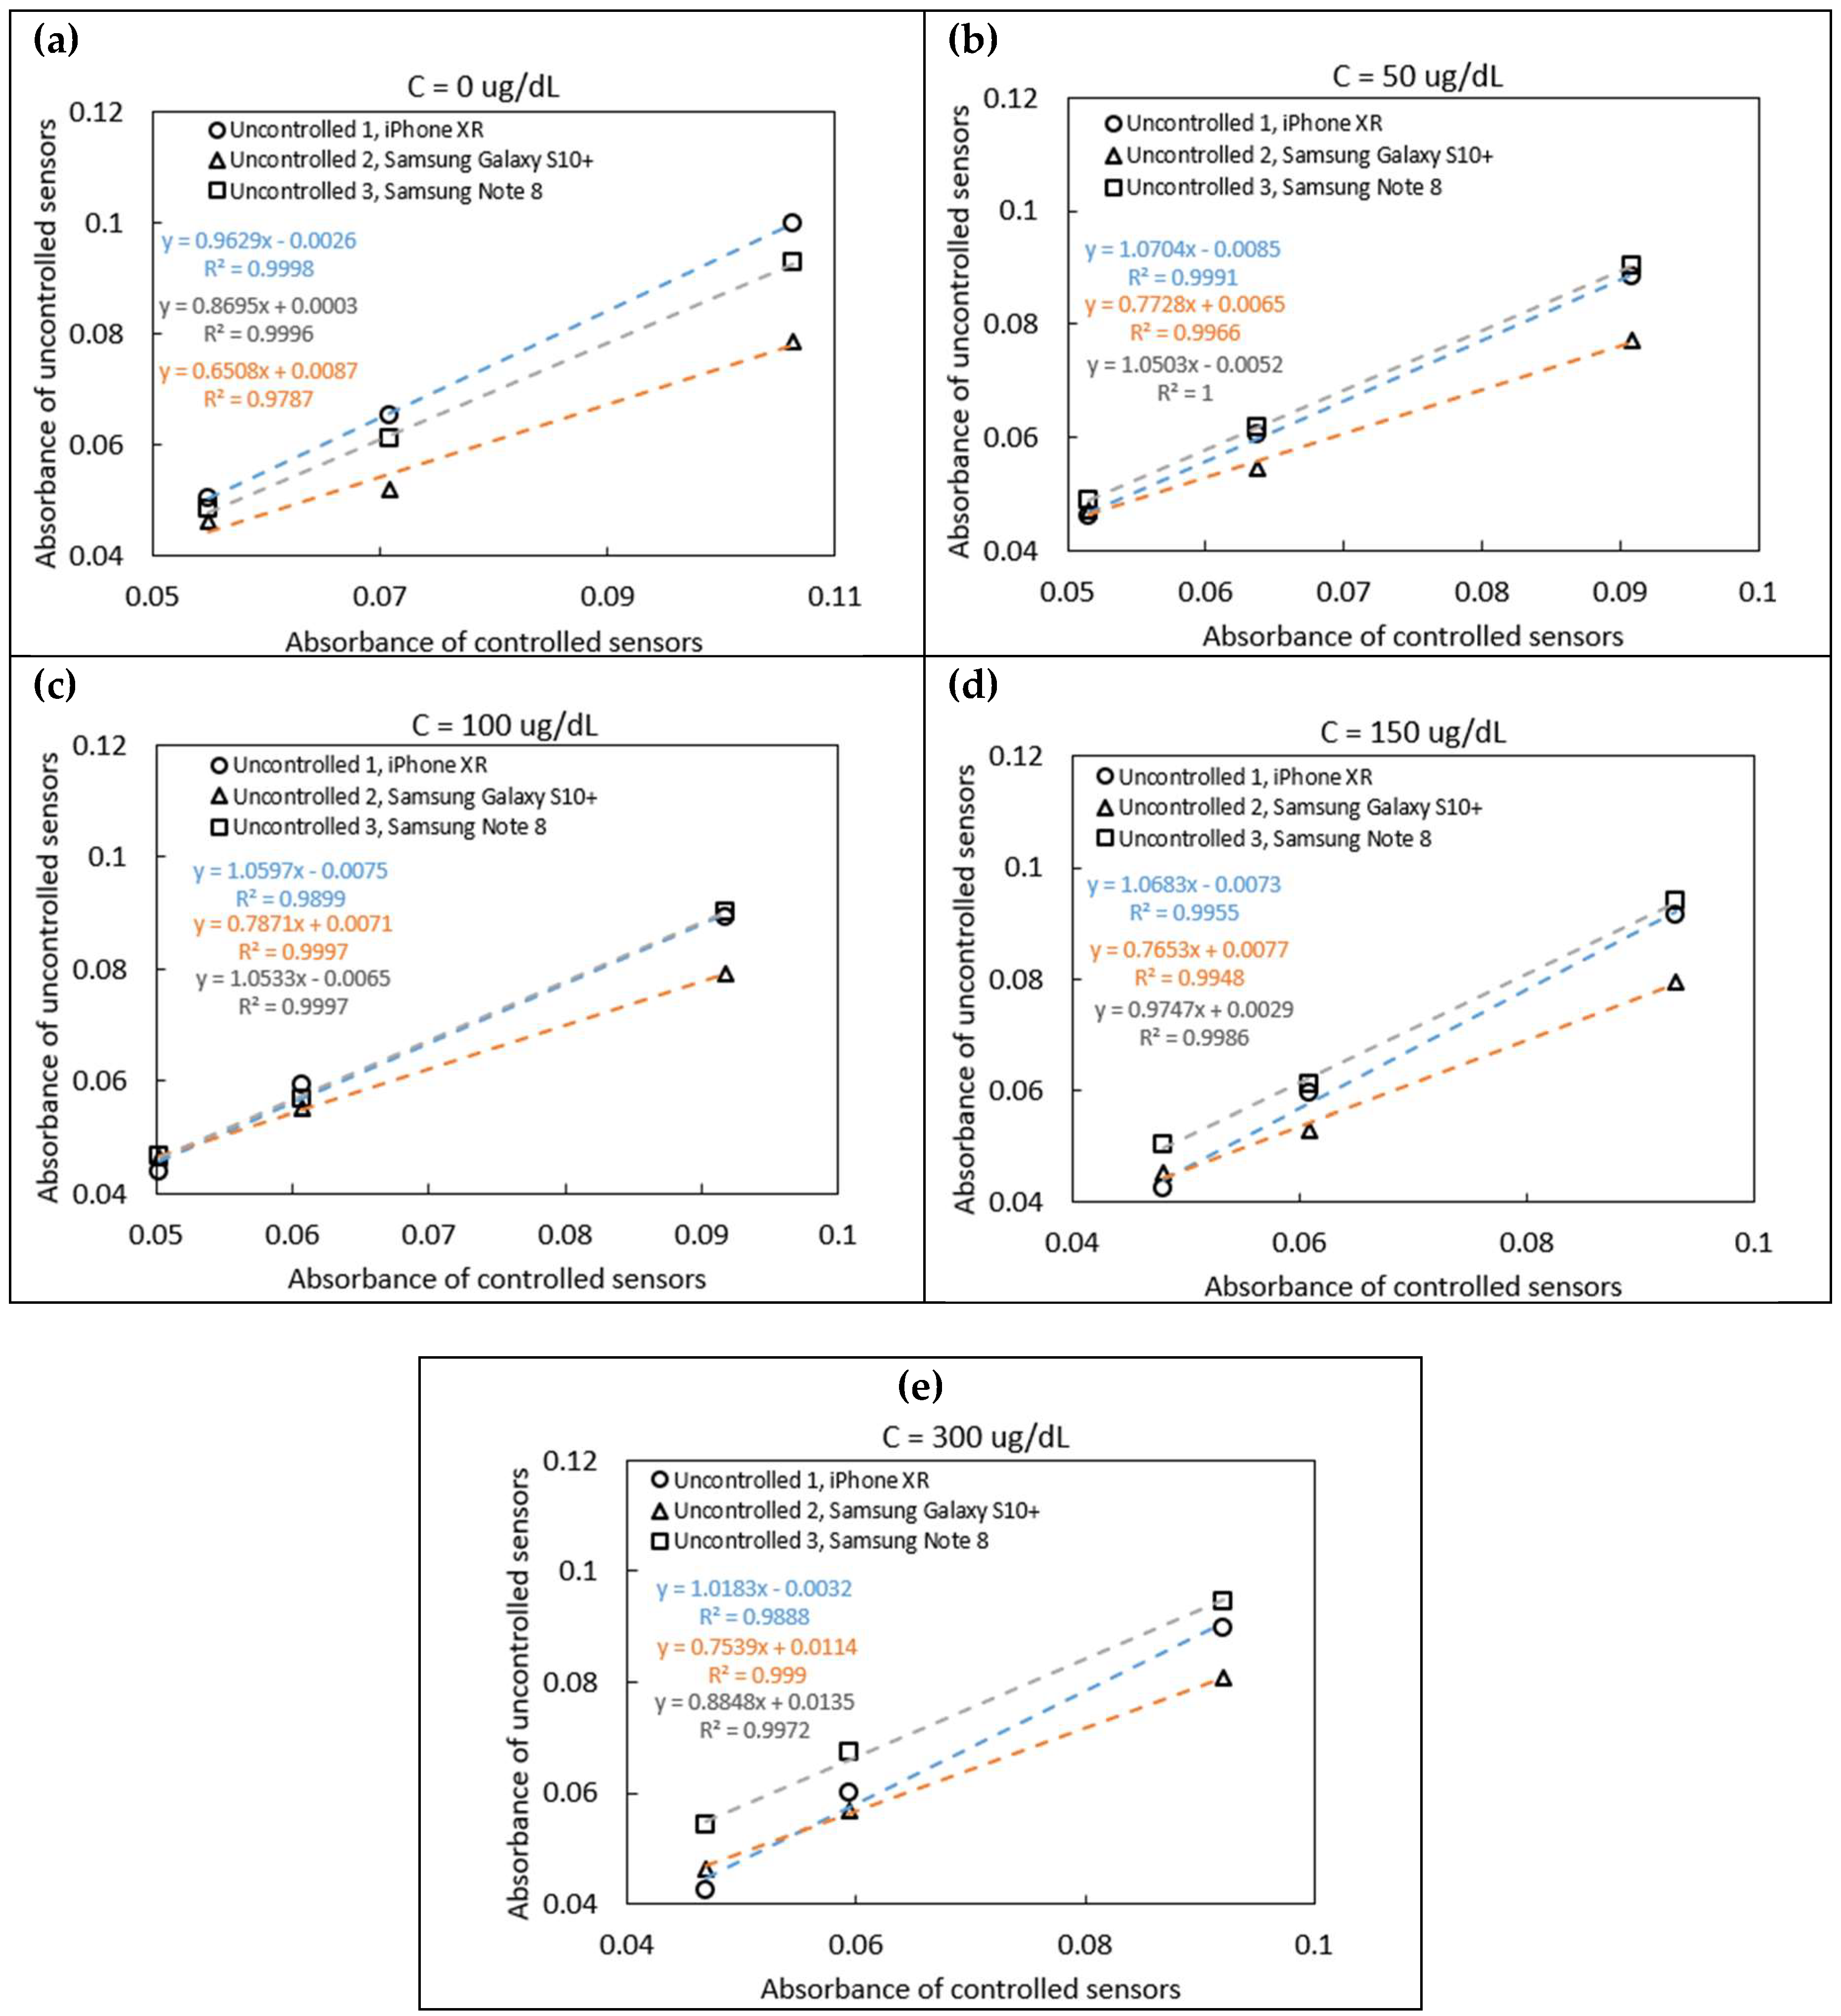
Figure 5.
(a) Sensor images taken under controlled and uncontrolled lighting conditions using iPhone XR, Samsung Galaxy S10+, and Samsung Note 8 cameras, respectively. Left to right iron concentrations: 0, 50, 100, 150, and 300 μg/dL; (b) Concentration correlation plot of sensor against the reference iron concentration (spectrophotometry results); (c) Concentration correlation plot of sensor against the reference iron concentration, the uncontrolled values are obtained by taking the means of the corrected measurements of uncontrolled data of three phone models. The normal clinical range of iron levels found in human blood is also displayed.
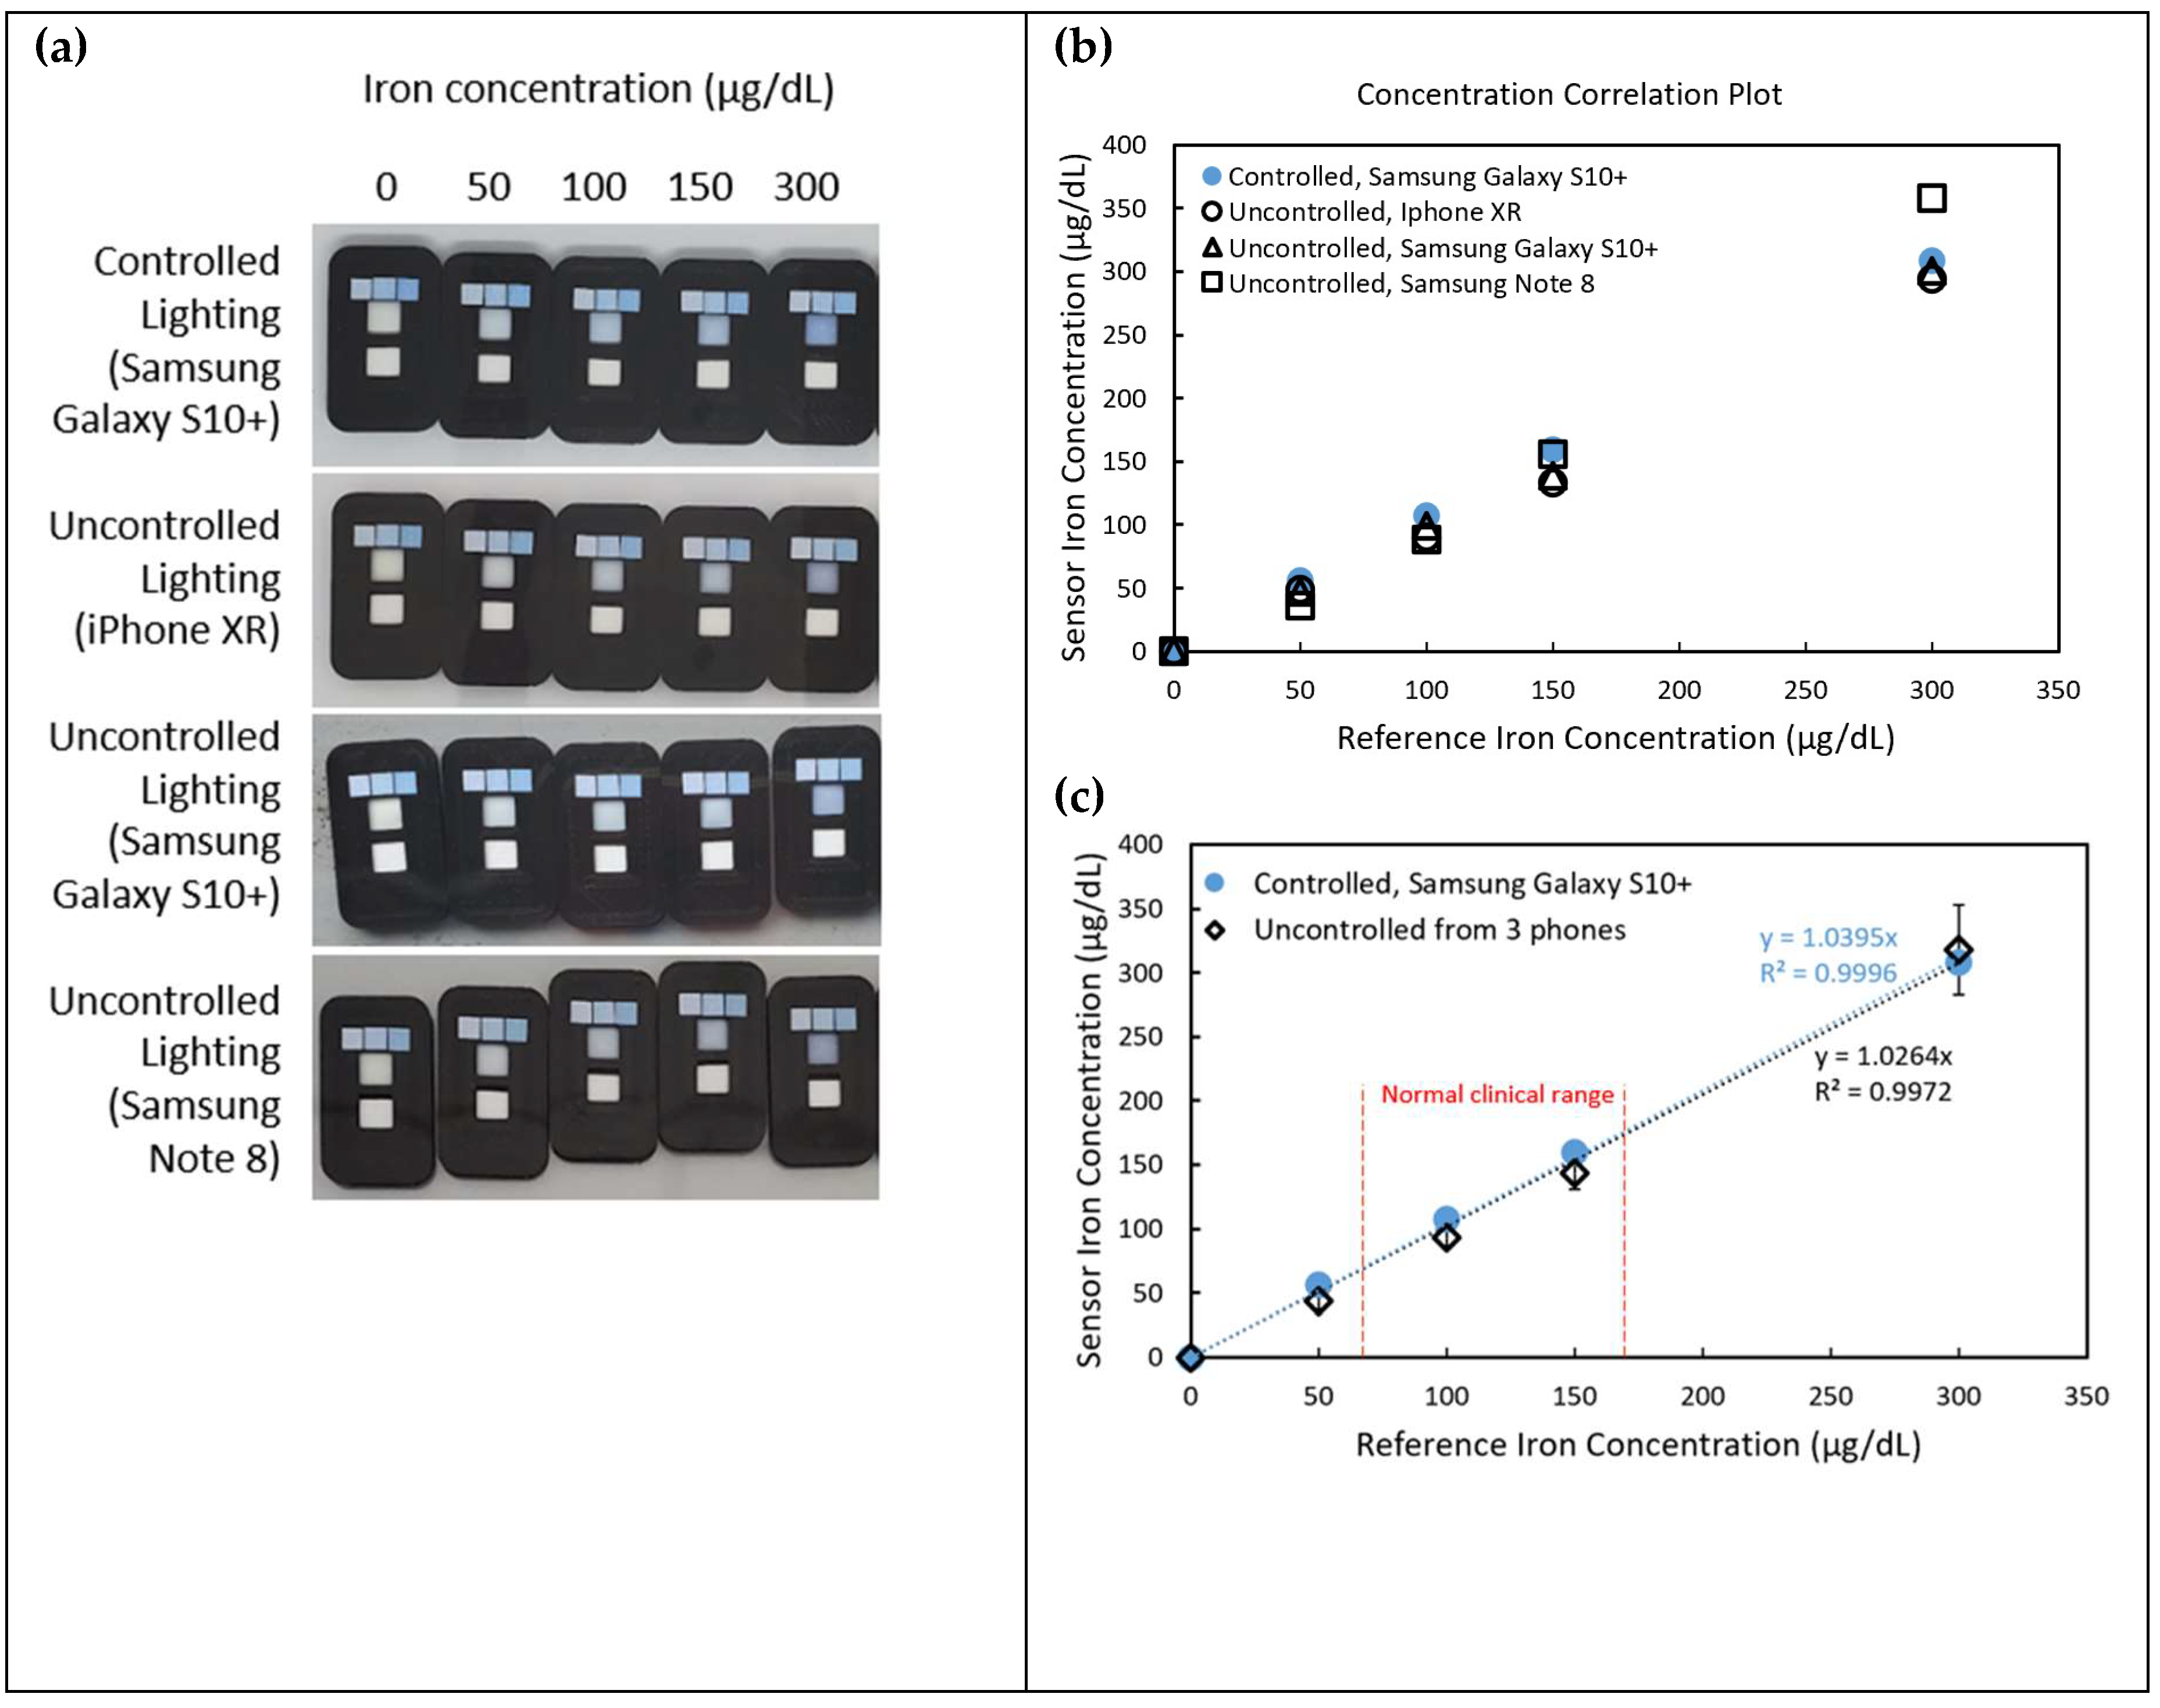
Figure 6.
Iron concentration correlation plot between controlled and uncontrolled lighting conditions using: (a) iPhone XR; (b) Samsung Galaxy S10+; and (c) Samsung Note 8 cameras.
Figure 6.
Iron concentration correlation plot between controlled and uncontrolled lighting conditions using: (a) iPhone XR; (b) Samsung Galaxy S10+; and (c) Samsung Note 8 cameras.
Disclaimer/Publisher’s Note: The statements, opinions and data contained in all publications are solely those of the individual author(s) and contributor(s) and not of MDPI and/or the editor(s). MDPI and/or the editor(s) disclaim responsibility for any injury to people or property resulting from any ideas, methods, instructions or products referred to in the content. |
© 2025 by the authors. Licensee MDPI, Basel, Switzerland. This article is an open access article distributed under the terms and conditions of the Creative Commons Attribution (CC BY) license (http://creativecommons.org/licenses/by/4.0/).
Copyright: This open access article is published under a Creative Commons CC BY 4.0 license, which permit the free download, distribution, and reuse, provided that the author and preprint are cited in any reuse.


