
Submitted:
26 May 2025
Posted:
26 May 2025
You are already at the latest version
Abstract
Unified Modeling Language (UML) diagrams are essential tools for visualizing system structure and behavior in software design. With the rise of using Large Language Models (LLMs) in automating various phases of software development, there is growing interest in automating UML diagrams generation. To that end, this study presents an empirical investigation into the effectiveness of LLMs, GPT-4-turbo, in generating structural (Class, Deployment) and behavioral (Use Case, Sequence) UML diagrams. A rule-based prompt engineering was developed to transform domain scenarios, extracted from a widely used UML textbook, into optimized prompts fed to LLMs. Then, UML diagrams were automatically synthesized using PlantUML, and evaluated through a survey of 121 computer science and software engineering students across three U.S. universities. Participants assessed completeness and correctness for both of LLM-assisted and Human-created diagrams by checking various elements for each single UML diagram. Statistical analyses, including paired t-tests, Wilcoxon signed-rank tests, and Pearson correlation, were conducted to validate the results. Findings revealed that LLM-assisted diagrams achieve completeness and correctness scores of 65%, 61.1% for Class diagram, 65.9%, 64.3% for Deployment diagram, 67.1%, 64.2% for Use Case diagram, and 67.7%, 66.2% for Sequence diagram. Whereas, the completeness and correctness for human-created diagrams reported as (79.8%, 76.3%), (70%, 73%), (80.7%, 80.4%), and (73.2%, 72.6%) for Class, Deployment, Use Case, and Sequence diagrams accordingly. Obviously, Class and Use Case diagrams show less similarity comparing to human-created models, while Deployment and Sequence diagrams show stronger alignment.
Keywords:
UML
; LLMs
; completeness
; correctness
; validation
; rules
1. Introduction
The rapid advancement of LLMs has effectively influenced various domains, including software engineering [1]. LLMs have been effectively utilized in code generation [2] [3], software architecture [4], and software testing [5]. UML [6] has been widely used to help in modeling with a set of graphical notations to capture structural and behavioral aspects of software systems. Therefore, it is an essential to explore how LLMs aid to accomplish that. Recent developments in Natural Language Processing (NLP) have facilitated the integration of LLMs [7] such as GPT-3.5, GPT-4, into UML diagram generation, enabling the conversion of natural language descriptions into UML models. From a modeling perspective, UML includes both syntactic and semantic dimensions [8,9]. The syntax defines the structure and rules of UML elements [10], while semantics explains the intended behavior and meaning, such as how generalization implies inheritance, or how messages in sequence diagrams represent method calls or signal exchanges.
Advancements in prompt engineering have further amplified the effectiveness of LLMs for software-related tasks. For instance, the research [11] introduced the concept of promptware engineering, an approach for integrating LLMs into various phases of the SDLC. Additional studies have highlighted how combining fine-tuning and optimized prompting can improve automation in code generation [12], support safety-critical software development [13], and generate test cases using intelligent prompt-guided frameworks [14].
Several studies [15,16] have explored the ability of LLMs to generate UML diagrams. Despite their remarkable ability to convert textual descriptions into UML code, LLMs still struggle with misunderstandings of all required system’s elements and constraints. To address these challenges, research studies [17] [18] have dedicated to focus on tuning models with domain scenarios, integrating validation techniques, and refining prompt engineering approaches to improve UML diagramming accuracy. Also, the studies [19,20,21] have focused on improving the accuracy of LLM-assisted UML diagrams through fine-tuning techniques. This involves adapting pre-trained LLMs to specific tasks or domains, optimizing performance in understanding, and translating software description into UML representations. Moreover, researchers [22,23,24,25,26] have explored the integration of domain-specific knowledge and constraints into the LLM training process, further refining the generated UML diagrams to meet industry standards and project requirements. There are promising capabilities of LLMs [27,28] in automating software design. However, in the academic context, incomplete or incorrect modeling outputs can mislead learners and result in a misunderstanding of the essential parts of UML modeling. Despite these advancements, the completeness and correctness of LLM-assisted UML diagrams remain an area that needs further investigation in software engineering education [29,30].
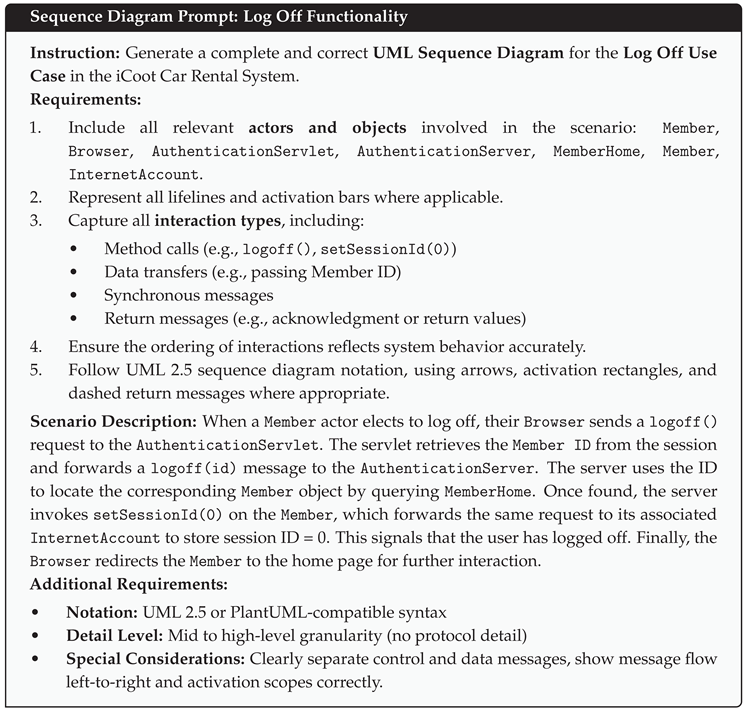
This study introduces an empirical evaluation for the effectiveness of LLM-assisted UML generation; it integrates scenario-based prompt engineering with cross-diagram evaluation. Specifically, it conducted a survey with 121 computer science and software engineering students from three U.S. institutions—Saint Cloud State University, Southern Illinois University Carbondale, and the University of Wisconsin–Green Bay. The goal is to capture the evaluation from the students centric perspectives. The survey includes set of investigated elements for completeness and correctness to compare LLM-assisted UML diagrams (Class, Deployment, Use Case, and Sequence) with human-created ones. The study addresses the following research questions:
- RQ1: To what extent do an LLM-assisted class diagram match a human-created diagram in terms of completeness and correctness?
- RQ2: To what extent do an LLM-assisted deployment diagram match a human-created diagram in terms of completeness and correctness?
- RQ3: To what extent do an LLM-assisted use case diagram match a human-created diagram in terms of completeness and correctness?
- RQ4: To what extent do an LLM-assisted sequence diagram match a human-created diagram in terms of completeness and correctness?
2. Related Work
LLMs have significantly influenced software modeling, particularly in automating the generation of UML diagrams. Recent studies [15,16,17,29,30,31] have addressed a variety of approaches where LLMs such as GPT-3.5, GPT-4, Gemini, are applied for converting natural language descriptions or user stories into UML models, extracting UML from textual or visual inputs, and assessing modeling quality through experimental or prompt engineering. These studies are summarized in Table 1.
From the perspective of UML structural diagrams, the study [31] explored the usage of GPT-4V, Gemini to generate a UML Class model from given images of hand-drawn UML diagrams. Their study compared GPT-4, Gemini Pro, and Gemini Ultra. Based on their findings, GPT-4 provided the best results. The research conducted by [29] aimed to provide class diagrams from the NL descriptions using GPT-3.5 and GPT-4. Also, the study [29] evaluated fully automated domain modeling using, GPT-3.5/GPT-4, by exploring three types of shots, zero-shot (no examples), N-shot (1-2 labeled examples), and chain-of-thought (CoT) (step-by-step rationale). Results showed that GPT-4 with 1-shot prompting performed best for classes and relationships, while 2-shot improved attribute generation. Zero-shot had lowest recall values (missing elements), and CoT was ineffective for domain modeling. Their findings reveal that LLMs struggled with relationships and modeling. Another research study by [16] purposed to explore the current capabilities of ChatGPT in performing modeling tasks and help software designers identify the syntactic and semantic gaps of UML. Nevertheless, these studies captured only the Class diagram.
In terms of UML behavioral diagrams, the study [15] applied a qualitative approach by investigating how ChatGPT would assist in producing sequence diagrams from 28 Software Requirements Specifications (SRS) in various problem domains. In addition, the research work [17] proposed a co-prompt engineering approach, ECHO, that helped software engineers efficiently use ChatGPT as an essential LLM to improve the quality of generated Use Case diagrams. Nevertheless, these studies are limited to Sequence or Use Case diagrams.
Considering the exploration of both structural and behavioral UML diagrams, the study [30] designed an experiment by involving 45 undergraduate students enrolled in a required modeling course. The findings showed how GPT-3.5, GPT-4 would significantly assist the students in producing three UML models: class diagram, use case diagram, and sequence diagram. This study addressed only correctness evaluation, and it involved students’ feedback from a single University.
This study attempts to capture both completeness and correctness evaluation for structural (Class and Deployment) and behavioral (Use Case and Sequence) UML diagrams. The proposed approach uses a survey which is designed to compare LLM-assisted UML diagrams with human-created diagrams based on students perspectives, across three different U.S. Universities. The proposed approach employs zero-shot prompts with explicit UML constraints and algorithmic validation, which essentially aims to test the ability of GPT-4-turbo in assisting the visualization of the investigated diagrams.
3. Materials and Methods
This section outlines the proposed methodology, it presents a rule-based prompt engineering framework used to generate UML diagrams from problem domain scenarios, details the validation algorithms applied to ensure quality of prompts, and explains the empirical data collection process.
Our approach is structured as a pipeline design to evaluate the effectiveness of GPT-4-turbo, in generating complete and correct UML diagrams given natural language scenarios, as illustrated in Figure 1. We selected GPT-4-turbo because it is designed to handle longer natural language text (i.e. problem domain scenarios), compared to GPT 3.5 and GPT 4.
3.1. Generate UML Diagrams Using GPT-4-Turbo and PlantUML
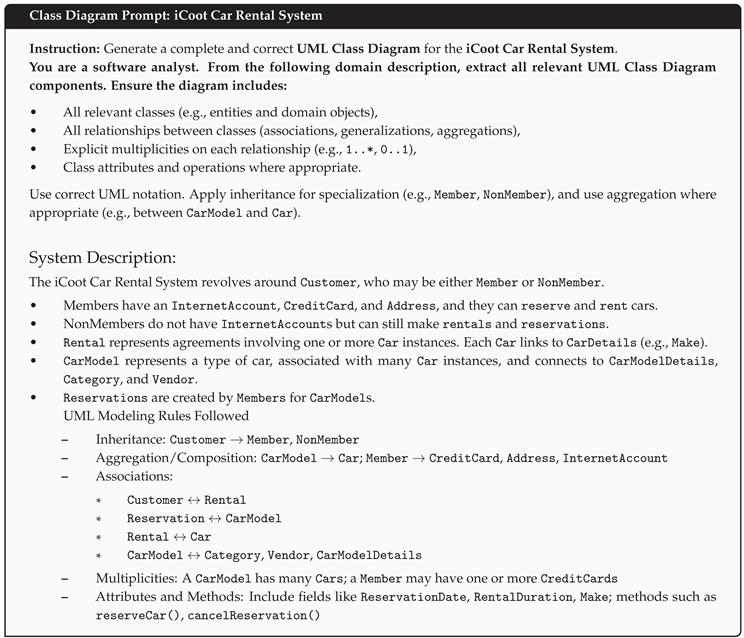
The iCoot Car Rental system has been chosen to represent a real-world system, which it’s scenarios (i.e., natural language) have been taken from one of the most popular object-oriented design textbooks [28], as described in Appendix A.
To generate a UML diagram from scenarios is a complex process that we formulated into a series of prompts for LLMs. We started with rule-based prompt engineering, where natural language scenarios were converted into prompts. The developed prompting strategy guides LLMs through identifying relevant elements and gathering them into a diagram description (i.e., UML code). The elements extraction was implemented to detect all relevant components, such as classes, actors, relationships, multiplicity, nodes, software artifacts, use cases, objects, message types, etc. To develop structured prompts that direct LLMs in creating UML diagrams from plain-language requirements, we formalize this work using a set of connected algorithms, including extraction, mapping, constraint enforcement, optimization, and validation.
3.2. Prompt Engineering Rules
We begin with a high-level overview of the pipeline through Algorithm 1. It describes scenario requirements and target diagram type to UML model elements for diagrams to be identified in the domain as software analysts. This procedure encapsulates the transformation from unstructured text to a well-formed UML diagram prompt, which orchestrates the entire pipeline and ensures that the final prompt is both structurally complete and semantically valid before it is used for UML generation. Let denote the NLP description of a software system, be the target UML diagram type, and be the resulting prompt structure.
| Algorithm 1 Generate UML Prompt |
|
Algorithm 1 generates valid and complete UML diagram as described in formal prompt engineering models, which converts unstructured NL scenarios into structured prompts suitable for LLM usage. It defines a set of sequential computational steps that extract modeling elements, identify relationships, enforce constraints and validate prompt quality. Each step, as described in the following subsections, ensures that the final prompts are aligned with UML syntactic rules and domain semantics before creating UML diagrams.
Elements Extraction. The first step involves identifying the core entities and actions from the requirement specification, which can identify all relevant entities, actors, nodes, and functional elements, etc. from the scenarios. These become the foundational elements for modeling UML diagrams. This ensures that all relevant objects and functionalities mentioned in the textual description are captured and formalized as potential diagram elements as shown in Algorithm 2.
| Algorithm 2 Extract Elements |
|
Relationship Mapping. Once elements are identified, we map the interactions or dependencies among them to define structural or behavioral relationships, such as associations, generalizations, message flows, or deployment links, depending on the diagram type. These relationship types vary based on the type of diagram, either behavioral or structural, as shown in Algorithm 3.
| Algorithm 3 Map Relationships |
|
Constraint Definition. Each element and relationship are then annotated with UML-specific constraints, such as multiplicity, types, role, attributes, aggregation, composition, inheritance rules, association, extends, includes, deploys, manifest, artifact mapping, and messages sequences and types. These constraints ensure that generated prompts yield diagrams that adhere to valid UML syntax and semantics, reducing ambiguity as shown in Algorithm 4.
| Algorithm 4 Define Constraints |
|
3.3. Validation Functions
To prevent the generation of incomplete or incorrect UML prompts, we proposed two scoring functions that evaluate prompt quality based on completeness and constraint satisfaction. Algorithms 5 and 6 describe the essential validation functions for completeness and correctness, respectively. They provide the empirical basis for rejecting poorly designed prompts and ensure the reliability of the generated UML diagrams according to the previously defined rules described in Algorithm 2, Algorithm 3, and Algorithm 4.
Completeness Validation: It checks whether the prompts include all required elements expected from the scenarios; it computes a completeness ratio () and rejects prompts below a predefined threshold .
| Algorithm 5 Validate Completeness |
|
measures how fully a generated diagram covers the required UML elements extracted during prompt formulation. It is calculated as the proportion of implemented elements as classes, actors, relationships, etc. to the total expected elements for a given diagram type. Mathematically, is defined as in Equation 1.
Where, the ImplementedElements represents the number of required UML components correctly generated, and the RequiredElements forms the total number of UML components expected according to the prompt.
Correctness Validation: It checks each constraint in the prompt. If any constraint is violated—such as incorrect attribute types or mismatched relationships—the prompt is rejected.
| Algorithm 6 Validate Correctness |
|
The Constraint Satisfaction Score () measures adherence to UML syntactic and semantic rules embedded within the prompt, such as multiplicity constraints, relationship types, for example, aggregation vs. composition, and behavioral accuracy, such as message sequencing in Sequence diagrams. It is calculated as indicated in Equation 2. Furthermore, a prompt is deemed acceptable if both scores exceed defined thresholds: and , which were empirically set to 0.5 in our evaluation.
Where the SatisfiedConstraints show the number of rules that the prompt required and the LLM respected correctly in the diagram as all correct relationships, multiplicities, Actor-use connections, Sequence message types, etc. While the TotalConstraints represent the total number of all required rules that the prompt expected the LLM to satisfy. All the calculations for the validation functions (CR and CS), for both human-created and LLMs-assisted UML diagrams, have been explained in the Appendix A.
3.4. Generating UML-Assisted Diagrams
After applying the prompt development strategy, this study constructed textual prompts for all UML diagrams using scenario descriptions from the textbook. These prompts were processed using GPT-4 turbo, which then generated the corresponding UML code for each diagram. The generated code was copied into the PlantUML tool 1 to visualize the diagrams, alongside human-created UML diagrams that were extracted from the same textbook to ensure consistency with the associated scenarios. The LLM-assisted diagrams were then extracted and included in our survey. All details regarding the prompt descriptions are provided in Appendix A.
3.5. Data Collection
The methodology adopts an empirical evaluation through a survey that collected responses from about 121 computer science and software engineering students across three different public universities. The survey includes 8 diagrams, four diagrams for LLM-assisted and four for Human-created diagrams. The survey captures (6, 6), (4, 4), (5, 4), and (4, 4) elements of (Completeness, Correctness) for Class, Deployment, Use Case, and Sequence diagrams respectively. The same identical questions have been given for each single LLM-assisted and human-created diagrams, and each question captures a single investigated element. To collect and analyze the responses, we used Qualtrics 2. Figure 2 displays the number of participating students from all universities. In total, there are 80 undergraduate students and 41 graduate students across all universities. The majority of undergraduate students are Juniors and Seniors. In terms of their UML modeling skills, the majority of participants have taken software engineering courses such as, Introduction to Software Engineering, Software Design, and Software Analysis.
4. Results
This section presents the empirical findings derived from the student evaluation of LLM-assisted and human-created UML diagrams. It includes descriptive and inferential statistical analyses that compare performance across diagram types, highlighting differences in completeness and correctness.
4.1. Statistical Analysis
To enable more robust statistical analysis, we mapped the categorical survey responses-assigning 0 for incomplete and incorrect elements and 1 for complete and correct elements. We then calculated the average score for each element to obtain a value between 0 and 1 that reflected the completeness or correctness score for the element being measured. As shown in Table 2, the completeness scores of LLM-assisted UML diagrams consistently fall short of those of their human-created counterparts across all four diagram types. This gap is most evident in the Class and Use Case diagrams. The human-created class diagram achieved a mean () score of 0.7988 ( = 0.0322), while the LLM-assisted version scored notably lower at 0.6502 ( = 0.0457). Similarly, the human-created use case diagram recorded the highest mean completeness score at 0.8072 ( = 0.0087), whereas the LLM-assisted counterpart attained a mean of 0.6712 ( = 0.0300).
4.1.1. Descriptive Statistics
In the remaining two diagram types—Deployment and Sequence—LLM-assisted diagrams came somewhat closer to human performance but still underperformed. For the deployment diagram, the human-created diagram had a mean score of 0.7005 ( = 0.0372), compared to 0.6486 ( = 0.0362) for the LLM-assisted diagram. The sequence diagram had the narrowest margin between the two sources, with human-created diagrams averaging 0.7320 ( = 0.0358) and LLM-assisted ones achieving 0.6768 ( = 0.0174).
While the gaps in mean scores ranged from roughly 5 to 15 percentage points, LLM-assisted diagrams also exhibited greater variability in three of the four diagram types. Specifically, the class diagram generated by LLMs had a wide score range, from 0.5721 to 0.6982, indicating inconsistent levels of completeness. In contrast, human-created diagrams not only scored higher but also showed tighter clustering of scores, particularly in the use case diagram, where scores ranged narrowly between 0.7928 and 0.8153.
As shown in Table 3, LLM-assisted UML diagrams also trail behind human-created diagrams in terms of correctness scores in the four types of diagram. This disparity is most apparent in the Class and Use Case diagrams. The human-created class diagram received a mean () score of 0.7635 ( = 0.0220), while the LLM-assisted version scored lower at 0.6111 ( = 0.0854). Similarly, the use case diagram produced by human participants achieved the highest correctness mean at 0.8041 ( = 0.0222), in contrast to the LLM-assisted counterpart, which had a mean score of 0.6419 ( = 0.0298).
In the Deployment and Sequence diagrams, the performance gap narrowed slightly but still favored the human-created diagrams. For the deployment diagram, human-created versions attained a mean correctness score of 0.7309 ( = 0.0174), whereas LLM-assisted diagrams scored a mean of 0.6430 ( = 0.0279). The sequence diagram showed the smallest difference, with human-created diagrams averaging 0.7264 ( = 0.0245) and LLM-assisted ones scoring 0.6622 ( = 0.0337).
LLM-assisted diagrams also exhibited greater inconsistency in correctness scores-similar to what was observed in the completeness scores-particularly in the class diagram category, where scores ranged from 0.4865 to 0.6847, a considerably wider spread than the human-created range of 0.7342 to 0.7928. Human-created diagrams also consistently showed tighter clustering, with smaller standard deviations and more stable minimum and maximum values. For example, the correctness scores for human-generated deployment diagrams ranged narrowly from 0.7207 to 0.7568, while the LLM equivalents varied more broadly from 0.6126 to 0.6802.
4.1.2. Inferential Statistics
To assess how differently participants evaluated LLM-assisted diagrams compared to human-created ones, we conducted both paired t-tests and Wilcoxon signed-rank tests. These tests compared human and LLM scores given by the same group of participants for each UML diagram type. Although our survey collected 121 individual responses, the aggregated scores were calculated for each element (e.g., Methods, Notations, Classes, Inheritance, etc.). Since the number of elements per diagram was relatively small (–6), we combined the correctness and completeness scores to increase power and perform an overall comparison between human-created and LLM-assisted diagrams. The resulting sample sizes still remained modest (–12), limiting the reliability of the t-test alone due to the assumption of normality. To address this, we include a supplementary test-the Wilcoxon signed-rank test. It is a nonparametric alternative that does not assume normality and is therefore more robust for small samples or when the normality assumption may be violated.
Table 4 and Table 5 show the results of these tests. We also include the standardized effect sizes (Cohen’s d) to assess the size of the difference between the human and LLM completeness and correctness scores. The larger the value, the greater the difference between their standardized means.
Across the four types of UML diagrams, LLM-assisted diagrams received significantly lower scores than their human-created counterparts. The most pronounced difference appeared in the Use Case diagram. The average completeness and correctness scores for the LLM-assisted version was considerably lower, with a very large effect size () and a Wilcoxon test result of (), meaning that almost every participant rated the LLM version lower than the human one.
A similar pattern was found in the Class diagram, where LLM-assisted UML output received lower average scores and had higher variability. The paired t-test indicated a strong effect (, ), while the Wilcoxon test again yielded (), reflecting unanimous lower scores for the LLM-assisted diagram.
In the case of the Deployment diagram, the LLM version was also consistently scored lower (, ), though the magnitude of difference was slightly less than in the previous two types. The Wilcoxon test still confirmed this pattern (), indicating a clear preference for the human-created version.
Even in the Sequence diagram, where the performance gap was smallest, the LLM-assisted diagram lacked in terms of matching the quality of the human one. The effect size remained large (), and the Wilcoxon test again reported (), showing that all participants favored the human diagram.
These results are visually summarized in Figure 3. In each UML diagram type, scores for the LLM-assisted diagrams are lower and more spread out. This pattern is most evident in the Class and Use Case diagrams, where a large visual difference can be observed and the box plots for the LLM-assisted diagrams have much longer tails.
4.2. Comparing LLM-Assisted Diagrams to Human-Created Diagrams
To further explore how LLM-assisted diagrams underperformed, and to more comprehensively answer our research questions, we visualized completeness and correctness scores within each UML diagram. Figure 4, Figure 5, Figure 6 and Figure 7 show a side-by-side comparison of completeness and correctness scores for each element for each UML diagram type. The x-axis represents the elements, and y-axis represents the completeness or correctness score for all diagrams in this section.
4.2.1. Class Diagram
Addressing RQ1, Figure 4 shows that LLM-assisted Class diagrams demonstrated moderately close performance to human-created diagrams, particularly in representing basic classes and inheritance. However, noticeable gaps emerged in methods (0.77 vs. 0.57) and visibility (0.73 vs. 0.49), suggesting that while LLMs could model structural elements reasonably well, they had greater difficulty capturing functional behaviors and access control. Overall, the results show that LLMs can approximate human-created Class diagrams to a meaningful degree but still fall short on more nuanced features.
4.2.2. Deployment Diagram
Figure 5 answers RQ2 and shows that LLMs achieved relatively strong performance on Deployment diagrams. Scores for core elements such as nodes and artifacts were only 5–6 percentage points below human-created diagrams, indicating that the LLM could effectively replicate the main architectural aspects of this diagram. Some differences remained in modeling relationships and communication paths, where correctness scores were lower (0.64 and 0.61, respectively), suggesting that while LLMs closely approximate human deployment modeling in terms of static elements, further improvements are needed to holistically capture dynamic elements.
4.2.3. Use Case Diagram
To answer RQ3, Figure 6 shows that the Use Case diagram posed the greatest challenge for LLMs. Although they were able to approximate basic actor and use case labeling to some extent, larger discrepancies appeared in links (0.78 vs. 0.60) and generalized relationship structures (0.82 vs. 0.64). These results suggest that LLMs have more difficulty modeling hierarchical relationships and interaction flows.
4.2.4. Sequence Diagram
As relating to RQ4, the Sequence diagram results (Figure 7) showed the highest degree of alignment between LLM-assisted and human-created diagrams. Completeness scores for key elements like actors and messages differed by as little as 5 percentage points, suggesting that LLMs were highly capable of capturing the basic interaction structure. Minor gaps remained in correctness, particularly in message order (0.73 vs. 0.63) and notations (0.75 vs. 0.66). The results demonstrate that LLMs can closely replicate human-created Sequence diagrams better than other types.
Importantly, from the structural perspectives of UML modeling, the consistent patterns in student feedback imply that deployment diagrams are interpreted as architectural manifestations of the class structure. This relationship is pedagogically relevant and statistically supported, emphasizing that effective UML modeling requires coherence between the internal structure of a system, class diagram, and its physical realization, the deployment diagram. Furthermore, from the behavioral perspectives of UML modeling, these findings indicate that learners inherently recognize the functional linkage between use case scenarios and their realization in sequence diagrams, as it concretizes the temporal interactions and message flows required to fulfill the abstract functionalities captured in the Use Case diagram. Thus, the sequence diagrams serve as operational extensions of use case diagrams, and this relationship is both learning-centered and grounded in statistical data.
4.3. Validation of the Proposed Approach
To validate the proposed approach, we benchmark our findings against those reported in the recent study by Wang et al. [30], which involved 45 undergraduate students, in one institution, using GPT-3.5/GPT-4 to generate UML diagrams for a predefined scenario. Notably, their study limited to assess correctness. In contrast, our study aims to evaluate both completeness and correctness through a survey conducted with 121 undergraduate and graduate students, across three Universities, who had completed one or more software engineering courses. With respect to the adapted type of shots in training LLMs. The study [30] used few-shots example-based prompting (3 examples for each modeling task) for GPT-3.5/GPT-4 combined with template-based dynamic prompting for iterative refinement by students. In contrast, this study considers single zero-shot prompt that feds to GPT-4-turbo to visualize single problem domain (iCoot Car Rental System). The observed differences in correctness values stems from the variation in the number of shots for prompts and evaluation method. Comparing to the approach [30], our findings show correctness scores as (61.1% vs 64.4%) for Class diagrams, (66.2% vs 74.8%) for Sequence diagrams, and (64.2% vs 59.4%) for Use Case diagrams.
5. Discussion
This study introduces an empirical evaluation to investigate the capabilities of GPT-4-turbo in assisting UML modeling with involvement of students in the educational environment. The survey results reflect subjective student evaluations based on their prior UML modeling skills and background. The use of zero-shot prompts along within the problem domain influenced the evaluation results of UML diagrams. As both types of diagrams provided for students in the survey, students will only evaluate those diagrams without any involvement in the prompt. This approach increased cognitive load by requiring them to assess LLMs-assisted diagrams without prior examples, depending on their existing UML knowledge and skills. Such evaluation eliminates variability from iterative refinements, and also highlighted gaps in their evaluation.
The findings highlight the critical insights of current and potential drawbacks of LLMs-assisted UML modeling. The results clearly demonstrate that GPT-4-turbo exhibits superior ability to translate the textual descriptions into UML codes. Nevertheless, after converting such codes to visual models, the resulting diagrams vary in matching the completeness and correctness comparing to human-created UML diagrams. This referring to differences in diagram type and the complexity of system requirements. For example, Class and Use Case diagrams show less similarity to human-created ones because they require deeper domain logic modeling, as well as they involve complex relationships as (inheritance, aggregation, composition, and multiplicities) in Class diagram, and (includes and extends relationships) in Use Case diagram. Consequently, LLMs struggle with such precise relationships, leading to miss capturing that or even provide incorrect representation. In contrast, Deployment and Sequence diagrams show stronger alignment since such diagrams focus more on flow based structure, and they show linear interactions among objects as in Sequence diagram, or mapping between software artifacts and hardware nodes as in Deployment diagram. Quantitatively, such gaps were validated through statistical differences in completeness and correctness scores of LLMs-assisted and human-created diagrams, as proved by both paired t-test and Wilcoxon signed-rank test. The significant findings carry notable academic and practical significance in the era of software engineering. In educational contexts, LLMs can act as essential learning tool to help learners in understanding the basic UML modeling. But, it requires post-generation validation for the intended prompts. Consequently, this emphasizes the essential need of hybrid human with LLMs collaboration in educational and practical applications.
6. Conclusions
In conclusion, this study provides a comprehensive evaluation of LLMs, particularly GPT-4-turbo, in generating UML diagrams. Empirical findings, supported by participant surveys and rigorous statistical analyses, highlight the pedagogical potential of LLMs as supplementary tools in software engineering education but emphasize the need for human intervention to address such limitations. Particularly, LLM-assisted generated diagrams achieved completeness and correctness scores of 65%, 61.1% for Class diagram, 65.9%, 64.3% for Deployment diagram, 67.1%, 64.2% for Use Case diagram, and 67.7%, 66.2% for Sequence diagram. Across all explored diagram types, LLM-assisted unperformed the human-created diagrams, with statistically significant differences confirmed by paired t-tests and Wilcoxon signed-rank tests , and effect sizes > 2.0.
The most limitations were observed in Class and Use Case diagrams, reflecting challenges in modeling complex relationships and semantic structures. The proposed rule-based prompt engineering framework and evaluation elements provide a replicable methodology for further research of LLMs in software design. As future work, this study will be expanded to cover others LLM as Gemini and Copilot, and compared the output with the current outcomes. Also, we plan to extend this study by involving the software engineering professionals in industry, their feedback will be beneficial to observe the evaluation of LLM-assisted UML modeling from different perspectives. This expansion will help to bridge the gaps between the academic environment and software ithe software One important direction is to apply the same methodology on different problem domain scenarios in health, education, and commerce. Expanding Prompt optimization is another future step. Finally, as another significant future direction is to expand the proposed approach to capture another shot types rather than zero-shot and compare the current output with the upcoming results to explore how changing the type of shot in training of GPT-4- turbo might impact the completeness and correctness evaluations. Future work will address these extensions.
Funding
No funding exist for this research.
Informed Consent Statement
Informed consent was obtained from all subjects involved in the study.
Acknowledgments
We gratefully acknowledge the valuable participation of the students who contributed their time and insights to this survey. Their input was instrumental in advancing our research. We also extend our sincere appreciation to the academic staff in Saint Cloud State University, Southern Illinois University Carbondale, and University of Wisconsin-Green Bay for their support, whose collaboration and encouragement made this work possible.”
Conflicts of Interest
The authors declare no conflicts of interest.
Abbreviations
| LLMs | Large Language Models |
| UML | Unified Modeling Language |
| GPT | Generative Pre-trained Transformer |
| SDLC | Software Development Life Cycle |
| NLP | Natural Language Processing |
| CR | Completeness Ratio |
| CS | Constraint Satisfaction |
| SR | System Requirements |
| SRS | Software Requirements Specification |
Appendix A. Class Diagram
Figure A1.
Human-created Class diagram.
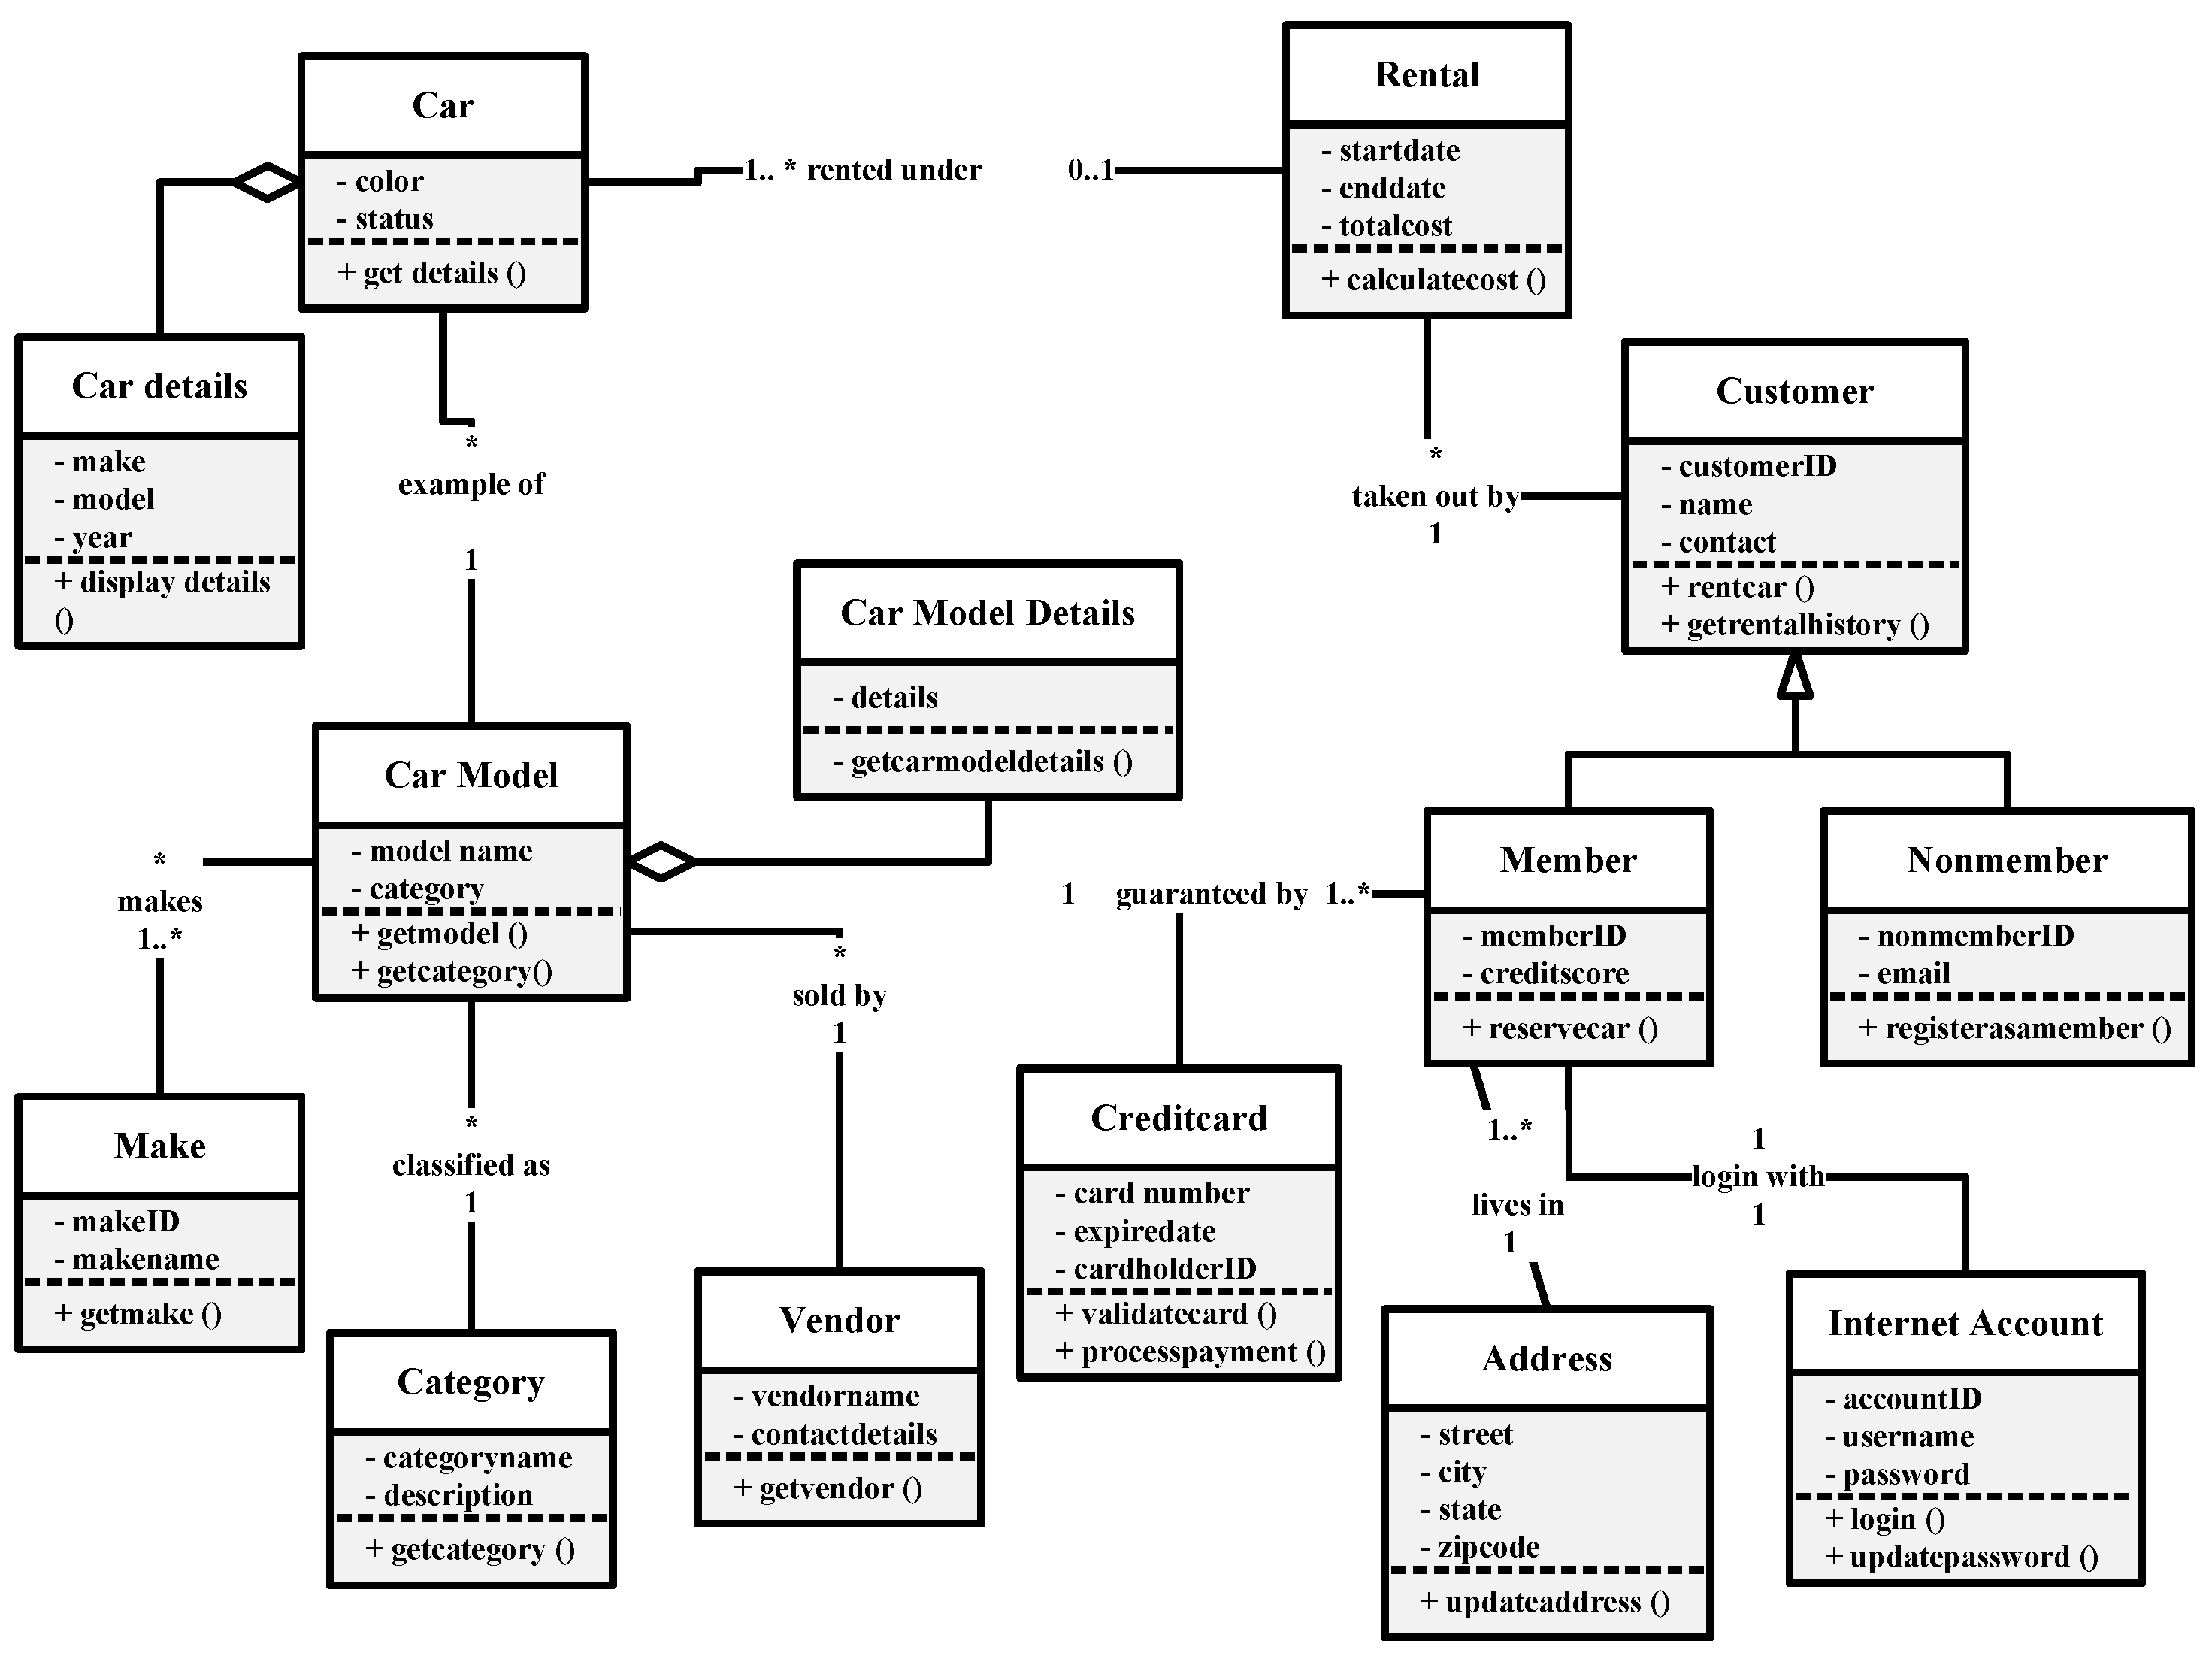
Figure A2.
LLM-assisted Class diagram.

Rule-Based Validation

Table A1.
Validation of Prompt Based on Rule-Based Framework.
| Rule Step | Applied Output |
|---|---|
| ExtractCriteria | Identified core classes: Customer, Member, NonMember, Car, CarModel, Reservation, Rental, CreditCard, Address, InternetAccount, Category, Vendor, CarModelDetails |
| MapRelationships | Defined generalization, aggregation, and associations based on domain semantics. Mapped actions like reserve/rent/cancel to operations. |
| DefineConstraints | Added multiplicities, role labels, and semantic constraints on class-to-class relationships. |
| ValidatePrompt | Satisfied completeness and correctness criteria based on coverage and UML alignment. |
To assess the effectiveness of prompt-engineered UML Class Diagrams, we applied () and () validation metrics, as described in Section 3.2. Below are the detailed evaluations for both LLM-assisted and human-created diagrams based on the iCoot car rental scenario.
LLM-Generated UML Class Diagram
- Implemented Elements: 19 out of 29
- Observed Coverage: Included major domain classes such as Customer, Member, Car, and Rental
- Missing Elements:Vendor, Category, CarModelDetails, and Make
- Satisfied Constraints: 22 out of 33
- Strengths: Correct usage of inheritance and multiplicity annotations
- Limitations: Lacked precise naming conventions, omitted some aggregations and compositions
Scores:
Human-Generated UML Class Diagram
- Implemented Elements: 24 out of 29
- Observed Coverage: Included nearly all expected elements, including Vendor, Make, CarModelDetails, and Category
- Satisfied Constraints: 27 out of 33
- Strengths: Correct use of inheritance, composition, aggregation, and multiplicity; improved naming and semantic precision
Scores:
Table A2.
Evaluation Summary: LLM vs. Human UML Class Diagrams.
| Source | Implemented Elements | CR (%) | Satisfied Constraints | CS (%) |
|---|---|---|---|---|
| LLM-Generated | 19 / 29 | 65.52% | 22 / 33 | 66.67% |
| Human-Generated | 24 / 29 | 82.76% | 27 / 33 | 81.82% |
The figures in Table A2 reveal a comparable performance difference between human-generated and LLM-generated UML class diagrams on both completeness and correctness metrics.
The LLM-generated diagram achieved a completeness score of 65.52%, indicating that it contained approximately two-thirds of the domain-sound elements defined in the prompt. While it successfully modeled central concepts such as Customer, Member, Rental, and Car, it left out important supporting entities such as Vendor, Make, CarModelDetails, and Category. These omissions significantly affect the semantic coverage of the generated diagram, constraining its capability to represent the true business domain of the iCoot car rental system.
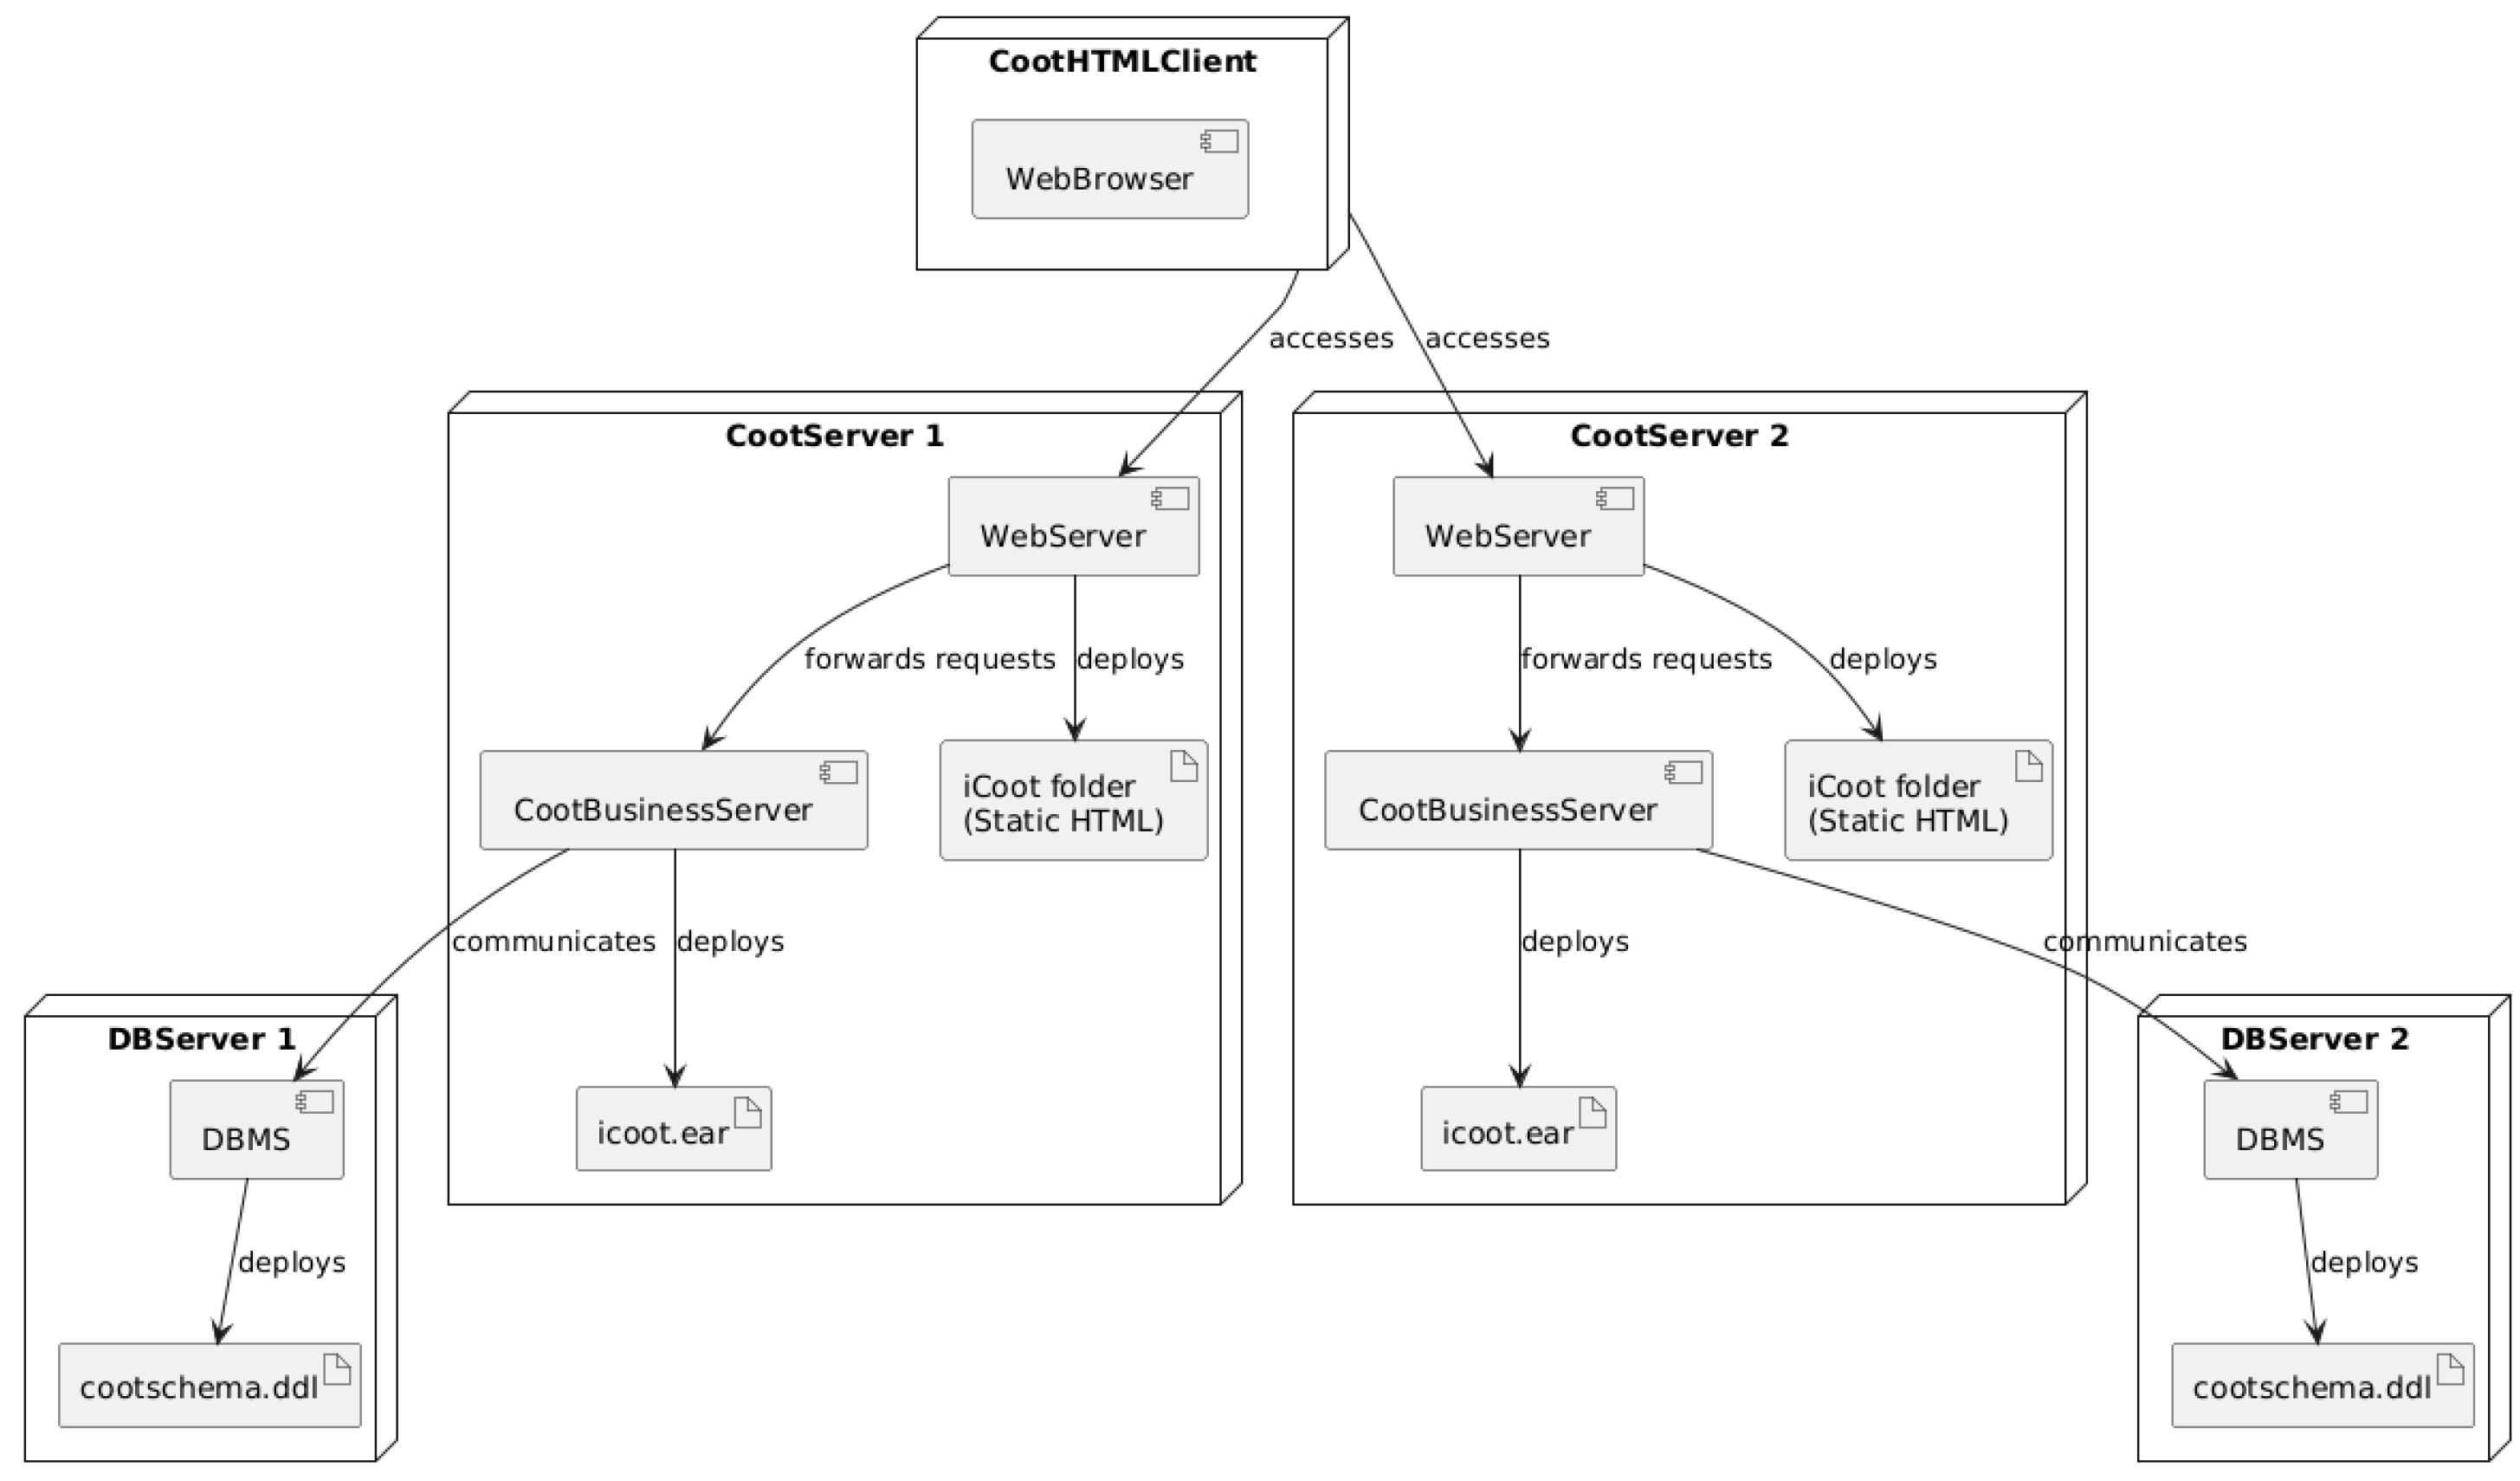
Appendix B. Deployment Diagram
Figure A3.
Human-created Deployment diagram.
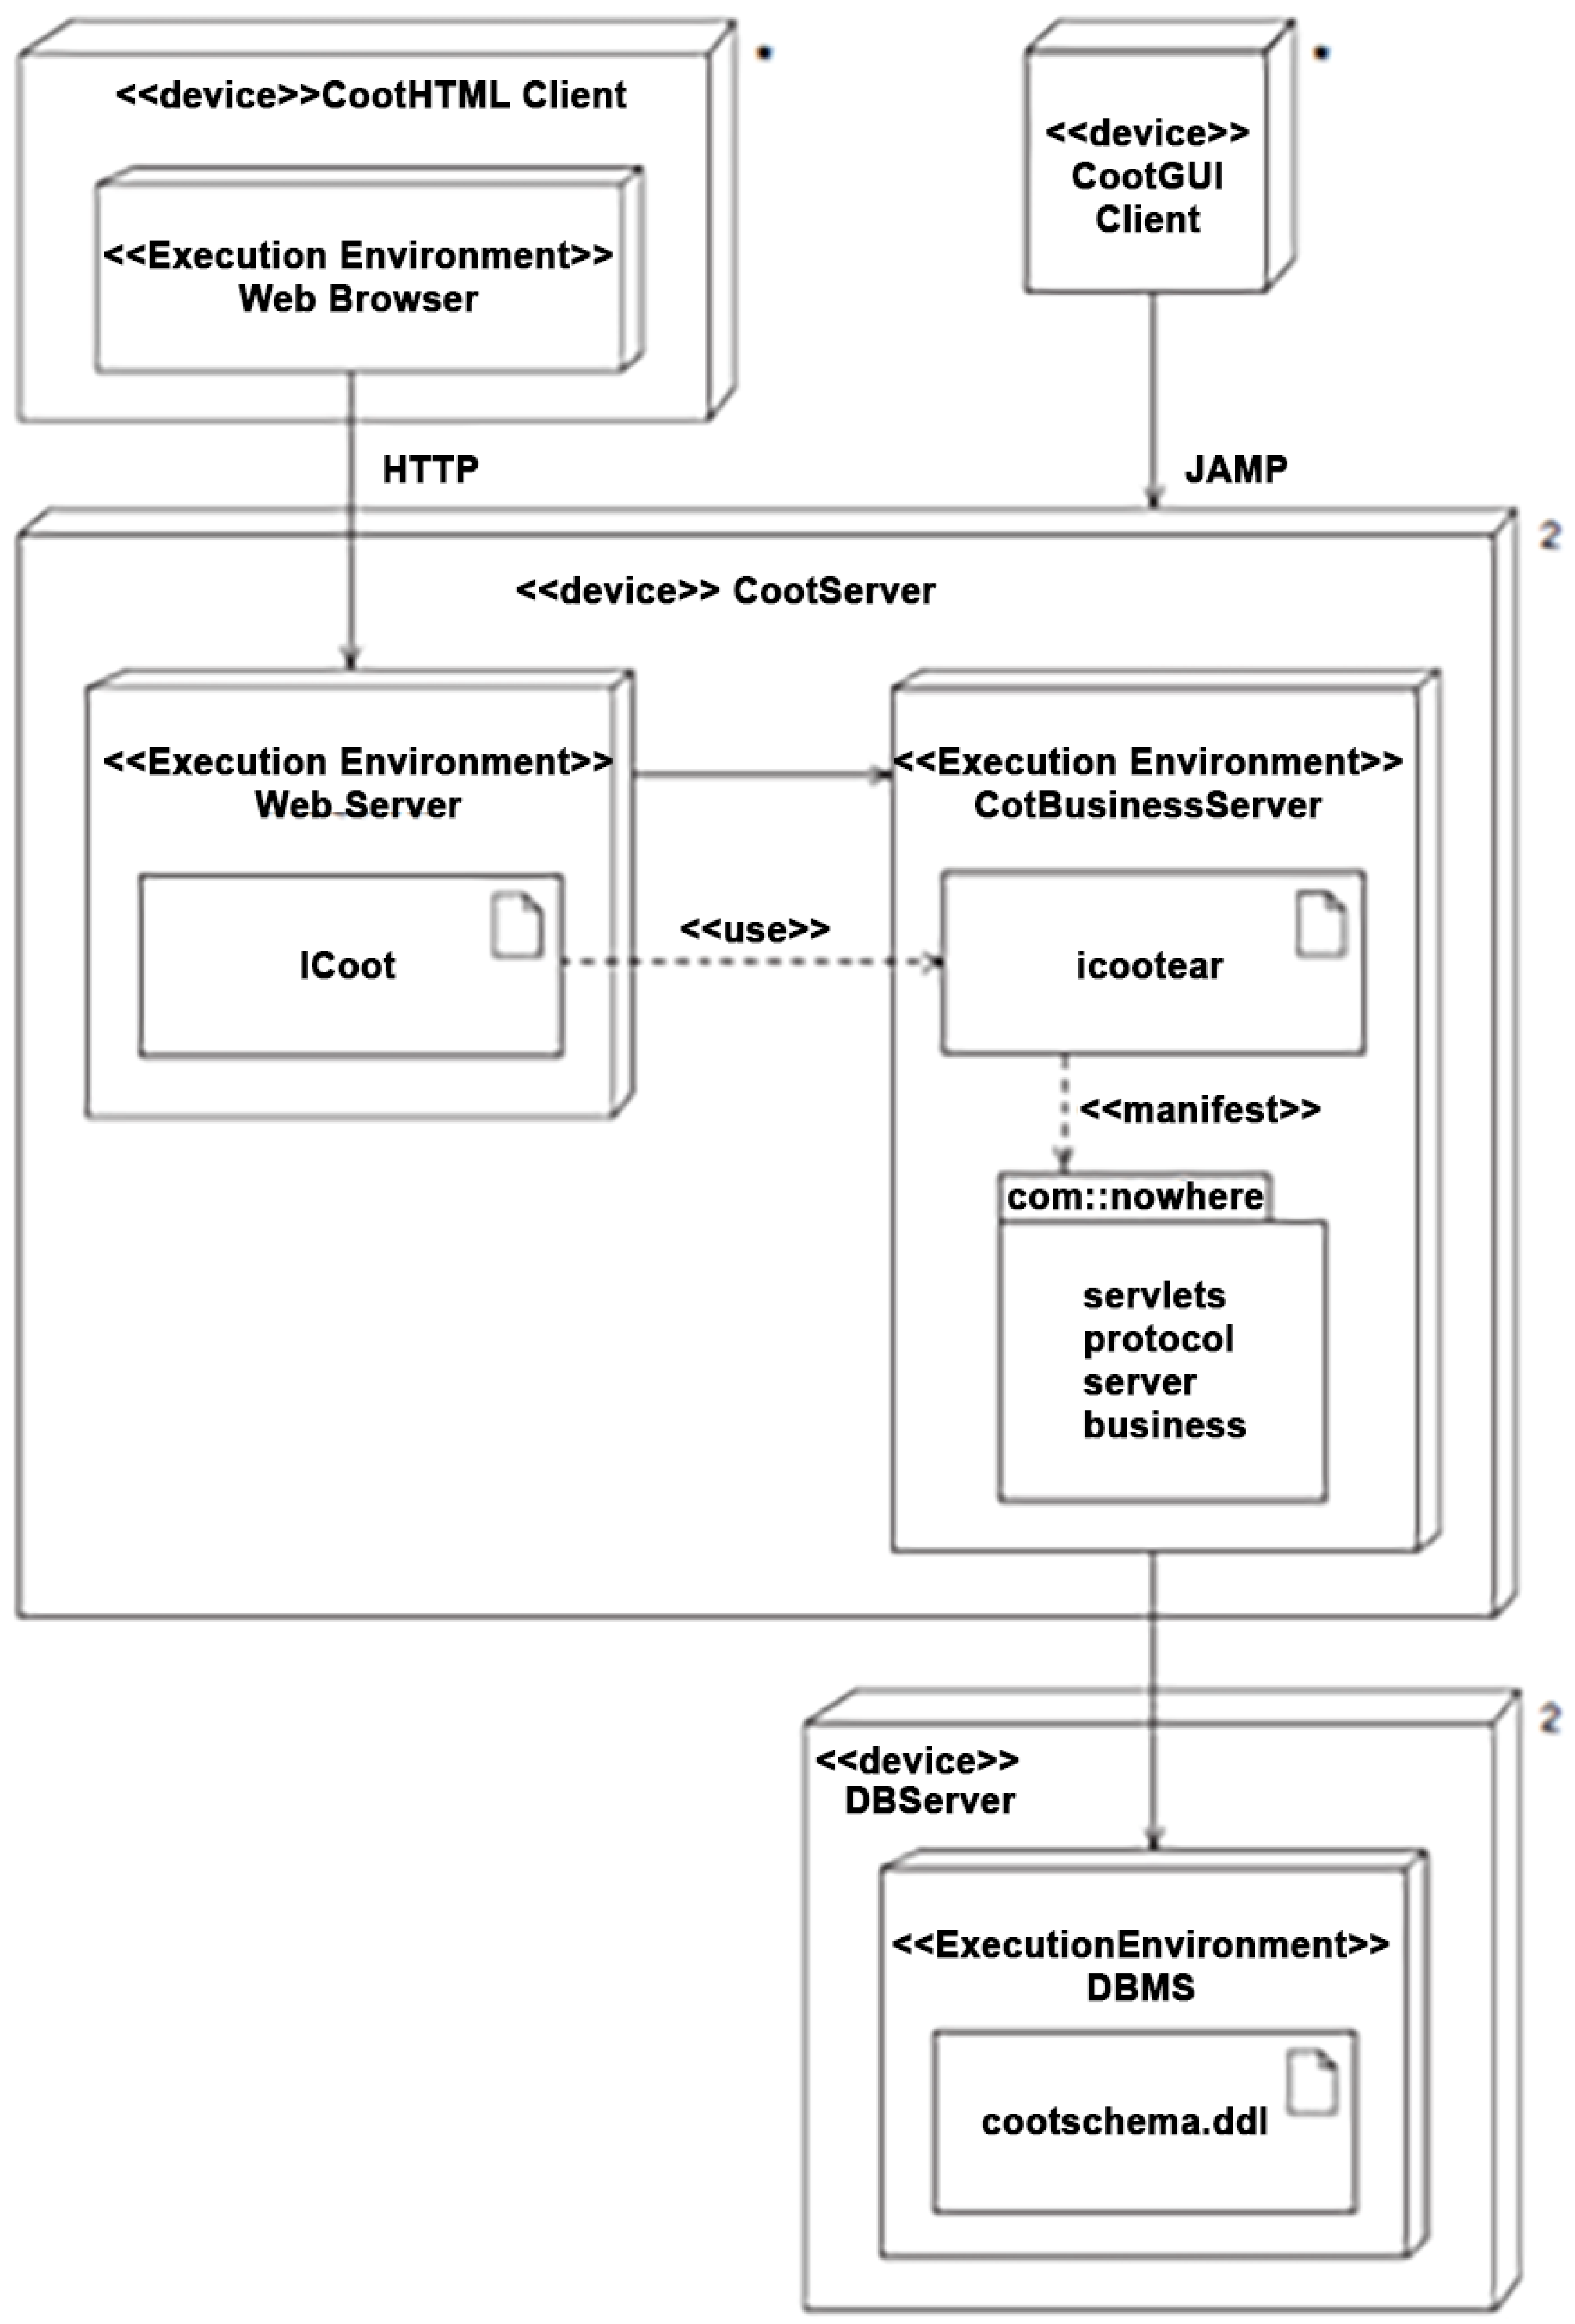
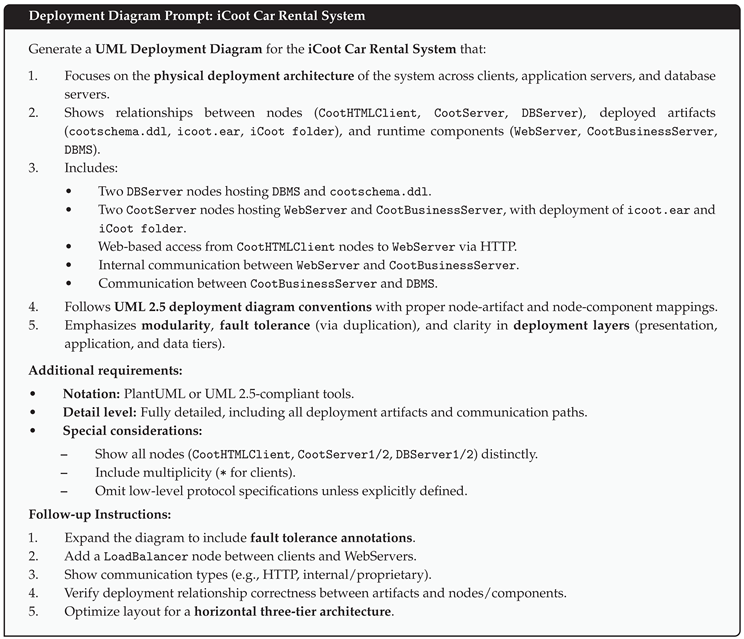
Figure A4.
LLM-assisted Deployment diagram.
Rule-Based Validation
Table A3.
Validation of Deployment Diagrams Based on Rule-Based Framework.
| Rule Step | Applied Output |
|---|---|
| ExtractComponents | Identified nodes and environments: CootHTMLClient, CootServer, DBServer, with execution environments like WebServer, CootBusinessServer, and DBMS. |
| MapRelationships | Mapped inter-node communication (e.g., HTTP, internal links), deployment of artifacts (e.g., icoot.ear, cootschema.ddl), and WebServer → BusinessServer interactions. |
| DefineConstraints | Included deployment semantics, replicated nodes for reliability, layered structure (client → app → data), and use of artifacts per UML standard. |
| ValidatePrompt | Compared against UML 2.5 structure; evaluated for completeness (elements, relationships) and correctness (notation, stereotypes). |
To assess the effectiveness of both human and LLM-assisted UML Deployment Diagrams, we applied the validation metrics of Completeness Rate (CR) and Correctness Score (CS). Below are the detailed results based on the iCoot deployment architecture.
LLM-Generated UML Deployment Diagram
- Implemented Elements: 18 out of 18
- Observed Coverage: All major nodes, execution environments, and artifacts included
- Missing Constraints: Lacked full UML stereotypes (e.g., <<device>>, <<execution environment>>), no <<manifest>> usage
- Satisfied Constraints: 21 out of 26
- Strengths: Clear three-tier layout, full redundancy modeling, artifact deployment clarity
- Limitations: Missing UML annotations (e.g., stereotypes), minor layout inconsistency
Scores:
Human-Generated UML Deployment Diagram
- Implemented Elements: 14 out of 18
- Observed Coverage: Core layers present, but no node redundancy, partial client-side representation
- Satisfied Constraints: 24 out of 26
- Strengths: Accurate UML stereotypes, manifest usage, well-formed internal structure
- Limitations: Missing replicated nodes (no DBServer2 or CootServer2), lacks scalability representation
Scores:
Table A4.
Evaluation Summary: LLM vs. Human UML Deployment Diagrams.
| Source | Implemented Elements | CR (%) | Satisfied Constraints | CS (%) |
|---|---|---|---|---|
| LLM-Generated | 18 / 18 | 100.00% | 21 / 26 | 80.77% |
| Human-Generated | 14 / 18 | 77.78% | 24 / 26 | 92.31% |
The results in Table A4 reveal a complementary contrast between the LLM and human outputs. The LLM-generated diagram achieved perfect completeness by including all deployment artifacts, replicated servers, and client tiers. However, it fell short in formal UML syntax, missing critical stereotypes and semantic decorators. Its correctness score reflects these syntactic gaps.
In contrast, the human-generated diagram attained a very high correctness score, emphasizing adherence to UML 2.5 specification with appropriate stereotypes, manifest blocks, and well-structured component packaging. However, the absence of redundancy nodes like CootServer2 and DBServer2 penalized its completeness score.
These findings illustrate that while LLMs excel in structural breadth and layout generation, human modelers outperform in semantic precision and notational discipline. A combined workflow using LLM-generated scaffolding followed by human UML review may yield the best modeling outcomes.
Appendix C. Use Case Diagram
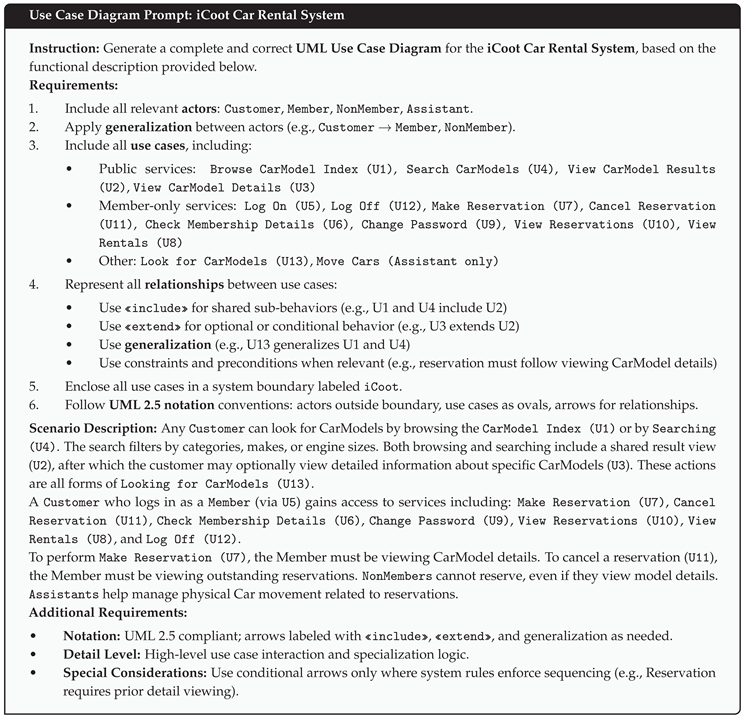
Figure A5.
Human-created Use Case diagram.
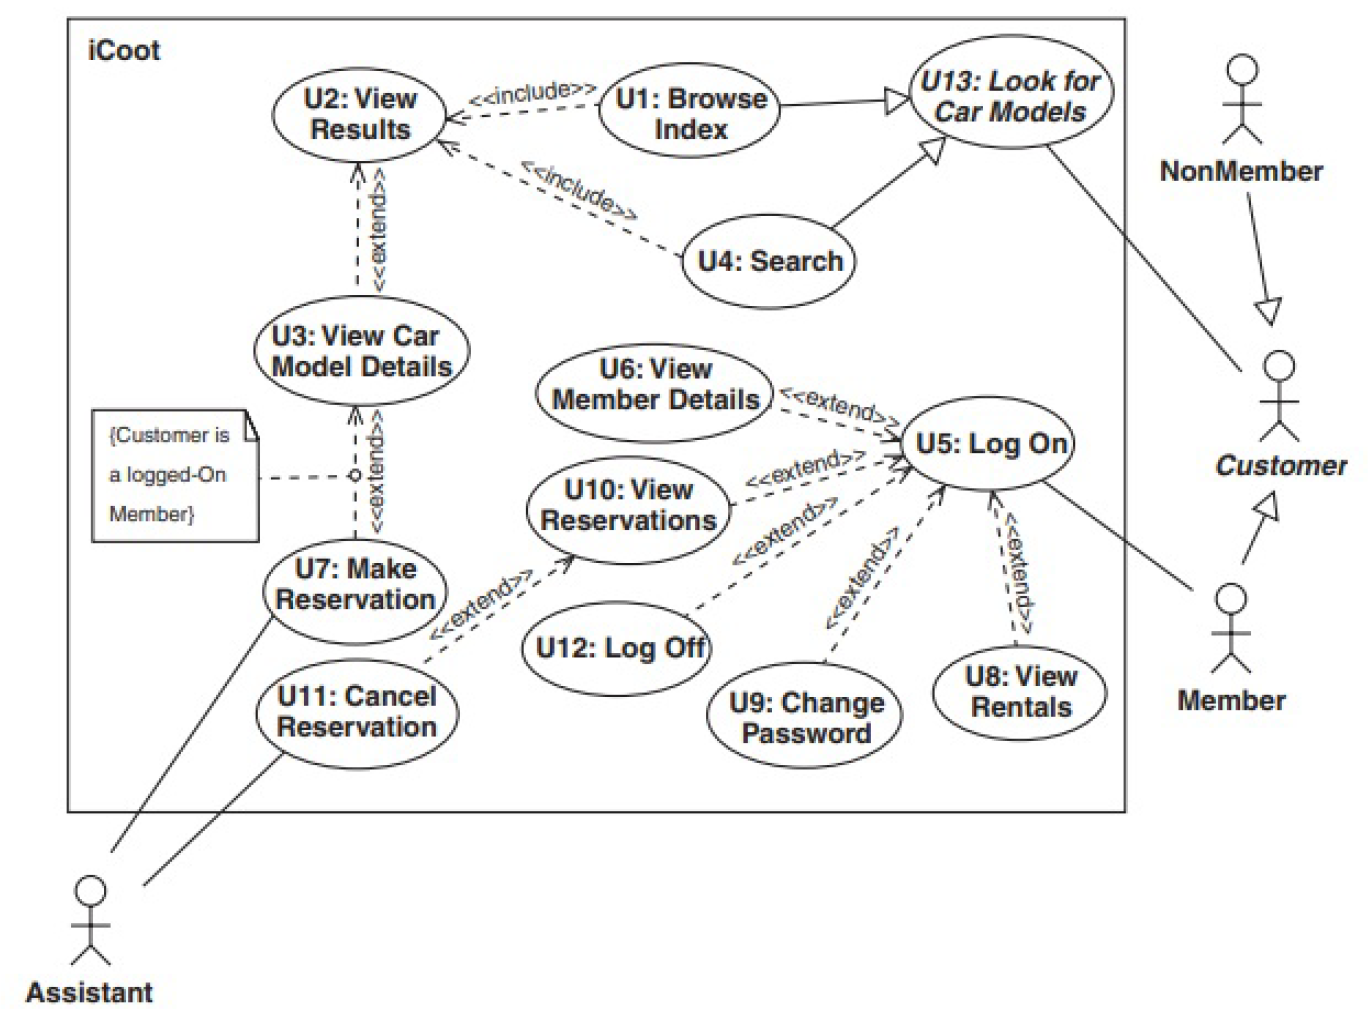
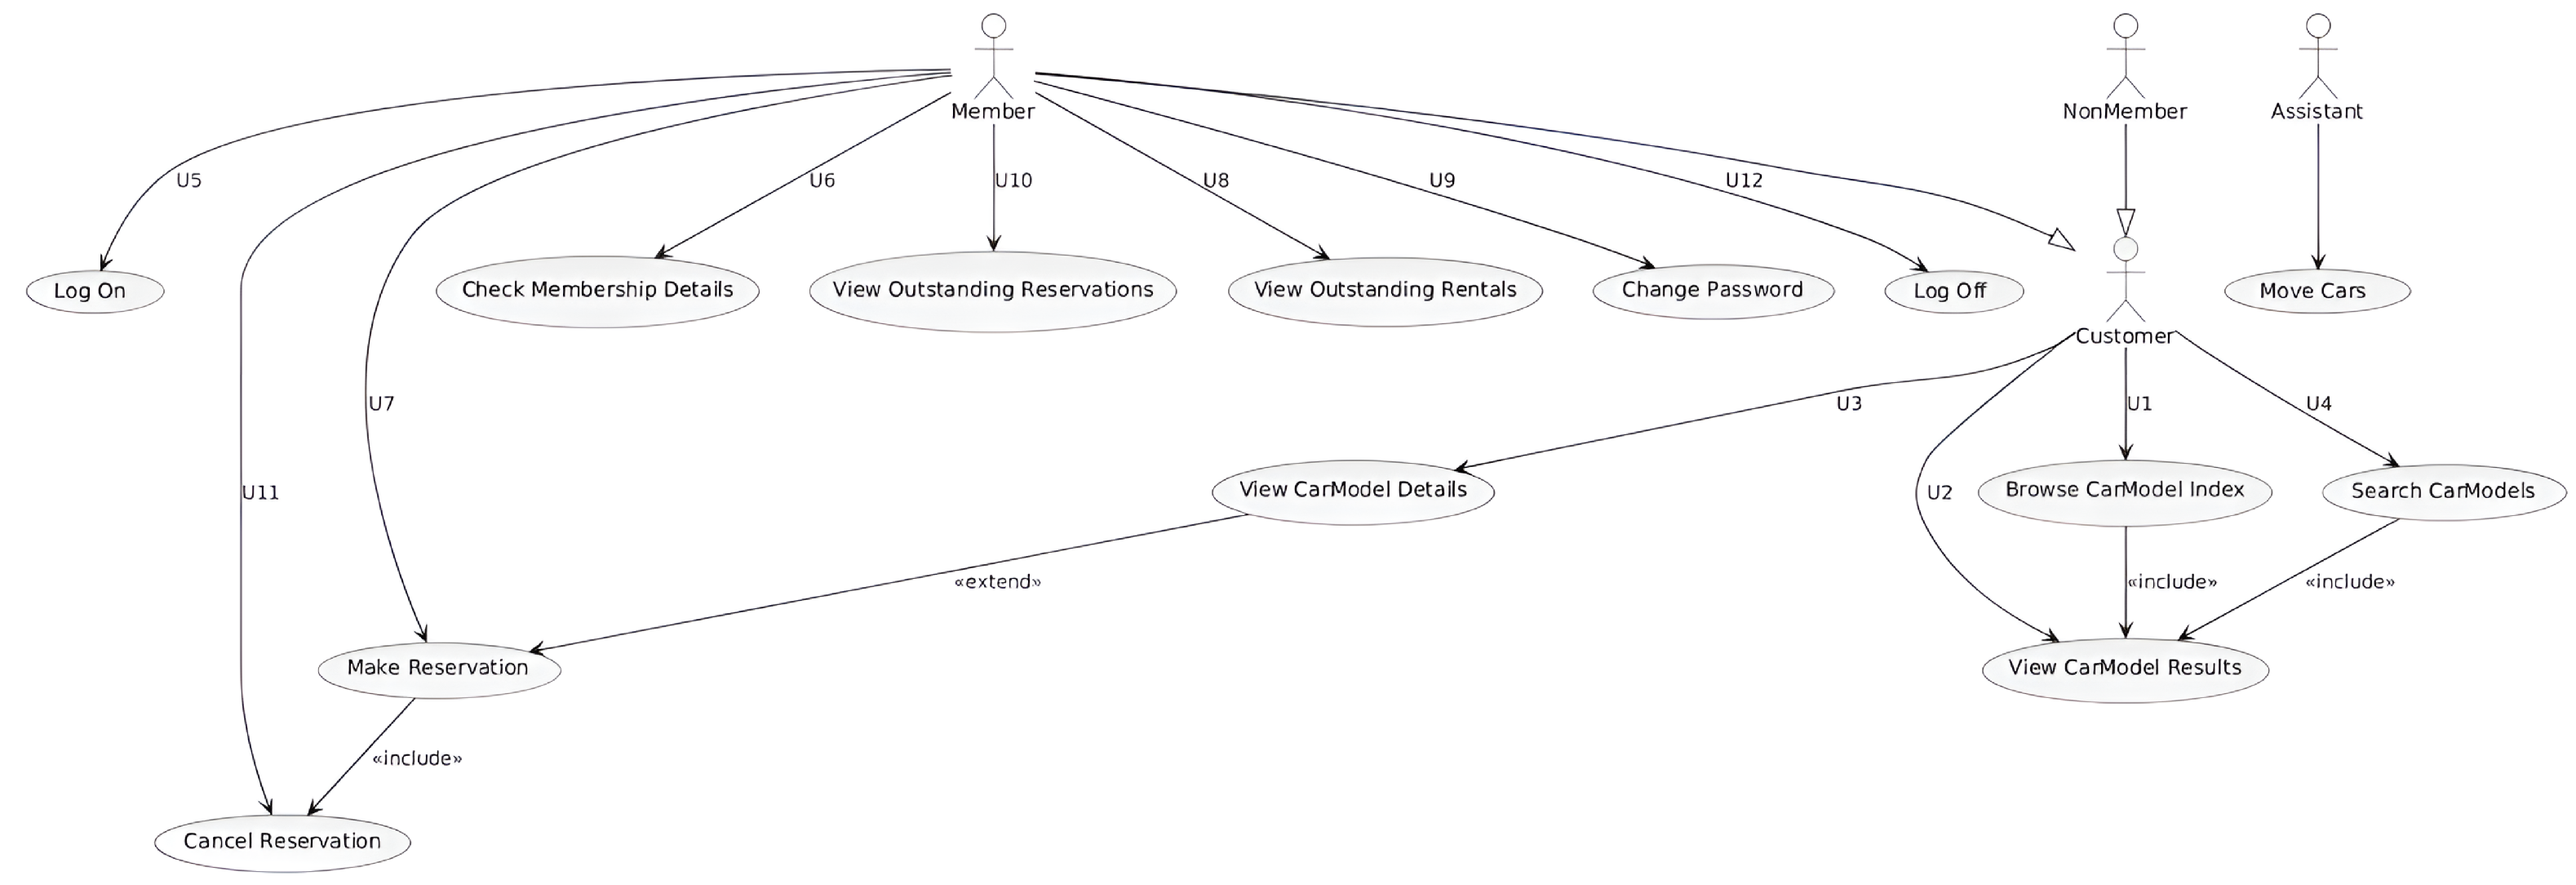
Figure A6.
LLM-assisted Use Case diagram.
Rule-Based Validation
Table A5.
Validation of Use Case Diagrams Based on Rule-Based Framework.
| Rule Step | Applied Output |
|---|---|
| ExtractComponents | Identified actors: Customer, Member, NonMember, Assistant. Identified use cases: Log On, Make Reservation, Cancel Reservation, Browse, Search, View Results, View CarModel Details, etc. |
| MapRelationships | Modeled associations between actors and use cases. Applied generalization between Customer, Member, and NonMember. Defined includes (<<include>>) and extends (<<extend>>) relationships. |
| DefineConstraints | Applied system boundary, actor-use case mapping constraints, logical grouping, and interaction coverage per domain. Checked for overlapping actor responsibilities and goal-oriented behavior. |
| ValidatePrompt | Evaluated based on UML completeness (actors, use cases, relationships) and syntactic correctness (notation, use of stereotypes, boundary box). |
LLM-Generated UML Use Case Diagram
- Implemented Elements: 16 out of 18
- Observed Coverage: Covered all key actors and most use cases
- Missing Elements: Omitted abstraction of “Look for Car Models” (U13); fewer <<extend>> relations used
- Satisfied Constraints: 22 out of 28
- Strengths: Accurate actor generalization, proper naming, and most core use cases shown
- Limitations: Lacked a system boundary, missed include/extend richness, and scenario abstraction
Scores:
Human-Generated UML Use Case Diagram
- Implemented Elements: 18 out of 18
- Observed Coverage: All actors, use cases, and abstract/generalized goals (e.g., U13: Look for Car Models)
- Satisfied Constraints: 26 out of 28
- Strengths: Rich use of <<include>> and <<extend>>, clear boundary, correct generalization, scenario modularity
- Limitations: Minor clutter in layout (non-impacting correctness)
Scores:
Table A6.
Evaluation Summary: LLM vs. Human UML Use Case Diagrams.
| Source | Implemented Elements | CR (%) | Satisfied Constraints | CS (%) |
|---|---|---|---|---|
| LLM-Generated | 16 / 18 | 88.89% | 22 / 28 | 78.57% |
| Human-Generated | 18 / 18 | 100.00% | 26 / 28 | 92.86% |
The results in Table A6 highlight the comparative strengths of human diagramming for scenario abstraction and modeling fluency. The LLM-generated diagram scored well on core use case and actor coverage, achieving 88.89% completeness, but lacked structural abstraction and semantic enrichment through <<extend>> relations and boundary usage.
The human diagram performed near-perfectly in completeness (100%) and scored higher in correctness (92.86%) by applying generalized actions like Look for Car Models (U13) and explicitly modeling use case reuse through <<include>> and scenario variants through <<extend>>. Its careful actor-role mapping and detailed modularity demonstrate a stronger understanding of use case semantics and system behavior modeling.
These results again suggest that while LLMs can scaffold functional diagrams reliably, human expertise currently remains superior in translating complex textual scenarios into high-fidelity UML representations.
Appendix D. Sequence Diagram
Figure A7.
Human-created Sequence diagram.
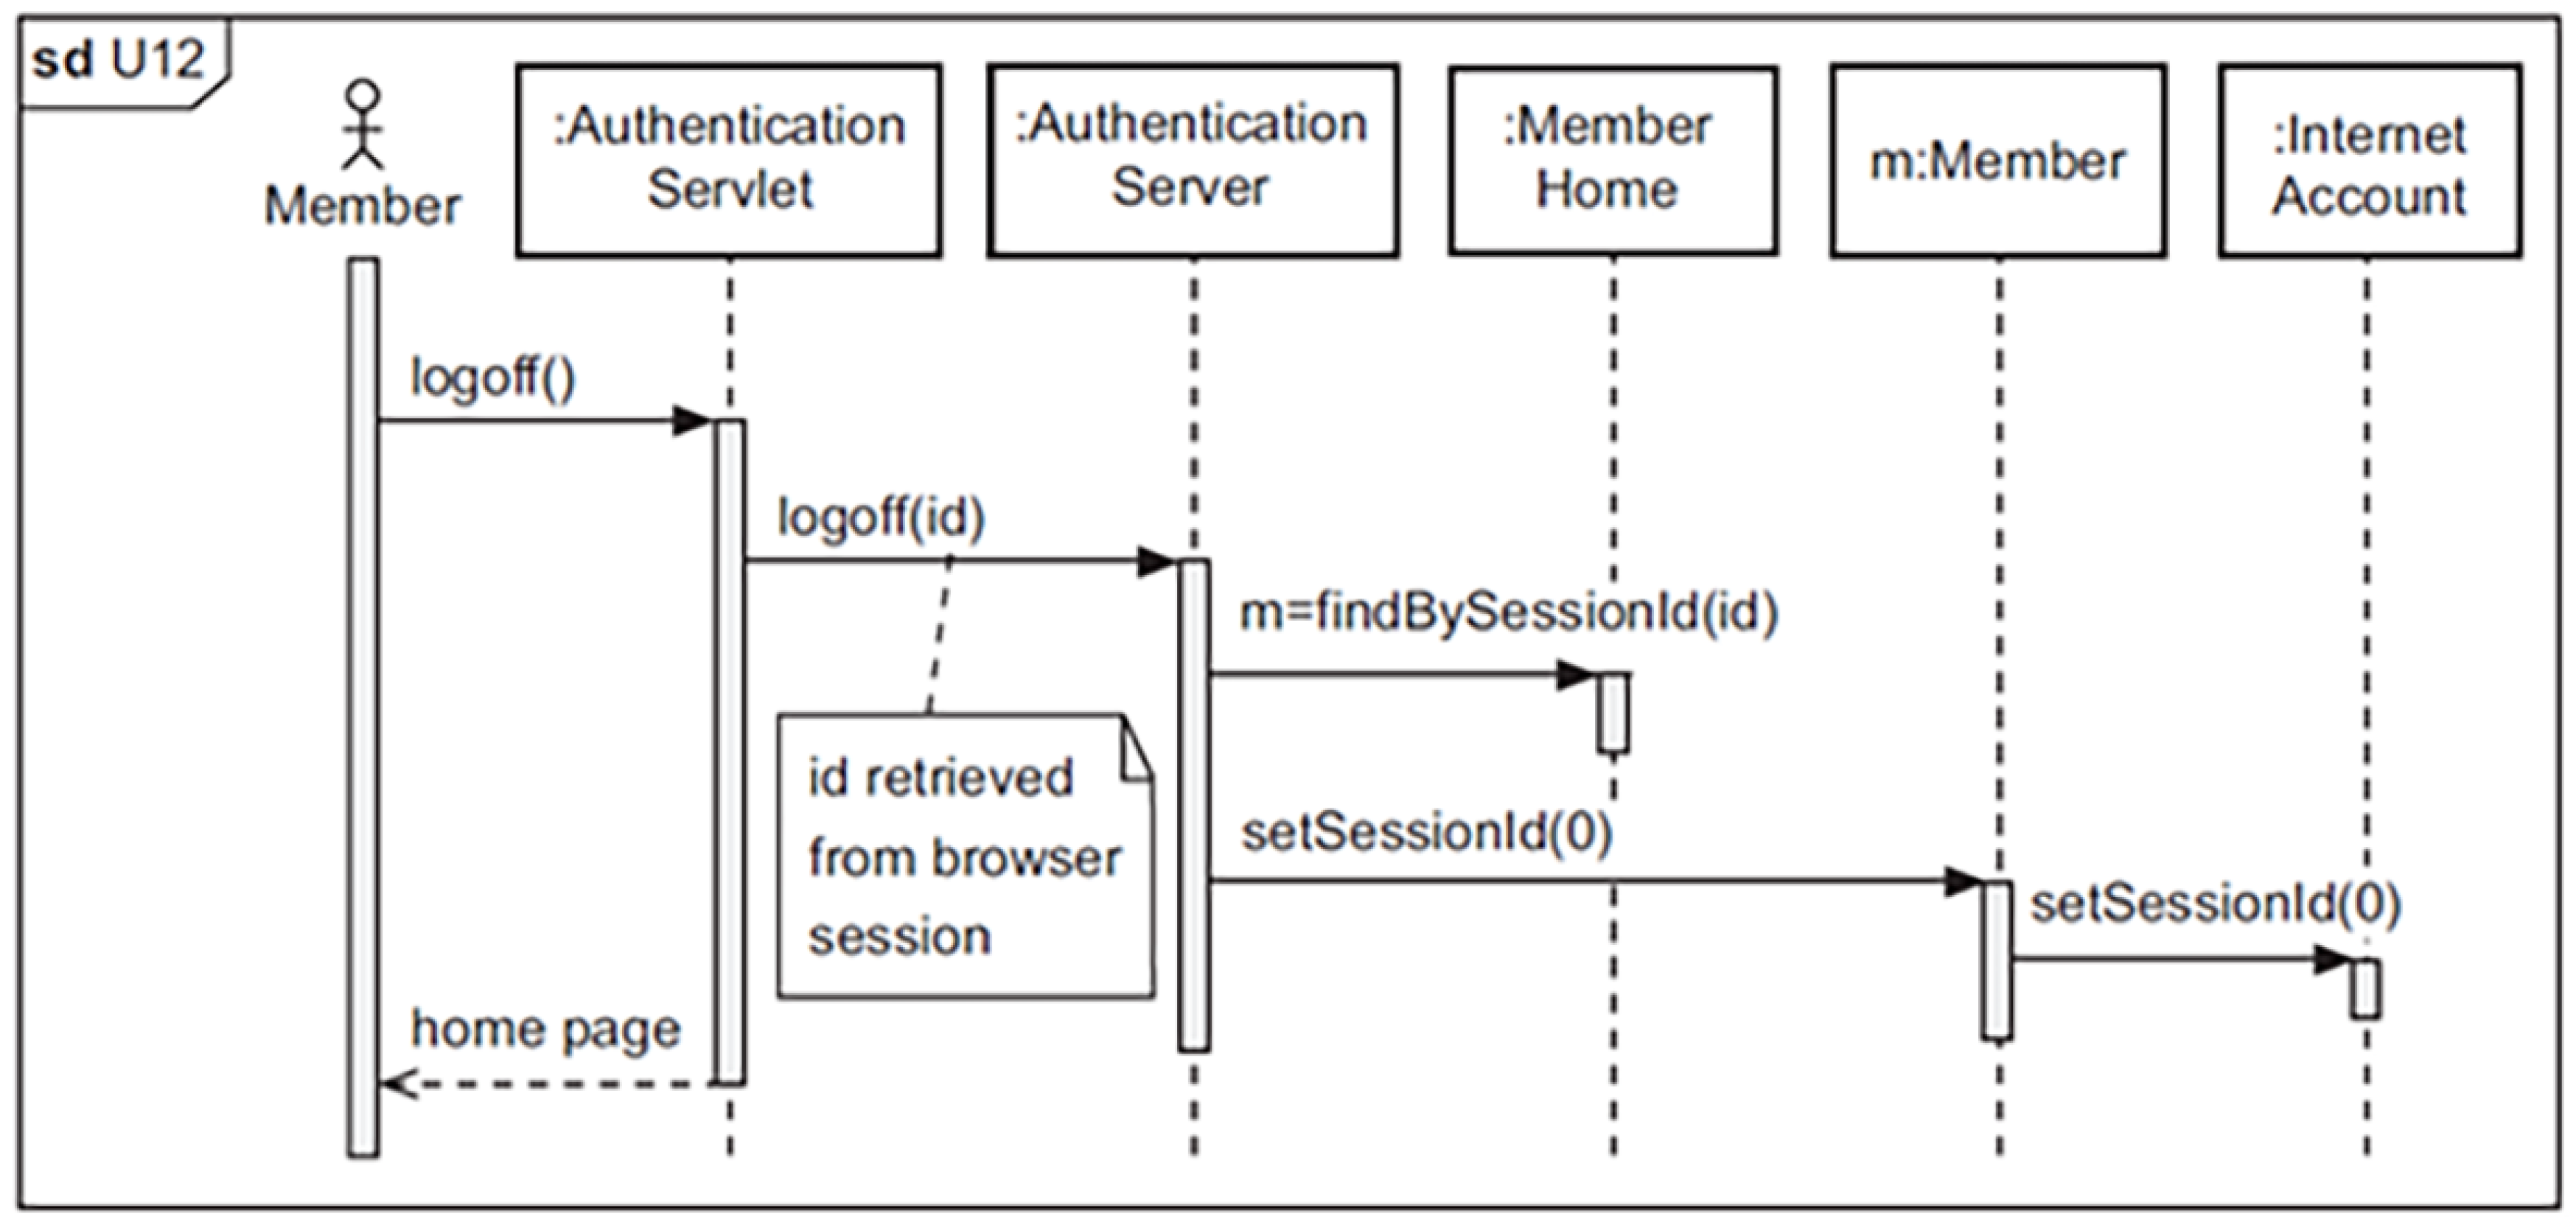
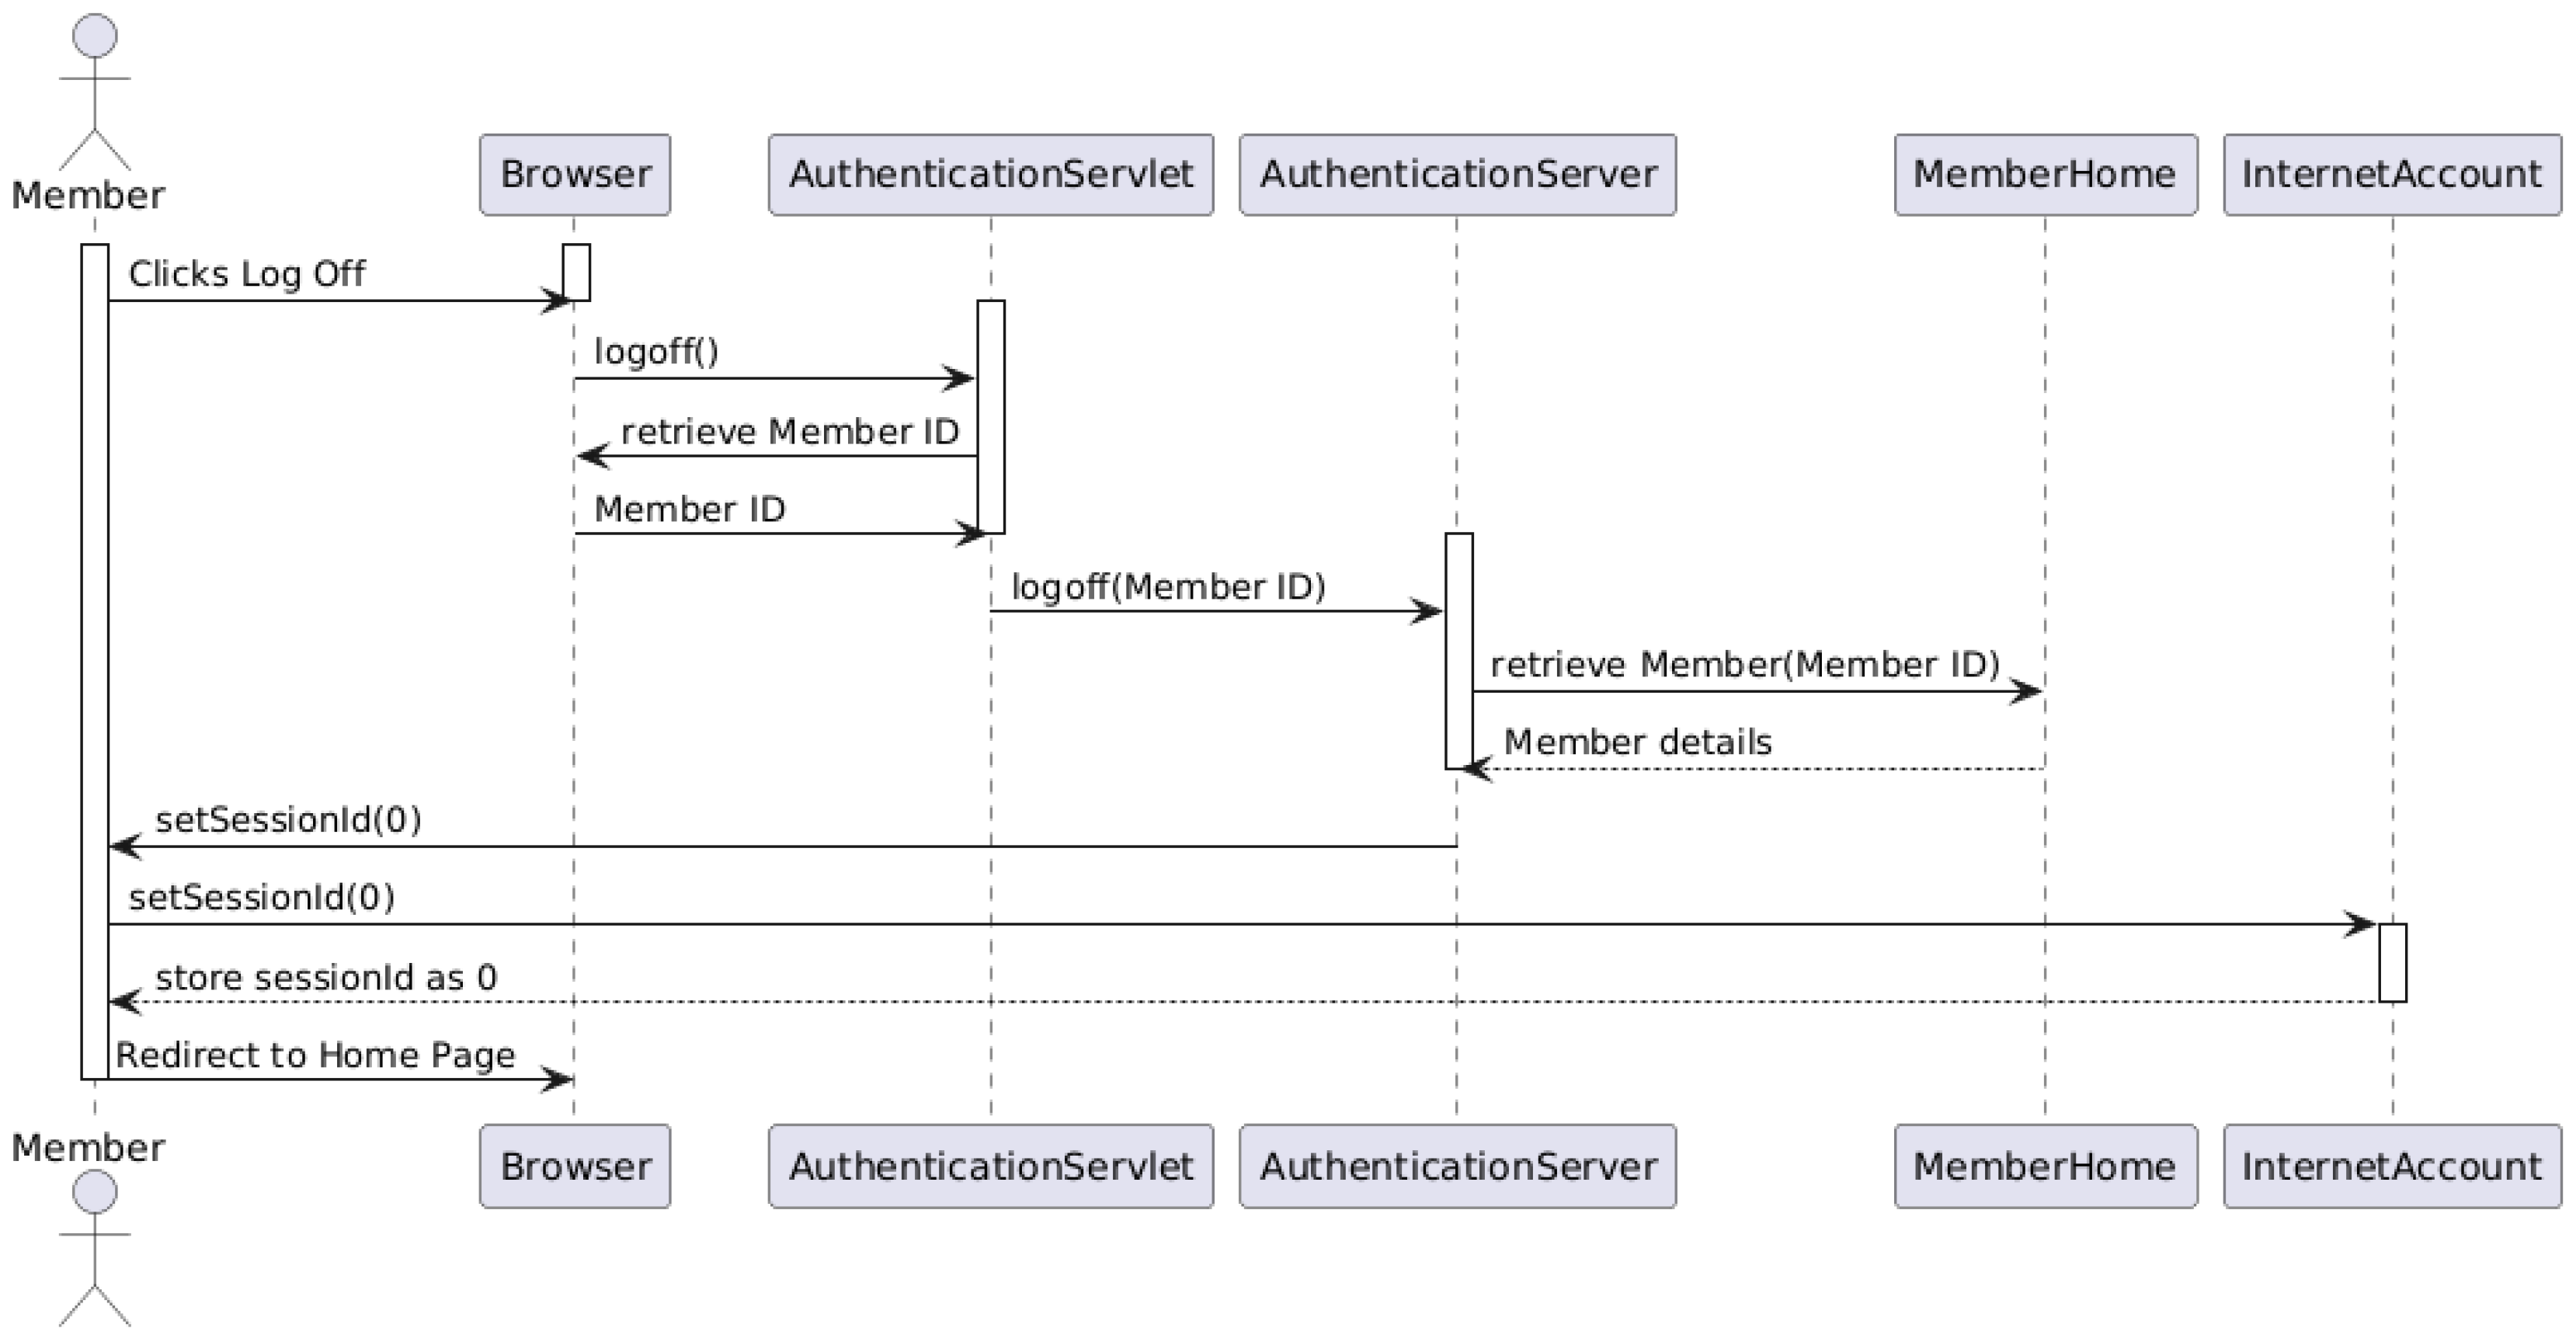
Figure A8.
LLM-assisted Sequence diagram.
Rule-Based Validation
Table A7.
Validation of Sequence Diagrams Based on Rule-Based Framework.
| Rule Step | Applied Output |
|---|---|
| ExtractComponents | Identified lifelines: Member, Browser, AuthenticationServlet, AuthenticationServer, MemberHome, InternetAccount. |
| MapRelationships | Modeled message flows such as logoff(), retrieveMember(), setSessionId(0). Captured synchronous and return messages between components. |
| DefineConstraints | Validated ordering of messages, logical grouping of synchronous vs. asynchronous calls, inclusion of return messages, and correct use of activation bars. |
| ValidatePrompt | Assessed for proper UML 2.x notation, completeness of flow, and coverage of the "logoff" use case scenario based on system description. |
LLM-Generated UML Sequence Diagram
- Implemented Elements: 12 out of 14
- Observed Coverage: Included major objects and messages for the logoff scenario
- Missing Elements: Some unclear labels (e.g., “store session as 0”), absent activation bars
- Satisfied Constraints: 19 out of 24
- Strengths: Good message ordering, full lifeline inclusion, and coverage of all involved actors
- Limitations: Mixed semantic annotations (textual labels vs. methods), lacks activation semantics, missing interaction fragment constructs
Scores:
Human-Generated UML Sequence Diagram
- Implemented Elements: 14 out of 14
- Observed Coverage: Full logoff interaction sequence modeled clearly
- Satisfied Constraints: 22 out of 24
- Strengths: Clear lifelines, activation bars, correct synchronous calls, consistent use of UML notation
- Limitations: Slight diagram compactness (layout), missing guard or alt fragments for edge cases (e.g., failed session retrieval)
Scores:
Table A8.
Evaluation Summary: LLM vs. Human UML Sequence Diagrams.
| Source | Implemented Elements | CR (%) | Satisfied Constraints | CS (%) |
|---|---|---|---|---|
| LLM-Generated | 12 / 14 | 85.71% | 19 / 24 | 79.17% |
| Human-Generated | 14 / 14 | 100.00% | 22 / 24 | 91.67% |
The results in Table A8 highlight the strengths and weaknesses of LLM-generated vs. human-generated sequence diagrams. While the LLM successfully covered the core system flow and participants for the logoff interaction, it fell short in applying proper UML activation bars and reusing clear method call syntax throughout. Human-generated diagrams scored better in correctness, particularly due to full compliance with sequence diagram semantics and consistent visual structure.
These observations suggest that LLMs are effective in approximating communication flows but still require refinement in expressing formal interaction constructs such as fragments, alt conditions, and execution focus markers. In high-assurance modeling tasks, human refinement remains essential for achieving high-fidelity UML specifications.
References
- Gao, C.; Hu, X.; Gao, S.; Xia, X.; Jin, Z. The Current Challenges of Software Engineering in the Era of Large Language Models. ACM Transactions on Software Engineering and Methodology 2024. [Google Scholar] [CrossRef]
- Liu, J.; Xia, C.S.; Wang, Y.; Zhang, L. Is your code generated by chatgpt really correct? rigorous evaluation of large language models for code generation. Advances in Neural Information Processing Systems 2023, 36, 21558–21572. [Google Scholar]
- Vaithilingam, P.; Zhang, T.; Glassman, E.L. Expectation vs. In experience: Evaluating the usability of code generation tools powered by large language models. In Proceedings of the Chi conference on human factors in computing systems extended abstracts; 2022; pp. 1–7. [Google Scholar]
- Ahmad, A.; Waseem, M.; Liang, P.; Fahmideh, M.; Aktar, M.S.; Mikkonen, T. Towards human-bot collaborative software architecting with chatgpt. In Proceedings of the Proceedings of the 27th international conference on evaluation and assessment in software engineering, 2023, pp.
- Zimmermann, D.; Koziolek, A. Automating gui-based software testing with gpt-3. In Proceedings of the 2023 IEEE International Conference on Software Testing, Verification and Validation Workshops (ICSTW). IEEE; 2023; pp. 62–65. [Google Scholar]
- Ozkaya, M.; Erata, F. A survey on the practical use of UML for different software architecture viewpoints. Information and Software Technology 2020, 121, 106275. [Google Scholar] [CrossRef]
- Raiaan, M.A.K.; Mukta, M.S.H.; Fatema, K.; Fahad, N.M.; Sakib, S.; Mim, M.M.J.; Ahmad, J.; Ali, M.E.; Azam, S. A review on large language models: Architectures, applications, taxonomies, open issues and challenges. IEEE access 2024, 12, 26839–26874. [Google Scholar] [CrossRef]
- Gamage, M.Y.L. Automated Software Architecture Diagram Generator using Natural Language Processing. A Dissertation by Mr Yasitha Lalanga Gamage Submitted in partial fulfillment of the requirements for the BSc (Hons) in Computer Science degree at the University of Westminster, UK.
- Carvalho, G.; Dihego, J.; Sampaio, A. An integrated framework for analysing, simulating and testing UML models. In Proceedings of the Brazilian Symposium on Formal Methods. Springer; 2024; pp. 86–104. [Google Scholar]
- Ambler, S.W. The elements of UML (TM) 2.0 style; Cambridge University Press, 2005.
- Chen, Z.; Wang, C.; Sun, W.; Yang, G.; Liu, X.; Zhang, J.M.; Liu, Y. Promptware Engineering: Software Engineering for LLM Prompt Development. arXiv preprint arXiv:2503.02400, arXiv:2503.02400 2025.
- Pornprasit, C.; Tantithamthavorn, C. Fine-tuning and prompt engineering for large language models-based code review automation. Information and Software Technology 2024, 175, 107523. [Google Scholar] [CrossRef]
- Liu, M.; Wang, J.; Lin, T.; Ma, Q.; Fang, Z.; Wu, Y. An empirical study of the code generation of safety-critical software using llms. Applied Sciences 2024, 14, 1046. [Google Scholar] [CrossRef]
- Boukhlif, M.; Kharmoum, N.; Hanine, M.; Kodad, M.; Lagmiri, S.N. Towards an Intelligent Test Case Generation Framework Using LLMs and Prompt Engineering. In Proceedings of the International Conference on Smart Medical, IoT & Artificial Intelligence. Springer; 2024; pp. 24–31. [Google Scholar]
- Ferrari, A.; Abualhaija, S.; Arora, C. Model Generation from Requirements with LLMs: an Exploratory Study. arXiv preprint arXiv:2404.06371, arXiv:2404.06371 2024.
- Cámara, J.; Troya, J.; Burgueño, L.; Vallecillo, A. On the assessment of generative AI in modeling tasks: an experience report with ChatGPT and UML. Software and Systems Modeling 2023, 22, 781–793. [Google Scholar] [CrossRef]
- De Vito, G.; Palomba, F.; Gravino, C.; Di Martino, S.; Ferrucci, F. Echo: An approach to enhance use case quality exploiting large language models. In Proceedings of the 2023 49th Euromicro Conference on Software Engineering and Advanced Applications (SEAA). IEEE; 2023; pp. 53–60. [Google Scholar]
- Herwanto, G.B. Automating Data Flow Diagram Generation from User Stories Using Large Language Models. In Proceedings of the 7th Workshop on Natural Language Processing for Requirements Engineering; 2024. [Google Scholar]
- Hou, X.; Zhao, Y.; Liu, Y.; Yang, Z.; Wang, K.; Li, L.; Luo, X.; Lo, D.; Grundy, J.; Wang, H. Large language models for software engineering: A systematic literature review. ACM Transactions on Software Engineering and Methodology 2024, 33, 1–79. [Google Scholar] [CrossRef]
- Hussein, D. Usability of LLMs for Assisting Software Engineering: a Literature Review 2024.
- Lorenzo, C. Integrating large language models for real-world problem modelling: A comparative study. In Proceedings of the INTED2024 Proceedings. IATED; 2024; pp. 3262–3272. [Google Scholar]
- Nifterik, S.v. Exploring the Potential of Large Language Models in Supporting Domain Model Derivation from Requirements Elicitation Conversations. Master’s thesis, 2024.
- Buchmann, R.; Eder, J.; Fill, H.G.; Frank, U.; Karagiannis, D.; Laurenzi, E.; Mylopoulos, J.; Plexousakis, D.; Santos, M.Y. Large language models: Expectations for semantics-driven systems engineering. Data & Knowledge Engineering 2024, 152, 102324. [Google Scholar]
- Hemmat, A.; Sharbaf, M.; Kolahdouz-Rahimi, S.; Lano, K.; Tehrani, S.Y. Research directions for using LLM in software requirement engineering: a systematic review. Frontiers in Computer Science 2025, 7, 1519437. [Google Scholar] [CrossRef]
- Umar, M.A. Automated Requirements Engineering Framework for Model-Driven Development. PhD thesis, King’s College London, 2024.
- Vega Carrazan, P.F. Large Language Models Capabilities for Software Requirements Automation. PhD thesis, Politecnico di Torino, 2024.
- Conrardy, A.; Capozucca, A.; Cabot, J. User Modeling in Model-Driven Engineering: A Systematic Literature Review. arXiv preprint arXiv:2412.15871, arXiv:2412.15871 2024.
- O’docherty, M. Object-oriented analysis & design; John Wiley & Sons, 2005.
- Chen, K.; Yang, Y.; Chen, B.; López, J.A.H.; Mussbacher, G.; Varró, D. Automated Domain Modeling with Large Language Models: A Comparative Study. In Proceedings of the 2023 ACM/IEEE 26th International Conference on Model Driven Engineering Languages and Systems (MODELS). IEEE; 2023; pp. 162–172. [Google Scholar]
- Wang, B.; Wang, C.; Liang, P.; Li, B.; Zeng, C. How LLMs Aid in UML Modeling: An Exploratory Study with Novice Analysts. arXiv preprint arXiv:2404.17739, arXiv:2404.17739 2024.
- Conrardy, A.; Cabot, J. From Image to UML: First Results of Image Based UML Diagram Generation Using LLMs. arXiv preprint arXiv:2404.11376, arXiv:2404.11376 2024.
| 1 | |
| 2 |
Figure 1.
The proposed methodology.
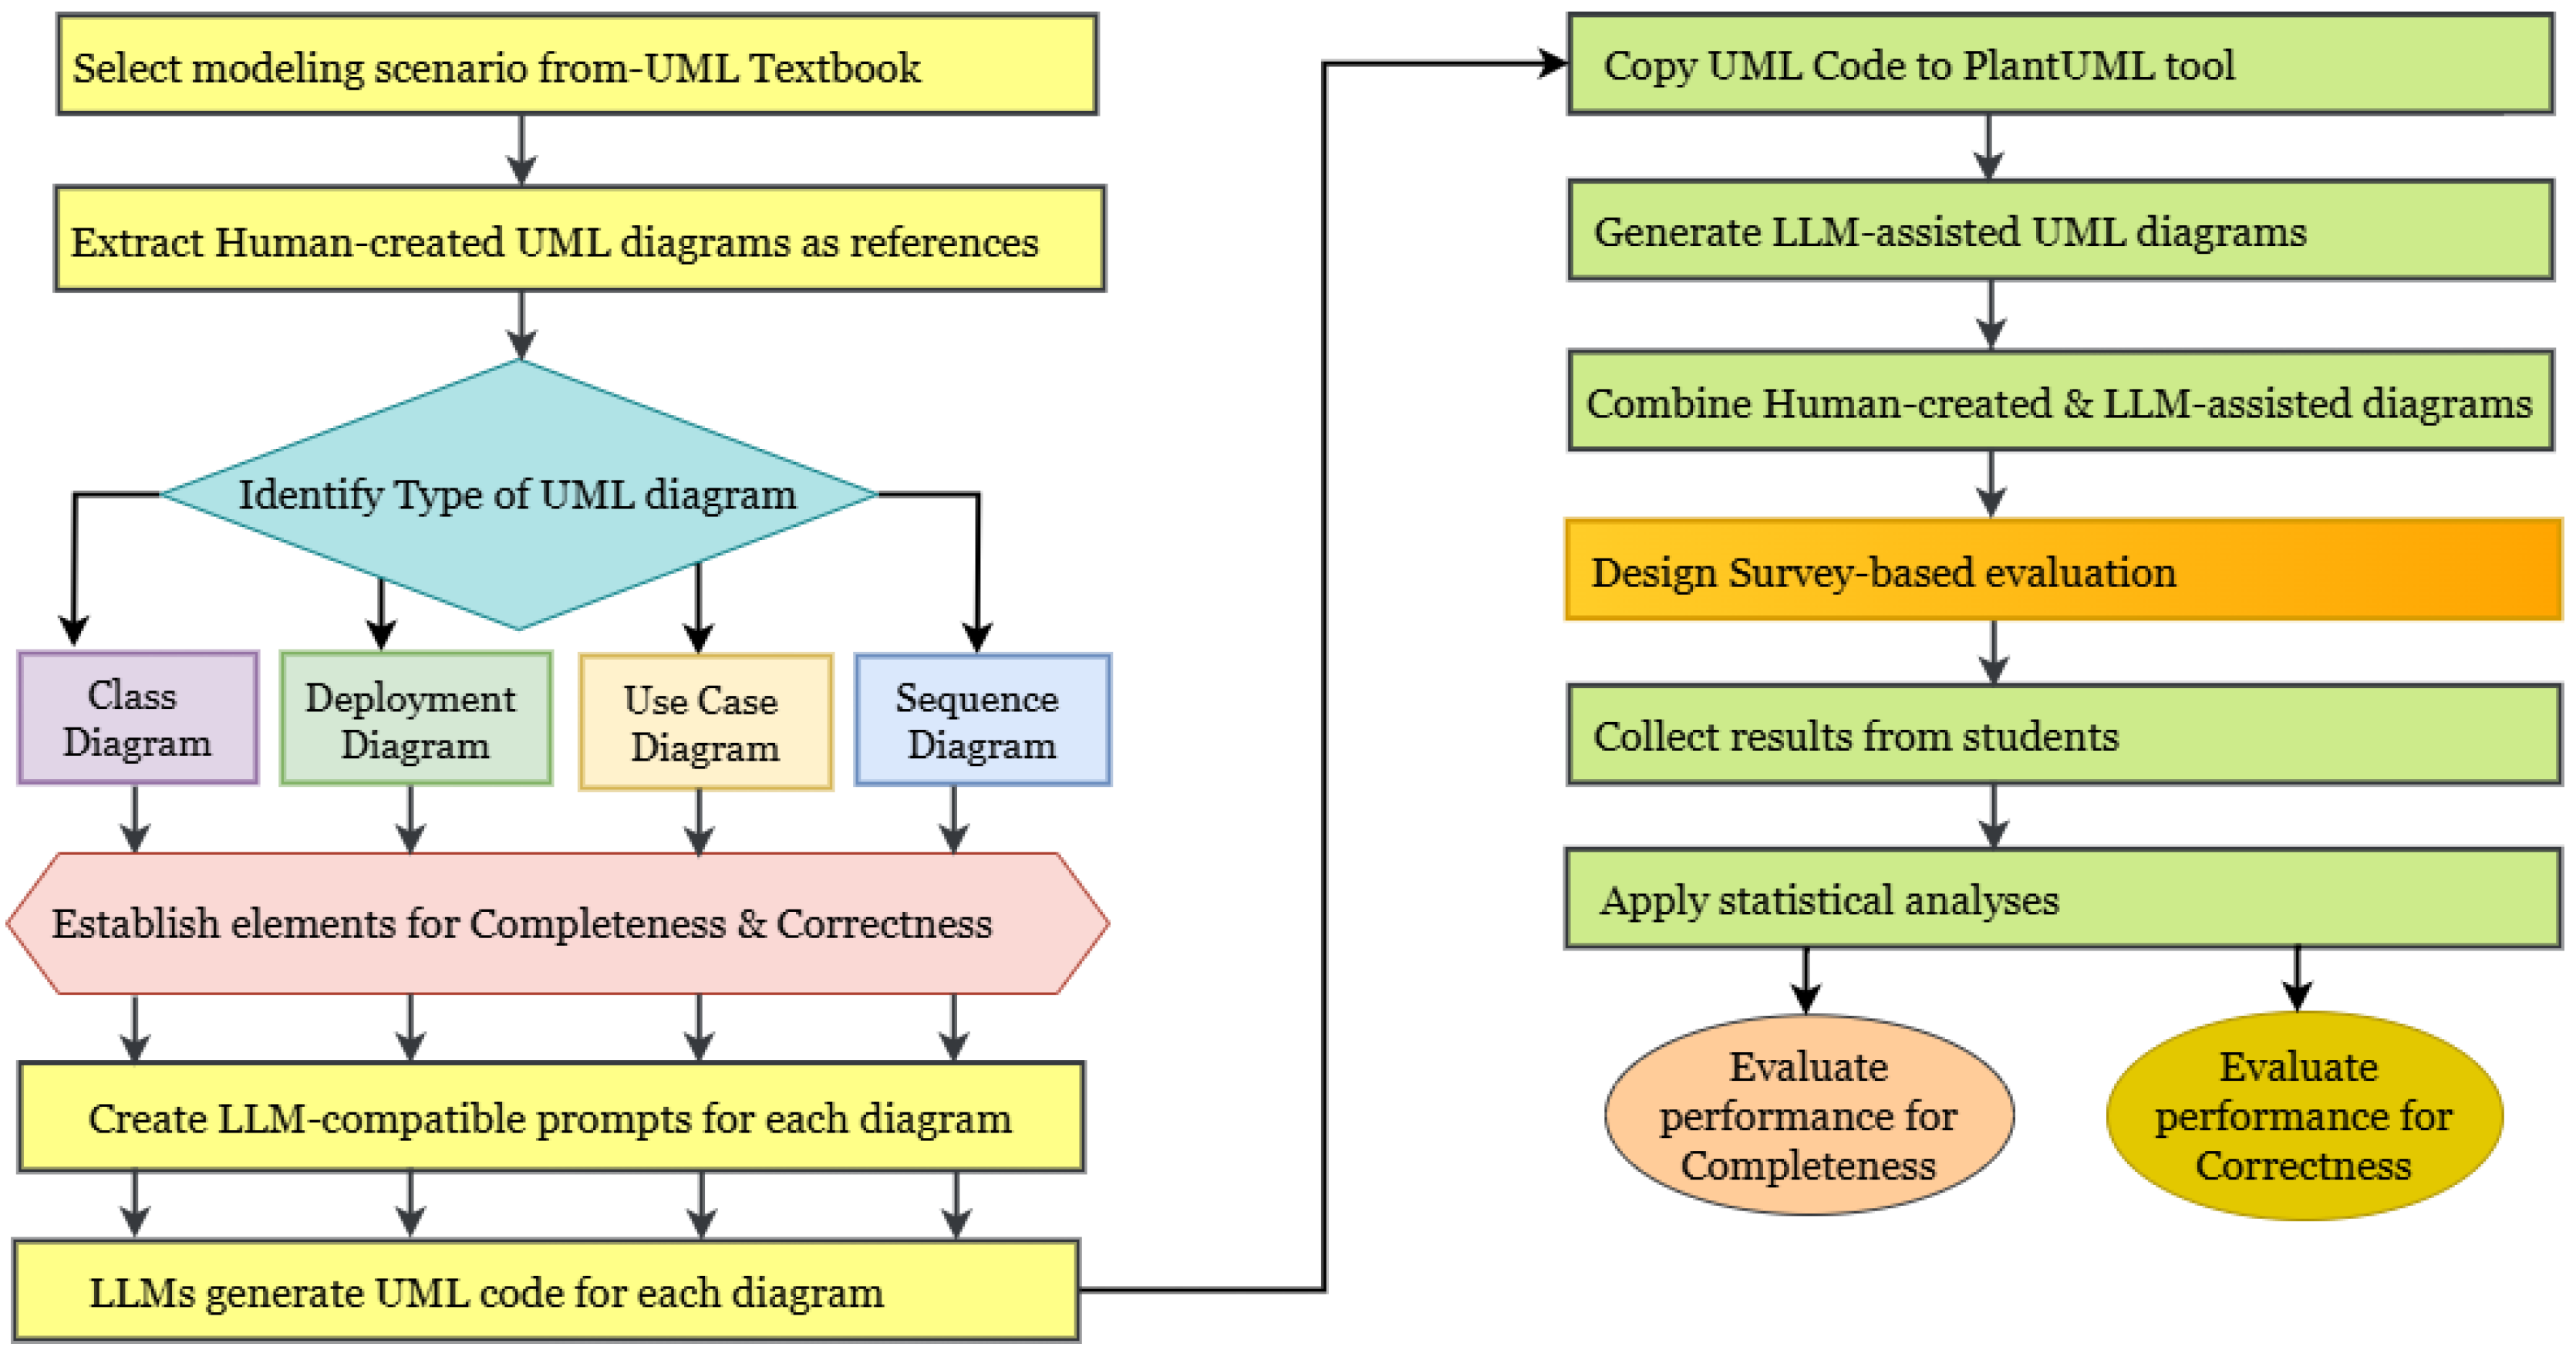
Figure 2.
Number of participating students across universities.
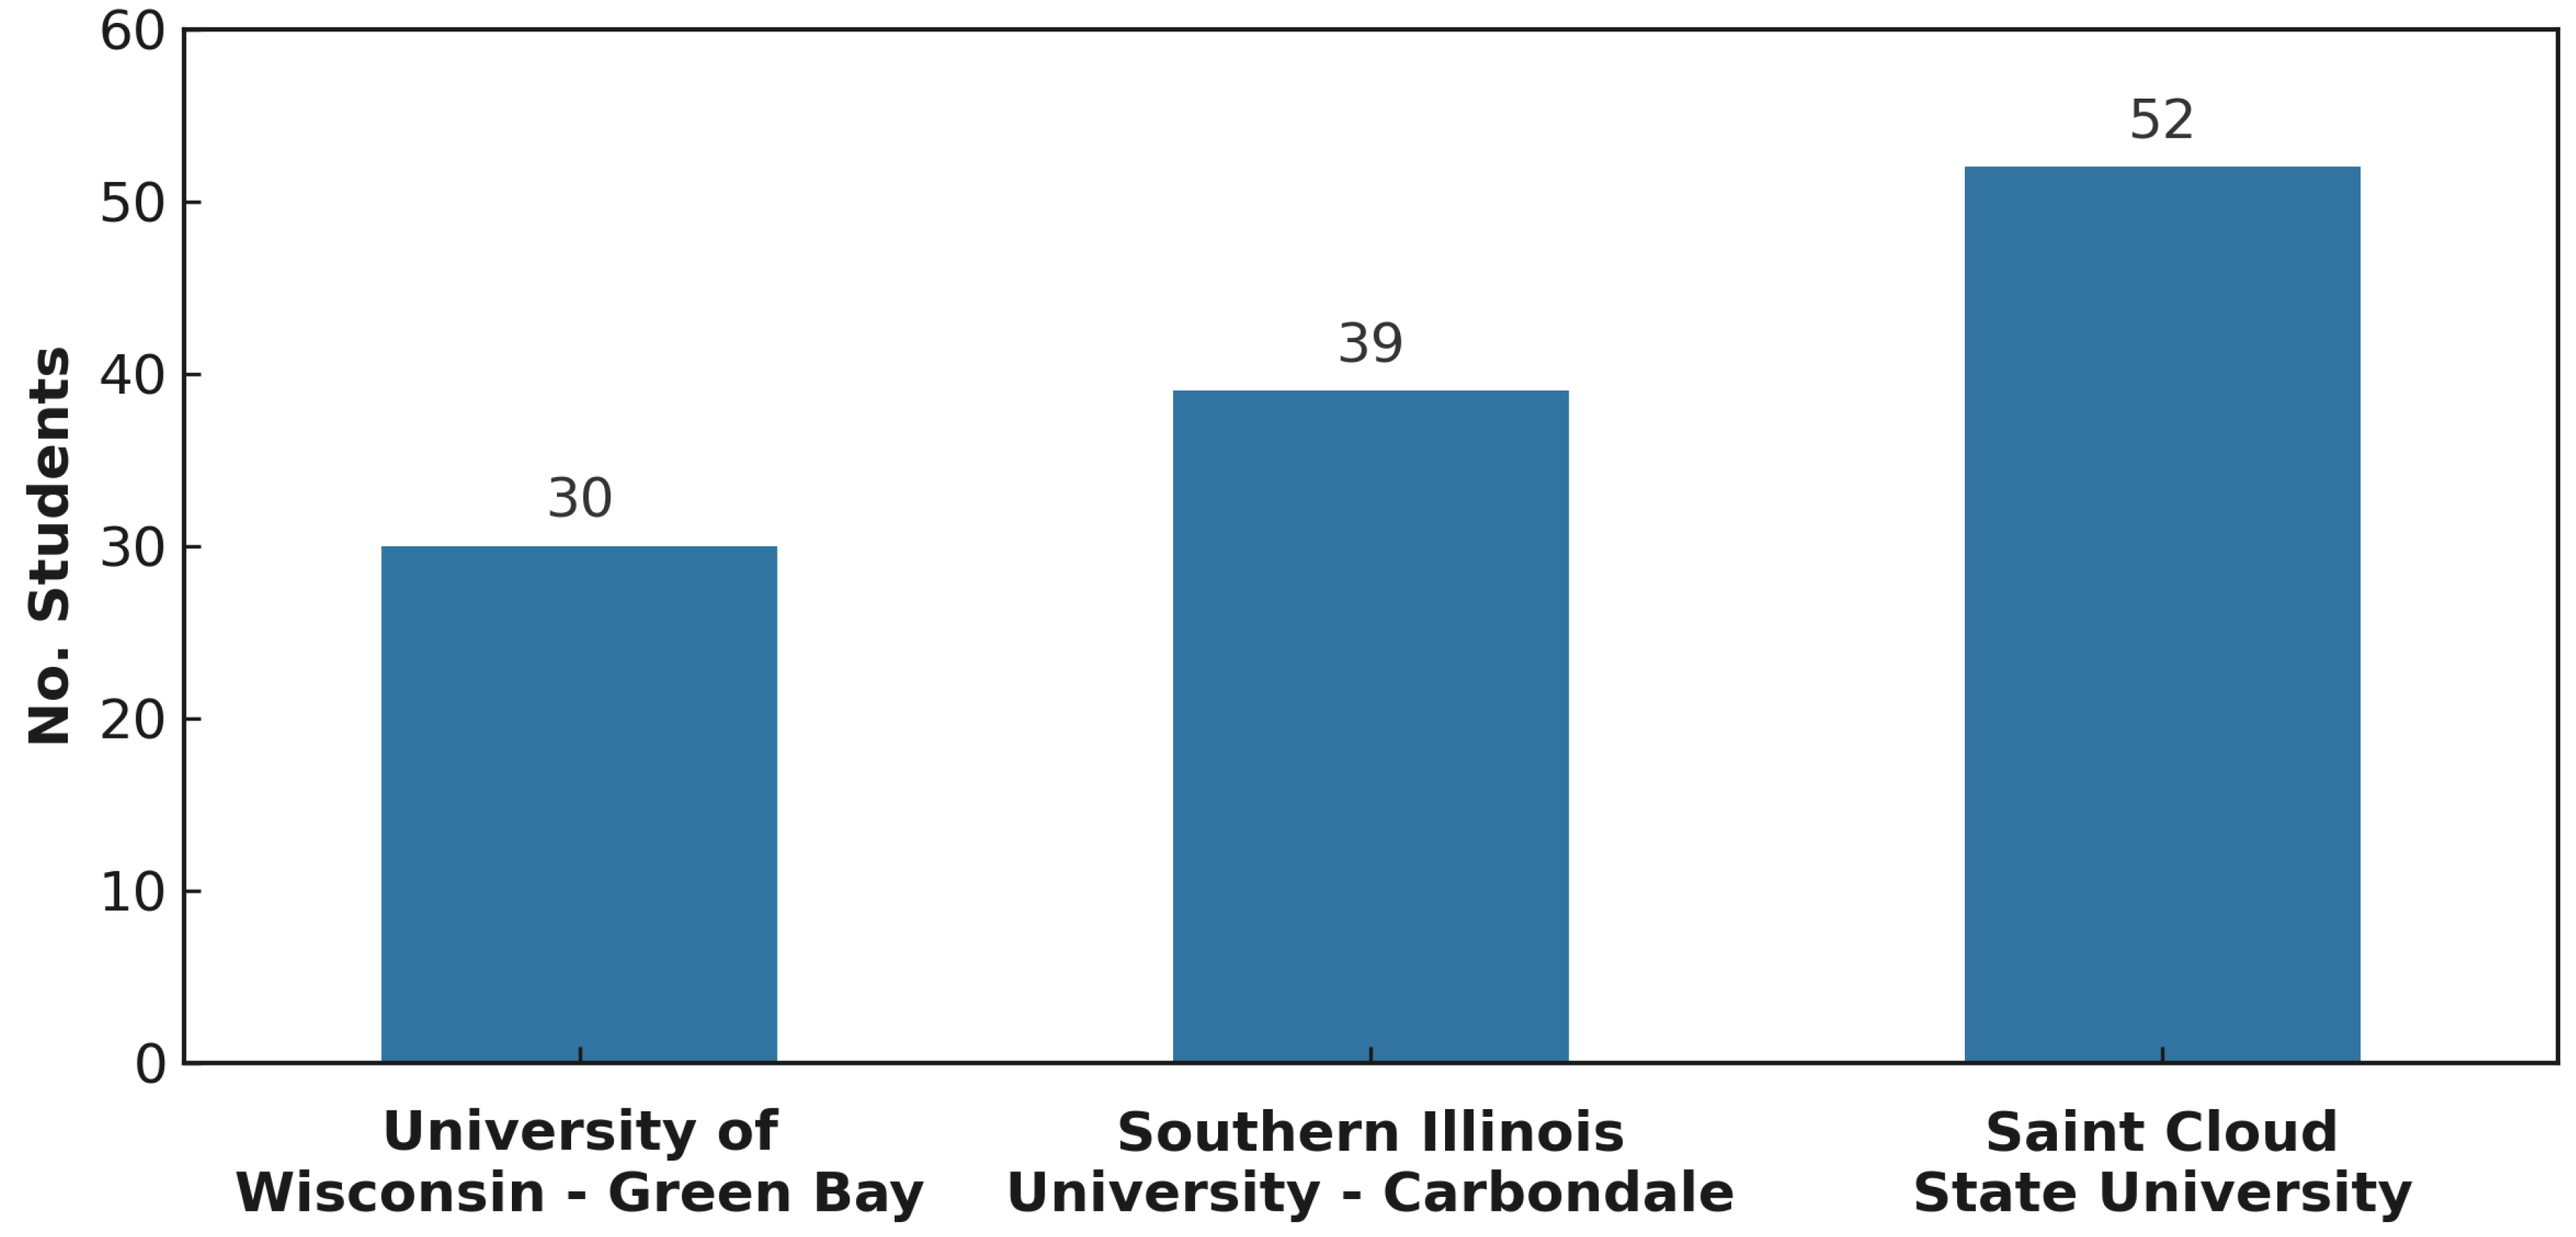
Figure 3.
Score distribution by UML diagram.
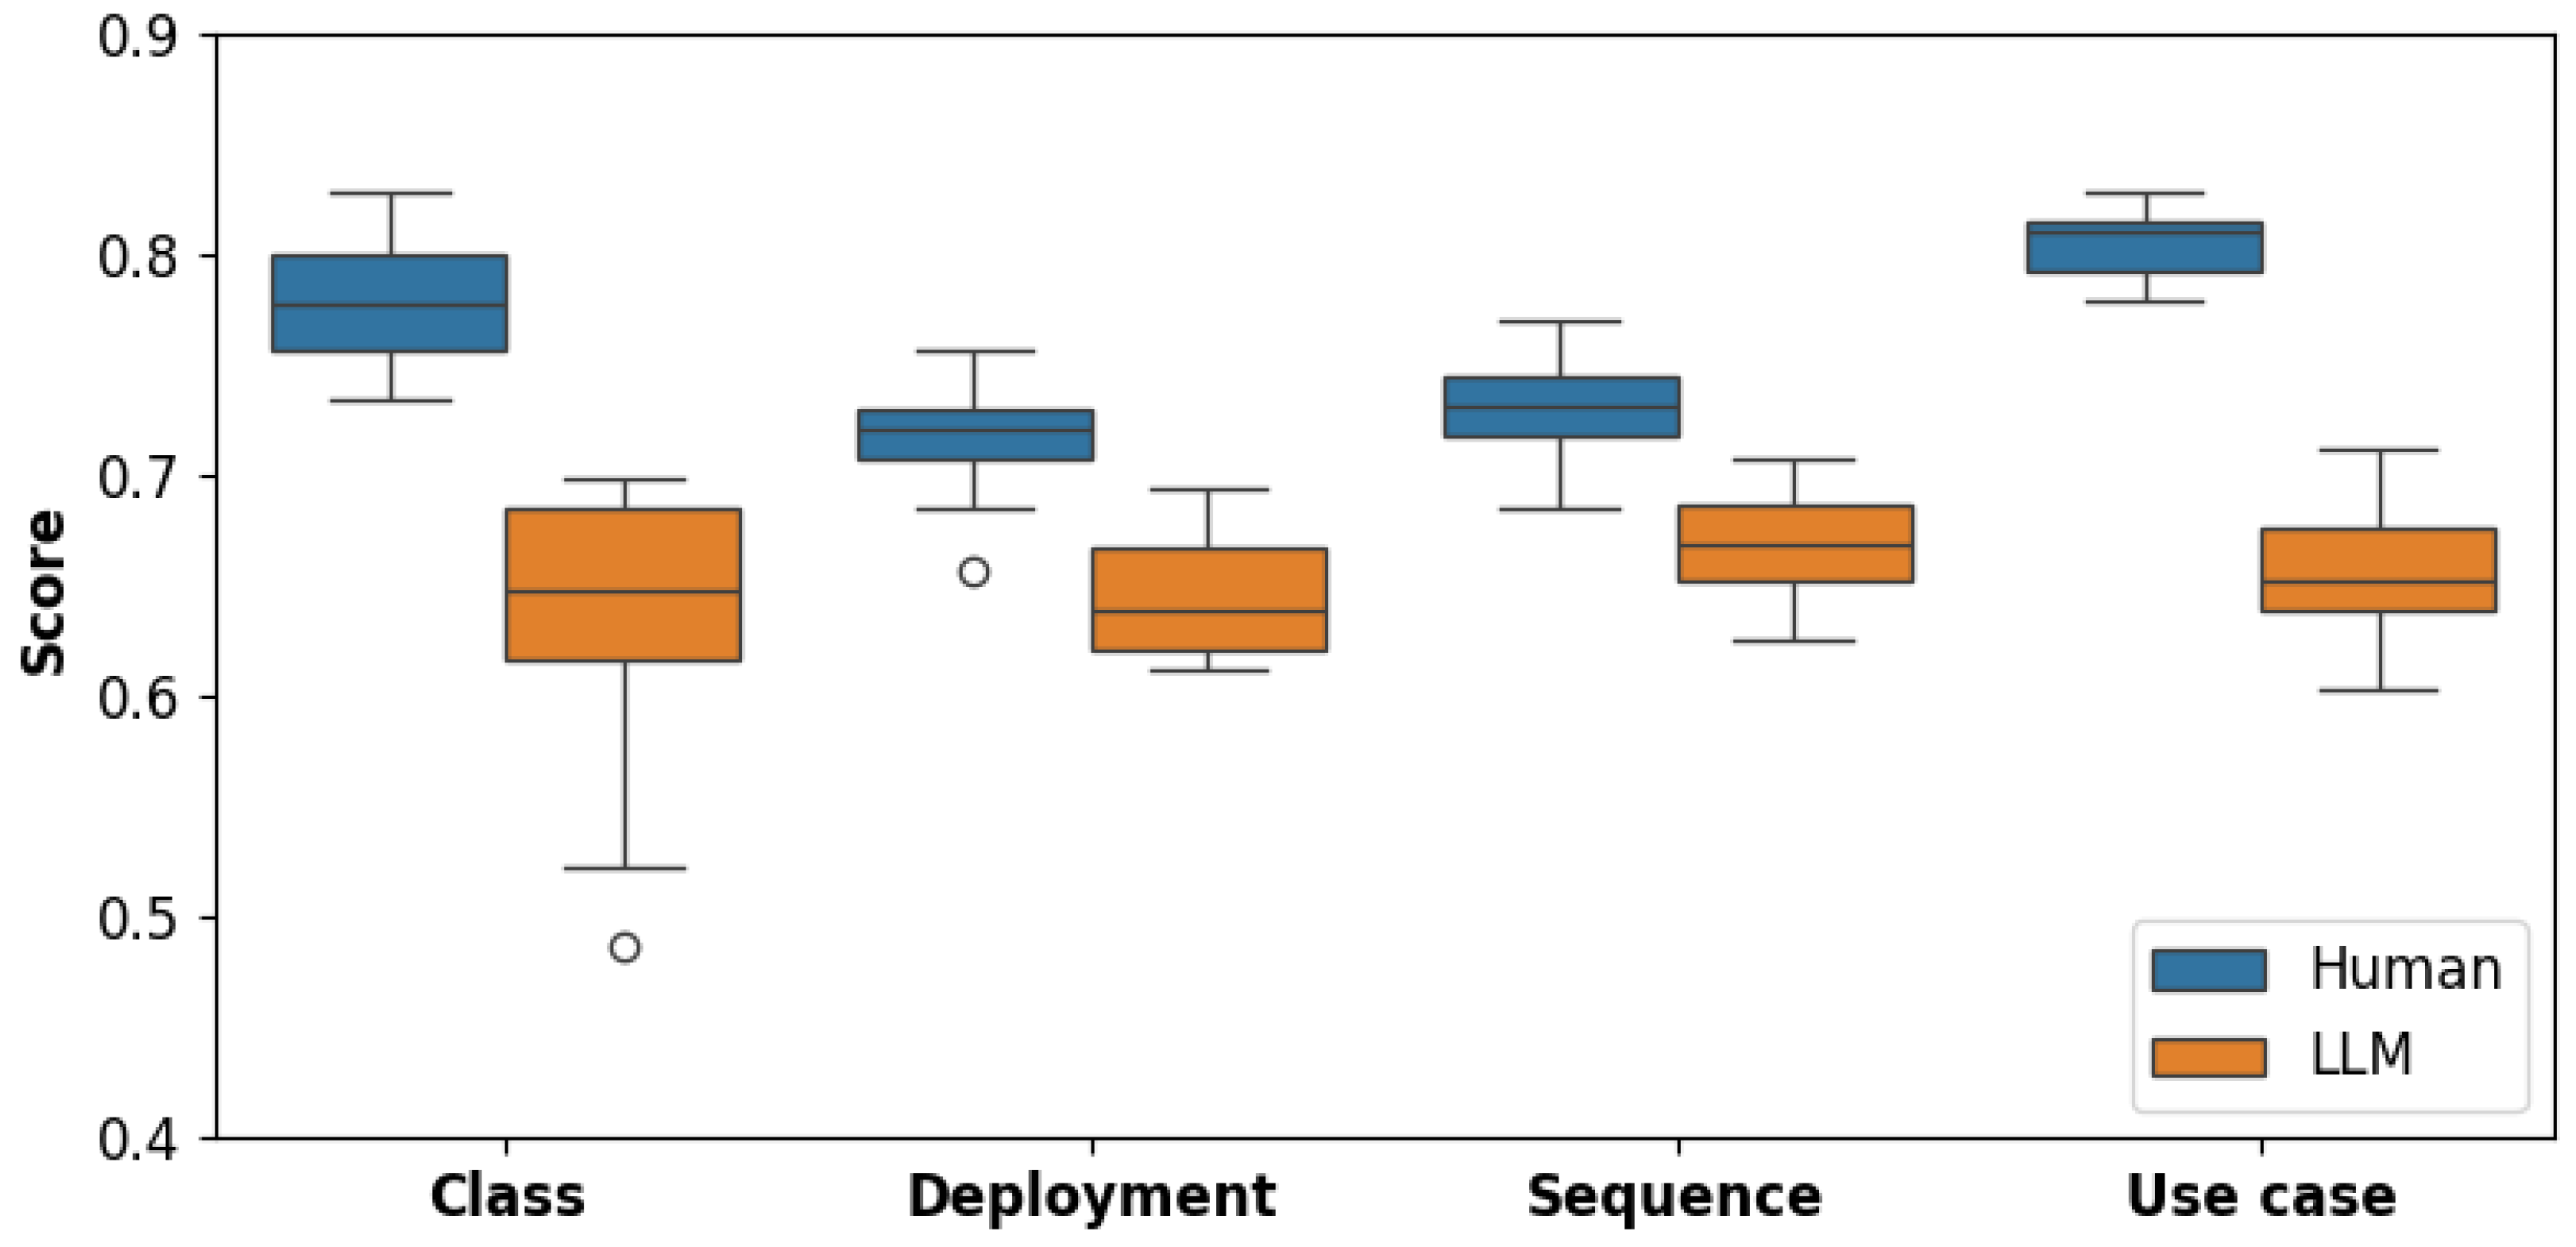
Figure 4.
Human and LLM scores for the Class Diagram.
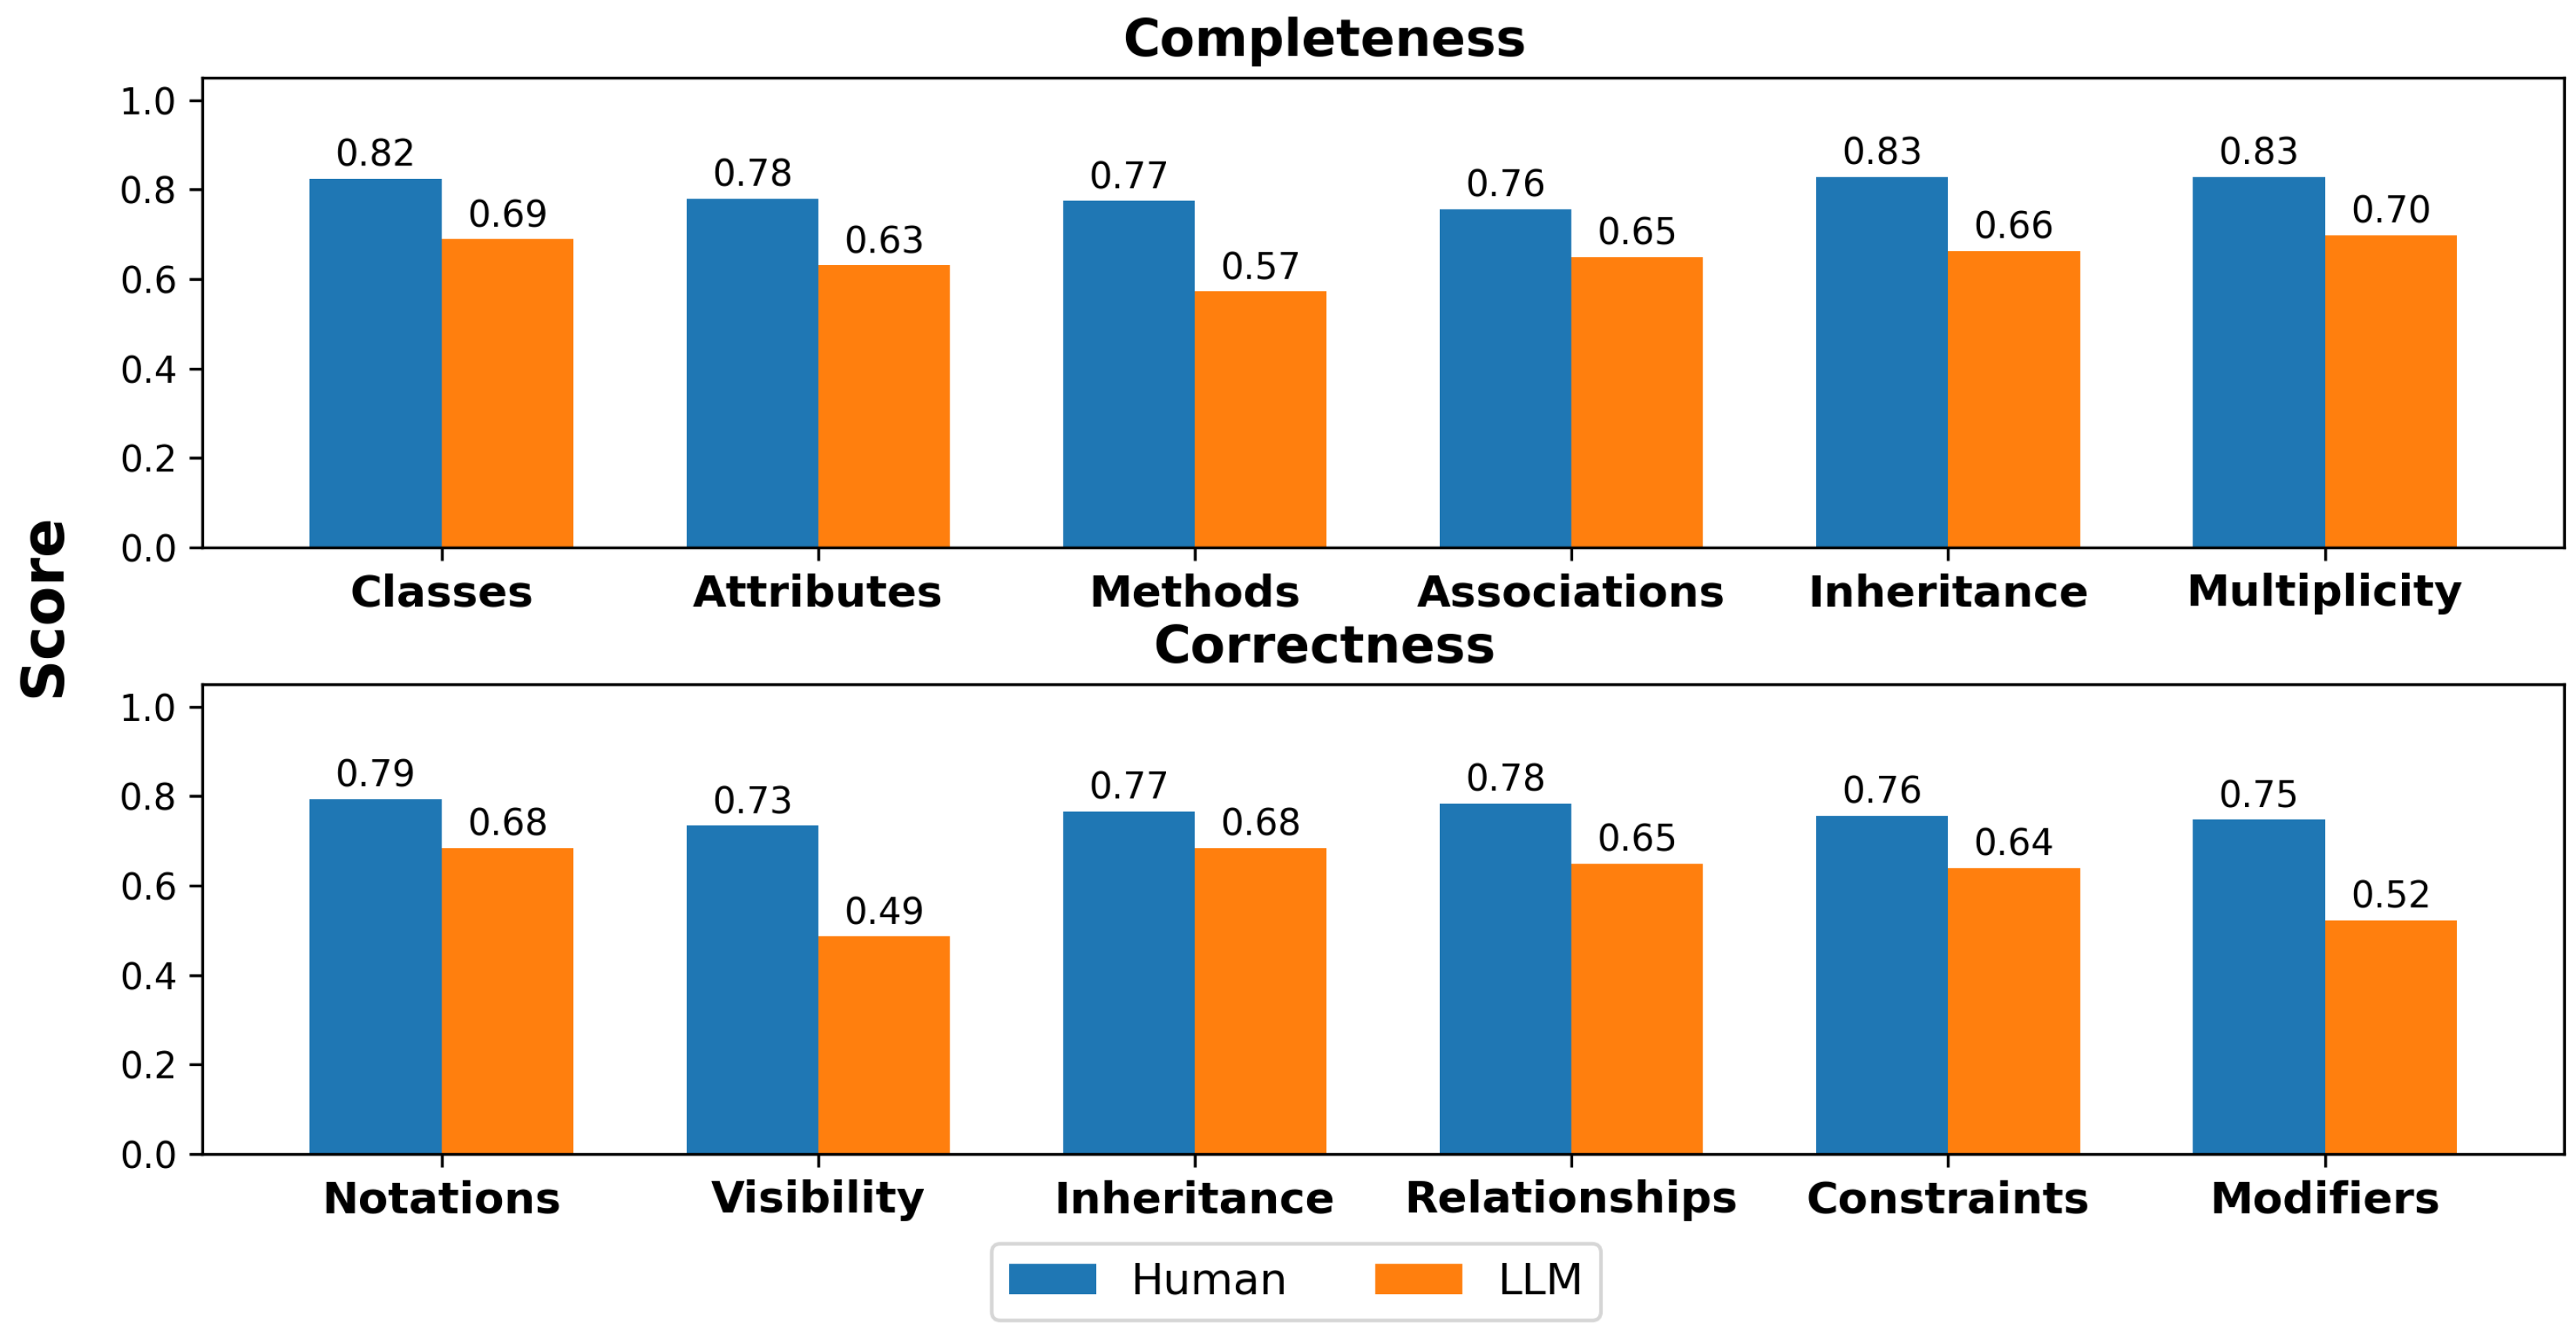
Figure 5.
Human and LLM scores for the Deployment Diagram.
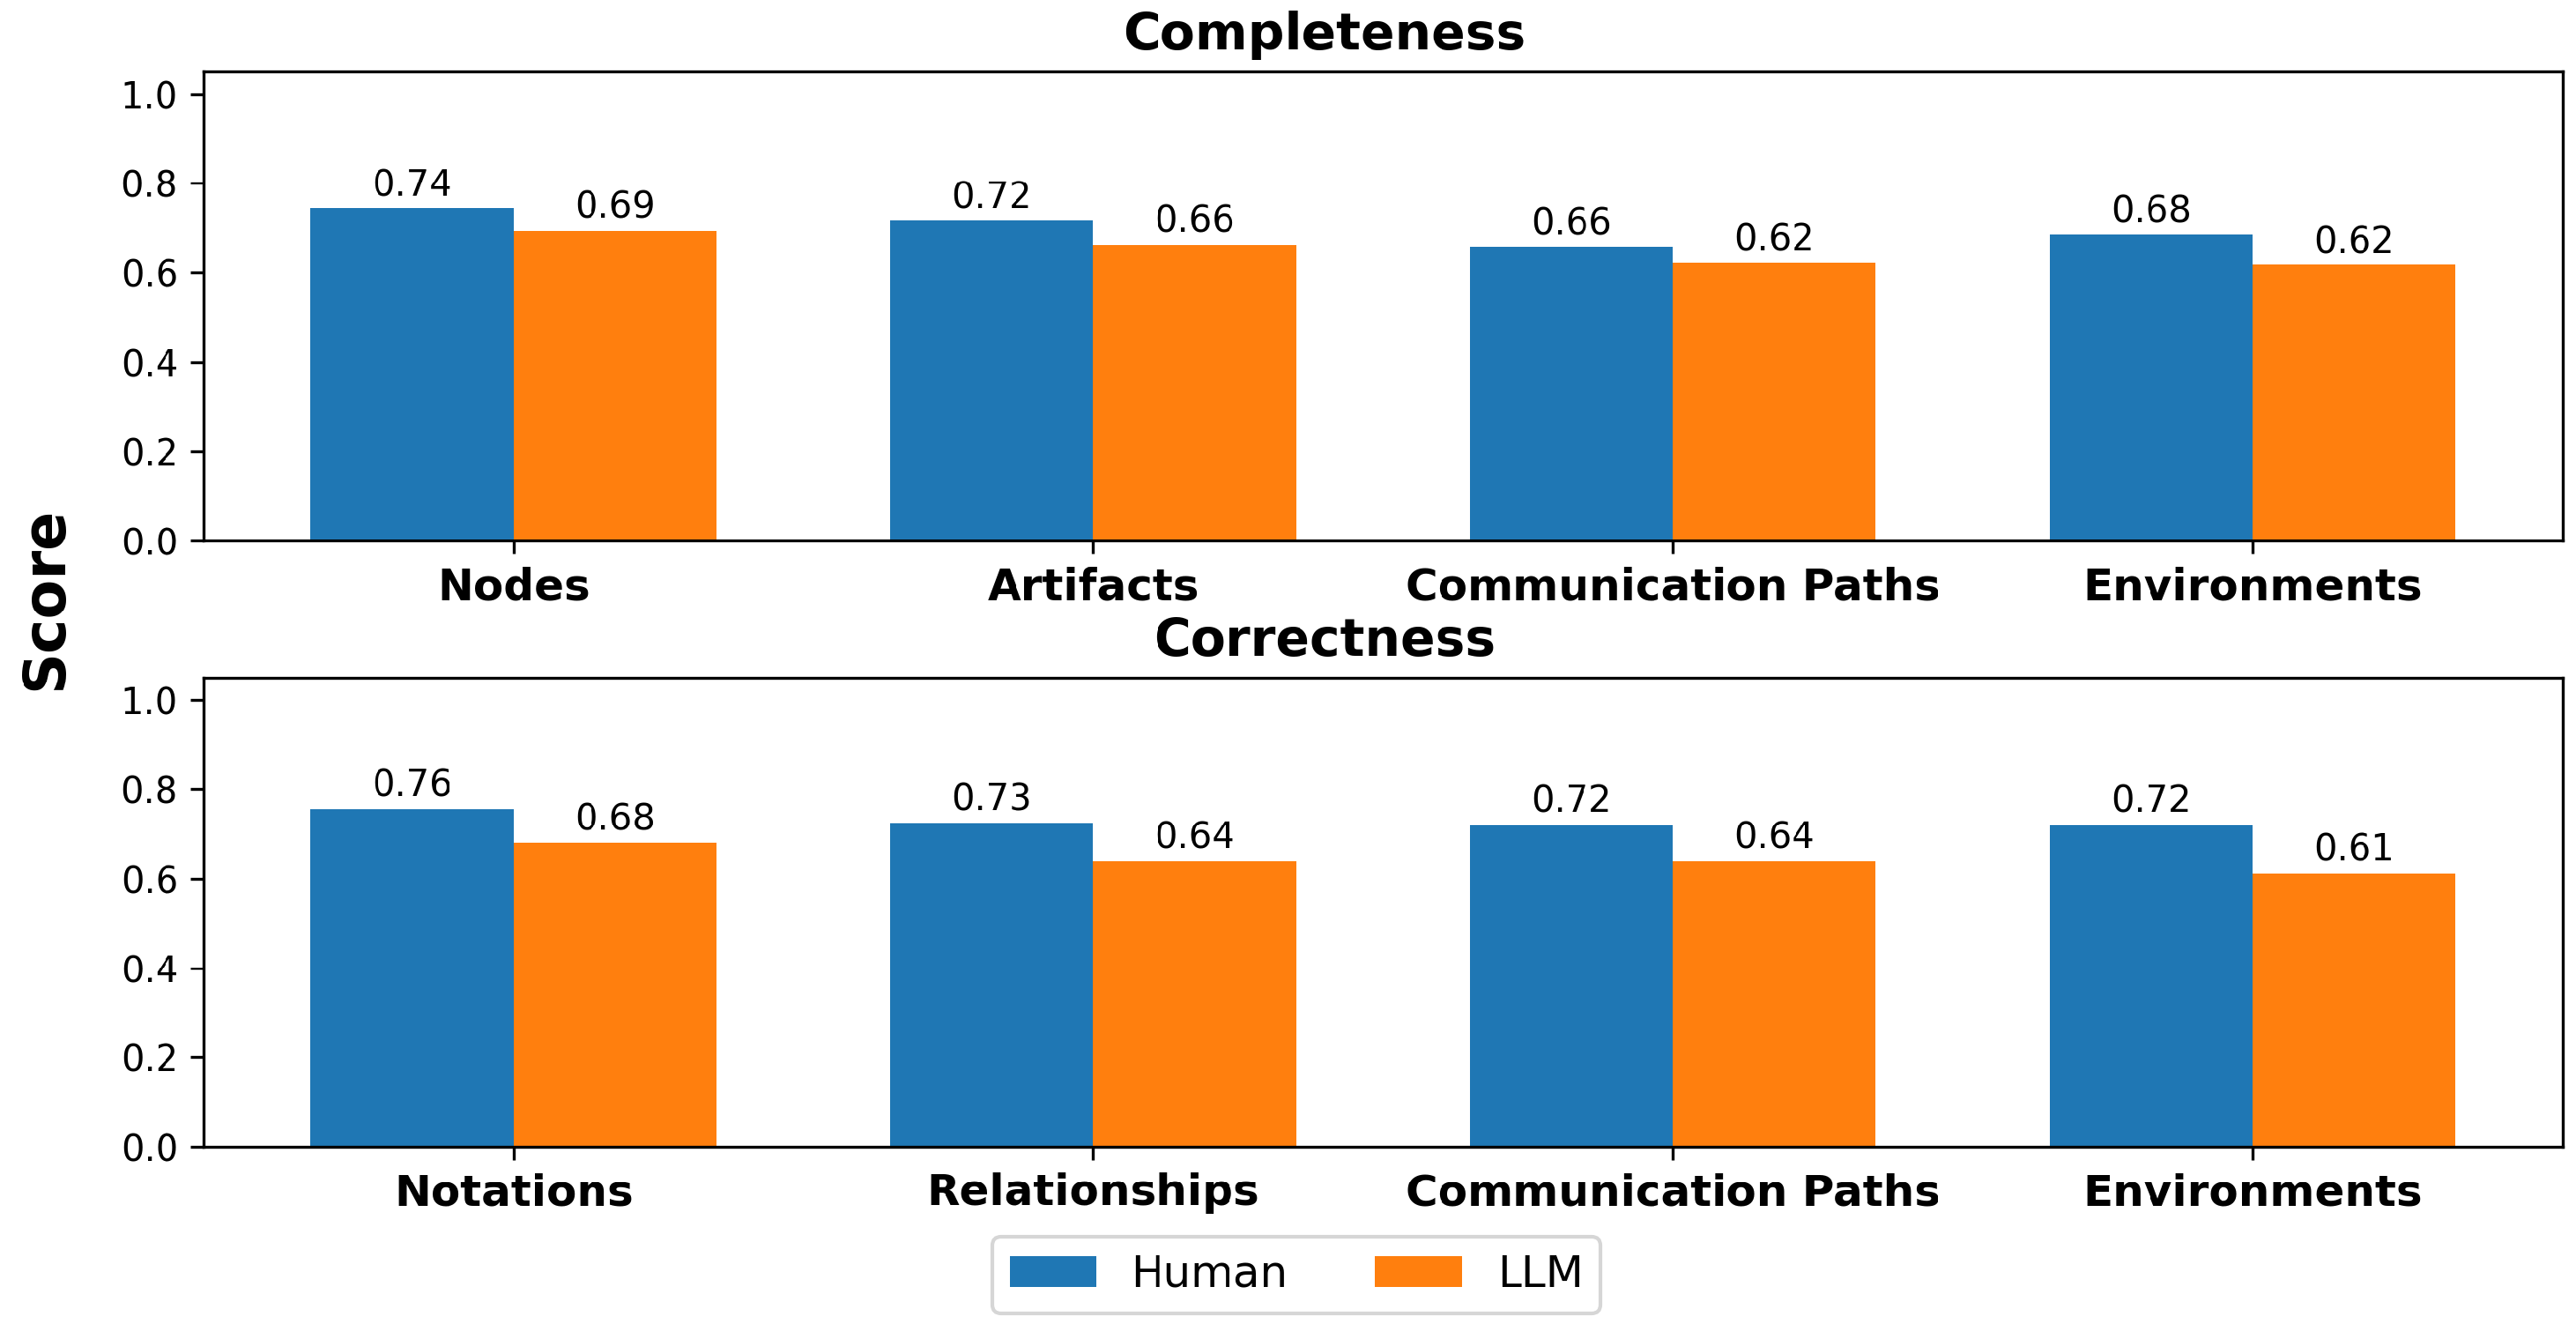
Figure 6.
Human and LLM scores for the Use Case Diagram.
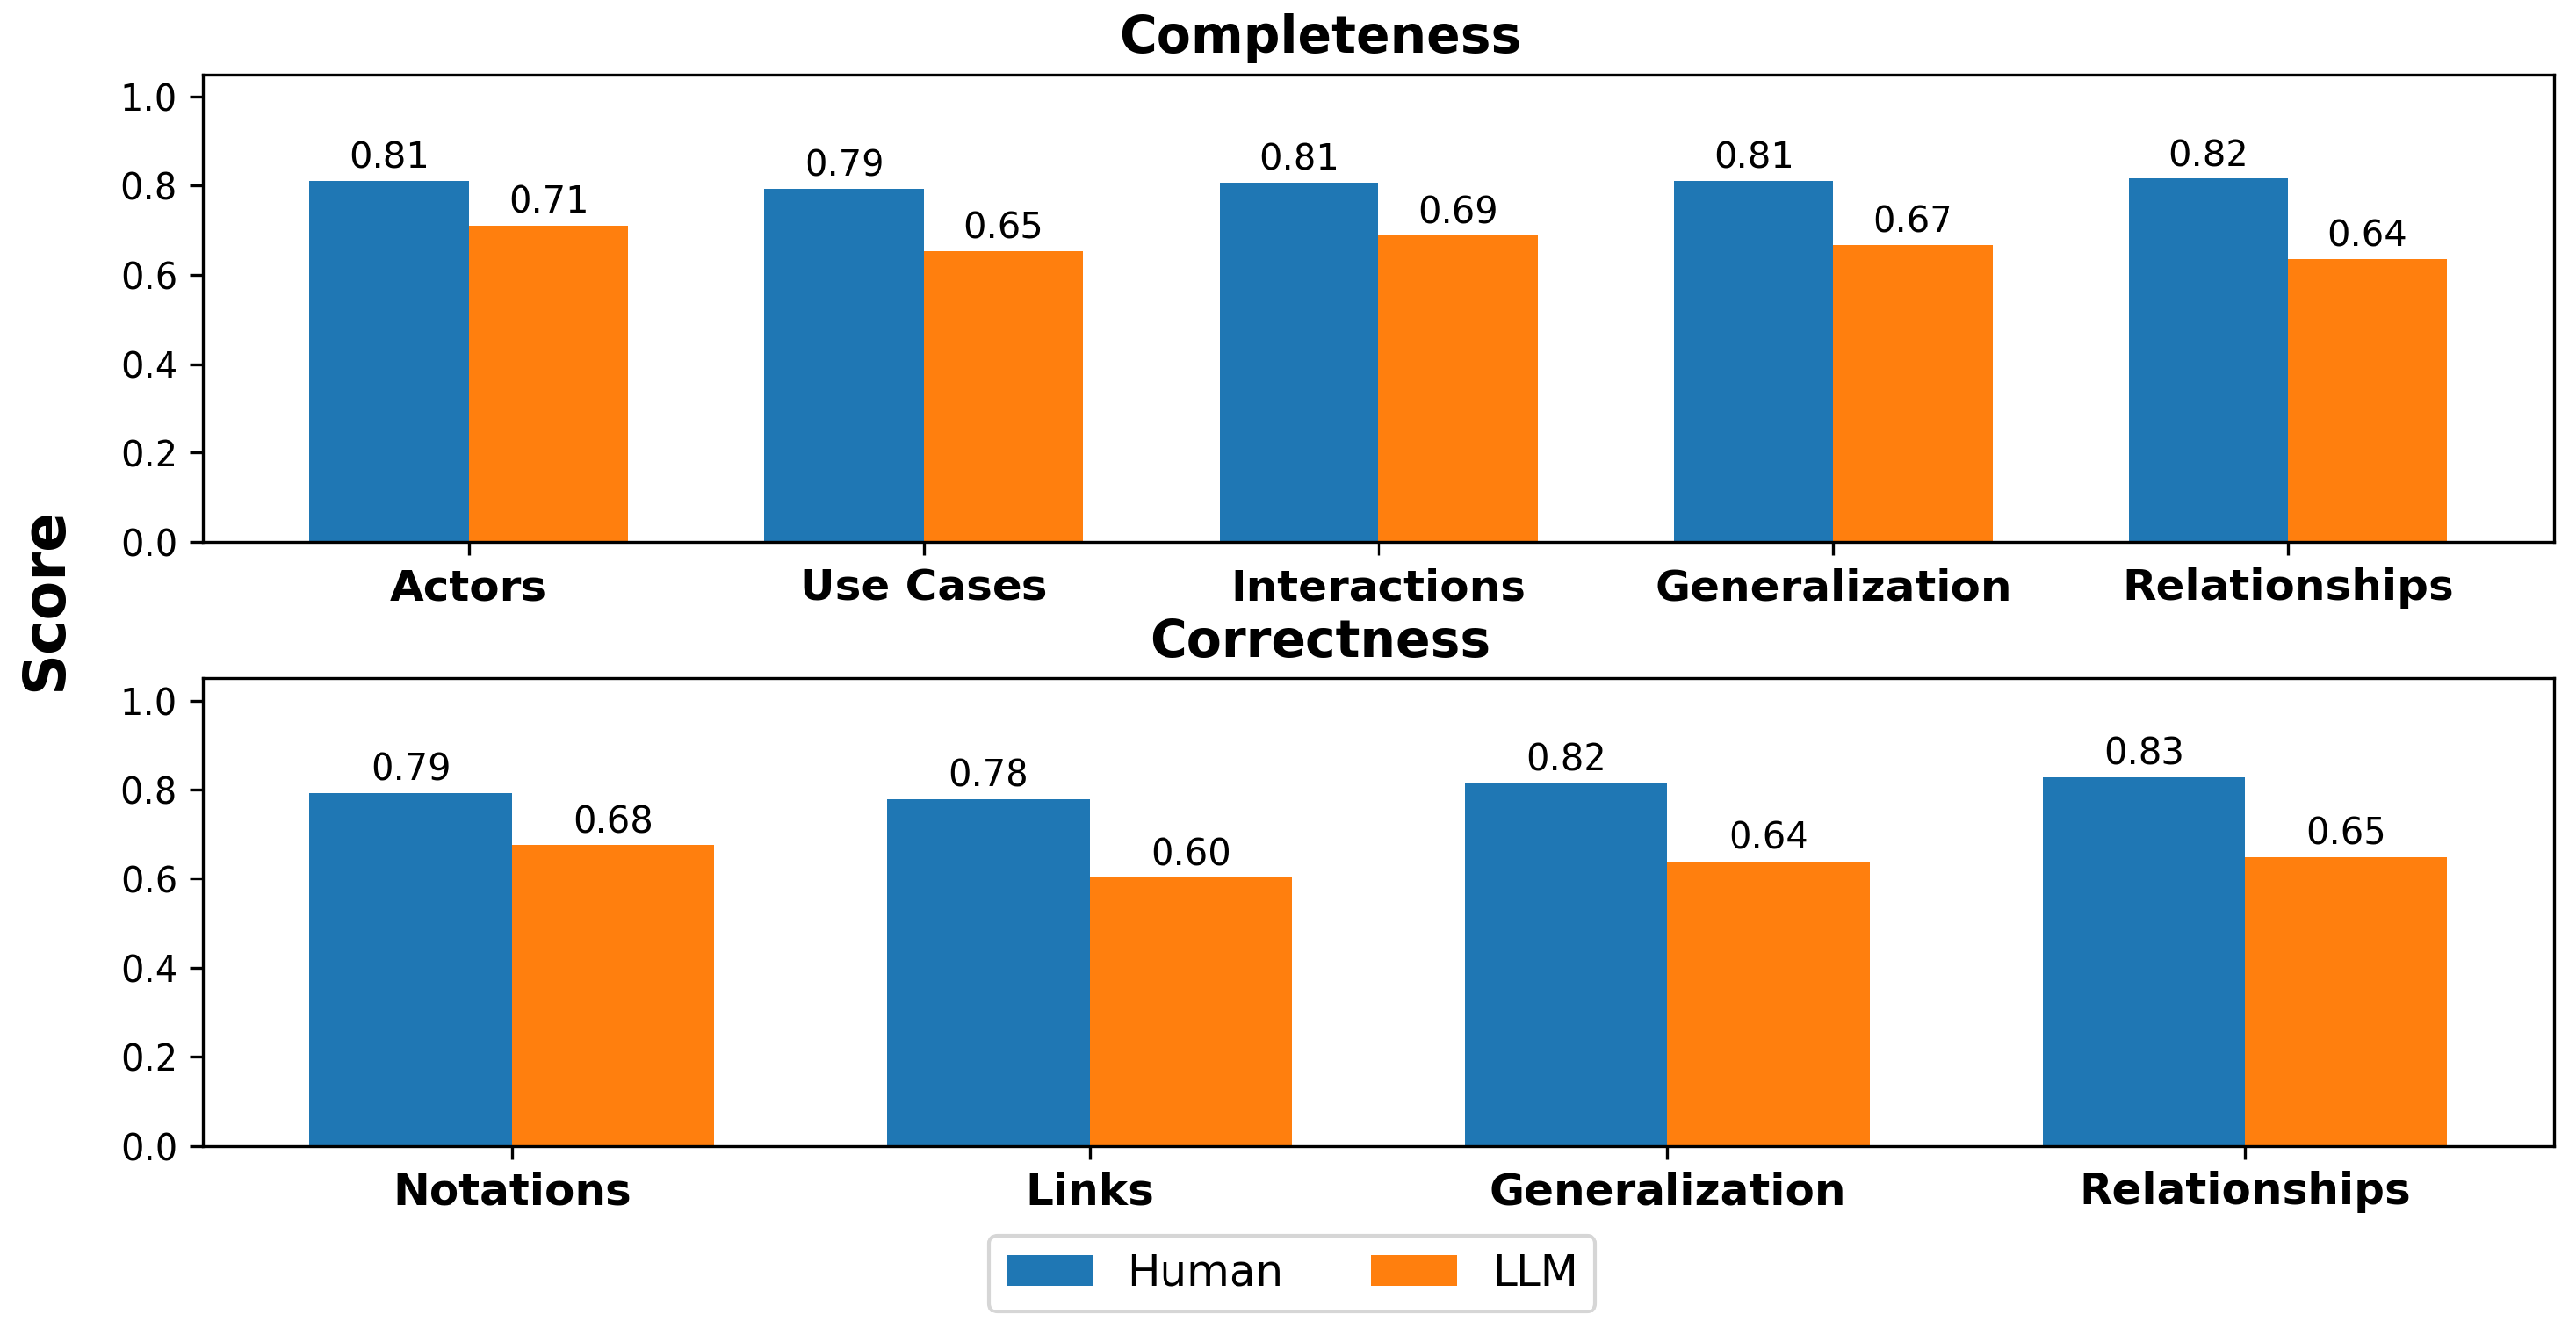
Figure 7.
Human and LLM scores for the Sequence Diagram.

Table 1.
Related studies.
| Study | UML Diagram | Purpose |
|---|---|---|
| [31] | Class | Class diagrams generated from images |
| [30] | Class, Use Case, Sequence | Students-generated diagrams from requirements |
| [15] | Sequence | Generate sequence diagram from SRS |
| [29] | Class | Fully automated domain modeling |
| [16] | Class | Understand capabilities of ChatGPT in modeling |
| [17] | Use Case | Co-prompt engineering approach |
| This study | Class, Deployment, Use Case, Sequence | Students-centric evaluation survey |
Table 2.
Summary statistics for completeness scores across UML diagrams.
| UML Diagram | Source | Sample Size (N) | Mean () | Std. Dev. () | Min | Max |
|---|---|---|---|---|---|---|
| Class | Human | 6 | 0.7988 | 0.0322 | 0.7568 | 0.8288 |
| LLM | 6 | 0.6502 | 0.0457 | 0.5721 | 0.6982 | |
| Deployment | Human | 4 | 0.7005 | 0.0372 | 0.6577 | 0.7432 |
| LLM | 4 | 0.6486 | 0.0362 | 0.6171 | 0.6937 | |
| Use Case | Human | 5 | 0.8072 | 0.0087 | 0.7928 | 0.8153 |
| LLM | 5 | 0.6712 | 0.0300 | 0.6351 | 0.7117 | |
| Sequence | Human | 4 | 0.7320 | 0.0358 | 0.6847 | 0.7703 |
| LLM | 4 | 0.6768 | 0.0174 | 0.6532 | 0.6937 |
Table 3.
Summary statistics for correctness scores across UML diagrams
| UML Diagram | Source | Sample Size (N) | Mean () | Std. Dev. () | Min | Max |
|---|---|---|---|---|---|---|
| Class | Human | 6 | 0.7635 | 0.0220 | 0.7342 | 0.7928 |
| LLM | 6 | 0.6111 | 0.0854 | 0.4865 | 0.6847 | |
| Deployment | Human | 4 | 0.7309 | 0.0174 | 0.7207 | 0.7568 |
| LLM | 4 | 0.6430 | 0.0279 | 0.6126 | 0.6802 | |
| Use case | Human | 4 | 0.8041 | 0.0222 | 0.7793 | 0.8288 |
| LLM | 4 | 0.6419 | 0.0298 | 0.6036 | 0.6757 | |
| Sequence | Human | 4 | 0.7264 | 0.0245 | 0.6937 | 0.7523 |
| LLM | 4 | 0.6622 | 0.0337 | 0.6261 | 0.7072 |
Table 4.
Paired t-test results across UML diagram types.
| UML Diagram | Sample Size (N) | Degrees of Freedom () | t-statistic (t) | p-value | Cohen’s d |
|---|---|---|---|---|---|
| Class | 12 | 11 | 10.2576 | 2.9617 | |
| Deployment | 8 | 7 | 8.5979 | 3.0393 | |
| Use Case | 9 | 8 | 14.0198 | 4.6764 | |
| Sequence | 8 | 7 | 6.3026 | 2.1703 |
Table 5.
Wilcoxon signed-rank test results across UML diagram types.
| UML Diagram | Sample Size (N) | Wilcoxon T-statistic (W) | p-value |
|---|---|---|---|
| Class | 12 | 0.0000 | |
| Deployment | 8 | 0.0000 | 0.0078 |
| Use Case | 9 | 0.0000 | 0.0039 |
| Sequence | 8 | 0.0000 | 0.0078 |
Disclaimer/Publisher’s Note: The statements, opinions and data contained in all publications are solely those of the individual author(s) and contributor(s) and not of MDPI and/or the editor(s). MDPI and/or the editor(s) disclaim responsibility for any injury to people or property resulting from any ideas, methods, instructions or products referred to in the content. |
© 2025 by the authors. Licensee MDPI, Basel, Switzerland. This article is an open access article distributed under the terms and conditions of the Creative Commons Attribution (CC BY) license (http://creativecommons.org/licenses/by/4.0/).
Copyright: This open access article is published under a Creative Commons CC BY 4.0 license, which permit the free download, distribution, and reuse, provided that the author and preprint are cited in any reuse.


