
Submitted:
24 May 2025
Posted:
26 May 2025
You are already at the latest version
Abstract
Acute lymphoblastic leukemia (ALL) is the most common malignancy in children. Excellent overall survival rate of about 90% are the result of improvements in risk stratification and risk-adapted therapy, intensive chemotherapy regimens, hematopoietic stem cell transplanta-tion and supportive care. Background and Objectives: The aim of this study is to review the epi-demiology, prognostic factors, and causes of death of pediatric ALL in a terciary center. Mate-rials and Methods: A retrospective study was conducted at the Croatian Referral Center for Pe-diatric Hematology and Oncology, University Hospital Centre Zagreb, including 302 children (0–18 years) diagnosed with ALL between January 2001 and December 2015, accounting for about 70% of national cases. Results: Two hundred fifty-one children survived (5-year overall survival 83%). Relapse occurred in 13.6% of patients. Relapse rates were higher for B-cells pre-cursor ALL than for T-cell ALL (14.3% vs. 10.4%), and no patient with relapsed T-cell ALL survived. Main causes of death were refractory/relapsed disease (43% of patients), followed by infections (35%) and GVHD (8%). The most frequent causes of infectious death were Pseudo-monas aeruginosa and Aspergillus fumigatus. The most critical treatment periods were induc-tion and reinduction phases, especially de-escalation of corticosteroids. The time of relapse and risk group were independent factors in predicting the outcome. Conclusions: Our study con-firmed that relapse and infections are major causes of mortality in children with ALL. To im-prove the outcome, we should encourage participation in collaborative international trials, im-provement of supportive care and implementation of new treatment modalities.
Keywords:
leukemia
; children
; death
; prognostic factors
; relapse
; infection
1. Introduction
Acute lymphoblastic leukemia (ALL) is the most common childhood malignancy accounting for one-fourth of all pediatric cancers. ALL arises from the proliferation of hematopoietic cells leading to disruption of normal marrow function and marrow failure [1]. The survival rate of pediatric ALL has improved significantly with risk stratification based on biologic features of leukemic cells and response to the treatment, therapy modifications based on patients' pharmacodynamics and pharmacogenomics, and better supportive care [2]. These advances have improved the survival rate from less than 10% in the 1960s to about 90% nowadays [3]. The most common cause of treatment failure and death in pediatric ALL depends on the country’s development. According to studies [4,5,6,7,8,9], relapse is a common cause of treatment failure in high-income countries (8–19%), and post-relapse survival remains unsatisfactory (3-year overall survival (OS) 29.7% to 38.1% depending on the site of relapse) [10]. On the contrary, in low-income countries [11] infections remain a common cause of death (43.2%), while relapse is responsible for death in 27% of cases. Other causes of death have not been frequently reported. The aim of this study is to investigate causes of death in pediatric ALL patients in a single center, and to identify risk factors and their impact on clinical outcome.
2. Materials and Methods
2.1. Study Design
A retrospective study was carried out at the Division of Hematology and Oncology, Department of Pediatrics, University Hospital Centre Zagreb, during the time period from 1st of January 2001 to 31st of December 2015. The Division is the Croatian Referral Center for Pediatric Hematology and Oncology, where about 70% of all children with ALL are treated.
2.2. Participants and Data Collection
The study included 302 children aged 0-18 newly diagnosed with ALL. Exclusion criteria were previous treatment and secondary ALL. Epidemiological and clinical data were obtained from patient records. Demographic information included gender, date of birth, age at diagnosis and therapy start date. Other collected data included ALL immunophenotype and risk group. Due unavailable information on bone marrow cytogenetics, it was excluded from statistical analysis. Furthermore, molecular genetics and minimal residual disease were routinely incorporated in 2009, and these two parameters were excluded from statistical analysis as well. Data about the time and site of relapse, treatment protocol, date of last follow-up/date of death, and causes of death were also collected. The majority of patients had initially been treated according to ALL-BFM 95, ALL-IC-BFM 2002 and ALL-IC-BFM 2009 protocols and classified into risk groups (standard risk – SR, intermediate risk – IR, high risk – HR), while infants had been treated according to Interfant protocol. Philadelphia chromosome–positive (Ph+) ALL positive patients were treated with hematopoietic stem cell transplantation (HSCT).
2.3. Statistical Analysis
Collected data were incorporated into a previously constructed database in Microsoft Excel 2010 and processed in Stata/MP 13. Basic statistics (descriptive statistics) were performed using Excel data analysis. The results were interpreted at a significance level of p<0.05. Kaplan–Meier curve was used to analyze the survival rates. Univariate and multivariate analyses (Efron method) by Cox proportional hazard model were performed with 95% confidence intervals (CIs) in order to identify statistically significant prognostic factors of survival.
3. Results
The median age of patients was 5 years (range 9 months to 17 years). Female patients had a lower median age at diagnosis (4 years) compared to male patients (5 years). Five-year event-free survival (EFS) was 80%, while 5-year OS was 83%. Characteristics of patients with ALL and differences in epidemiology between newly diagnosed and relapsed patients are shown in Table 1.
Relapse occurred in 41 patients (13.6%) with no statistically significant difference in relapse rate according to gender, although girls had better OS than boys (86% vs 81%). Characteristics of ALL patients who experienced relapse are shown in Table 2.
The relapse rate was higher in B-ALL (14.5%) than in T-ALL (10%). Five-year OS of patients without relapse (251 patients) was 93%, while 5-year OS of patients who experienced relapse was 22%; there was a statistically significant difference between these groups (Table 3).
The median time from diagnosis to relapse was 20 months (for SR patients 52 months, for IR patients 12 months, and for HR patients 8 months), while the median post-relapse survival time was 9 months. Figure 1 shows 5-year OS of relapsed patients according to the time of relapse.
We recorded 51 total deaths with a cumulative incidence of 16,9 %. Nineteen patients (37%) died without relapse and 32 patients died (63%) after relapse. The main cause of death was refractory/relapsed disease (43%) followed by infections (35%), graft-versus-host disease (GVHD, 8%), hemorrhage (6%), liver failure (4%), discontinued treatment (2%) and unknown cause (2% of patients). The most critical periods in non-relapsed patients were induction (8 patients, 42%) and reinduction phase of the treatment (9 patients, 48%), while only 1 patient died during intensification and 1 patient after HSCT.
Regarding infections, the most common isolated microorganisms were Pseudomonas aeruginosa (7 patients – 5 non-relapsed and 2 relapsed), Aspergillus fumigatus (6 patients - 5 non-relapsed and 1 relapsed) and Fusarium spp. (2 patients – 1 non-relapsed and 1 relapsed).
4. Discussion
Five-year OS of children with ALL in our study was 83%. In larger studies, Jeha (St Jude Total Therapy XVI protocol) [12] and Pieters (DCOG 10) [13] reported 5-year OS excellent rates of 94.1% and 92% , respectively. On the other side, 10-year EFS in the study of Keizo [14] was 77% for patients recruited from 1997 to 2002 without significant difference between risk groups – EFS rates for SR, IR, HR and very HR groups were 79.3%, 72.5%, 71.7% and 66.3%, respectively. Similar results were reported by Hao [15] with 10-year OS of 69%, confirming that survival rates are related to the resources of the country. Of note, our study, unlike several other studies, includes patients without exclusion of HR cases, such as Ph+ALL or infants
Long-term survival of infants remains unsatisfactory despite many efforts for improvement with intensified chemotherapy and immunotherapy. Hossain et al. [16] reported the lowest survival rate (50%) in infants, compared to age groups 1–4, 5–9, 10–14, and 15–19 years (82%, 75%, 57%, and 32%, respectively). The survival rate is also inversely proportional to age in our cohort except for infants, but in our study multivariate regression analysis had no statistical significance. To mention, univariate regression analysis showed age groups as significant predictors of outcome, but this was not documented in multivariate analysis. Relapse rates in our patients were highest in infants (50%) and lowest in children 1-4 years (10%).
Immunophenotype is an important component in the diagnostic evaluation of patients with ALL. Many studies [17,18] reported a higher relative risk of death in patients with T-cell ALL. Our results closely match for B-cell and T-cell ALL (survival rates 83,3% and 82%, respectively). We observed higher relapse rates for B-cell ALL than for T-cell ALL (14,3% and 10%, respectively), but there were no survivors in the cohort of patients with T-cell ALL who experienced a relapse. Pro-B ALL remains infrequent, but with the worst outcome. In the study of Rheingold and colleagues [19], relapse rates were similar for B- and T-cell ALL (12% and 11%), and the prognosis was better for patients with relapsed B-ALL (52±1%) than for T-ALL (33±3%) and infant ALL (19±4%), with greater variability in OS by the site in T-ALL vs. B-ALL. In multivariable analysis, their results were equal to ours showing that a shorter time to relapse was associated with the worse outcome with addition to the site of relapse, age <1 or >10 years at diagnosis, initial WBC > 100 x 1012/L and T-cell phenotype as statistically significant unfavorable prognostic factors. The small sample size in our study makes the conclusion about variability in OS by the site of relapse unreliable.
Risk-adapted therapy is one of the main contributors to the forceful improvement of survival in children with ALL. The OS for SR patients in our study was 96% with only 6% of relapsed patients, which is comparable to the results of Maloney et al. [20], with 6-year OS for children with SR ALL enrolled in AALL0331 exceeding 95%.
As reported in other studies [8,21], treatment-related mortality, mainly accounted by infections, primarily occurred in induction protocols. In our study, deaths were slightly more reported in the reinduction protocol (9 deaths in reinduction, 8 deaths in induction). Furthermore, we want to emphasize the tapering of corticosteroids as the critical period for susceptibility to infection. Inaba et al. [20] noted that poor neutrophil surge after dexamethasone pulses during continuation, which can reflect the poor bone marrow reserve, was associated with infections.
Nakagawa et al. [22] reported that fatal infections mostly occurred during the third week of induction therapy. They suggested close monitoring, stringent infection control, and immediate administration of appropriate antibiotics through hospitalization as an approach to reducing the rate of infection-related induction deaths. Our patients were hospitalized throughout the entire induction phase, and during reinduction, they were discharged between therapies if their general condition and laboratory findings were acceptable. We checked up patients regularly in outpatient setting and they were admitted at the slightest suspicion of infection or deterioration. Microbiological specimens (stool, urine, oropharynx, nasopharynx, armpit, groin) were collected routinely at least once a week.
The most common isolated microorganisms as the cause of sepsis and death in our study were Pseudomonas aeruginosa followed by Aspergillus fumigatus and Fusarium spp. Also, Nakagawa [22] reported Pseudomonas aeruginosa as the most common cause of sepsis and death (32%), followed by Bacillus spp. (27%), while other microorganisms (Enterobacter cloacae, Candida albicans, Aspergillus, Candida tropicalis and Chickenpox) were rare causes of death. Ruijters and colleagues [23] reported that the most common fungal cause was Candida, followed by Aspergillus.
Due to the growing incidence of invasive fungal infections (IFI), many studies [24,25,26,27] focused on preventive strategies and reported the importance of environmental factors. Building constructions, tobacco, pets, potted plants, gardening, and rooms without HEPA filtration might increase the risk of IFI. Short-term laminar airflow use may reduce risk of aspergillosis, but its long-term use is inadequate.
In this study, relapse occurred in 51 patients (13.6%) which is higher than in UKALL2003 trial (relapse risk 8.8%) [4] and DFCI 05-001 trial (relapse risk 8.9%), but slightly lower in comparison with the study of Tuong et al [28] (relapse risk 16.7%). Most of our patients (43.9%) had a very early relapse with a dismal prognosis, while early and late relapses were associated with better, still poor prognosis (10% and 62%, respectively). The time of relapse was an independent unfavorable prognostic factor which is comparable with Egyptian study [29], reporting that ‘very early’ relapses had significantly lower 5-year OS (15.8%), compared to ‘early’ and ‘late’ relapses, (46.2% and 66.7% respectively), without significance in multivariate Cox regression analysis. Kelly et al. [30] reported that EFS was significantly higher in patients with a longer duration of the first complete remission regardless of whether the threshold was made at 24 months (p < 0,05) or 36 months (p < 0,05), which is in agreement with our results. Furthermore, their study showed no significant difference between disease-free survival (DFS) at 8 years for patients treated with chemotherapy alone (45.3% ± 11.2%) and chemotherapy followed by SCT (50% ± 9.1%).
Regardless of better results reported in some studies after relapse [10], extremely aggressive treatment for ALL relapse is often associated with substantial late sequelae. Therefore, improved strategies to prevent relapse are needed for the subset of HR patients. Pui et al. [18] reported that patients with NCI HR B-ALL or T- ALL had an inferior outcome, even with undetectable minimal residual disease (MRD) on day 46, with the cumulative risk of relapse of 12.7% and 15.5%, respectively.
Consequently, our goal is to reach better results comparable to highly developed centers using standardized treatment protocols for relapse and better supportive care. Further studies are needed to focus on molecular therapies and cellular immunotherapy to achieve better survival, reduce treatment-related mortality, and improve the quality of life in childhood cancer survivors.
5. Conclusions
This study showed a 5-year OS rate of 83% and a relapse rate of 13.6% in children with ALL. Infants and very early relapse had the poorest prognosis. Treatment-related mortality was primarily driven by infections, with a notable number occurring during reinduction. Despite limited resources, our results are comparable to those reported by more developed centers, demonstrating the effectiveness of consistent treatment protocols and comprehensive care. Future efforts should focus on reducing relapse rates and treatment-related mortality through optimized therapy and enhanced supportive measures.
Author Contributions
For research articles with several authors, a short paragraph specifying their individual contributions must be provided. The following statements should be used “Conceptualization, M.J., J.R. and E.B..; methodology, M.J..; software, L.L. and M.J..; validation, J.R. and E.B..; formal analysis, M.J., M.P., L.M., S.D.B., Z.S., T.M., D.T., L.L., J.R. and E.B..; investigation, M.J. and J.R..; resources, M.J., M.P., L.M., S.D.B., Z.S., T.M., D.T., J.R. and E.B.; data curation, M.J., M.P., L.M., S.D.B., Z.S., T.M., D.T., L.L., J.R. and E.B.; writing—original draft preparation, M.J. and J.R..; writing—review and editing, M.J., M.P., L.M., S.D.B., Z.S., T.M., D.T., J.R. and E.B.; visualization, M.J. and E.B..; supervision, J.R. and E.B..;. All authors have read and agreed to the published version of the manuscript.”
Funding
This research received no external funding
Institutional Review Board Statement
The study was conducted in accordance with the Declaration of Helsinki, and approved by the Institutional Review Board (or Ethics Committee) of University Hospital Centre Zagreb
Informed Consent Statement
Informed consent was obtained from all children and their parents or legal guardians before taking part in the study. Written consent was also received from them to allow us to publish the results of this study.
Data Availability Statement
The data presented in this study are available on request from the corresponding author due to privacy reasons.
Acknowledgments
Ljubica Rajić, Ranka Femenić and Josip Konja participated in the treatment of the patients included in the study. The paper was written with the support of Croatian Cooperative Group for Hematological Diseases (KROHEM).
Conflicts of Interest
The authors declare no conflicts of interest.
Abbreviations
The following abbreviations are used in this manuscript:
| ALL | Acute lymphoblastic leukemia |
| OS | Overall survival |
| HSCT | Hematopoietic stem cell transplantation |
| CI | Confidence interval |
| EFS | Event free survival |
| IFI | Invasive fungal infection |
References
- Seth R, Singh A. Leukemias in Children. Indian J Pediatr. 2015;82(9):817–24. [CrossRef]
- Hiroto Inaba, Mel Greaves CGM. Acute lymphoblastic leukemia. Lancet. 2014;381(9881):1–27. [CrossRef]
- Hunger SP, Mullighan CG. Acute Lymphoblastic Leukemia in Children. N Engl J Med. 2015;373(16):1541–52. [CrossRef]
- Hough R, Rowntree C, Goulden N, et al. Efficacy and toxicity of a paediatric protocol in teenagers and young adults with Philadelphia chromosome negative acute lymphoblastic leukaemia : results from UKALL 2003. Br J Haematol. 2016;172:439–51. [CrossRef]
- Stary J, Zimmermann M, Campbell M, et al. Intensive Chemotherapy for Childhood Acute Lymphoblastic Leukemia : Results of the Randomized Intercontinental Trial ALL IC-BFM 2002. Am Soc Clin Oncol. 2019;32(3):172–84. [CrossRef]
- Toft N, Birgens H, Abrahamsson J, et al.Toxicity profile and treatment delays in NOPHO ALL2008 — comparing adults and children with Philadelphia chromosome-negative acute lymphoblastic leukemia. Eur J Haematol. 2015;96:160–9. [CrossRef]
- Pui C-H, Pei D, Raimondi SC, et al. Clinical Impact of Minimal Residual Disease in Children with Different Subtypes of Acute Lymphoblastic Leukemia Treated with Response-Adapted Therapy. Leukemia. 2017;31(2):333–9. [CrossRef]
- Veerman AJ, Kamps WA, Berg H Van Den, et al. Dexamethasone-based therapy for childhood acute lymphoblastic leukaemia : results of the prospective Dutch Childhood Oncology Group ( DCOG ) protocol ALL-9 ( 1997 – 2004 ). Lancet Oncol. 2009;10(10):957–66. [CrossRef]
- Place AE, Stevenson KE, Vrooman LM, et al. Intravenous pegylated asparaginase versus intramuscular native Escherichia coli L-asparaginase in newly diagnosed childhood acute lymphoblastic leukaemia ( DFCI 05-001 ): a randomised, open-label phase 3 trial. Lancet Oncol. 2015;2045(15):1–14. [CrossRef]
- Freyer DR, Devidas M, La M, et al. Postrelapse survival in childhood acute lymphoblastic leukemia is independent of initial treatment intensity : a report from the Children ’ s Oncology Group. Blood J. 2018;117(11):3010–6. [CrossRef]
- Hao TK, Hiep PN. Causes of Death in Childhood Acute Lymphoblastic Leukemia at Hue Central Hospital for. Glob Pediatr Heal. 2020;7:1–8. [CrossRef]
- Jeha S, Pei D, Choi J, et al. Improved CNS control of childhood acute lymphoblastic leukemia without cranial irradiation: St Jude Total Therapy Study 16. J Clin Oncol. 2019;37(35):3377–91. [CrossRef]
- Surapolchai P, Anurathapan U, Sermcheep A, et al. Long-Term Outcomes of Modified St Jude Children’s Research Hospital Total Therapy XIIIB and XV Protocols for Thai Children With Acute Lymphoblastic Leukemia. Clin Lymphoma, Myeloma Leuk. 2019;19(8):497–505. [CrossRef]
- Horibe K, Yumura-Yagi K, Kudoh T, et al. Long-term results of the risk-adapted treatment for childhood B-cell acute lymphoblastic leukemia: Report from the Japan association of childhood leukemia study ALL-97 trial. J Pediatr Hematol Oncol. 2017;39(2):81–9. [CrossRef]
- Kiem Hao T, Nhu Hiep P, Kim Hoa NT, et al. Causes of Death in Childhood Acute Lymphoblastic Leukemia at Hue Central Hospital for 10 Years (2008-2018). Glob Pediatr Heal. 2020;7:1–8. [CrossRef]
- Hossain MJ, Xie L, McCahan SM. Characterization of Pediatric Acute Lymphoblastic Leukemia Survival Patterns by Age at Diagnosis. J Cancer Epidemiol. 2014;2014. [CrossRef]
- Hunger SP, Lu X, Devidas M, et al. Improved Survival for Children and Adolescents With Acute Lymphoblastic Leukemia Between 1990 and 2005 : A Report From the Children ’ s Oncology Group. J Clin Oncol. 2012;10:1–21. [CrossRef]
- Pui C, Pei D, Raimondi SC, et al. Clinical Impact of Minimal Residual Disease in Children with Different Subtypes of Acute Lymphoblastic Leukemia Treated with Response-Adapted Therapy. Leukemia. 2017;31(2):333–9. [CrossRef]
- Rheingold SR, Ji L, Xu X, et al. Prognostic factors for survival after relapsed acute lymphoblastic leukemia (ALL): A Children’s Oncology Group (COG) study. J Clin Oncol. 2019;37(15):10008. [CrossRef]
- Maloney KW, Devidas M, Wang C, et al. Outcome in Children With Standard-Risk B-Cell Acute Lymphoblastic Leukemia : Results of Children ’ s Oncology Group Trial AALL0331. J Clin Oncol. 2019;38(6):602–12. [CrossRef]
- Binitha Rajeswari, Reghu K Sukumaran Nair, C S Guruprasad, et al. Infections during Induction Chemotherapy in Children with Acute Lymphoblastic Leukemia – Profile and Outcomes : Experience from a Cancer Center in South India. Indian J Med Paediatr Oncol. 2021;39(02):188–92. [CrossRef]
- Nakagawa S, Kato M, Imamura T, et al. In-Hospital Management Might Reduce Induction Deaths in Pediatric Patients With Acute Lymphoblastic Leukemia: Results From a Japanese Cohort. J Pediatr Hematol Oncol. 2021;43(2):39–46. [CrossRef]
- Ruijters VJ, Oosterom N, Wolfs TFW, et al. Frequency and Determinants of Invasive Fungal Infections in Children With Solid and Hematologic Malignancies in a Nonallogeneic Stem Cell Transplantation Setting: A Narrative Review. J Pediatr Hematol Oncol. 2019;41(5):345–54. [CrossRef]
- Rambaldi, B. , Russo D. PL. Letters to the Editor: Defining Invasive Fungal Infection Risk in Hematological Malignancies : A New Tool for Clinical Practice. Mediterr J Hematol Infect Dis. 2017;9(1):1–4. [CrossRef]
- Hernandez H, Martinez LR. Relationship of environmental disturbances and the infectious potential of fungi. Microbiology. 2018;164:233–41. [CrossRef]
- Kanamori H, Rutala WA, Sickbert-bennett EE, et al. Review of Fungal Outbreaks and Infection Prevention in Healthcare Settings During Construction and Renovation. Helathcare Epidemiol. 2015;61:433–44. [CrossRef]
- Iwasaki M, Kanda J, Hishizawa M, et al. Effect of laminar air flow and building construction on aspergillosis in acute leukemia patients : a retrospective cohort study. BMC Infect Dis. 2019;19(38):1–8. [CrossRef]
- Tuong PN, Kiem Hao T, Kim Hoa NT. Relapsed Childhood Acute Lymphoblastic Leukemia: A Single-Institution Experience. Cureus. 2020;12(7):1–9. [CrossRef]
- Abdelmabood S, Elsayed A, Boujettif F, et al. Treatment outcomes of children with acute lymphoblastic leukemia in a middle-income developing country : high mortalities, early relapses, and poor survival J Pediatr (Rio J). 2018;1–9. [CrossRef]
- Kelly ME, Lu X, Devidas M, et al. Treatment of Relapsed Precursor-B Acute Lymphoblastic Leukemia with Intensive Chemotherapy: POG (Pediatric Oncology Group) Study 9411 (SIMAL 9). J Pediatr Hematol Oncol. 2013;35(7):509–13. [CrossRef]
Figure 1.
Kaplan-Meier curve according to time of relapse
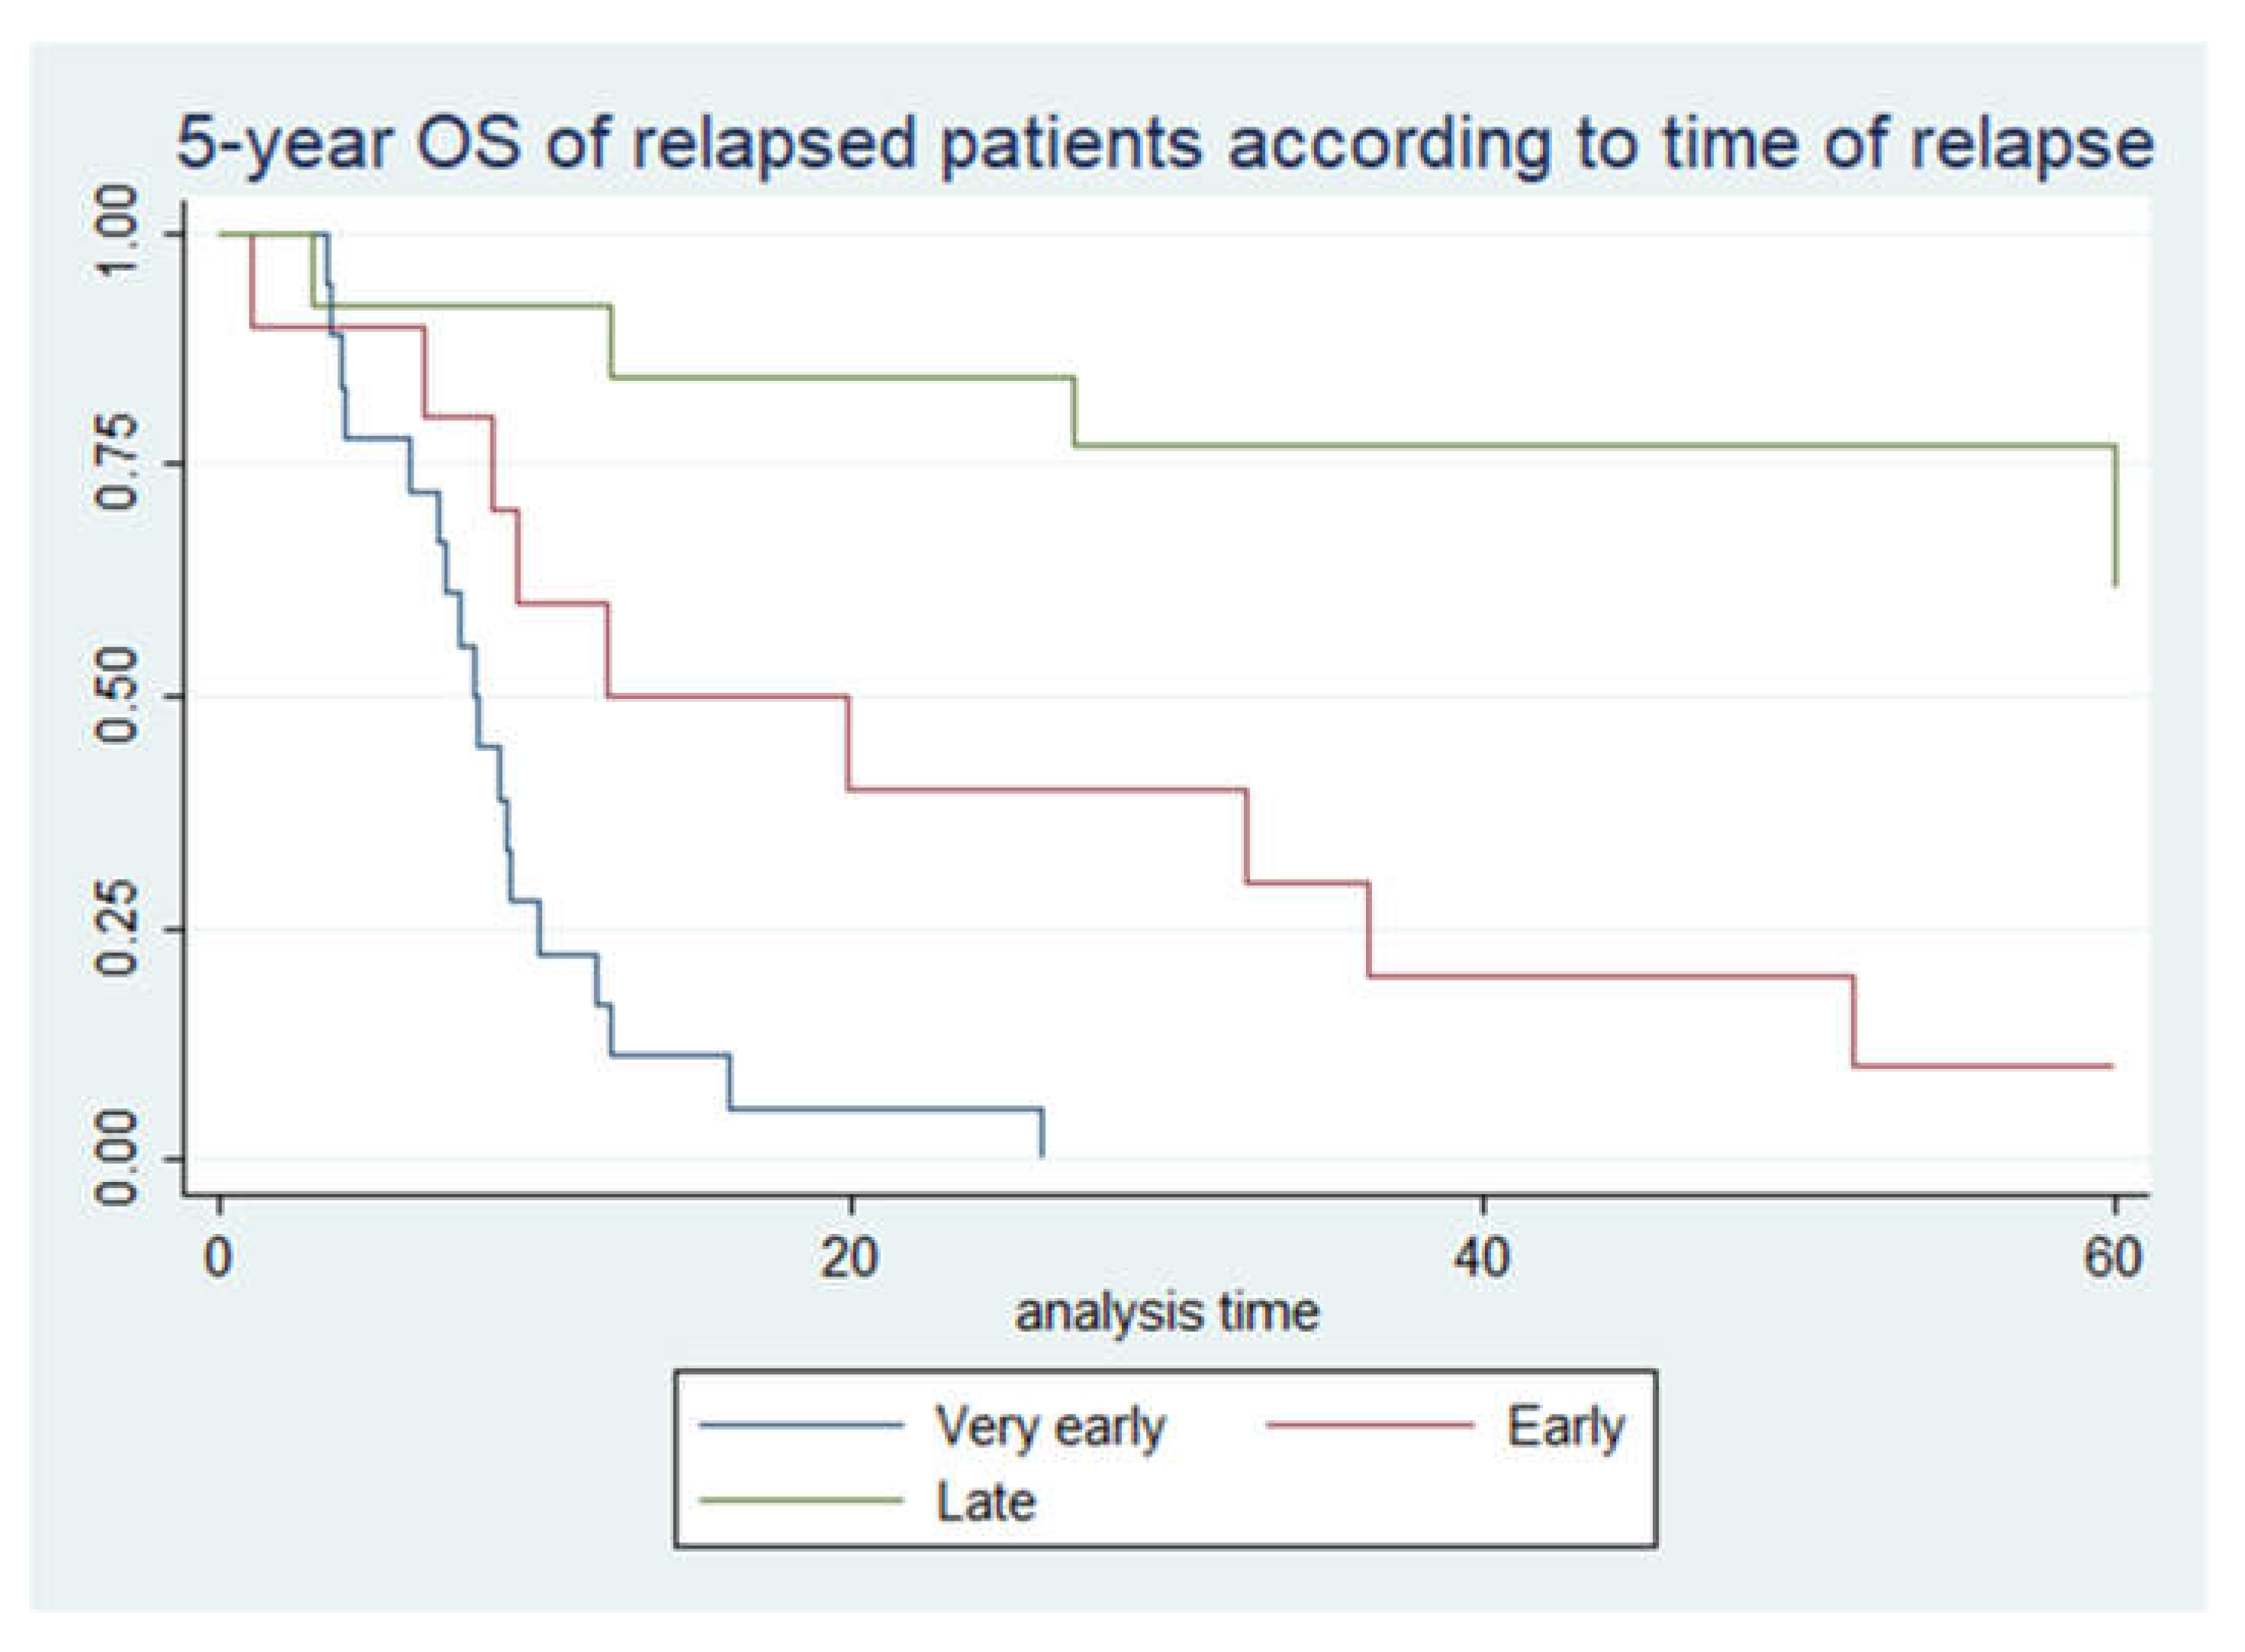
Figure 2.
Causes of death in non-relapsed patients.
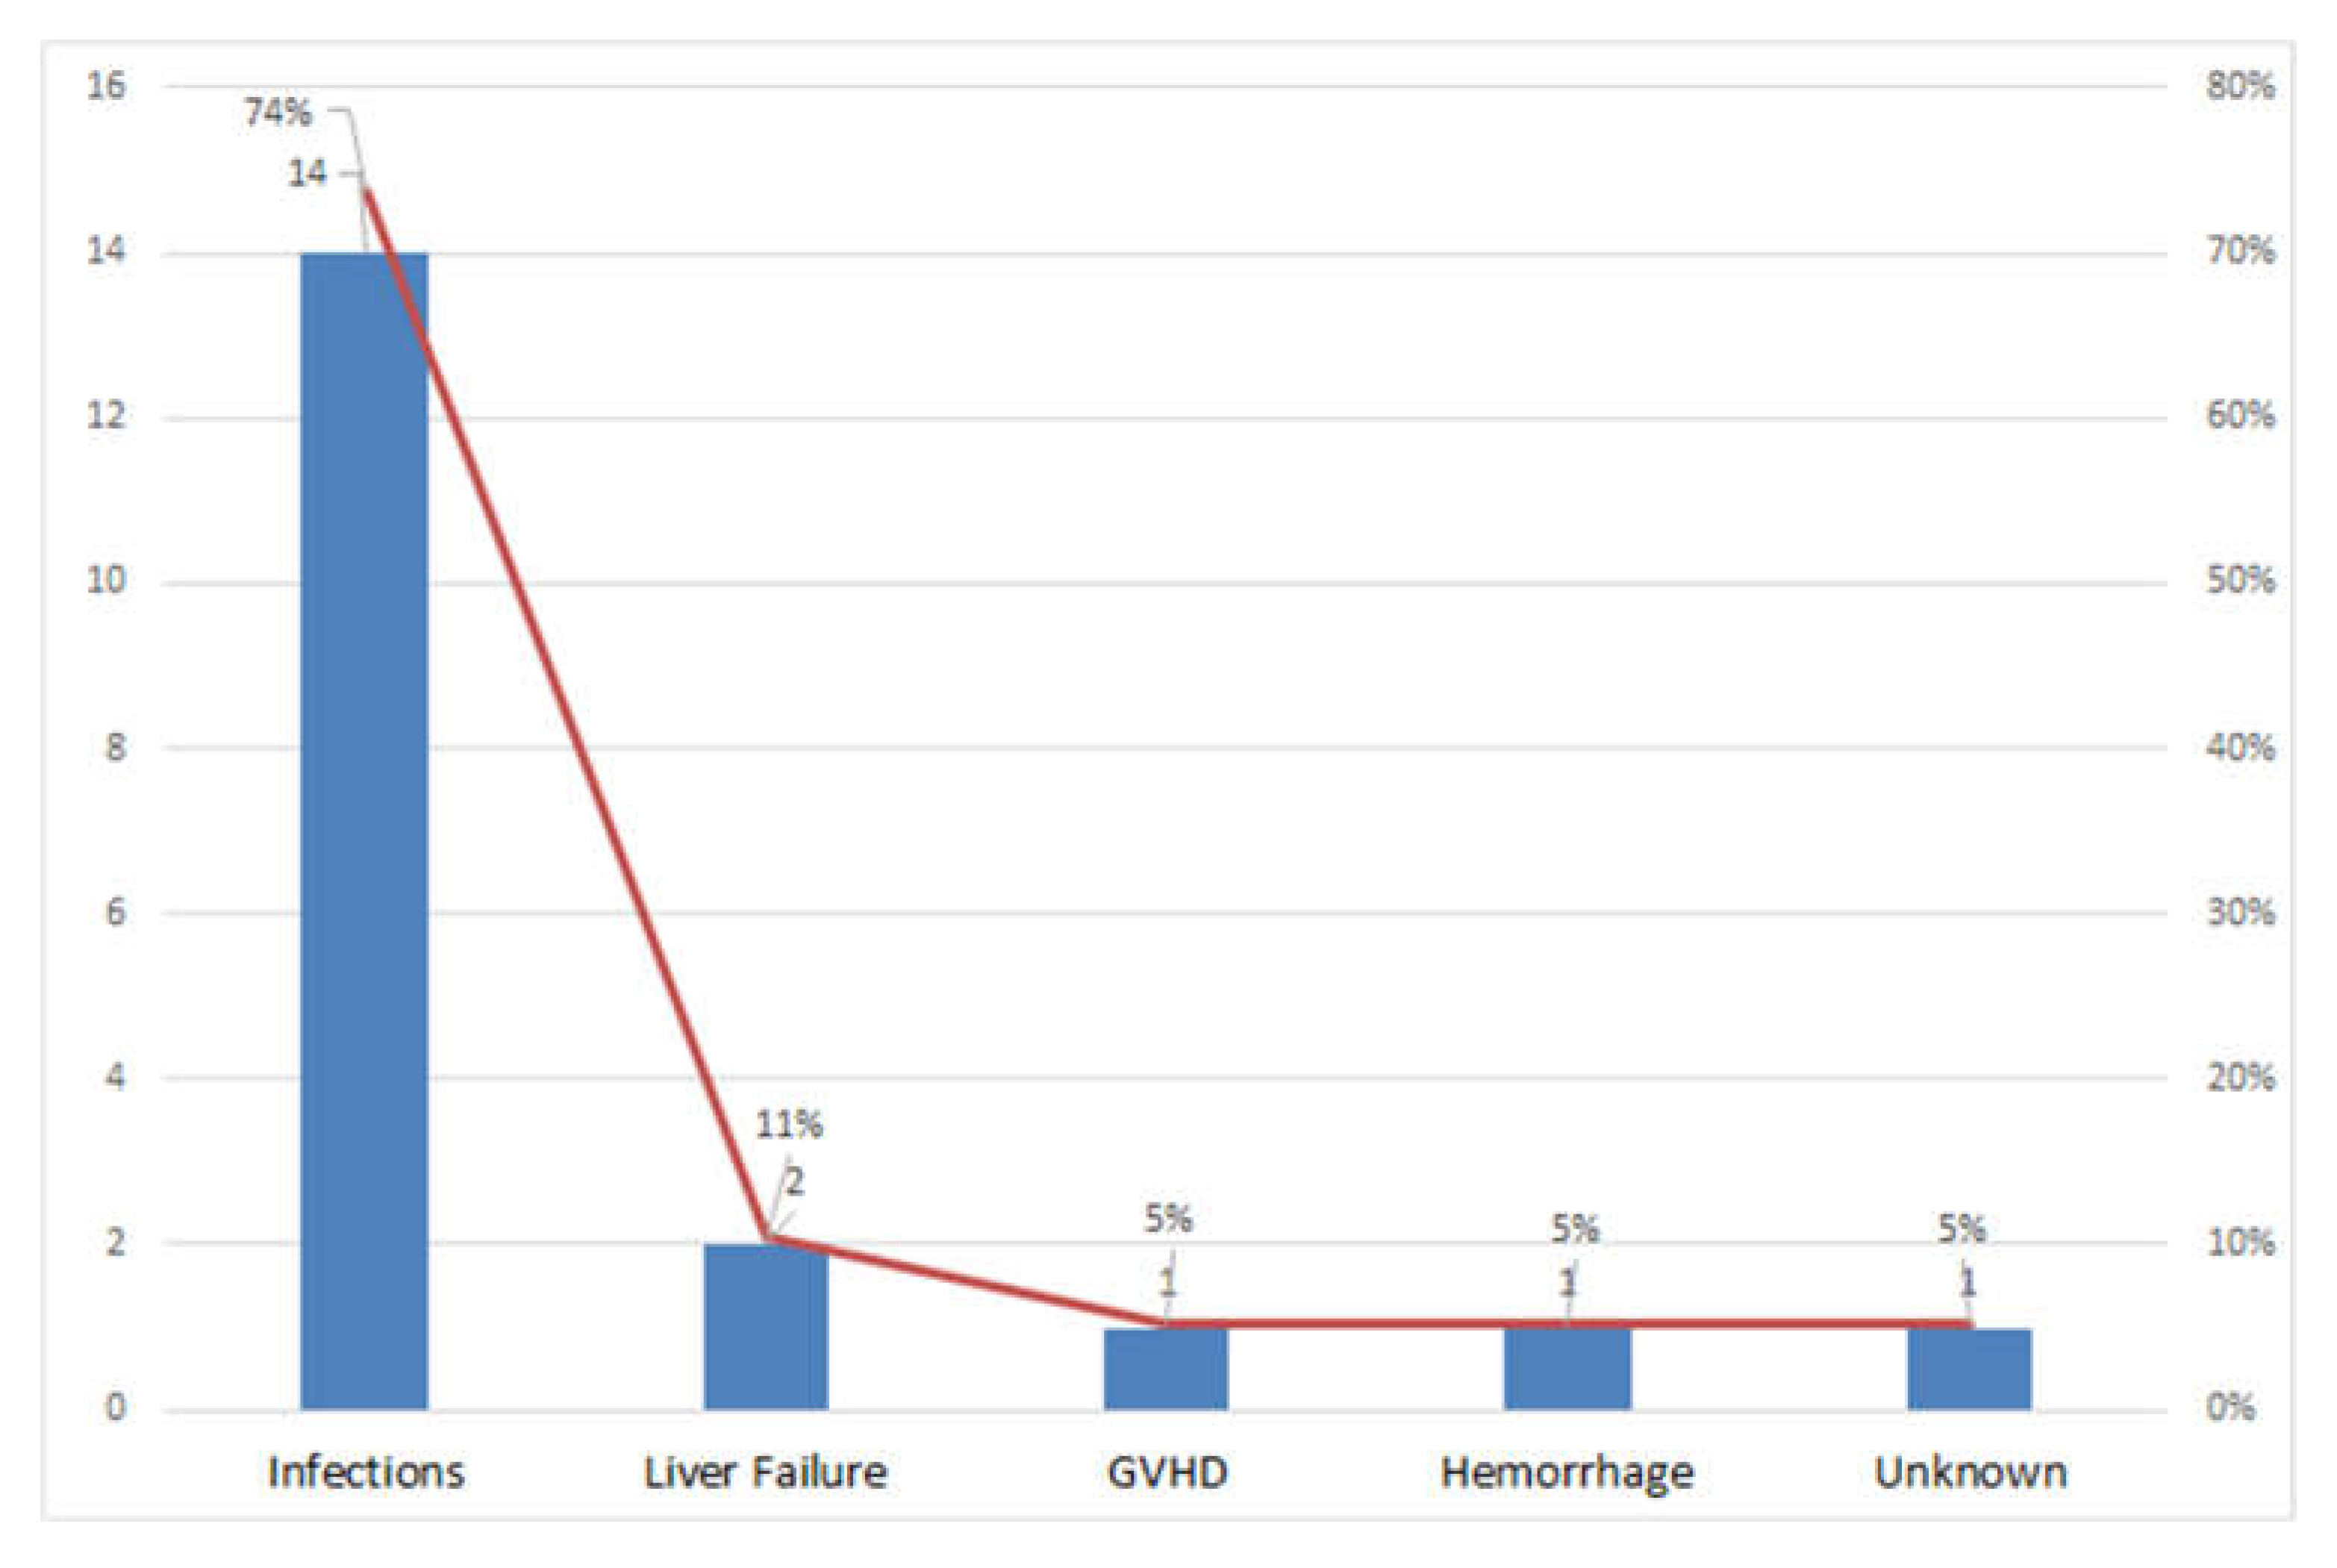
Figure 3.
Causes of death in relapsed patients.
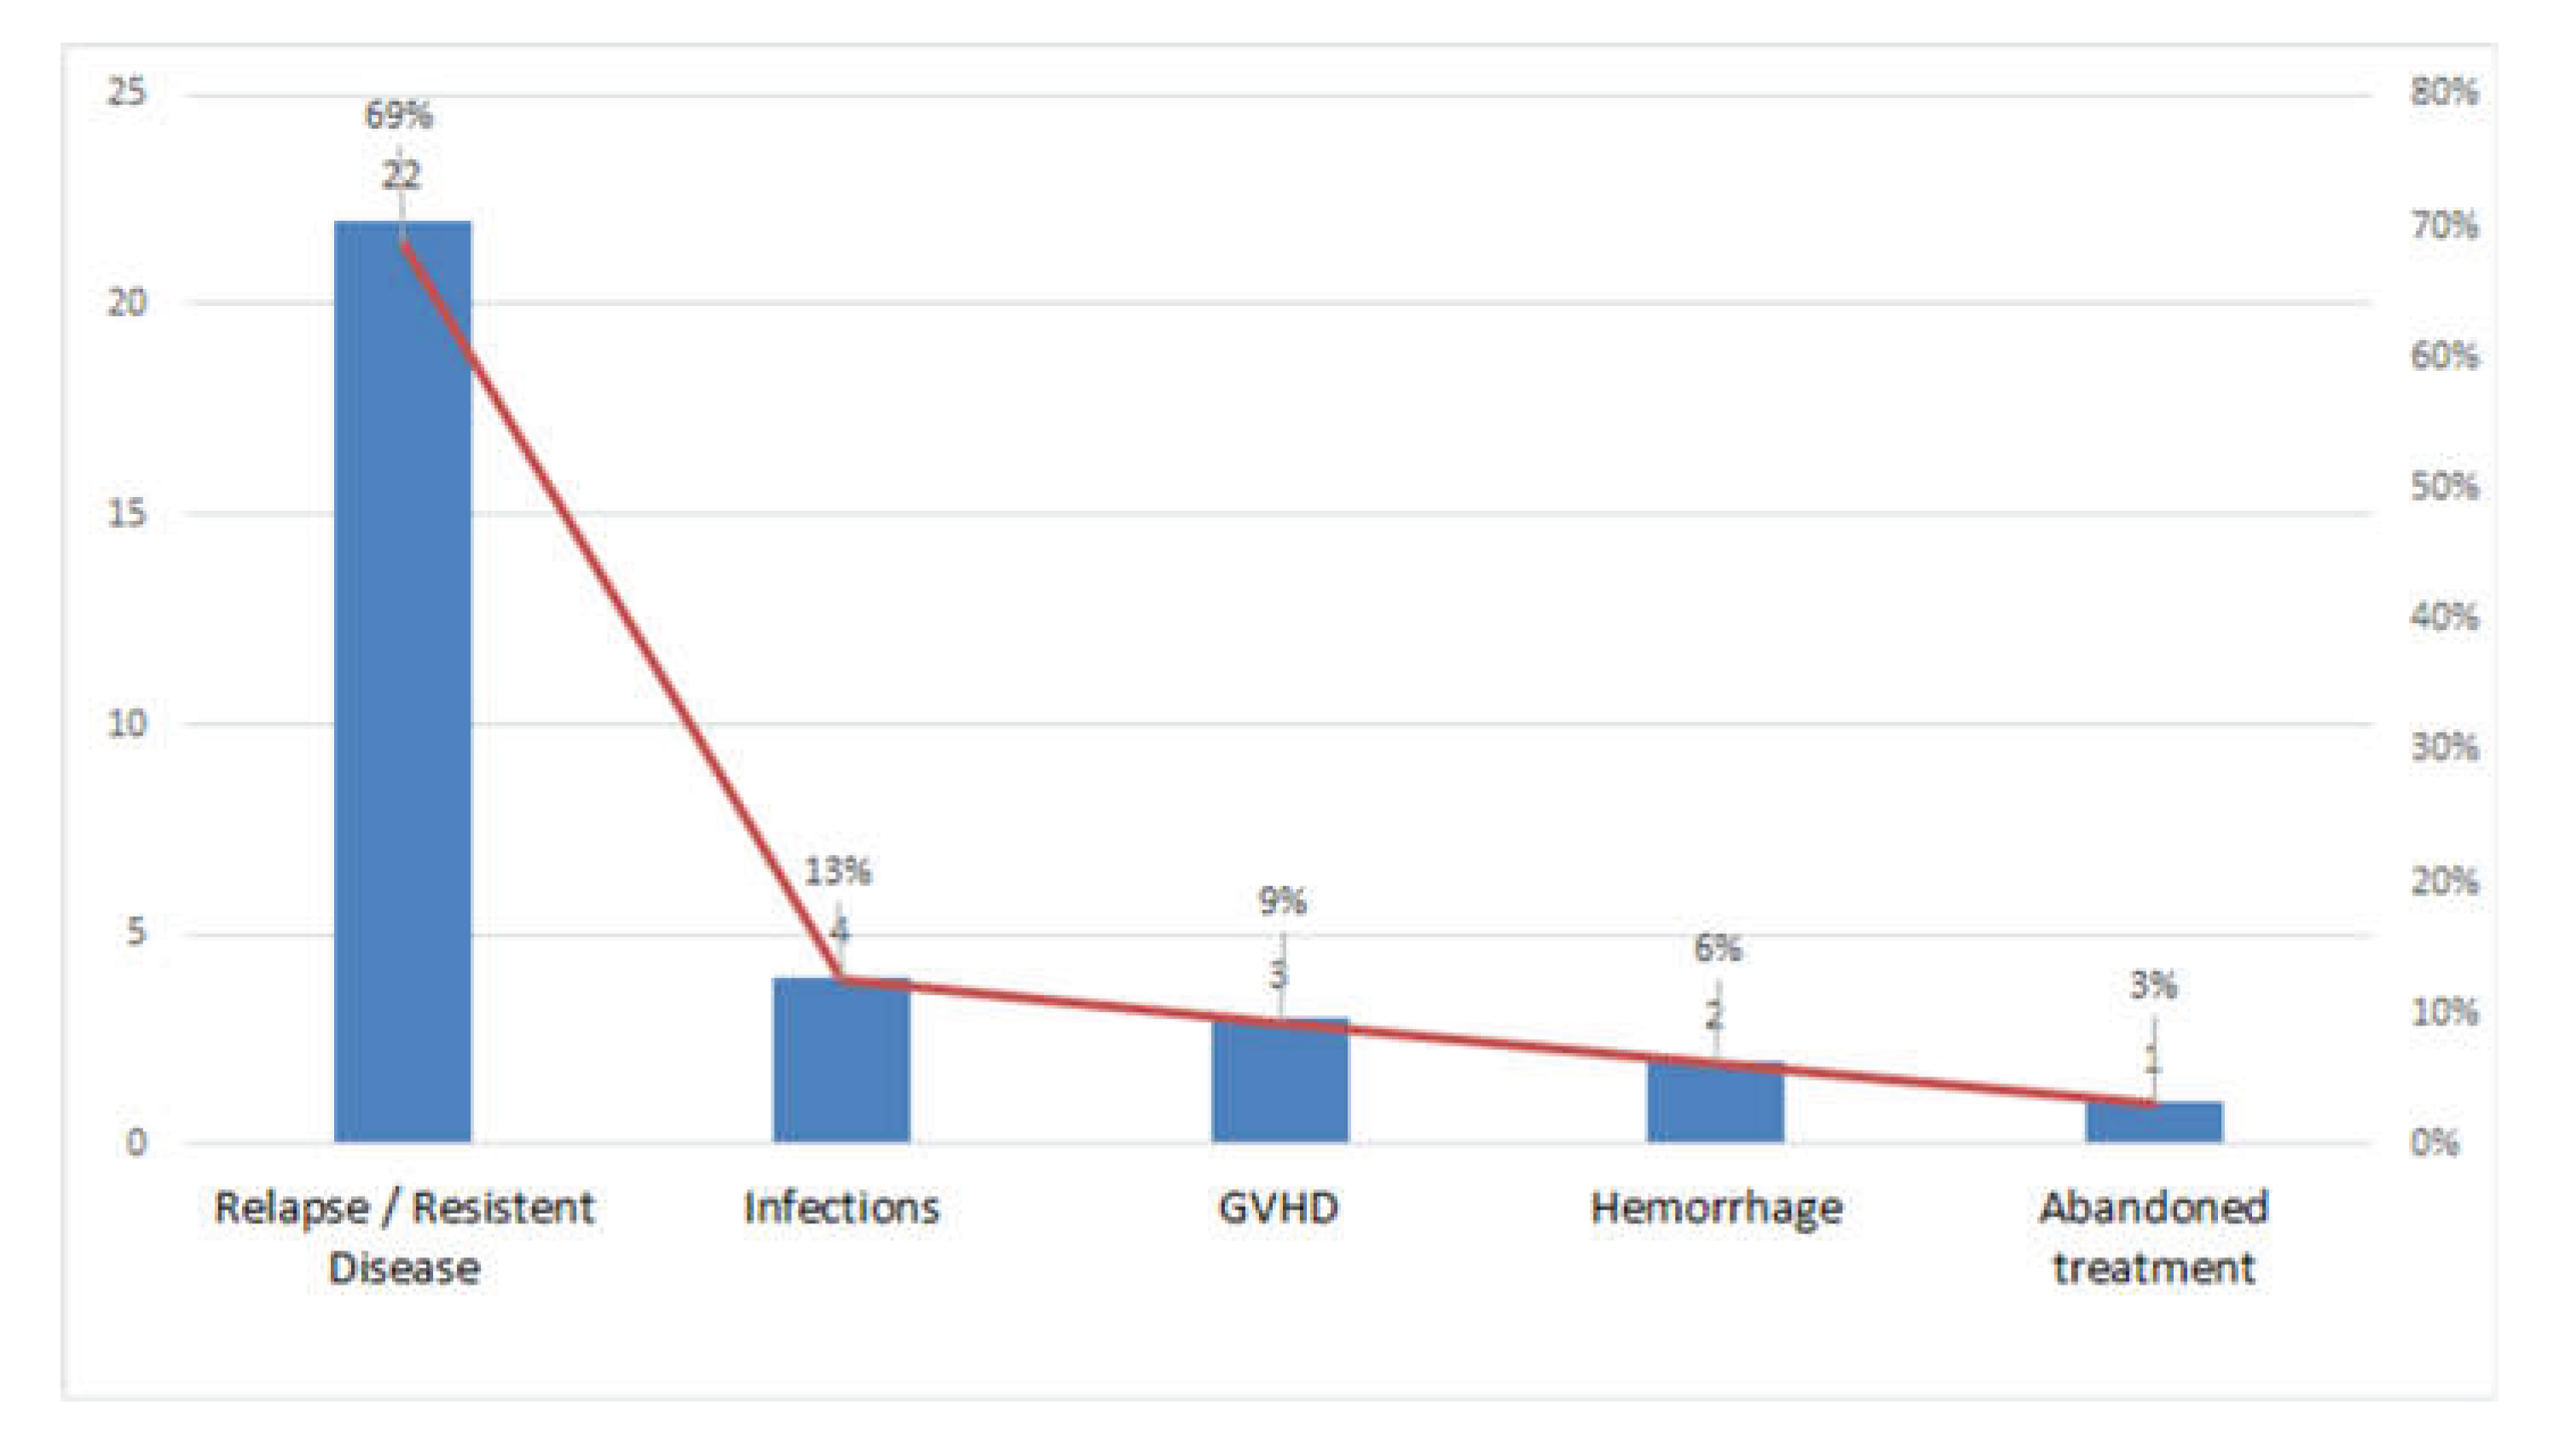

Table 1.
Characteristics of patients with acute lymphoblastic leukemia.
| Number of patients (%) | 5-year EFS (%) | 5-year OS (%) | Number of relapsed patients | Percentage of relapsed patients | 5-year OS of relapsed patients (%) | |
|---|---|---|---|---|---|---|
| in relation to overall number at the diagnosis (%) | ||||||
| Patients | 302 (100%) | 80% | 83% | 41 | 14% | 22% |
| GENDER | ||||||
| Male | 178 (59%) | 77% | 81% | 30 | 17% | 23% |
| Female | 124 (41%) | 85% | 86% | 11 | 9% | 18% |
| AGE GROUPS | ||||||
| Infants | 8 (3%) | 50% | 50% | 4 | 50% | 0% |
| 1 - 4 y. | 165 (55%) | 85% | 88% | 16 | 10% | 31% |
| 5 - 9 y. | 66 (22%) | 77% | 83% | 11 | 17% | 36% |
| 10 - 17 y. | 63 (21%) | 73% | 73% | 10 | 16% | 0% |
| IMMUNOPHENOTYPE | ||||||
| common | 181 (60%) | 82% | 86% | 22 | 12% | 27% |
| pre B | 63 (21%) | 73% | 78% | 12 | 19% | 25% |
| pro B | 5 (1%) | 60% | 60% | 2 | 40% | 0% |
| T | 53 (18%) | 83% | 83% | 5 | 10% | 0% |
| RISK GROUPS | ||||||
| SR | 69 (23%) | 87% | 96% | 4 | 6% | 25% |
| IR | 154 (51%) | 85% | 89% | 16 | 10% | 44% |
| HR | 79 (26%) | 53% | 63% | 21 | 27% | 5% |
Abbrevations: SR – standard risk, IR – intermediate risk, HR – high risk, EFS – event-free survival, OS – overall survival.
Table 2.
- Characteristics of patients with relapsed acute lymphoblastic leukemia.
| Number | Percentage | Survival | 5-year OS (%) | ||
|---|---|---|---|---|---|
|
Relapsed patients |
41 | 14% (in relation to entire cohort) | 9 | 22% | |
| TIME OF RELAPSE | |||||
| Very early | 18 | 44% | 0 | 0% | |
| Early | 10 | 24% | 1 | 10% | |
| Late | 13 | 32% | 8 | 62% | |
| SITE OF RELAPSE | |||||
| Bone marrow | 27 | 66% | 6 | 22% | |
| Isolated CNS | 1 | 2% | 1 | 100% | |
| Bone marrow + CNS | 13 | 32% | 2 | 15% | |
| TREATMENT | |||||
| Chemotherapy | 22 | 54% | 3 | 14% | |
| Chemotherapy + HSCT | 19 | 46% | 6 | 32% | |
Abbrevations: CNS – central nervous system, HSCT – hematopoetic stem cell transplantation.
Table 3.
Hazard risk of mortality associated with prognostic factors in pediatric ALL patient.
| Analysis | Univariate HR | p | Multivariate HR | p |
|---|---|---|---|---|
| INITIAL DIAGNOSIS | ||||
| Relapse | ||||
| No | 1,00 | Reference | 1,00 | Reference |
| Yes | 15,78 (8,76-28,43) | <0,05 | 13,24 (6,92-25,37) | <0,05 |
| Sex | ||||
| Male | 1,00 | Reference | 1,00 | Reference |
| Female | 0,66 (0,37-1,2) | 0,17 | 1,02 (0,54-1,91) | 0,96 |
| Age groups | ||||
| Infants | 1,00 | Reference | 1,00 | Reference |
| 1y-4y | 0,19 (0,06-0,55) | 0,002 | 1,07 (0,33-3,54) | 0,9 |
| 5y-9y | 0,24 (0,08-0,77) | 0,016 | 0,66 (0,19-2,3) | 0,52 |
| 10y-17y | 0,43 (0,14-1,28) | 0,128 | 1,03 (0,33-3,27) | 0,95 |
| Immunophenotype | ||||
| common | 1,00 | Reference | 1,00 | Reference |
| pre B | 1,72 (0,89-3,31) | 0,104 | 1,41 (0,72-2,77) | 0,32 |
| pro B | 3,6 (0,85-15,22) | 0,082 | 1,48 (0,32-6,73) | 0,61 |
| T ALL | 1,3 (0,61-2,78) | 0,502 | 1,75 (0,77-3,98) | 0,18 |
| Risk group | ||||
| SR | 1,00 | Reference | 1,00 | Reference |
| IR | 2,51 (0.73-8.64) | 0,142 | 2,18 (0,61-7,75) | 0,23 |
| HR | 11,76 (3,59-38,5) | <0,05 | 6,85 (1,87-24,9) | <0,05 |
Abbrevations: SR – standard risk, IR – intermediate risk, HR – high risk.
Table 4.
Hazard risk of mortality associated with prognostic factors in relapsed pediatric ALL patient.
Table 4.
Hazard risk of mortality associated with prognostic factors in relapsed pediatric ALL patient.
| Analysis | Univariate HR | p | Multivariate HR | p |
|---|---|---|---|---|
| AFTER RELAPSE | ||||
| Sex | ||||
| male | 1,00 | Reference | 1,00 | Reference |
| female | 1,02 (0,47-2,2) | 0,95 | 1,06 (0,44-2,57) | 0,897 |
| Age groups | ||||
| infants | 1,00 | Reference | 1,00 | Reference |
| 1y-4y | 0,14 (0,04-0,5) | <0,05 | 0,36 (0,05-2,78) | 0,33 |
| 5y-9y | 0,14 (0,03-0,52) | <0,05 | 0,81 (0,14-4,69) | 0,81 |
| 10y-17y | 0,29 (0,08-1,03) | 0,055 | 0,72 (0,14-3,59) | 0,69 |
| Immunophenotype | ||||
| common | 1,00 | Reference | 1,00 | Reference |
| pre B | 1,96 (0,87-4,4) | 0,102 | 2,16 (0,66-7,1) | 0,21 |
| pro B | 23,56 (3,74-148,2) | <0,05 | 7,17 (0,76-67,76) | 0,086 |
| T ALL | 9,1 (2,77-29,9) | <0,05 | 2,87 (0,49-16,84) | 0,24 |
| Risk group | ||||
| Standard risk | 1,00 | Reference | 1,00 | Reference |
| Intermediate risk | 0,95 (0,26-3,5) | 0,94 | 3,08 (0,44-21,69) | 0,26 |
| High risk | 3,57 (1,04-12,27) | 0,043 | 14,18 (1,2-167,4) | 0,035 |
| Time of relapse | ||||
| very early | 1,00 | Reference | 1,00 | Reference |
| early | 0,1 (0,03-0,32) | <0,05 | 0,22 (0,03-1,55) | 0,129 |
| late | 0,02 (0,004-0,08) | <0,05 | 0,008 (0,001-0,06) | <0,05 |
| Site of relapse | ||||
| Bone marrow | 1,00 | Reference | 1,00 | Reference |
| Isolated CNS | / | / | / | / |
| Bone marrow + CNS | 1,05 (0,5-2,2) | 0,9 | 2,27 (0,6-8,4) | 0,22 |
| Chemo/HSCT | ||||
| Chemotherapy + HSCT | 1,00 | Reference | 1,00 | Reference |
| Chemotherapy | 1,01 (0,5-2,02) | 0,982 | 1,54 (0,64-3,74) | 0,34 |
Abbreviations: CNS = central nervous system; HSCT = hematopoietic stem cell transplantation.
Disclaimer/Publisher’s Note: The statements, opinions and data contained in all publications are solely those of the individual author(s) and contributor(s) and not of MDPI and/or the editor(s). MDPI and/or the editor(s) disclaim responsibility for any injury to people or property resulting from any ideas, methods, instructions or products referred to in the content. |
© 2025 by the authors. Licensee MDPI, Basel, Switzerland. This article is an open access article distributed under the terms and conditions of the Creative Commons Attribution (CC BY) license (http://creativecommons.org/licenses/by/4.0/).
Copyright: This open access article is published under a Creative Commons CC BY 4.0 license, which permit the free download, distribution, and reuse, provided that the author and preprint are cited in any reuse.


