
Submitted:
29 April 2025
Posted:
30 April 2025
You are already at the latest version
Abstract
Background and Objectives: Due to progress made in all areas of research, pediatric patients diagnosed with acute lymphoblastic leukemia (ALL) now have an average overall survival rate of 90%. There are still discrepancies between high-income countries and limited-resource centers. The aim of this study was to analyze prognostic factors and outcome parameters in a 223-patient cohort from one center in Romania, treated with two adapted BFM protocols. Materials and Methods: Patients enrolled were diagnosed with ALL in our center from 01.2016 to 12.2022 and followed up until 12.2024. They were treated according to ALL IC BFM 2009 protocol until 06.2019 and based on ALL AIEOP BFM 2017 protocol since 07.2019. Prognostic factors were analyzed in both subgroups and outcomes were measured: event-free survival (EFS), overall survival (OS), cumulative incidence of relapse (CIR), relapse-free survival (RFS) and non-relapse mortality (NRM). Results: Comparing the two subgroups, every parameter has improved over time: complete remission after induction (87.75% vs 80.7%), early-deaths (3.92% vs 5.78%), deaths in remission (4.08% vs 5.26%), 5-year EFS (73.79% vs 70.22%), 5-year CIR (18.36% vs 19.04%), 5-year RFS (81.76% vs 80.97%), 5-year NRM (7.85% vs 10.77%), and 5-year OS (88.18% vs 82.54%). While for standard-risk group events such as relapse or death were isolated, and for intermediate-risk patients they were limited to a small number and did not influence meaningfully the overall outcomes, for high-risk children the results improved noteworthy between the two subgroups. Patients with BCR::ABL1, teenagers, T-ALL had worse outcomes compared to ETV6::RUNX1, smaller children and B-ALL, respectively. Conclusions: The 5-year OS increased in our center from 82.54% to almost 90%, with the most substantial finding being the survival rate for high-risk patients, now reaching up to 80%. The prognostic factors were age at diagnostic, genetic characteristics and response to treatment, especially prednisone sensibility.
Keywords:
acute lymphoblastic leukemia
; pediatric patients
; ALL IC BFM
; survival rates
1. Introduction
Acute lymphoblastic leukemia (ALL) is the most frequent oncological pathology in childhood, and it has been largely studied, therefore in the past decades we can talk about a true success story regarding survival rates. After implementing multiple agent therapy and refining prognostic factors, the children benefit from overall survival rate of 90% [1]. Berlin-Frankfurt-Münster (BFM) group develops treatment protocols for ALL patients, which are being used worldwide. The ALL IC BFM subgroup includes resource-limited centers [2] and this specific treatment strategy has been used in Romania over the past decade.
The national average incidence of ALL is 100 new cases/year, and Fundeni Clinical Institute (FCI) is responsible for diagnosing almost 40% of them, according to Romanian Cancer Registry for Children with Oncological Disease. The 2024 report from aforementioned registry showed an improvement in nationwide overall survival at 1, 3 and 5 years, comparing 2010-2013 and 2014-2017 cohorts: 85%, 76% and 74% versus 90%, 82% and 80% [3].
The aim of this study was to analyze the survival of children with ALL, focusing on front-line therapy. The primary objective was comparing two therapeutic strategies based on BFM protocols, by assessing outcome parameters: event-free survival (EFS), overall survival (OS), cumulative incidence of relapse (CIR), relapse-free survival (RFS), and non-relapse mortality (NRM). The secondary objective was evaluating prognostic factors and identifying the ones which impacted survival.
2. Materials and Methods
We performed a retrospective analysis for children diagnosed with ALL in FCI, between January 2016 and December 2022, with a follow-up period until December 2024. All consecutive newly diagnosed patients (pts) 0–18-year-old were enrolled, cases with L3 or mixed lineage phenotype were excluded. Patients lost to follow-up due to emigration to other countries at any point during first-line treatment were discontinued.
At diagnosis and at every subsequent admission in the ward or day hospital, patients’ legal guardian signed informed consent forms for diagnosis and treatment procedures, and for participating in medical scientific activity, respectively.
2.1. Specific Diagnostic and Monitoring Procedures
All pts were diagnosed using peripheric and bone marrow morphology, flowcytometry (FCM), conventional cytogenetic procedures with GTG banding, fluorescent-in-situ-hybridization and molecular biology via polymerase-chain-reaction methods for the most common anomalies: BCR::ABL1, TCF3::PBX1, SIL::TAL1, KMT2A::AFF1, ETV6::RUNX1, FLT3-ITD duplication and KMT2A::MLLT3.
In order to clarify the genetic background of the pts, we used two ways of conveying diagnostic information: ”Genetics_x” gathered all different chromosomal or molecular abnormalities, while ”Genetics_y” divided pts into four categories: ”adverse prognosis” (when hypodiploidy, BCR::ABL1 or KMT2A were found), ”favorable prognosis” (for ETV6::RUNX1 and hyperdiploidy), ”other” (if we were able to identify certain mutations, but they did not impact stratification), and ”none” (used for pts in which we could not find any aberrations via classical methods, described previously.
Monitoring measurable residual disease (MRD) was done using FCM in all pts on day 15 (D15), day 33 (D33, TP1) and day 78 (D78, TP2), using an eight-color panel and achieving a sensitivity level of 10-4 and recommendations from EuroFlow were abided by. Positive MRD was defined as the presence of at least 50 clustered events exhibiting lymphoid-scattering properties and leukemia-associated immunophenotypic features noted at diagnosis.
Prednisone response was assessed on day 8 by morphological analysis of peripheral blood smears, defining prednisone-good-responders (PGR) and prednisone-poor-responders (PPR), accordingly. Complete remission (CR) by end of induction (EOI) was established through morphology and FCM (MRD level of <0.05x10⁻⁴). Relapse was noted via classical parameters: reoccurrence of blasts in medullary or extramedullary sites. Early mortality rate was defined for pts who died before EOI, mortality rate after achieving CR was applied to children that passed due to relapses or treatment-related causes (NRM). EFS was the time elapsed from diagnosis to an event, defined by relapse or death, while OS was the total period from diagnosis to death or the end of study, 31st December 2024.
2.2. Treatment Protocols
Therapy strategy was based on BFM protocols, following the standard arms, without randomizing pts, conveying a uniform management of our cohort. Patients were stratified into standard-risk group (SRG), intermediate-risk group (IRG) and high-risk group (HRG). BCR::ABL1 positive pts received tyrosine-kinase inhibitors, added to standard chemotherapy. There were a few adjustments to protocol in all children: intravenous dexamethasone used in induction, after a week of oral prednisone, no prophylactic use of irradiation therapy, and monthly mini-inductions with 5-days dexamethasone and single vincristine dose for T-cell ALL and high-risk patients during maintenance, respectively.
The cohort was divided into two subgroups, namely T1-cohort, from January 2016 to June 2019, and T2-cohort, between July 2019 and December 2022.
1) T1 pts were treated according to ALL IC BFM 2009 protocol. The stratification criteria for T1: HRG had PPR or BCR::ABL1 or KMT2A::AFF1 or hypodiploidy ≤44 chromosomes or D15 FCM-MRD ≥10% or no CR by TP1, SRG had age >1 and <6 years, and leukocyte count at diagnosis <20×109/L and PGR and D15 FCM-MRD <0.1% and CR on TP1, IRG were the remaining patients.
2) For T2, the treatment plan was based on ALL AIEOP BFM 2017 protocol: HRG had PPR only in T-cell ALL or BCR::ABL1 or KMT2A::AFF1 or hypodiploidy ≤44 chromosomes or D15 FCM-MRD ≥10% or TP1 FCM-MRD ≥5x10⁻⁴, SRG D15 FCM-MRD <0.1% and negative FCM-MRD on TP1, IRG were the remaining patients.
Regarding treatment differences, in T1 native E Coli asparaginase was used during induction, high-risk blocks and reinduction, compared to T2 in which pegylated formulation was available up-front. Considering methotrexate dosage in consolidation for non-HRG B-cell ALL pts, in T1 2g/m2 was administered, in T2 pts received 5g/m2.
2.3. Statistical Analysis
Data analysis was conducted using Python version 3.12 with the following libraries employed: Pandas for data management and preprocessing, NumPy for numerical computations and data manipulation, SciPy for statistical analysis including normality assessments and hypothesis testing, Lifelines for survival analyses such as Kaplan–Meier estimations, log-rank testing, and Cox proportional hazards modeling, Matplotlib for generating graphical representations, including survival curves and other visualizations, and ForestPlot for creating forest plots to visualize hazard ratios and confidence intervals. Categorical variables were expressed as absolute counts and percentages. Comparisons between groups were conducted using Pearson’s chi-square test or Fisher’s exact test, as appropriate. The normality of the distribution was assessed using the Shapiro-Wilk test and visualization of histograms. Normally distributed variables were reported as mean ± standard deviation, while non-normally distributed variables were reported as medians with interquartile ranges (quartile 1, quartile 3). Differences between two normally distributed groups were evaluated using the t-test, while differences between two non-normally distributed groups were assessed with the Mann–Whitney–Wilcoxon test. Kaplan–Meier curves were generated and analyzed for OS, EFS and RFS, and compared with the log-rank test. CIR and NRM were assessed using the Aalen-Johnson model, accounting for competing risks. Univariate survival analysis was conducted using a univariate Cox proportional hazards model. Variables with a p-value below 0.1 in the univariate Cox proportional hazards model were included in the multivariate Cox proportional hazards model. In cases where both Genetics_x and Genetics_y met the p-value threshold, Genetics_y was prioritized to avoid potential convergence issues in the Cox analysis. Multicollinearity was assessed based on the variance inflation factor or whether the variable was already included in another collected scoring system. In instances where no events occurred in one of the selected groups, rendering the Cox proportional hazards model unsuitable, the log-rank test was employed to calculate a p-value. Statistical significance was defined as a p-value lower than 0.05.
3. Results
A total number of 223 pts met inclusion/ exclusion/ discontinuation criteria and were enrolled in the study. In the following table (Table 1) we presented general characteristics of the entire cohort, specifically demographic and diagnostic parameters at onset, but also of the two subgroups, represented by T1 (121 pts) and T2 (102 pts).
Overall, there was a slight male predominance in both groups, with 58.68% in T1 and 59.80% in T1. Most pts were between 1 and 10 years old, representing 68.60% of the first treatment group and 67.65% of the second. As expected, the predominant immunophenotype was B-cell lineage, observed in 87.60% of patients in T1 and 88.24% in T2. Genetic features (Genetics_x and Genetics_y) showed no statistically significant differences between the two treatment groups.
Considering the different aspects of stratifying pts based on risk groups, in T1 there were 15 pts (12.39%) SRG, 66 pts (54.54%) IRG, 36 pts (29.75%) HRG and 4 pts (3.3%) not included in any category, due to death EOI and no prior HRG-characteristics; in T2 the distribution was 21 pts (20.58%) SRG, 45 pts (44.11%) IRG, 33 pts (32.35%) HRG and 3 pts (2.94%) not included in any category.
Analyzing parameters regarding outcome, the rate of CR at EOI was 80.7% in T1, and 87.75% in T2, death-before-EOI rate was 5.78% in T1 and 3.92% in T2, death-in-CR rate was 5.26% in T1 and 4.08% in T2, the CIR was 19.04% in T1 and 18.36% in T2. Regarding mortality causes for pts achieving CR, we mention severe sepsis and post hematopoietic stem cell transplantation (HSCT) toxicities.
Out of 223 pts, 9 of them underwent HSCT in first CR according to BFM indications, 2 pts from T1 (1 transitioned to adult care and was lost to follow-up and 1 died due to post-HSCT toxicities), and 7 pts from T2 group (6/7 remained in first CR, only 1/7 experienced a post-HSCT relapse and eventually succumbed to the disease). A total of 13 pts received HSCT in ≥2nd CR, 9 from T1 (4/9 are in CR, 2/9 died due to post-HSCT toxicities and 3/9 died due to disease progression) and 4 from T2 (3/4 are in CR, only 1 died because of severe toxicity).
It is worth mentioning that the median follow-up duration for T1 pts was 88.83 months, and 46.72 months for those in the T2 group.
Figure 1a presents the results of the univariate Cox regression analysis for EFS. Several factors demonstrated significant associations with EFS: age, genetic factors, prednisone response, FCM MRD on D15 and D33. Figure 1b presents the results of the multivariate Cox proportional hazards regression analysis for EFS. While MRD levels on D15 (HR = 0.77, 95% CI: 0.36–1.69, p = 0.52) and D33 (HR = 1.42, 95% CI: 0.62–3.29, p = 0.40) did not maintain statistical significance, adverse genetic prognosis (HR = 2.96, 95% CI: 1.37–6.42, p = 0.005), poor prednisone response (HR = 2.43, 95% CI: 1.23–4.82, p = 0.01), and age (HR = 1.07, 95% CI: 1.01–1.13, p = 0.02) retained their significant association with EFS.
In the univariate analysis of OS for the entire cohort (Figure 2a), several factors were identified as potential prognostic indicators. Increasing age (HR 1.10, 95% CI 1.03-1.18, p = 0.003, Wald) and prednisone poor response (HR 3.86, 95% CI 1.93-7.70, p < 0.001, Wald) were significantly associated with an increased risk of death. Among genetic factors, the presence of BCR::ABL1 (HR 4.09, 95% CI 1.50-11.14, p = 0.006, Wald) was associated with significantly worse OS. In Genetics_y, the adverse prognosis category (HR 2.85, 95% CI 1.05-7.75, p = 0.040, Wald) was associated with a higher risk of mortality, while a favorable prognosis was borderline significant (HR 0.39, 95% CI 0.13-1.17, p = 0.094, Wald), and is further included in the multivariate analysis. Day 33 MRD assessment by FCM ≥ 0.05% was significantly associated with a worse prognosis (HR 2.02, 95% CI 0.92-4.44, p = 0.081, Wald). However, MRD levels at D15 and D78, as well as other genetic abnormalities, immunophenotype, treatment, and gender did not show significant associations with OS. In the multivariate Cox regression analysis of OS (Figure 2b), several factors were found to significantly influence survival outcomes. Age (HR 1.09, 95% CI 1.02–1.16, p = 0.014) was significantly associated with an increased risk of mortality, with each year increase in age corresponding to a higher risk of death. Poor prednisone response (PPR; HR 2.25, 95% CI 1.08–4.72, p = 0.031) was also significantly associated with worse survival. However, Day 33 FCM-MRD did not maintain statistical significance in the multivariate model (HR 0.74, 9 CI 0.32–1.70, p = 0.473). Genetic factors were not significantly associated with OS in this multivariate analysis.
Considering outcome parameters, we compared the three risk-group pts in both cohorts (T1 vs T2). The most statistically significant results were for HRG pts, with improvements in all contexts: 5-year EFS from 44.44% in T1 to 72.73% in T2 (Figure 3), 5-year OS from 60.14% in T1 to 78.79% in T2 (Figure 4), 5-year CIR from 30.56% in T1 to 18.18% in T2 (Figure 5), 5-year RFS from 69.44% in T1 to 81.82% in T2 (Figure 6), and 5-year NRM from 25.37% in T1 to 9.09% in T2 (Figure 7).
4. Discussion
Analyzing the entire cohort, there was a slight male predominance (59.2%), most pts were between 1 and 10 years old (68.16%) with only 2 pts bellow the age of one, and the main immunophenotype was B-cell lineage (87.89%). These findings are consistent with international papers on large cohorts [2,4,5]. The most frequent genetic feature was ETV6::RUNX1 (18.83%), followed by hyperdiploidy (10.31%) and TCF3::PBX1 (5.38%); less common mutations were BCR::ABL1 (4.47%), KMT2A rearrangements (1.34%) and SIL:TAL1 (0.89%); the incidence of Down syndrome was 1.34% and there were no pts with hypodiploidy. While in almost 48% pts no genetic abnormalities were found, either due to normal karyotype, or to the absence of metaphases, the remaining 9.41% uncovered several cytogenetic lesions, but not important to risk group stratification.
EFS was 87.9% (CI 82.33-91.15%) at 1 year, 79.6% (CI 73.69-84.38%) at 3 years, and 73.7% (CI 66.90-79.37%) at 5 years. OS was 91.9% (CI 86.94-94.47%) at 1 year, 85.5% (CI 80.14-89.53%) at 3 years, and 84.9% (CI 79.46-89.06%) at 5 years. The overall results of your study were higher than reports from middle-income countries on large cohorts: 65% EFS and 71.9% OS at 5 years from Brazilian groups [6], 3-year EFS of 71% and OS of 79.6% in other centers from Latin America [7], 5-year estimated survival rate in Armenia of 75% [8] or 3-year EFS of 52% and OS of 58% in India [9]. On the other hand, high-income countries still exceed with a 5-year OS of 89% in England, 91% in the Netherlands, and 94% in the United States of America [6].
For univariate Cox regression analysis, we considered diagnostic parameters, such as gender, age, immunophenotype, both specific genetic characteristics and known genetic prognosis impact, and treatment response, represented by prednisone sensibility and MRD by FCM assessments on D15, D33 and D78. The risk groups were not included in the uni- and multivariate analysis considering they are assigned in dependence on other factors included. The results of the univariate Cox regression analysis for EFS showed significant associations with the patient’s genetic profile at diagnosis, prednisone response, D15 and D33 FCM-MRD (D78 FCM-MRD did not show statistical significance, but there was a very small number for pts with positive values at TP2). In the multivariate Cox, only age, poor genetic traits and prednisone response retained noteworthy correlations. In the univariate analysis of OS, several factors were identified as potential prognostic indicators: age, genetic aspects at unset of the disease, prednisone response and D33 FCM-MRD. In the multivariate Cox regression, though, the only factors which maintained their independence factor in our cohort where age at diagnosis and blast clearance after one week of oral prednisone. Referring to genetic abnormalities discovered at diagnosis, it must be noted that between favorable and adverse prognostic factors, ETV6::RUNX1 and BCR::ABL1 fusion genes were, respectively, at opposite spectrum for influencing children’s outcomes, as mentioned in other studies [9,10,11].
Our results are congruent with other international reports [4,5,12]. The fact that age and prednisone response are still important independent predictors for EFS and OS in children with ALL, raises the question if their exclusion from the latest stratification criteria is warranted. It remains unclear why MRD assessment did not preserve an independent statistical significance for our cohort, the hypothesis being that treatment response is already influenced by patient’s characteristics, such as age and chromosomal and molecular abnormalities, as commented in previous papers [13,14,15,16].
Even though immunophenotype was not a statistical predictor for outcome in our cohort, it is worth mentioning that T-ALL pts were only 12%. Even though p-value was consistently higher than 0.05, all prognostic parameters at 5 years (EFS, OS, NRM, CIR, RFS) were diminished in T-ALL children compared to B-ALL pts: 64.51% vs 75.08, 77.29% vs 85.98%, 14.98% vs 8.68%, 20.68% vs 16.24% and 79.86% vs 83.78%, respectively. The reasons for these findings are probably the undefined genetic stratification criteria and the higher prevalence of T-ALL in adolescences [17], who are prone to worse outcomes on the count of different leukemic pathology, poor tolerance to chemotherapy, and even suboptimal adherence to therapy [18,19].
The 223-patient cohort was divided into two subgroups, based on the period of diagnosis and the treatment protocol used, implicitly: in the first group (T1) 121 pts were included, and in the second one (T2) there were 102 pts. To simplify the comparison between the two subgroups, quality assessment parameters are presented in Table 2. Regarding the differences encountered in risk group stratifications, they are easily explained by the changes in criteria: prednisone response was maintained only for T-ALL pts, and the number of leukocytes and age at diagnosis were removed from classification in ALL AIEOP BFM 2017 protocol, compared to ALL IC BFM 2009 strategy.
Considering that official results for ALL IC BFM 2009 protocol were published in 2023 [2], we were able to compare the outcomes of our 121 pts from T1 group with the 6187 pts from the cited study. It is important to mention that our pts followed the standard arm of the protocol, without randomization at any point during treatment. Looking at the 5-year global results, the OS is almost identical (82.54% vs 82.6%), but the EFS is better in the international paper (75.2% vs 70.22%). An explanation for the 5% difference could be the higher incidence in our cohort both for pts 10-18-years-old (31.4% vs 23.9%), and for pts with BCR::ABL1 (5.79% vs 2%), both categories being known for a higher incidence of relapse and worse outcome overall.
The percentages for the three risk groups were slightly different in our analysis (SRG 12.39% vs 10%, IRG 54.54% vs 66.5%, and HRG 29.75% vs 23.5%). Regarding outcomes, for the first two groups, SRG and IRG, there were no discrepancies between the two cohorts, in terms of EFS and OS. However, the results were not encouraging in our cohort for HRG pts, with an EFS of 44.44% vs 60.8%, and an OS of 60.14% vs 68.4%. Other parameters did not differ significantly (survival in B-ALL vs T-ALL, death in CR and relapse rates), except for early-deaths in induction (5.78% vs 1.7%).
We proceeded to compare the results from two periods of time: 2016-2019 and 2019-2022. As depicted in Table 2, although there was not a statistically significant difference for any of these results (EFS p=0.24, CIR p=0.24, OS p=0.335, NRM p=0.483, RFS p=0.321), the improvement in outcomes for children with ALL is evident looking at the aforementioned values. Moreover, the previous Romanian reported 5-year OS was 74% for the 2010-2013 cohort, and 80% for the 2014-2017 cohort [3].
While for SRG pts events such as relapse or death were isolated, and for IRG pts they were limited to a small number and did not influence meaningfully the overall outcomes, for HRG pts the results drastically changed between the two subgroups. There was an important increase in 5-year EFS from 44.44% to 72.73% (p<0.001), in 5-year OS from 60.14% to 78.79% (p<0.001), and in 5-year RFS from 69.44% to 81.82% (p=0.008), on one hand, and a decrease in 5-year CIR from 30.56% to 18.18% (p<0.001), and in 5-year NRM from 25.37% to 9.09% (p<0.001), on the other hand. Similarly, other groups have reported increasing outcomes over the last decade [4,20].
It should be emphasized that CIR was higher for IRG, compared to HRG, both in T1 and T2 cohorts. The explanation might reside in the fact that IRG pts are a heterogeneous group, which could benefit from a subclassification based on genetic characteristics and/or FCM MRD D15 (for example: 0.1-1% intermediate-low and 1-10% intermediate-high). More to the point, using triple intrathecal chemotherapy during consolidation phase could decrease the incidence of CNS relapses in IRG pts, but these proposals need to be assessed in large multicentric studies.
One aspect the authors want to draw attention to is that most treatment protocols were developed and delivered in high-income countries, therefore it is evident the need for adjusted regimens, based on local means in middle or low-income countries using standardized regimens, such as ALL IC BFM [21]. As stated by a Polish group, most countries with high health expenditure report lower death rates in ALL pts, due to any cause, compared to less experienced teams or with fewer resources [22]. It is of the same importance to understand that treatment efficacy is not only determined by EFS and OS, but also by frequency and severity of toxicities. Hence, future de-escalation strategies for SRG pts should be the focus, without adversely affecting cure rate [13,23].
There were limitations to this paper: the retrospective study, the difference in median follow-up between the two subgroups, and the single-center cohort. Even though a retrospective approach can lead to bias analysis, we limited this by enrolling all consecutive diagnosed children which met the inclusion/exclusion criteria, by retrieving the same data about participants and by eliminating upfront information that was not available in all pts (PCR-MRD, central nervous system status) or elements which were influenced on admission to FCI (hemoglobin or platelet levels if the patient was transfused prior, white blood count affected by hyperhydration or lack thereof), thus creating a uniform database. The second limitation, the apparently significant discrepancy between the median follow-up of 88 months for T1 pts and 44 months in T2 pts, we do not consider it an influential limitation, since most relapses and deaths occur before the 3-year mark after diagnosis. The third limitation we identified is the single-center experience report, but FCI has been the biggest hospital in the country for diagnosing and treating children with ALL, therefore this analysis can be viewed as significant for nationwide practice.
5. Conclusions
We have shown increasing survival rates in children diagnosed with ALL and treated in FCI, with a global 5-year OS from 82.54% in 2016-2019 to almost 90% in 2019-2022, presently close to those published by international consortia. The most significant results were for HRG, which demonstrated an increase in OS up to a value close to 80%. In our cohort, independent inferior prognostic factors were older age and poor-prednisone response, while univariate analysis listed also unfavorable genetic characteristics, and MRD assessments. Additional optimization of personalized therapy is required for further improving outcome and diminishing disease- and treatment-related mortality.
Author Contributions
Conceptualization, methodology, validation, L.E.R. and A.C.; patient resources, L.E.R., A.D.M., A.M.B., A.M.M., A.N.S., C.G.J., A.C.; laboratory data curation, C.J., D.C.P.; statistical analysis, C.C., A.M.V.; writing—original draft preparation, L.E.R.; writing—review and editing, O.O.N.; supervision, A.C. All authors have read and agreed to the published version of the manuscript.
Institutional Review Board Statement
The study was conducted in accordance with the Declaration of Helsinki. Ethical review and approval were waived for this analysis since it is a retrospective study, no intervention was performed, and no changes were made to patients’ diagnostic procedures, treatment strategy or outcomes.
Informed Consent Statement
Written informed consent was obtained from all legal guardians of patients involved in the study, as previously mentioned in section Materials and Methods.
Data Availability Statement
Data is unavailable due to privacy. The raw data supporting the conclusions of this article will be made available by the authors on request.
Acknowledgments
We acknowledge the consistent work of other clinicians involved in patient management (Ramona F. Ioan, Andreea I. Stefan, Radu Obrisca, Silvia A. Alexandru, Irina Avramescu, Petruta D. Lazar, Sabina G. Mihai, Elisa M. Busescu, Anda Mocanu) and other doctors: morphology (Minodora M. Asan, Cristian Calin), flowcytometry (Anca Gheorghe, Catalin Serban, Horia Sandu) and molecular biology (Mihaela Dragomir, Onda T. Calugaru).
Conflicts of Interest
The authors declare no conflicts of interest.
Abbreviations
| ALL | Acute lymphoblastic leukemia |
| BFM | Berlin-Frankfurt-Münster |
| CR | Complete remission |
| CI | Confidence interval |
| CIR | Cumulative incidence of relapse |
| D15 | Day 15 |
| D33, TP1 | Day 33 |
| D78, TP2 | Day 78 |
| EOI | End of induction |
| EFS | Event-free survival |
| FCI | Fundeni Clinical Institute |
| FCM | Flowcytometry |
| HR | Hazard ratio |
| HSCT | Hematopoietic stem cell transplant |
| HRG | High-risk group |
| IRG | Intermediate-risk group |
| MRD | Measurable residual disease |
| NRM | Non-relapse mortality |
| OS | Overall survival |
| pts | patients |
| PGR | Prednisone good response |
| PPR | Prednisone poor response |
| RFS | Relapse-free survival |
| SRG | Standard-risk group |
References
- Devilli, L.; Garonzi, C.; Balter, R.; Bonetti, E.; Chinello, M.; Zaccaron, A.; Vitale, V.; De Bortoli, M.; Caddeo, G.; Barett, V.; Tridellor, G.; Cesaro, S. Long-term and quality of survival in patients treated for acute lymphoblastic leukemia during the pediatric age. Hematol Rep. 2021, 13(1), 8847. [Google Scholar] [CrossRef] [PubMed]
- Campbell, M.; Kiss, C.; Zimmermann, M.; Riccheri, C.; Kowalczyk, J.; Felice, M.S.; Kuzmanovic, M.; Kovacs, G.; Kosmidis, H.; Gonzalez, A.; et al. Childhood Acute Lymphoblastic Leukemia: Results of the Randomized Acute Lymphoblastic Leukemia Intercontinental-Berlin-Frankfurt-Münster 2009 Trial. J Clin Oncol. 2023, 41(19), 3499–3511. [Google Scholar] [CrossRef] [PubMed]
- Romanian Society of Pediatric Oncology and Hematology, National Registry for Pediatric Oncological and Hematological Patients. Available online: https://srohp.ro/wp-content/uploads/2024/02/RNOHP-cu-studiu-2023.pdf (accessed on 18 April 2025).
- Horn, P.R.C.B.; Ribeiro-Carvalho, M.M.; de Azevedo, A.M.B.; de Souza, A.M.; Faria, S.; Wiggers, C.; Rouxinol, S.; Schramm, M.T.; Sanches, B.S.; Duarte, N.L.; et al. Long-Term Outcomes of Childhood Acute Lymphocytic Leukemia Treated with Adapted Berlin–Frankfurt–Münster (BFM) Protocols: A Multicentric Analysis from a Developing Country. Cancers. 2024, 16(16), 2898. [Google Scholar] [CrossRef] [PubMed]
- Moreira, D.C.; Gonzalez-Ramella, O.; Valenzuela, M.E.; Carillo, A.K.; Faughnan, L.; Job, G.; Chen, Y.; Villegas, C.; Irigoyen, A.E.; Urbays, R.B.; et al. Evaluation of factors leading to poor outcomes for pediatric acute lymphoblastic leukemia in Mexico: a multi-institutional report of 2,116 patients. Front Oncol. 2023, 13, 1255555. [Google Scholar] [CrossRef] [PubMed]
- Correa, B.T.; Silva, G.S.S.; Mendes, W.J.S.; Maia, A.d.M.; Aleluia, A.C.M.; Fonseca, T.C.C.; da Guarda, C.C.; Gonçalves, M.d.S.; Aleluia, M.M. Association of the clinical profile and overall survival of pediatric patients with acute lymphoblastic leukemia. Front Pediatr. 2023, 11, 1223889. [Google Scholar] [CrossRef] [PubMed]
- Duffy, C.; Graetz, D.E.; Lopez, A.M.Z.; Carrillo, A.K.; Job, G.; Chen, Y.; Devidas, M.; Leon, S.A.; Bonzi, S.A.; Flores, P.C.; et al. Retrospective analysis of outcomes for pediatric acute lymphoblastic leukemia in South American centers. Front Oncol. 2023, 13, 1254233. [Google Scholar] [CrossRef] [PubMed]
- Vagharshakyan, L., Tamamyan, G., Avagyan, A., Vardanyan, G., Grigoryan, H., Anastasiadi, M.; Krmoyan, L.; Khalatyan, I.; Hovhannisyan, S.; Marirosyan, N.; et al. ALL-280 Our Experience Treating Childhood Acute Lymphoblastic Leukemia in Armenia. Clin Lymphoma Myeloma Leuk. 2022, 22, S200.
- Chennamaneni, R.; Gundeti, S.; Konatam, M.L.; Bala, S.; Kumar, A.; Srinivas, L. Impact of cytogenetics on outcomes in pediatric acute lymphoblastic leukemia. South Asian J Cancer, 2018; 7, 263-266.
- Qiu, K.Y.; Xu, H.G.; Luo, X.Q.; Mai, H.R.; Liao, N.; Yang, L.H.; Zheng, M.C.; Wan, W.Q.; Wu, X.D.; Liu, R.Y.; et al. Prognostic Value and Outcome for ETV6/RUNX1-Positive Pediatric Acute Lymphoblastic Leukemia: A Report From the South China Children’s Leukemia Group. Front Oncol. 2021, 11, 797194. [Google Scholar] [CrossRef] [PubMed]
- Wang, Y.; Zeng, H.M.; Zhang, L.P. ETV6/RUNX1-positive childhood acute lymphoblastic leukemia in China: excellent prognosis with improved BFM protocol. Riv Ital Pediatr. 2018, 44, 94. [Google Scholar] [CrossRef] [PubMed]
- Lee, J.K.; Kim, S.; Jang, P.S.; Chung, N.G.; Cho, B. Differing Outcomes of Patients with High Hyperdiploidy and ETV6-RUNX1 Rearrangement in Korean Pediatric Precursor B Cell Acute Lymphoblastic Leukemia. Cancer Res Treat. 2021; 53(2), 567-575.
- Sidhom, I.; Shaaban, K.; Yousedd, S.H.; Ali, N.; Gohar, S.; Rashed, W.M.; Mehanna, M.; Salem, S.; Soliman, S.; Yassin, D.; et al. Reduced-intensity therapy for pediatric lymphoblastic leukemia: impact of residual disease early in remission induction. Blood. 2021, 137(1), 20–28. [Google Scholar] [CrossRef] [PubMed]
- Pui, C.H.; Pei, D.; Raimondi, S.C.; Raimond, S.C.; Coustan-Smith, E.; Jeha, S.; Cheng, C.; Bowman, W.P.; Sandlund, J.T.; Ribeiro, R.C.; Rubnik, J.E.; et al. Clinical impact of minimal residual disease in children with different subtypes of acute lymphoblastic leukemia treated with Response-Adapted therapy. Leukemia. 2017; 31(2), 333-339.
- Berry, D.A.; Zhou, S.; Higley, H.; Mukundan, L.; Fu, S.; Reaman, G.H.; Wood, B.L.; Kelloff, G.J.; Jessup, J.M.; Radich, J.R. Association of minimal residual disease with clinical outcome in pediatric and adult acute lymphoblastic leukemia. JAMA Oncol. 2017, 3(7), e170580. [Google Scholar] [CrossRef] [PubMed]
- Zou, P.; Zhou, M.; Wen, J.; Liao, X.; Shen, Y.; Liu, H.; Song, L.; Xiao, J. The long-term outcomes and risk factors for precursor B-cell acute lymphoblastic leukemia without specific fusion genes in Chinese children: Experiences from multiple centers. Bosn J Basic Med Sci. 2022; 22(2), 238-246.
- Yu, C.H.; Jou, S.T.; Su, Y.H.; Coustan-Smith, E.; Wu, G.; Cheng, C.N.; Lu, M.Y.; Lin, K.H.; Wu, K.H.; Chen, S.H.; et al. Clinical impact of minimal residual disease and genetic subtypes on the prognosis of childhood acute lymphoblastic leukemia. Cancer 2023, 129(5), 790–802. [Google Scholar] [CrossRef] [PubMed]
- Jinwala, P.; Patidar, R.; Bansal, S.; Bansai, S.; Asati, V.; Shrivastava, S.P.; Elhence, A.; Patel, S.; Chitalkar, P.G. Initial Experiences in Adolescents and Young Adults with T-Cell Acute Lymphoblastic Leukemia/Lymphoma Treated with the Modified BFM 2002 Protocol in a Resource-Constrained Setting. South Asian J Cancer, 2023, 12(4), 378–383.
- Feng, J.; Cheng, F.W.T.; Chiang, A.K.S.; Lam, G.K.S.; Chow, T.T.W.; Ha, S.Y.; Luk, C.W.; Li, C.H.; Ling, S.C.; Yau, P.W.; et al. Outcomes of adolescents with acute lymphoblastic leukaemia. Hong Kong Med J, 2022, 28(3), 204-214.
- Jaime-Pérez, J.C.; Jiménez-Castillo, R.A.; Pinzón-Uresti, M.A.; Cantú-Rodríguez, O.G.; Herrera-Garza, J.L.; Marfil-Rivera, L.J.; Gomez-Almaguer, D. Real-world outcomes of treatment for acute lymphoblastic leukemia during adolescence in a financially restricted environment: Results at a single center in Latin America. Pediatr Blood Cancer, 2017; 64, e26396.
- Demidowicz, E.; Pogorzała, M.; Łęcka, M.; Żołnowska, H.; Marjańska, A.; Kubicka, M.; Kurylo-Rafinska, B.; Czyzewshi, K.; Debski, R.; Koltan, A.; et al. Outcome of Pediatric Acute Lymphoblastic Leukemia: Sixty Years of Progress. Anticancer Res, 2019, 39, 5203–5207. [Google Scholar] [CrossRef] [PubMed]
- Kowalczyk, J.R.; Zawitkowska, J.; Lejman, M.; Drabko, K.; Samardakiewicz, M.; Matysiak, M.; Romiszewski, M.; Balwierz, W.; Ćwiklińska, M.; Kazanowska, B.; et al. Long-term treatment results of Polish pediatric and adolescent patients enrolled in the ALL IC-BFM 2002 trial. Am J Hematol, 2019, 94(11), E307-E310.
- Sun, Y.; Zhang, Y.; Feng, G.; Chen, Z.; Gao, C.; Liu, S.; Zhang, R.; Zhang, H.; Zheng, X.; Gong, W.; et al. An improved advanced fragment analysis-based classification and risk stratification of pediatric acute lymphoblastic leukemia. Cancer Cell Int. 2019, 19, 110. [Google Scholar] [CrossRef] [PubMed]
Figure 1.
Cox analysis on EFS. (a) Univariate Cox analysis; (b) Multivariate Cox analysis.
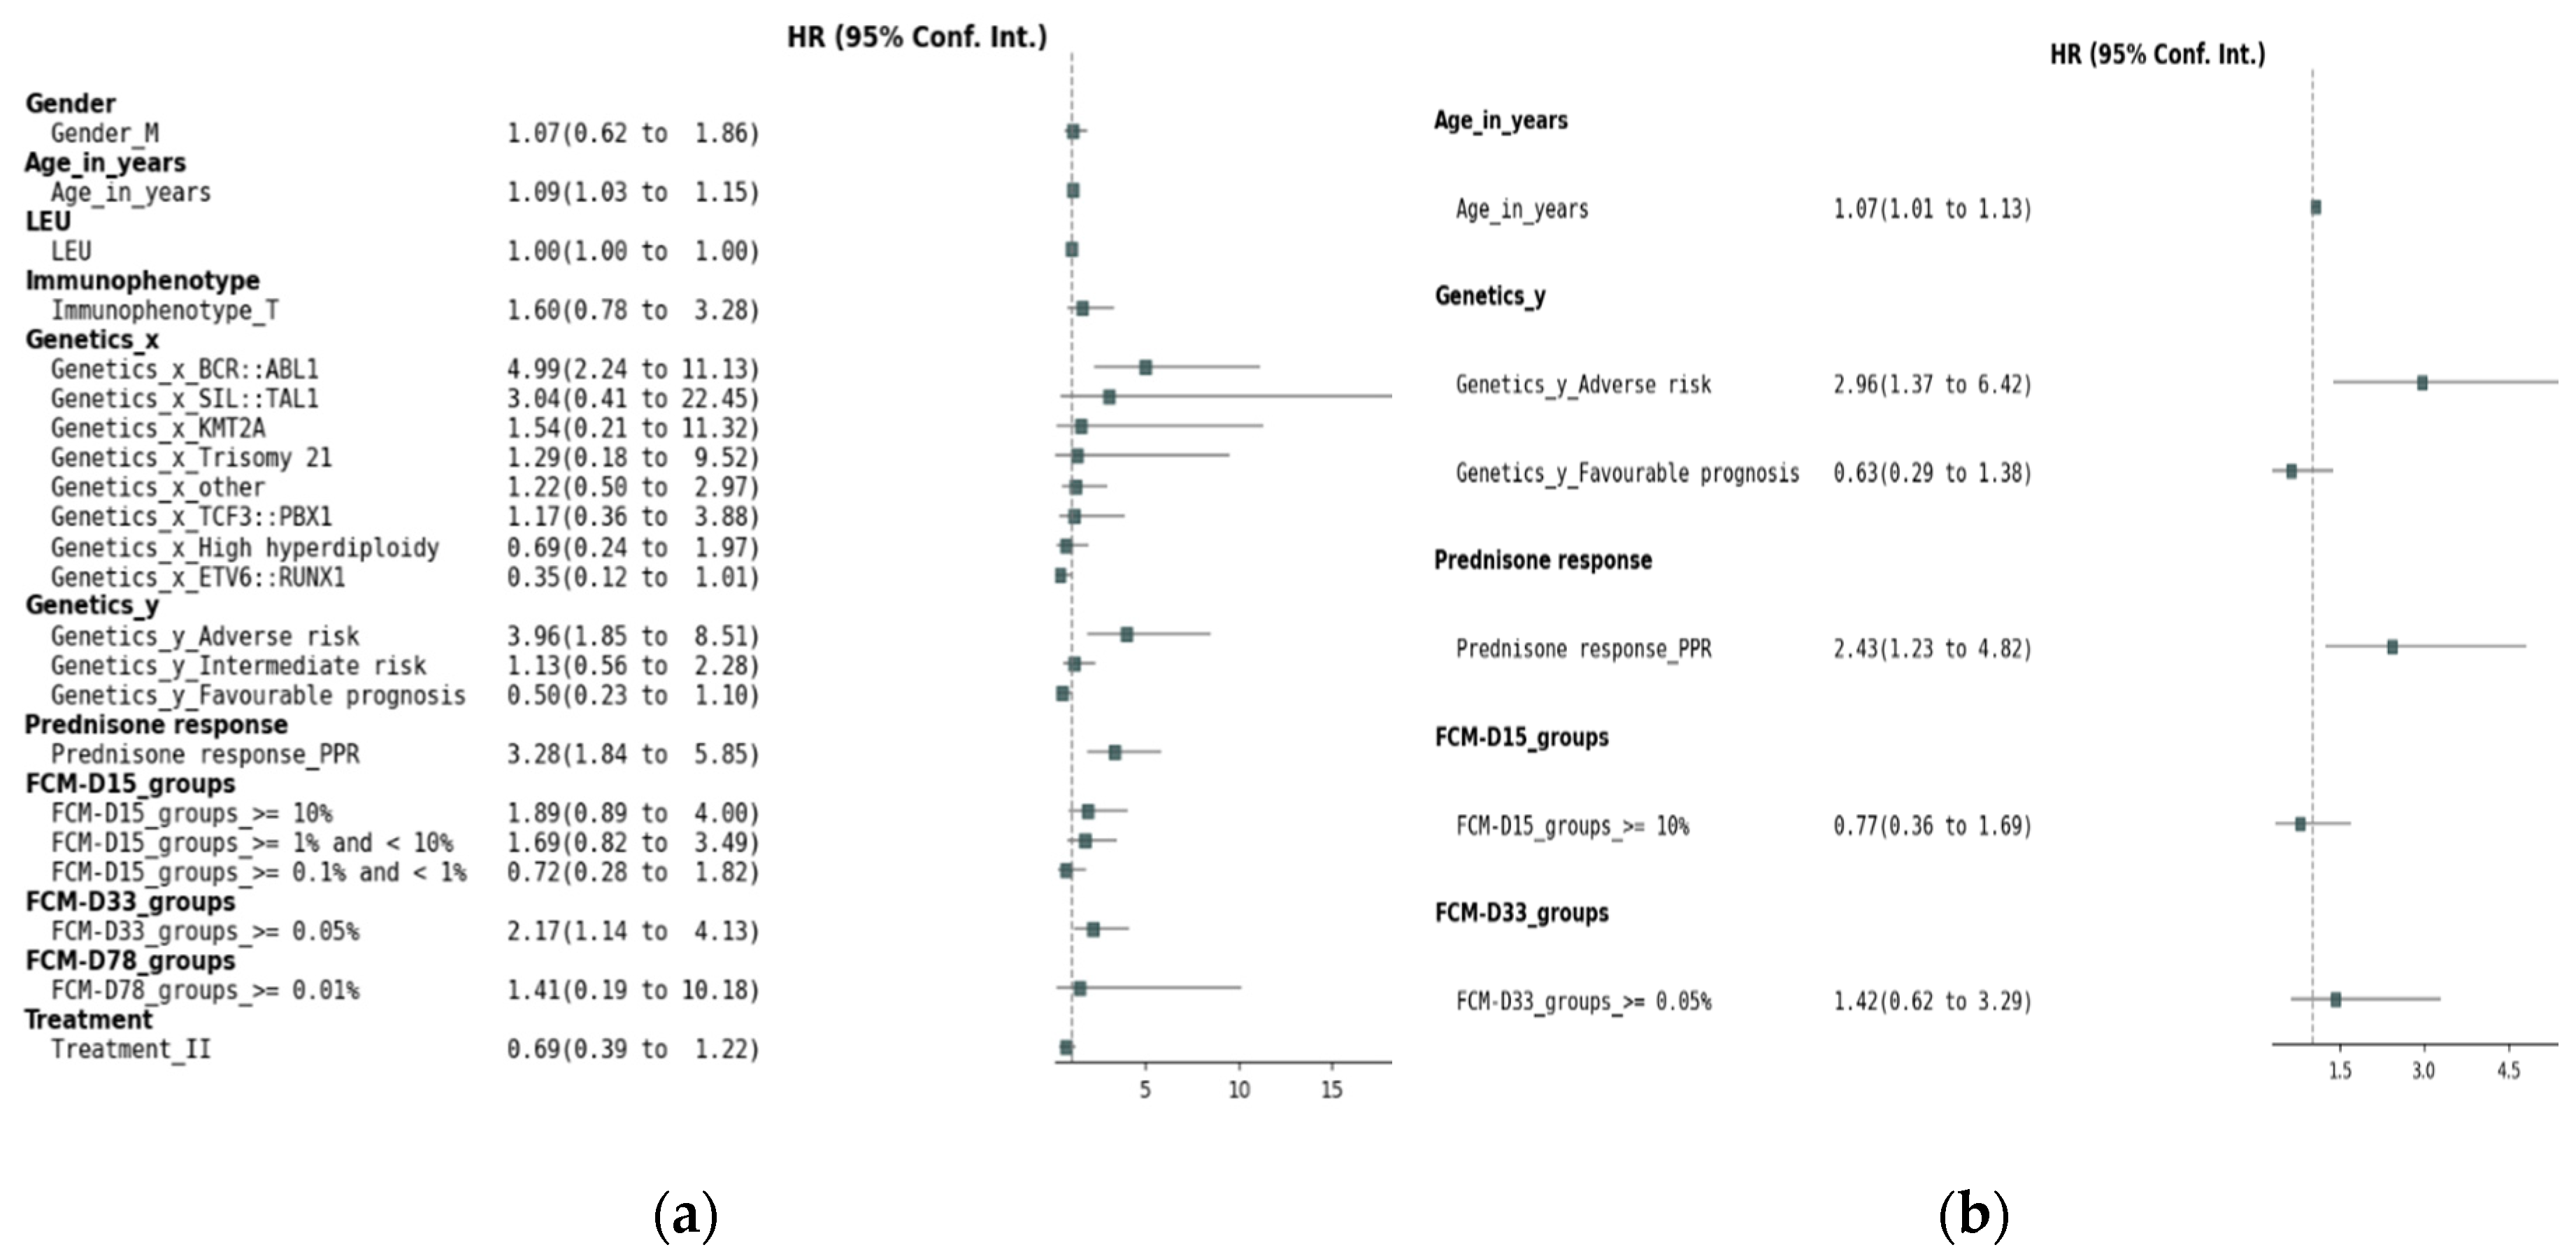
Figure 2.
Cox analysis on OS. (a) Univariate Cox analysis; (b) Multivariate Cox analysis.
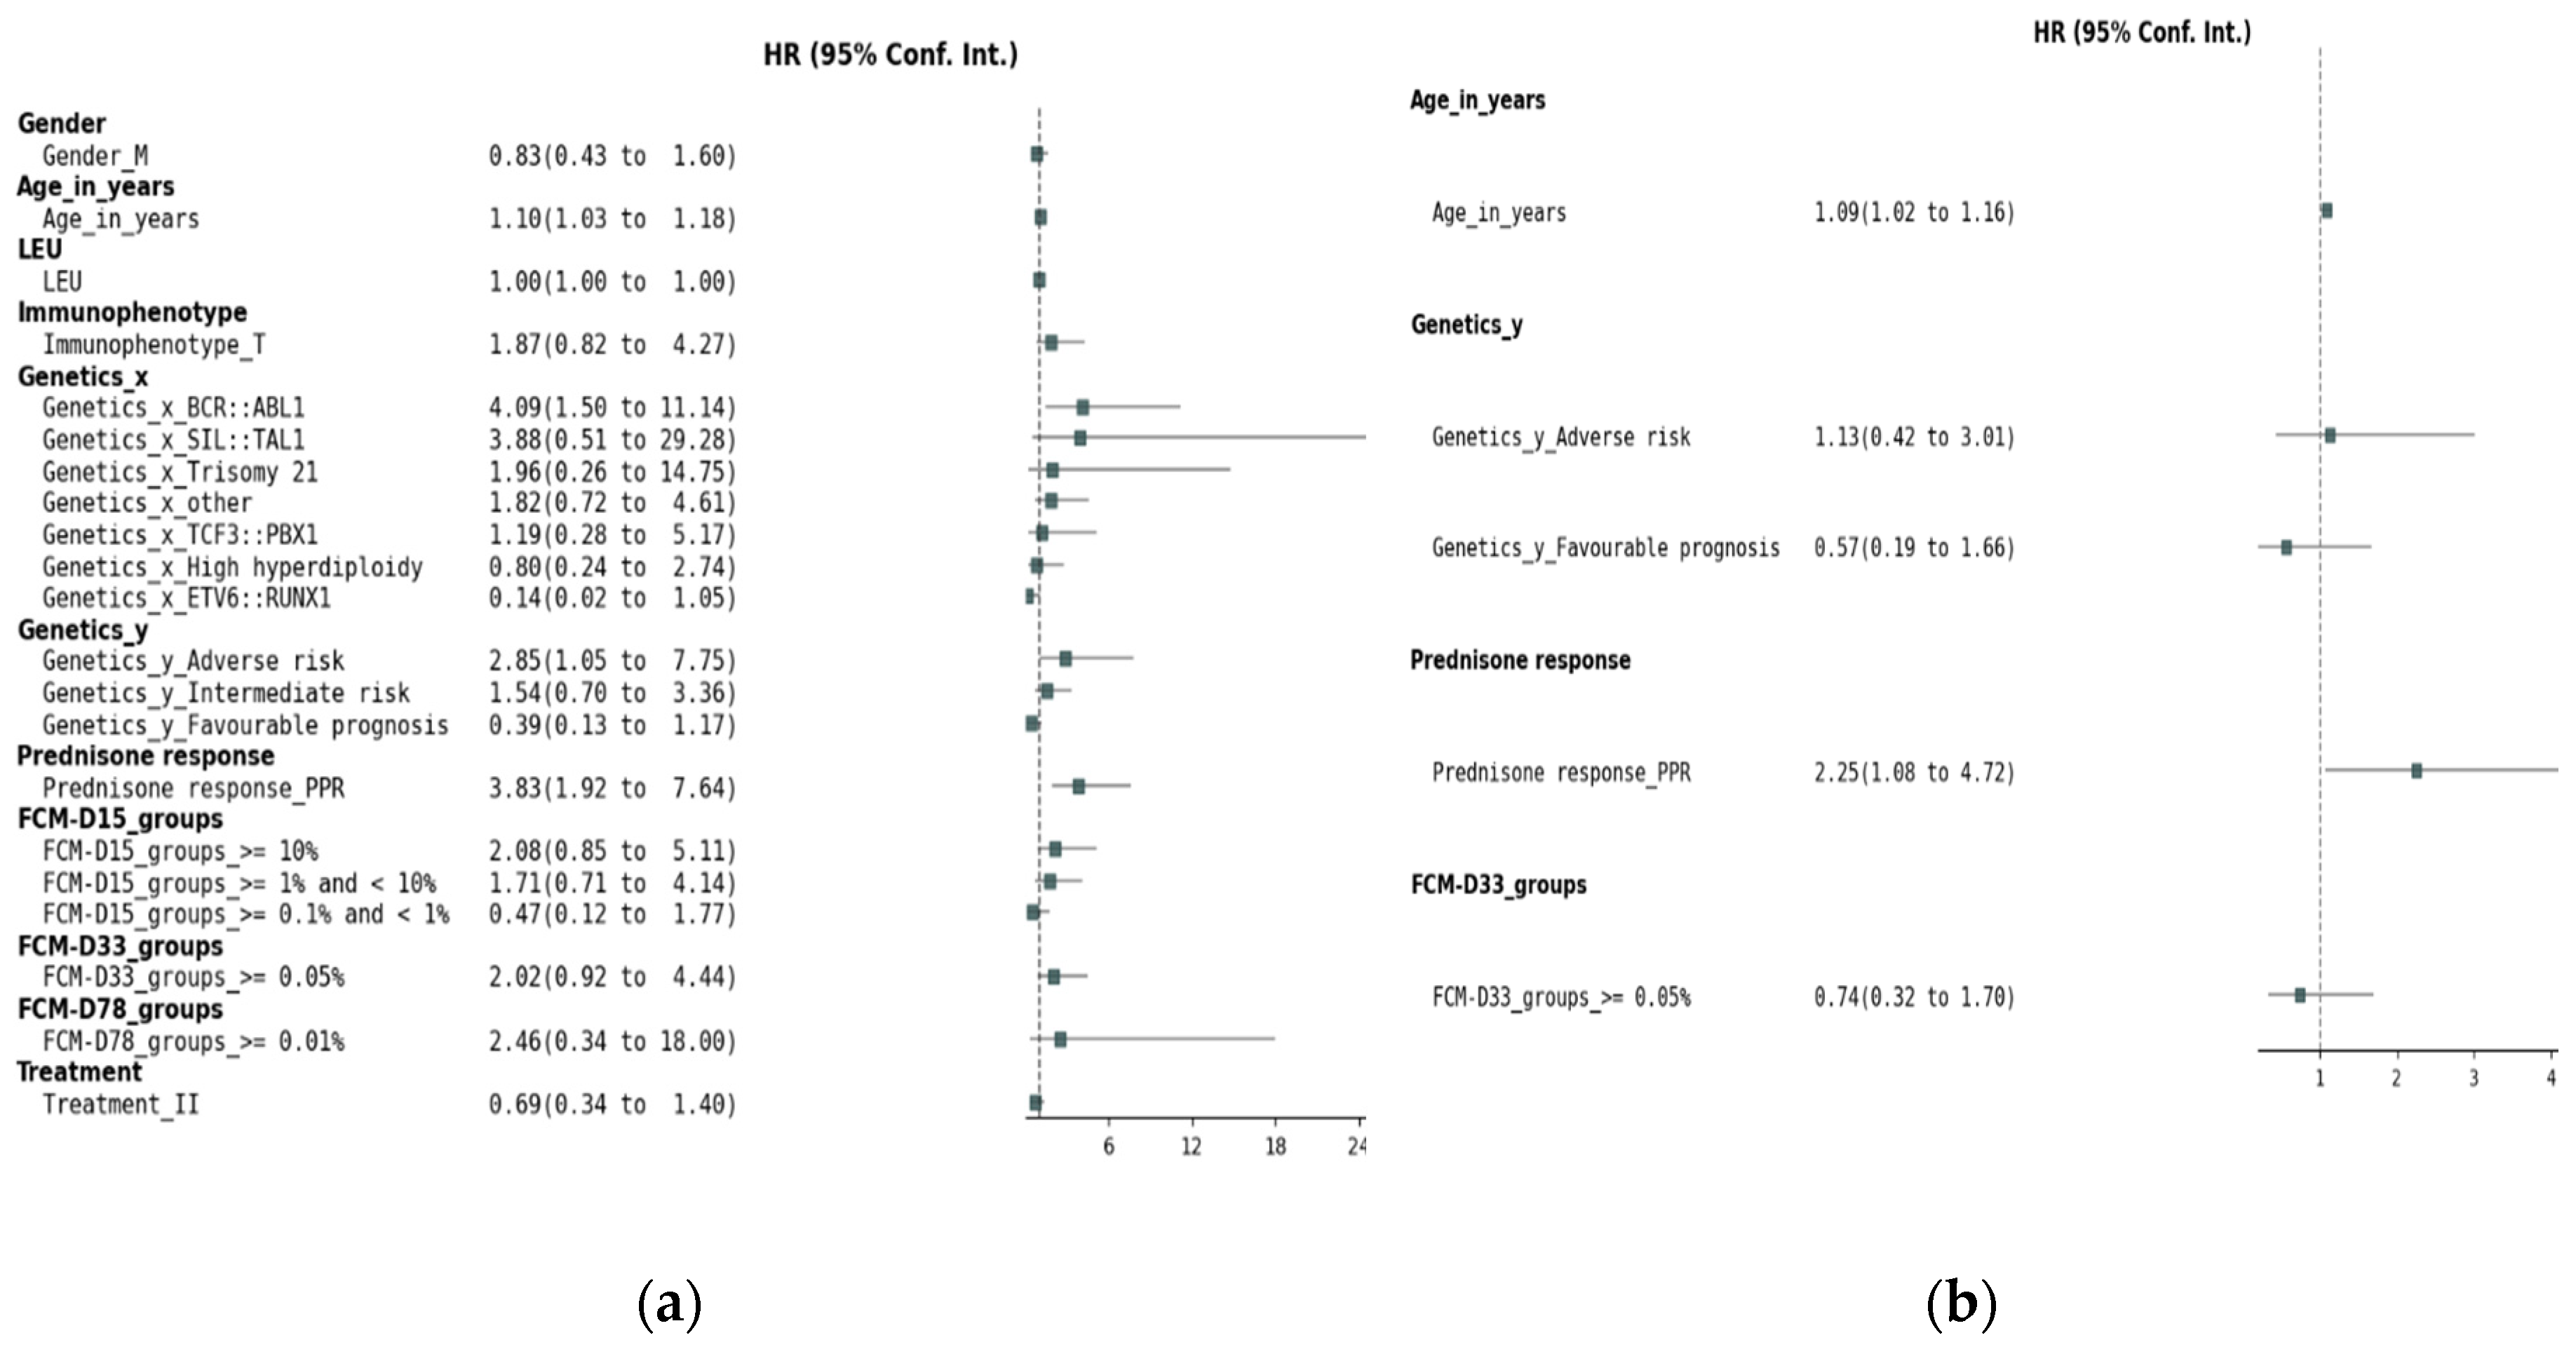
Figure 3.
Event-free survival (EFS) based on risk groups and treatment options. SRG-I = SRG pts in T1, SRG-II = SRG pts in T2, IRG-I = IRG pts in T1, IRG-II = IRG pts in T2, HRG-I = HRG pts in T1, HRG-II = HRG pts in T2.
Figure 3.
Event-free survival (EFS) based on risk groups and treatment options. SRG-I = SRG pts in T1, SRG-II = SRG pts in T2, IRG-I = IRG pts in T1, IRG-II = IRG pts in T2, HRG-I = HRG pts in T1, HRG-II = HRG pts in T2.
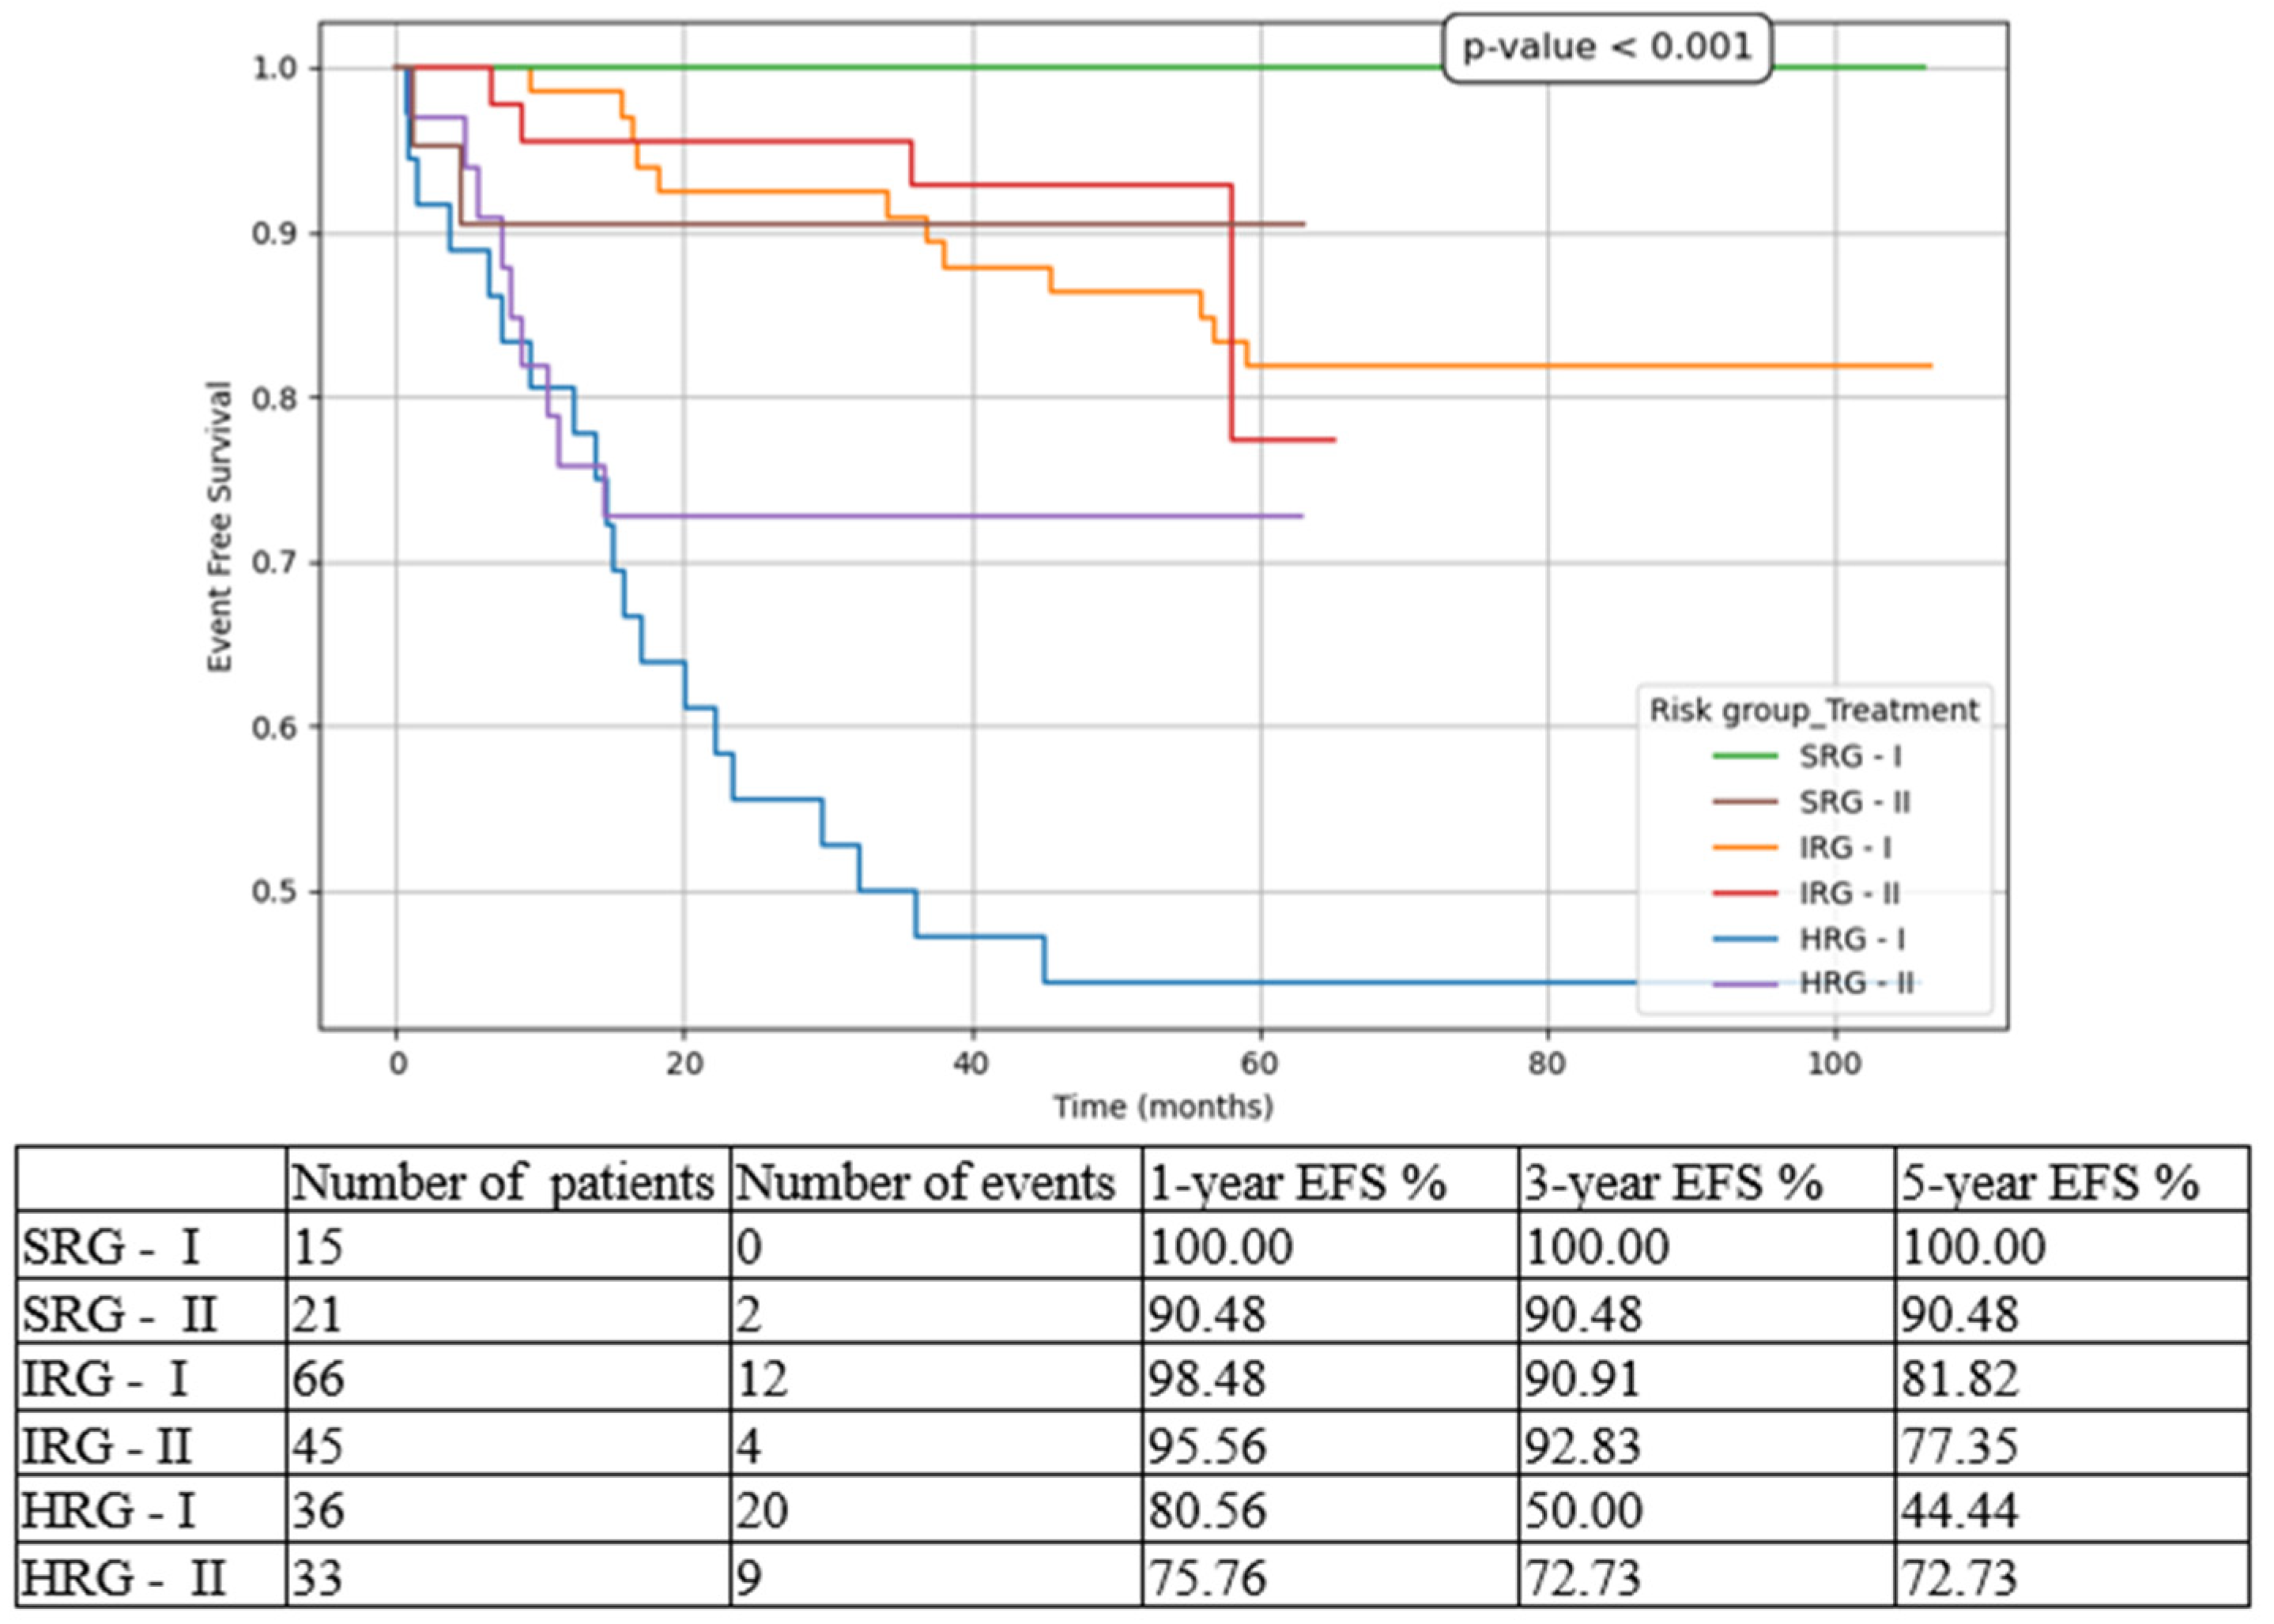
Figure 4.
Overall survival (OS) based on risk groups and treatment options. SRG-I = SRG pts in T1, SRG-II = SRG pts in T2, IRG-I = IRG pts in T1, IRG-II = IRG pts in T2, HRG-I = HRG pts in T1, HRG-II = HRG pts in T2.
Figure 4.
Overall survival (OS) based on risk groups and treatment options. SRG-I = SRG pts in T1, SRG-II = SRG pts in T2, IRG-I = IRG pts in T1, IRG-II = IRG pts in T2, HRG-I = HRG pts in T1, HRG-II = HRG pts in T2.
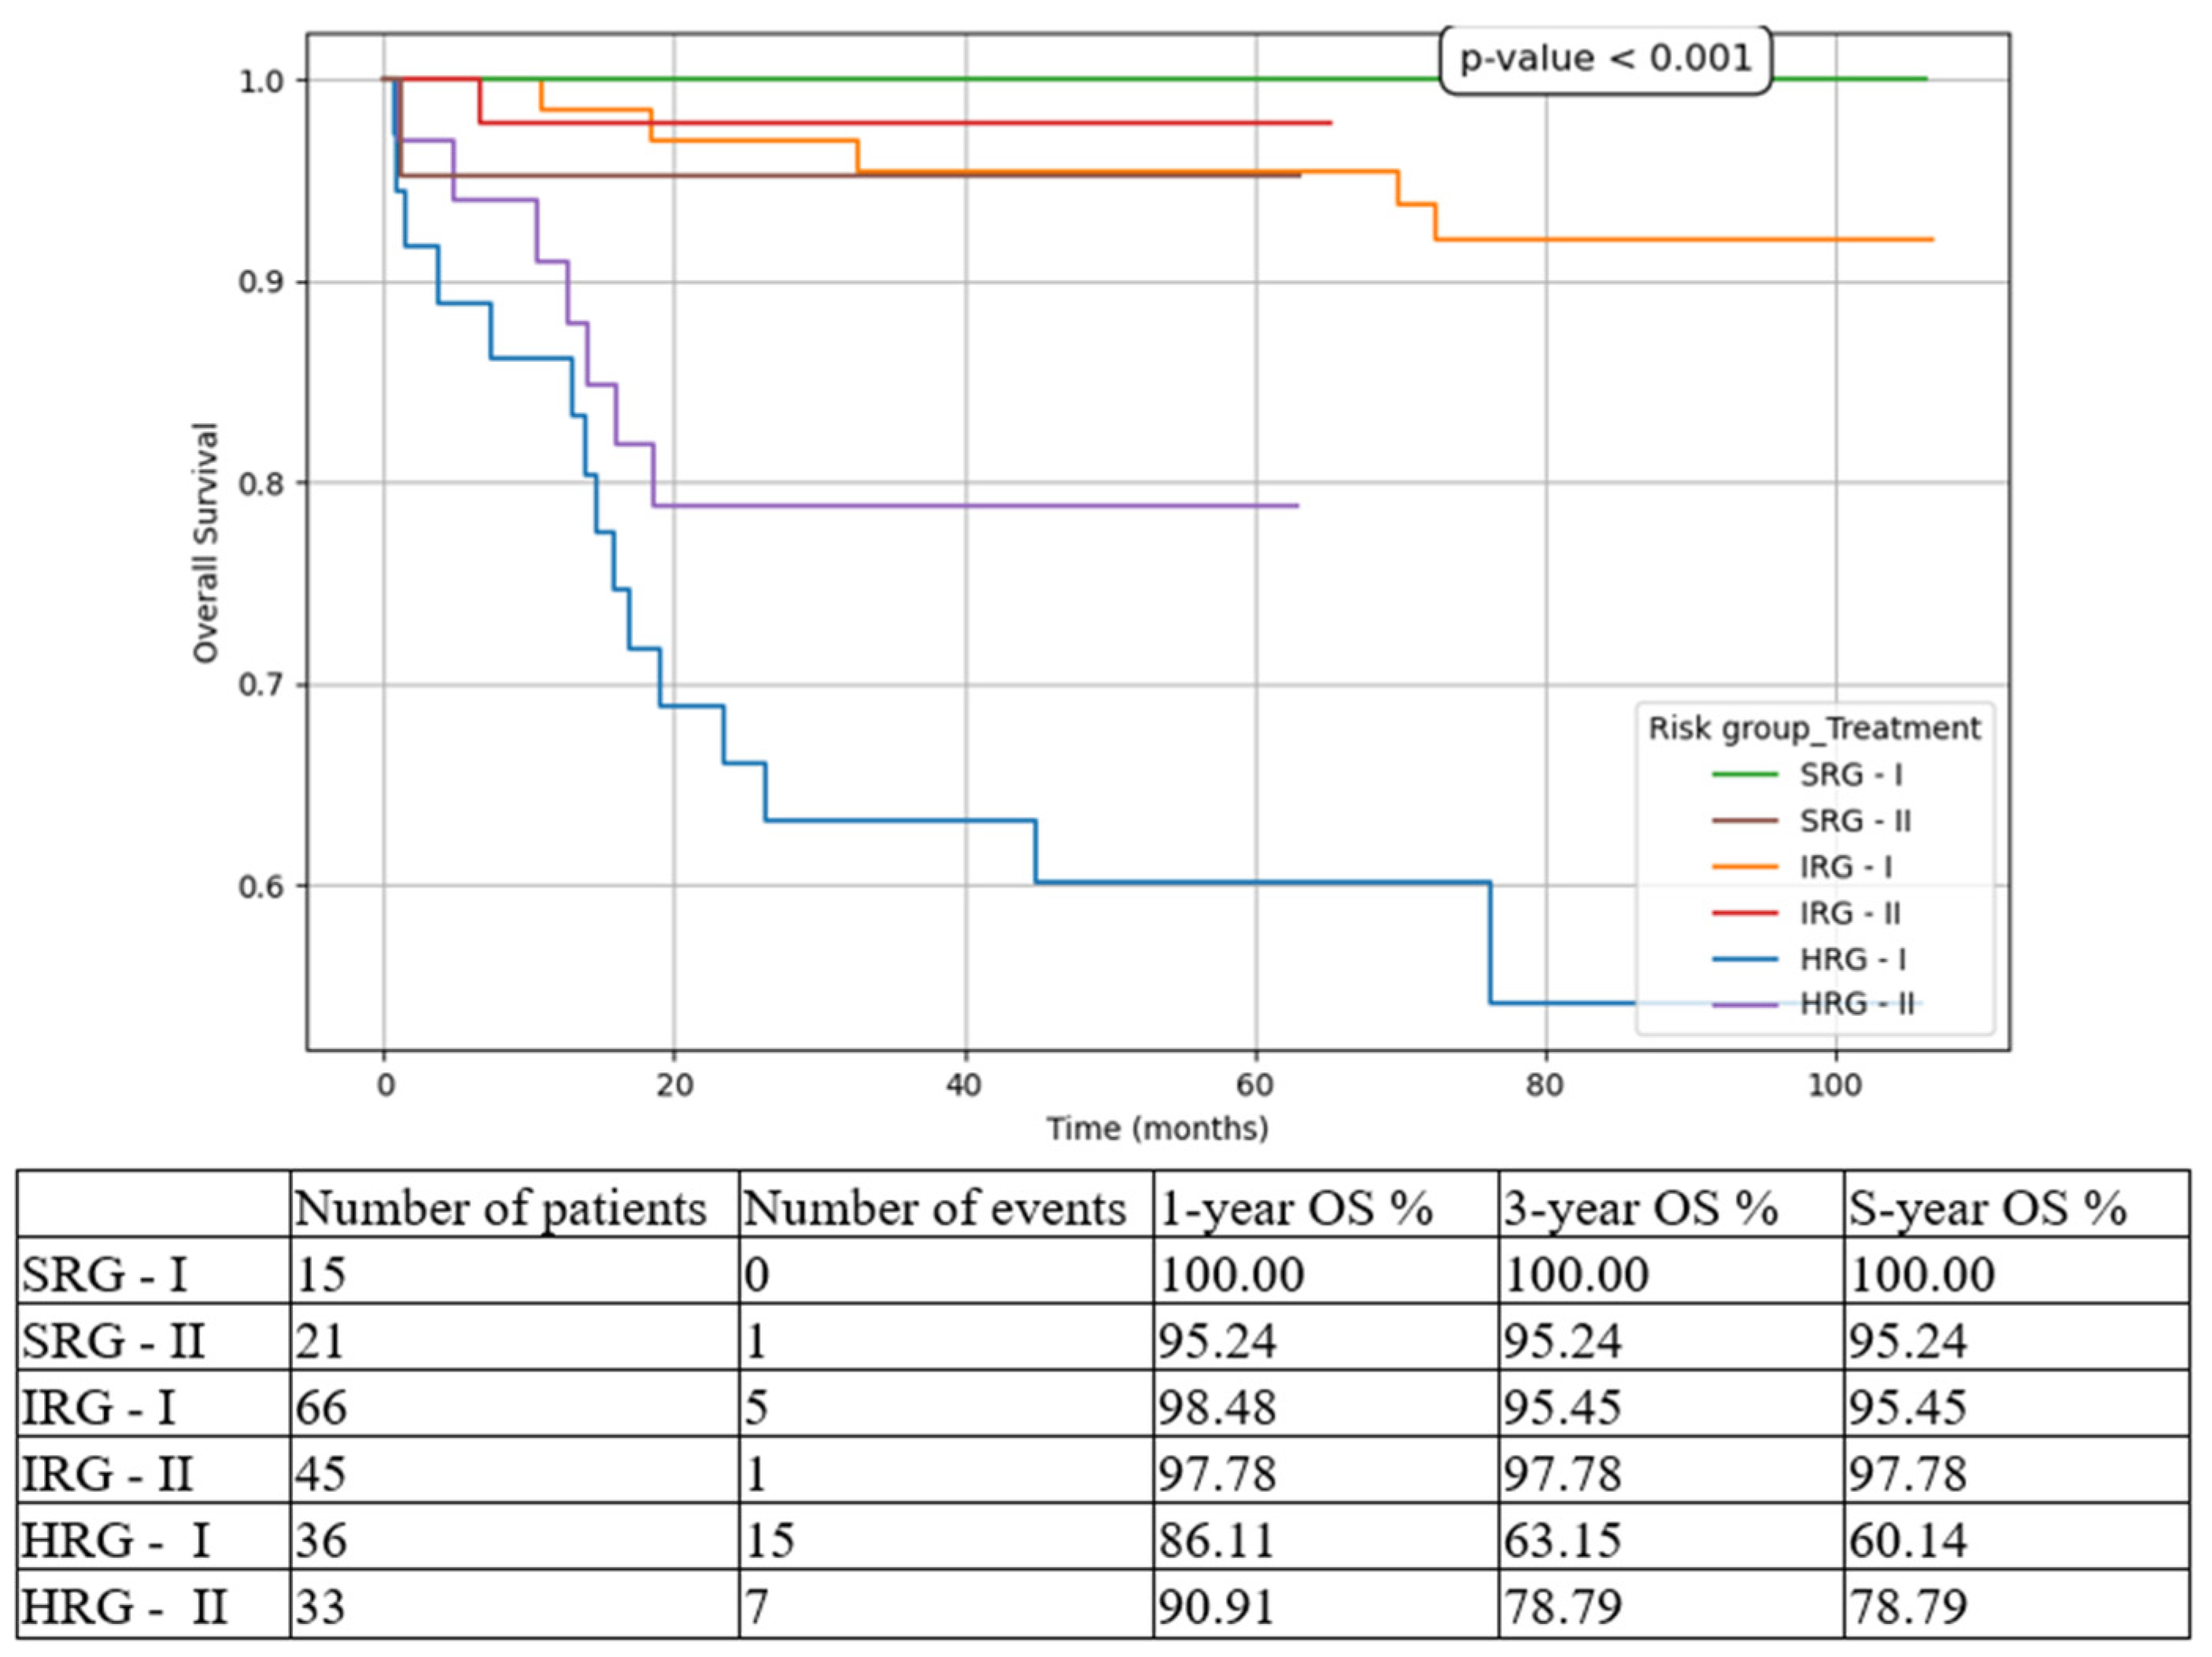
Figure 5.
Cumulative incidence of relapse (CIR) based on risk groups and treatment options. SRG-I = SRG pts in T1, SRG-II = SRG pts in T2, IRG-I = IRG pts in T1, IRG-II = IRG pts in T2, HRG-I = HRG pts in T1, HRG-II = HRG pts in T2.
Figure 5.
Cumulative incidence of relapse (CIR) based on risk groups and treatment options. SRG-I = SRG pts in T1, SRG-II = SRG pts in T2, IRG-I = IRG pts in T1, IRG-II = IRG pts in T2, HRG-I = HRG pts in T1, HRG-II = HRG pts in T2.
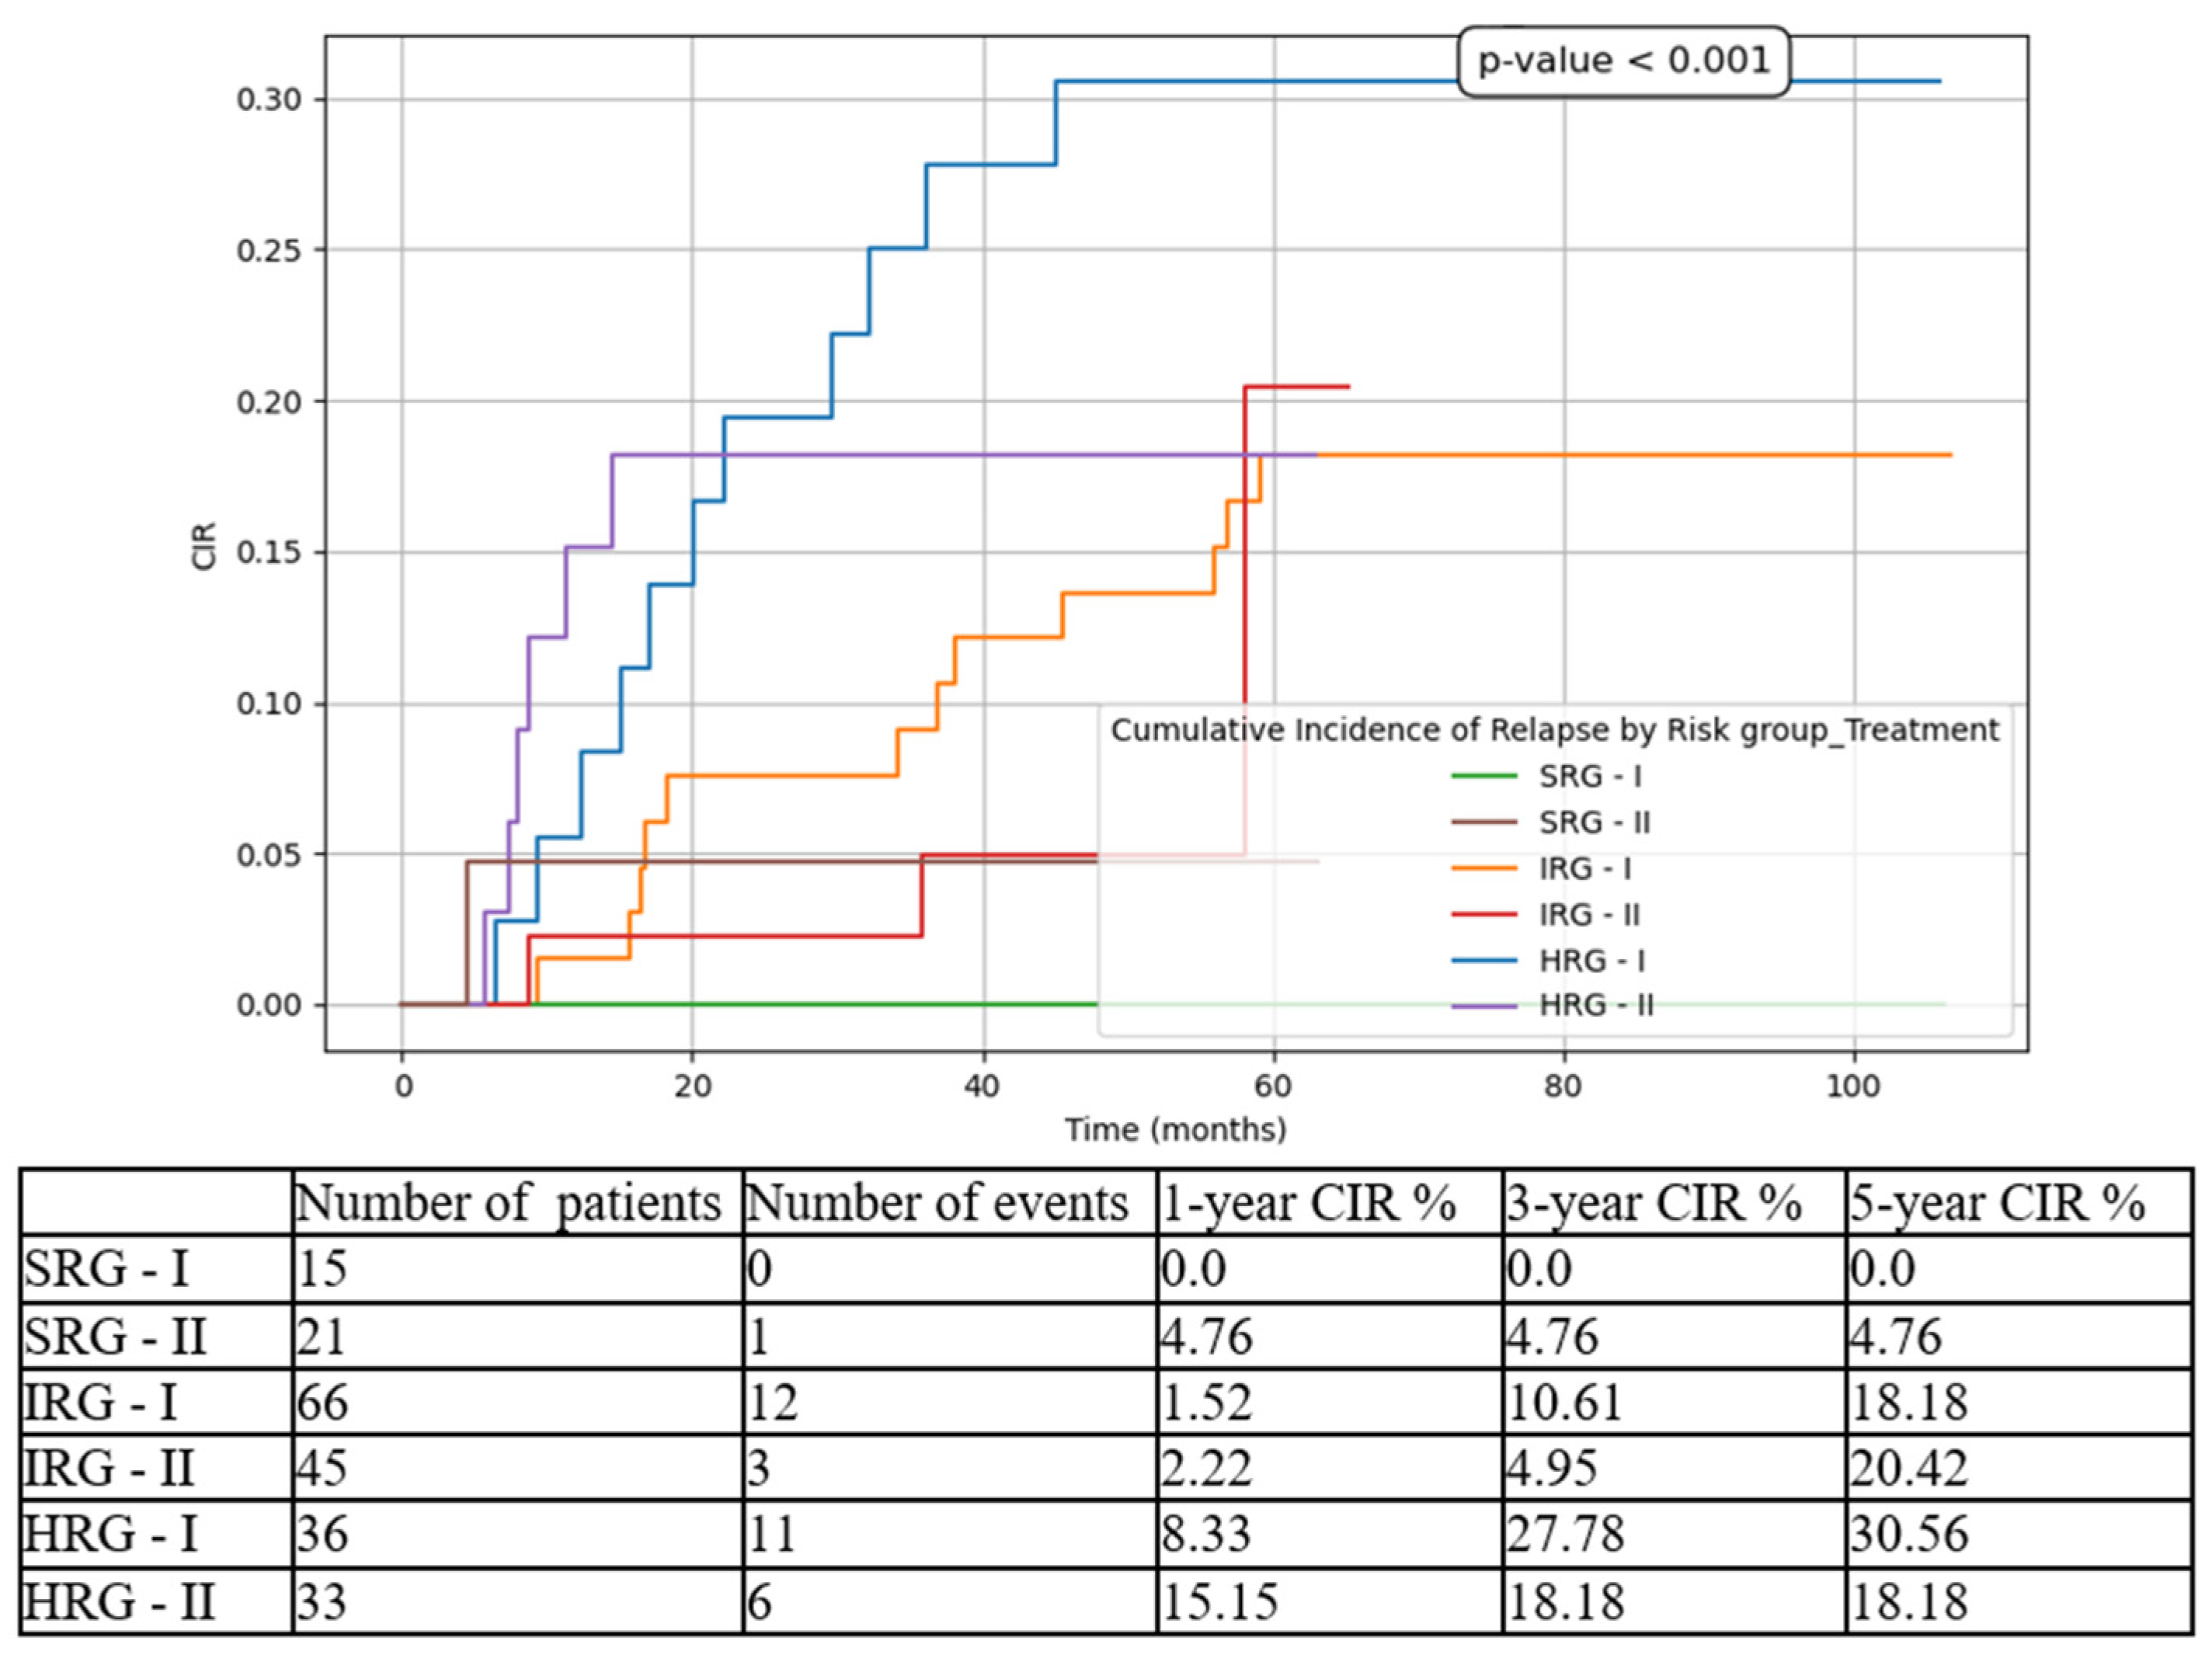
Figure 6.
Relapse-free survival (RFS) based on risk groups and treatment options. SRG-I = SRG pts in T1, SRG-II = SRG pts in T2, IRG-I = IRG pts in T1, IRG-II = IRG pts in T2, HRG-I = HRG pts in T1, HRG-II = HRG pts in T2.
Figure 6.
Relapse-free survival (RFS) based on risk groups and treatment options. SRG-I = SRG pts in T1, SRG-II = SRG pts in T2, IRG-I = IRG pts in T1, IRG-II = IRG pts in T2, HRG-I = HRG pts in T1, HRG-II = HRG pts in T2.
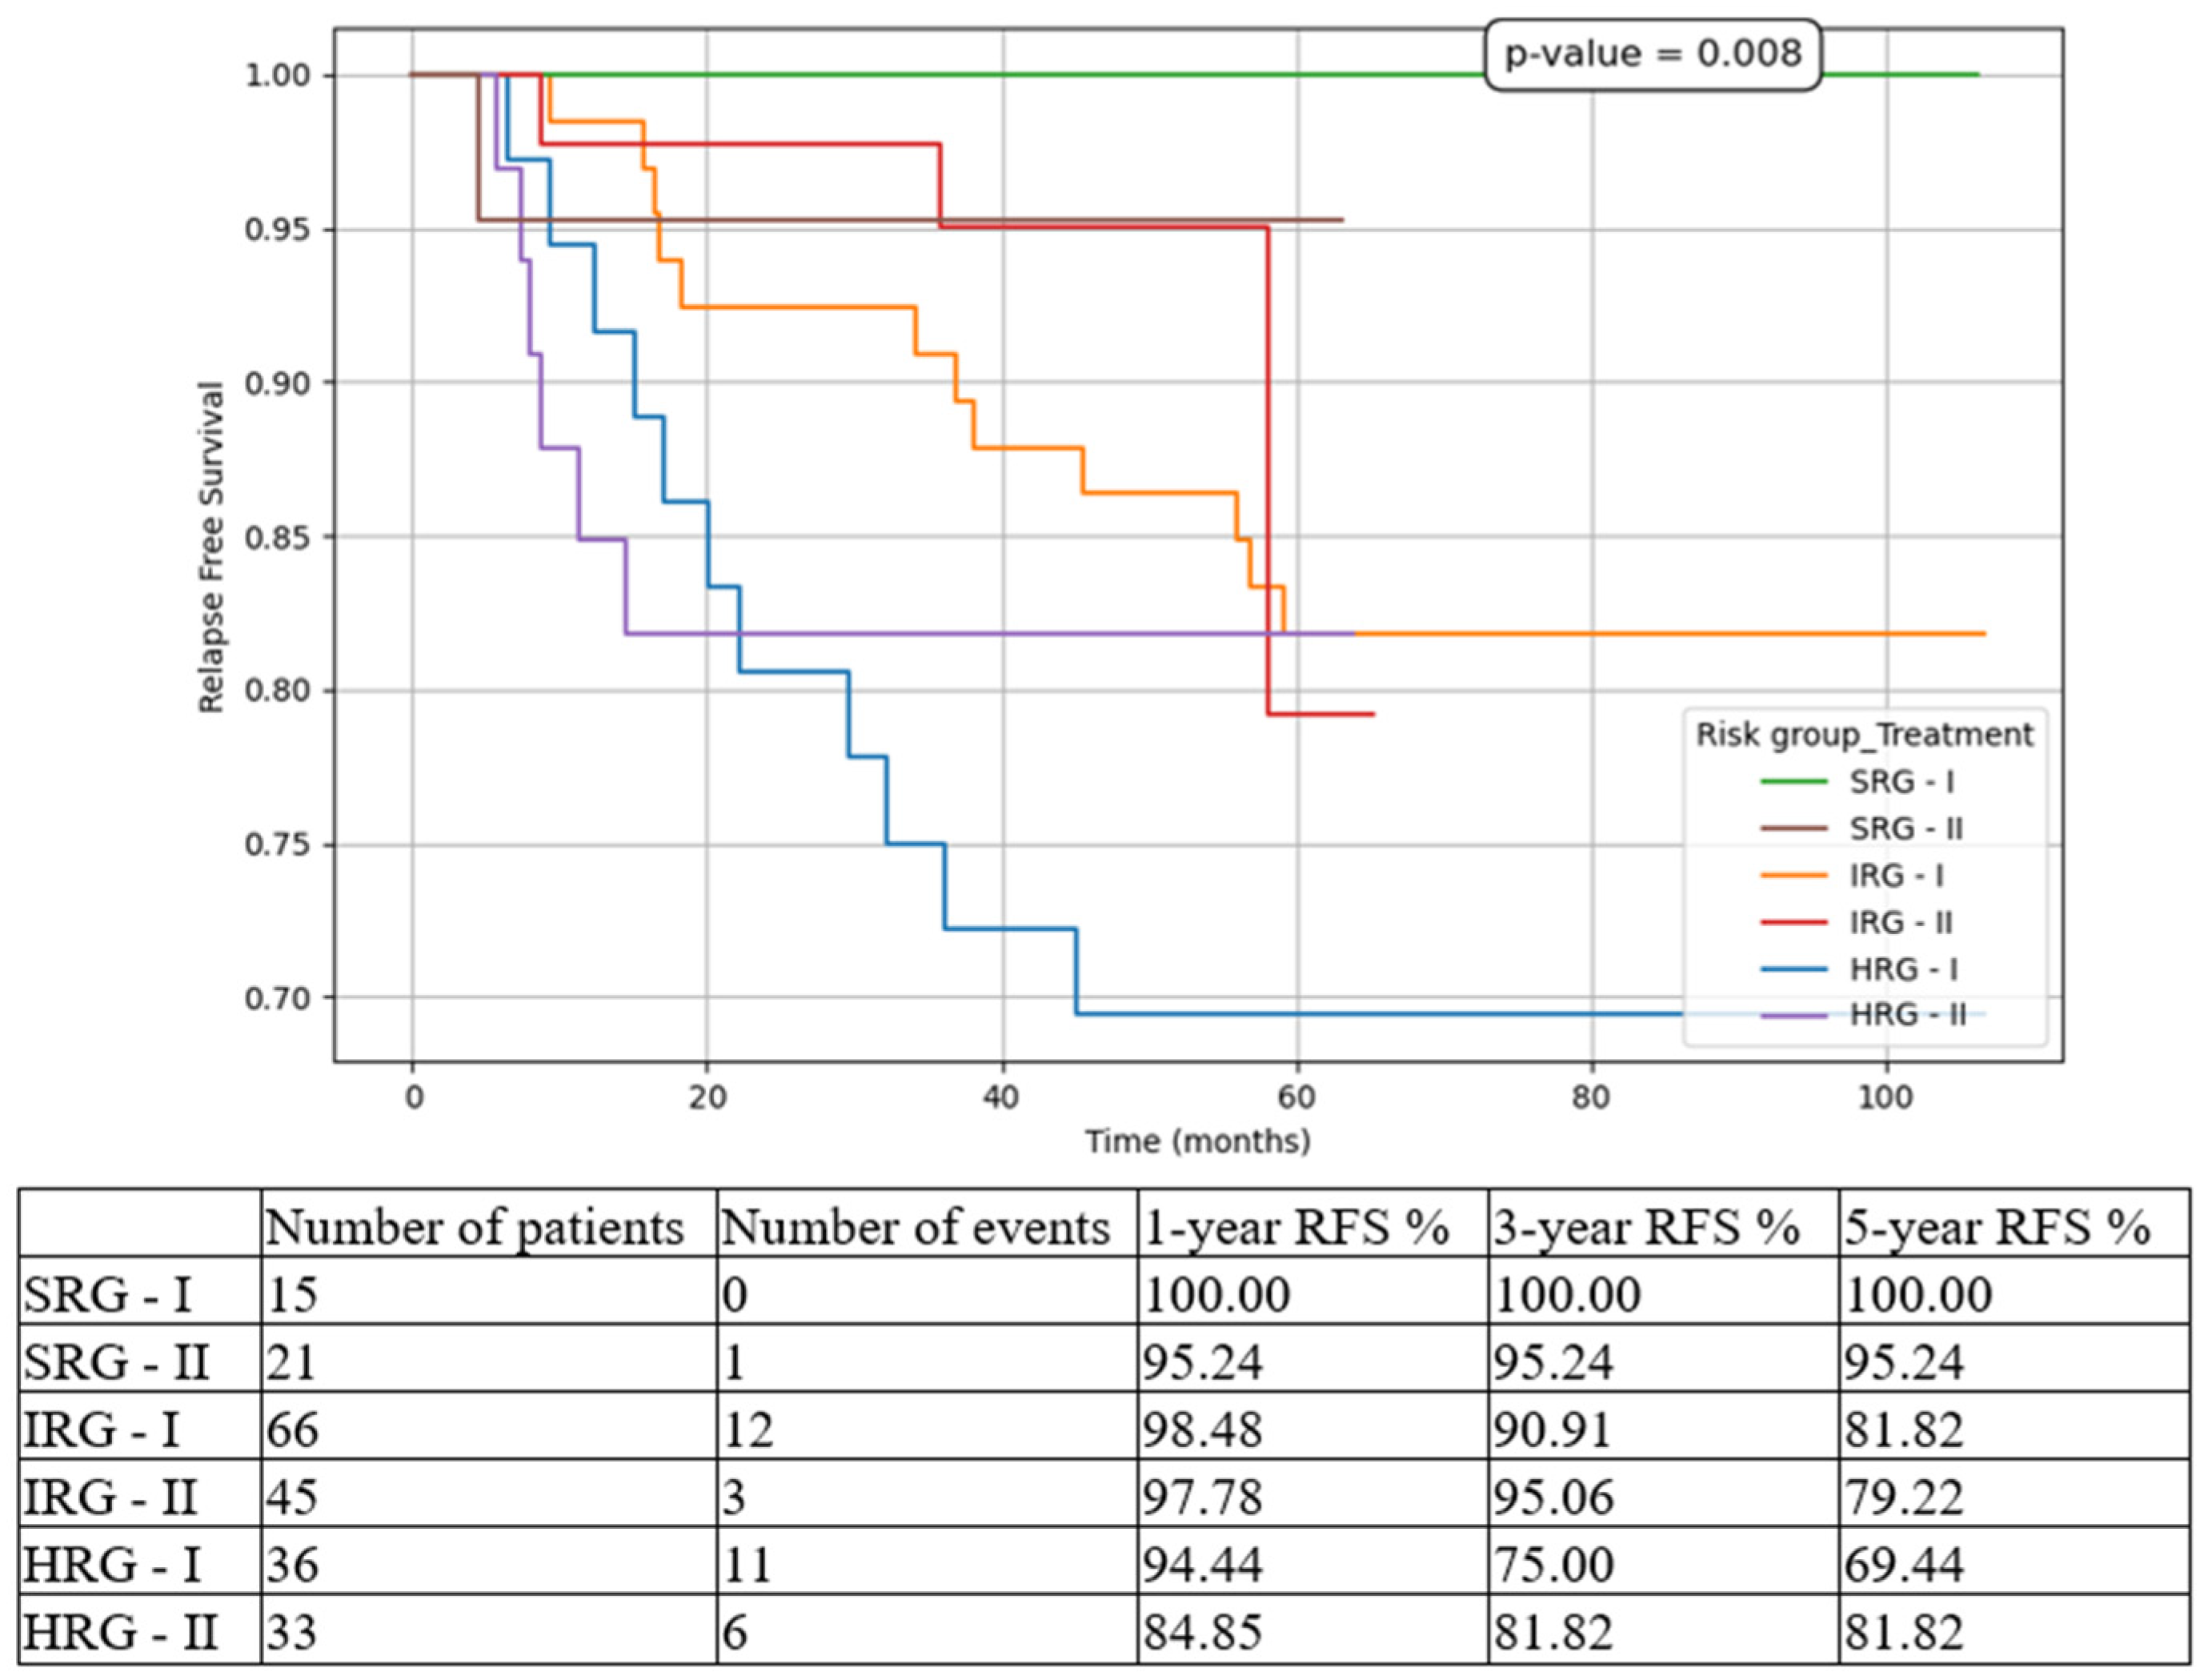
Figure 7.
Non-relapse mortality (NRM) based on risk groups and treatment options. SRG-I = SRG pts in T1, SRG-II = SRG pts in T2, IRG-I = IRG pts in T1, IRG-II = IRG pts in T2, HRG-I = HRG pts in T1, HRG-II = HRG pts in T2.
Figure 7.
Non-relapse mortality (NRM) based on risk groups and treatment options. SRG-I = SRG pts in T1, SRG-II = SRG pts in T2, IRG-I = IRG pts in T1, IRG-II = IRG pts in T2, HRG-I = HRG pts in T1, HRG-II = HRG pts in T2.
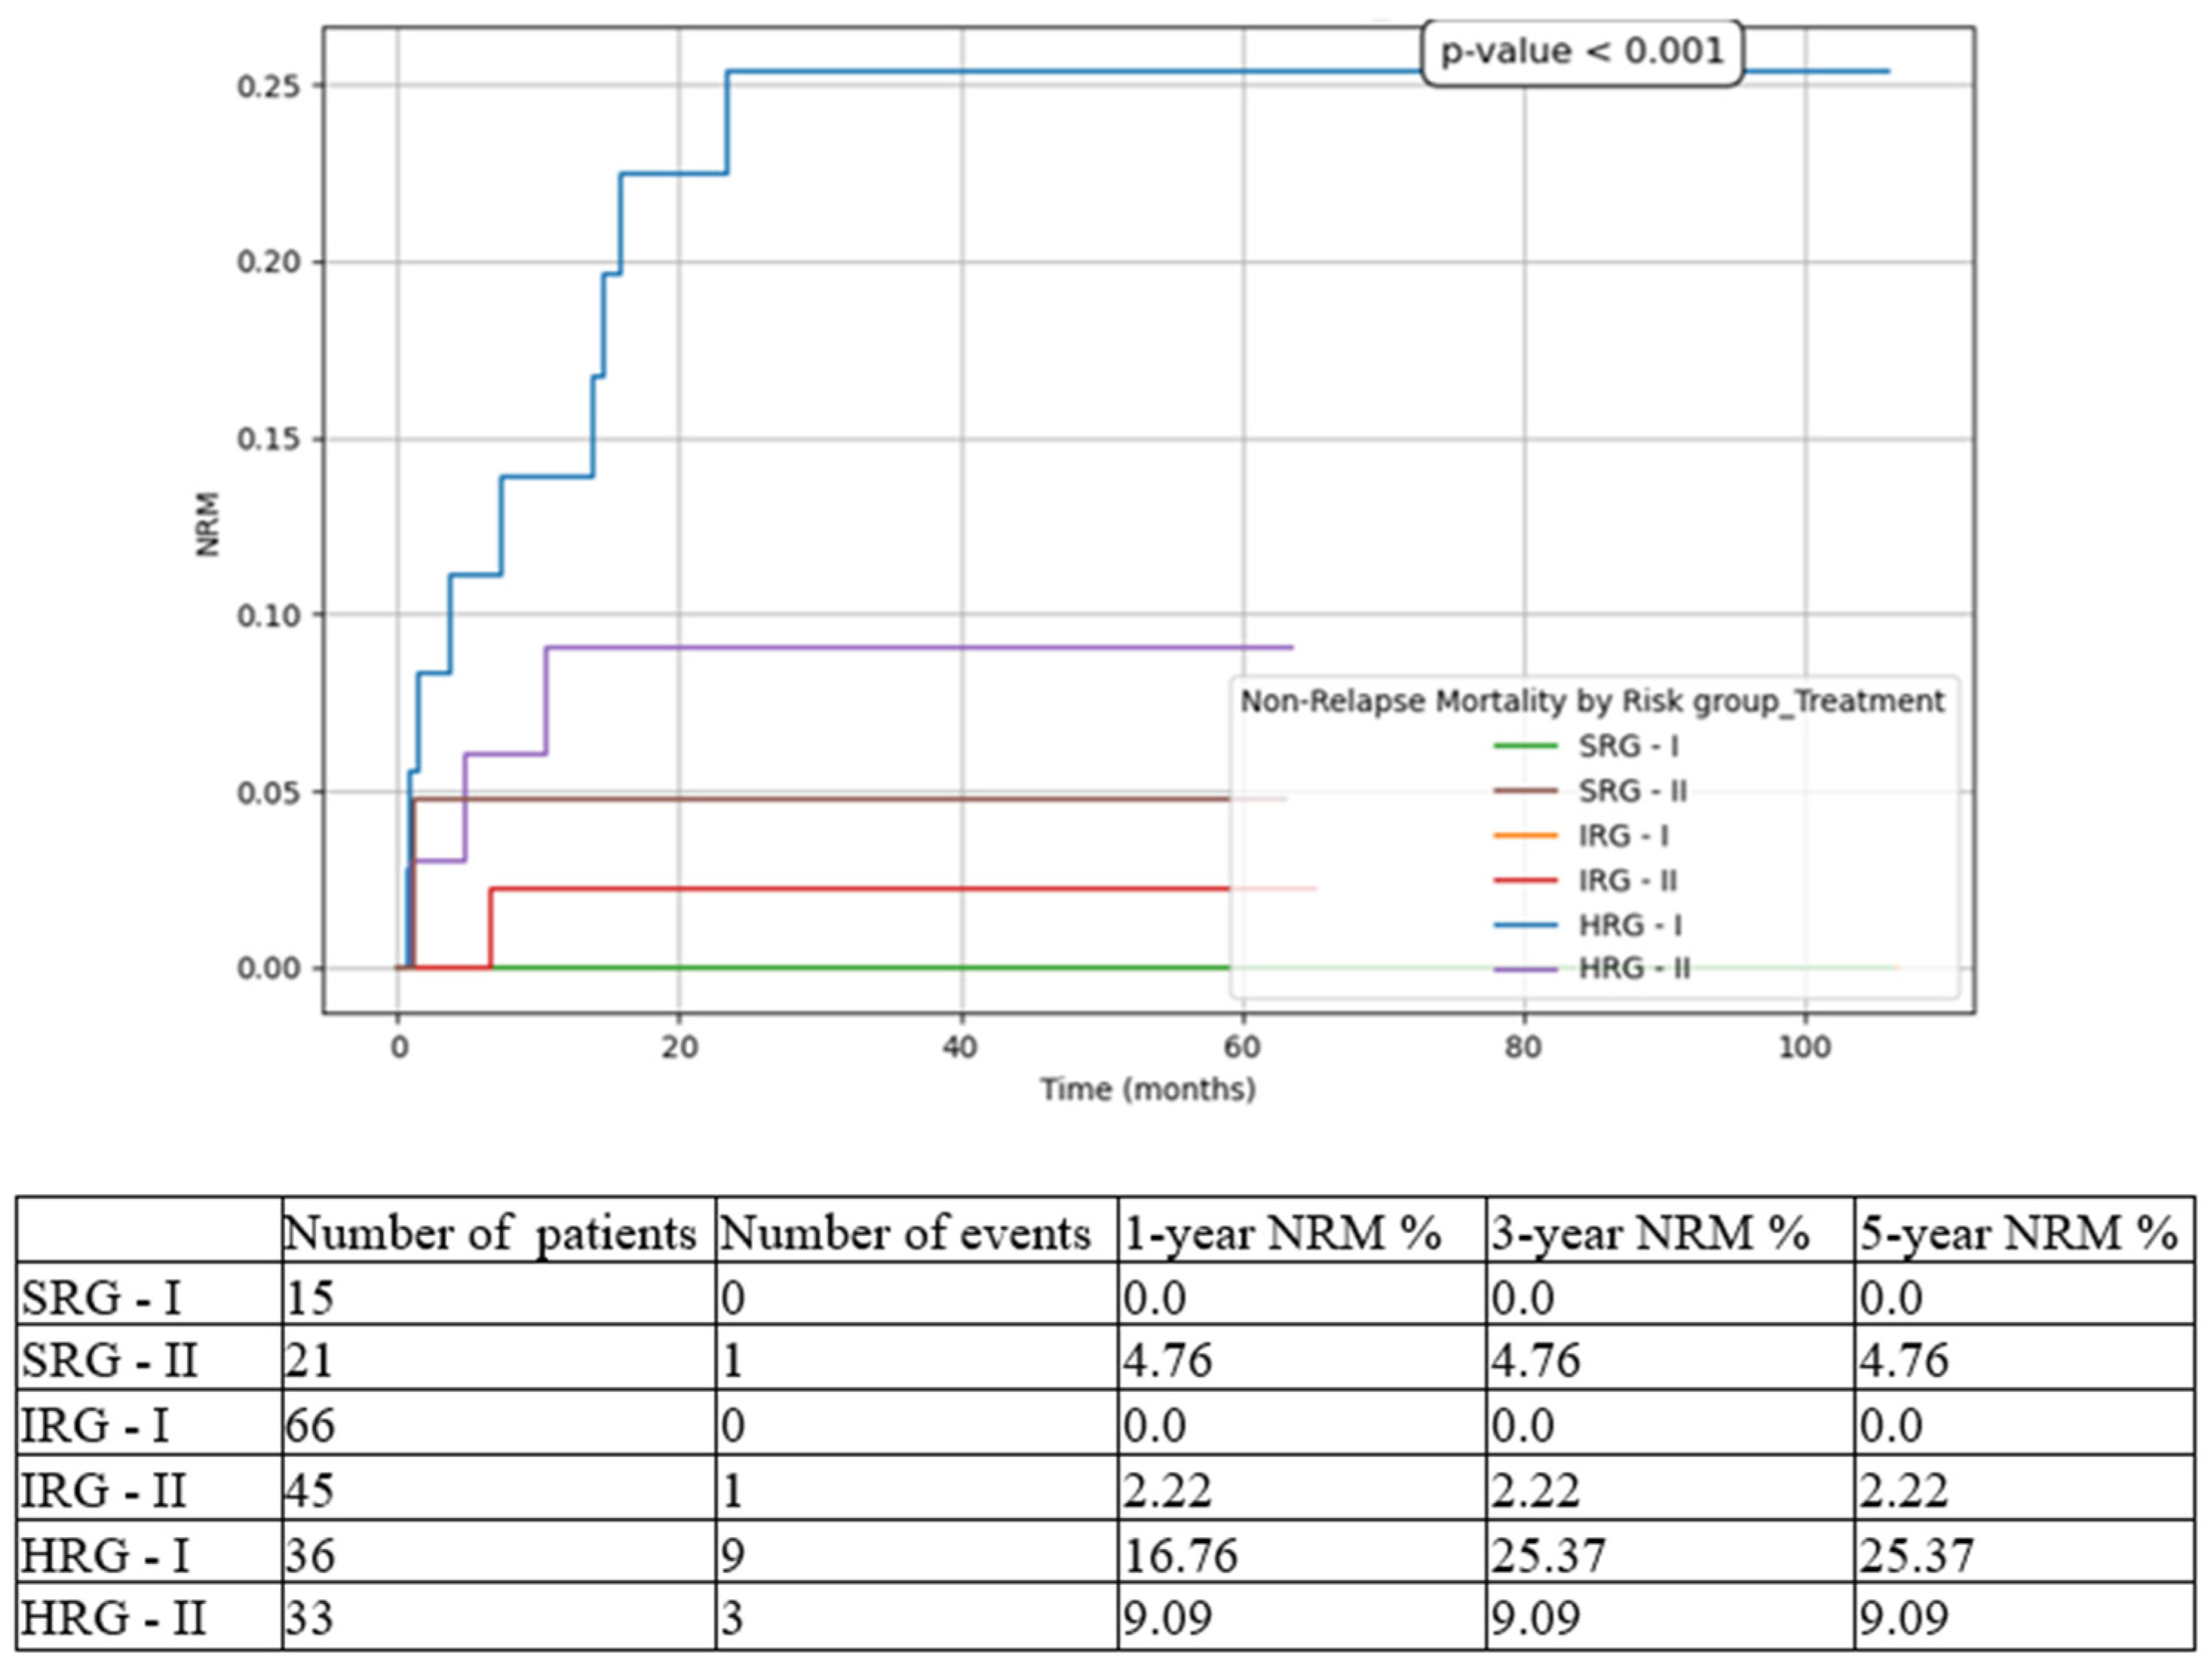

Table 1.
Overview of diagnostic characteristics for the cohort and for the two subgroups.
| Total (n = 223) | T1 (n=121) | T2 (n=102) | p value | ||
|---|---|---|---|---|---|
|
Gender |
Female | 91 (40.8%) | 50 (41.32%) | 41 (40.20%) | 0.892 |
| Male | 132 (59.2%) | 71 (58.68%) | 61 (59.80%) | ||
|
Age groups |
< 1y | 2 (0.90%) | 0 (0.00%) | 2 (1.96%) | 0.301 |
| ≥ 1y and < 10y | 152 (68.16%) | 83 (68.60%) | 69 (67.65%) | ||
| ≥ 10y | 69 (30.94%) | 38 (31.40 %) | 31 (30.39%) | ||
|
Leukocyte groups |
< 50 × 109/L | 175 (78.47%) | 97 (80.17%) | 78 (76.47%) | 0.518 |
| ≥ 50 × 109/L | 48 (21.53%) | 24 (19.83%) | 24 (23.53%) | ||
|
Morphology |
L1 | 213 (95.51%) | 116 (95.87%) | 98 (96.08%) | 1 |
| L2 | 9 (4.03%) | 5 (4.13%) | 4 (3.92%) | ||
|
Immunophenotype |
B | 196 (87.89%) | 106 (87.60%) | 90 (88.24%) | 1 |
| T | 27 (12.11%) | 15 (12.40%) | 12 (11.76%) | ||
|
Genetics_x |
Hyperdiploidy | 23 (10.31%) | 11 (9.09%) | 12 (11.76%) | 0.305 |
| Trisomy 21 | 3 (1.34%) | 3 (2.48%) | 0 (0.00%) | ||
| KMT2A | 3 (1.34%) | 1 (0.83%) | 2 (1.96%) | ||
| TCF3::PBX1 | 12 (5.38%) | 4 (3.31%) | 8 (7.84%) | ||
| ETV6::RUNX1 | 42 (18.83%) | 23 (19.01%) | 19 (18.63%) | ||
| SIL::TAL1 | 2 (0.89%) | 0 (0.00%) | 2 (1.96%) | ||
| BCR::ABL1 | 10 (4.47%) | 7 (5.79%) | 3 (2.94%) | ||
| Other | 21 (9.41%) | 13 (10.74%) | 8 (7.84%) | ||
| None | 107 (47.98%) | 59 (48.76%) | 48 (47.05%) | ||
|
Genetics_y |
Adverse prognosis | 13 (5.82%) | 8 (6.61%) | 5 (4.90%) | 0.895 |
| Favorable prognosis | 61 (27.35%) | 31 (25.62%) | 30 (29.41%) | ||
| Intermediate prognosis | 42 (18.83%) | 23 (19.01%) | 19 (18.62%) | ||
| None | 107 (47.98%) | 59 (48.76%) | 48 (47.06%) |
*n=number; y=years.
Table 2.
Overview of quality assessment in the two subgroups.
| T1 | T2 | |
|---|---|---|
| Risk stratification | SRG 12.39% | SRG 20.58% |
| IRG 54.54% | IRG 44.11% | |
| HRG 29.75% | HRG 32.35% | |
| FCM-MRD <0.05x10⁻⁴ rate at EOI | 80.7% | 87.75% |
| 5-year EFS | 70.22% | 73.79% |
| 5-year CIR | 19.04% | 18.36% |
| 5-year OS | 82.54% | 88.18% |
| Death-before-EOI rate | 5.78% | 3.92% |
| Death-in-CR rate | 5.26% | 4.08% |
| 5-year NRM | 10.77% | 7.85% |
| 5-year RFS | 80.97% | 81.76% |
Disclaimer/Publisher’s Note: The statements, opinions and data contained in all publications are solely those of the individual author(s) and contributor(s) and not of MDPI and/or the editor(s). MDPI and/or the editor(s) disclaim responsibility for any injury to people or property resulting from any ideas, methods, instructions or products referred to in the content. |
© 2025 by the authors. Licensee MDPI, Basel, Switzerland. This article is an open access article distributed under the terms and conditions of the Creative Commons Attribution (CC BY) license (https://creativecommons.org/licenses/by/4.0/).
Copyright: This open access article is published under a Creative Commons CC BY 4.0 license, which permit the free download, distribution, and reuse, provided that the author and preprint are cited in any reuse.


