
Submitted:
26 May 2025
Posted:
26 May 2025
You are already at the latest version
Abstract
Globally, groundwater resources are experiencing decline in hydraulic heads resulting from the dual effect of urbanization and climate change, thereby necessitating the need for integrated and sustainable water resources management. Urban development in cities of Kansai region, western Japan are presenting a significant challenge to sustainable groundwater resources. This study aims to assess the combined influence of urbanization and climate change on the groundwater resources of Nara basin using MODFLOW 6 for two different periods (Pre-Urbanization Period (PreUP): 1980 -1988, Post-Urbanization Pe-riod (PostUP): 2000-2008). Simulated hydraulic heads were assessed based on three different recharge scenarios: uniformly, spatiotemporally and spatially distributed. The uniform recharge scenario both overestimates and underestimates hydraulic heads, emphasizing the need for spatiotemporal variations in recharge input for groundwater flow simulation. Our findings indicate a significant decrease in groundwater heads from the PreUP to PostUP in the unconfined aquifer, attributed to the effects of land use and climate change, while the declines in deep confined aquifers are primarily influenced by climatic variations over several years. These head changes were notably evident in the interactions between surface and groundwater. Effective management of groundwater resources amidst urbanization and climate change necessitates a holistic and integrated approach.
Keywords:
numerical model
; groundwater recharge
; urbanization
; climate variability
; surface water-groundwater interaction
1. Introduction
Many regions around the world are currently experiencing rapid decline in groundwater resources due to population growth, climatic pressures and variability [1,2]. In the past 50 years, the global population has increased by 100% from roughly 4.02 billion to 8.06 billion [3]. Urban areas historically accommodated a dense population within limited space [4]; however, in recent years, these cities have experienced rapid expansion, significantly impacting global environment and placing groundwater resource under pressure [5,6,7,8,9]. This includes changes in groundwater percolation rates resulting from the prevalence of impervious surfaces [10]. Therefore, the growth of urban areas and the resulting changes in land cover have a profound effect on hydrologic processes including evapotranspiration, and infiltration affecting both surface and subsurface water systems.
The impact of climate variability has been deduced to have direct influence on surface water features such as streams and lakes due to variation in climatic variables including rainfall and temperature, but it’s effect on groundwater resources are complex having intricate connections [11]. Variation in precipitation and air temperature can influence aquifer recharge and evapotranspiration rate [11,12,13]. An exhaustive evaluation of the impacts of climate variability on groundwater resources requires accurate estimations of critical meteorological variables and groundwater recharge rates [11]. Besides, determining the spatial and temporal distribution of groundwater recharge presents significant challenges due to factors such as land use and hydrogeological variability. Consequently, estimating groundwater recharge is essential for efficient integrated river basin management strategies targeted towards safeguarding the scarce groundwater resources. Numerous studies conducted over the past two decades have assessed how climate change would affect hydraulic heads and regional groundwater recharge in various regions of the world, indicating that these changes may have either favourable or adverse consequences [14,15,16,17]. Based on 16 Global Climate Models (GCM), deep aquifer recharge will either rise or reduce by approximately 10% by 2050 in the High Plains aquifer, USA [15]. Research conducted on the Mancha Oriental aquifer system in Spain, which assessed the response to groundwater resources to changing climate and land use revealed a significant reduction in groundwater recharge for all scenarios where climate change has greater impact than land use change [18].
Various models have been employed to evaluate the effects of climatic variability and land use alterations on surface and groundwater resources, such as hydrological models [10,19,20,21,22], groundwater numerical models [23,24] , and integrated model such as SWAT-MODLOW [1,25,26]. MODFLOW is a three-dimensional groundwater flow model that adopts the finite-difference method for the simulation of groundwater flow [27]. Coupled hydrological and hydrogeological models are often used to simulate both the surface and groundwater systems, however the inherent assumption in these models makes it difficult to adjust and assess certain parameters and variables [18]. If appropriately constructed and calibrated, numerical models that include spatiotemporal heterogeneity offer the most reliable method of estimating the effects of changing land use and climate on groundwater systems [18]. However, in the previous studies, the combined effects of urbanization and climate variability on groundwater environment are not well examined considering spatiotemporal variation in groundwater recharge.
Therefore, this study is aimed to evaluate the combined influence of urbanization and climate variability on the groundwater environment in a basin scale between two periods (Pre-Urbanization Period (PreUP): 1980 -1988, and Post-Urbanization Period (PostUP): 2000-2008) using numerical model. The specific objectives include: 1) the assessment of groundwater heads on three different recharge scenarios; uniform, spatiotemporally distributed, and spatially distributed, 2) evaluation of surface water and groundwater interactions over the entire basin for all the scenarios.
2. Study Area
2.1. Geography of Nara Basin
Nara Basin (34° 23' 7'' ~ 34° 46' 48'' N, 135° 39' 15'' E ~ 135° 56' 50'' E), a landlocked catchment located in Nara Prefecture of Western Japan and surrounded by the Ikoma and Kongo Mountains to the west, Ryūmon and Kasagi Mountains to the South and East, respectively (Figure 1). The catchment boundaries obtained from Wang et al. [21] has an approximate area of the intermontane basin is 714 km2 with about 56% and 45% coverage for the plains and mountains, respectively [21]. The elevation ranges from 200 – 1000m on the hills whereas the plain area spans approximately 16 km from east to west and 25 km from north to south (Figure 1). Nara plain encompasses roughly 300 square kilometres, featuring an elevation ranging from 40 to 100 meters [28]. The long-term (30 years) average annual precipitation and mean temperature of about 1450 mm/year and 14oC respectively over the entire basin [29]. Nara Basin has a characteristic rainfall pattern which is uneven both spatially and temporally, rainy season occur between June and July, and typhoon season with higher rainfall from September to October [29].
The main river in the Nara Basin is the Yamato River, extending 68 km in length with a catchment area of 1077 km2 [19]. It originates from the Kasagi Mountain with steep flow and subsequently flowing into the Nara plains connecting with tributaries downstream. Transversing the central region of Nara basin, Yamato River flows gently westward thereby depositing its sediments and exiting into the Osaka plains downstream [28,30]. The steep gradient of the Yamato River upstream leads to rapid water movement that swiftly transitions into its middle course, coupled with its low water retention capacity during significant flooding [28]. Conversely, during prolonged dry seasons, the river tends to dry up rapidly due to its interaction with groundwater resources beneath the basin [28].
2.2. Hydrogeology of Nara Basin
The Nara basin is primarily characterized by a sequence of north-south movements in the earth's crust that took place during the late Pliocene and Pleistocene epochs, along with east-west compressions that followed the Pleistocene period [31]. The geological structure of the Nara Basin is based on the bedrock of the Ryoke belt (Granite), outcropping on the mountains, overlain by the Upper and Lower Osaka Group (Plio-Pleistocene) sedimentary layers consisting of interbedding layers of sand, gravel, marine and non-marine clay conglomerates (Figure 2) [30]. The alternating beds of marine and non-marine clay, sand and gravel forms various hydrogeological units (aquitards, and aquifers) that define the groundwater resources in Nara Basin. Above the Osaka Group are the terrace deposits along the foothills, whereas alluvial deposits dominate the surface of plains and cover over 60% of the basin. In addition, several faults can be identified in Nara Basin including the Nara-Toen fault in northeastern part, and the southwestern Kongo fault spanning from North to South which forms the rift valley of the Nara Plain [28,30].
Both shallow and deep groundwater resources are spatially distributed in Nara plains, and in fractured rocks in the southern part of Nara Prefecture. Percolating surface water reaches the deep aquifers in the northern part of Nara [32]. Moreover, along the foothills of Ikoma, Katsuragi and Kongo mountains, deep groundwater resources in confined aquifers are present due to the predominate gravels and coarse terrace deposits in this region [28]. Groundwater discharge occurs in the center of the basin along the Yamato River because of the low hydraulic heads and the connectivity of the river with the water table in the basin. The hydrogeological units are separated by both marine and non-marine clays in different layers in the subsurface, where the alluvial plain of sand and gravel serves as the basin's major aquifers [30,33].
2.3. Land Use Classification of Nara Basin
The dominant land use types in Nara plain are urban and rice paddy. For the purpose of analysis, the various land use types are sub-divided into pervious and impervious surfaces as shown in Table 1. Agriculture in the Nara Basin has advanced swiftly from ancient times, establishing Nara as an important agricultural region of Western Japan [21]. However, urban development is rapidly growing a rate is greater than agricultural expansion (Figure 3). From 1987 to 2006, the built-up area transitioned from the second most prevalent land use type to the first, experiencing an approximate increase of 38%. In contrast, the area dedicated to rice paddy cultivation saw a decline of about 20%. Surrounding the Nara plain are the mountains classified into four forest regions with varying vegetation distribution which includes evergreen coniferous vegetation, broad-leaved evergreen vegetation type, shrub and bamboo forests [19,34,35].
Prior studies conducted in Nara basin unveil the drastic change in land use due to urbanization between 1976 and 2016, and the increasing percent imperviousness of urban regions (PIU) thereby resulting in a rapid decline in the recharge rates over the basin [10]. The PIU of the northern and southern part of Nara Basin increased by 14% and 16% respectively from the 1970s – 2010s. The impervious land use types (Built-up, Roads, Public areas) have the least groundwater recharge with values less than the recharge experienced in pervious land use type (Rice-paddy, and cropland) by 10%. Additionally, the hydraulic heads and estimated recharge rates in Nara basin have been evaluated using various methods including numerical models, water balance method coupled with groundwater temperature profiles, heat-flow techniques and hydrogeological models [30,33,36,37]. However, there has been no research on the impact of land use and climate variability on the hydraulic heads in Nara basin.
3. Methods
3.1. Data Collection
For this study, hydrological, geological and groundwater abstraction datasets were collected. SRTM 1 Arc-Second Global dataset was obtained from the United States Geological Survey (USGS) and used as the elevation data [38]. The surface geological and soil map were obtained from the Ministry of Land, Infrastructure, Transport, and Tourism of Japan (MLIT) [39]. Additionally, hydrological datasets including river stages for the simulated rivers in Nara Basin were obtained from the Nara Prefecture River Information System (a subsidiary of MLIT) [40]. High-Resolution Land use raster (with a spatial resolution of 30 meters) was obtained from Japan Aerospace Exploration Agency (JAXA) Earth Observation Research Center (EORC) [41].
The recharge datasets inherited from a previous research force on the long-term water balance of the Yamato River Catchment, utilizing Soil & Water Assessment Tool (SWAT) to analyze the spatial and temporal distribution of both surface and groundwater recharge influenced by urbanization and forest growth [10,19]. This study employed two periods between (1989 -1998) and (1999 -2008), records the shallow and deep percolation from SWAT output in subbasin scale, and were integrated into the groundwater flow model for the assessment of the impact of urbanization on groundwater flow dynamics. Furthermore, comparing the effects of spatiotemporally distributed versus constant recharge in the Nara Basin for groundwater simulation, an estimated annual groundwater recharge rate of 450 mm/year was derived from the study by Taniguchi (1994) [37], which utilized type-curve approach based on the temperature-depth profiles of groundwater.
Groundwater abstraction datasets were obtained from the individual city office in charge of water supply in Nara Basin [42,43]. The location of the pumping wells are shown in Figure 2 above with depth ranging from 2 - 50 meters, including the industrial areas with wells pumping at different rates ranging from 100 – 7000 m3/day from the deep confined aquifers. Besides, the regions surrounding the Yamato River at the center of the basin have the largest groundwater abstraction.
3.2. Groundwater Flow Model
3.2.1. Conceptual Model of Nara Basin
The conceptual model of Nara Basin was designed based on the available geological, hydrological and hydro stratigraphic datasets. The surface geological map unveils the bedrock in the northeastern – southeastern part of the basin along the Nara-Toen fault, therefore a no-flow boundary was assigned. Also, another no-flow boundary condition was assigned to the western part of the basin due to the impermeable surfaces of the Ikoma and Kongo mountains. Whereas the groundwater-divide between the Nara Basin and the Kizu River Basin, as indicated by the regional groundwater head table, demonstrates a hydraulic no-flow boundary in the northern region [30]. A defined head boundary was assigned at the outlet of the Yamato River which was also adopted in previous studies conducted in this basin [30,33].
The hydro stratigraphic units of the subsurface including aquifers and aquitards in Nara Basin was developed by examining, analyzing and simplifying the lithologic descriptions contained in 10 borehole logs [44] along West -East cross-section of the Nara Plain as shown in Figure 4 below. The hydro stratigraphic layers identified from the careful examination of the cross-sections include three layers of Deep Confined Aquifers, one Shallow Confined Aquifer and an Unconfined Aquifer, separated by marine and non-marine clay layers. The clay layers function as confining beds (Aquitards). The thickness of the unconfined aquifer (UAC), shallow confined aquifer (SCA), and the three deep confined aquifers (DCA) ranges from 6m – 20m, 30 – 40m, 55m, 40m, and 70m respectively in the Nara Plain. Additionally, the aquitards increase in layer thickness and layer continuity with depth, while the lateral variations of layer thickness decrease significantly from the SCA to DCA.
The rivers were simulated using the head-dependent flux boundary condition, particularly the Stream Flow Routing Package, while the specified flux boundary condition (recharge package) was used for the recharge. The river stage datasets, reach, width and hydraulic conductivity of the riverbed obtained from MLIT [45] were assigned for the computation of riverbed conductance.
Figure 4.
Model grid and boundary conditions.
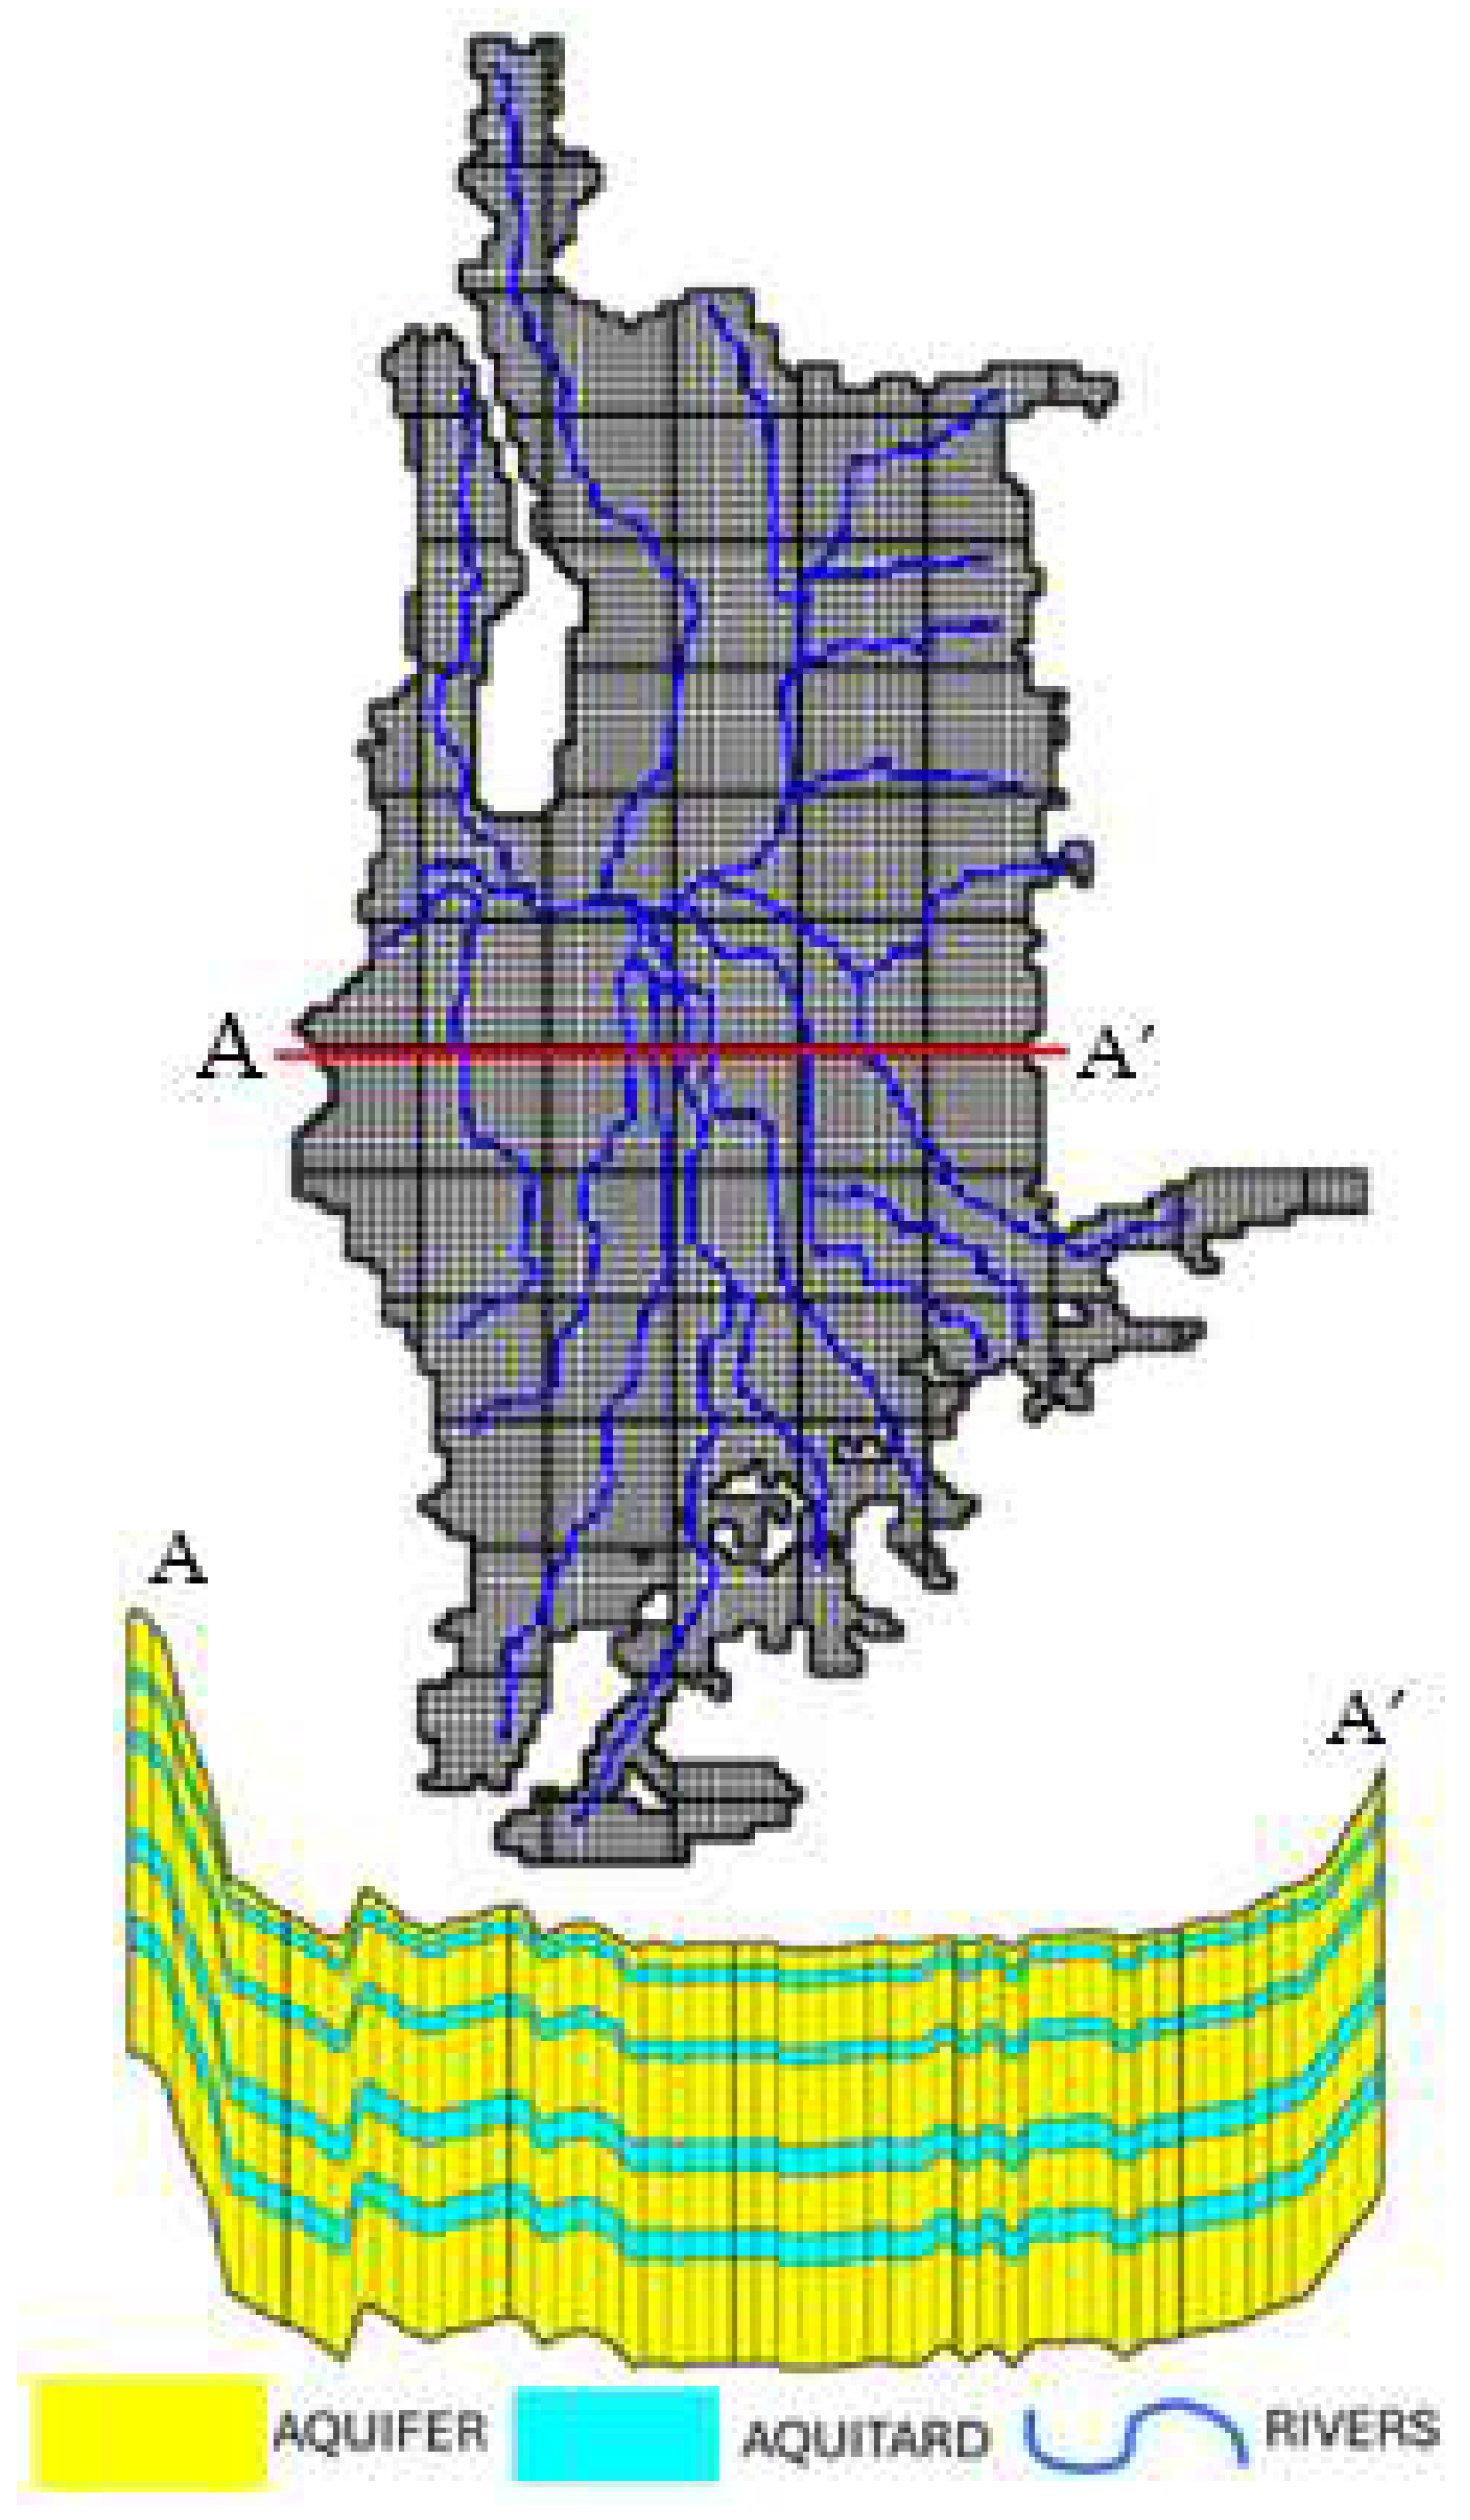
3.2.2. Construction of the Numerical Model
A three-dimensional numerical groundwater flow model of Nara Basin was constructed using MODFLOW 6 which is an open-source software developed by the United States Geological Survey (USGS) [27] coupled with the ModelMuse graphical user interface (GUI) which helps to aid input files preparation and visualization of the model result. MODFLOW 6 is a fully distributed model that uses generalized control-volume finite-difference method for solving groundwater flow equations. It is an object-oriented, modular platform leveraging an adaptable and extendable architecture to combine groundwater flow and transport operations [27]. Furthermore, one of the uniqueness of MODFLOW 6 unlike previous versions is the Discretization by Vertices (DISV) for unstructured grid for modelling of faults, fractures and complex geology.
The study area (Nara basin) was discretized into a model grid size of 300 x 300m, with 145 rows, 85 columns, and 9 layers, consisting of 5 aquifers and 4 confining beds (aquitards) as shown in Figure 4. The total number of active cells over the entire basin is 49231 cells. The model top was defined using SRTM 1 Arc-Second Global dataset obtained from USGS [38] whereas the subsequent layers thicknesses were determined based on the cross-sectional interpretations of over 80 boreholes logs obtained over the basin (Figure 4). The initial hydraulic heads were defined as the top surface of the model for a steady-state groundwater flow model, the output of which was subsequently utilized for the transient groundwater flow model simulated over the period 2000-2008. The transient simulation was conducted for the assessment of the annual variations in groundwater flow dynamics, and this was put into consideration when selecting the stress periods and time step.
The MODFLOW packages used include the Multi-Aquifer Well package for simulating municipal and industrial groundwater abstraction, Streamflow Routing package for stream upstream and downstream rivers in a connected manner, Recharge package, and the Time-variant specified-head package. The model input parameters are the horizontal hydraulic conductivity, river heads, well pumping rate, riverbed hydraulic conductivity, groundwater observations, and the spatiotemporal recharge rate [10,37]). Moreover, the streamflow routing package which is synonymous to the river package was used for the assessment of surface water and groundwater interactions in Nara Basin.
3.2.3. Model Calibration, Performance Evaluation and Sensitivity Analysis
Model calibration was performed using hydraulic heads datasets of observation wells spatially distributed over the Nara plain as shown in Figure 2. Daily groundwater head time series were collected from 13 sites and subsequently aggregated into yearly time series from 2000 to 2008 [45].
In this study, manual calibration coupled with an Independent Parameter Estimation (PEST) was performed by varying the hydraulic conductivities, river conductivity, specific yield and specific storage iteratively until a good fit was achieved. PEST adopts the inverse modelling and advanced regularization technique for the estimation of model parameters with the aim of achieving the minimum differences between measured and simulated hydraulic heads [46]. The steady state model was first calibrated using long-term averages of observed hydraulic heads which was followed by the transient state model calibration.
While the recharge remained constant during model calibration, it was utilized for scenario analysis of the effect of recharge input on the hydraulic heads in Nara basin. At each phase of the calibration process, the simulated hydraulic heads were compared with the observed heads using the following model performance metrics: Root Mean Square Error, Correlation coefficient, and Water Balance Error (WBE). The calibration process was halted after attaining a good fit between the simulated and observed heads.
Where hobs, hsim and n are the observed head, simulated head, and the total number of observed data respectively.
3.2.4. Scenario Analysis for Varying Recharge Input
The impact of varying recharge input on the groundwater system was examined based on three scenarios: Uniform recharge scenario (Scenario A), spatiotemporally distributed recharge scenario (Scenario B) and spatially distributed temporally averaged scenario (Scenario C). For Scenario-A, an estimated annual groundwater recharge rate of 450 mm/year was derived from the study by Taniguchi (1994) [37], which utilized type-curve approach based on the temperature-depth profiles of groundwater. This recharge rate was applied over the entire basin and the simulation period.
The spatial and temporal distribution of groundwater recharge datasets for Scenario B were obtained from the previous research analyzed impacts of urbanization and forest growth on the long-term water balance in Yamato River Catchment using Soil & Water Assessment Tool (SWAT) [10,19]. This study employed two periods between (1989 -1998) and (1999 -2008), records the shallow and deep aquifer recharges from SWAT output in subbasin scale, and were integrated into the groundwater flow model for the assessment of the impact of urbanization on hydraulic potential and surface water-groundwater interaction. The SWAT hydrological model output for the Yamato River Catchment, derived from 39 subbasins, was retrieved and subsequently clipped to the Nara Basin, revealing both geographically distributed and annual fluctuations in groundwater recharge rates over the specified simulation period. Whereas for Scenario C, 9-years average of the scenario B dataset were used thereby suggesting only spatial distribution (no temporal variation). The spatial variation of average recharge at PostUP shows the highest recharge rate in the paddy fields followed by other pervious land use types including croplands and orchards, and lowest in the urban areas. However, PreUP forest land use exhibits the highest recharge rates followed by the paddy fields and pervious surfaces, and lowest in the urban and impervious areas. This is due to the large macropores in forest areas influencing more groundwater recharge [19].
For the evaluation of the importance of spatial variation and temporal variation of recharge input over the basin, the simulated head difference between Scenario A and Scenario B (A minus B), and Scenario B and Scenario C (B minus C) respectively were used.
3.2.5. Evaluation of the Impacts of Climate Variability and Urbanization
The groundwater flow model was simulated for two different periods post-urbanization (PostUP) 2000 – 2008, and pre-urbanization period (PreUP) 1980 -1988, for the evaluation of the influence of urbanization and climate variability on hydraulic heads and surface water and groundwater interactions in Nara Basin. The baseline simulation period is PostUP. However, the calibrated transient model was also simulated for PreUP with different land use and climate conditions to assess both the effect climate variability and urbanization on the baseline simulation period. Based on the data obtained from the Japan Meteorological Agency [29], the climate of the PreUP, considered historical, have greater rainfall compared to the PostUP. Between the historical and current climate (PreUP and PostUP), the total rainfall over Nara Basin decreased by 1.5%. Also, the 9 years averaged daily mean, minimum and maximum temperature over the basin between the PreUP and PostUP increased by 8%, 12%, and 7.5% respectively. Whereas solar radiation increased by about 4% from 12.6 MJ/m2 to 13.1 MJ/m2 which corresponds to the increase in mean temperature thereby resulting possibly in a proportionate rise in evapotranspiration and decrease in groundwater recharge. Wang et al. [10] estimated a decadal rise in total evapotranspiration in the forested regions (Ikoma, Kasuga, and Kongo) by 33%, 6% and 15 % between the PreUP and PostUP due to the climate change, forest growth and anthropogenic influences.
According to Wang et al. [10] groundwater recharge to deep aquifer (excluding baseflow) decreased between the PreUP and PostUP by 28% from 123 mm/year to about 94 mm/year, however surface runoff increased by 27% between the two periods. It is evident that alterations in climatic parameters, specifically decrease in rainfall and increase in temperature by 1.5% and 8% respectively, cannot alone explain the 28% decline in groundwater recharge to the deep aquifer; hence, changes in land use, notably urbanization, also significantly contribute. The increase in surface runoff can be traced to the urban expansion in Nara basin and the rise in percent imperviousness of urban regions over the past 50 years [10]. Therefore, it is necessary to access the combined impact of climate variability and urban expansion.
Pixel analysis and zonal basic statistics were performed to assess the combined impact of urbanization and climate variability on hydraulic heads in Nara Basin. analysis of the pixels that maintained the same land use between the two simulated periods (PreUP and PostUP) was conducted to examine the stand-alone impact of climate change over the basin, whereas the pixels with experienced changes in land use from other land use types to urban were analyzed for the combined impact of climate variability and urbanization.
4. Results and Discussion
4.1. Estimation of Hydraulic Heads
The comparison between the measured hydraulic heads and the simulated heads at the observation wells (Figure 1) from the model based on the spatiotemporally distributed scenario is shown in the scatter plot below (Figure 5). The result reveals a good fit between the observed and the simulated heads with a high R2 value of 0.95, and a low RMSE value of 3.97, indicating a precisely calibrated model. This outcome is deemed an acceptable correlation with the observed values and considerably better than the prior work by Pathak et al. [30], which reported an RMSE value of 9.7m. More than two-thirds of the residual values obtained from deducting the simulated heads from the observed heads falls between -3.5- and +3.5-meters. The remarkable model performance is attributed to the availability of datasets in these regions which aided the accurate simulation of the observed hydraulic heads.
The model slightly overestimated the hydraulic heads in most of the observation wells. Overestimated points with residuals greater than 3.5 meters could be found in Imaizumi (OBS_4), Nishikujo (OBS_13) and Oji_Temple (OBS_7) observation points (Figure 5), which could be due to uncertainties in the no-flow boundary condition, undeclared groundwater abstraction and the slight overestimation of groundwater recharge in these regions. These residuals were notably larger prior to calibration and were rectified by adjusting the uncertain model parameters outlined in the preceding section. The overestimation in Nishikujo could be linked to undeclared groundwater abstraction by farmers for paddy rice irrigation in this region. Although the Oji_Temple and Imaizumi locations are close to the hilly regions of Mt. Ikoma and Mt. Kongo, which are classified as a no-flow boundary based on the surface geological map, the land use map reveals that these mountains are forested and are estimated to undergo significant evapotranspiration [19].
Whereas, underestimated hydraulic heads with residuals below -3 meters are only limited to Bojo_Castle (OBS_1) and Tenrikita (OBS_10) (Figure 5) because of the underestimation of recharge particularly in OBS_1 which is located in the fan shaped area of Mt. Katsuragi capable of storing large recharge due to its coarse-grained conglomerates [47].
Groundwater is being pumped out from both shallow and deep wells for domestic and industrial use in Nara Basin, especially in Yamatokoriyama city with the aid of abstraction wells as shown in Figure 2. This region is known for over abstraction beyond recovery rate of the aquifer thereby resulting in significant lowering of the ground-water pressure head. Figure 6 illustrates a spiral blue hue seen in the deep aquifers (DCA1-3), indicative of substantial aquifer depletion exceeding the replenishment rate due to overextraction. Furthermore, the pumping activities also changes the groundwater flow leading to greater hydraulic gradient in the region of depletion.
4.2. Scenario Analysis for the Impact of Varying Recharge Input on Hydraulic Heads
The results of the simulated hydraulic heads for the three distinct recharge scenarios (A-C) during the period from 2000 to 2008 are presented in Figure 6. However, the simulated results along the northeastern and southern boundaries were not displayed as a result of the uncertainty in the simulated heads which could have been influenced by the no flow boundary conditions at the boundaries of the basin. The assignment of no-flow boundaries at the boundaries of the basin resulted in the accumulation of groundwater in nearby cells due to constrained lateral flow resulting in unrealistic hydraulic heads.
The hydraulic heads for all layers and all scenarios could be observed to follow the topography of the basin with low hydraulic heads in the center of the basin and high hydraulic heads in the northern and southern of the basin, thereby creating a hydraulic gradient that propels groundwater from the north and south to the midwestern part of the basin. The distribution of simulated hydraulic heads exhibits consistent patterns across all levels and situations, aligning with previous research in this basin conducted by Pathak [30].
Scenario A reproduced the highest hydraulic heads in all the aquifers with maximum hydraulic heads of 188m, 173, 145, 114, and 105m respectively for all the five aquifers, from UCA to DCA-3 (Figure 6a). RMSE of around 5.8 was detected when compared with observed heads, exceeding the values of the other two scenarios (Scenario B and C: 3.97) , indicating the overestimation of hydraulic heads in the forested areas of the basin and underestimation of hydraulic heads in the urban areas with impervious surface. Whereas scenario B in which spatial and temporal distribution of recharge were considered, reproduced a near precise hydraulic heads simulation with a root mean square error of 3.9 when compared with the observation heads (Figure 6b). The hydraulic head difference between scenario A and B (A minus B) as shown in Figure 7a is averagely about 3.6 meters with a minimum and maximum head difference of -13 and 30 meters at the eastern and northern boundaries of the basin. Overestimation of hydraulic heads in scenario A is prevalent generally over the basin because of the variation in land use types over the basin except for the eastern side where underestimated heads could be observed. The forest land use type had the greatest head difference of around 13 meters, attributable to the high recharge in forested areas due to the presence of macropores from broad roots, hence rendering the uniform recharge strategy inadequate. Pixels with permeable land use classifications, such as paddy field, cropland, and water, have the lowest overestimated mean head difference of 1-3 meters, since these areas are regarded as recharge zones with high recharge rates. Pixels characterized by impermeable land use categories, including urban areas, public spaces, recreational zones, roadways, and barren ground (rocks), have a greater overestimated mean head difference of 3 to 9 meters due to minimal or non-existent recharge in these regions and overly estimated by scenario-A. Whereas the underestimated region in the eastern part of the basin a paddy field subbasin at the base of the Mt. Kasuga with flow through fractures and faults that possibly recharge the groundwater in this region and neglected by the uniform recharge scenario. Moreover, the variation in simulated average heads difference between the two scenarios increases transitioning from the UCA to the DCA with about 5 meters heads difference in the deepest aquifer. This is because the deep aquifer recharge in Nara Basin is lower that the unconfined and shallow aquifers which is overestimated by scenario A. The uniform recharge scenario both overestimates and underestimates the hydraulic heads and therefore underscores the necessity of considering the spatial and temporal variations of recharge input for groundwater flow simulation.
The spatially distributed scenario C (with no temporal change) which accounted for the 9 years averages of recharge over the basin shows similar values of simulated heads distribution with scenario B as shown in Figure 6c. To evaluate the impact of temporal variations of recharge, the head difference between scenario B and scenario C was calculated. The results as shown in Figure 7b indicate a mean hydraulic head difference of 0.4 meters across the basin with a maximum and minimum head difference of 0.5 meters and -8 meters respectively in the top aquifer; however, the head difference becomes negligible transitioning from the top aquifer to the deep aquifers. The maximum head difference (underestimated head) is prevalent in the forested pixels which have been mentioned earlier to have been influenced by forest growth that occurred over the decades, causing evapotranspiration increase and the significant temporal variation in recharge which was not accounted for in scenario-C. While other land use types have mean head difference value between -1.2 to -0.2 meters because of less significant temporal change over the decade. Hence, spatial distribution of recharge significantly influences the groundwater modelling of hydraulic heads more than the temporal distribution. The result obtained from this study also aligned with transient groundwater flow research conducted on the Grand Forks unconfined aquifer which revealed a greater effect of spatially distributed recharge scenario than temporal distribution effect when compared with constant scenario [17]. Similarly, Awan et al. found that integrating hydrological models, water balance models, and remote sensing techniques improved recharge estimates by considering spatial variability [48]. However, in Karstic regions the effect of climate variability is more pronounced in regions characterized by subsurface heterogeneity compared to regions with subsurface homogeneity [49].
Therefore, groundwater models are powerful tools that could either reproduce the true state of groundwater resources in a basin or an unrealistic overly or underly estimated state. This underscores the importance of incorporating spatiotemporal variations of input datasets with numerical models for effective assessment of groundwater resources.
4.3. Impact of Recharge Input on Surface Water and Groundwater (SW-GW) Interactions
The interaction between the river and aquifer across three distinct scenarios has been investigated by estimating the volume of water that flows from the river to the aquifer and the groundwater discharge into the river. The results as shown in Figure 8 reveals that groundwater discharge from the unconfined aquifer is notably greater than river seepage into the aquifer for all scenarios with a volume of 1400-2200 million cubic meters (MCM), while the river seepage is around 469 - 545 MCM. The recharge of the intermontane aquifer is mostly by precipitation as shown in Figure 8, where the rainwater recharge exceeds the river seepage into the aquifer. The volume of both the river seepage and groundwater discharge into the river are higher in scenario A than scenario B and C which is because of the overestimation of recharge rate in the uniform recharge rate scenario. In comparison with scenario B and C, the rainwater recharge was overestimated by about 55% resulting in 48% and 16% increase in groundwater discharge to the river and river seepage to the aquifer respectively in Scenario A. Moreover, there is little or no difference between the spatiotemporally distributed and spatially distributed scenarios. Therefore, it could be deduced that the effect of temporal distribution of recharge over a basin is less than the effect of spatial distribution.
4.4. Effect of Climate Variability and Land Use Change on Hydraulic Heads and SW-GW Interactions
Hydraulic heads of the basin were simulated using spatiotemporally distributed recharge for two distinct periods: the historical climate (PreUP) and the contemporary climate (PostUP) with substantial land use alterations. Urbanization plays a critical role in the decline of hydraulic heads due to the increasing impervious surfaces which impede groundwater recharge. Nara basin witnessed a tremendous urbanization between 1970 – 2010, with increasing the percent imperviousness of urban region by 20% thereby resulting in the rapid decline in the ratio of groundwater recharge to precipitation [10]. The average decrease in hydraulic heads (PreUP minus PostUP) over the basin in all the layers from unconfined to deep confined aquifers are 5, 4.3, 4.2, 4.1, and 4 meters respectively (Figure 9a). Slight change in hydraulic head can be observed in the Nara plain around the Yamato River, while significant change occurs in the forested mountains regions. In UCA and SCA, a maximum head difference of about 15 meters as shown in Figure 9a, and b (the former displays all pixels across the basin, and the latter illustrates pixels that retained the same land use), can be observed in the forested areas along the boundaries in the eastern, northern and western side (Figure 3). This could be because of the increasing evapotranspiration rate over Ikoma, Sakurai, Kongo and Kasuga forested areas between the period of 1980 -2010 [19]. Similar research conducted by Toure et al. [50] in the Kiela basin, Southern Mali using Global Climate Models and MODLFOW reveals an average hydraulic head drop of 15 meters from the past and future climate (1970–2010; 2010–2050) due to decrease in groundwater recharge. Between the two different periods (PreUP: 1980 -1988, and PostUP: 2000 – 2008)) the cumulative volume of groundwater discharge to the river decreased by 16% whereas the river seepage volume increased by 27% from period 1 to 2 reflecting the severe lowering of hydraulic heads in certain areas along the river sections due to reduced recharge influenced by increasing evaporation and urban expansion and thereby resulting in the increase of river seepage to the aquifers.
Furthermore, analysis of the pixels that maintained the same land use between the two simulated periods was conducted to examine the stand-alone impact of climate change over the basin (Figure 9b). The premise of this analysis is that, given the absence of land use change in this pixel, the sole factor affecting groundwater levels must be the alteration in recharge attributable to climate variability. The result reveals an average simulated head decline of about 3.3 meters in the UCA, 3 meters in the SCA, and declines of 2.9 meters in the DCA1-3 (Figure 9b). Therefore, the impact of reduced recharge resulting from climate variability is more significant in the UCA and SCA compared to the DCA, particularly in the impervious land use types with a mean decline in hydraulic heads between 2.25m – 3.61m, while the pervious land use types experienced just a slight decline in hydraulic head with values ranging from 1.3m -1.7m. The impervious surfaces, including urban zones, public spaces, and barren terrain (rocks), intensify the influence of climatic variability on water availability for recharge by preventing infiltration, whereas the pervious layers are only affected by climate variability. Deep aquifers are more affected by groundwater over abstraction, unlike the unconfined and shallow aquifers which are highly influenced by climate variability including changes in temperature and precipitation [51,52].
For the assessment of the combined influence of urbanization and climate change on the hydraulic heads, the pixels that witnessed land use change to urban type were analyzed. The average decline in simulated head is about 0.5 meters in the UCA and SCA, and a decline of 0.4 meters in the DCA. However, among the various land use types that changed to urban between PreUP and PostUP, the cropland, orchard, public-area and forest land use had the greatest mean head difference of 4m, 3.7m, 3.7m, 3.7m, 3.7m, and 5m respectively in UCA and 3.4m, 3.7m, 4.3m and 5.1m respectively in SCA. The mean hydraulic head difference is maximum in the change of forested land use types (known for high infiltration and percolation rate due to presence of macropores from root channels, and organic matters) to urban implying change from permeable macropores to impermeable concrete surface thereby significantly affecting groundwater recharge and hydraulic heads. Besides, cultivated lands and public areas exhibit significant declines in hydraulic heads due to urbanization. The former is attributed to irrigation percolation and recharge via drains and canals, while the latter results from parks and public gardens with permeable surfaces that facilitate groundwater recharge which are all eradicated due to urban expansion, thereby negatively influencing the groundwater resources. Typically, in Japan, orchards and paddy rice are often cultivated at the base of hills which are highly permeable areas due to the dominance of permeable soils formed by terrace deposits, gravels and sands. Therefore, the expansion of urban areas to these regions reduces natural infiltration thereby posing serious threat to groundwater resources.
Additionally, climate variabilities including decreased precipitation by 1.5%, increased temperature and solar radiation by 8% and 3.8% respectively play a crucial role in increasing the rate of evapotranspiration over the basin, thereby reducing the amount of recharge to shallow and deep aquifers. The paddy fields which are often inundated or flooded during the planting season also witnessed 1.5m, and 2m drop in hydraulic heads in UCA and SCA after urbanization. The slight hydraulic head decline due to urbanization from paddy field relative to the cropland and forest is attributable to the partial urbanization observed in the paddy field regions, as illustrated in Figure 3b, where urban and paddy field pixels are interwoven. This indicates that the paddy field pixels that transitioned to urban between PreUP and PostUP are limited and are still affected by the adjacent permeable land use pixels surrounding them.
Therefore, the hydraulic head changes in all aquifers are both affected by urbanization and climate change with more significant impact by the latter. Shallow aquifers are more sensitive to urbanization and climate variability while deep aquifers are more influenced by over abstraction. Previous research conducted by Pulido-Velazquez et al., [18] deduced that climate change appears to be the primary factor influencing alterations in groundwater recharge, as the variations among climate scenarios with identical land uses exceed those caused by the land use scenarios. In contrast, according to a three-decade study of the Kurose River Catchment (1980s–2000s), the main factors driving hydrological modifications was urbanization, particularly the conversion of paddy fields into built-up areas, which led to a significant 34.9% decrease in groundwater recharge [22]. This research compared with the previous studies evaluated the overall effect of cli-mate variability and land use change on hydraulic heads, and surface and groundwater interactions for a multiple aquifers intermontane basin.
4.5. Limitations and Recommendations
The main sources of uncertainty in the calibrated model are the limited hydrological and hydrogeological datasets available for this research. Particularly the non-availability of upstream river stage measurements for the simulated period, and limited information about the river conductivities in Nara Basin. This limitation was addressed through inverse modelling utilizing the observed groundwater heads available both upstream and downstream. The impact of agricultural activity was not evaluated this study, because of the limitation of groundwater abstraction data by irrigation [53]
The no-flux boundary conditions along the model borders assigned considering the surface geological map of the study area could also be the reason for significant groundwater heads changes between the past climate and simulated period in the forested areas. Japanese mountains are mostly covered by forest which can potentially influence on the shallower aquifer through the hydrological processes (e.g. groundwater recharge, evapotranspiration), therefore the mountains areas are not completely a no-flow boundary, and shallower layers should be considered in the simulation.
Future climate scenarios under various Shared Socioeconomic Pathways (SSPs) were not also considered in this research.
Therefore, subsequent research could incorporate the effects of future climate change and anthropogenic activities including urbanization and agriculture on groundwater environments in a basin scale.
5. Conclusions
This research analyzed the impacts of urbanization and climate variability on hydraulic heads applying a three-dimensional groundwater flow model.
In evaluating the impact of groundwater recharge inputs on our groundwater flow model, three scenarios were analyzed. The findings highlight the relevance of spatial distribution of recharge in comparison to temporal distribution for both hydraulic heads and SW-GW interactions. The constant recharge scenario both overestimates and underestimates groundwater heads, emphasizing the need to account for especially spatial variations in recharge input for groundwater flow simulation.
The results indicate a more significant decrease in groundwater heads in the unconfined aquifer, attributed to the combined effects of urbanization (increase in impervious surfaces) and climate variability. The impervious land use types experienced more decline in hydraulic heads than the permeable areas under changing climate because of the impedance to infiltration and percolation exacerbating the climate variability effect. The forested areas stand as an exception because of the increased evapotranspiration due to forest growth and the economically influenced anthropogenic activities resulting in significant decline in hydraulic heads between the PreUP and PostUP. In addition, the impact of urbanization and climate variability on hydraulic heads in previously forested and pervious areas (especially cropland, and orchards cultivated on hilly terrains) are significantly higher than impervious areas because of their high recharge potential. In contrast, declines in the heads of deep confined aquifers are primarily influenced by climatic variations over several years. These hydraulic heads declines were notably evident in the SW-GW interactions resulting more recharge to the aquifer from the river. Therefore, the expansion of urban areas coupled with climate variability has significant impact on groundwater resources and presents a dual threat to groundwater sustainability. Urban infrastructure constrains recharge potential, whereas climate variability diminishes the dependability of natural replenishment. Our findings were focused on the changes in hydraulic heads and caused by urbanization and climate variabilities, however, future research should incorporate other anthropogenic activities including groundwater over abstraction and future climate change scenarios on groundwater heads that are influenced by societal transformations.
Author Contributions
Conceptualization, M. S., S. O., and K. W.; methodology, O. J. A., M. S., S. O., and K. W.; software, O. J. A.; validation, O. J. A, and K. W.; formal analysis, O. J. A; investigation, O. J. A., M. S., S. O., and K. W.; resources, M. S., S. O., and K. W.; data curation, O. J. A.; writing—original draft preparation, O. J. A.; writing—review and editing, M. S., and K. W; visualization, O. J. A.; supervision, M. S., S. O., and K. W.; project administration, M. S.; funding acquisition, M. S. All authors have read and agreed to the published version of the manuscript.
Funding
This research was funded by Japan Society for the Promotion of Science (JSPS), grant number 20KK0262, and Osaka Bay Regional Offshore Environmental Improvement Center, grant number 060003.
Acknowledgments
This manuscript is part of the PhD research of Olawale Joshua Abidakun, supported by the Japanese Ministry of Education, Culture, Sports, Science, and Technology’s (MEXT) Monbukagakusho Scholarship.
Conflicts of Interest
The authors declare no conflicts of interest.
References
- Jafari, T.; Kiem, A.S.; Javadi, S.; Nakamura, T.; Nishida, K. Fully Integrated Numerical Simulation of Surface Water-Groundwater Interactions Using SWAT-MODFLOW with an Improved Calibration Tool. Journal of Hydrology: Regional Studies 2021, 35. [CrossRef]
- Yusuf, H.A.; Abidakun, O.J.; Makinde, S.B. Evapotranspiration Estimation Using Artificial Neural Network over South-Western Nigeria. Journal of Engineering Research and Reports 2020, 16–35. [CrossRef]
- World Bank World Population Prospects: 2024 Revision Available online: https://data.worldbank.org/ (accessed on 14 April 2025).
- Seto, K.C.; Sánchez-Rodríguez, R.; Fragkias, M. The New Geography of Contemporary Urbanization and the Environment. Annual review of environment and resources 2010, 35, 167–194. [CrossRef]
- Angel, S.; Parent, J.; Civco, D.L.; Blei, A.; Potere, D. The Dimensions of Global Urban Expansion: Estimates and Projections for All Countries, 2000-2050. Progress in planning 2011, 75, 53–107. [CrossRef]
- Seto, K.C.; Fragkias, M.; Güneralp, B.; Reilly, M.K. A Meta-Analysis of Global Urban Land Expansion. PLOS ONE 2011, 6(8). [CrossRef]
- Grimm, N.B.; Faeth, S.H.; Golubiewski, N.E.; Redman, C.L.; Wu, J.; Bai, X.; Briggs, J.M. Global Change and the Ecology of Cities. Science 2008, 319(5864), 756–760. [CrossRef]
- Seto, K.C.; Güneralp, B.; Hutyra, L.R. Global Forecasts of Urban Expansion to 2030 and Direct Impacts on Biodiversity an Carbon Pools. Proceedings of the National Academy of Sciences USA 2012, 109, 16083–16088. [CrossRef]
- Davamani, V.; John, J.E.; Poornachandhra, C.; Gopalakrishnan, B.; Arulmani, S.; Parameswari, E.; Santhosh, A.; Srinivasulu, A.; Lal, A.; Naidu, R. A Critical Review of Climate Change Impacts on Groundwater Resources: A Focus on the Current Status, Future Possibilities, and Role of Simulation Models. Atmosphere 2024, 15, 122. [CrossRef]
- Wang, K.; Onodera, S.; Saito, M.; Shimizu, Y. Long-Term Variations in Water Balance by Increase in Percent Imperviousness of Urban Regions. Journal of Hydrology 2021, 602. [CrossRef]
- Jyrkama, M.I.; Sykes, J.F. The Impact of Climate Change on Spatially Varying Groundwater Recharge in the Grand River Watershed (Ontario). Journal of Hydrology 2007, 338, 237–250. [CrossRef]
- Oki, T.; Kanae, S. Global Hydrological Cycles and World Water Resources. science 2006, 313(5790), 1068–1072. [CrossRef]
- Shao, G.; Guan, Y.; Zhang, D.; Yu, B.; Zhu, J. The Impacts of Climate Variability and Land Use Change on Streamflow in the Hailiutu River Basin. Water 2018, 10, 814. [CrossRef]
- Yoshioka, Y.; Nakamura, K.; Horino, H.; Kawashima, S. Numerical Assessments of the Impacts of Climate Change on Regional Groundwater Systems in a Paddy-Dominated Alluvial Fan. Paddy and Water Environment 2016, 14, 93–103. [CrossRef]
- Crosbie, R.S.; Scanlon, B.R.; Mpelasoka, F.S.; Reedy, R.C.; Gates, J.B.; Zhang, L. Potential Climate Change Effects on Groundwater Recharge in the High Plains Aquifer, USA. Water Resources Research 2013, 49, 3936–3951. [CrossRef]
- Goderniaux, P.; Brouyére, S.; Blenkinsop, S.; Burton, A.; Fowler, H.J.; Orban, P.; Dassargues, A. Modeling Climate Change Impacts on Groundwater Resources Using Transient Stochastic Climatic Scenarios. Water Resources Research 2011, 47. [CrossRef]
- Scibek, J.; Allen, D.M. Modeled Impacts of Predicted Climate Change on Recharge and Groundwater Levels. Water Resources Research 2006, 42, 11405. [CrossRef]
- Pulido-Velazquez, M.; Peña-Haro, S.; García-Prats, A.; Mocholi-Almudever, A.F.; Henriquez-Dole, L.; Macian-Sorribes, H.; Lopez-Nicolas, A. Integrated Assessment of the Impact of Climate and Land Use Changes on Groundwater Quantity and Quality in the Mancha Oriental System (Spain). Hydrology and Earth System Sciences, 2015, 19, 1677–1693. [CrossRef]
- Wang, K.; Onodera, S.; Saito, M.; Shimizu, Y.; Iwata, T. Effects of Forest Growth in Different Vegetation Communities on Forest Catchment Water Balance. Science of the Total Environment 2022, 809. [CrossRef]
- Zhang, A.; Zhang, C.; Fu, G.; Wang, B.; Bao, Z.; Zheng, H. Assessments of Impacts of Climate Change and Human Activities on Runoff with SWAT for the Huifa River Basin, Northeast China. Water Resources Management 2012, 26, 2199–2217. [CrossRef]
- Wang, K.; Onodera, S.; Saito, M.; Shimizu, Y. Assessment of Nitrogen Budget in Detailed Spatial Pattern Using High Precision Modeling Approach with Constructed Accurate Agricultural Behavior. Science of the Total Environment 2024, 912. [CrossRef]
- Kimbi, S.B.; Onodera, S.; Wang, K.; Kaihotsu, I.; Shimizu, Y. Assessing the Impact of Urbanization and Climate Change on Hydrological Processes in a Suburban Catchment. Environments 2024, 11, 225. [CrossRef]
- Gebru, H.; Gebreyohannes, T.; Hagos, E.; Perilli, N. Hydrogeological Assessment and Steady-State Groundwater Flow Modeling for Groundwater Management in the Golina River Sub-Basin, Northern Ethiopia, Using MODFLOW 6. Water 2025, 17, 949. [CrossRef]
- Behera, A.K.; Pradhan, R.M.; Kumar, S.; Chakrapani, G.J.; Kumar, P. Assessment of Groundwater Flow Dynamics Using MODFLOW in Shallow Aquifer System of Mahanadi Delta (East Coast), India. Water 2022, 14, 611. [CrossRef]
- Narayana Loukika, K.; Keesara, V.R.; Buri, E.S.; Sridhar, V.; Ndehedehe, C.E.; Sarker, S.; Pramada, S.K. Spatiotemporal Variations of Surface and Groundwater Interactions under Climate and Land Use Land Cover Change Scenarios. Frontiers in Water 2025. [CrossRef]
- Fiorese, G.D.; Balacco, G.; Bruno, G.; Nikolaidis, N. Hydrogeological Modelling of a Coastal Karst Aquifer Using an Integrated SWAT-MODFLOW Approach. Environmental Modelling & Software 2025, 183, 106249. [CrossRef]
- Langevin, C.D.; Hughes, J.D.; Banta, E.R.; Niswonger, R.G.; Panday, S.; Provost, A.M. Documentation for the MODFLOW 6 Groundwater Flow Model. US Geological Survey 2017. [CrossRef]
- Fujinaga Kazuo Yamato Water Story_ In Search of Stable Water. Journal of the Japanese Society of Irrigation, Drainage and Crop Science 1998, 66, 623-630, a2, doi.org/10.11408/jjsidre1965.66.6_623.
- Japan Meteorological Agency Available online: https://www.jma.go.jp/jma/indexe.html (accessed on 17 April 2025).
- Pathak, D. Groundwater Flow Modeling in an Intermontane Basin. Journal of Nepal Geological Society 2015, 49, 7–15. [CrossRef]
- Taniguchi, M. Analysing the Long Term Reduction in Groundwater Temperature Due to Pumping. Hydrological Sciences Journal 1995, 40, 407–421. [CrossRef]
- National Spatial Planning and Regional Policy Bureau, M. of J. National Groundwater Data Register Survey Available online: https://nlftp.mlit.go.jp/kokjo/inspect/landclassification/water/f9_exp.html (accessed on 24 April 2025).
- Pathak, D. Hydrogeology of Shallow and Deep Aquifers in Nara Basin, West Japan. Journal of Nepal Geological Society 2011, 43, 267–276. [CrossRef]
- Osaka Prefecture. History of Ikoma Forests. 2021. Available online: https://www.pref.osaka.lg.jp/o120160/chubunm/chubu_nm/ryokuti17.html (accessed on 23 May 2025).
- Nara Perfecture Trees’ Story in Nara. Available online: https://naranoki.pref.nara.jp/about/ (accessed on 16 April 2025).
- Pathak, D. Heat Flow and Vertical Groundwater Flux in Deep Fractured Basement Rock in Nara Basin, Southwest Japan. Journal of Nepal Geological Society 2003, 28. [CrossRef]
- Taniguchi, M. Estimated Recharge Rates From Groundwater Temperatures In The Nara Basin, Japan. Applied Hydrogeology 1994, 2, 7–14. [CrossRef]
- U.S Geological Survey, Shuttle Radar Topography Mission (SRTM). Available online. https://doi.org/10.5066/F7PR7TFT (accessed on 23 May 2025).
- Ministry of Land, Infrastructure, Transport and Tourism, Japan. Land Classification Basic Survey 1:200,000, Available online: https://nlftp.mlit.go.jp/kokjo/inspect/landclassification/download.html (accessed on 21 April 2025).
- Nara Prefecture River Information System Available online: http://www.kasen.pref.nara.jp/gispub/info/top/menu (accessed on 21 April 2025).
- Japan Aerospace Exploration Agency (JAXA) Earth Observation Research Center (EORC) High-Resolution Land-Use and Land-Cover Map of Japan [2014 ∼ 2016] Available online https://www.eorc.jaxa.jp/ALOS/en/dataset/lulc/lulc_v1803_e.htm (accessed on 21 April 2025).
- Nara Prefecture Waterworks Corporation Water Departments of Municipalities in Nara Prefecture Available online: https://www.pref.nara.jp/6829.htm (accessed on 25 April 2025).
- Yamatotakada City Water Supply Available online: https://www.city.yamatotakada.nara.jp/soshikikarasagasu/suidosomuka/jogesuido/index.html (accessed on 25 April 2025).
- Geospatial Information Authority of Japan National Land Information Available online: https://www.kunijiban.pwri.go.jp/jp/ (accessed on 21 April 2025).
- Ministry of Land, Infrastructure, Transport and Tourism, Japan, Water Information System. Available online: https://www.river.go.jp/index (accessed on 23 May 2025).
- Doherty, J.E.; Hunt, R.J. Approaches to Highly Parameterized Inversion-A Guide to Using PEST for Groundwater-Model Calibration. Scientific Investigations Report 2010. [CrossRef]
- National Land Information Division, N.S.P. and R.P.B.M. of J. National Groundwater Data Register. 1964.
- Awan, U.K.; Tischbein, B.; Martius, C. Combining Hydrological Modeling and GIS Approaches to Determine the Spatial Distribution of Groundwater Recharge in an Arid Irrigation Scheme. Irrigation Science 2013, 31, 793–806. [CrossRef]
- Hartmann, A.; Gleeson, T.; Wada, Y.; Wagener, T. Enhanced Groundwater Recharge Rates and Altered Recharge Sensitivity to Climate Variability through Subsurface Heterogeneity. Proc. Natl. Acad. Sci. U.S.A. 2017, 114, 2842–2847. [CrossRef]
- Toure, A.; Diekkrüger, B.; Mariko, A. Impact of Climate Change on Groundwater Resources in the Klela Basin, Southern Mali. Hydrology 2016, 3, 17. [CrossRef]
- Cui, Y.; Liao, Z.; Wei, Y.; Xu, X.; Song, Y.; Liu, H. The Response of Groundwater Level to Climate Change and Human Activities in Baotou City, China. Water 2020, 12, 1078. [CrossRef]
- Rusli, S.R.; Bense, V.F.; Mustafa, S.M.T.; Weerts, A.H. The Impact of Future Changes in Climate Variables and Groundwater Abstraction on Basin-Scale Groundwater Availability. Hydrology and Earth System Sciences 2024, 28, 5107–5131. [CrossRef]
- Nara Prefecture Waterworks Corporation History of Water. Available online: https://www.pref.nara.jp/7042.htm (accessed on 21 April 2025).
Figure 1.
Location of Nara Basin and elevation map.
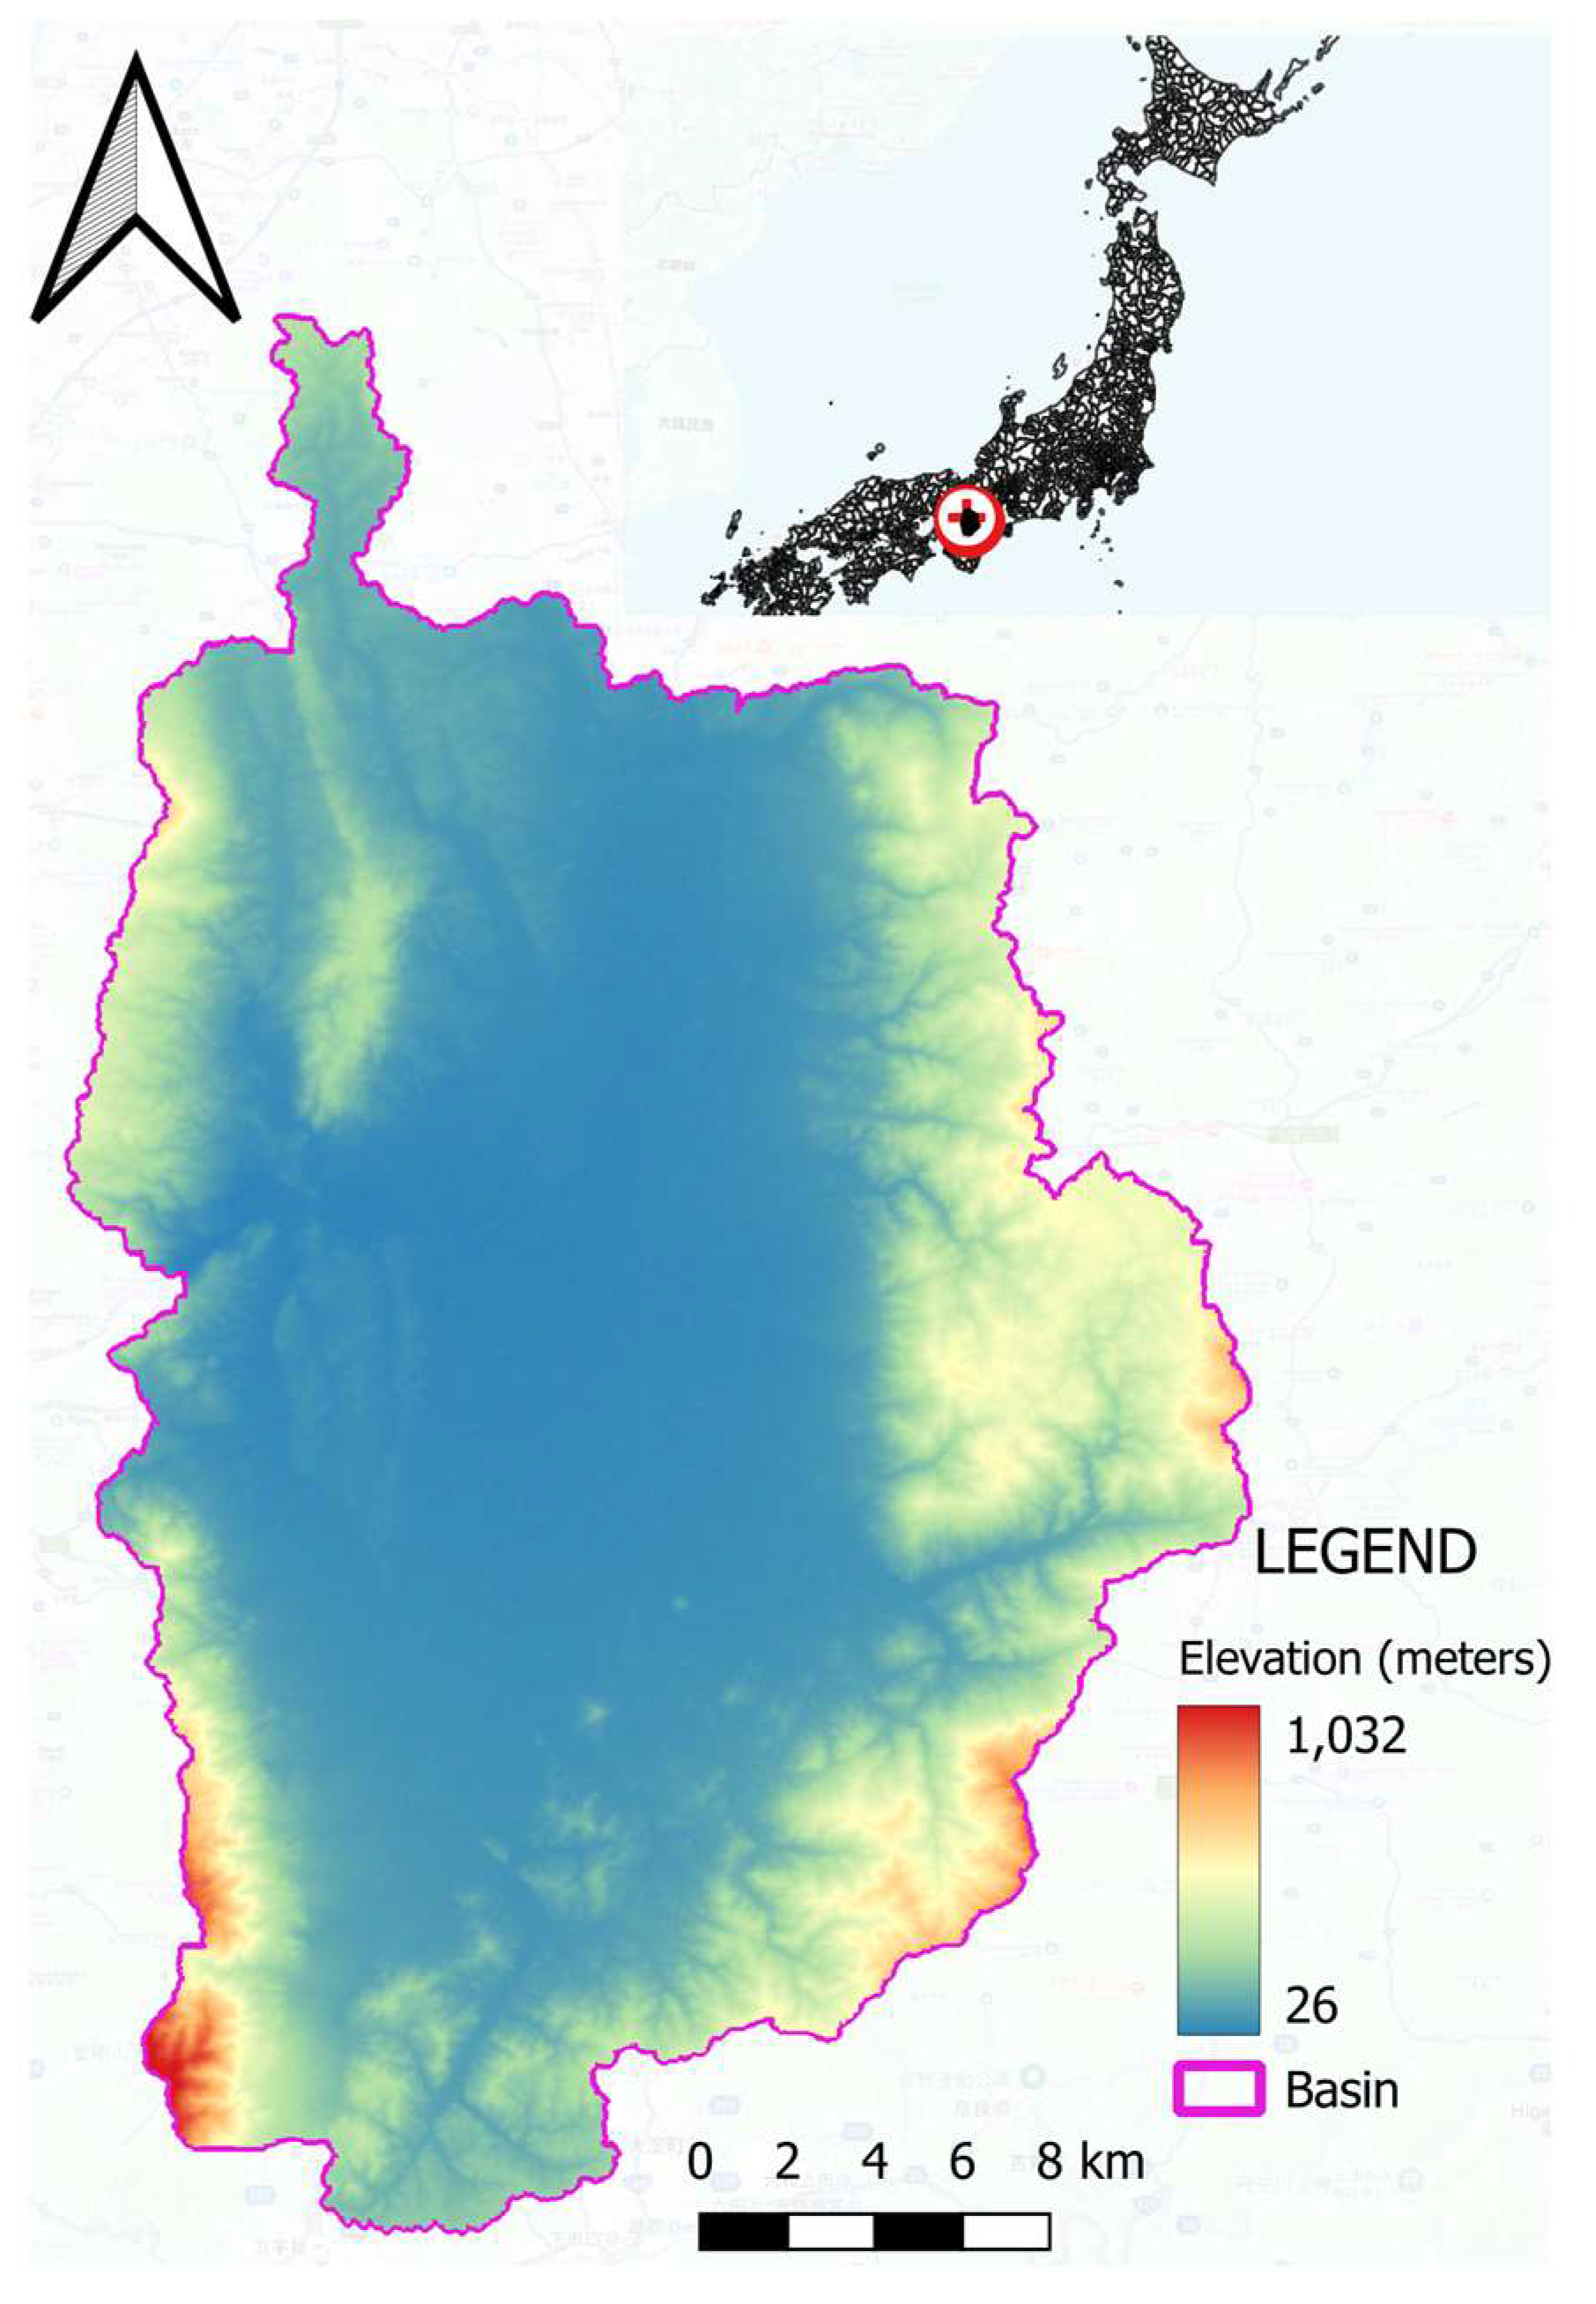
Figure 2.
Geological map of Nara basin, river network and well locations.
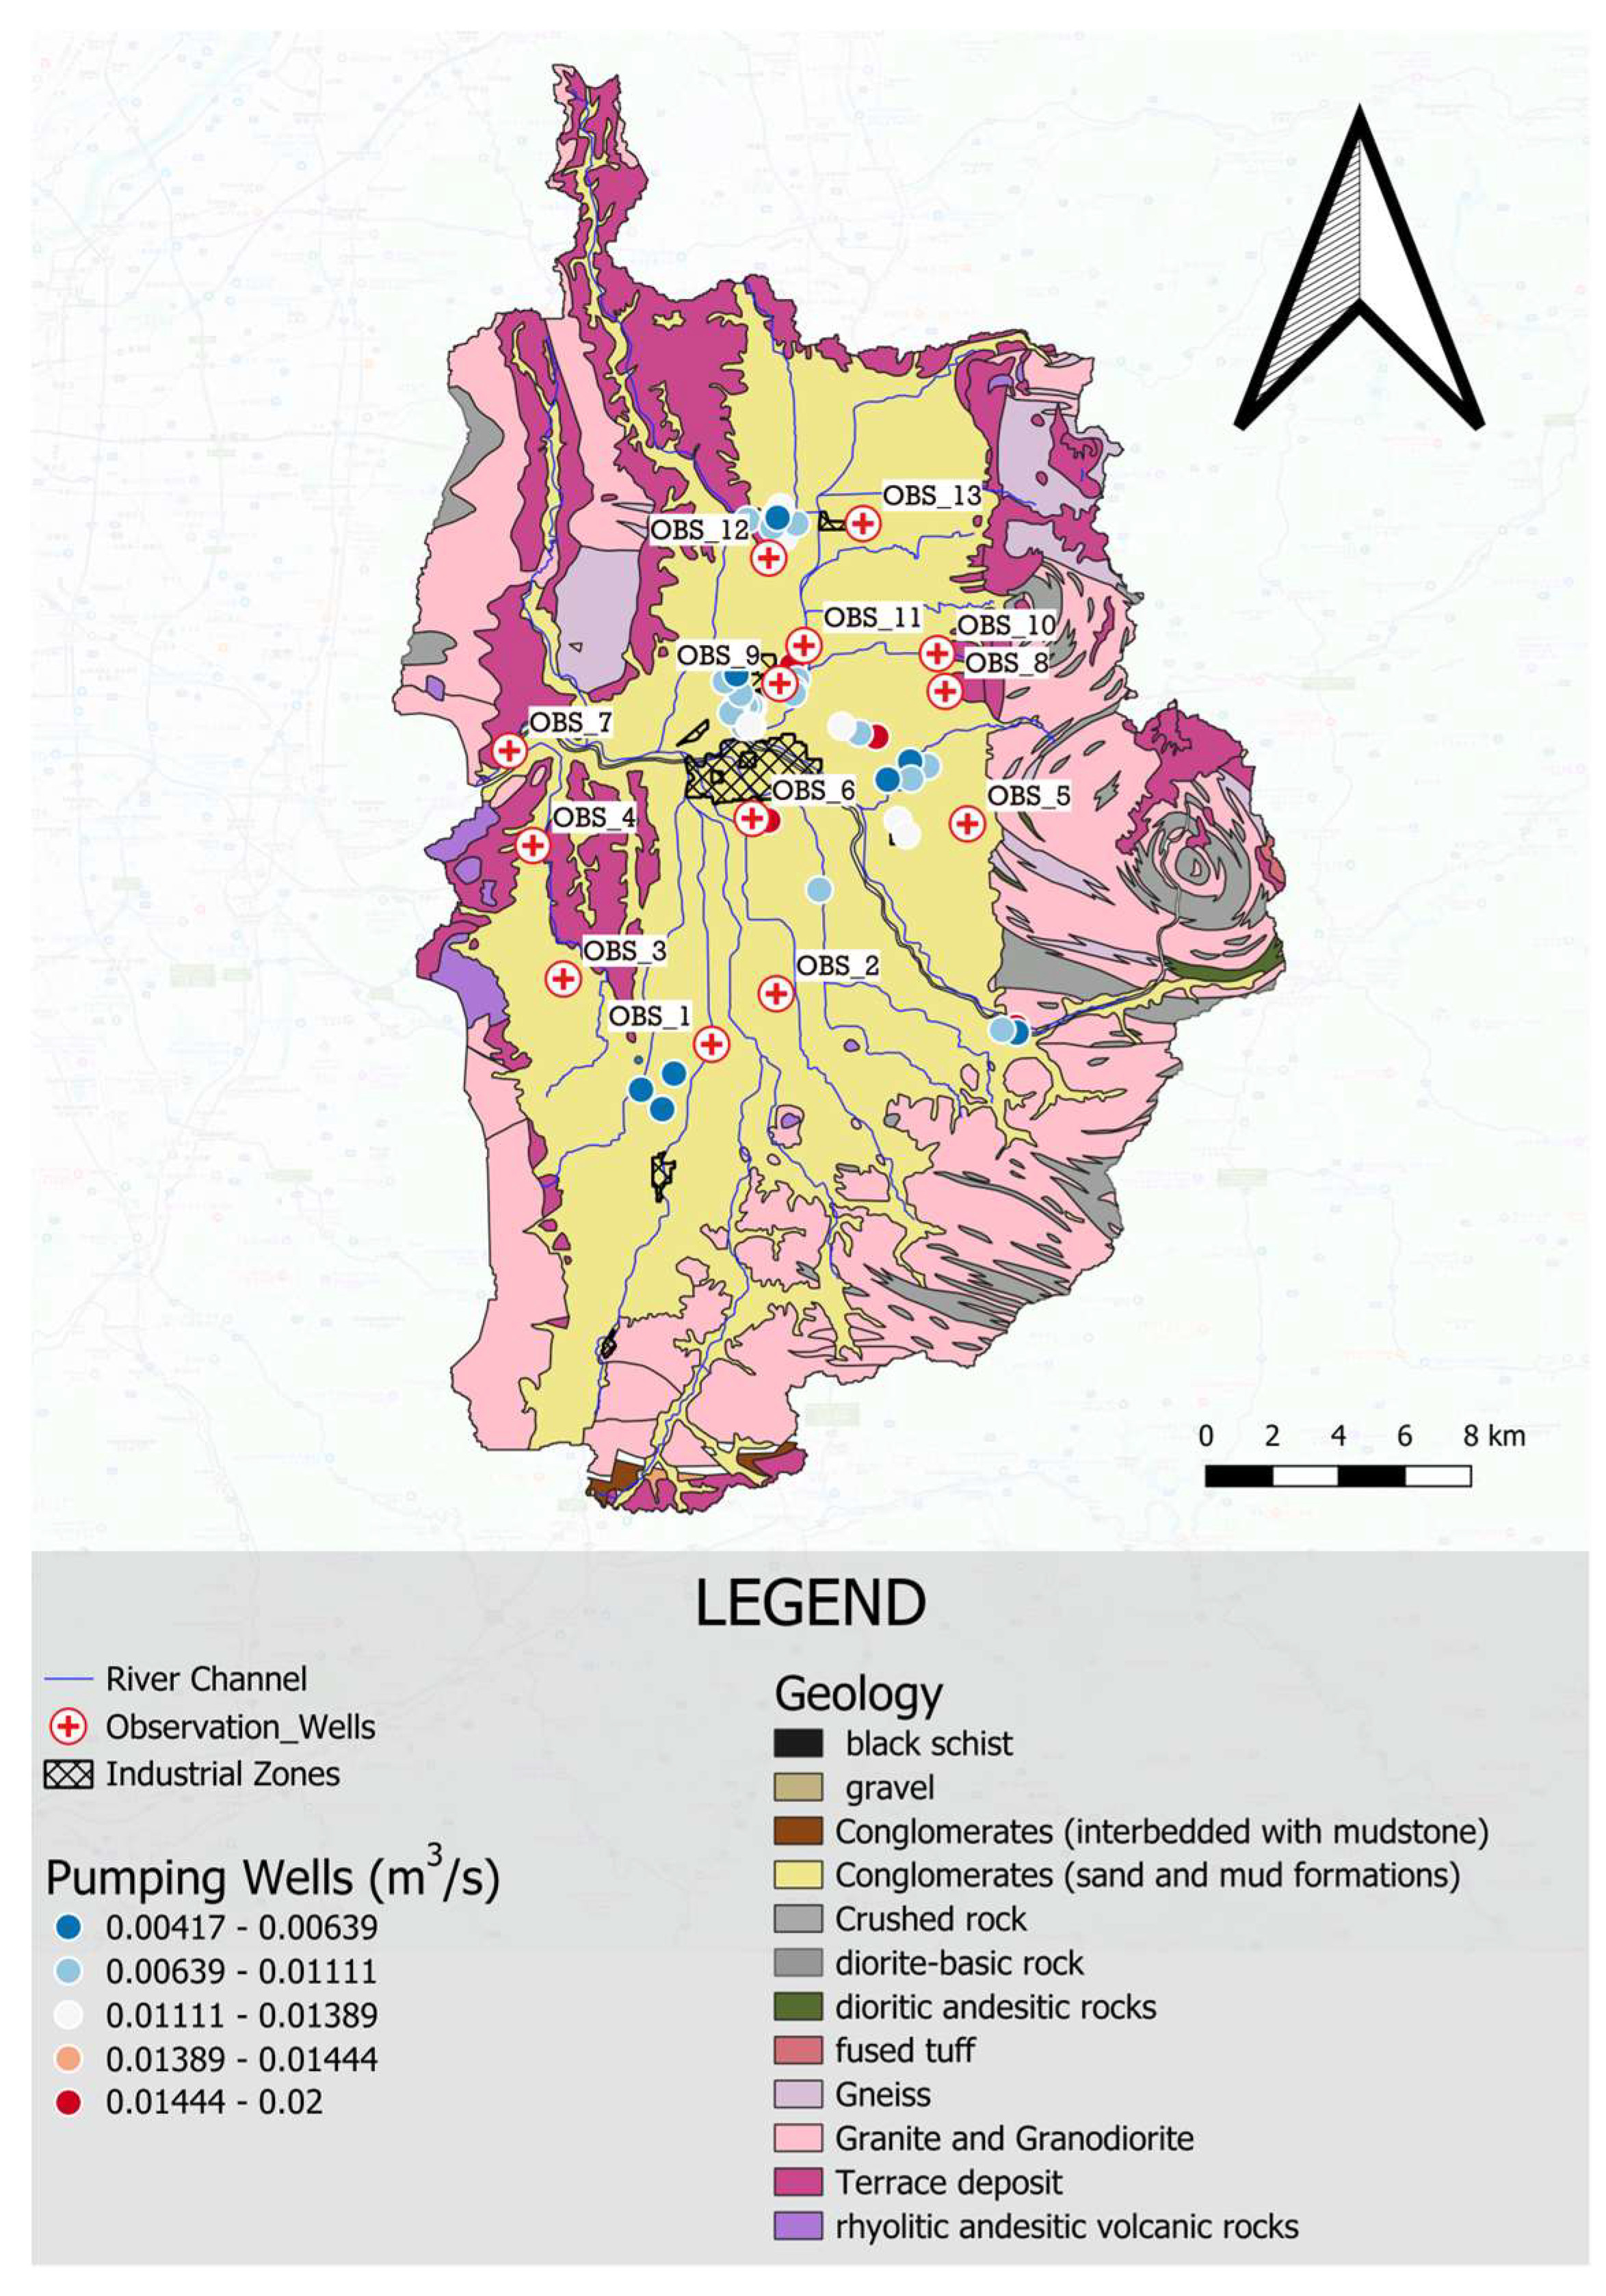
Figure 3.
Land use maps of Nara Basin in 1987, pre-urbanization period (a) and 2006 post-urbanization period (b).
Figure 3.
Land use maps of Nara Basin in 1987, pre-urbanization period (a) and 2006 post-urbanization period (b).
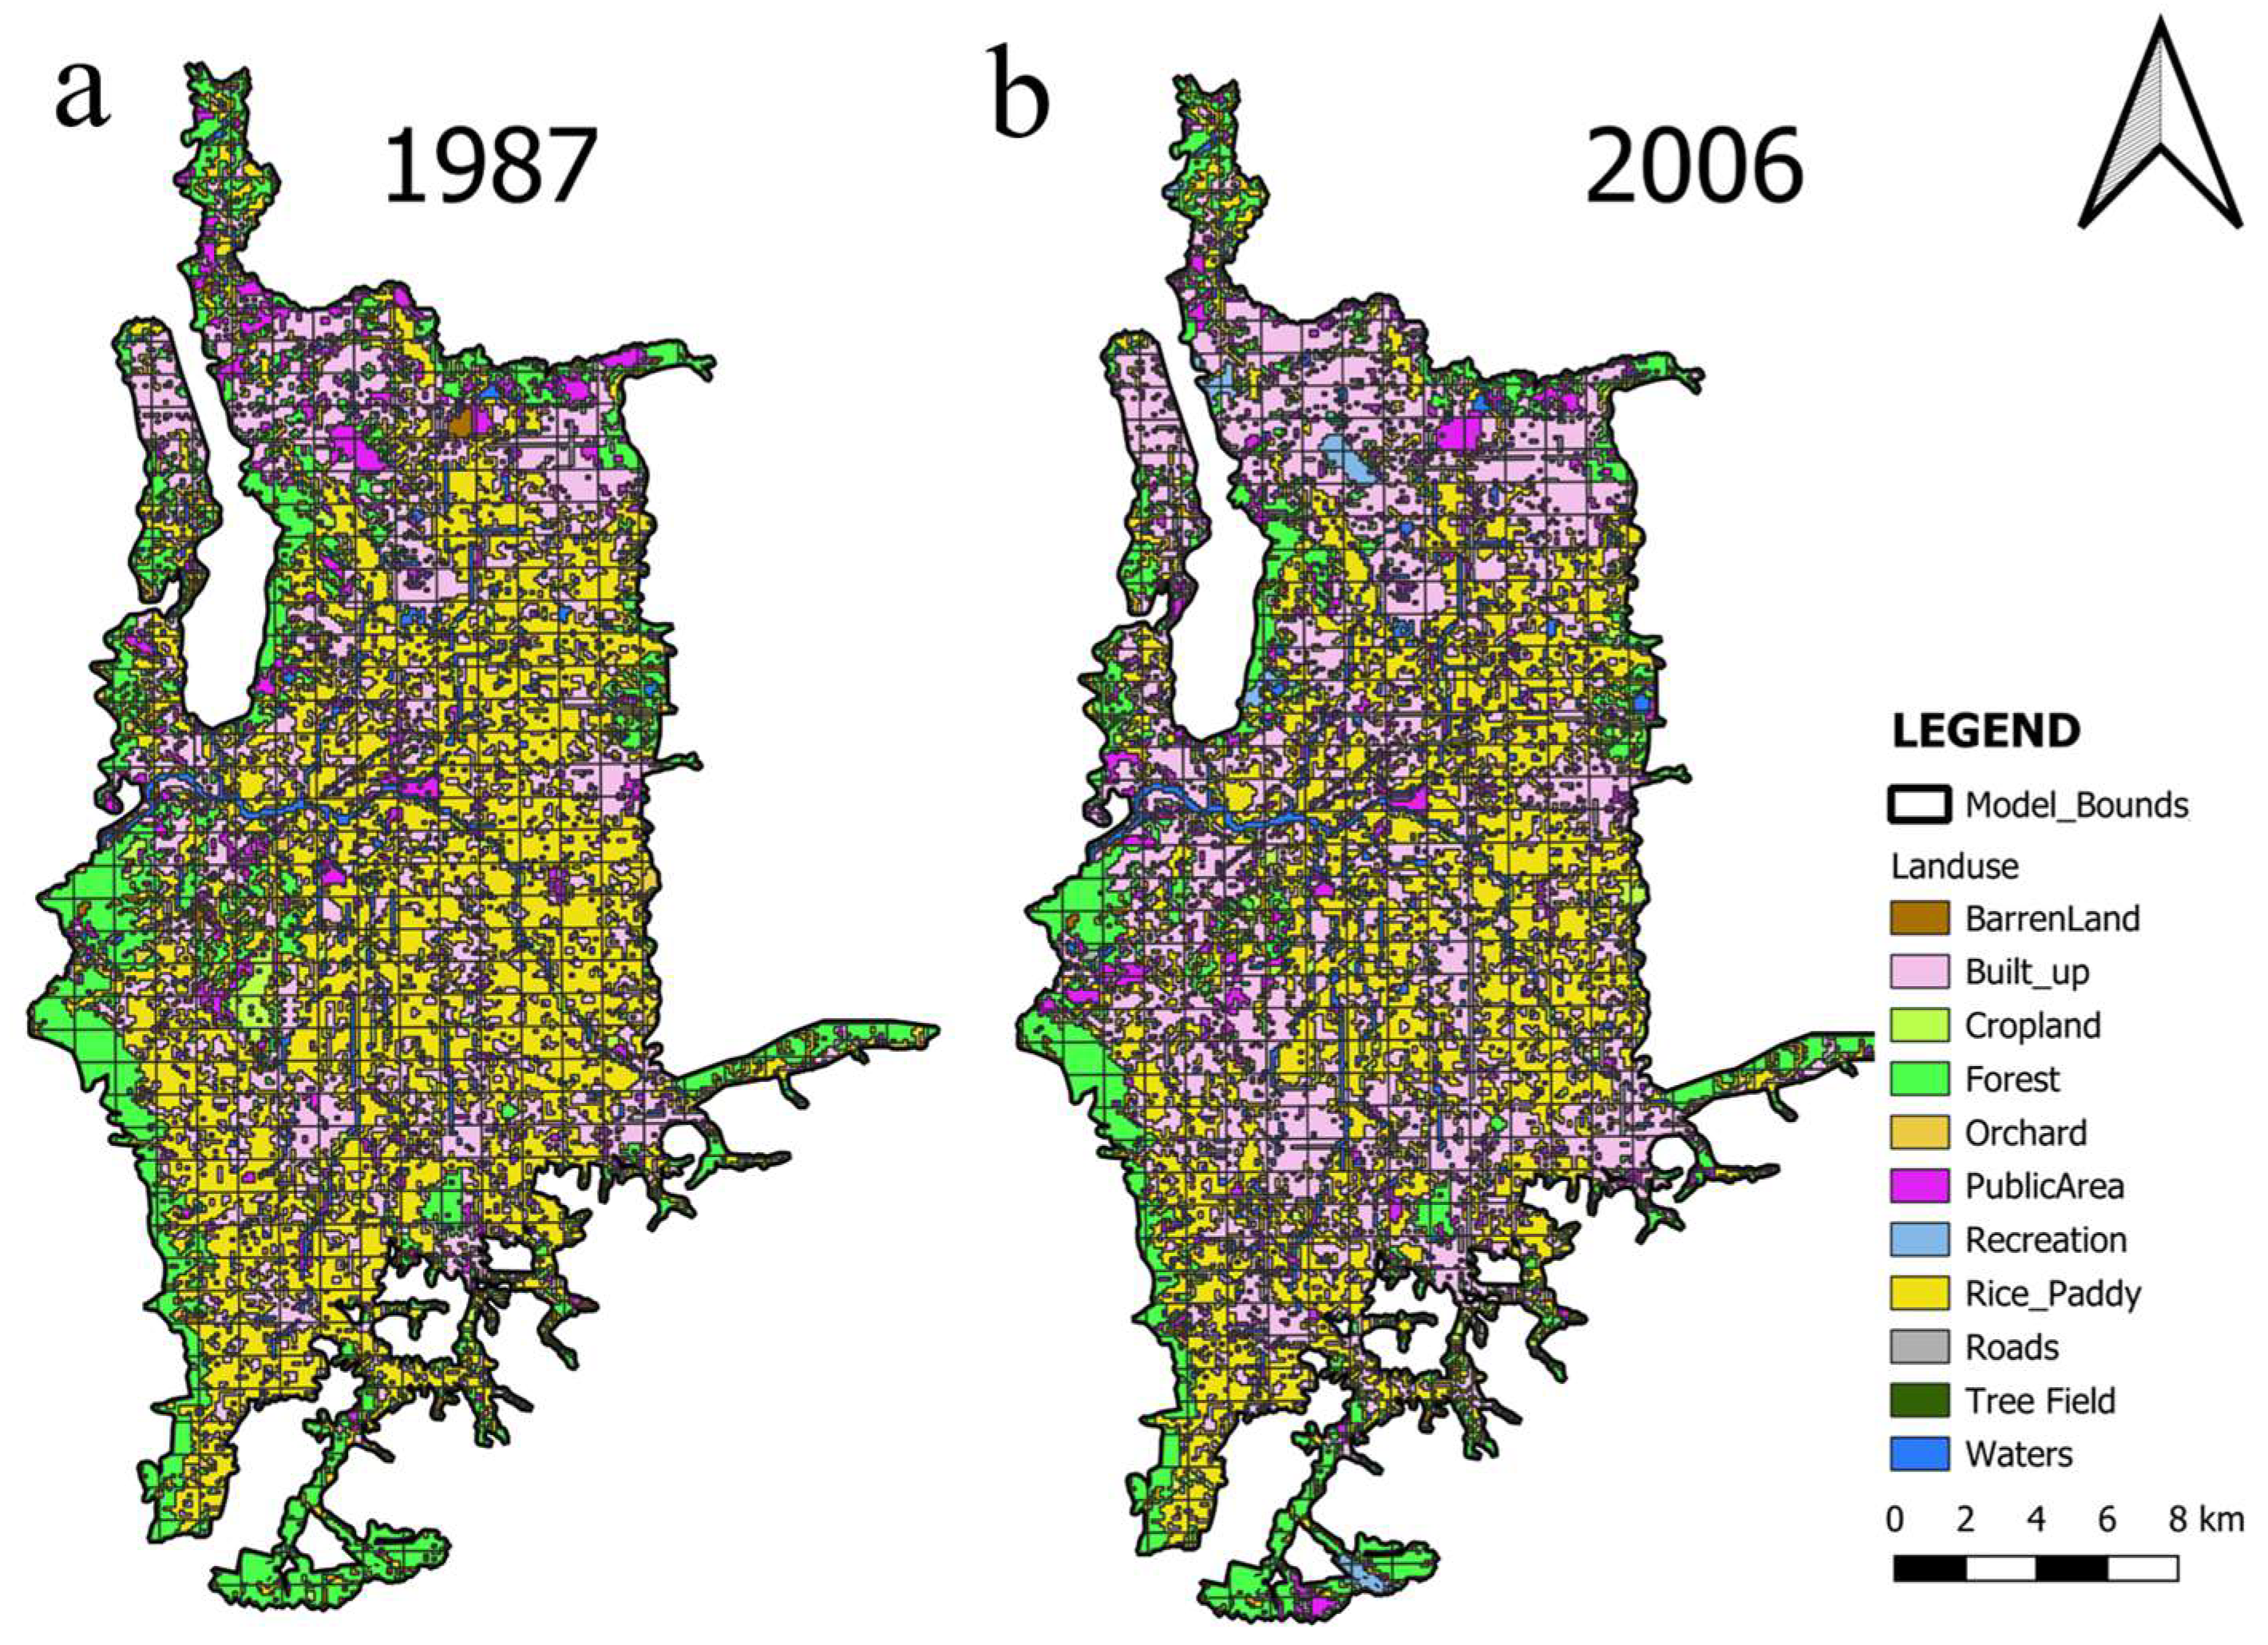
Figure 5.
Scatter plot of simulated and observed hydraulic heads (red, blue and green colored circle indicates overestimation, underestimation and reliable estimation respectively in the observation points).
Figure 5.
Scatter plot of simulated and observed hydraulic heads (red, blue and green colored circle indicates overestimation, underestimation and reliable estimation respectively in the observation points).
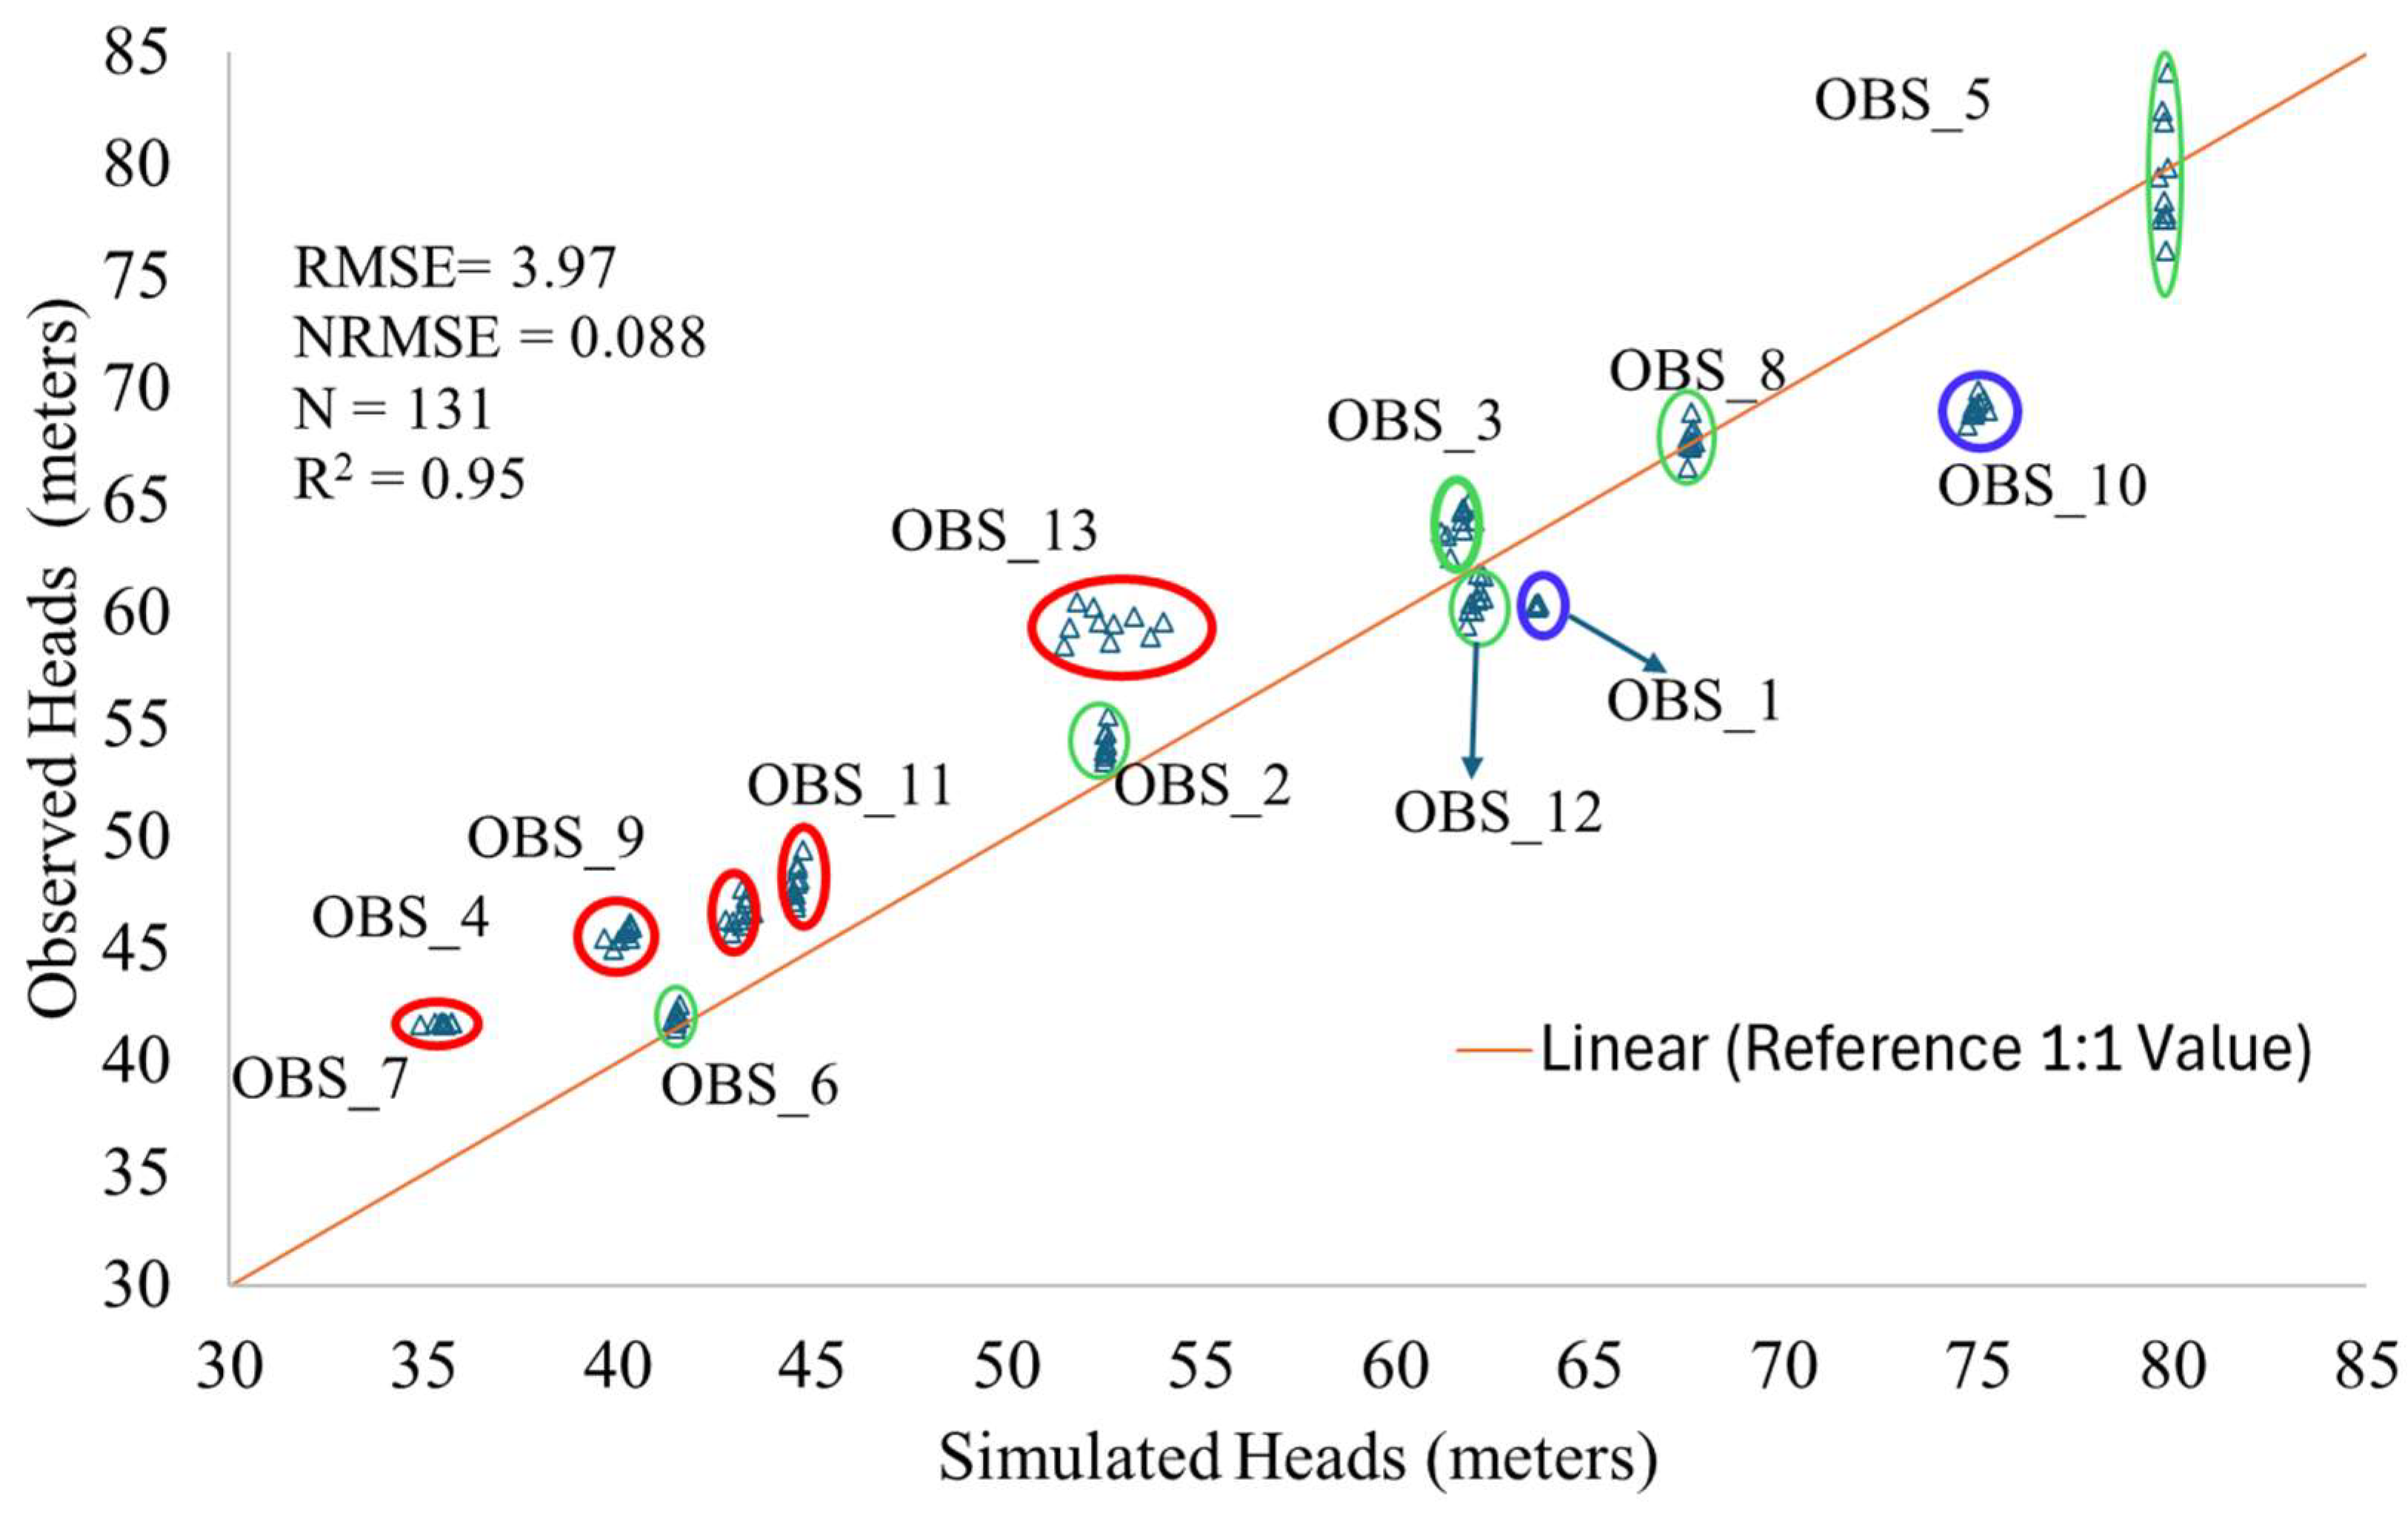
Figure 6.
Simulated Hydraulic Heads for a) Scenario A - Uniform recharge scenario, b) Scenario B- Spatiotemporally distributed recharge scenario, c) Spatially distributed recharge scenario.
Figure 6.
Simulated Hydraulic Heads for a) Scenario A - Uniform recharge scenario, b) Scenario B- Spatiotemporally distributed recharge scenario, c) Spatially distributed recharge scenario.
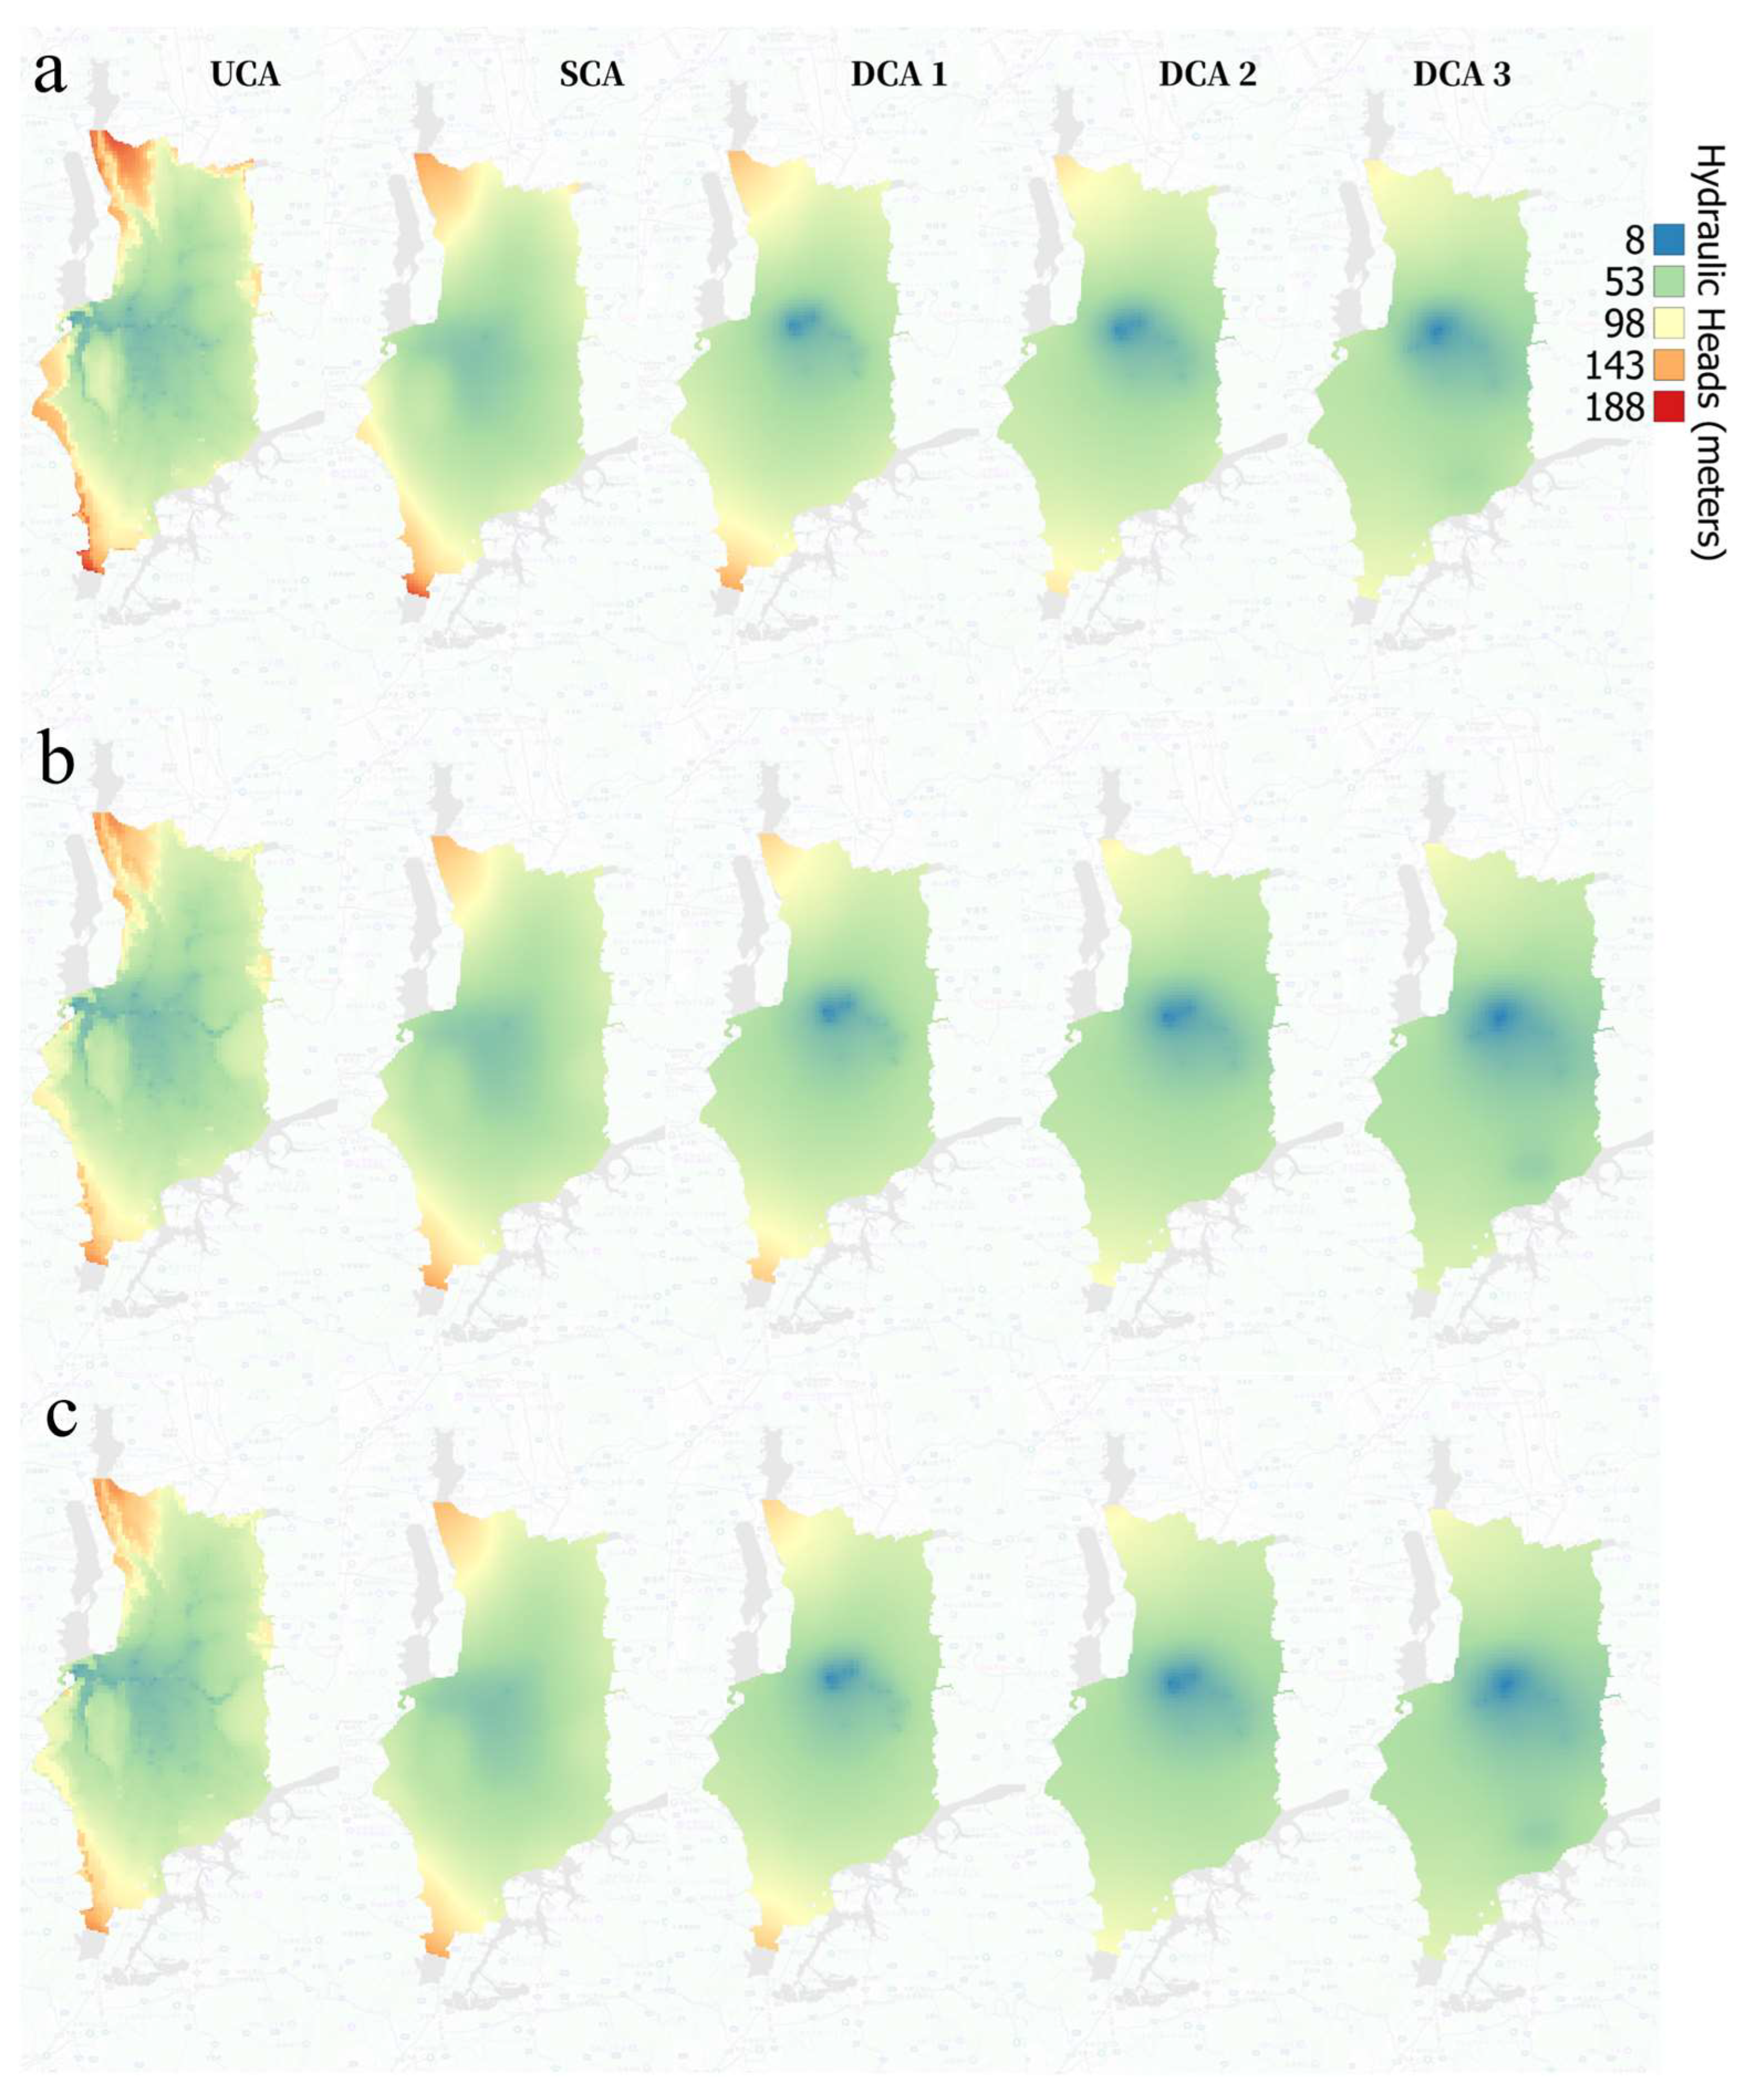
Figure 7.
Simulated Hydraulic Head Change (a) Head difference between scenario A and scenario B, (b) Head difference between scenario B and scenario C.
Figure 7.
Simulated Hydraulic Head Change (a) Head difference between scenario A and scenario B, (b) Head difference between scenario B and scenario C.
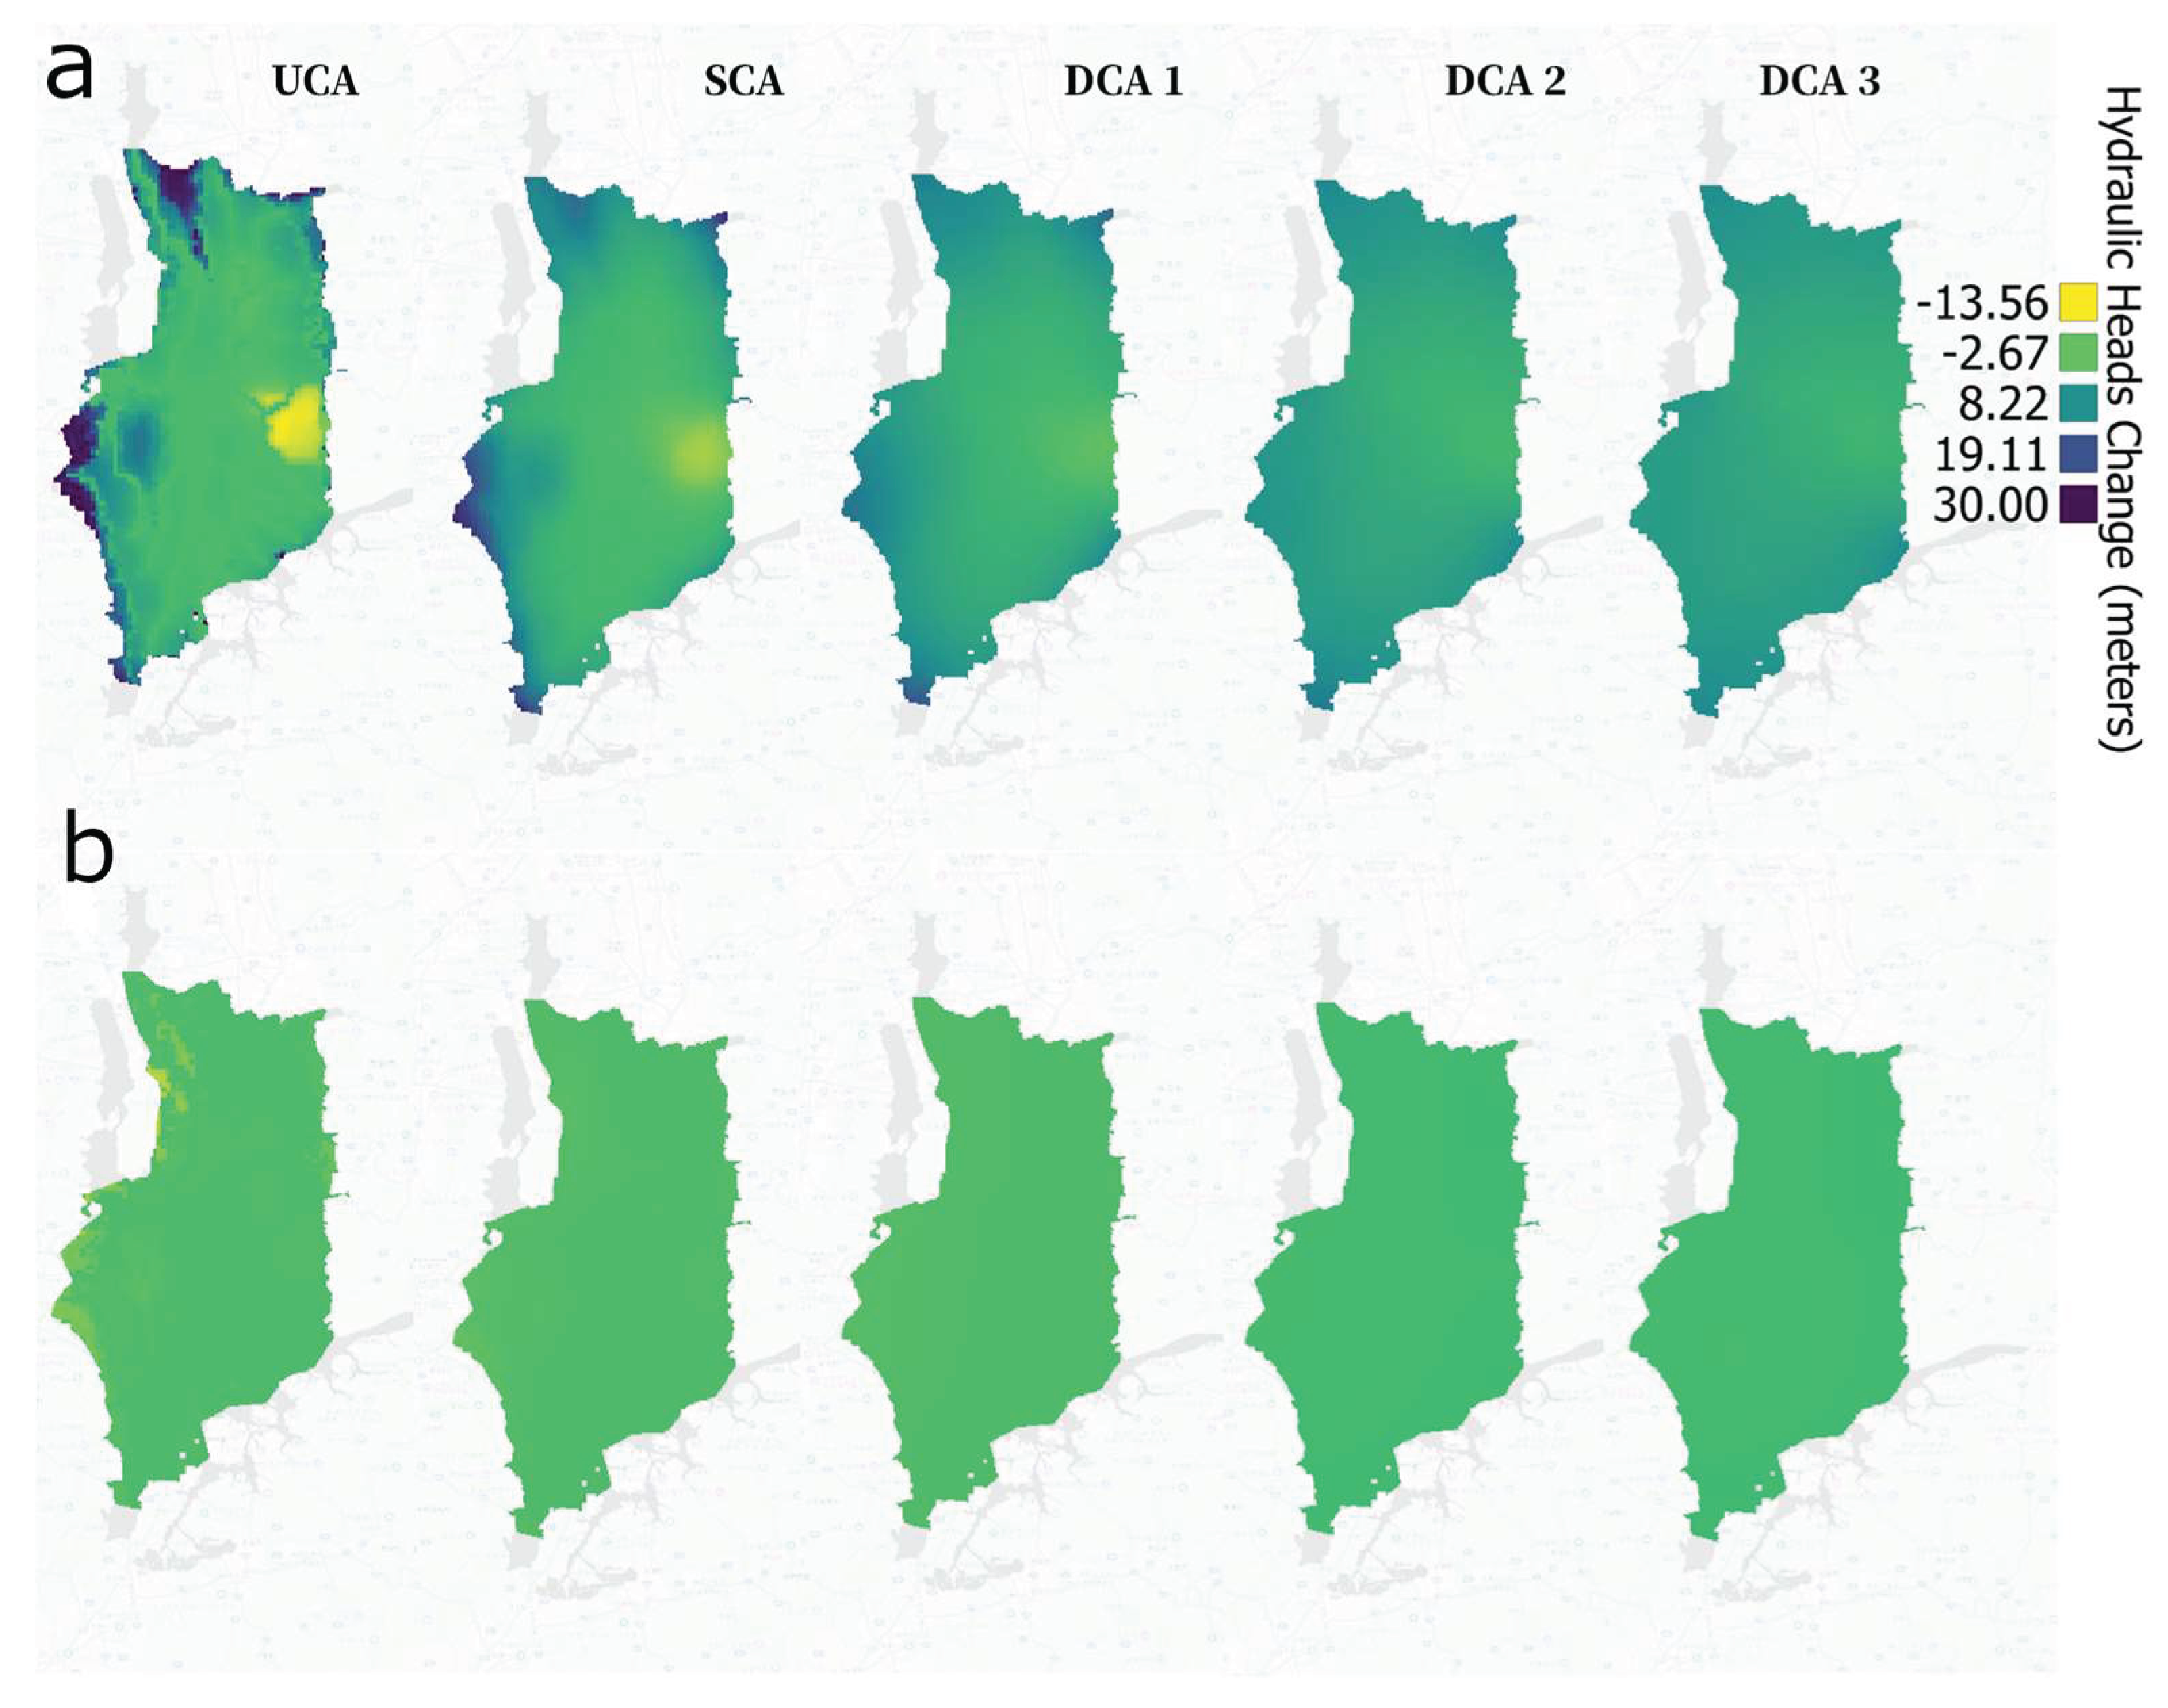
Figure 8.
Interaction between surface water and groundwater for the three recharge scenarios (A-C).
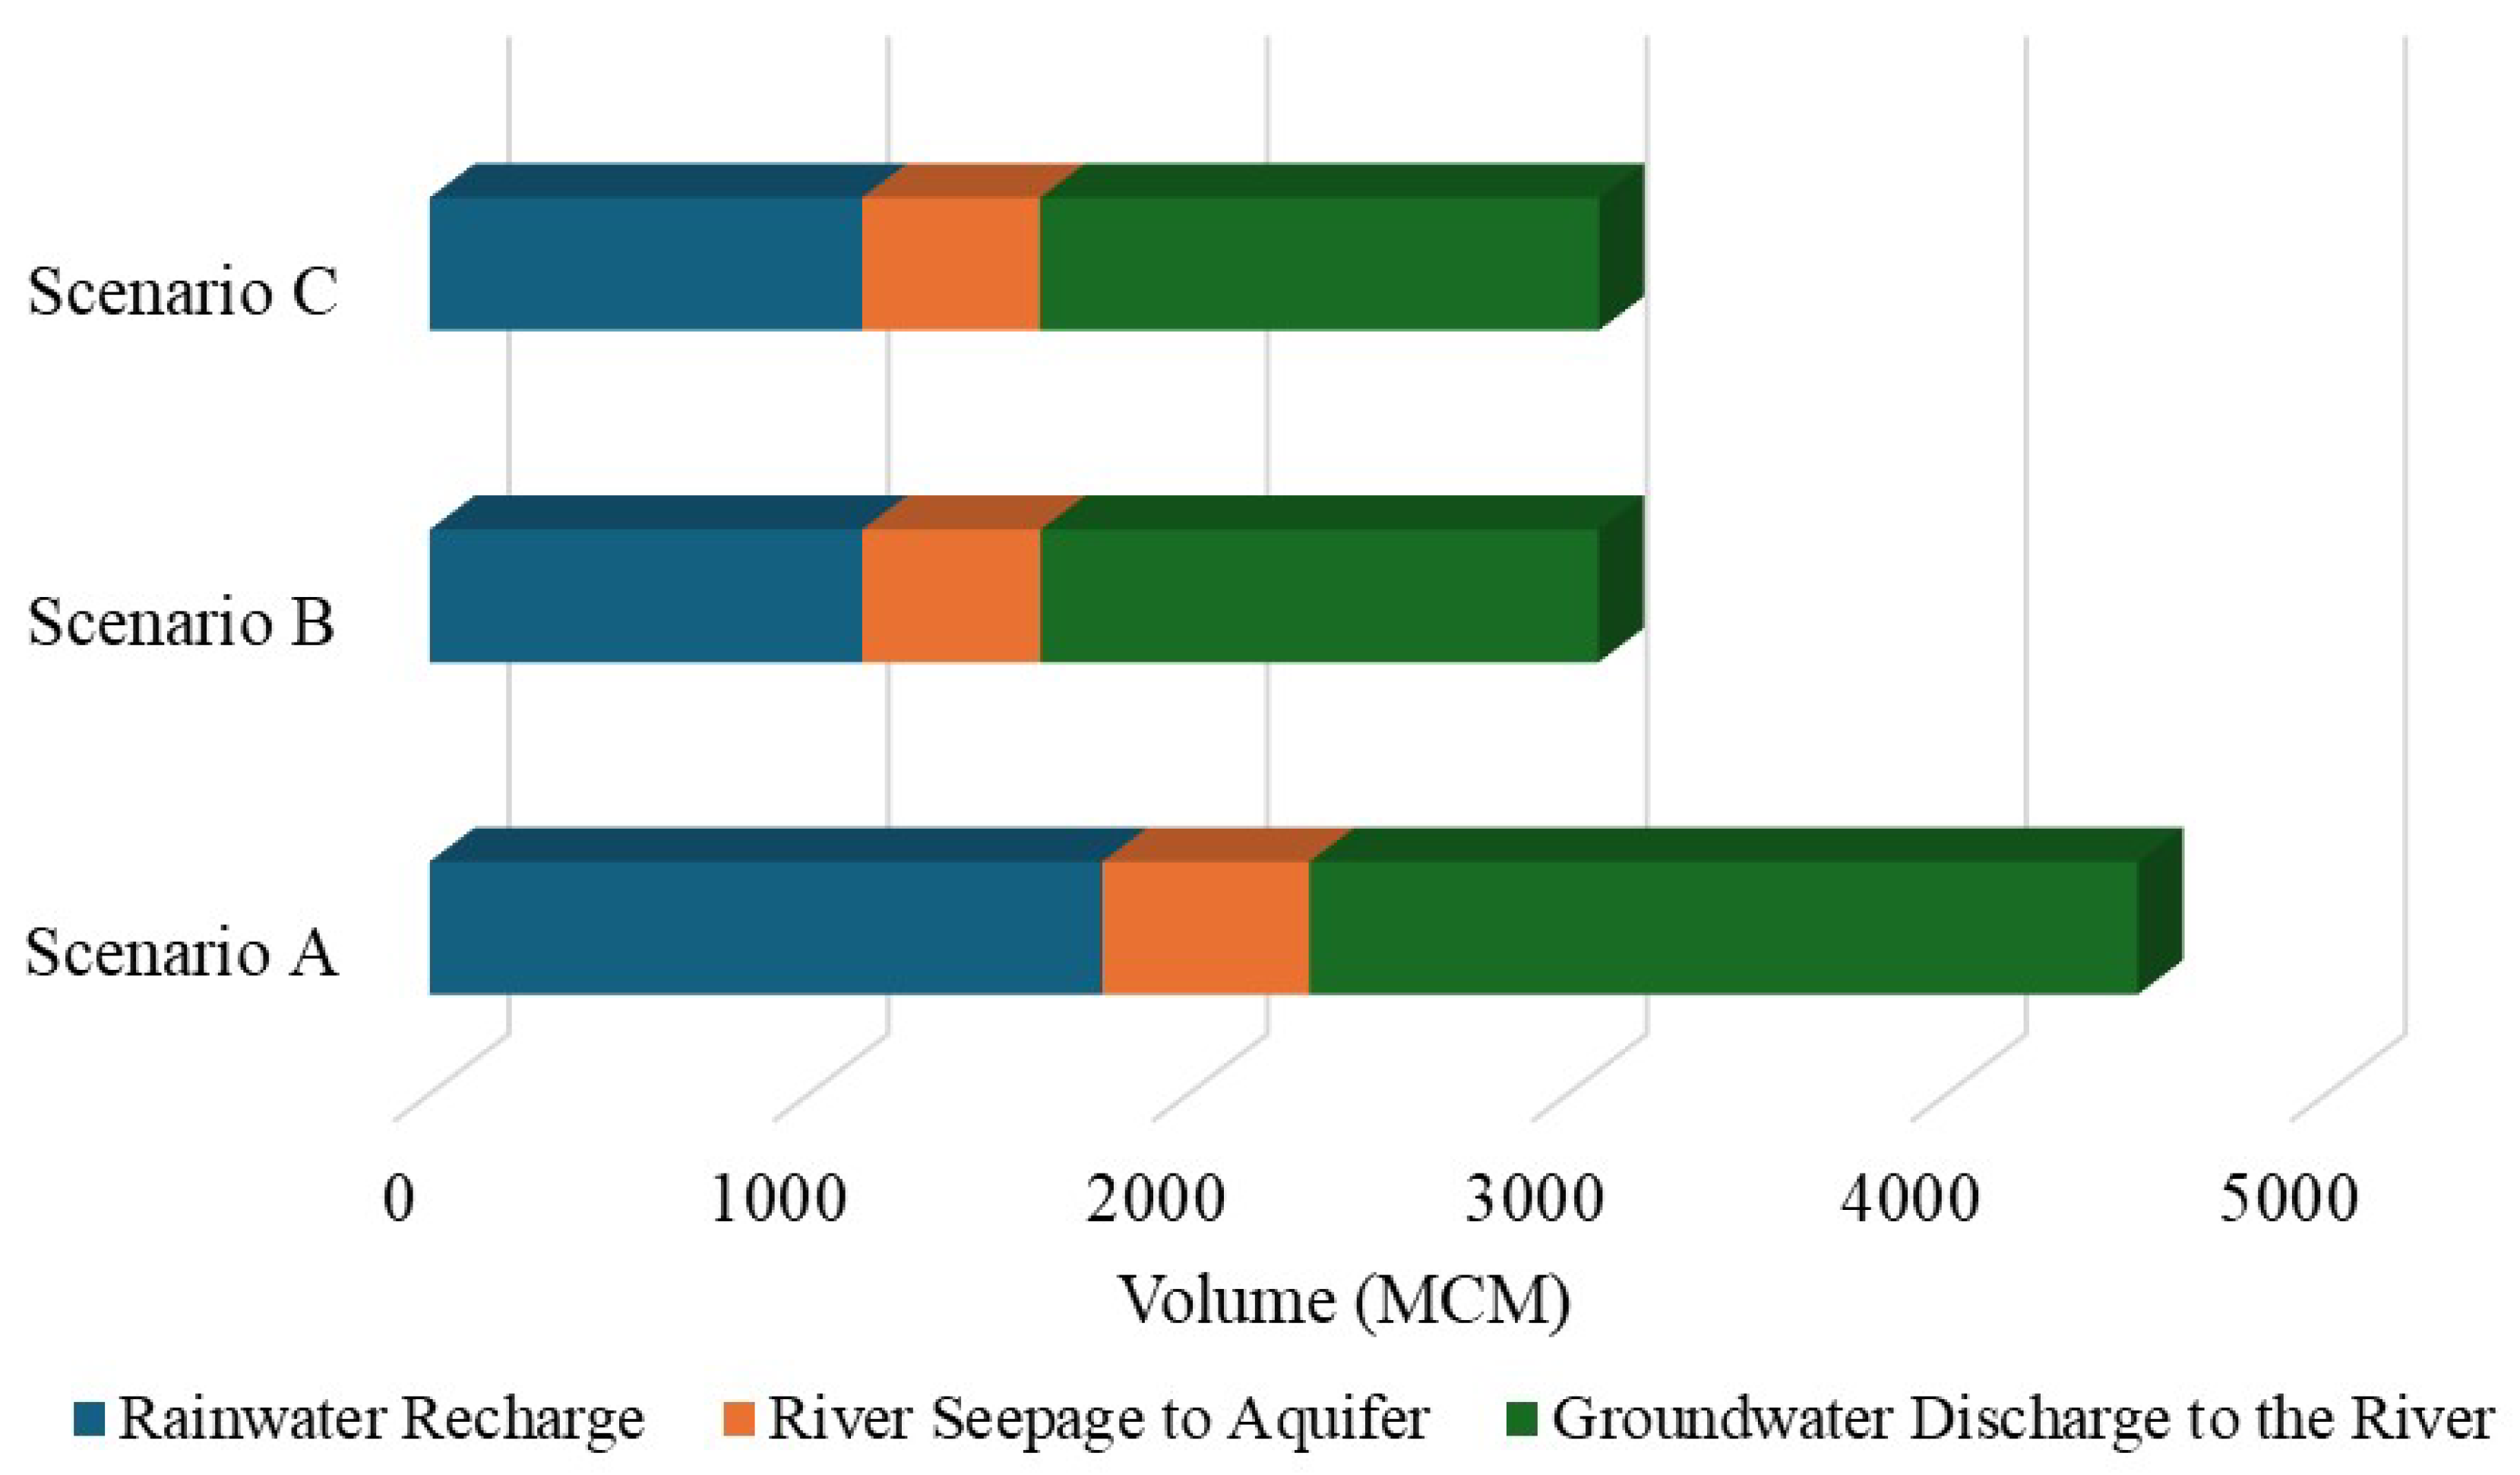
Figure 9.
Simulated hydraulic head difference between two different periods: 1980-1988 and 2000-2008 for a) All the pixels over the basin (b) pixels that maintained the same land use between the two periods.
Figure 9.
Simulated hydraulic head difference between two different periods: 1980-1988 and 2000-2008 for a) All the pixels over the basin (b) pixels that maintained the same land use between the two periods.
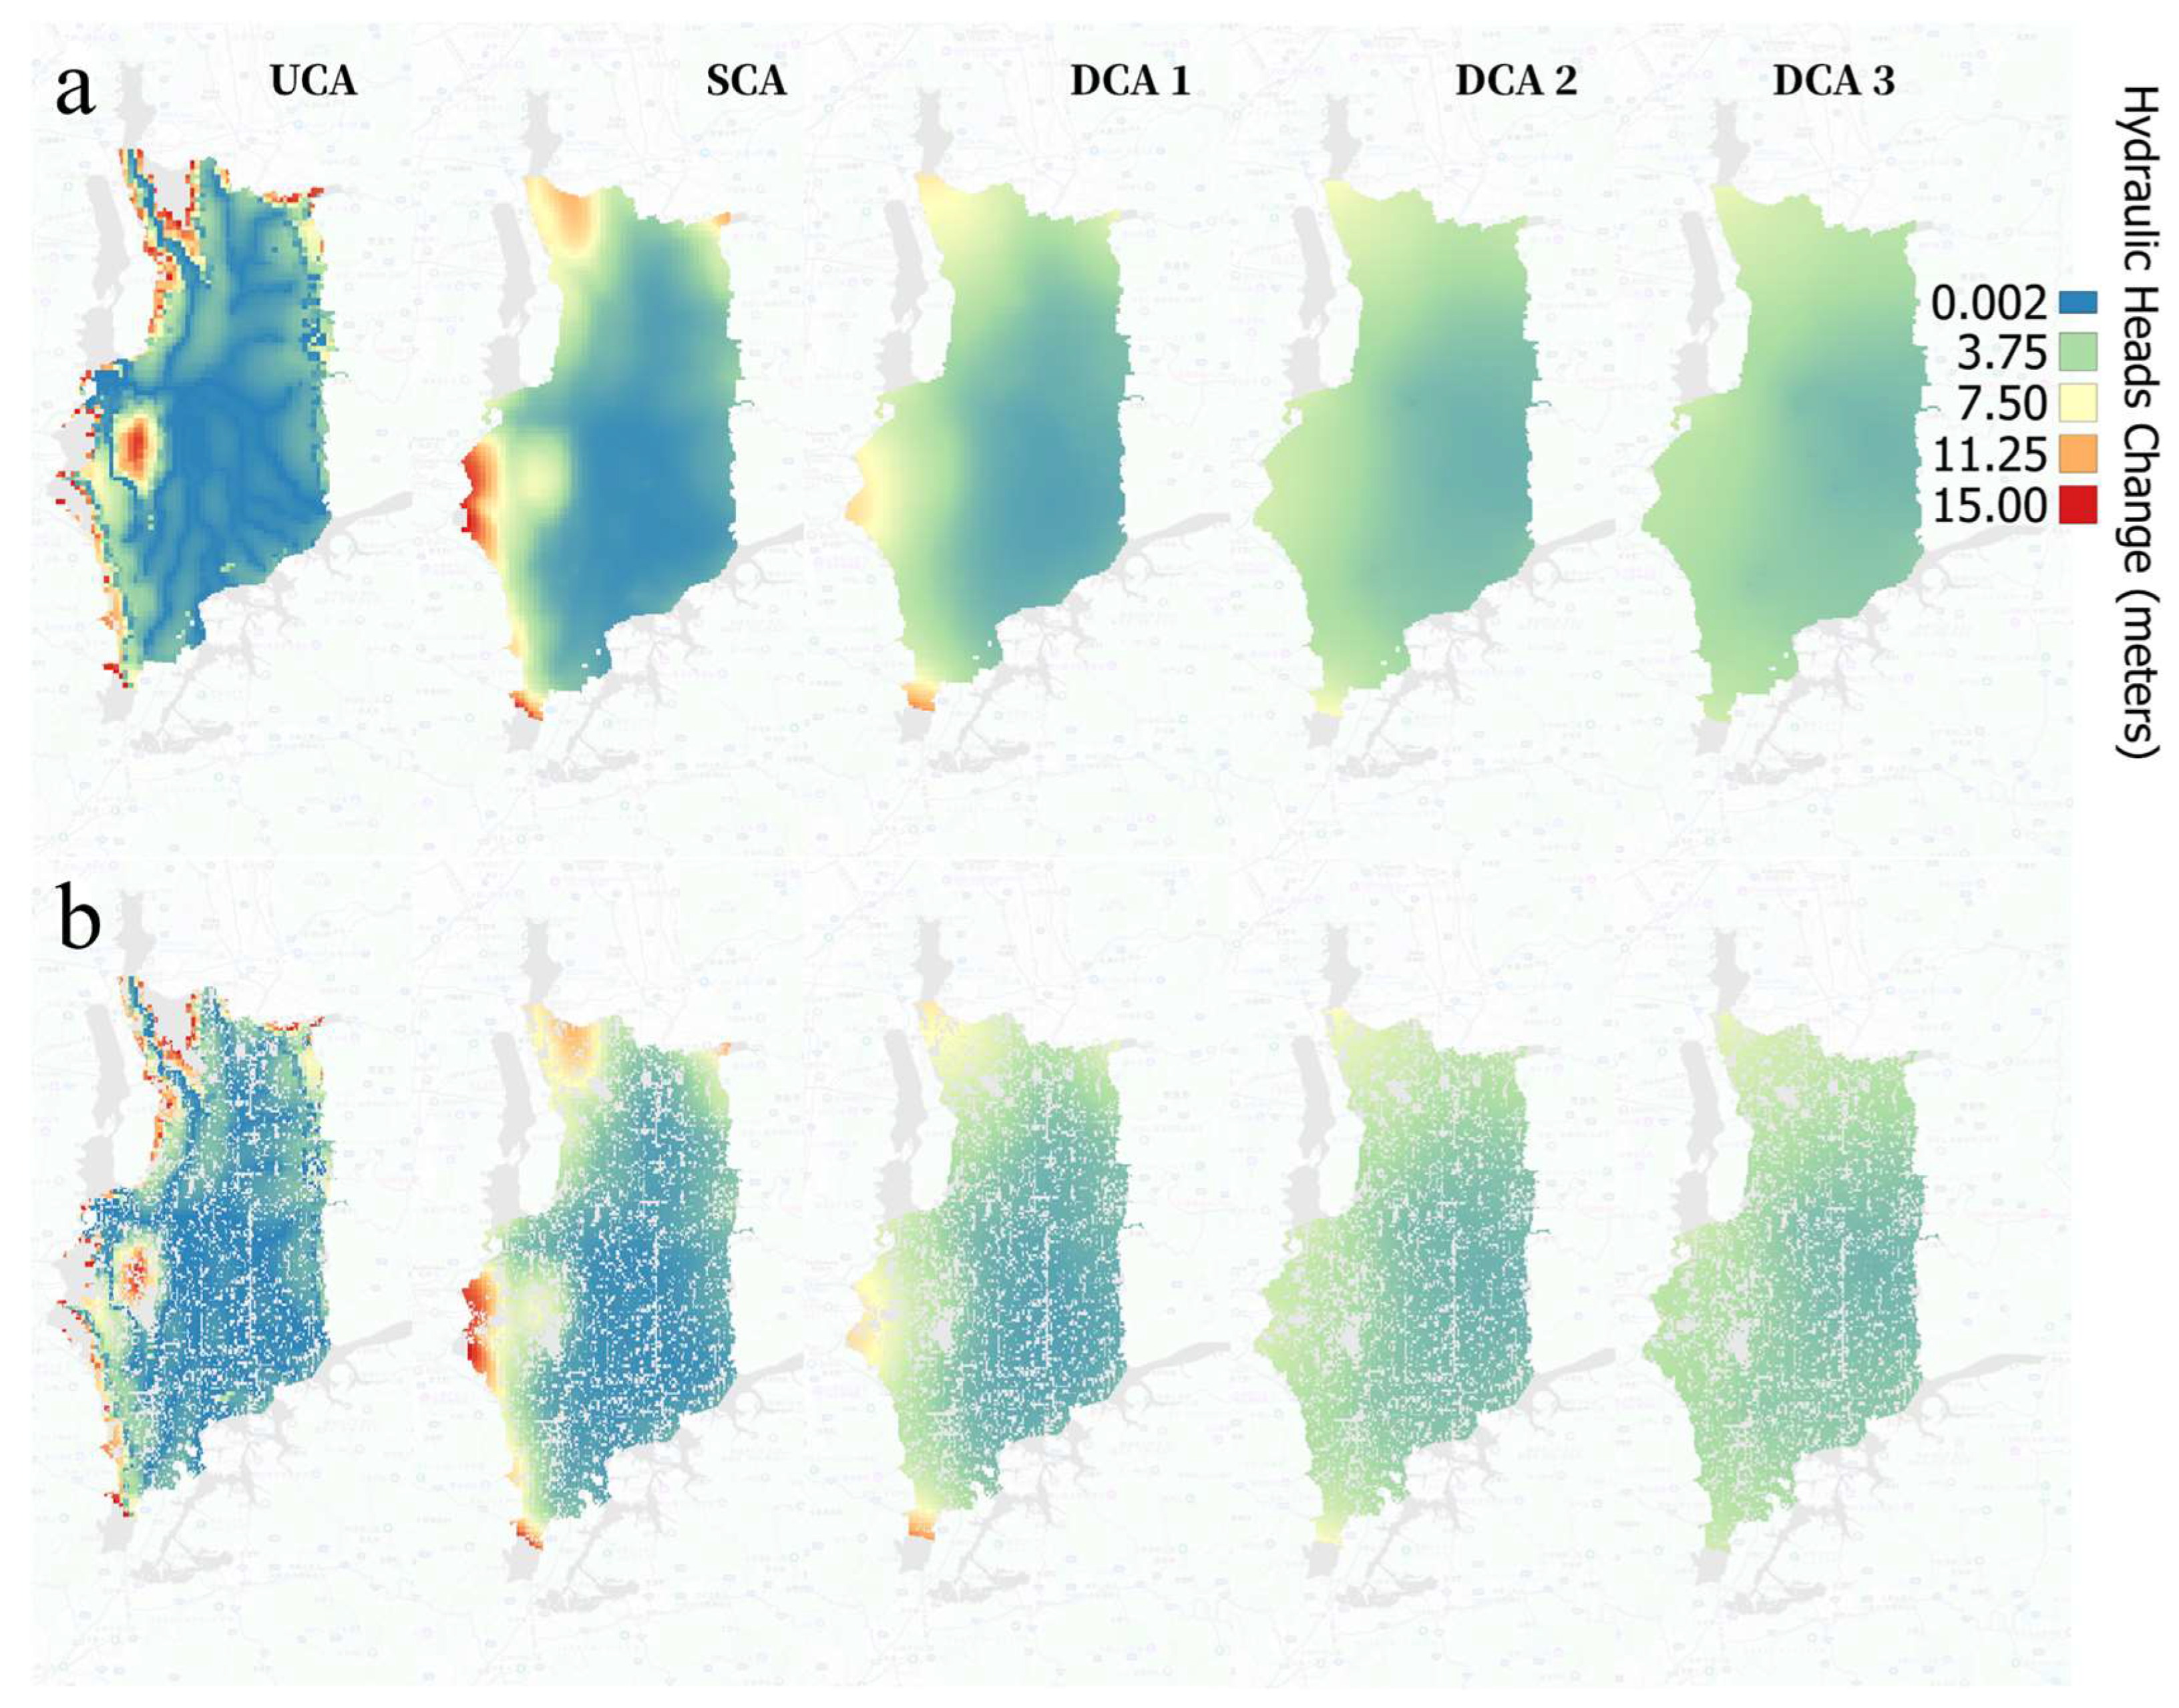

Table 1.
Land use classification based on permeability.
| Pervious Surfaces | Impervious Surfaces |
|---|---|
| Rice_Paddy | Built_up (urban) |
| Croplands | Barren-Land (Rocks) |
| Orchards | Roads |
| Tree Fields | Public Area |
| Forest | Recreation |
Disclaimer/Publisher’s Note: The statements, opinions and data contained in all publications are solely those of the individual author(s) and contributor(s) and not of MDPI and/or the editor(s). MDPI and/or the editor(s) disclaim responsibility for any injury to people or property resulting from any ideas, methods, instructions or products referred to in the content. |
© 2025 by the authors. Licensee MDPI, Basel, Switzerland. This article is an open access article distributed under the terms and conditions of the Creative Commons Attribution (CC BY) license (http://creativecommons.org/licenses/by/4.0/).
Copyright: This open access article is published under a Creative Commons CC BY 4.0 license, which permit the free download, distribution, and reuse, provided that the author and preprint are cited in any reuse.


