
Submitted:
26 May 2025
Posted:
26 May 2025
You are already at the latest version
Abstract
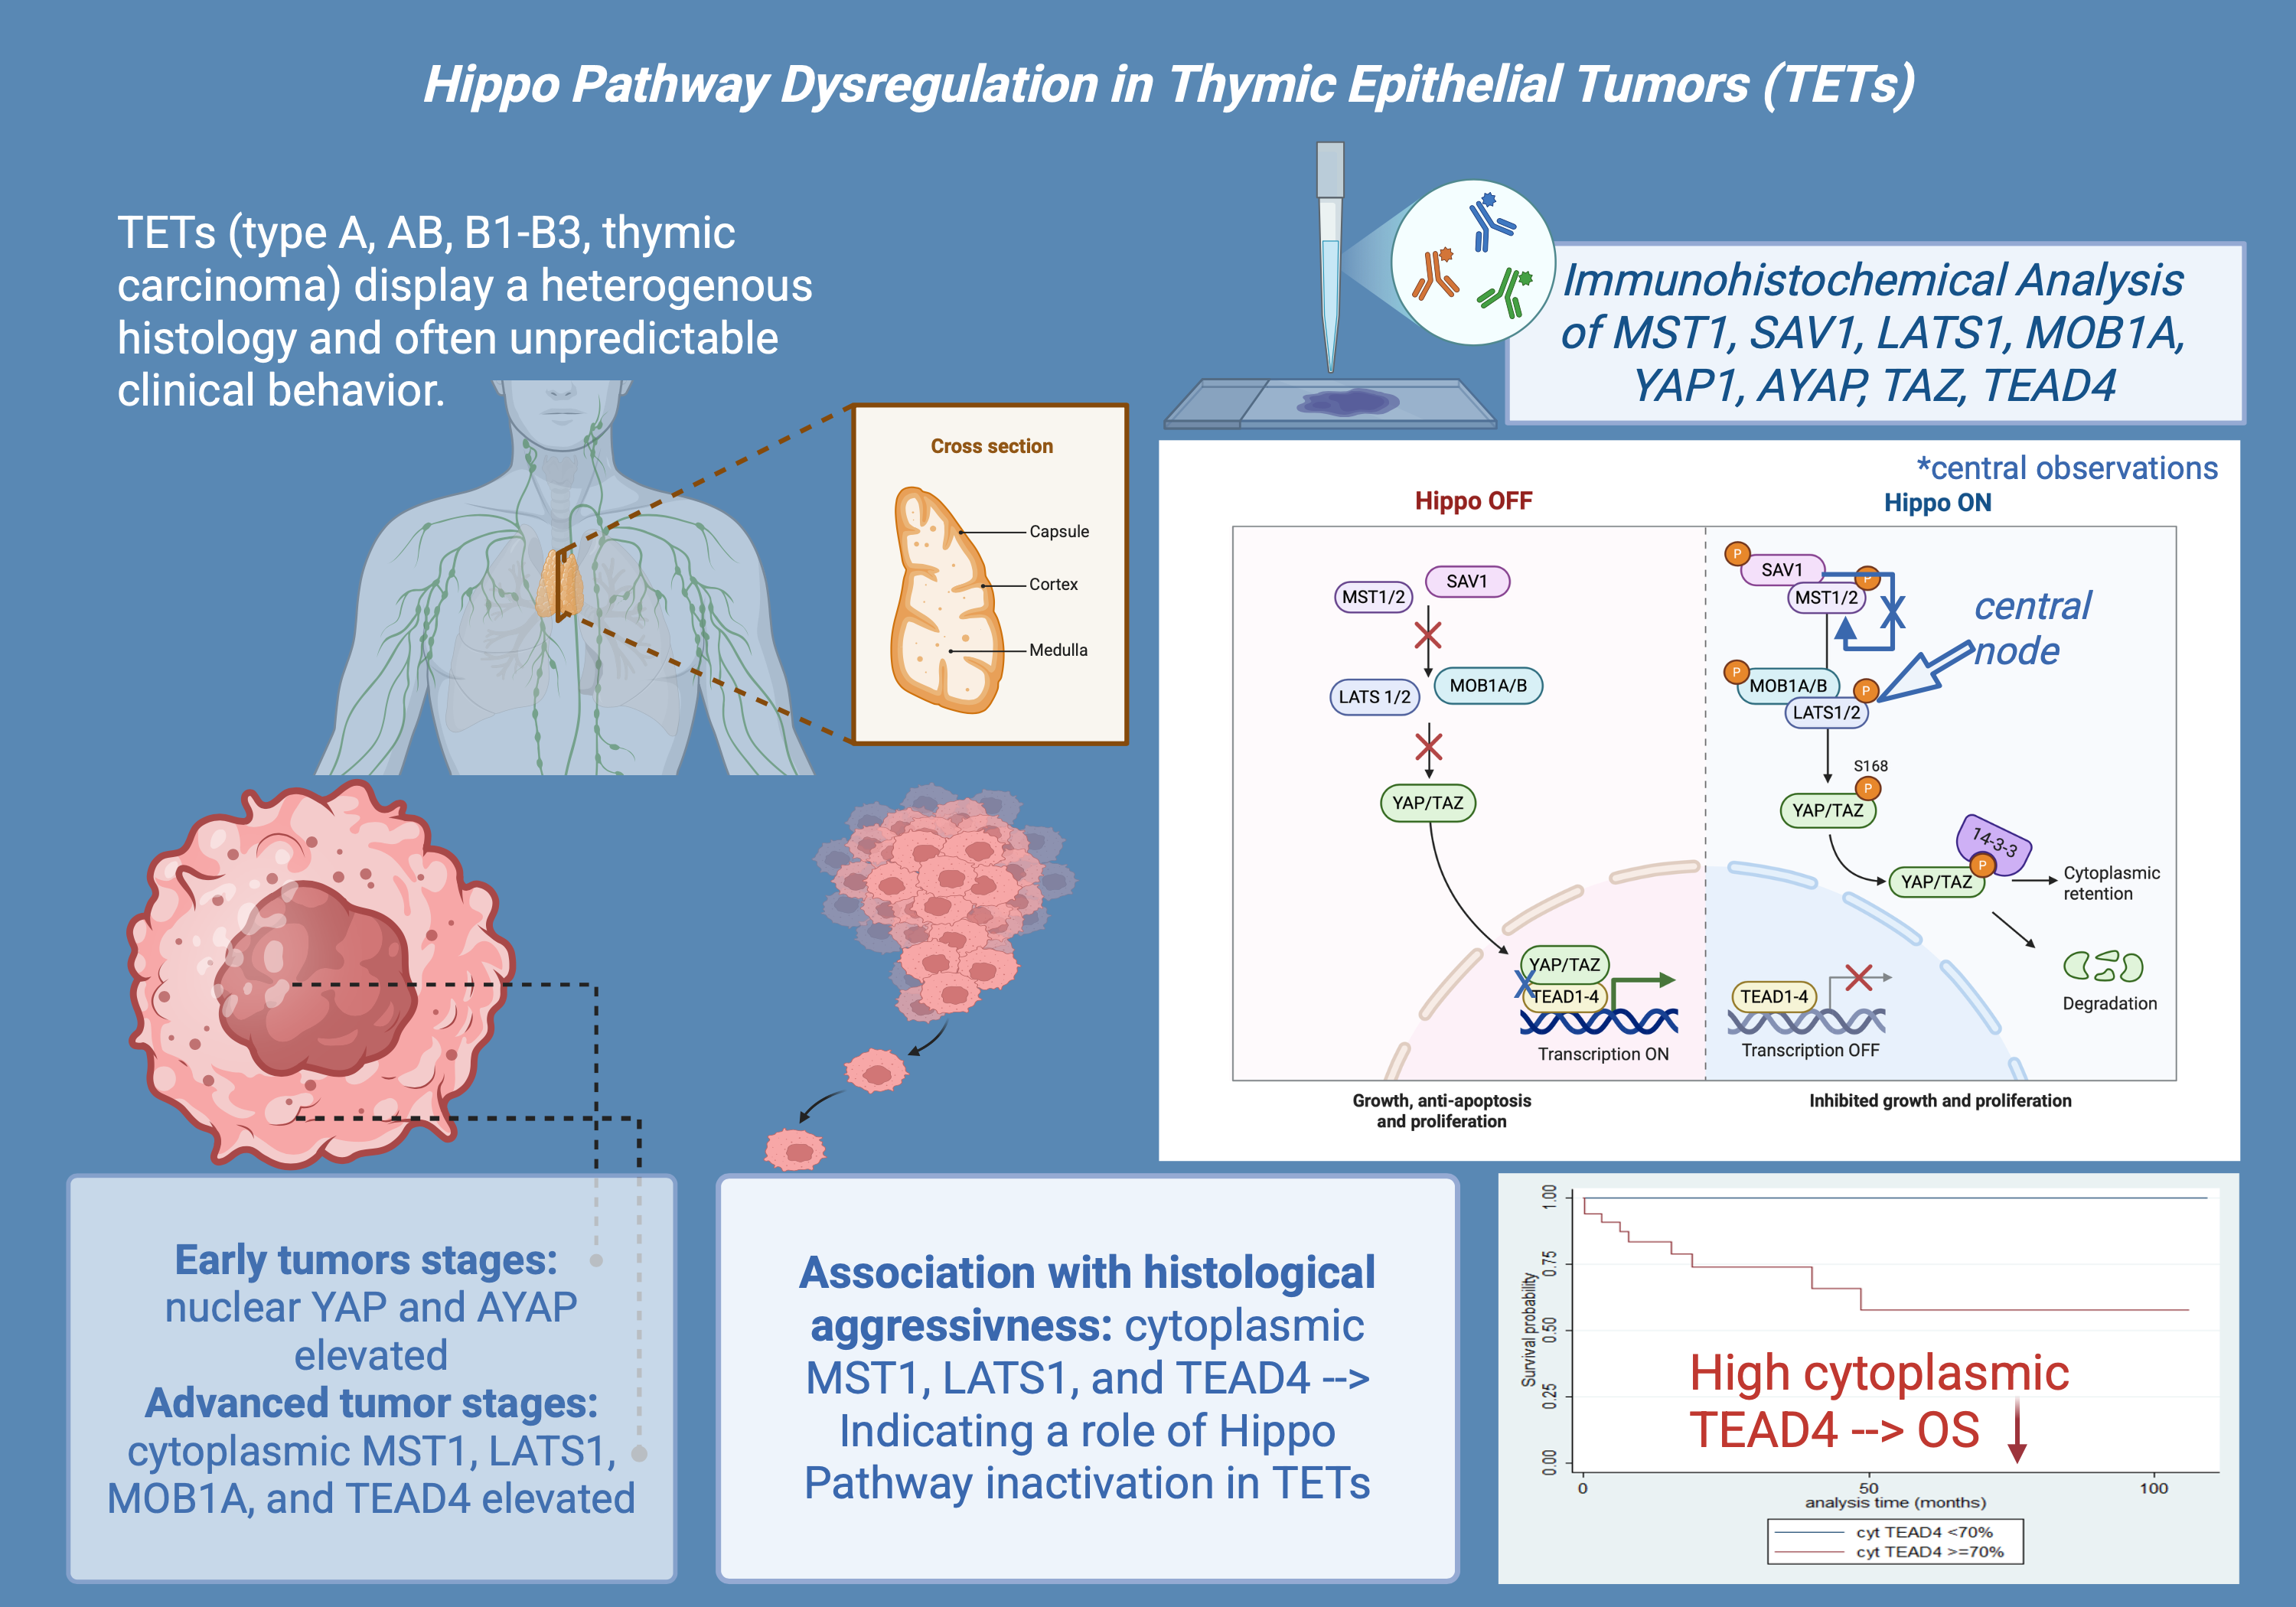
Thymic epithelial tumors (TETs) display a heterogeneous histology and often unpredictable clinical behavior. The Hippo signaling pathway has been implicated in tumorigenesis, but its role in TETs remains poorly characterized. We analyzed the immunohistochemical expression of core Hippo pathway components—YAP1, active YAP (AYAP), TAZ, LATS1, MOB1A, MST1, SAV1, and TEAD4—in 77 TETs. Associations with clinicopathological parameters and patients’ survival were explored. We observed widespread expression of Hippo pathway components in TETs with significant associations among the molecules and differences in their subcellular localization and with the expression in normal tissue. Early stage TETs showed higher nuclear YAP1 (p = 0.032) and AYAP (p = 0.007), while cytoplasmic MST1 (p = 0.002), LATS1 (p = 0.007), MOB1A (p = 0.033) and TEAD4 (p < 0.001) correlated with advanced stage. Cytoplasmic MST1 (p = 0.014), LATS1 (p < 0.001) and TEAD4 (p = 0.005) were associated with histological aggressiveness. Cytoplasmic TEAD4 overexpression was associated with poorer overall survival (p = 0.003). Our findings provide novel insights into the differential regulation and compartmentalization of Hippo components in TETs. While indolent tumors show features consistent with partial Hippo inactivation, more aggressive phenotypes exhibit reduced nuclear YAP/TAZ and altered TEAD4 compartmentalization, suggesting a context-dependent Hippo signaling state. Cytoplasmic TEAD4 emerges as a potential adverse prognosticator, indicating involvement in non-canonical or Hippo-independent signal mechanisms.
Keywords:
thymic epithelial tumors
; TETs
; hippo signaling pathway
; immunohistochemistry
1. Introduction
The thymus, situated in the anterior mediastinum, is essential for immunological development, especially in the maturation and selection of T-cells. This organ comprises different cortical and medullary areas, each inhabited by specialized epithelial cells [1,2,3]. Malignant transformation of thymic epithelial cells leads to the growth of thymic epithelial tumors (TETs), a rare yet clinically relevant category of neoplasms exhibiting epithelial traits [1,4,5,6]. Although infrequent, constituting merely a small fraction (0.2% to 1.5%) of all human malignancies, TETs are the predominant neoplasms located in the anterior mediastinum [7].
From a pathological perspective, the World Health Organization (WHO) categorizes TETs into six specific subtypes (A, AB, B1, B2, B3, and thymic carcinoma (TC)), according to the lymphocyte-to-epithelial cell ratio and the tumor's physical characteristics [7,8,9]. However, histological features alone cannot consistently predict tumor activity, as benign-appearing thymomas may have aggressive, invasive traits [7,10]. Tumor invasiveness is a more precise prognostic indicator, with survival results varying significantly: individuals with non-invasive TETs have a 15-year survival rate of 47%, whereas those with invasive tumors experience a substantially worse prognosis, with survival rates declining to 12.5% [7,10,11,12]. The Masaoka-Koga staging system continues to be the established approach for evaluating tumor invasion [4,6,10,11,12]. Due to the difficulties in differentiating indolent from aggressive TETs, researchers are increasingly concentrating on molecular markers to improve diagnostic precision and refine prognosis assessment [13,14].
The Hippo pathway has received attention among the signaling pathways involved in cancer due to its regulation of cell proliferation, apoptosis, and organ size [1,15,16,17]. Moreover, it plays a critical role in the development and homeostasis of the thymus [13,14]. The Hippo signaling pathway is an evolutionarily conserved kinase cascade that modulates cell development and inhibits cancer (Figure 1) [1,15].
This pathway mostly encompasses the kinases MST1/2 (Mammalian STE20-like kinases) and LATS1/2 (Large tumor suppressor kinases). Upon activation of MST1/2, it phosphorylates LATS1/2, which then phosphorylates the transcriptional co-activators TAZ (Transcriptional co-activator with PDZ-binding motif) and YAP (Yes-associated protein) [1,15,17,18]. The phosphorylation leads to the sequestration and degradation of YAP and TAZ in the cytoplasm, preventing their nuclear translocation and consequent activation of gene expression [1,15,17,18]. The Hippo pathway is further controlled by adaptor proteins such as MOB1 (Mps one binder 1) and SAV1 (Salvador homolog 1). MOB1 enhances the activation of LATS1/2 by stabilizing MST1/2, while SAV1 acts as a scaffold protein, facilitating MST1/2 kinase activity. In the absence of Hippo pathway activity, unphosphorylated YAP and TAZ translocate to the nucleus, where they interact with transcription factors like TEAD4 (TEA domain transcription factor 4) to augment the expression of genes related to cell proliferation, survival, and tissue growth [1,13,15,17,18,19].
The deregulation of the Hippo pathway is linked to various malignancies, and the uncontrolled activation of YAP/TAZ is proposed to promote abnormal cellular proliferation and survival in numerous tumors, facilitating tumor progression [1,18]. Despite advancements in understanding TET biology, the precise role and dysregulation mechanisms of the Hippo signaling pathway in these tumors remain largely unexplored, with only a limited number of studies addressing its role [1]. Notably, a recent study by Palamaris et al. (2023) has laid the groundwork by investigating the expression of key Hippo pathway components in TETs, highlighting their potential as molecular markers [1].
This study aims to enhance the analysis initiated by investigating not only the key elements YAP1, TAZ, LATS1, and TEAD4, but also the supplementary components MOB1, MST1, and SAV1 of the Hippo signaling pathway across various TET subtypes and their association with clinical parameters. Furthermore, we examine the correlations between the expression patterns of individual Hippo pathway components to uncover potential functional interactions, providing a more comprehensive understanding of its regulatory mechanisms in TETs.
The inclusion of these additional components is vital for gaining a deeper understanding of the pathway's activity and regulation in TETs. Additionally, we analyze the expression of active YAP, which is particularly important for assessing the functional state of YAP and its potential role in promoting cell proliferation and tumor progression. By examining these relationships, we seek to discover novel molecular markers that may substantially enhance risk stratification, enable more personalized treatment strategies, and ultimately improve patient outcomes by providing superior diagnostic tools and targeted therapies for these rare and challenging tumors.
2. Results
2.1. Immunohistochemical Expression of MST1 in TETs
In general, approximately 50% of thymocytes exhibited positive cytoplasmic staining in normal thymic tissue, while all other cell populations remained negative. Positive staining was observed in macrophages and ocassionally in lymphocytes (Figure 2A).
MST1 expression in TETs was cytoplasmic and present in the vast majority of the cases (74/77, 96.1%), with a median value of 10% (range 0–100%). Only one of the three negative cases displayed nuclear immunopositivity. The vast majority of the cases displayed moderate staining intensity (71.4%), whereas 9.1% showed strong and 19.4% mild staining intensity. In six cases we also found a positive immunoreactivity in lymphocytes.
MST1 cytoplasmic expression was higher in TCs compared to thymomas (Mann-Whitney U test, p = 0.014, Figure 2D) and in advanced tumor stage (Mann-Whitney U test, p = 0.002, Figure 2B,C,E. Moreover, when we compared the expression levels between B3 thymomas and TCs with the remaining histological types, B3 thymomas and TCs displayed a significantly higher MST1 expression (Mann Whitney U test, p = 0.032, Figure 2D). There was no significant association with tumor size (Spearman’s correlation coefficient, p = 0.152), patients’ overall survival (log-rank test, >10% versus ≥10%, p = 0.99) or the remaining clinicopathological parameters as presented in Table A1.
2.2. Immunohistochemical Expression of SAV1 in TETs
In normal thymic tissue, SAV1 expression was cytoplasmic strongly positive. Likewise, both adipose and connective tissues exhibited robust positivity (Figure 3A).
SAV1 immunoreactivity in TETs was cytoplasmic and was observed in all the cases (77/77, 100%), showing an extensive expression in the majority of the cases (median value 100%, range 80–100%, Figure 3B,C). 74% of the cases displayed a strong staining intensity, 24.7% a moderate and only one case (1.3%) a mild staining intensity. In seventeen cases (22.1%) a positive staining was also observed in the lymphocytes.
In all but one of the B3/TC cases (96.4%) we observed an expression of SAV1 in all tumor cells, whereas in 24.5% of the rest WHO histological types there were also negative tumor cells within the tumor area (Fischer’s exact test, p = 0.025).The same applied to cases with advanced Masaoka-Koga stage, which all displayed a positive expression of SAV1 in all tumor cells, whereas in 23.4% of the stage I/II cases we found also negative tumor cells within the tumor (Fischer’s exact test, I/II versus III/IV, p = 0.027). There was no significant association with tumor size (Spearman’s correlation coefficient, p = 0.237), patients’ overall survival (log-rank test, <100% versus 100%, p = 0.479) or the remaining clinicopathological parameters, as presented in Table A2.
2.3. Immunohistochemical Expression of LATS1 in TETs
In normal thymic tissue, LATS1 exhibited weak cytoplasmic positivity, thymocytes showed nuclear positivity, and lymphocytes were negative (Figure 4A).
LATS1 expression in TETs was cytoplasmic and present in all cases (77/77), with a median value of 90% (range 10–100%). In fourteen cases (18%) we observed an intense staining, in 26 (33.8%) a moderate, in 29 (37.5%) a mild and in 8 (10.4%) a very light stain in terms of intensity. In 27 cases (35.1%) we also had a positive stain in the lymphocytes. Positive LATS1 lymphocytes were mostly observed in B1-B2 thymomas as well as in AB thymomas (Fischer’s exact test, p < 0.001).
B3 Thymomas and TCs displayed significantly higher levels of LATS1 expression compared to the rest WHO histological types (Mann-Whitney U test, p < 0.001, Figure 4B,C,D). In particular, TCs seemed to have the highest levels of expression when compared to thymomas, as displayed in Figure 4D (Mann-Whitney U test, p < 0.001).The same applied to cases with advanced Masaoka-Koga stage (III/IV), which displayed higher levels of LATS1 expression (Mann-Whitney U test, p = 0.007, Figure 4E). LATS1 expression was not correlated with the patient’s overall survival (log-rank test, p = 0.838) and the remaining clinicopathological parameters, as presented in Table A3.
2.4. Immunohistochemical Expression of MOB1A in TETs
Normal thymic tissue demonstrated diffuse cytoplasmic immunoreactivity in both thymic epithelial cells and thymocytes, while connective and adipose tissue, as well as vascular structures serving as internal negative controls, remained entirely unstained (Figure 5A). In general, the staining intensity observed in non-neoplastic regions was markedly lower than that observed in tumor tissue.
MOB1A expression in TETs was cytoplasmic and was present in all the examined cases (76/76, 100%), with a median value of 100% (range 10–100%, Figure 5B,C). The majority of the cases (47/76, 59.2%) have displayed an intense stain, 26.3% a moderate and 13.5% a mild staining intensity. In 30 cases we also observed a positive staining in the lymphocytes (39.5%). Positive MOB1A lymphocytes were mostly observed in B1-B3 thymomas as well as in AB thymomas (Fischer’s exact test, p = 0.014).
B3 thymomas and TCs tended to have higher levels of MOB1A expression (Mann-Whitney U test p = 0.063, Figure 5D), but this relationship was of marginal significance. Additionally, advanced Masaoka-Koga stage cases showed higher levels of MOB1A expression (Mann-Whitney U test, I/II versus III/IV, p = 0.033, Figure 5E). MOB1A expression was not correlated with the patient’s overall survival (log-rank test, >100% versus 100%, p = 0.592) and the remaining clinicopathological parameters, as presented in Table A4.
2.5. Immunohistochemical Expression of YAP1 in TETs
Immunohistochemical analysis of YAP1 revealed stronger staining in normal thymic tissue compared to thymomas. In normal tissue, thymocytes showed mild to moderate nuclear and cytoplasmic positivity, while lymphocytes were negative (Figure 6A). Endothelial cells (vessels) displayed both nuclear and cytoplasmic YAP1 expression.
YAP1 expression in TETs was both nuclear and cytoplasmic. Nuclear YAP1 expression was observed in 90.9% (70/77, median value 40%) and cytoplasmic in 63.4% (44/77, median value 15%) of the cases. Most of the cases displaying nuclear immunoreactivity had either a moderate (34/70) or a mild (29/70) staining intensity, whereas most of the cases displaying cytoplasmic immunoreactivity had a moderate staining intensity (31/44). Nuclear and cytoplasmic YAP1 expression were positively correlated (Spearman’s correlation coefficient, R = 0.32, p = 0.004).
Nuclear YAP1 expression was higher in thymomas compared to TCs (Mann-Whitney U test, p = 0.001, Figure 6B,C,D) and in early tumor stage (Mann-Whitney U test, I/II versus III/IV, p = 0.023). Moreover, when we compared the expression levels between B3 thymomas and TCs with the remaining histological types, B3 thymomas and TCs displayed a significantly lower nuclear YAP1 expression (Mann Whitney U test, p = 0.010, Figure 6D). Advanced tumor stage cases displayed higher levels of cytoplasmic YAP1 expression (Mann-Whitney U test, I versus II/III/IV, p = 0.032, Figure 6E). There was no significant association between either nuclear or cytoplasmic YAP1 expression and patient’s overall survival (log-rank, <40% versus ≥40%, p = 0.323 for nuclear expression and <15% versus ≥15%, p = 0.468 for cytoplasmic expression) or the remaining clinicopathological parameters, as presented in Table A5 and Table A6.
2.6. Immunohistochemical Expression of Active YAP (AYAP) in TETs
In normal thymic tissue, thymocytes exhibited moderate nuclear positivity, predominantly with a strong staining intensity (Figure 7A).
AYAP immunohistochemical expression in TETS was both nuclear and cytoplasmic. Nuclear immunopositivity was observed in 72 cases (72/77, 93.5%, median value 40%) and cytoplasmic in 58 cases (58/77, 75.3%, median value 30%). Five cases did not display either nuclear or cytoplasmic AYAP expression, 58 showed both nuclear and cytoplasmic immunoreactivity, and the remaining 14 cases showed only nuclear expression. The vast majority of the examined cases showed a staining of mild intensity in both immunolocalizations, followed by moderate staining intensity, with only 5 cases having a strong nuclear and only 1 a strong cytoplasmic immunoreactivity. Nuclear and cytoplasmic AYAP expression were positively correlated (Spearman’s correlation coefficient, R = 0.58, p < 0.001).
Nuclear AYAP expression was higher in thymomas compared to TCs (Mann-Whitney U test, p < 0.001, Figure 7B,C,D) and in early tumor stage (Mann-Whitney U test, I/II versus III/IV, p = 0.007, Figure 7E). Moreover, type A/AB thymomas displayed the highest levels of nuclear AYAP expression, followed by type B thymomas, whereas TCs had the lowest levels of nuclear AYAP expression (Kruskal Wallis ANOVA, p = 0.001, Figure 7D). Type A/AB thymomas also displayed the highest levels of cytoplasmic AYAP expression, followed by TC and B1-B3 thymomas (Kruskal Wallis ANOVA, p = 0.011, Figure 7F). Both nuclear and cytoplasmic AYAP expression were not correlated with patients’s overall survival (log-rank, <40% versus ≥40%, p = 0.296 for nuclear expression and <30% versus ≥30%, p = 0.614 for cytoplasmic expression, Table A7). The associations of nuclear or cytoplasmic AYAP with the remaining clinicopathological parameters are presented in Table A7.
2.7. Immunohistochemical Expression of TAZ in TETs
TAZ generally shows low cytoplasmic expression in normal thymic tissues, with sporadic mild nuclear positivity observed (Figure 8A). Thymocytes occasionally exhibited nuclear positivity, while endothelial cells showed strong positivity.
TAZ expression in TETs was both nuclear and cytoplasmic. Nuclear expression was observed in 68.8% of the cases (53/77) with a median value of 10% (range 0–90) and cytoplasmic in 51.9% of the cases (40/77) with a median value of 2% (range 0–90%). Most of the positive cases displayed a rather moderate staining intensity. Twenty-eight cases displayed both nuclear and cytoplasmic immunopositivity, 25 only nuclear, 12 only cytoplasmic and 12 did not show any nuclear or cytoplasmic immunopositivity. There was no association between nuclear and cytoplasmic TAZ expression (Spearman’s correlation coefficient, p = 0.814).
There was a significant difference in nuclear TAZ expression among different categories of TETs, thymomas B1-B3 showing the lowest levels of expression, followed by TCs, whereas TETs containing an A component (A or AB) had the highest levels of nuclear TAZ expression (Kruskal Wallis ANOVA, p = 0.004, Figure 8B,C,D). On the other hand, cytoplasmic TAZ expression was significantly lower in B3/TC compared to the rest WHO histological types (Mann-Whitney U test, p = 0.004, Figure 8D). There was no significant correlation with Masaoka-Koga stage (Mann-Whitney U test, I/II versus III/IV, p = 0.182 for nuclear expression and p = 0.281 for cytoplasmic expression), or with patient’s overall survival (log-rank test, <10% versus ≥10%, p = 0.951 for nuclear expression, <2% versus ≥2% p = 0.218 for cytoplasmic expression, or the remaining parameters, as presented in Table A8 and Table A9.
2.8. Immunohistochemical Expression of TEAD4 in TETs
In normal thymic tissue, nuclear positivity for TEAD4 was observed, while cytoplasmic staining was weakly positive. Lymphocytes remained negative (Figure 9A).
TEAD4 expression in TETs was both nuclear and cytoplasmic. Nuclear immunopositivity was observed in 49 cases (49/77, 63.6%, median value 15%) and cytoplasmic in 73 cases (73/77, 94.8%, median value 70%). Two cases did not display either nuclear or cytoplasmic TEAD4 expression, 47 showed both nuclear and cytoplasmic immunoreactivity, 26 displayed only cytoplasmic expression and the remaining 2 cases showed only nuclear expression. The majority of the examined cases showed a nuclear staining of mild intensity and a cytoplasmic staining of moderate intensity, with only 1 case having a strong nuclear and only 6 a strong cytoplasmic immunoreactivity. Nuclear and cytoplasmic TEAD4 expression were positively correlated (Spearman’s correlation coefficient, R = 0.31, p = 0.007). In four cases we also observed a positive immunoreactivity in the lymphocytes.
Cytoplasmic TEAD4 expression was higher in TCs compared to thymomas (Mann-Whitney U test, p = 0.002, Figure 9D) and in advanced tumor stage (Mann-Whitney U test, I/II versus III/IV, p < 0.001, Figure 9B,C,E). On the other hand both type A/AB thymomas and TCs displayed higher levels of nuclear TEAD4 expression compared to thymomas type B1, B2, and B3 (Kruskal Wallis ANOVA, p = 0.005, Figure 9B–D). Nuclear TEAD4 expression was not correlated with patients’s overall survival (log-rank, <15% versus ≥15%, p = 0.850, Table A10). However, cytoplasmic TEAD4 expression was correlated with worse patients’ overall survival (log-rank, <70% versus ≥70%, p = 0.003, Figure 10, Table A11). Moreover, cytoplasmic TEAD4 expression was positively correlated with the patient’s age (Spearman correlation’s coefficient, R = 0.25, p = 0.027, Table A10). The associations of nuclear or cytoplasmic TEAD4 with the remaining clinicopathological parameters are presented in Table A10 and Table A11.
2.9. Associations Between the Investigated Molecules of the Hippo Cascade
Table 1 illustrates in detail the associations between the investigated molecules. There were positive associations between cytoplasmic MST1 with many of its downstream proteins, namely cytoplasmic LATS1, cytoplasmic MOB1A, cytoplasmic TAZ and cytoplasmic TEAD4 expression. The correlation with cytoplasmic SAV1 was only of marginal significance. Cytoplasmic SAV1 expression was positively correlated with cytoplasmic LATS1, whereas cytoplasmic LATS1 was also positively associated with cytoplasmic MOB1A and all the downstream proteins, namely nuclear and cytoplasmic TAZ, cytoplasmic YAP1, cytoplasmic AYAP, and nuclear and cytoplasmic TEAD4. Cytoplasmic MOB1A was also positively correlated with its downstream proteins cytoplasmic TAZ, cytoplasmic YAP1 and AYAP and cytoplasmic TEAD4. Both nuclear and cytoplasmic TAZ were positively associated with the downstream molecules, such as nuclear YAP1 as well as nuclear and cytoplasmic AYAP, whereas additionally nuclear TAZ showed positive correlations with nuclear and cytoplasmic TEAD4 with cytoplasmic TAZ being associated with cytoplasmic YAP1. As expected, nuclear and cytoplasmic YAP1 expression was positively associated with nuclear and cytoplasmic AYAP expression and additionally only cytoplasmic YAP1 expression had a significant positive correlation with nuclear and cytoplasmic TEAD4. On the other hand only cytoplasmic AYAP was positively correlated with cytoplasmic TEAD4 expression.
3. Discussion
TETs, though extremely rare neoplasms, represent a significant clinical challenge due to their histological diversity, unpredictable behavior, and limited molecular characterization [7,10,13]. Despite the presence of specific staging systems like Masaoka-Koga, distinguishing indolent from aggressive TETs remains complex, as even histologically benign-appearing thymomas can exhibit invasive traits [10]. This underscores the urgent need for molecular markers to refine prognostic stratification and guide therapeutic strategies. The Hippo signaling pathway as a conserved regulator of organ size, apoptosis, and cell proliferation, which has emerged as a critical player in tumorigenesis across multiple malignancies, is a potential candidate in this regard [1,13,15,16,18]. However, its role in TETs remains poorly understood, with only one study by Palamaris et al. (2023) investigating some of the Hippo pathway components, namely YAP, TAZ, LATS1, and TEAD4 in TETs [1]. Building on this foundation, our study expands the scope by evaluating the additional upstream regulators MOB1A, MST1, and SAV1 alongside YAP, TAZ, LATS1, and TEAD4. Importantly, we also assess active (dephosphorylated) YAP, a functional marker reflecting Hippo pathway suppression and oncogenic potential [1,17].
Our analysis revealed distinct expression patterns of Hippo pathway components in TETs, possibly reflecting a complex and potentially context-dependent regulatory network. YAP1 showed predominantly a nuclear but also a cytoplasmic localization, with a positive correlation between the expression levels in both compartments. This predominantly nuclear localization aligns with Palamaris et al. (2023) and supports the assumption of Hippo pathway inactivation in TETs. Similar patterns have been reported in lung, breast, and gastrointestinal carcinomas [1,20]. Importantly, we are the first to report immunohistochemical detection of AYAP in TETs. AYAP was found both in the nucleus and in the cytoplasm in the majority of the examined cases, suggesting an ongoing activation of YAP transcriptional programs. This dual localization has also been described in breast cancer [21], but its biological relevance is not clear. TAZ showed nuclear expression in most of the cases, half of them also displaying cytoplasmic immunoreactivity. These results are also consistent with Palamaris et al. (2023) and with findings in multiple tumor types such as non small cell lung cancer (NSCLC), hepatocellular, and colorectal carcinomas, as well as glioblastoma and breast cancer [1,22]. TEAD4, the main nuclear binding partner of YAP/TAZ, showed predominantly a cytoplasmic immunolocalization and an additional moderate nuclear expression. A similar cytoplasmic expression of TEAD4 was also reported by Palamaris et al. [1].This observation may contrast with its known role as a transcription factor [1,17] but has already been reported in several cell types [23]. Several studies confirm that TEAD4 may explicitly multiple cellular locations including the nucleus, cytosol and mitochondria [24]. The cytoplasmic accumulation of TEAD4 could be attributed to several mechanisms, including MST1–Akt1-mTOR axis signaling [25,26], environmental stress with p38 signaling [27] or expression of dominant-negative TEAD4 splice variants, which are known to exhibit both nuclear and cytoplasmic localization and to function as a dominant-negative isoform by antagonizing canonical YAP/TAZ-mediated transcription [28].
The upstream regulators of the Hippo pathway, namely MST1, SAV1, LATS1, and MOB1A, were almost exclusively localized to the cytoplasm, consistent with their canonical roles in Hippo signaling [17]. This pattern was particularly evident for MST1, which exhibited cytoplasmic staining in the vast majority of the cases, aligning with findings in pancreatic cancer cells [29]. Interestingly, a single case showed nuclear MST1 expression, which may indicate activation of apoptotic signaling pathways, as nuclear translocation of MST1 has been described under apoptotic conditions and linked to caspase-mediated cleavage in pancreatic and HER2-positive breast cancer [30,31,32,33]. In contrast to our observations, LATS1 was reported to be mainly nuclear in TETs in the study of Palamaris et al. (2023); however, cytoplasmic LATS1 expression is supported by studies in renal and colorectal carcinoma [1,34]. The cytoplasmic immunolocalization of SAV1 and MOB1A is also in line with previous reports in pancreatic carcinoma for SAV1 [17,35] and in NSCLC for MOB1A [36].
Positive staining in lymphocytes was observed for some upstream Hippo pathway components, namely LATS1 (35.1%), SAV1 (22.1%), and MOB1A (39.5%). While the primary focus of Hippo signaling lies in epithelial tumor cells, the presence of pathway components in tumor-infiltrating lymphocytes may suggest additional immunological roles. LATS1, SAV1, and MOB1A are known to regulate T-cell function, differentiation, and survival [37]. Their expression in the lymphocytic compartment could indicate local immune modulation, aberrant thymocyte selection, or activation states induced by the tumor microenvironment. This finding may be especially relevant in lymphocyte-rich thymoma subtypes and warrants further investigation to understand whether Hippo signaling in these immune cells contributes to immune surveillance, suppression, or escape mechanisms within the TET niche.
In our study, we found a moderated cytoplasmic MST1 staining in normal thymic tissue in about 50% of thymocytes, with occasional positivity in macrophages and lymphocytes. On the contrary, neoplastic tissue showed significantly stronger MST1 expression, suggesting an increased Hippo pathway activity in tumors. The same applied to LATS1, MOB1A, TAZ and TEAD4 and was less obvious but still apparent in the case of YAP1, all of which displayed an increased expression in neoplastic compared to normal tissue. On the other hand, AYAP expression was more prominent in normal compared to tumor tissue, while SAV1 was the only marker showing strong staining in both normal and neoplastic tissue. These findings highlight a potential dysregulation of Hippo signaling in thymomas, with variations in expression patterns that could correlate to tumorigenesis.
Nuclear YAP1 and AYAP expression was significantly higher in type A and AB thymomas compared to TCs, a result that is in line with Palamaris et al., who similarly found elevated nuclear YAP in these tumors [1]. Notably, both studies observed that B3 thymomas also exhibit increased nuclear YAP levels, underscoring the potential role of transcriptionally active YAP in these tumors. Accordingly, cytoplasmic MST1 expression as well as nuclear and cytoplasmic LATS1 expression were significantly higher in TCs and B3 thymomas. We also found that nuclear TAZ expression is highest in TETs with an A component and significantly lower in B1–B3 thymomas, while cytoplasmic TAZ is markedly diminished in B3 thymomas and TCs, suggesting that alterations in TAZ localization may correlate with tumor aggressiveness. In the same context, TEAD4 emerges as a critical marker since both nuclear and cytoplasmic TEAD4 are significantly high in TCs. These observations are in alignment with the results of Palamaris et al. and especially these differential expression profiles underscore the distinct roles of YAP1, AYAP, TAZ, MST1, LATS1, and TEAD4 in TET biology, suggesting that altered Hippo pathway signaling may underlie key differences in tumor behavior across histological types [1].
Our analysis revealed significant associations between the expression levels of several Hippo pathway components and the Masaoka–Koga tumor stage, further indicating a potential involvement in tumor aggressiveness. Cytoplasmic MST1, LATS1, MOB1A and TEAD4 expression was significantly elevated in advanced Masaoka–Koga stages compared to early stages. The association of LATS1 and TEAD4 with tumor stage has also been reported by Palamaris et al [1]. These results suggest a potential involvement of MST1, LATS1, MOB1A and TEAD4 in the progression of TETs, possibly via altered subcellular dynamics or compensatory feedback in response to Hippo pathway dysregulation. This cytoplasmic shift of expression may indicate a loss of nuclear activity, potentially contributing to YAP/TAZ activation and Hippo pathway escape in more aggressive tumor phenotypes. In alignment with this hypothesis is the higher cytoplasmic YAP1 expression and reduced nuclear AYAP expression in advanced-stage TETs. Similarly, SAV1 showed a stage-dependent expression pattern: all advanced-stage tumors exhibited uniform positivity of SAV1 in all tumor cells, whereas in 23.4% of early-stage tumors, tumor cell subpopulations lacked SAV1 expression. This pattern may reflect stabilization or selective retention of Hippo core components during tumor progression. Similar associations of the altered expression of members of the Hippo cascade with tumor stage have also been reported in other tumor types, such as NSCLC [18,38], prostate [38], pancreatic [39], colon and gastric [39,40], hepatocellular [15] and breast cancer [38,40].
One of the most interesting findings of our analysis emerges from the systematic assessment of the prognostic relevance of the examined Hippo pathway components. For the majority of markers, including MST1, SAV1, LATS1, MOB1A, TAZ, YAP1, AYAP, and nuclear TEAD4, no significant association with patients’ overall survival was observed. Interestingly, however, high cytoplasmic TEAD4 expression was significantly associated with poorer overall survival, suggesting a potential prognostic role for this cytoplasmic TEAD4 fraction. Mechanistically, this adverse prognostic effect may reflect involvement in non-nuclear Hippo-related oncogenic mechanisms. Cytoplasmic accumulation of TEAD4 may result from upstream signaling events such as MST1–Akt1–mTOR activation or p38 signaling under cellular stress, as previously described [25,26,27], or may arise through dominant-negative TEAD4 isoforms that exhibit dual localization and antagonize canonical YAP/TAZ-driven transcription [28]. These alterations could contribute to oncogenic processes via activation of metabolic pathways, regulation of mitochondrial oxidative phosphorylation (OXPHOS) [27], or cross-talk with PI3K/AKT signaling. Our study is the first to demonstrate that cytoplasmic TEAD4 expression alone—independent of its nuclear counterpart—is significantly associated with patient outcome in TETs, thereby identifying the first prognostic role of a cytoplasmic Hippo pathway component in this tumor entity.
While nuclear TEAD4 has been reported as a prognostic marker in various malignancies such as bladder cancer [41,42], renal clear cell carcinoma [43], and lung adenocarcinoma [44], and one glioma study applied a combined nuclear–cytoplasmic score [45], cytoplasmic TEAD4 has not previously been evaluated as an isolated prognostic variable. These alternative signaling routes provide a plausible mechanistic framework to interpret the prognostic relevance of cytoplasmic TEAD4 in TETs and highlight its potential as a therapeutic target beyond canonical Hippo axis disruption. However, our findings require validation in larger, independent cohorts.
Correlation analysis revealed a coordinated expression pattern among Hippo pathway proteins in TETs, reflecting both canonical signaling architecture and tumor-specific regulatory adaptations. Cytoplasmic MST1 showed significant associations with downstream targets such as LATS1, MOB1A, TAZ, and TEAD4, indicating preserved upstream activity. Notably, LATS1 emerged as a central node, correlating positively with multiple downstream components—including TAZ, YAP1, AYAP, and TEAD4—supporting its key role in phosphorylating and retaining YAP/TAZ in the cytoplasm [16,46]. In contrast, SAV1 showed only weak associations, mainly with LATS1, and no clear links to other Hippo components. This limited connectivity deviates from its classical role as a scaffold protein within the MST–LATS complex [46]. Several factors may explain this finding, such as tumor-specific loss of regulatory function, post-translational modifications [47], or a more structural, non-dynamic role in TETs. Among downstream effectors, YAP1 and AYAP exhibited strong intra- and intercompartmental correlations, particularly in the nucleus. TEAD4 showed the strongest associations in the cytoplasm, correlating with cytoplasmic TAZ, LATS1, and AYAP. These findings suggest TEAD4 may engage in cytoplasmic interactions in TETs, possibly through complex formation, alternative splicing (e.g., TEAD4-S) [28], or cytoplasmic signaling crosstalk, unlike in other tumors such as hepatocellular [1,22] or colorectal carcinomas [19], where TEAD4 functions predominantly in the cell nucleus. Importantly, no significant correlation was observed between nuclear YAP1 and nuclear TEAD4, suggesting a functional uncoupling of these canonical co-activators in the nuclear compartment. Taken together, our results indicate that thymic tumors may employ alternative mechanisms of Hippo signaling modulation.
Several limitations of this study should be acknowledged. First, the cohort size, although reasonable for a rare tumor entity such as TETs, remains limited and did not allow us to perform multivariate survival analysis to test the potential prognostic significance of TEAD4 expression adjusted to possible cofactors. Second, while immunohistochemical analysis provides valuable spatial and semi-quantitative insights into protein expression and localization, it is inherently limited by variability in antibody specificity, staining conditions, and scoring subjectivity [48]. Although internal controls and established evaluation criteria were applied, technical variation cannot be entirely excluded [49]. Third, the study was restricted to protein-level analyses and did not incorporate complementary molecular data such as mRNA expression or protein isoform analysis, which could provide a more detailed understanding of pathway activation, mechanistic relationships and functional relevance [50]. Additionally, the study focused on a static analysis of protein expression in Formalin-Fixed, Paraffin-Embedded (FFPE) tissues, which does not capture dynamic signaling events or functional interactions. As such, the correlations observed cannot be interpreted as causal or mechanistically definitive. Despite these limitations, the study provides novel and comprehensive insights into the expression and compartmental regulation of Hippo pathway components in TETs and lays a foundation for future mechanistic and translational research.
Building on these findings, future research should aim to unravel both the mechanistic underpinnings and translational potential of Hippo pathway dysregulation in TETs. Functional validation of key regulators—particularly YAP, TAZ, and TEAD4—could be pursued in in vitro models derived from TET cell lines or engineered systems [38], in an effort to clarify possible causal links between subcellular localization, post-translational modifications, and transcriptional output. To complement immunohistochemical and functional in vitro data, quantitative gene expression analysis using Reverse Trancription quantitative Polymerase Chain Reaction (RT-qPCR) could serve as a valuable method to validate the observed protein-level differences—particularly for YAP, TAZ, and TEAD4—on the mRNA level, and to explore their correlation with tumor subtype or stage. In addition, integration of immunohistochemical data with RNA sequencing, phosphoproteomics, and spatial transcriptomics could provide a deeper understanding of active pathway states and reveal transcriptional programs driving tumor behavior [51,52]. Whole-exome or targeted Next Generation Sequencing (NGS) might identify Hippo-related mutations or co-activated oncogenic pathways (e.g., PI3K/AKT, WNT) [53], potentially yielding novel combinatorial treatment strategies [54,55,56]. Combining expression analysis with DNA-based NGS may also help to elucidate whether genomic alterations contribute to the dysregulated expression and compartmentalization of Hippo pathway components observed in TETs, offering further insight into genotype–phenotype relationships. Importantly, the identification of cytoplasmic TEAD4 expression as a marker associated with poor prognosis highlights a potential therapeutic vulnerability. Recent developments in TEAD-targeting agents—including autopalmitoylation inhibitors (e.g., VT3989, IK-930) [57] may hold promise in YAP/TAZ-driven tumors. However, the prognostic and predictive value of cytoplasmic TEAD4 and other candidate markers should be validated in prospective, clinically annotated TET cohorts.
4. Materials and Methods
4.1. Patients
This is a study of archival FFPE tissue retrieved from the archives of the Department of Pathology, Nuremberg hospital from 77 patients with the diagnosis of a TET between 2013 and 2023 and available medical records. Table 2 presents patients’ characteristics in detail. 39 of the patients were men (50.6%) and 38 women (49.4%), with a median age at the time of diagnosis 69 years (range 21–88 years). The relative frequency of WHO subtypes was as follows: type A 3.9%; type AB 33.7%; type B1 9%; type B2 14.3%; type B3 18.2%; micronodularthymoma with lymphoid stroma (MNT) 2.6%; and thymic carcinoma (TC) 18.2%. Masaoka–Koga stage was I in 33.8%; II in 38.5% III in 13.8%; IVa in 7.7%; IVb in 6.1% of the patients. Surgical margins were positive in 18.7% of the cases, for which this information was available. Co-existing myasthenia gravis was diagnosed in 11 patients. Follow-up information was available for 60 patients, ranging from 0.3 to 109.4 months (median: 21.8 months).
4.2. Immunohistochemistry
Immunohistochemistry (IHC) for the molecules of the Hippo cascade was performed on formalin-fixed, paraffin-embedded tissue sections. From each paraffin block, a 2 µm-thick section was obtained, mounted on a slide, and allowed to dry at 37 °C. Subsequently, the sections were stained with hematoxylin and eosin using an automated staining system (Autostainer Link48, Dako [Agilent]) in combination with the EnVision FLEX Kit (Agilent). The following antibodies were used for the IHC: YAP1 (mouse monoclonal (1A12), invitrogen, 1:1000), Anti-active YAP1 (rabbit monoclonal (EPR19812), abcam, 1:2000), WWTR1 Antibody (TAZ) (mouse monoclonal (2A12A10), proteintech, 1:600), LATS1 (rabbit polyclonal, proteintech, 1:200), MOB1A (rabbit polyclonal, invitrogen, 1:350), SAV1 (mouse monoclonal (OTI2B7), invitrogen, 1:100, MST1 (rabbit polyclonal, invitrogen, 1:250, TEAD4 (rabbit polyclonal, invitrogen, 1:500). For positive controls, we selected tissue samples known to express the target proteins. Specifically, prostate tissue was used for YAP1, human breast cancer tissue for anti-active YAP1, TAZ, LATS1, and MOB1A, placenta tissue for TEAD4, human kidney tissue for SAV1, and human adenocarcinoma tissue for MST1.
IHC evaluation was performed by counting at least 1000 tumor cells in each case independently by an experienced pathologist (L.G.), blinded to clinical information, with complete interobserver compliance. Nuclear and cytoplasmic immunoreactivity was evaluated separately. The extent of protein expression was calculated by the percentage of positive tumor cells to the total number of tumor cells within each specimen. The staining intensity was estimated in four categories: 0 (no reaction), 1 (mild reaction), 2 (moderate reaction), and 3 (intense reaction).
4.3. Statistical Analysis
Statistical analysis was performed by a MSc biostatistician (L.G.). The association between the IHC expression of MST1, with clinicopathological characteristics was examined using non-parametric tests with correction for multiple comparisons, as appropriate. Survival analysis was performed using Kaplan–Meier survival curves and the differences between the curves were compared with log-rank test. Numerical parameters were categorized based on the median value. Due to the small number of events in our cohort as multivariate survival analysis was not conducted. A p-value of <0.05 was considered statistically significant. The analysis was performed with the statistical package STATA 11.0/SE (College Station, TX, USA) for Windows.
5. Conclusions
Our findings demonstrate that the core components of the Hippo signaling pathway are differentially expressed and compartmentalized in TETs, being also differentially expressed in neoplastic compared to normal tissue and showing significant variations according to histological subtype and tumor stage. In particular, these findings indicate a retained or possibly reactivated Hippo pathway activity in advanced tumors, potentially reflecting a shift toward non-canonical, TEAD-independent mechanisms of tumor progression. Importantly, cytoplasmic TEAD4 expression emerged as a novel prognostic marker associated with reduced overall survival, highlighting its potential role in alternative signaling pathways beyond the classical Hippo axis.. Future studies should incorporate functional assays and integrative approaches such as single-cell omics, spatial transcriptomics, and targeted expression analyses by RT-qPCR, as well as DNA-based sequencing strategies, to further elucidate the biological, genomic, and immunological roles of Hippo signaling in thymic tumorigenesis.
Author Contributions
Conceptualization, L.E. and L.G.; methodology, L.E. and L.G.; software, L.G.; validation, L.E., L.G. and A.H. ; formal analysis, L.E. and L.G.; investigation, L.E. and L.G.; resources, T.P.; data curation, L.G.; writing—original draft preparation, L.E and L.G.; writing—review and editing, L.G. and N.G.; visualization, L.E. and L.G.; supervision, L.G. and N.G.; project administration, L.G., N.G. and T.P.; funding acquisition, T.P. All authors have read and agreed to the published version of the manuscript.
Funding
This research received no external funding.
Institutional Review Board Statement
The study was conducted in accordance with the Declaration of Helsinki and approved by the Institutional Review Board of the Paracelsus Medical University (PMU) (IRB-2024-07; 2024-04-05).
Informed Consent Statement
Due to the retrospective nature of the studies and the absence of impact on patients’ treatment, informed consent was not necessary.
Data Availability Statement
The data in this work can be obtained upon request from the corresponding author.
Acknowledgments
This article is a revised and expanded version of an oral presentation entitled “Deciphering Molecular Alterations of the Hippo Signaling Pathway in Thymic Epithelial Tumors Using Immunohistochemistry”, which was presented at the International Electronic Conference on Biomedicines (ECB 2025), Online, 12–15 May 2025 [58].
Conflicts of Interest
The authors declare no conflicts of interest.
Abbreviations
The following abbreviations are used in this manuscript:
| TET(s) | Thymic Epithelial Tumor(s) |
| WHO | World Health Organization |
| TC | Thymic Carcinoma |
| MST1/2 | Mammalian STE20-like kinases |
| LATS1/2 | Large tumor suppressor kinases). |
| TAZ | Transcriptional co-activator with PDZ-binding motif |
| YAP | Yes-associated protein |
| MOB1(A) | Mps one binder 1(A) |
| SAV1 | Salvador homolog 1 |
| TEAD4 | TEA domain transcription factor 4 |
| AYAP | Active YAP1 |
| NSCLC | Non-small cell lung cancer |
| OXPHOS | Mitochondrial oxidative phosphorylation |
| FFPE | Formalin-Fixed, Paraffin-Embedded |
| RT-qPCR | Reverse Transcription quantitative Polymerase Chain Reaction |
| NGS | Next Generation Sequencing |
| WWTR1 | WW domain-containing transcription regulator 1 |
| MNT | Micronodular thymoma with lymphoid stroma |
| PMU | Paracelsus Medical University |
Appendix A
Appendix A.1: MST1

Table A1.
Associations of MST1 cytoplasmic expression with clinicopathological parameters.
| Parameter | MST1 cytoplasmic expression | |
|---|---|---|
| Numerical variables | Spearman’s correlation coefficient | p-value |
| Age | R = −0.08 | p = 0.465 |
| Tumor size | R = 0.18 | p = 0.152 |
| Categorical/nominal variables | ||
| Median (min–max) | p-value* | |
| Gender | ||
| Male | 15 (0–100) | p =0.370 |
| Female | 10 (1–95) | |
| WHO subtypes | ||
| Thymomas | 10 (0–95) | p =0.014 |
| Thymic carcinomas (TC) | 70 (1–100) | |
| Masaoka–Koga stage | ||
| I-II | 10 (0–95) | p =0.002 |
| III-IV | 45 (0–100) |
*Results of Mann-Whitney U test.
Appendix A.2: SAV1
Table A2.
Associations of SAV1 cytoplasmic expression with clinicopathological parameters.
| Parameter | SAV1 expression | ||
|---|---|---|---|
| Numerical variables |
<100% Median (min–max) |
100% Median (min–max) |
p-value* |
| Age (years) | 74 (45–88) | 67 (21–85) | p = 0.264 |
| Tumorsize (cm) | 4.5 (2.4–9) | 6, (0.9–14) | p = 0.237 |
| Categorical/nominal variables | |||
| <100% (n) | 100% (n) | p-value** | |
| Gender | |||
| Male | 4 | 35 | p = 0.138 |
| Female | 9 | 29 | |
| WHO subtypes | |||
| Rest WHO types | 12 | 37 | p = 0.025 |
| B3/TC | 1 | 27 | |
| Masaoka–Koga stage | |||
| I-II | 11 | 36 | p = 0.027 |
| III-IV | 0 | 18 | |
*Results of Mann-Whitney U test, **Results of Fischer’s exact test.
Appendix A.3: LATS1
Table A3.
Associations of cytoplasmic LATS1 expression with clinicopathological parameters in 77 TETs.
Table A3.
Associations of cytoplasmic LATS1 expression with clinicopathological parameters in 77 TETs.
| Parameter | LATS1 cytoplasmic expression | |
|---|---|---|
| Numerical variables | Spearman’s correlation coefficient | p-value |
| Age | R = −0.08 | p = 0.788 |
| Tumor size | R = −0.07 | p = 0.566 |
| Categorical/nominal variables | ||
| Median (min–max) | p-value* | |
| Gender | ||
| Male | 90 (10–100) | p = 0.528 |
| Female | 90 (20–100) | |
| WHO subtypes | ||
| Rest WHO types | 80 (10–100) | p < 0.001 |
| B3/TC | 100 (15–100) | |
| Masaoka–Koga stage | ||
| I-II | 80 (20–100) | p = 0.007 |
| III-IV | 100 (40–100) |
*Results of Mann-Whitney U test.
Appendix A.4: MOB1A
Table A4.
Associations of cytoplasmic MOB1A expression with clinicopathological parameters in 76 TETs.
Table A4.
Associations of cytoplasmic MOB1A expression with clinicopathological parameters in 76 TETs.
| Parameter | MOB1A cytoplasmic expression | |
|---|---|---|
| Numerical variables | Spearman’s correlation coefficient | p-value |
| Age | R = −0.01 | p = 0.879 |
| Tumor size | R = −0.10 | p = 0.389 |
| Categorical/nominal variables | ||
| Median (min–max) | p-value* | |
| Gender | ||
| Male | 100 (10–100) | p = 0.438 |
| Female | 100 (55–100) | |
| WHO subtypes | ||
| Rest WHO types | 100 (55–100) | p = 0.063 |
| B3/TC | 100 (10–100) | |
| Masaoka–Koga stage | ||
| I-II | 100 (55–100) | p = 0.033 |
| III-IV | 100 (10–100) |
*Results of Mann-Whitney U test.
Appendix A.5: YAP1
Table A5.
Associations of nuclear YAP1 with clinicopathological parameters.
| Parameter | YAP1 nuclear expression | |
|---|---|---|
| Numerical variables | Spearman’s correlation coefficient | p-value |
| Age | R = 0.04 | p = 0.669 |
| Tumor size | R = −0.02 | p = 0.870 |
| Categorical/nominal variables | ||
| Median (min-max) | p-value* | |
| Gender | ||
| Male | 30 (0–95) | p = 0.506 |
| Female | 40 (0–90) | |
| WHO subtypes | ||
| Thymomas | 50 (0–95) | p = 0.001 |
| TC | 5 (0–50) | |
| Masaoka–Koga stage | ||
| I-II | 60 (0–95) | p = 0.023 |
| III-IV | 12.5 (0–95) | |
*Results of Mann-Whitney U test.
Table A6.
Associations of cytoplasmic YAP1 with clinicopathological parameters.
| Parameter | YAP1 cytoplasmic expression | |
|---|---|---|
| Numerical variables | Spearman’s correlation coefficient | p-value |
| Age | R = 0.12 | p = 0.273 |
| Tumor size | R = −0.18 | p = 0.144 |
| Categorical/nominal variables | ||
| Median (min-max) | p-value* | |
| Gender | ||
| Male | 20 (0–100) | p = 0.470 |
| Female | 10 (0–100) | |
| WHO subtypes | ||
| Rest WHO types | 50 (0–95) | p = 0.740 |
| B3/TC | 5 (0–50) | |
| Masaoka–Koga stage | ||
| I | 5 (0–80) | p = 0.032 |
| II-IV | 30 (0–100) | |
*Results of Mann-Whitney U test.
Appendix A.6: AYAP
Table A7.
Associations of nuclear and cytoplasmic AYAP with clinicopathological parameters. *Results of Mann-Whitney U test.
Table A7.
Associations of nuclear and cytoplasmic AYAP with clinicopathological parameters. *Results of Mann-Whitney U test.
| Parameter | AYAP nuclear expression | AYAP cytoplasmic expression | ||
|---|---|---|---|---|
| Numerical variables | Spearman’s correlation coefficient | p-value | Spearman’s correlation coefficient | p-value |
| Age | R = 0.01 | p = 0.905 | R = 0.12 | p = 0.281 |
| Tumor size | R = 0.04 | p = 0.740 | R = −0.18 | p = 0.131 |
| Categorical/nominal variables | ||||
| Median (min-max) | p-value | Median (min-max) | p-value | |
| Gender | ||||
| Male | 50 (0–100) | p = 0.299* | 40 (0–100) | p = 0.384* |
| Female | 35 (0–90) | 17.5 (0–100) | ||
| WHO subtypes | ||||
| A/AB | 70 (20–100) | p = 0.001** | 60 (0–100) | p = 0.011** |
| B1, B2, B3 | 30 (0–95) | 10 (0–100) | ||
| TC | 5 (0–60) | 12.5 (0–80) | ||
| Masaoka–Koga stage | ||||
| I-II | 60 (2–95) | p = 0.007* | 45 (0–100) | p = 0.947** |
| III-IV | 17.5 (0–100) | 45 (0–95) | ||
** Results of Kruskal Wallis ANOVA.
Appendix A.7: TAZ
Table A8.
Associations of nuclear TAZ expression with clinicopathological parameters in 77 TETs.
| Parameter | TAZ nuclear expression | |
|---|---|---|
| Numerical variables | Spearman’s correlation coefficient | p-value |
| Age | R = 0.197 | p = 0.086 |
| Tumor size | R = −0.001 | p > 0.999 |
| Categorical/nominal variables | ||
| Median (min-max) | p-value* | |
| Gender | ||
| Male | 10 (0–90) | p = 0.872 |
| Female | 10 (0–70) | |
| WHO subtypes | ||
| Thymomas A/AB | 20 (0–80) | p = 0.004 |
| B1, B2, B3 | 1.5 (0–60) | |
| TC | 12.5 (0–90) | |
| Masaoka–Koga stage | ||
| I-II | 15 (0–70) | p = 0.182 |
| III-IV | 0 (0–80) | |
*Results of Mann-Whitney U test/Kruskal Wallis ANOVA as appropriate.
Table A9.
Associations of cytoplasmic TAZ expression with clinicopathological parameters in 77 patients with TETs.
Table A9.
Associations of cytoplasmic TAZ expression with clinicopathological parameters in 77 patients with TETs.
| Parameter | TAZ cytoplasmic expression | |
|---|---|---|
| Numerical variables | Spearman’s correlation coefficient | p-value |
| Age | R = 0.101 | p = 0.384 |
| Tumor size | R = 0.198 | p = 0.123 |
| Categorical/nominal variables | ||
| Median (min-max) | p-value* | |
| Gender | ||
| Male | 5 (0–90) | p = 0.298 |
| Female | 0 (0–80) | |
| WHO subtypes | ||
| Rest WHO types | 7.5 (0–90) | p = 0.004 |
| B3/TC | 3.5 (0–80) | |
| Masaoka–Koga stage | ||
| I-II | 5 (0–80) | p = 0.281 |
| III-IV | 0 (0–90) | |
*Results of Mann-Whitney U test.
Appendix A.8: TEAD4
Table A10.
Associations of nuclear TEAD4 expression with clinicopathological parameters.
| Parameter | TEAD4 cytoplasmic expression | |
|---|---|---|
| Numerical variables | Spearman’s correlation coefficient | p-value |
| Age | R = 0.25 | p = 0.027 |
| Tumor size | R = −0.11 | p = 0.348 |
| Categorical/nominal variables | ||
| Median (min-max) | p-value* | |
| Gender | ||
| Male | 80 (0–100) | p = 0.198 |
| Female | 60 (0–100) | |
| WHO subtypes | ||
| Thymomas | 60 (0–100) | p = 0.002 |
| TC | 100 (0–100) | |
| Masaoka–Koga stage | ||
| I-II | 60 (0–100) | p < 0.001 |
| III-IV | 95 (20–100) | |
*Results of Mann-Whitney U test ** Results of Kruskal Wallis ANOVA.
Table A11.
Associations of cytoplasmic TEAD4 expression with clinicopathological parameters.
| Parameter | TEAD4 nuclear expression | |
|---|---|---|
| Numerical variables | Spearman’s correlation coefficient | p-value |
| Age | R = 0.12 | p = 0.292 |
| Tumor size | R = −0.15 | p = 0.222 |
| Categorical/nominal variables | ||
| Median (min-max) | p-value | |
| Gender | ||
| Male | 20 (0–90) | p = 0.545* |
| Female | 12.5 (0–100) | |
| WHO subtypes | ||
| A/AB | 25 (0–90) | p = 0.005** |
| B1, B2, B3 | 0 (0–90) | |
| TC | 27.5 (0–100) | |
| Masaoka–Koga stage | ||
| I-II | 10 (0–90) | p = 0.957* |
| III-IV | 7.5 (0–90) | |
*Results of Mann-Whitney U test.
References
- Palamaris, K.; Levidou, G.; Kordali, K.; Masaoutis, C.; Rontogianni, D.; Theocharis, S. Searching for Novel Biomarkers in Thymic Epithelial Tumors: Immunohistochemical Evaluation of Hippo Pathway Components in a Cohort of Thymic Epithelial Tumors. Biomedicines 2023, 11, 1876. [Google Scholar] [CrossRef] [PubMed]
- Gameiro, J.; Nagib, P.; Verinaud, L. The thymus microenvironment in regulating thymocyte differentiation. Cell Adh Migr 2010, 4, 382–390. [Google Scholar] [CrossRef] [PubMed]
- Lin, X.; Gao, Y.; Ding, Y.; Zhao, B. Editorial: Revisiting the thymus: the origin of T cells. Frontiers in Immunology 2023, 14, Editorial. [Google Scholar] [CrossRef]
- Dai, H.; Lan, B.; Li, S.; Huang, Y.; Jiang, G.; Tian, J. Prognostic CT features in patients with untreated thymic epithelial tumors. Scientific Reports 2023, 13, 2910. [Google Scholar] [CrossRef]
- Sumi, A.; Fujimoto, K. Is there any consensus of long-term follow-up for incidental anterior mediastinal nodular lesions? Shanghai Chest 2018, 2. [Google Scholar] [CrossRef]
- Veraar, C.; Janik, S.; Thanner, J.; Veraar, C.; Mouhieddine, M.; Schiefer, A.-I.; Müllauer, L.; Dworschak, M.; Klepetko, W.; Ankersmit, H. J.; et al. Clinical prognostic scores for patients with thymic epithelial tumors. Scientific Reports 2019, 9, 18581. [Google Scholar] [CrossRef]
- Elm, L.; Levidou, G. The Molecular Landscape of Thymic Epithelial Tumors: A Comprehensive Review. International Journal of Molecular Sciences 2024, 25, 1554. [Google Scholar] [CrossRef]
- Marx, A.; Ströbel, P.; Badve, S. S.; Chalabreysse, L.; Chan, J. K.; Chen, G.; de Leval, L.; Detterbeck, F.; Girard, N.; Huang, J.; et al. ITMIG consensus statement on the use of the WHO histological classification of thymoma and thymic carcinoma: refined definitions, histological criteria, and reporting. J Thorac Oncol 2014, 9, 596–611. [Google Scholar] [CrossRef]
- Tomiyama, N.; Johkoh, T.; Mihara, N.; Honda, O.; Kozuka, T.; Koyama, M.; Hamada, S.; Okumura, M.; Ohta, M.; Eimoto, T.; et al. Using the World Health Organization Classification of Thymic Epithelial Neoplasms to Describe CT Findings. American Journal of Roentgenology 2002, 179, 881–886. [Google Scholar] [CrossRef]
- Tassi, V.; Vannucci, J.; Ceccarelli, S.; Gili, A.; Matricardi, A.; Avenia, N.; Puma, F. Stage-related outcome for thymic epithelial tumours. BMC Surg 2019, 18 (Suppl 1), 114. [Google Scholar] [CrossRef]
- Lee, G. D.; Kim, H. R.; Choi, S. H.; Kim, Y. H.; Kim, D. K.; Park, S. I. Prognostic stratification of thymic epithelial tumors based on both Masaoka-Koga stage and WHO classification systems. J Thorac Dis 2016, 8, 901–910. [Google Scholar] [CrossRef] [PubMed]
- Zhou, Q.; Ke, X.; Man, J.; Zhang, B.; Wang, F.; Zhou, J. Predicting Masaoka-Koga Clinical Stage of Thymic Epithelial Tumors Using Preoperative Spectral Computed Tomography Imaging. Frontiers in Oncology 2021, 11. Original Research. [Google Scholar] [CrossRef] [PubMed]
- Liu, Q.; Liu, X.; Song, G. The Hippo Pathway: A Master Regulatory Network Important in Cancer. Cells 2021, 10, 1416. [Google Scholar] [CrossRef]
- Liu, C.; Song, Y.; Li, D.; Wang, B. Regulation of the tumor immune microenvironment by the Hippo Pathway: Implications for cancer immunotherapy. International Immunopharmacology 2023, 122, 110586. [Google Scholar] [CrossRef]
- Mo, J. S.; Park, H. W.; Guan, K. L. The Hippo signaling pathway in stem cell biology and cancer. EMBO reports 2014, 15, 642–656. [Google Scholar] [CrossRef]
- Moshe Oren, Y. A. The Hippo Signaling Pathway and Cancer Springer, 2013. 15, 642-656.
- Fu, M.; Hu, Y.; Lan, T.; Guan, K.-L.; Luo, T.; Luo, M. The Hippo signalling pathway and its implications in human health and diseases. Signal Transduction and Targeted Therapy 2022, 7, 376. [Google Scholar] [CrossRef]
- Liang, H.; Xu, Y.; Zhao, J.; Chen, M.; Wang, M. Hippo pathway in non-small cell lung cancer: mechanisms, potential targets, and biomarkers. Cancer Gene Therapy 2024, 31, 652–666. [Google Scholar] [CrossRef]
- Liu, Y.; Wang, G.; Yang, Y.; Mei, Z.; Liang, Z.; Cui, A.; Wu, T.; Liu, C. Y.; Cui, L. Increased TEAD4 expression and nuclear localization in colorectal cancer promote epithelial-mesenchymal transition and metastasis in a YAP-independent manner. Oncogene 2016, 35, 2789–2800. [Google Scholar] [CrossRef]
- Zhou, D.; Conrad, C.; Xia, F.; Park, J.-S.; Payer, B.; Yin, Y.; Lauwers, G. Y.; Thasler, W.; Lee, J. T.; Avruch, J.; et al. Mst1 and Mst2 Maintain Hepatocyte Quiescence and Suppress Hepatocellular Carcinoma Development through Inactivation of the Yap1 Oncogene. Cancer Cell 2009, 16, 425–438. [Google Scholar] [CrossRef]
- Cao, L.; Sun, P.-L.; Yao, M.; Jia, M.; Gao, H. Expression of YES-associated protein (YAP) and its clinical significance in breast cancer tissues. Human Pathology 2017, 68, 166–174. [Google Scholar] [CrossRef]
- Feng J, R. P. , Gou J, Li Z. Prognostic significance of TAZ expression in various cancers: a meta-analysis. Onco Targets Ther 2016, 9, 5235–5244. [Google Scholar] [CrossRef] [PubMed]
- Home, P.; Saha, B.; Ray, S.; Dutta, D.; Gunewardena, S.; Yoo, B.; Pal, A.; Vivian, J. L.; Larson, M.; Petroff, M.; et al. Altered subcellular localization of transcription factor TEAD4 regulates first mammalian cell lineage commitment. Proc Natl Acad Sci U S A 2012, 109, 7362–7367. [Google Scholar] [CrossRef] [PubMed]
- Kaneko, K. J.; DePamphilis, M. L. TEAD4 establishes the energy homeostasis essential for blastocoel formation. Development 2013, 140, 3680–3690. [Google Scholar] [CrossRef]
- Cinar, B.; Fang, P. K.; Lutchman, M.; Di Vizio, D.; Adam, R. M.; Pavlova, N.; Rubin, M. A.; Yelick, P. C.; Freeman, M. R. The pro-apoptotic kinase Mst1 and its caspase cleavage products are direct inhibitors of Akt1. The EMBO Journal 2007, 26, 4523–4534. [Google Scholar] [CrossRef]
- Chen M, H. B. , Zhu L, Chen K, Liu M, Zhong C. Structural and Functional Overview of TEAD4. Cancer Biology. Onco Targets Ther. 2020, 13, 9865–9874. [Google Scholar] [CrossRef]
- Hsu, S.-C.; Lin, C.-Y.; Lin, Y.-Y.; Collins, C. C.; Chen, C.-L.; Kung, H.-J. TEAD4 as an Oncogene and a Mitochondrial Modulator. Frontiers in Cell and Developmental Biology 2022, 10, Review. [Google Scholar] [CrossRef]
- Qi, Y.; Yu, J.; Han, W.; Fan, X.; Qian, H.; Wei, H.; Tsai, Y.-h. S.; Zhao, J.; Zhang, W.; Liu, Q.; et al. A splicing isoform of TEAD4 attenuates the Hippo–YAP signalling to inhibit tumour proliferation. Nature Communications 2016, 7, ncomms11840. [Google Scholar] [CrossRef]
- Cui, J.; Zhou, Z.; Yang, H.; Jiao, F.; Li, N.; Gao, Y.; Wang, L.; Chen, J.; Quan, M. MST1 Suppresses Pancreatic Cancer Progression via ROS-Induced Pyroptosis. Molecular Cancer Research 2019, 17, 1316–1325. [Google Scholar] [CrossRef]
- Jin, X.; Zhu, L.; Xiao, S.; Cui, Z.; Tang, J.; Yu, J.; Xie, M. MST1 inhibits the progression of breast cancer by regulating the Hippo signaling pathway and may serve as a prognostic biomarker. Mol Med Rep 2021, 23, 383. [Google Scholar] [CrossRef]
- Song, H.; Mak, K. K.; Topol, L.; Yun, K.; Hu, J.; Garrett, L.; Chen, Y.; Park, O.; Chang, J.; Simpson, R. M.; et al. Mammalian Mst1 and Mst2 kinases play essential roles in organ size control and tumor suppression. Proceedings of the National Academy of Sciences 2010, 107, 1431–1436. [Google Scholar] [CrossRef]
- Turunen, S. P.; von Nandelstadh, P.; Öhman, T.; Gucciardo, E.; Seashore-Ludlow, B.; Martins, B.; Rantanen, V.; Li, H.; Höpfner, K.; Östling, P.; et al. FGFR4 phosphorylates MST1 to confer breast cancer cells resistance to MST1/2-dependent apoptosis. Cell Death Differ 2019, 26, 2577–2593. [Google Scholar] [CrossRef] [PubMed]
- Ura, S.; Masuyama, N.; Graves, J. D.; Gotoh, Y. Caspase cleavage of MST1 promotes nuclear translocation and chromatin condensation. Proc Natl Acad Sci U S A 2001, 98, 10148–10153. [Google Scholar] [CrossRef] [PubMed]
- Chen, K. H.; He, J.; Wang, D. L.; Cao, J. J.; Li, M. C.; Zhao, X. M.; Sheng, X.; Li, W. B.; Liu, W. J. Methylation-associated inactivation of LATS1 and its effect on demethylation or overexpression on YAP and cell biological function in human renal cell carcinoma. Int J Oncol 2014, 45, 2511–2521. [Google Scholar] [CrossRef] [PubMed]
- Wang, L.; Wang, Y.; Li, P. P.; Wang, R.; Zhu, Y.; Zheng, F.; Li, L.; Cui, J. J.; Wang, L. W. Expression profile and prognostic value of SAV1 in patients with pancreatic ductal adenocarcinoma. Tumour Biol 2016, 37, 16207–16213. [Google Scholar] [CrossRef]
- Ando, N.; Tanaka, K.; Otsubo, K.; Toyokawa, G.; Ikematsu, Y.; Ide, M.; Yoneshima, Y.; Iwama, E.; Inoue, H.; Ijichi, K.; et al. Association of Mps one binder kinase activator 1 (MOB1) expression with poor disease-free survival in individuals with non-small cell lung cancer. Thorac Cancer 2020, 11, 2830–2839. [Google Scholar] [CrossRef]
- Kato, W.; Nishio, M.; To, Y.; Togashi, H.; Mak, T. W.; Takada, H.; Ohga, S.; Maehama, T.; Suzuki, A. MOB1 regulates thymocyte egress and T-cell survival in mice in a YAP1-independent manner. Genes Cells 2019, 24, 485–495. [Google Scholar] [CrossRef]
- Han, H.; Huang, Z.; Xu, C.; Seo, G.; An, J.; Yang, B.; Liu, Y.; Lan, T.; Yan, J.; Ren, S.; et al. Functional annotation of the Hippo pathway somatic mutations in human cancers. Nature Communications 2024, 15, 10106. [Google Scholar] [CrossRef]
- Cunningham, R.; Hansen, Carsten G. The Hippo pathway in cancer: YAP/TAZ and TEAD as therapeutic targets in cancer. Clinical Science 2022, 136, 197–222. [Google Scholar] [CrossRef]
- Wu, Y.; Li, M.; Lin, J.; Hu, C. Hippo/TEAD4 signaling pathway as a potential target for the treatment of breast cancer. Oncol Lett 2021, 21, 313. [Google Scholar] [CrossRef]
- Chi, M.; Liu, J.; Mei, C.; Shi, Y.; Liu, N.; Jiang, X.; Liu, C.; Xue, N.; Hong, H.; Xie, J.; et al. TEAD4 functions as a prognostic biomarker and triggers EMT via PI3K/AKT pathway in bladder cancer. J Exp Clin Cancer Res 2022, 41, 175. [Google Scholar] [CrossRef]
- Huang, Z.; Yan, Y.; Tang, P.; Cai, J.; Cao, X.; Wang, Z.; Zhang, F.; Shen, B. TEAD4 as a Prognostic Marker Promotes Cell Migration and Invasion of Urinary Bladder Cancer via EMT. Onco Targets Ther 2021, 14, 937–949. [Google Scholar] [CrossRef] [PubMed]
- Park, M. A.; Lee, Y. H.; Gu, M. J. High TEAD4 Expression is Associated With Aggressive Clear Cell Renal Cell Carcinoma, Regardless of YAP1 Expression. Appl Immunohistochem Mol Morphol 2023, 31, 649–656. [Google Scholar] [CrossRef] [PubMed]
- Gong, X.; Li, N.; Sun, C.; Li, Z.; Xie, H. A Four-Gene Prognostic Signature Based on the TEAD4 Differential Expression Predicts Overall Survival and Immune Microenvironment Estimation in Lung Adenocarcinoma. Frontiers in Pharmacology 2022, 13. Original Research. [Google Scholar] [CrossRef]
- Xu, A.; Wang, X.; Zeng, Y.; Zhou, M.; Yi, R.; Wu, Z.; Lin, J.; Song, Y. Overexpression of TEAD4 correlates with poor prognosis of glioma and promotes cell invasion. Int J Clin Exp Pathol 2018, 11, 4827–4835. [Google Scholar]
- Oka, T.; Mazack, V.; Sudol, M. Mst2 and Lats Kinases Regulate Apoptotic Function of Yes Kinase-associated Protein (YAP)*. Journal of Biological Chemistry 2008, 283, 27534–27546. [Google Scholar] [CrossRef]
- Wang, Y.; Xu, X.; Maglic, D.; Dill, M. T.; Mojumdar, K.; Ng, P. K.; Jeong, K. J.; Tsang, Y. H.; Moreno, D.; Bhavana, V. H.; et al. Comprehensive Molecular Characterization of the Hippo Signaling Pathway in Cancer. Cell Rep 2018, 25, 1304–1317.e1305. [Google Scholar] [CrossRef]
- Brooks, H. L.; de Castro Brás, L. E.; Brunt, K. R.; Sylvester, M. A.; Parvatiyar, M. S.; Sirish, P.; Bansal, S. S.; Sule, R.; Eadie, A. L.; Knepper, M. A.; et al. Guidelines on antibody use in physiology research. Am J Physiol Renal Physiol 2024, 326, F511–f533. [Google Scholar] [CrossRef]
- Whyte, C. E.; Tumes, D. J.; Liston, A.; Burton, O. T. Do more with Less: Improving High Parameter Cytometry Through Overnight Staining. Curr Protoc 2022, 2, e589. [Google Scholar] [CrossRef]
- Cacioppo, R.; Akman, H. B.; Tuncer, T.; Erson-Bensan, A. E.; Lindon, C. Differential translation of mRNA isoforms underlies oncogenic activation of cell cycle kinase Aurora A. Elife 2023, 12. [Google Scholar] [CrossRef]
- Arora, R.; Cao, C.; Kumar, M.; Sinha, S.; Chanda, A.; McNeil, R.; Samuel, D.; Arora, R. K.; Matthews, T. W.; Chandarana, S.; et al. Spatial transcriptomics reveals distinct and conserved tumor core and edge architectures that predict survival and targeted therapy response. Nature Communications 2023, 14, 5029. [Google Scholar] [CrossRef]
- Jing, S.-y.; Wang, H.-q.; Lin, P.; Yuan, J.; Tang, Z.-x.; Li, H. Quantifying and interpreting biologically meaningful spatial signatures within tumor microenvironments. npj Precision Oncology 2025, 9, 68. [Google Scholar] [CrossRef] [PubMed]
- Borreguero-Muñoz, N.; Fletcher, G. C.; Aguilar-Aragon, M.; Elbediwy, A.; Vincent-Mistiaen, Z. I.; Thompson, B. J. The Hippo pathway integrates PI3K-Akt signals with mechanical and polarity cues to control tissue growth. PLoS Biol 2019, 17, e3000509. [Google Scholar] [CrossRef] [PubMed]
- Miyanaga, A.; Masuda, M.; Tsuta, K.; Kawasaki, K.; Nakamura, Y.; Sakuma, T.; Asamura, H.; Gemma, A.; Yamada, T. Hippo Pathway Gene Mutations in Malignant Mesothelioma: Revealed by RNA and Targeted Exon Sequencing. Journal of Thoracic Oncology 2015, 10, 844–851. [Google Scholar] [CrossRef]
- Tetreault, M.; Bareke, E.; Nadaf, J.; Alirezaie, N.; Majewski, J. Whole-exome sequencing as a diagnostic tool: Current challenges and future opportunities. Expert review of molecular diagnostics 2015, 15, 1–12. [Google Scholar] [CrossRef]
- Vashisht, V.; Vashisht, A.; Mondal, A. K.; Woodall, J.; Kolhe, R. From Genomic Exploration to Personalized Treatment: Next-Generation Sequencing in Oncology. Current Issues in Molecular Biology 2024, 46, 12527–12549. [Google Scholar] [CrossRef]
- Lao, Z.; Chen, X.; Pan, B.; Fang, B.; Yang, W.; Qian, Y. Pharmacological regulators of Hippo pathway: Advances and challenges of drug development. The FASEB Journal 2025, 39, e70438. [Google Scholar] [CrossRef]
- Elm, L.E. Deciphering Molecular Alterations of the Hippo Signaling Pathway in Thymic Epithelial Tumors Using Immunohistochemistry. Proceedings of the 3rd International Electronic Conference on Biomedicines (ECB 2025), Online, 12–15 May 2025; MDPI: Basel, Switzerland.
Figure 1.
Hippo Signaling Pathway. Created in BioRender. Elm, L. (2025); https://BioRender.com/3ebfg0o.
Figure 1.
Hippo Signaling Pathway. Created in BioRender. Elm, L. (2025); https://BioRender.com/3ebfg0o.
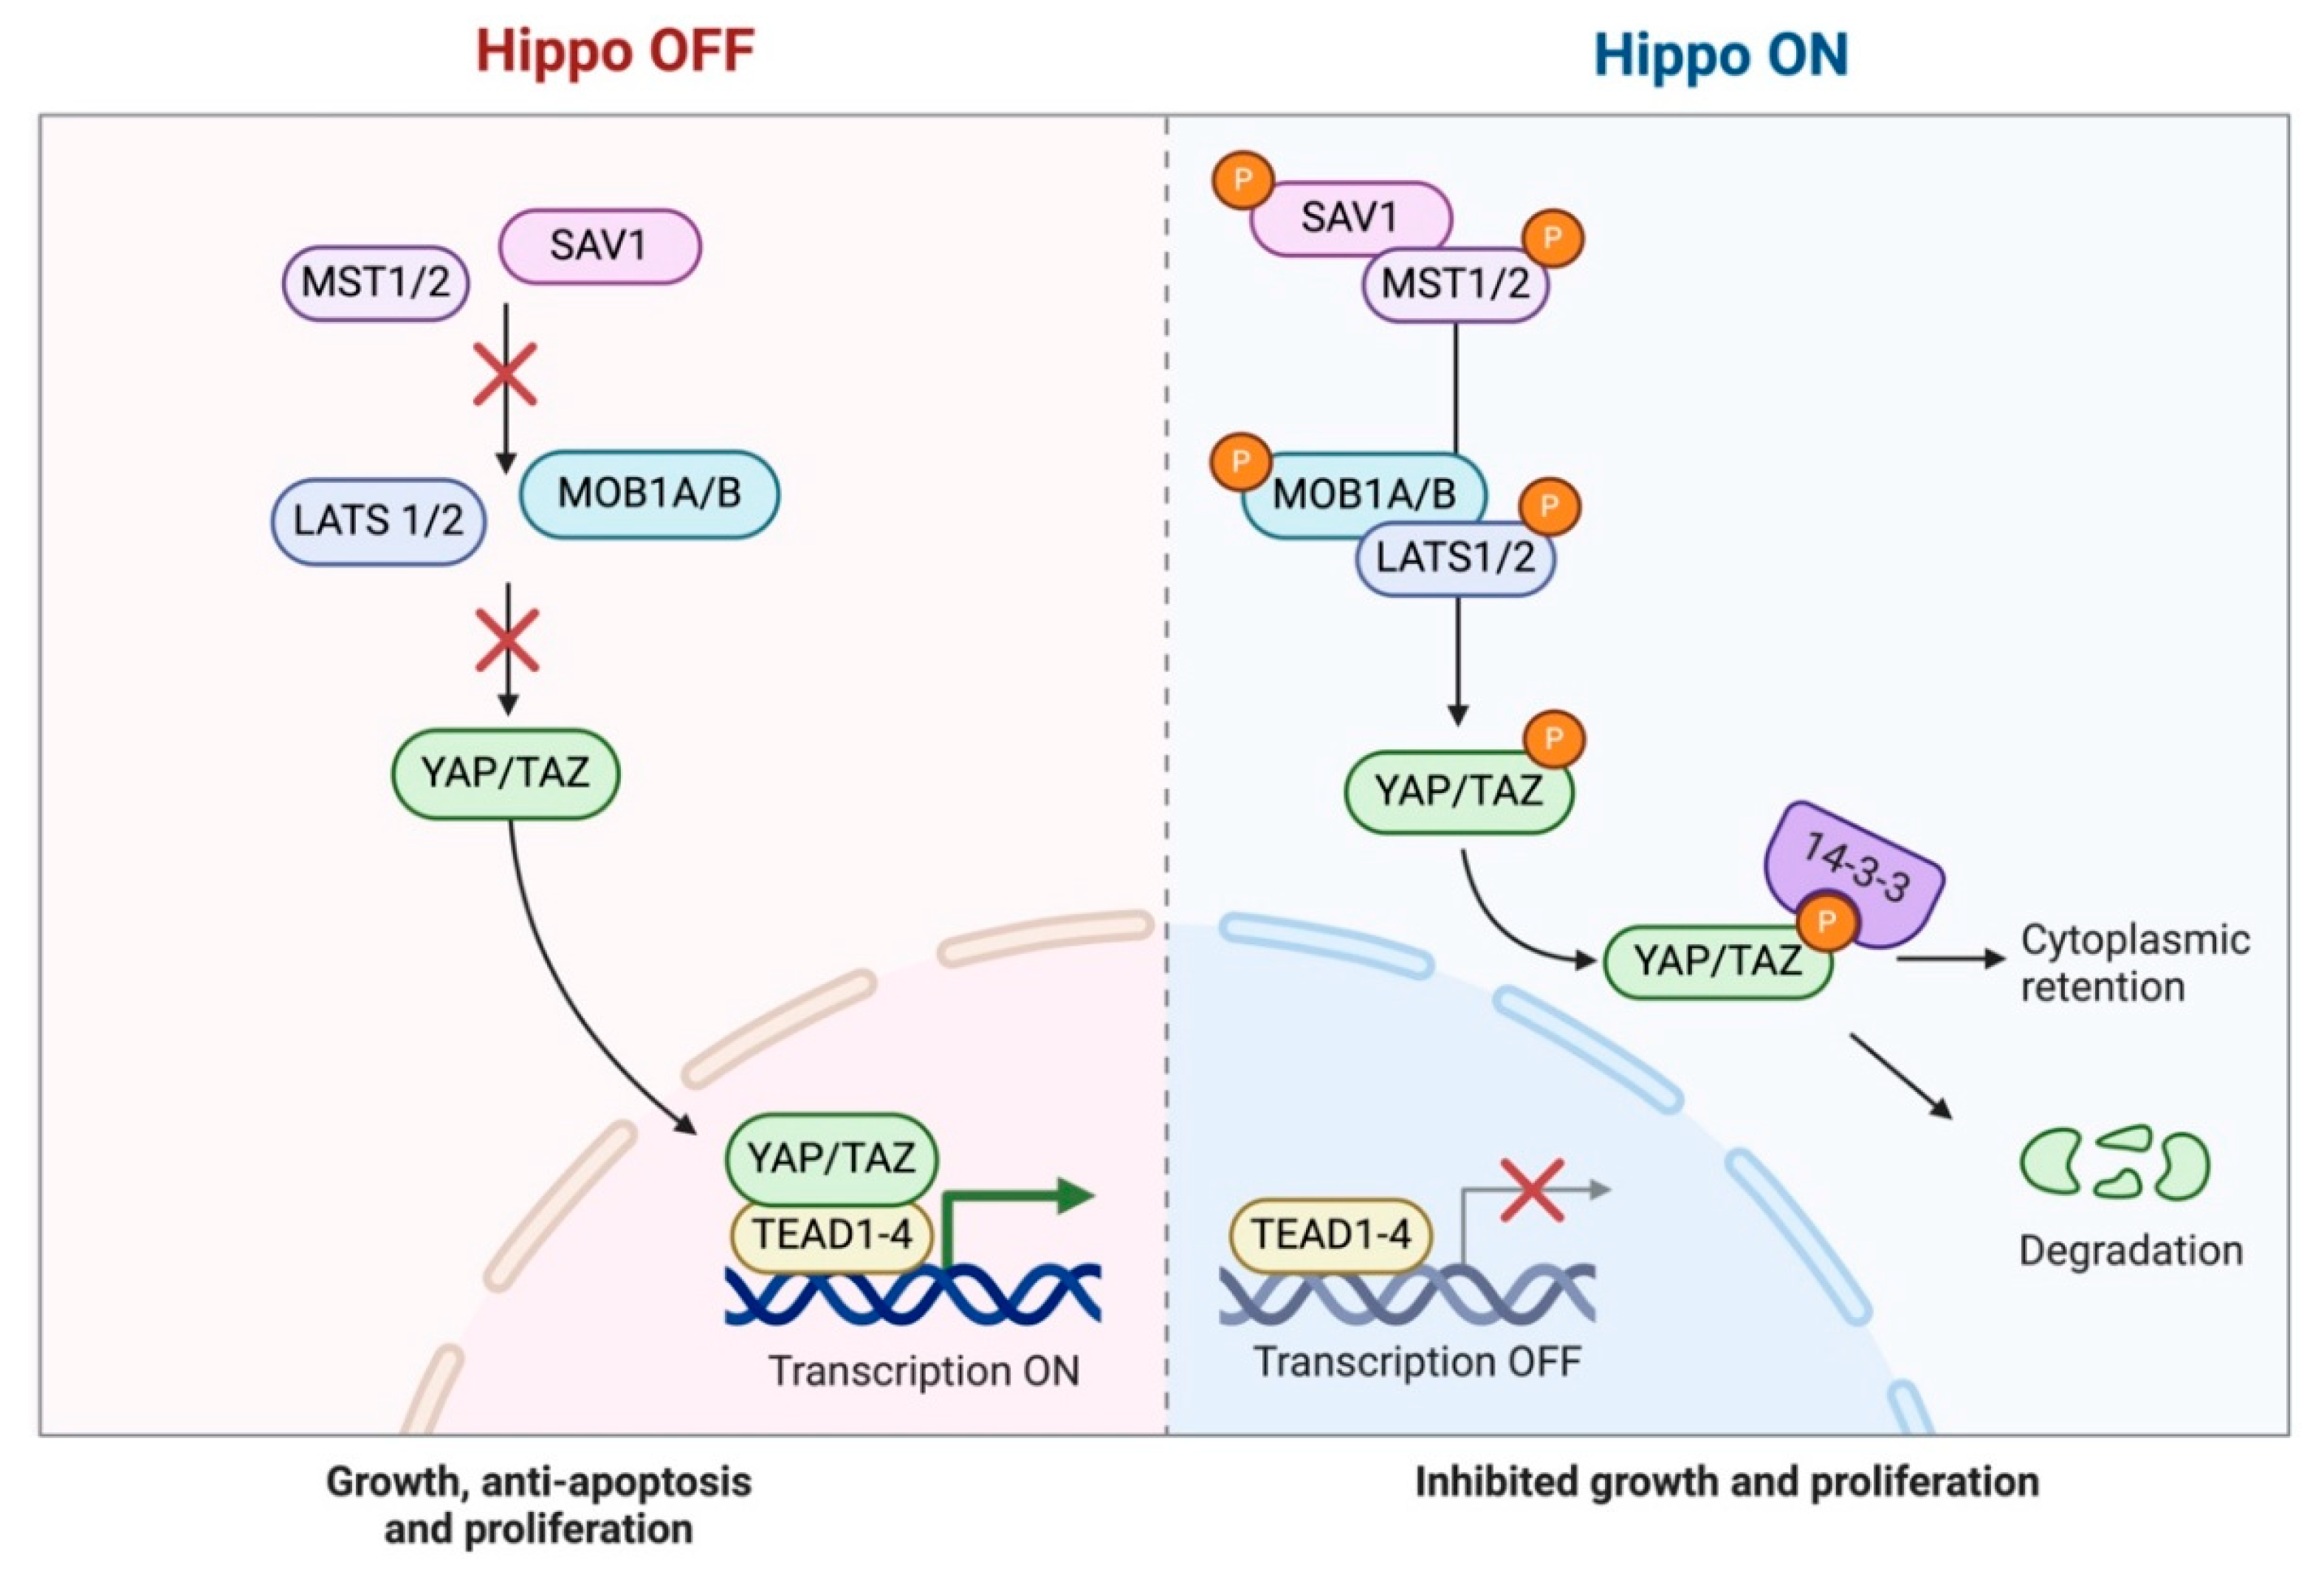
Figure 2.
Immunohistochemical expression of MST1 in TETs. (A) Normal thymic tissue (cytoplasmic; ×400); (B) Type A thymoma (cytoplasmic; ×400); (C) Thymic carcinoma (cytoplasmic; ×400); (D) Associations of MST1 expression with WHO histological type; (E) Associations of MST1 expression with Masaoka-Koga stage.
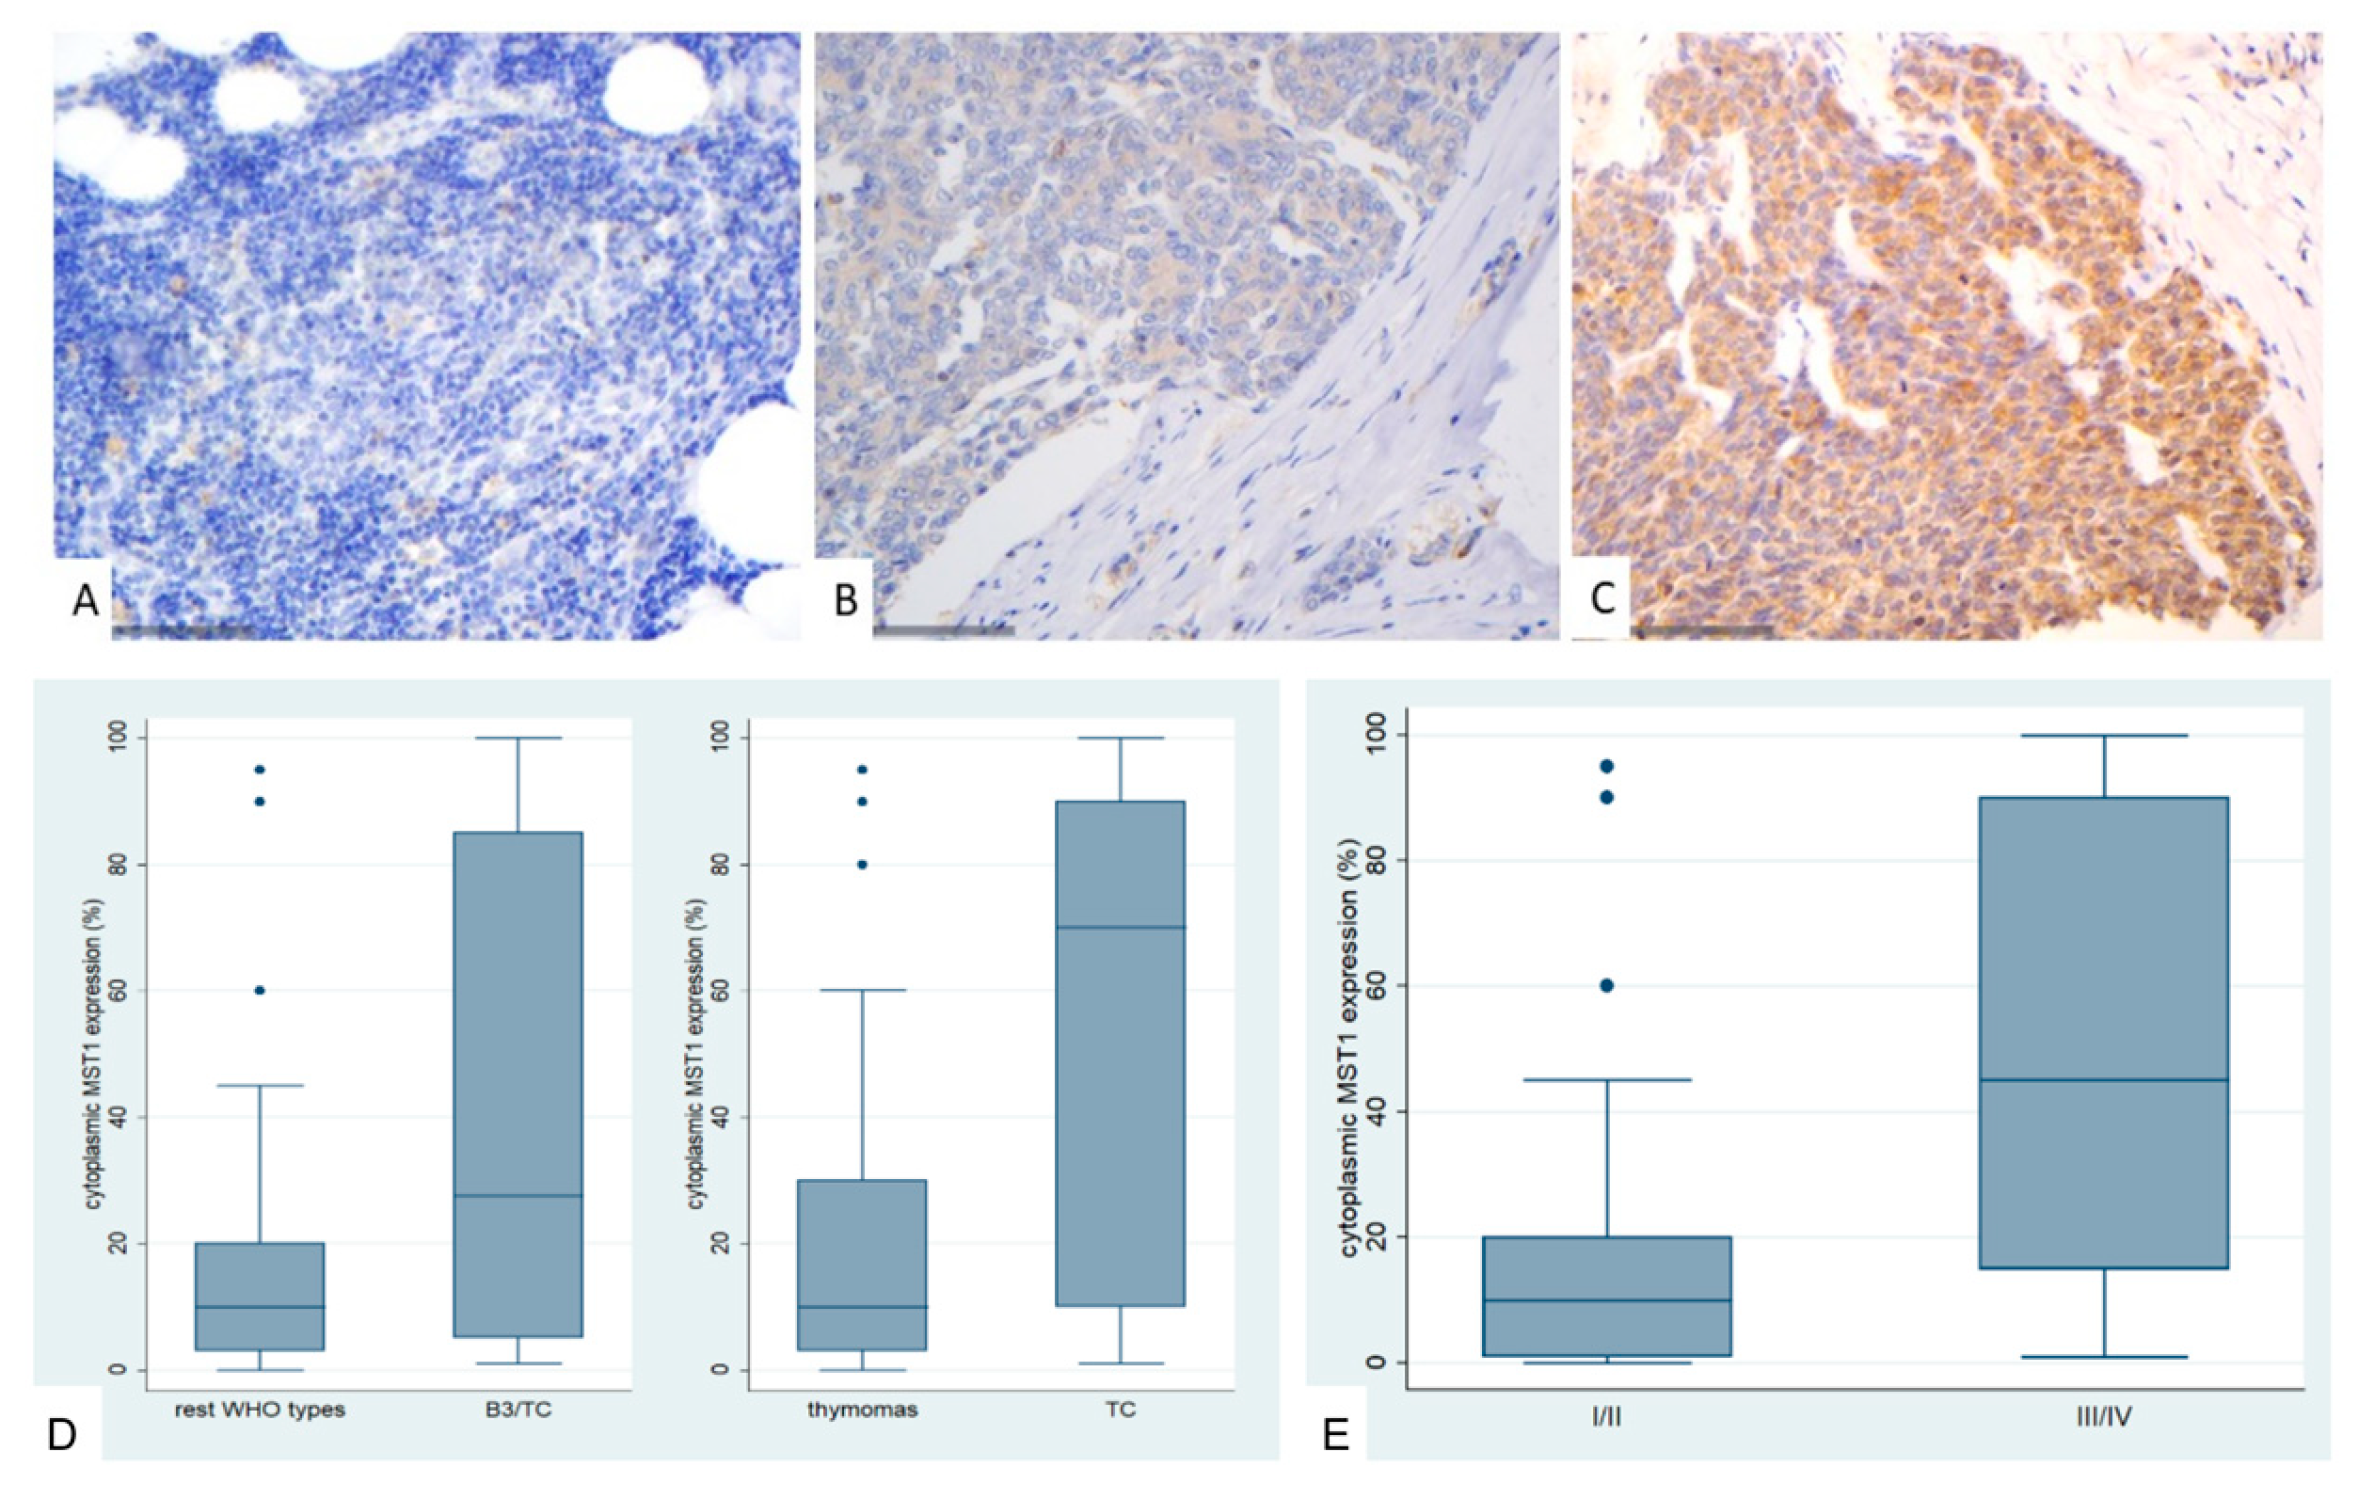
Figure 3.
Immunohistochemical expression of SAV1 in TETs. (A) Normal thymic tissue (cytoplasmic; ×400); (B) Type AB thymoma with negative endothelial cells serving as negative internal control (cytoplasmic; ×400); (C) Thymic carcinoma (cytoplasmic; ×400).
Figure 3.
Immunohistochemical expression of SAV1 in TETs. (A) Normal thymic tissue (cytoplasmic; ×400); (B) Type AB thymoma with negative endothelial cells serving as negative internal control (cytoplasmic; ×400); (C) Thymic carcinoma (cytoplasmic; ×400).
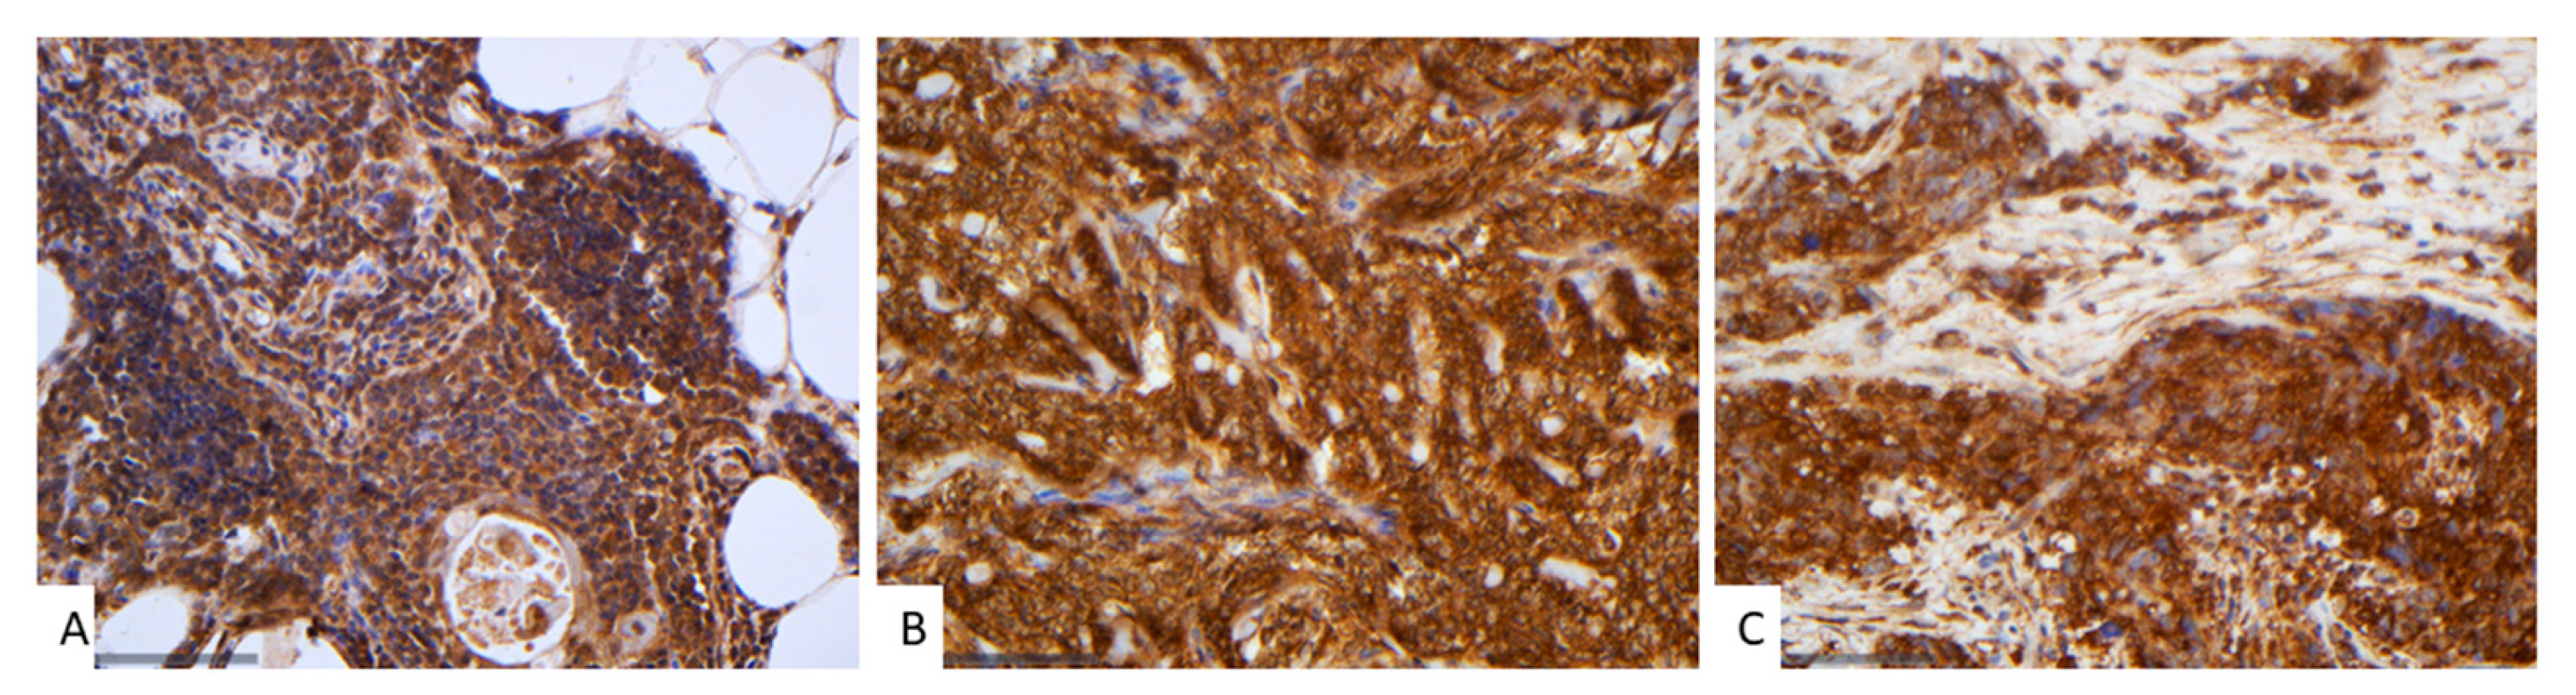
Figure 4.
Immunohistochemical expression of LATS1 in TETs. (A) Normal thymic tissue (cytoplasmic, nuclear; ×400); (B) Type AB thymoma (cytoplasmic; ×200); (C) Thymic carcinoma (cytoplasmic; ×200); (D) Associations of LATS1 expression with WHO histological type; (E) Associations of LATS1 expression with Masaoka-Koga stage.
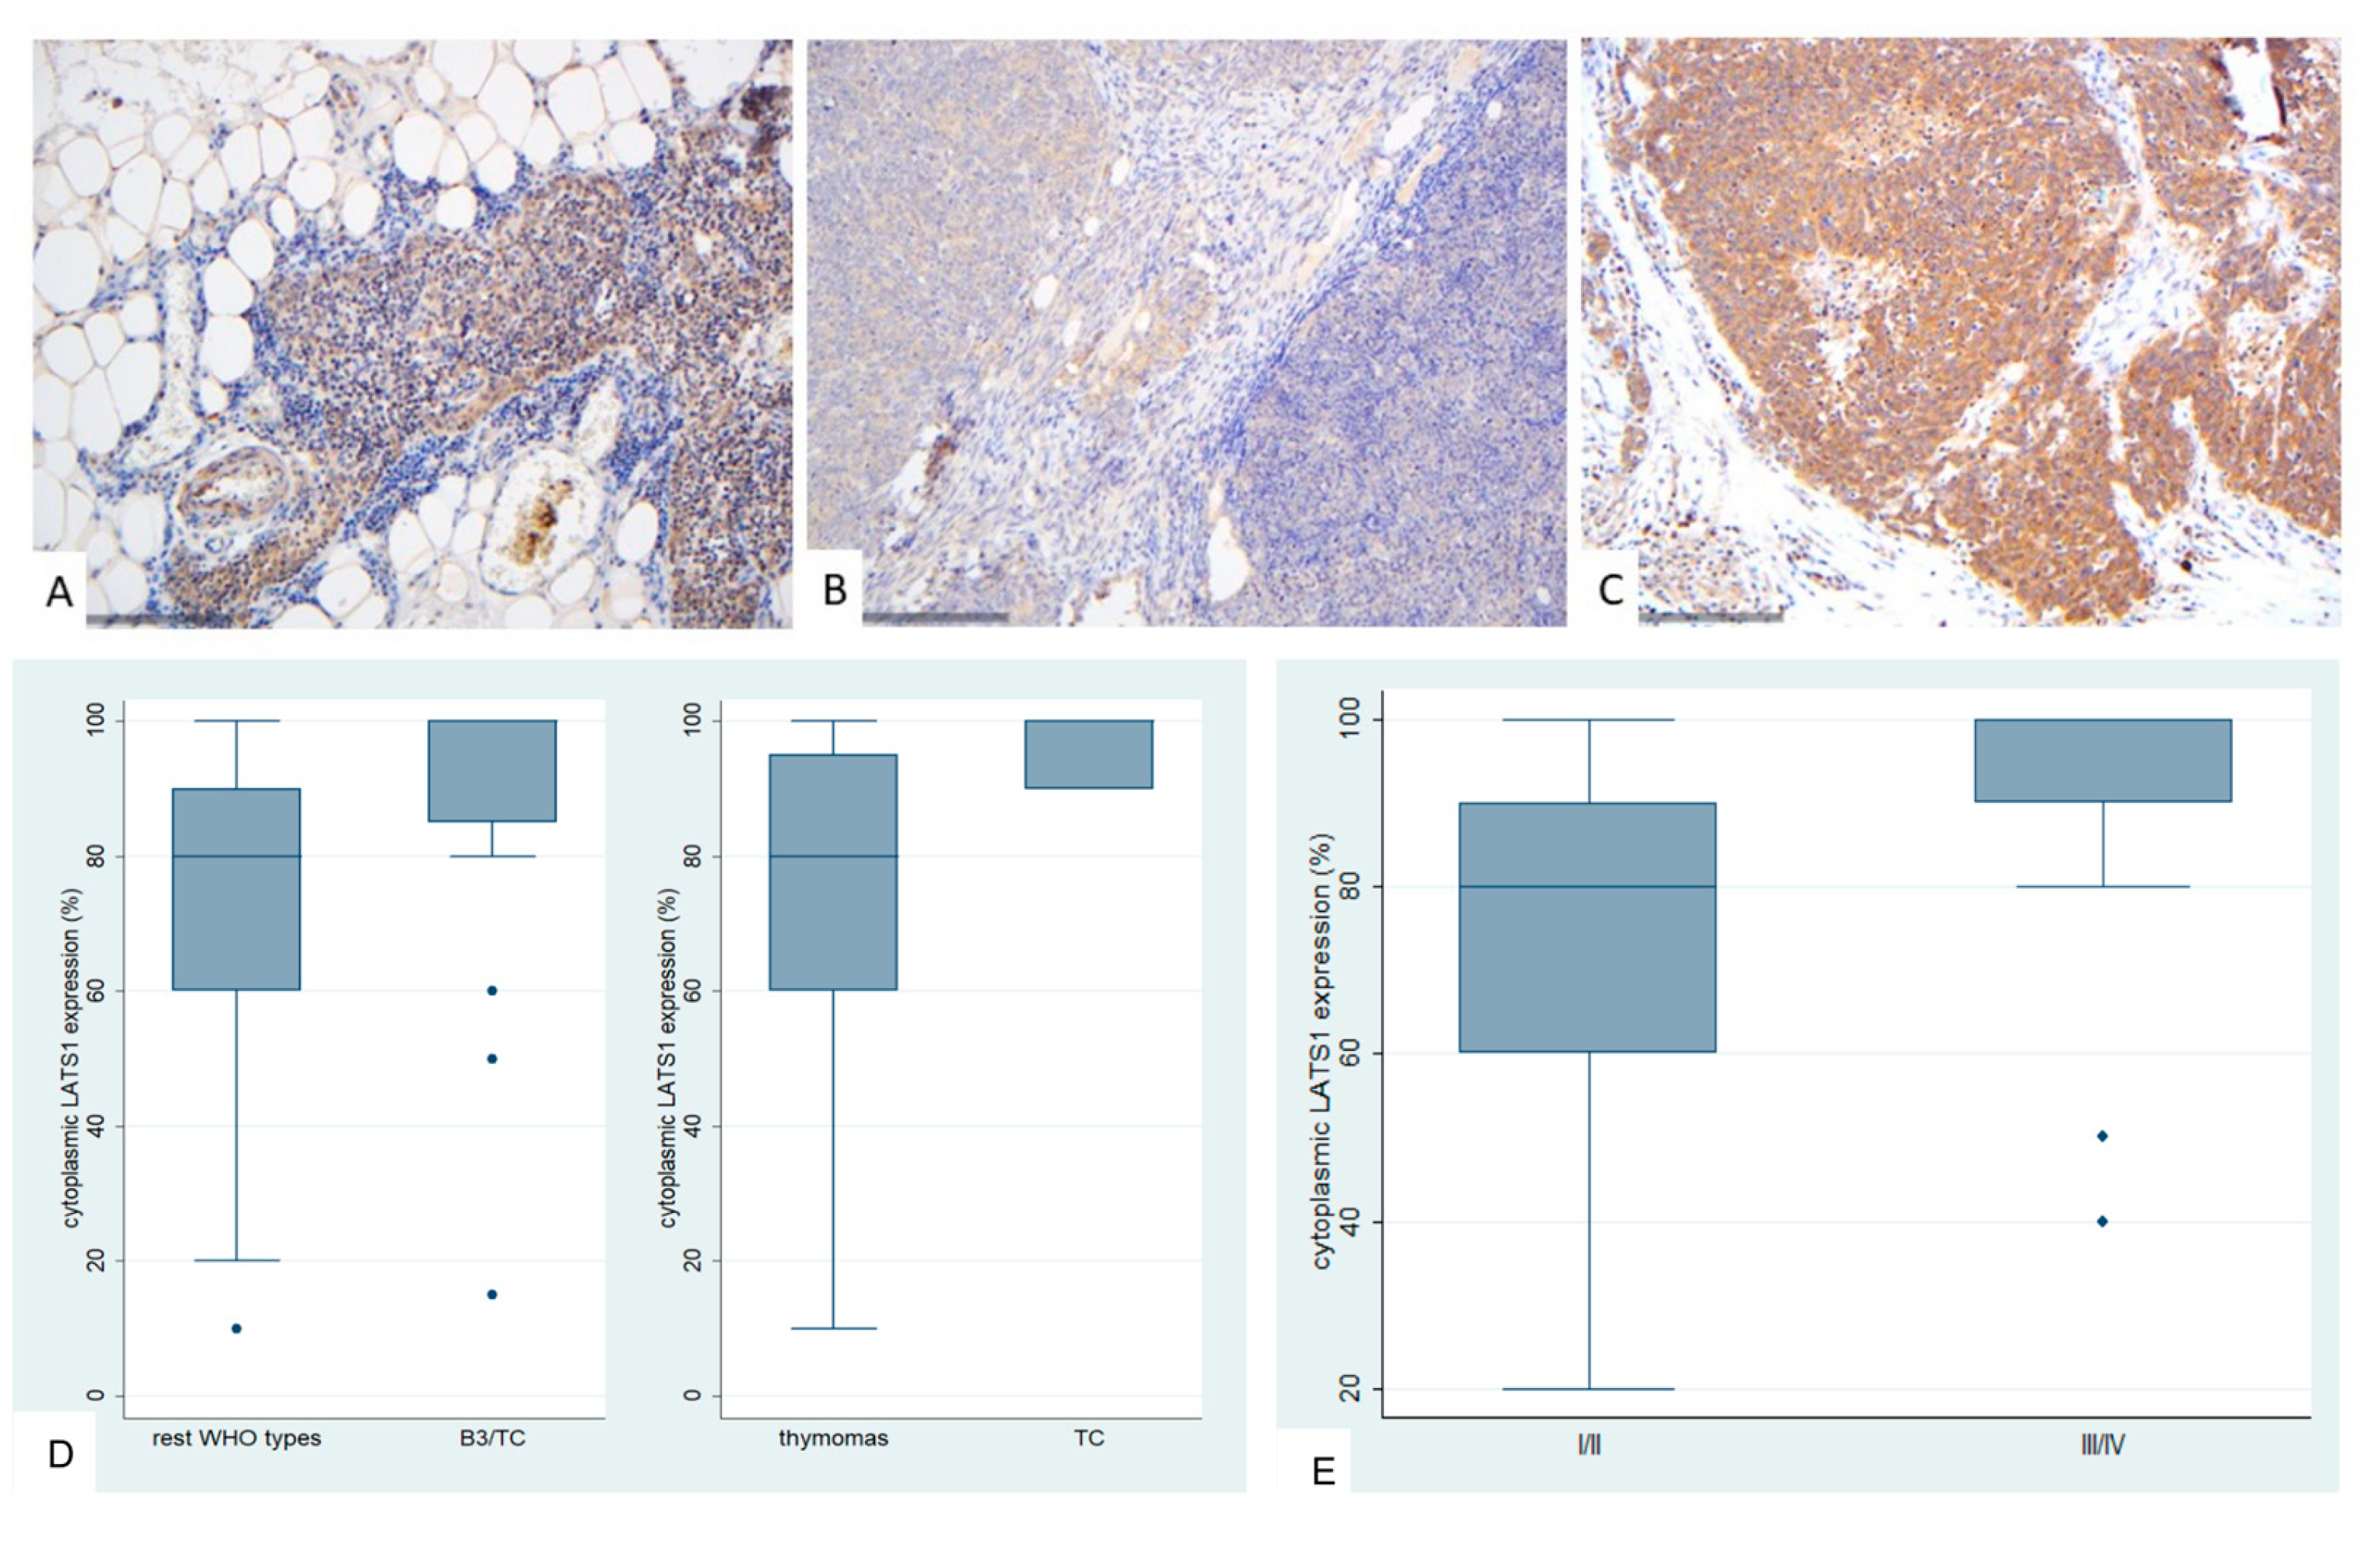
Figure 5.
Immunohistochemical expression of MOB1A in TETs. (A) Normal thymic tissue (cytoplasmic; ×400); (B) Type A thymoma (cytoplasmic; ×400); (C) Thymic carcinoma (cytoplasmic; ×400); (D) Associations of MOB1A expression with WHO histological type; (E) Associations of MOB1A expression with Masaoka-Koga stage.
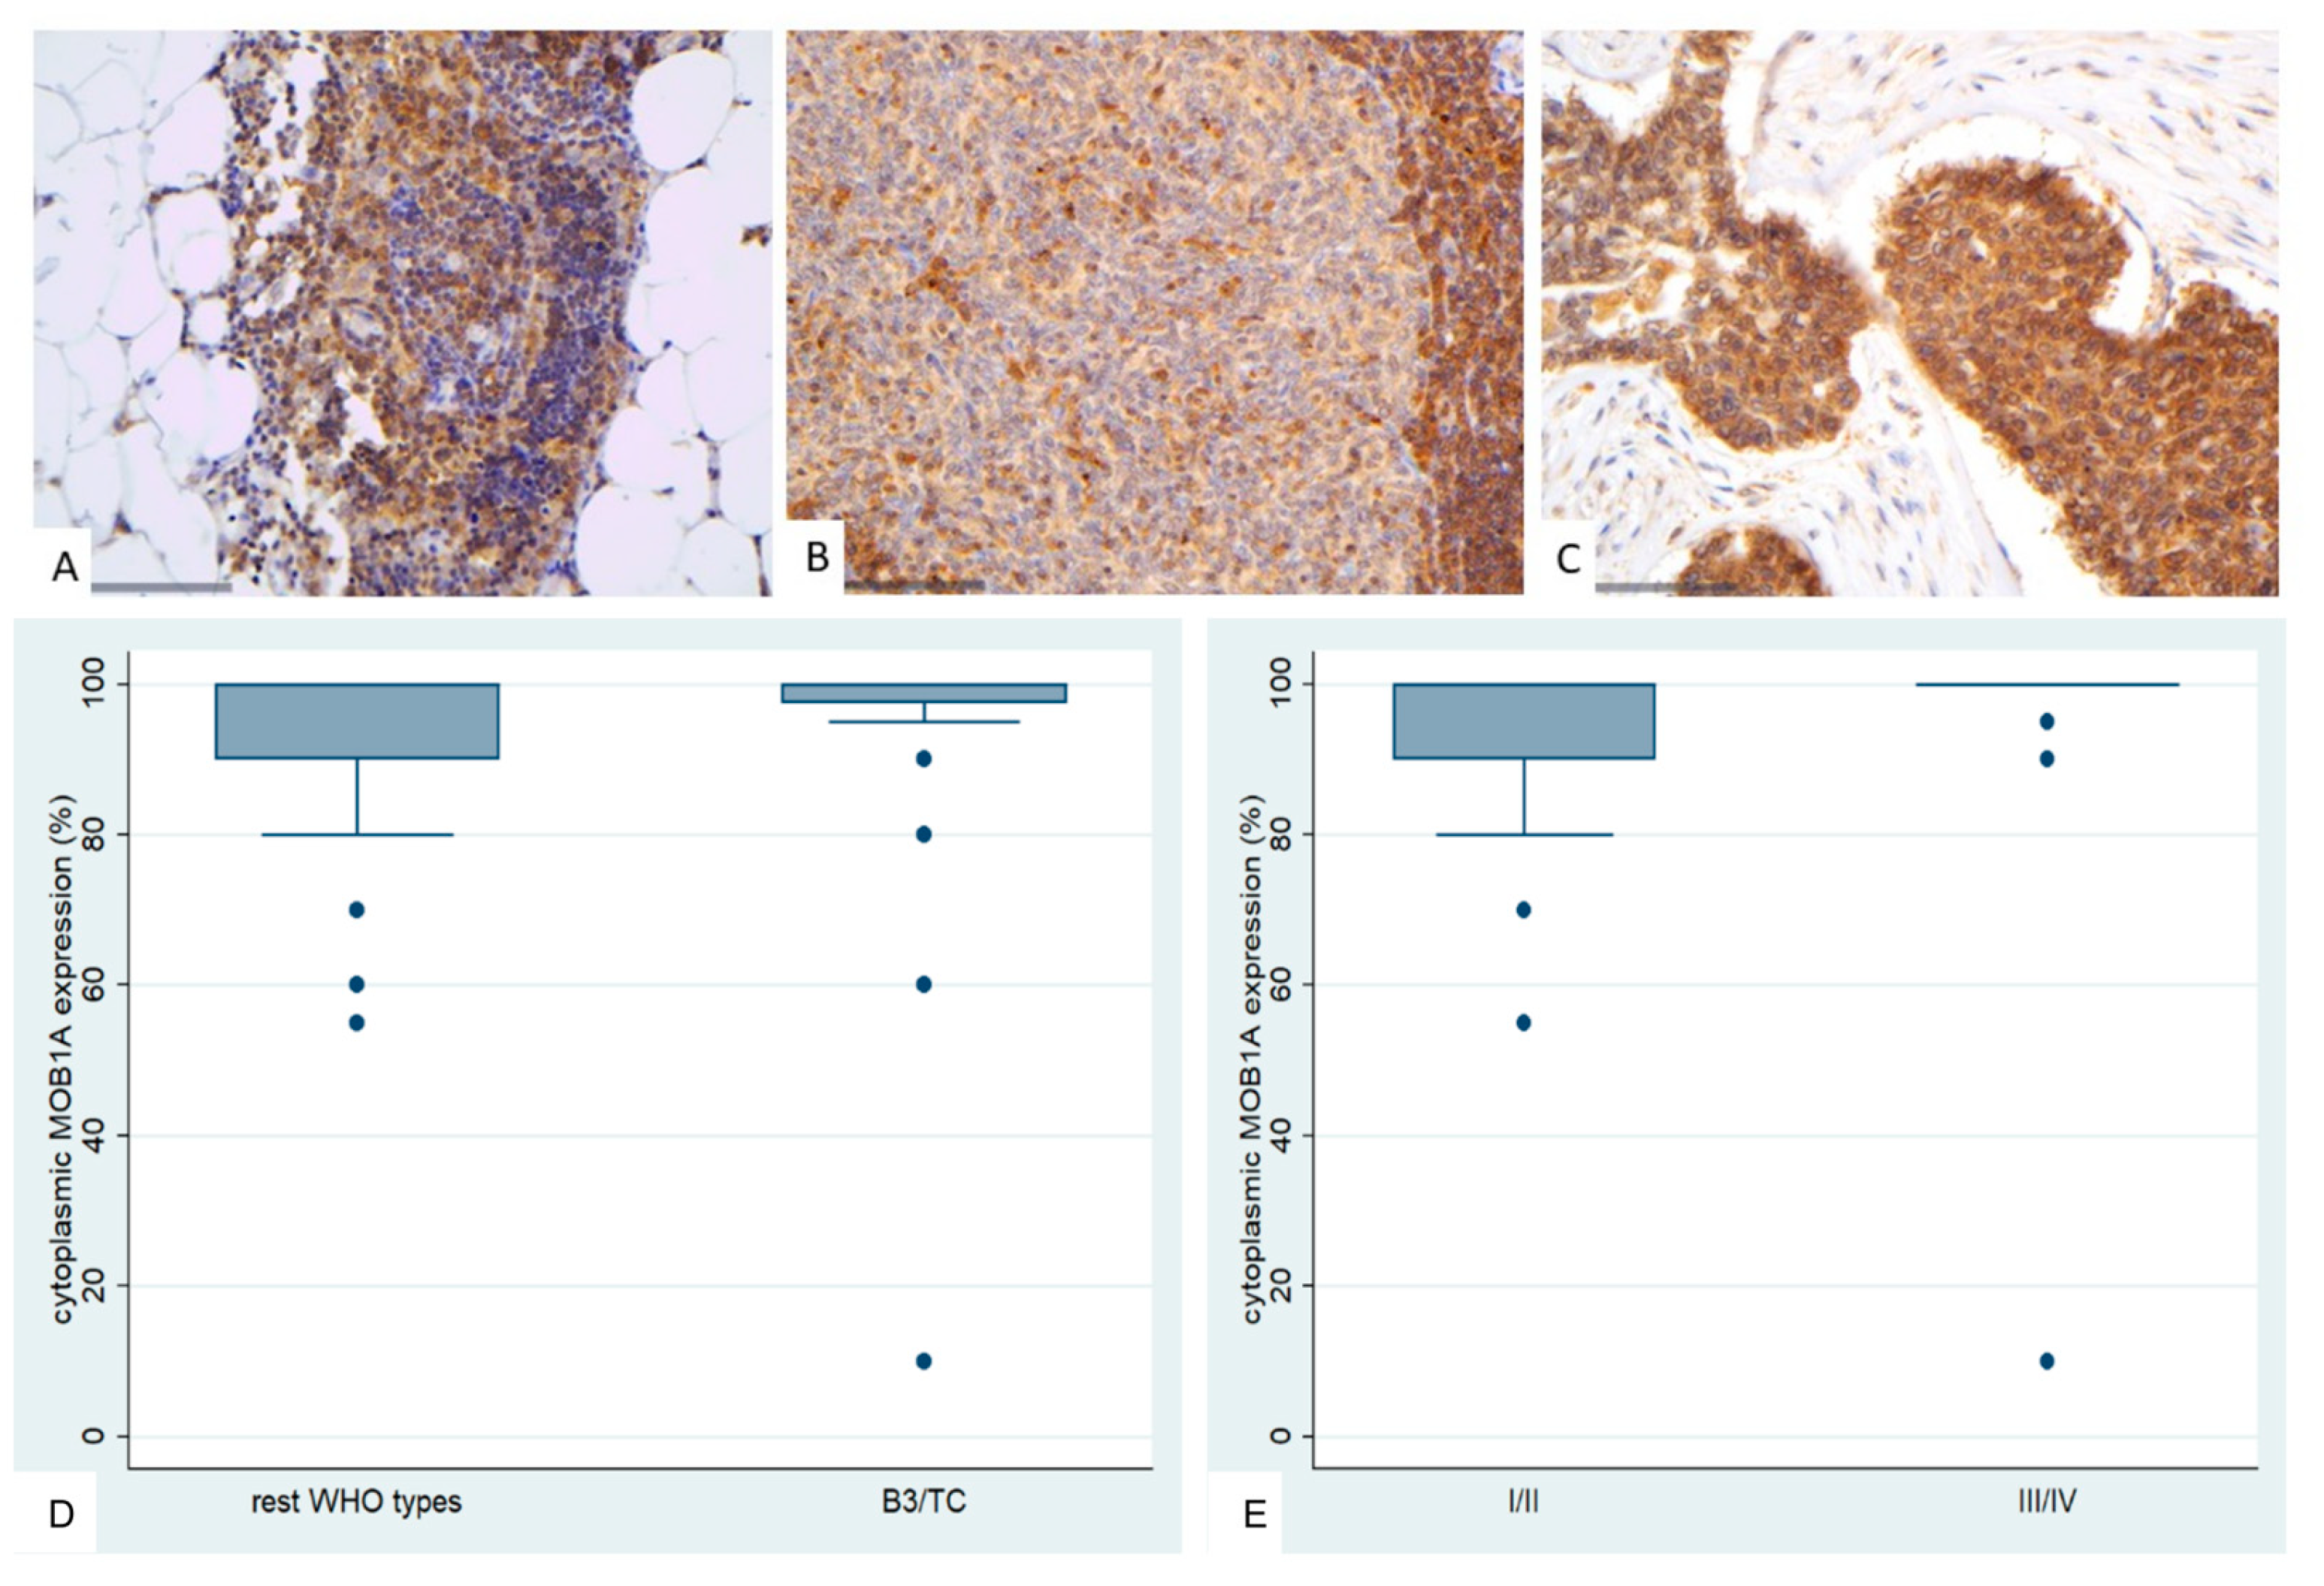
Figure 6.
Immunohistochemical expression of YAP1 in TETs. (A) Normal thymic tissue (cytoplasmic, nuclear; ×400); (B) Type B1 thymoma (cytoplasmic; ×400); (C) Thymic carcinoma (nuclear; ×400); (D) Associations of nuclear YAP1 with WHO histological type; (E) Associations of nuclear and cytoplasmic YAP1 with Masaoka-Koga stage.
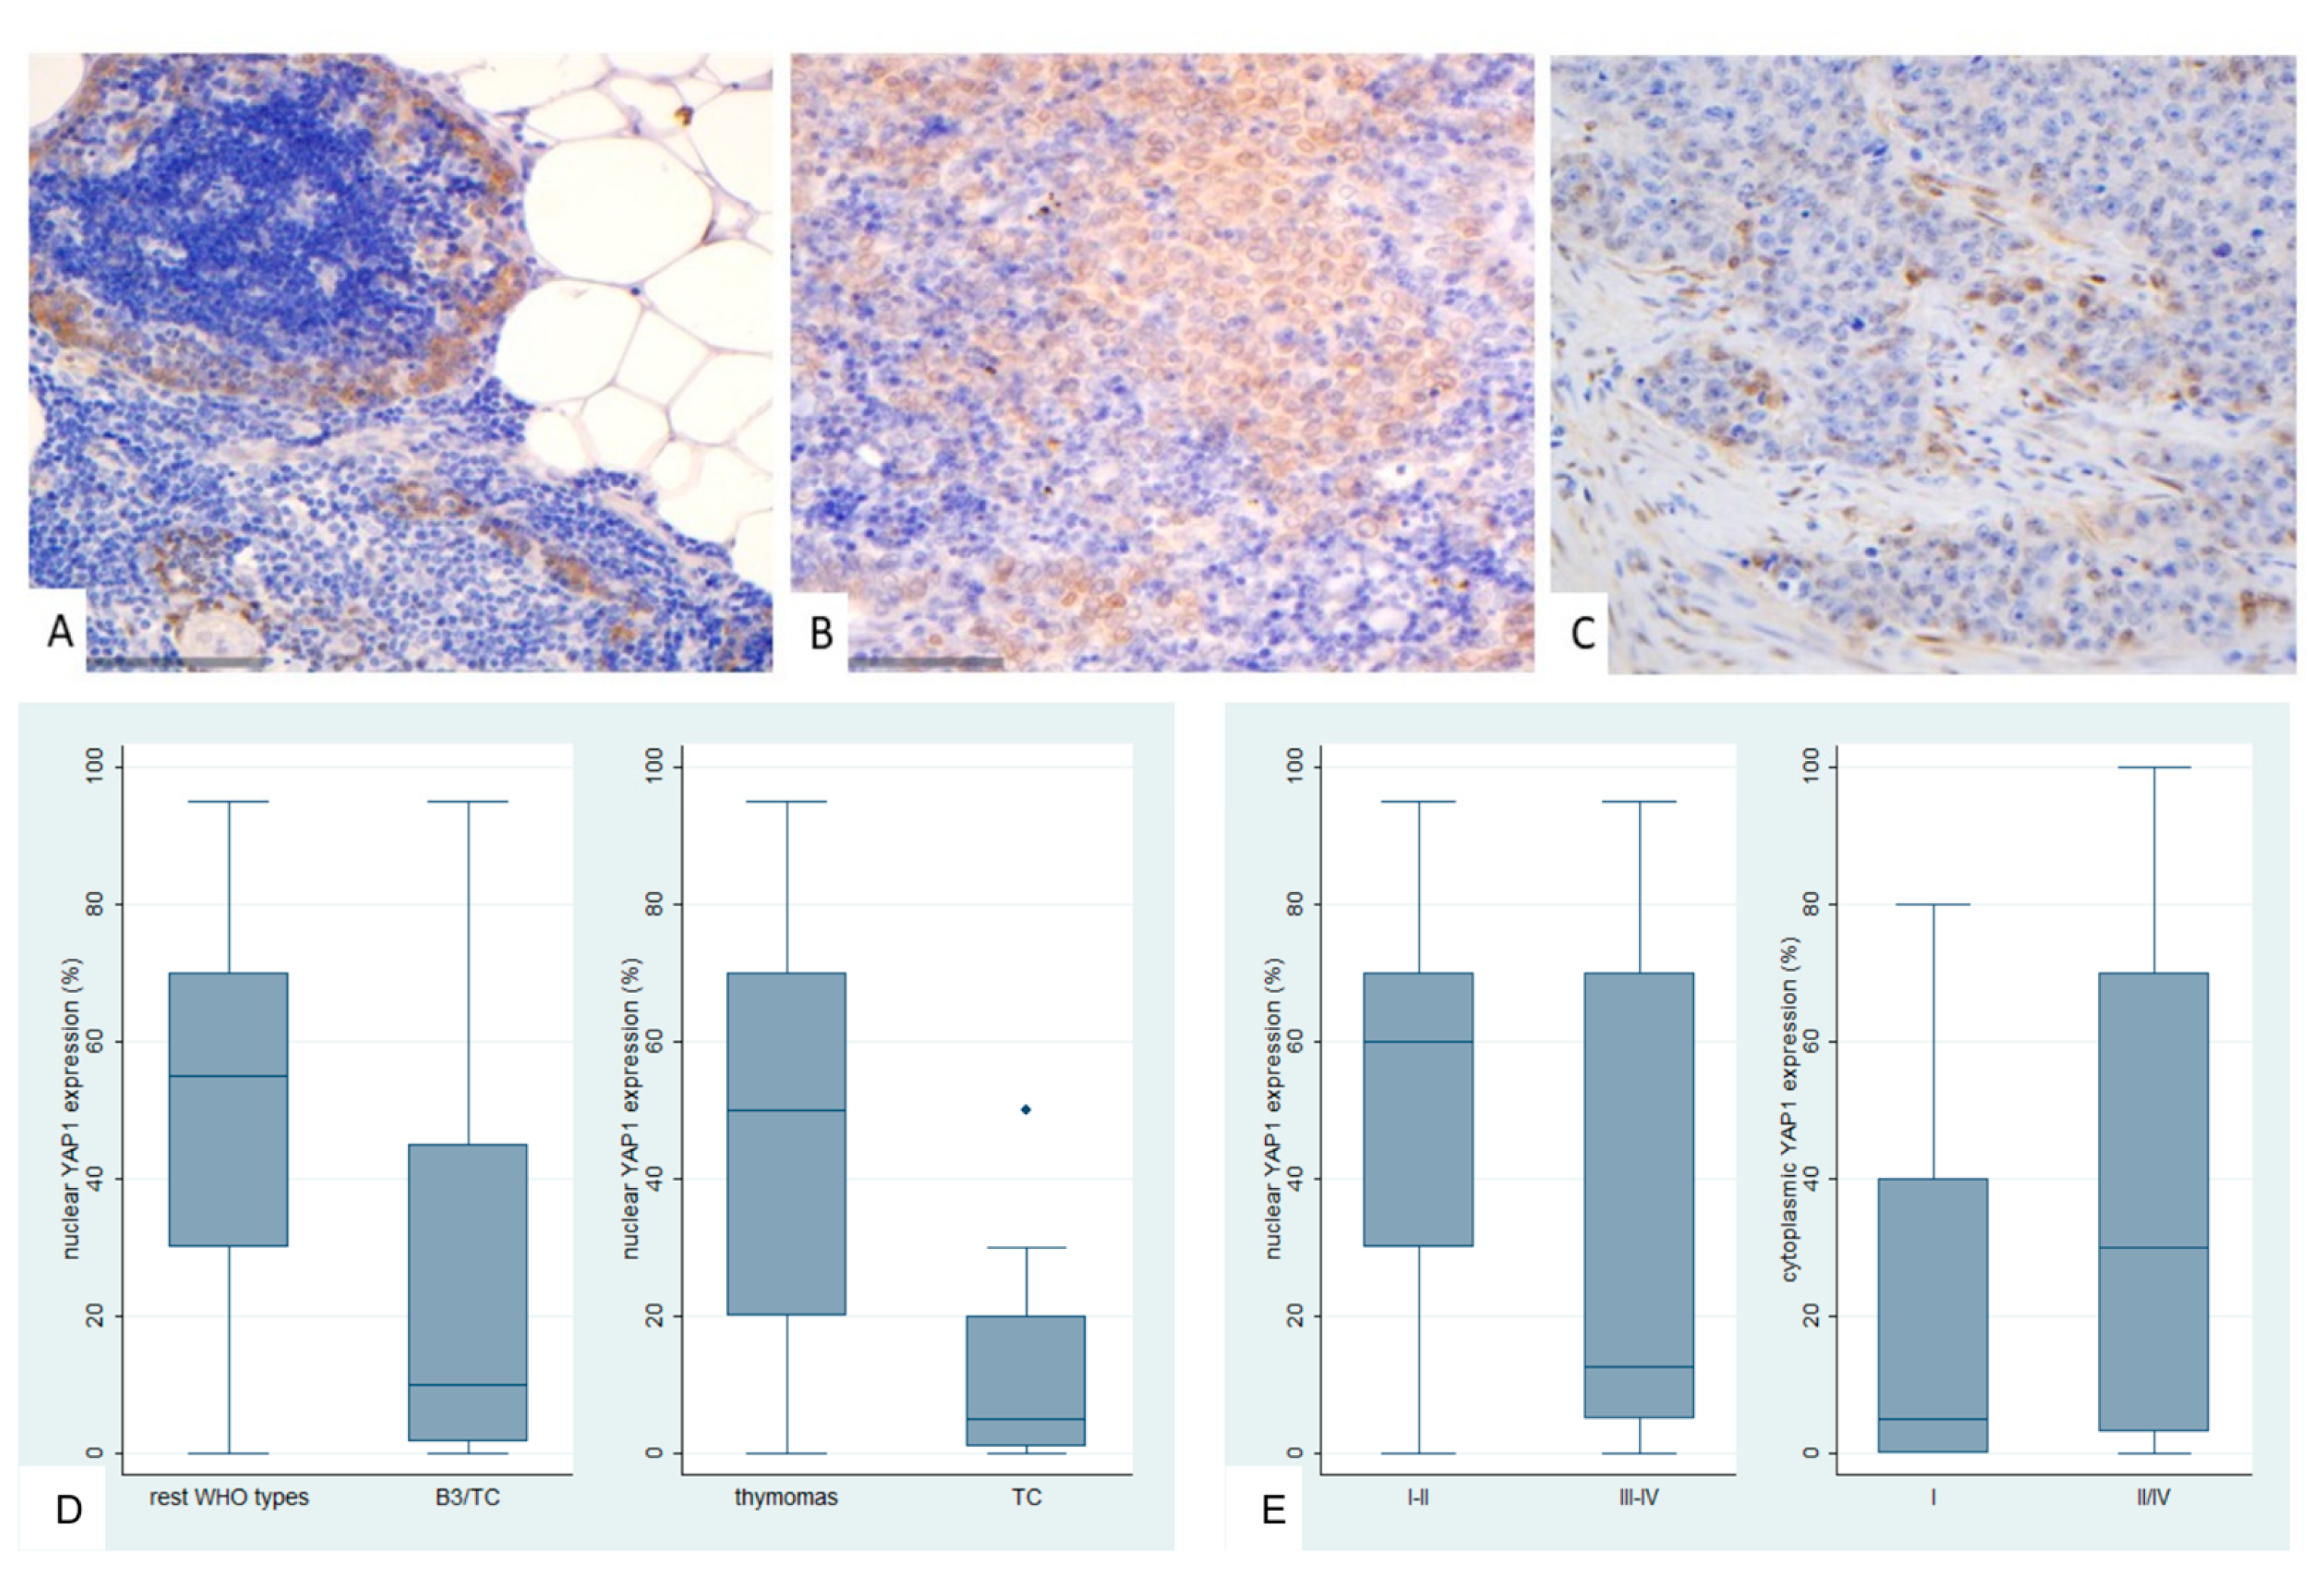
Figure 7.
Immunohistochemical expression of active YAP1 (AYAP) in TETs. (A) Type B2 thymoma next to normal thymic tissue (nuclear, cytoplasmic; ×200); (B) Type A thymoma (nuclear, cytoplasmic; ×400); (C) Thymic carcinoma (nuclear; ×400); (D) Associations of nuclear AYAP expression with WHO histological type; (E) Associations of nuclear AYAP expression with Masaoka-Koga stage; (F) Associations of cytoplasmic AYAP expression with WHO histological type.
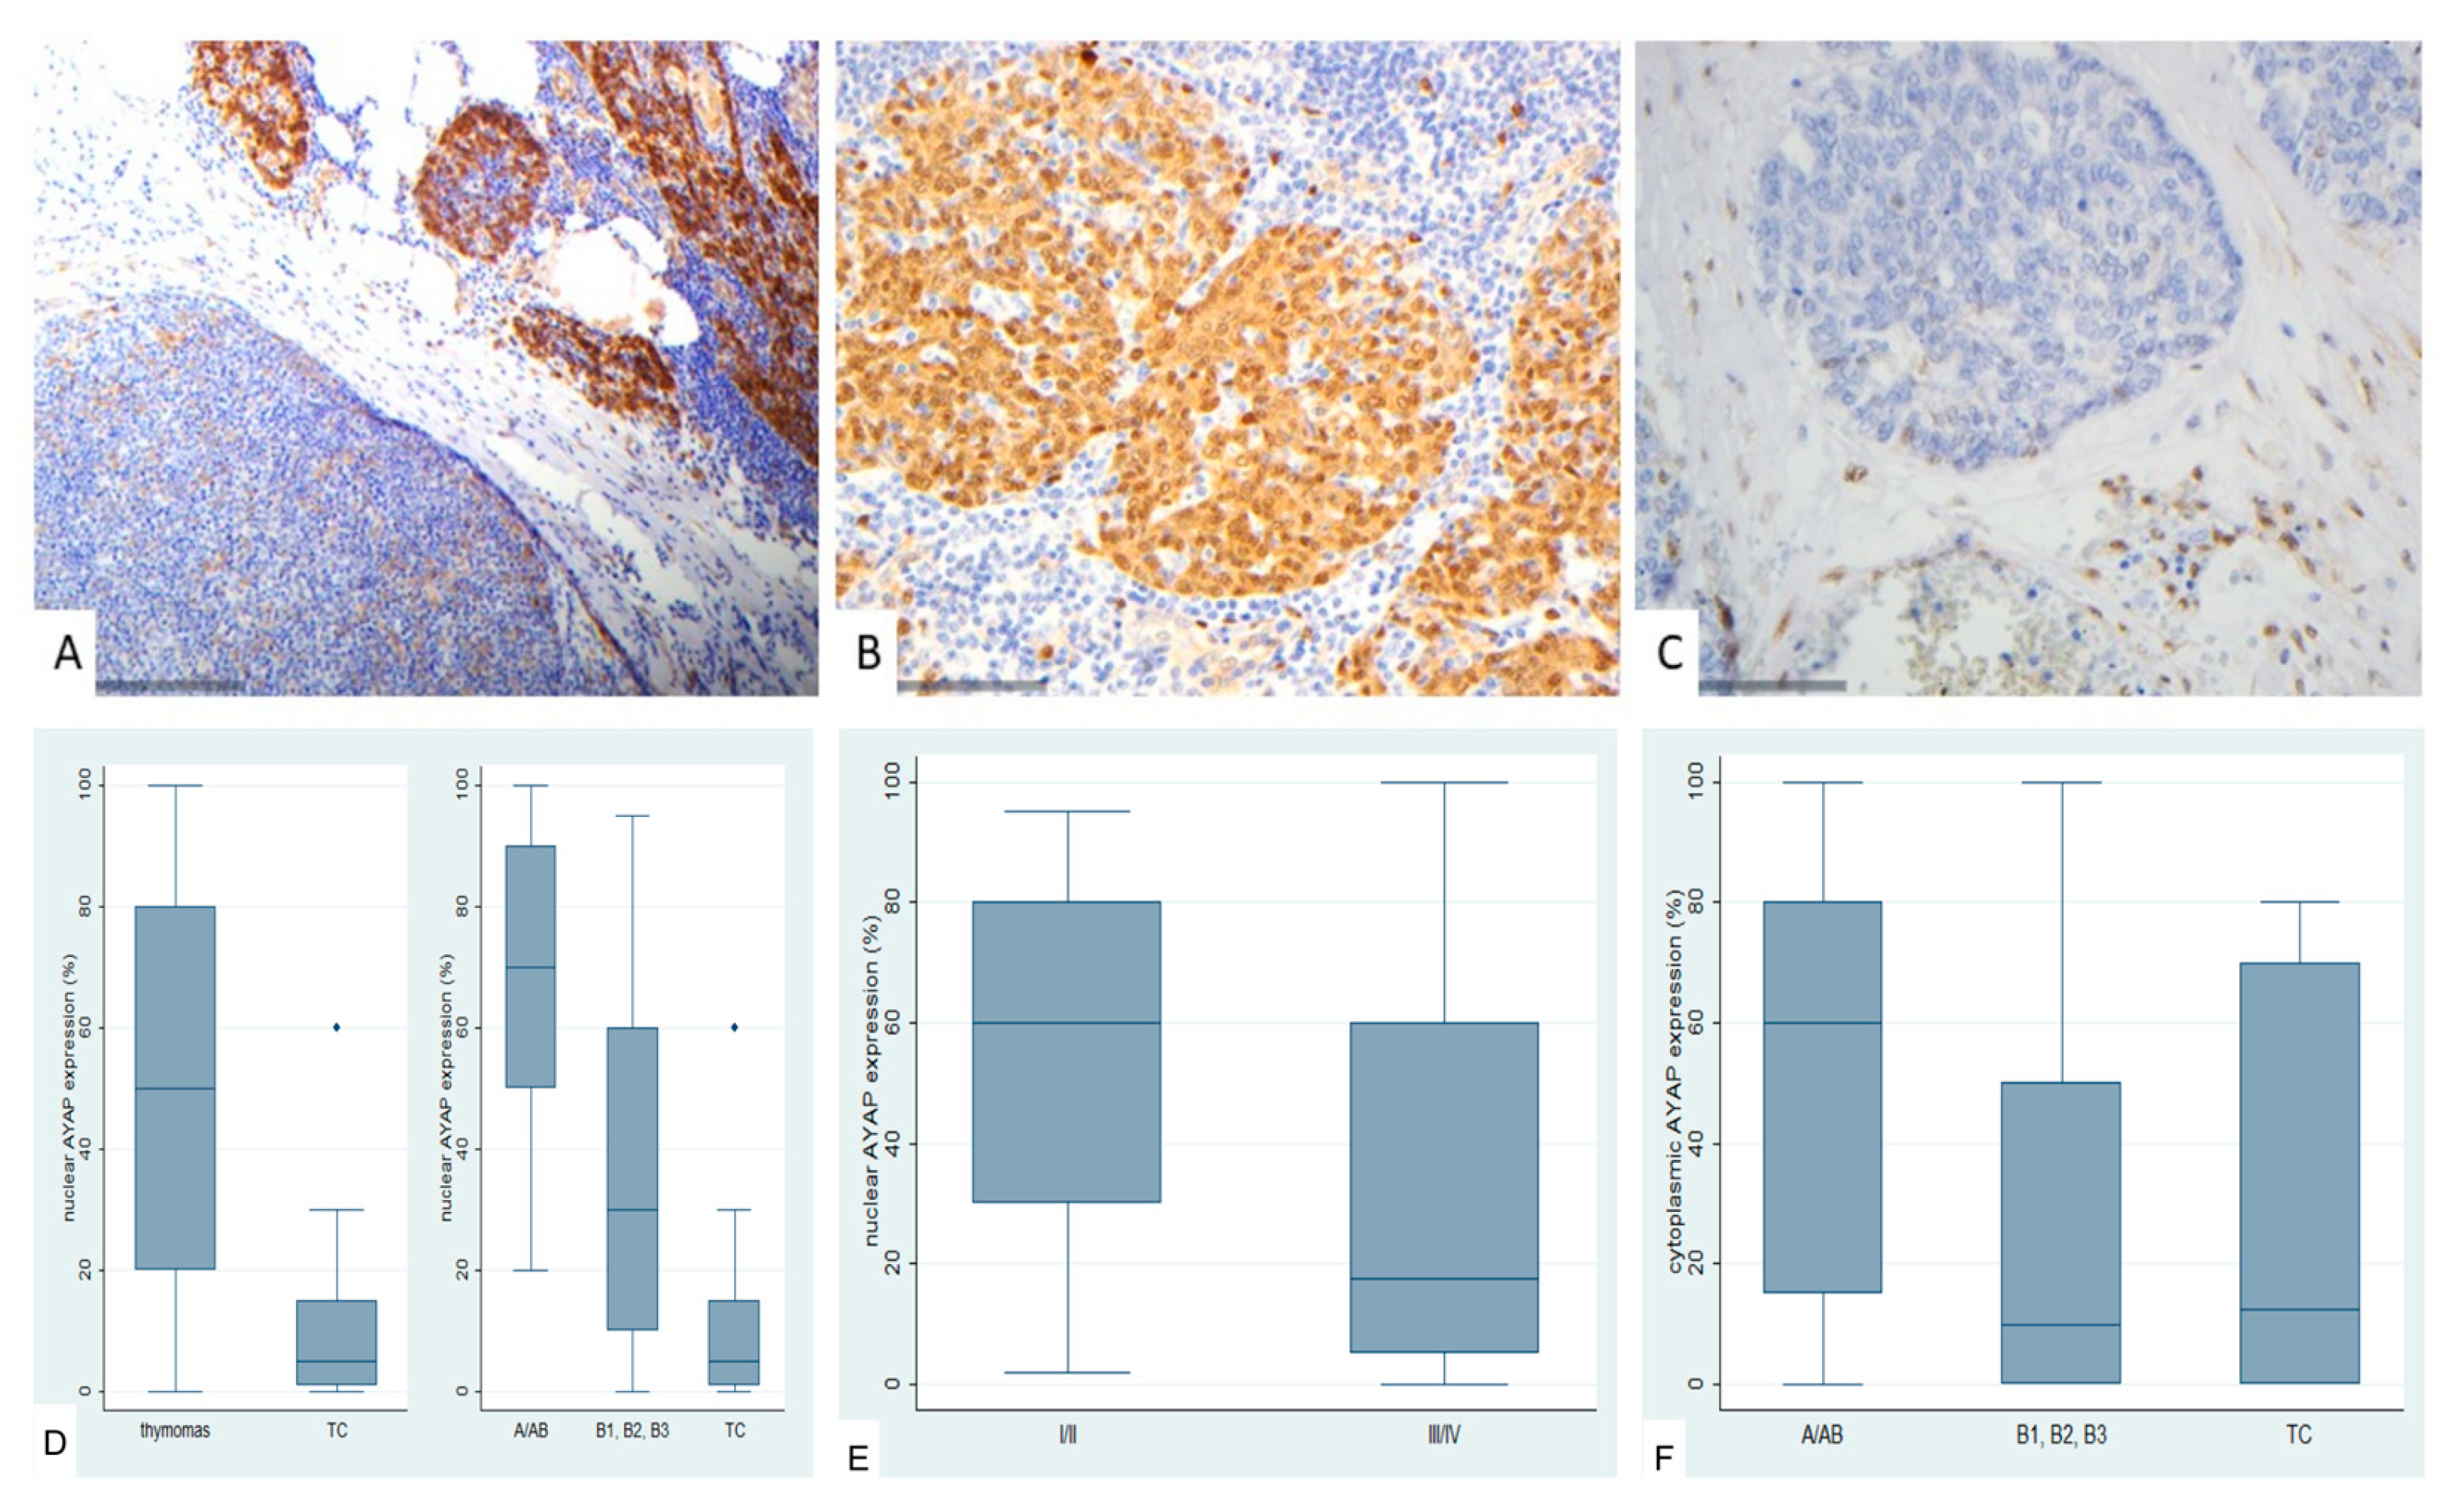
Figure 8.
Immunohistochemical expression of TAZ in TETs. (A) Normal thymic tissue (cytoplasmic, nuclear; ×400); (B) Type A thymoma (cytoplasmic, nuclear; ×400); (C) Type B2 thymoma (nuclear; ×400); D: Associations of nuclear and cytoplasmic TAZ expression with WHO histological type.
Figure 8.
Immunohistochemical expression of TAZ in TETs. (A) Normal thymic tissue (cytoplasmic, nuclear; ×400); (B) Type A thymoma (cytoplasmic, nuclear; ×400); (C) Type B2 thymoma (nuclear; ×400); D: Associations of nuclear and cytoplasmic TAZ expression with WHO histological type.
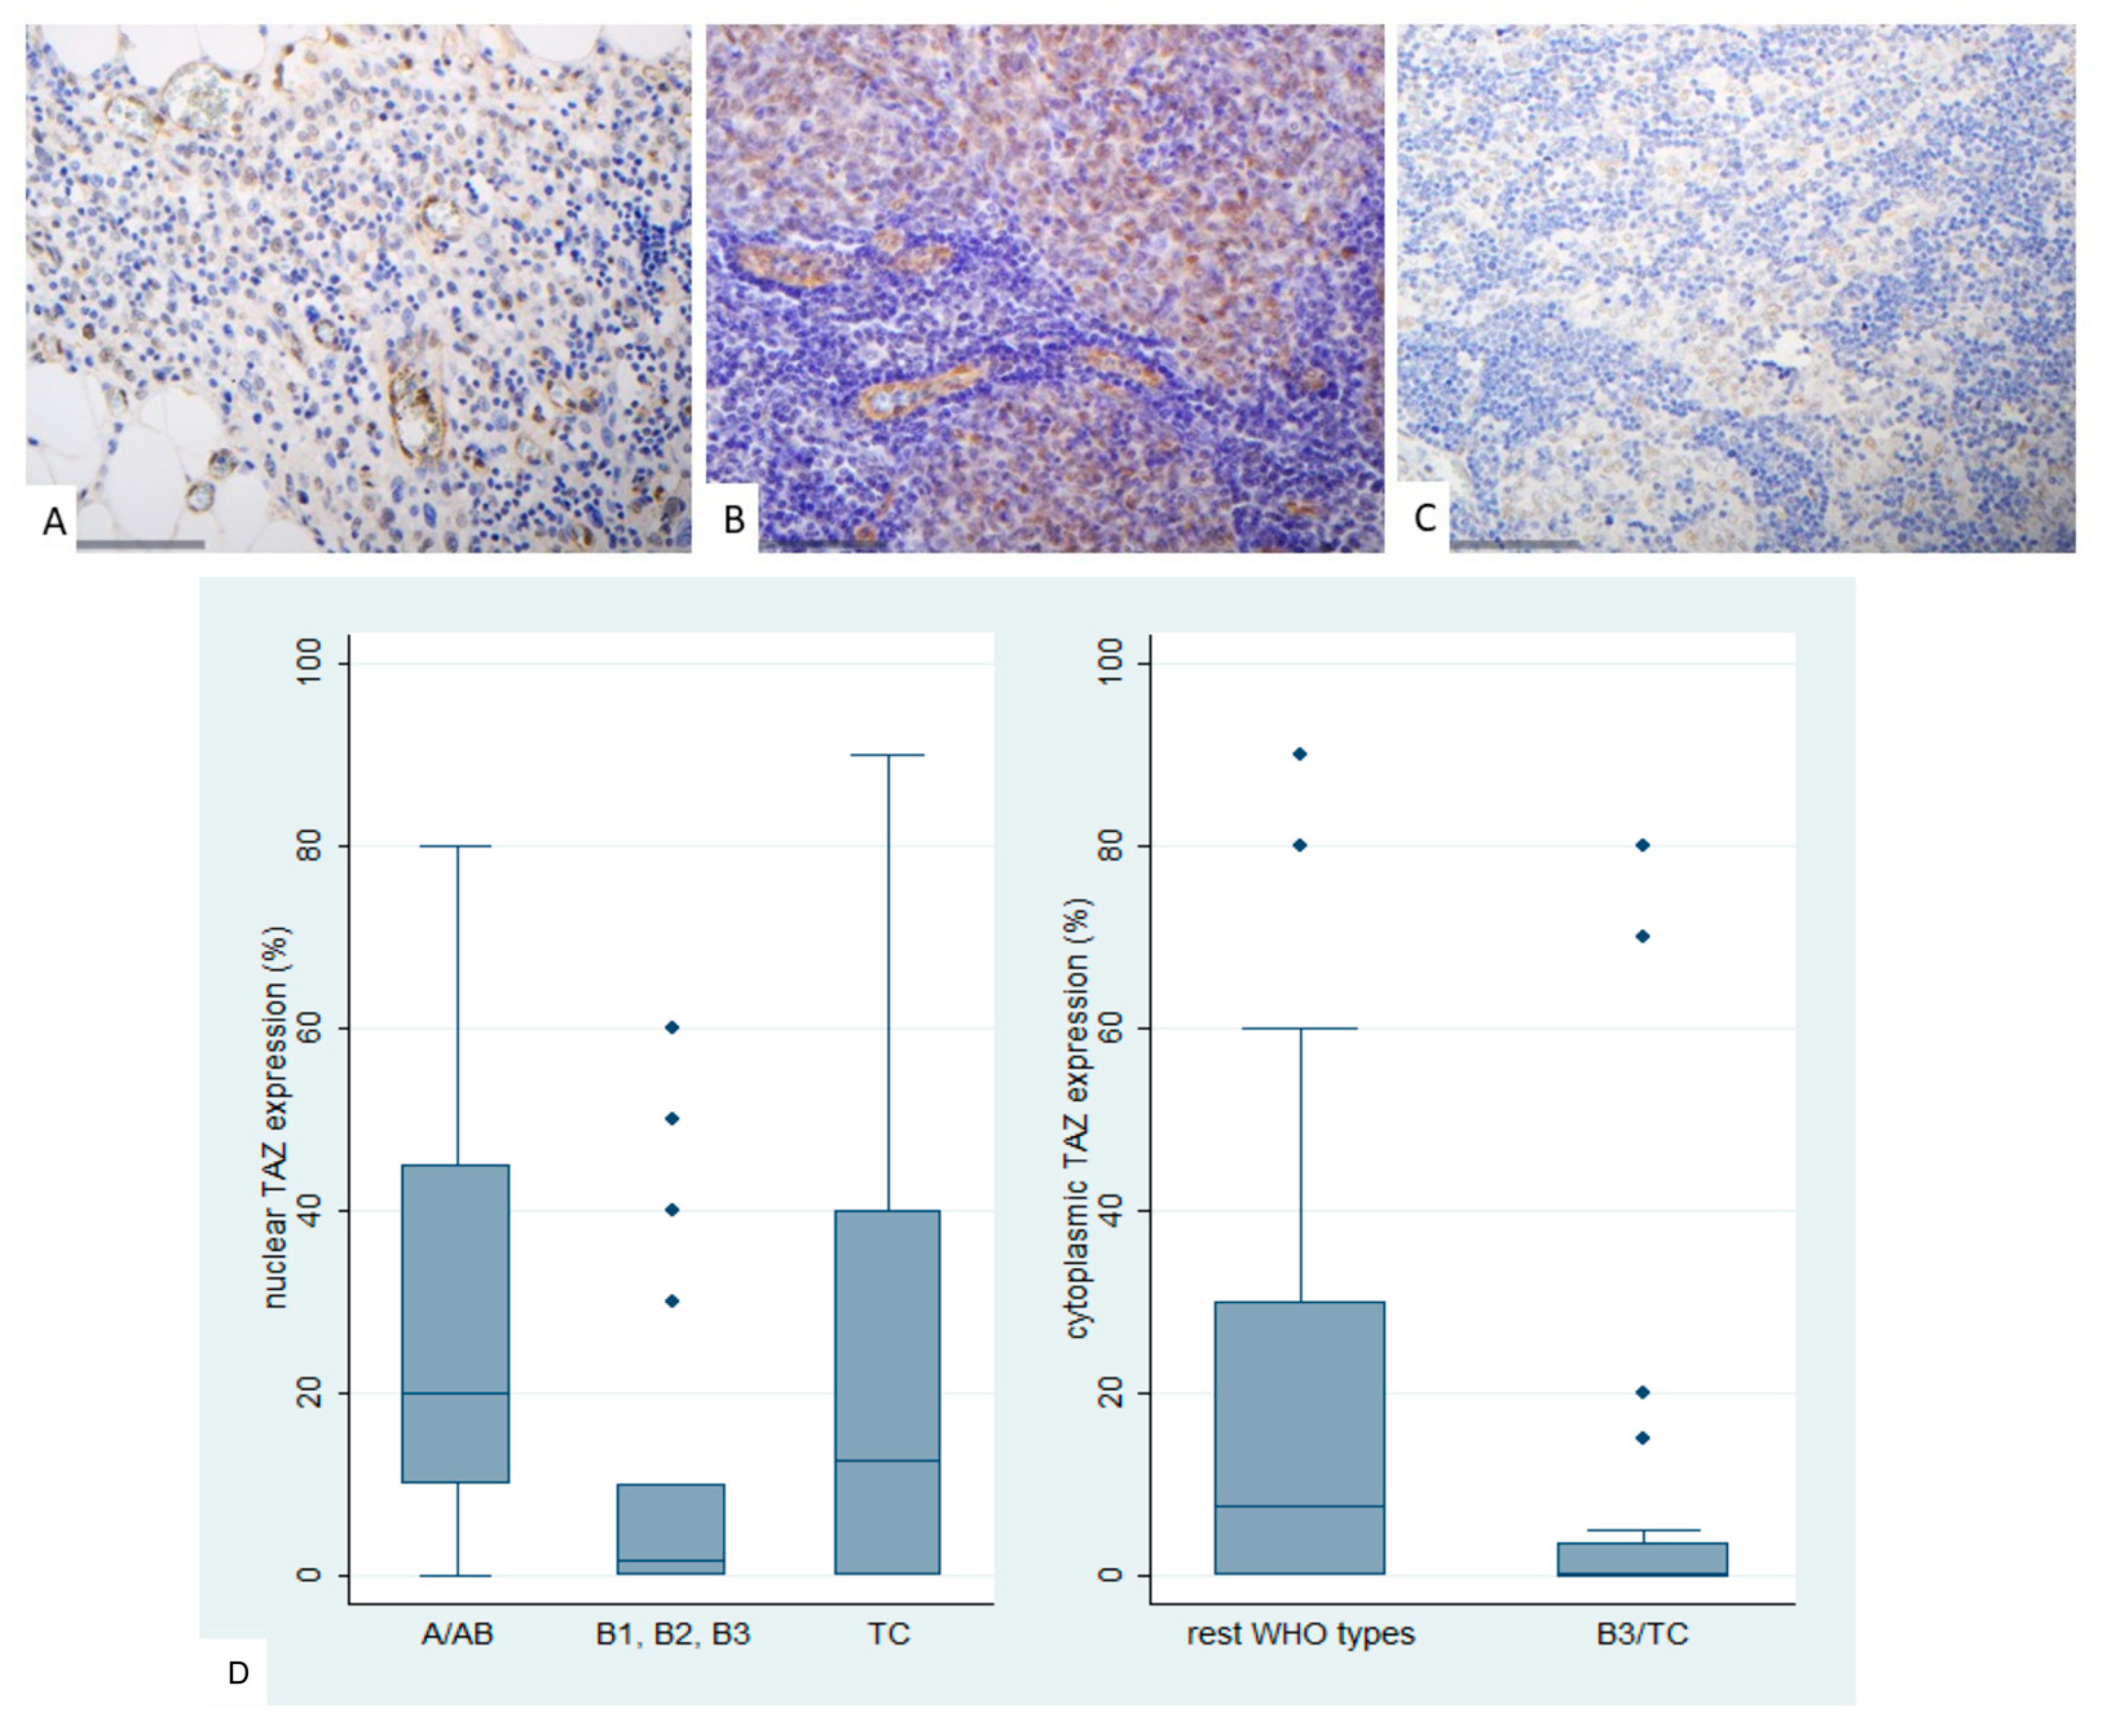
Figure 9.
Immunohistochemical expression of TEAD4 in TETs. (A) Normal thymic tissue (nuclear, cytoplasmic; x400); (B) Type AB thymoma (cytoplasmic; ×400); (C) Thymic carcinoma (cytoplasmic, nuclear; ×400); (D) Association of nuclear and cytoplasmic TEAD4 expression with WHO histological type; (E) Association of cytoplasmic TEAD4 expression with Masaoka-Koga stage.
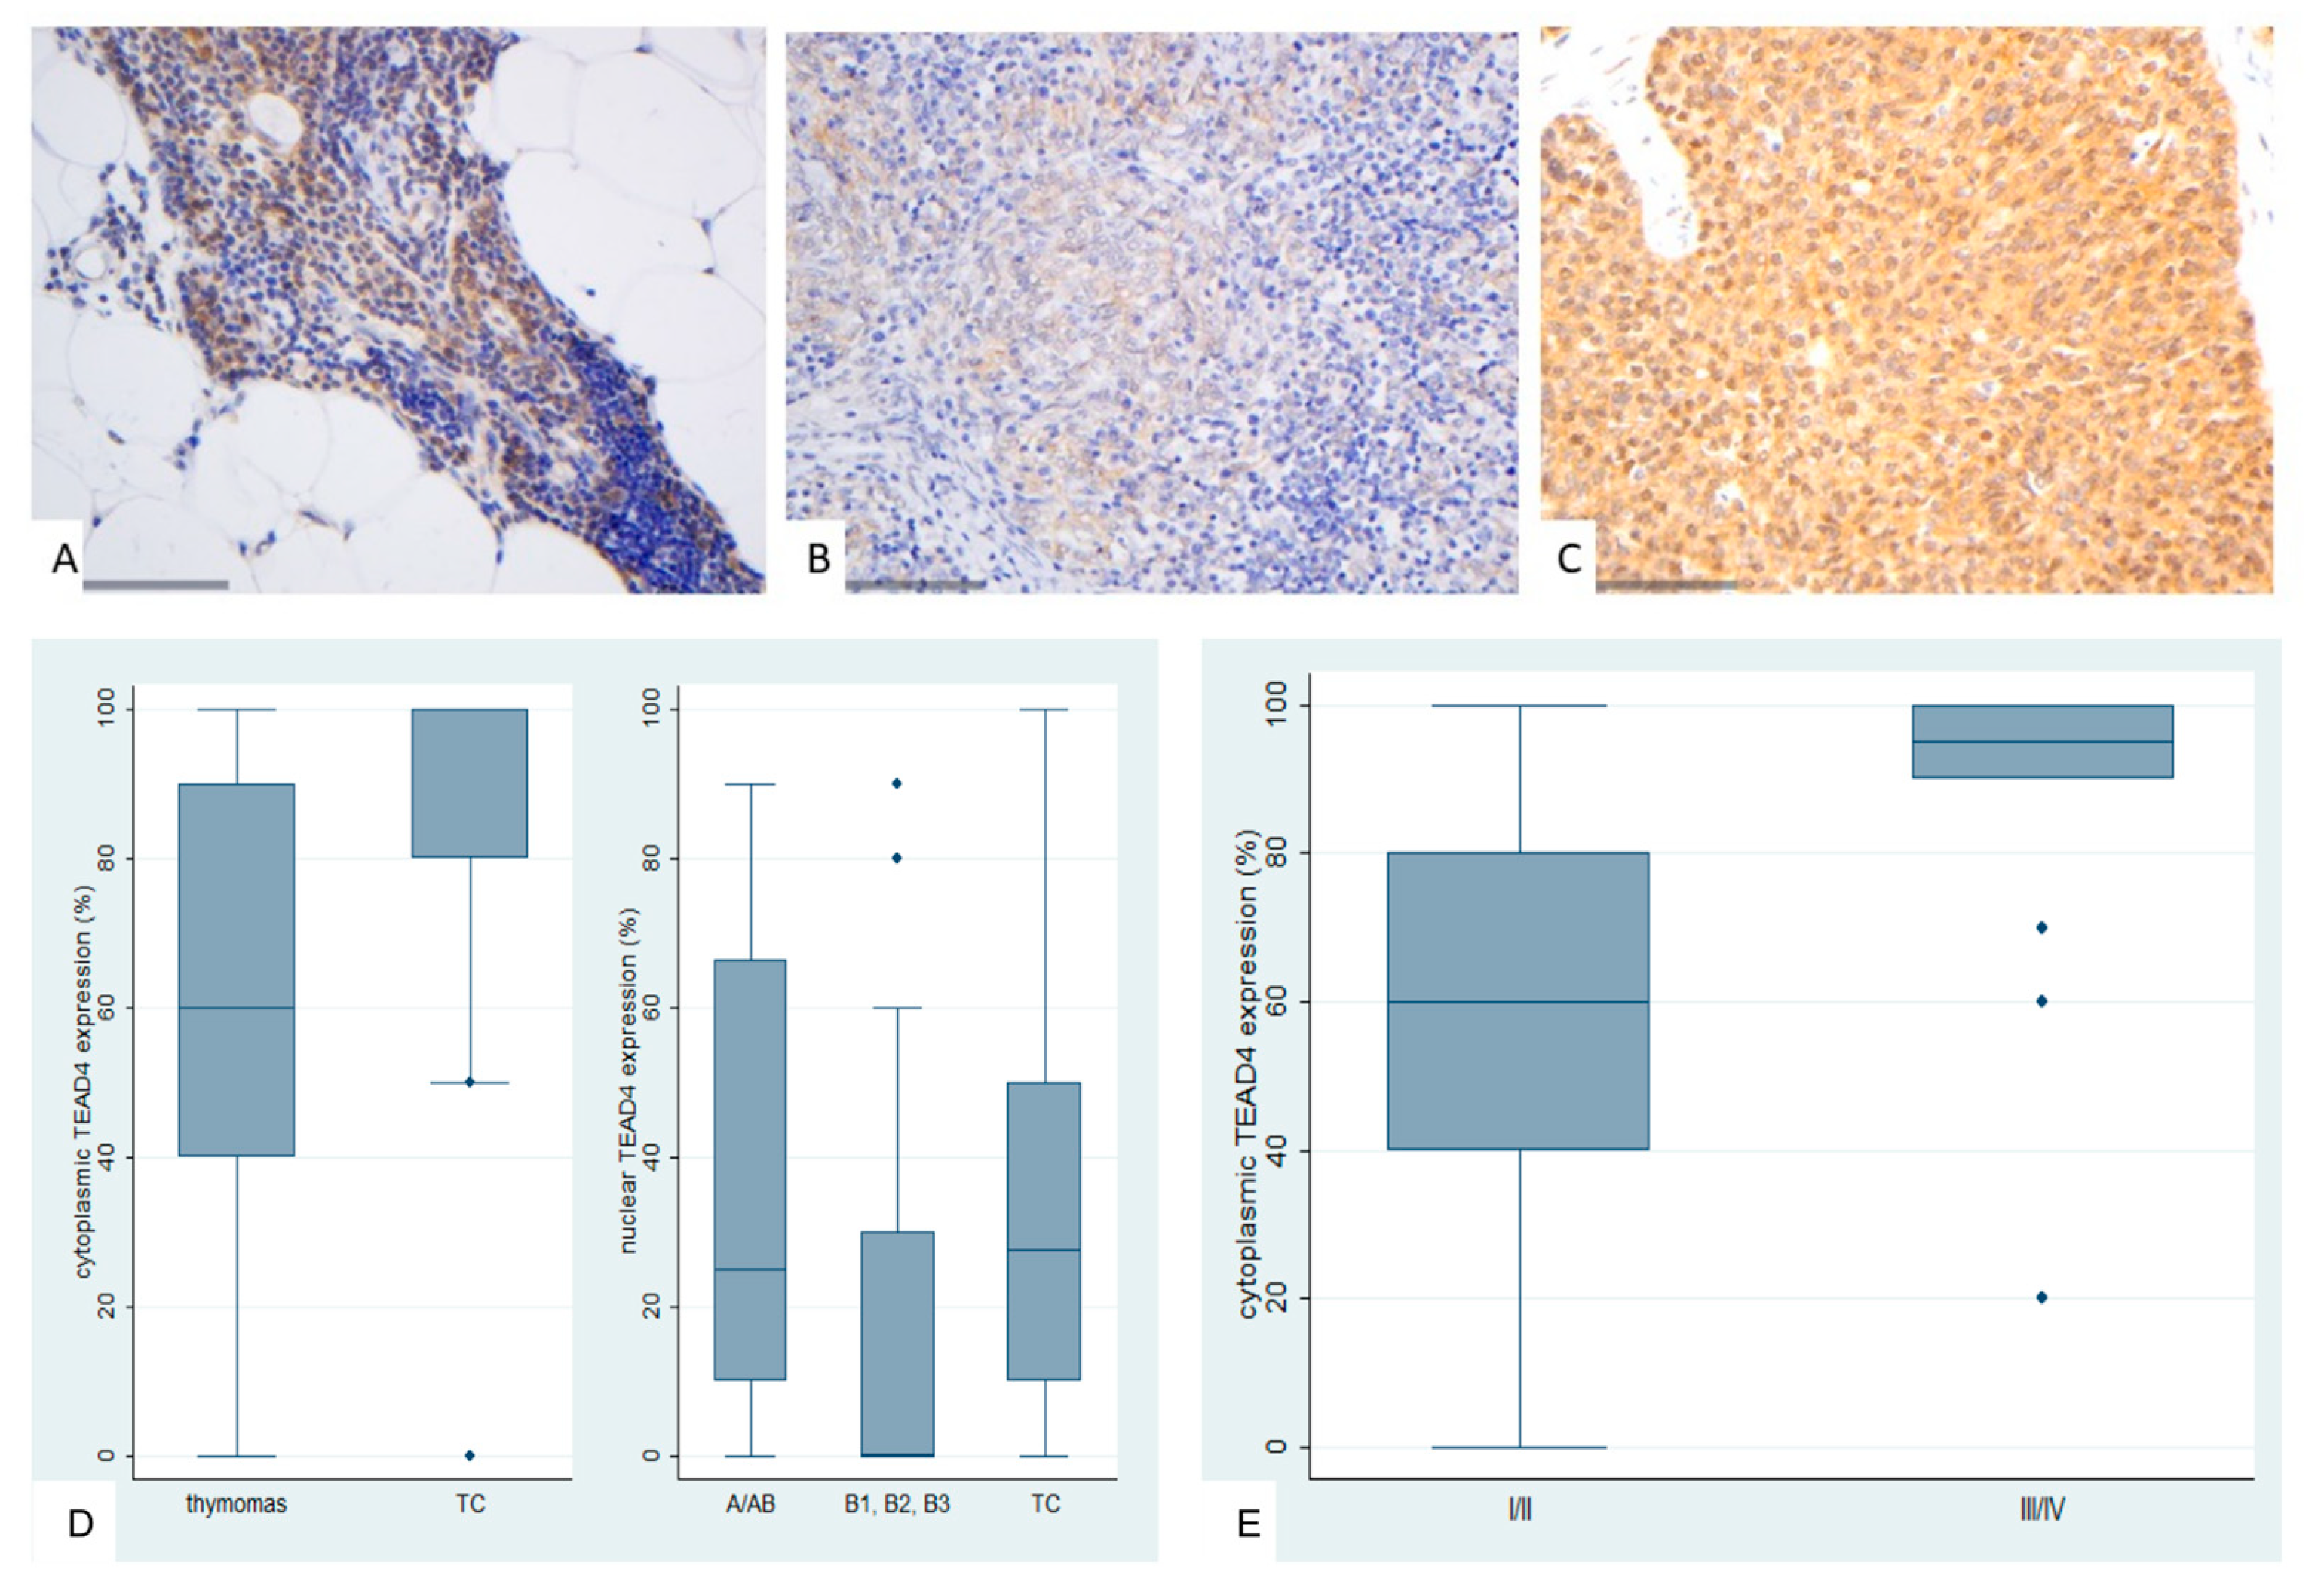
Figure 10.
Kaplan-Meier survival curves for the cytoplasmic TEAD4 expression in TETs.
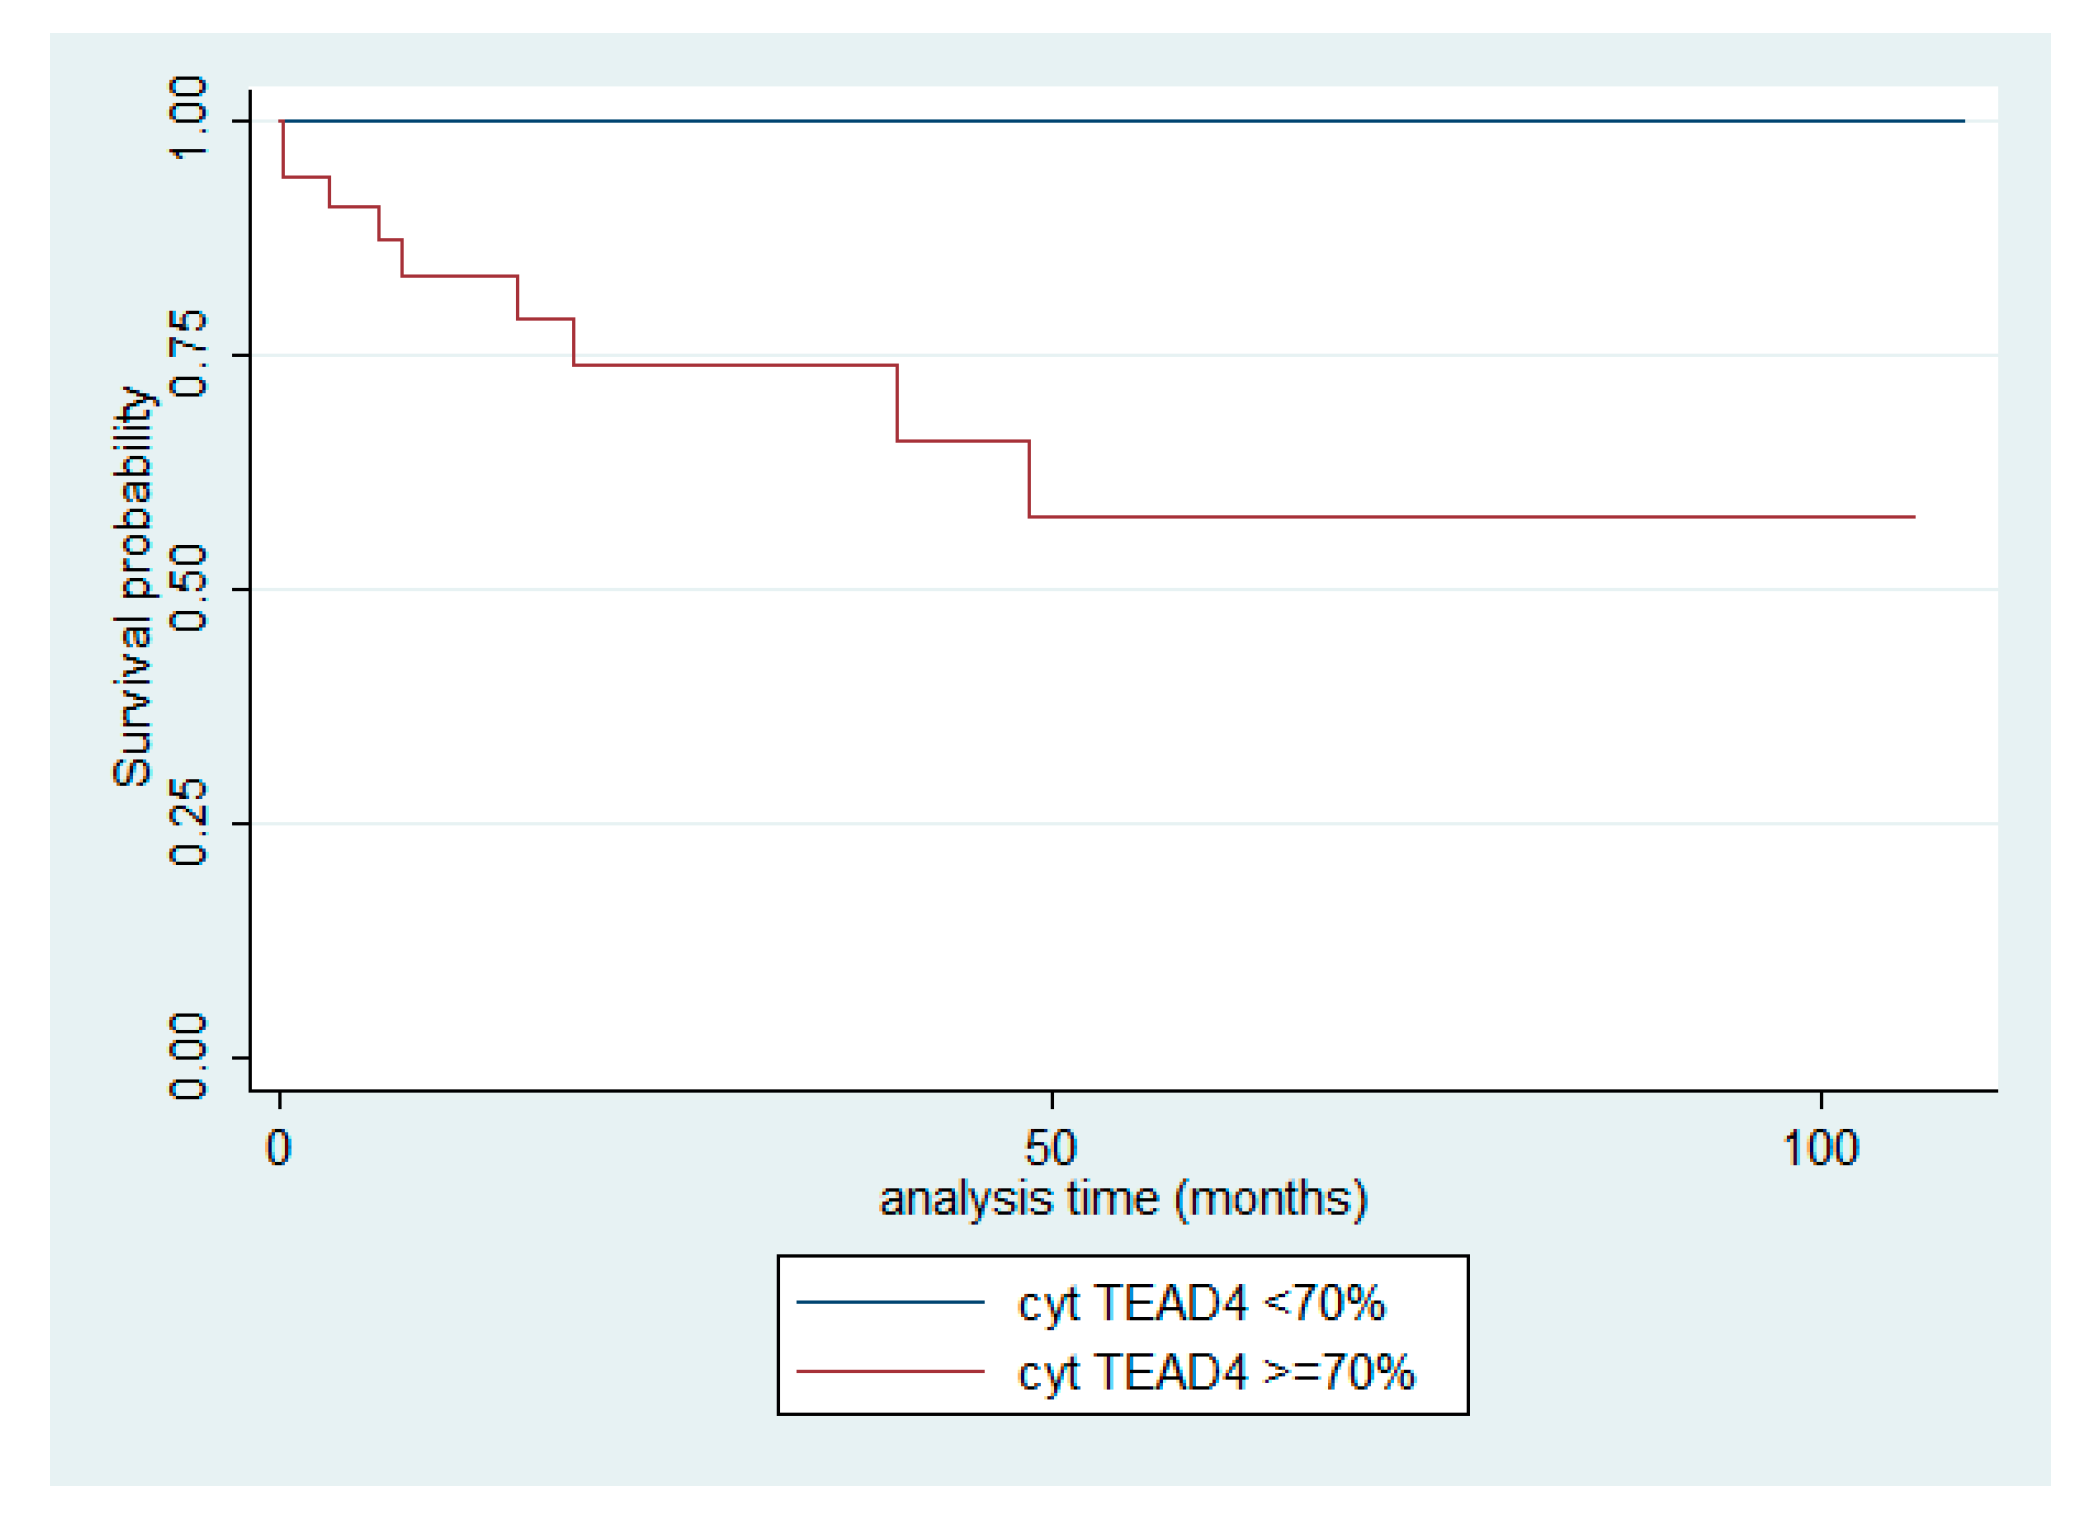
Table 1.
Associations between the investigated molecules of the Hippo cascade. Results of Spearman correlation’s coefficient. Bold decorates statistically significant associations.
Table 1.
Associations between the investigated molecules of the Hippo cascade. Results of Spearman correlation’s coefficient. Bold decorates statistically significant associations.
| n- MST1 | c-MST1 | c-SAV1 | c-LATS1 | c-MOB1A | n-TAZ | c-TAZ | n-YAP1 | c-YAP1 | n-AYAP | c-AYAP | n-TEAD4 | |
|---|---|---|---|---|---|---|---|---|---|---|---|---|
| c-MST1 | R = −0.19 p = 0.095 |
|||||||||||
| c-SAV1 | R = 0.048 p = 0.68 |
R = 0.19 p = 0.096 |
||||||||||
| c-LATS1 | R = −0.14 p = 0.206 |
R = 0.45* p < 0.001 |
R = 0.33* p = 0.003 |
|||||||||
| c-MOB1A | R = 0.09 p = 0.441 |
R = 0.24 p = 0.032 |
R = 0.05 p = 0.624 |
R = 0.34 p = 0.002 |
||||||||
| n-TAZ | R = 0.12 p = 0.275 |
R = −0.08 p = 0.459 |
R = −0.10 p = 0.366 |
R = 0.25 p = 0.025 |
R = 0.02 p = 0.814 |
|||||||
| c-TAZ | R = 0.13 p = 0.246 |
R = 0.24 p = 0.038 |
R = 0.01 p = 0.919 |
R = 0.22 p = 0.056 |
R = 0.23 p = 0.042 |
R = 0.19 p = 0.097 |
||||||
| n-YAP1 | R = −0.02 p = 0.816 |
R = −0.21 p = 0.070 |
R = −0.21 p = 0.064 |
R = −0.05 p = 0.631 |
R = 0.04 p = 0.729 |
R = 0.30 p = 0.007 |
R = 0.32 p = 0.004 |
|||||
| c-YAP1 | R = −0.13 p = 0.244 |
R = 0.11 p = 0.340 |
R = −0.02 p = 0.857 |
R = 0.35 p = 0.001 |
R = 0.23 p = 0.044 |
R = 0.13 p = 0.239 |
R = 0.27 p = 0.016 |
R = 0.36 p = 0.001 |
||||
| n-AYAP | R = 0.16 p = 0.16 |
R = −0.20 p = 0.07 |
R = −0.20 p = 0.080 |
R = −0.02 p = 0.826 |
R = 0.05 p = 0.653 |
R = 0.37 p = 0.001 |
R = 0.44 p < 0.001 |
R = 0.80 p < 0.001 |
R = 0.30 p = 0.009 |
|||
| C-AYAP | R = 0.08 p = 0.497 |
R = −0.01 p = 0.872 |
R = −0.03 p = 0.788 |
R = 0.29 p = 0.010 |
R = 0.29 p = 0.009 |
R = 0.28 p = 0.013 |
R = 0.23 p = 0.047 |
R = 0.45 p < 0.001 |
R = 0.68 p < 0.001 |
R = 0.58 p < 0.001 |
||
| n-TEAD4 | R = −0.01 p = 0.867 |
R = 0.13 p = 0.265 |
R = −0.01 p = 0.892 |
R = 0.36 p = 0.001 |
R = 0.01 p = 0.940 |
R = 0.34 p = 0.002 |
R = 0.06 p = 0.600 |
R = 0.07 p = 0.526 |
R = 0.24 p = 0.038 |
R = 0.07 p = 0.519 |
R = 0.13 p = 0.245 |
|
| c-TEAD4 | R = 0.08 p = 0.468 |
R = 0.31 p = 0.005 |
R = 0.13 p = 0.265 |
R = 0.62 p < 0.001 |
R = 0.29 p = 0.012 |
R = 0.25 p = 0.029 |
R = 0.11 p = 0.318 |
R = −0.04 p = 0.706 |
R = 0.27 p = 0.017 |
R = −0.07 p = 0.523 |
R = 0.24 p = 0.031 |
R = 0.31 p = 0.007 |
Table 2.
Characteristics of 77 patients with TETs included in our analysis.
| Parameter | Median | Min–max |
|---|---|---|
| Age (years) | 69 | 21–88 |
| Tumor size (cm) | 6.5 | 0.9–14 |
| Number | % | |
| Gender | ||
| Male | 39 | 50.6 |
| Female | 38 | 49.4 |
| WHO subtypes | ||
| Type A | 3 | 3.9 |
| Type AB | 26 | 33.7 |
| Type B1 | 7 | 9 |
| Type B2 | 11 | 14.3 |
| Type B3 | 14 | 18.2 |
| Micronodular with lymphoid stroma (MNT) | 2 | 2.6 |
| Thymic carcinoma (TC) | 14 | 18.2 |
| Masaoka–Koga stage | ||
| I | 22 | 33.8 |
| II | 25 | 38.5 |
| III | 9 | 13.8 |
| IVa | 5 | 7.7 |
| IVb | 4 | 6.1 |
| Presence of myasthenia Gravis | 11 | 14.1 |
| Event | ||
| Cencored-Alive | 51/60, follow-up 0.3–109, 4 months | 85 |
| Dead | 9/60, within 0.1–48.6 months | 15 |
Disclaimer/Publisher’s Note: The statements, opinions and data contained in all publications are solely those of the individual author(s) and contributor(s) and not of MDPI and/or the editor(s). MDPI and/or the editor(s) disclaim responsibility for any injury to people or property resulting from any ideas, methods, instructions or products referred to in the content. |
© 2025 by the authors. Licensee MDPI, Basel, Switzerland. This article is an open access article distributed under the terms and conditions of the Creative Commons Attribution (CC BY) license (http://creativecommons.org/licenses/by/4.0/).
Copyright: This open access article is published under a Creative Commons CC BY 4.0 license, which permit the free download, distribution, and reuse, provided that the author and preprint are cited in any reuse.


