
Submitted:
26 May 2025
Posted:
26 May 2025
You are already at the latest version
Abstract
Members of the family of molecule interacting with CASL protein (MICAL) proteins play crucial roles in the cytoskeleton rearrangements by promoting depolymerization of F-actin via oxidation of the specific methionine residues to methionine-sulfoxides. These proteins also have multiple other functions and are related to the pathogenesis of various maladies. However, not much is known about the prevalence and functionality of intrinsically disordered regions in MICALs. To fill this gap, we conducted a comprehensive bioinformatics analysis of five human MICAL protein family members, MICAL1, MICAL2, MICAL3, MICAL-L1, and MICAL-L2, to assess their intrinsic disorder characteristics. We also focused on the top 10 most disordered interactors of these proteins. We utilized a set of bioinformatics tools, FuzDrop, RIDAO, InterPro, IuPred, STRING, AlphaFold, and UniProt, for the extensive analysis of these proteins. This analysis revealed that all five MICALs are highly disordered; they take part in myriad of cellular functions, and are also involved in pathogenesis of various diseases, such as neurodegeneration, cancer, and muscle dystrophy. Our study focused on the intrinsic disorder of these proteins to highlight important implications of disorder in protein functionality. These insights may help to find out potential therapeutic targets in biological processes controlled by MICAL proteins.
Keywords:
intrinsically disordered proteins
; intrinsically disordered regions
; protein-protein interactions
; posttranslational modifications
; liquid-liquid phase separation
; alternative splicing
; MICAL
1. Introduction
1.1. Brief Introduction of MICALs
MICAL (molecule interacting with CasL (CRK-associated substrate-related protein)) proteins represent a family of actin regulatory enzymes (methionine monooxygenases) involved in the cytoskeleton rearrangements by promoting depolymerization of F-actin [1]. Here, MICALs mediate oxidation of specific methionine residues on F-actin leading to the formation of methionine-sulfoxide, thereby resulting in actin filament disassembly and preventing repolymerization [1]. In the absence of actin, MICALs can act as NADPH oxidases producing H2O2 [1-3]. In vertebrates, there are three MICAL genes (MICAL-1, MICAL-2, and MICAL-3), whereas Drosophila has one Mical gene [1]. The proteins of this family have a characteristic N-terminal redox-domain followed by other important functional regions [4]. In addition to the MICAL proteins, vertebrates also have two MICAL-like proteins, MICAL-L1 (also known as molecule interacting with Rab13, MIRab13) and MICAL-L2 (also known as junctional Rab13-binding protein, JRAB) with the domain organization similar to that of MICALs but lacking the redox domain [4].
MICALs can oxidize their substrate using two approaches, one is the direct approach, in which MICALs enzyme directly interact with the substrate like F-actin to oxidize them, in the indirect mechanism, MICALs produce ROS to do the job. Whether MICALs utilize both mechanisms or only use one at a time is not fully understood [5]. Clearly, the direct mechanism represents a controllable way of modification of specific methionines in target proteins, whereas the ROS generated via the indirect mechanism would hit all accessible sites sensitive to oxidative modification.
The major substrate of MICALs is actin, an integral part of cytoskeleton. However, being capable of the structural remodeling of actin, these enzymes are involved in multiple key biological functions, particularly playing a number of significant roles in controlling the shape of the cells, as well as cellular movement, cytokinesis, and navigation [5]. Because of the importance of actin in multiple cellular processes, the significance of actin binding proteins involved in the regulation of its action cannot be overlooked [4]. Among such actin binding proteins are the members of the MICAL family, which are involved in mediating the redox reaction of actin protein [4] and which represent the focus of our article.
Being more than 1000 amino acids long, MICALs are characterized by complex domain organization, where along with the conserved N-terminal domain known as hydroxylase or flavoprotein monooxygenase domain, there are several other notable regions, such as proline rich region, a calponin homology (CH) domain, Lin11, Isl-1, Mec-3 (LIM) zinc-biding domain that does not bind DNA but act as interface for protein-protein interaction, bMERB (bivalent Mical/EHBP Rab binding) domain, coiled-coil regions, and other functional motifs, through which these regulatory proteins interact with other proteins to carry out their various roles in cells. In humans, each MICAL family protein is directly involved in destabilization of F-actin, being capable of selective association with actin filaments and reshaping cells [1]. MICALs play very important role in numerous cellular functions, such as T cell maturation, intracellular vesicular trafficking, and axon growth [3]. However, the most notable function of the MICAL proteins is their involvement in a very important regulatory mechanism, oxidation of F-actin during cytokinesis [6]. One of the specific aspects of the flavoprotein monooxygenase domain mechanism that is unique to the MICALs is that these proteins interact physically with the substrate [6]. In the scenario related to F-actin oxidation, destabilization, and disassembly, crucial for the dynamics and remodeling of the cellular cytoskeleton, MICALs have regions capable of direct interaction with F-actin. This interaction places the catalytic domain of MICALs in the proximity of F-actin to oxidize it primarily at two methionine residues Met44 and Met47 within the actin molecule [7]. The N-terminal redox domain binds to the co-factor flavin adenine dinucleotide (FAD) and transfers the electrons from NADPH to oxygen to generate ROS (reactive oxygen species), H2O2 is a byproduct of this reaction [6,8]. The reaction renders the actin molecules interactions weak and leads to the disassembly of F-actin molecules, which is very important for cytoskeleton remodeling allowing cells to modify their shape and assist in directional growth. Generations of ROS further facilitate the oxidative modifications in the local environment of the cell [6].
By modifying actin assembly and disassembly MICAL proteins are involved in several biological processes and are closely linked to cellular signaling [6,9]. MICALs are involved in controlling morphology of neuronal dendrites and are essential for the proper development and regeneration of neurons. This is because actin dynamics are very important for several neuronal functions, such as synapse formation, and axonal repulsion, which is a directional growth of the neurons away from some areas and towards other areas to develop new connections [6]. MICALs also play crucial roles in protein trafficking into axons, which is essential for the proper growth and functions of axons, as well as in docking of the vesicles that are fused at the plasma membrane, all of these are vital for the normal signal transmission in nervous systems [6].
MICALs also have important roles in the pathogenesis of various maladies, e.g. cancer progression. For example, MICAL1 was knocked out in MDA MB 231 human breast cancer cell line to identify the implication of MICAL1 on cancer progression [10]. The changes were observed in cell size and motility, implying that MICAL1 does play an important role in the normal progression of malignant cells [10]. The knockout cells in the mouse models show reduced tumor growth, and analysis of human cancer data highlights the upregulation of MICAL1 expression in the invasive breast cancer cells compared to the normal cells [10]. All of these are pointing out in the direction of MICAL1 influence in the cancer progression [10].
Because of their high interactability, misbehavior of MICALs is related to the progression of neurodegenerative diseases [4]. For example, MICAL has been identified as an important interactor of human tau protein, which is one of the major proteins involved in the pathogenesis of Alzheimer disease (AD) in the brain of drosophila AD model. Furthermore, MICAL was shown to increase the propensity of tau aggregation in tauopathies [11]. Normally, Tau protein stabilizes the microtubules but the effect of the MICAL can change this function, as the interaction of MICAL increases the toxicity and aggregation of Tau proteins [11]. MICAL did this by using its redox domain to oxidize tau at specific cysteine residues, thereby modifying the normal functioning of tau protein [11]. Furthermore, this was validated in human tauopathy samples, as the human MICAL protein was upregulated in the brains of the patients with taupathies [11].
MICALs are important in muscle movement and morphology [12]. If MICAL is mutated, the synaptic boutons fails to spread normally across the surface of the muscles and tend to clusters at nerve entry points, suggesting that MICAL play very important role in neuromuscular junction structure [12]. Mutation in MICAL affect the normal distribution of actin and myosin filaments beneath the cell membrane, which are normally distributed in the sarcomeric manner, but the MICAL mutant might cause a notable disorganization of muscle filaments [12].
1.2. Intrinsic Disorder in Proteins
Since forever the classic “lock-and-key” concept coined in 1893 by Hermann Emil Louis Fischer (1852-1919) [13,14] converted to the “one gene – one enzyme – one biochemical reaction” notion (proposed for the first time in 1941 by George Wells Beadle (1903 – 1989) and Edward Lawrie Tatum (1909 – 1975) [15]) and later transformed into the classic model of a protein science, where a unique amino acid sequence of a protein encodes its unique structure required for unique function (derived from the classic experiments of Christian Boehmer Anfinsen Jr. (1916 – 1995) [16-18]) was a dominant belief in the structural biology community. It took a while for the scientists to start opening to the fluidity/flexibility of protein structure related to its function. The concept of proteins not always following the conventional “structure-function” paradigm was somewhat there in the 20th century literature, being dispersed in the scientific publications, where such “non-canonical” proteins were given different names, such as chameleon, dancing, flexible, floppy, malleable, mobile, partially folded, pliable, rheomorphic, vulnerable, or 4D proteins, protein clouds or proteins waiting for partners, as well as different combinations of “inherently-intrinsically-natively-naturally” with “denatured-disordered-unfolded-unstructured” (for the historic overview, see [19,20]).
Despite all these observations, it took long time to debunk the one structure – one function model. One reason for this challenge was the unshaken belief of protein community in the validity of the lock-and-key model supported by the development of specific and more and more advanced experimental approaches for finding and characterizing structure in proteins. However, the accumulated factual scientific discoveries eventually helped the acceptance of the protein intrinsic disorder concept, and advancement of experimental techniques provided a way for researchers to look deeper into the behavior of these uniquely interesting proteins. Intrinsically disordered proteins (IDPs) and intrinsically disordered regions (IDRs) are unstructured under physiological conditions. Because they typically have a high number of charged residues and low content of hydrophobic residues, many of them have poorly defined hydrophobic core (if any) and typically exist in somewhat extended form. Since they lack defined 3D shapes, IDPs/IDRs are very adaptable towards their environment [21-24].
Looking at the intrinsic disorder in members of MICAL family is expected to provide some important insights. Since MICALs are involved in the actin dynamic, having intrinsic disorder regions in these enzymes may allow them to switch between their active and inactive state more effectively, and give them more structural flexibility, which might be crucial for the MICALs to interact with actin and multiple binding partners. In the context of binding promiscuity, looking at the IDRs of MICALs can enhance understanding of the roles of these proteins in various signaling pathways, as IDRs allow interactions with multiple different partners. This might help MICAL proteins to interact with actin and different other proteins. IDRs are targets for various post-translational modifications (PTMs) [25]. Modifications in these regions like acylation, palmitoylation, and phosphorylation can alter their activity, stability, and localization, which might be responsible for regulation of the enzymatic activity of MICAL proteins [26]. For example, phosphorylation was shown to affect interaction of these proteins with their partners, such as RAB GTPases and their enzymatic activity. This is illustrated by the facts that phosphorylation of MICAL1 by PAK1 regulates MICAL binding to GTPase [27], whereas ARG-induced phosphorylation of MICAL2 promotes MICAL2-mediated F-actin disassembly [28].
The importance of IDPs and IDRs has been well established across various biological functions, whereas alterations in the IDPs/IDRs could potentially contribute towards the propagation of diseases, such as cancers and neurological disorders [29-31]. Changes in MICAL proteins can accelerate or slow down the propagation of cancer, and since these proteins are involved in the directional growth of neurons, unwanted mutations in them are detrimental, especially those located in the IDRs, as they could possibly aggravate the damage. These IDRs can serve as potential targets for drug development, especially if these regions are in functionally important areas of protein length. We can also get evolutionary insights through investigating the conserved IDR regions in MICAL proteins across various species, highlighting their evolutionary importance and their fundamental role in the protein function.
2. Results
2.1. Functional Disorder Analysis of Human MICALs
2.1.1. MICAL1 (UniProt ID: Q8TDZ2)
[F-actin]-monooxygenase MICAL1 also known as molecule interacting with CasL protein 1 (MICAL1) or neural precursor cell expressed developmentally down-regulated protein 9 (NEDD9)-interacting protein with calponin homology and LIM domains is a cytoplasmic 1067-residue-long monooxygenase that mediates the F-actin disassembly via oxidation of specific methionine residues along the length of actin filaments to methionine sulfoxides [1]. If the F-actin is absent, the MICAL1 act as a NADPH oxidase producing reactive oxygen species H2O2 [3]. It can also act as a Rab (Ras-like GTPase) effector to play a role in the vesicular trafficking [32].
Human MICAL1 contains a signature catalytic monooxygenase (MO) domain (residues 1-489), a calponin homology (CH) domain (residues 506-612) that is often involved in the actin binding, a LIM zinc-binding domain (residues 695-757), and a coiled-coil (CC) domain (residues 919-1027), which is also known as ERM α-like domain or Rab-binding domain (RBD) that participates in interaction with Rab GTPases via two coiled-coil regions (residues 919-962 and 999-1027) acting as two distinct Rab-binding sites with different affinities [6,9]. In addition to GTP-bound Rab proteins CC/RBD also binds plexins, which are the receptors for one of the largest protein families of extracellular guidance cues, semaphorins, that includes over twenty family members conserved from invertebrates to humans [33]. C-terminal half of MICAL1 includes a region important for interaction with RAB8A (residues 918-1067), and a bMERB domain (residues 918-1067) that mediates binding to predominantly RAB8, RAB10, RAB13, and RAB15 (in their GTP-bound forms) [34]. The four MICAL1 domains are linked via three linker regions, with the shortest linker, L1 (residues 490-507), bridging the MO and CH domains, the intermediate L2 linker (residues 613-694) connecting the CH and LIM domains, and the longest linker, L3 (residues 758 to 907), serving as a bridge between the LIM and the CC/RBD domain [35]. It was shown that the C-terminal coiled-coil domain of MICAL1 interacts with the N-terminal catalytic domain leading to the autoinhibition of this protein [35]. Furthermore, CC/RBD domain can also bind to the assembly of CH-LIM domains, with the L2α1 helix from the L2 linker region that play an important role in the stability of the CH-LIM-CC assembly being wedged between the CC/RBD, CH, and LIM domains [35]. Formation of the CH- L2α1-LIM-CC assembly is crucial for the MICAL activation and autoinhibition as well [35].
Our bioinformatics analysis revealed that human MICAL1 belongs to the category of highly disordered proteins, as it is characterized by the PONDR® VSL2-based content of disordered residues, PPIDRPONDR®VSL2 = 45.83% and PONDR® VSL2-based average disorder score, ADSPONDR®VSL2 = 0.48±0.28. In line with these observations, PPIDR values generated by other predictors included into RIDAO platform were 22.31%, 24.93%, 31.3 %, 33.93%, 40.67%, and 41.7%, for IUPred Short, IUPred long, PONDR® FIT, MDP (mead disorder prediction), PONDR® VL3, and PONDR® VLXT, respectively. Figure 1A shows that although the N-terminal half of human MICAL1 is predicted as mostly ordered, the C-terminal half of this protein contains high levels of predicted intrinsic disorder, with regions 610-694, 740-990, and 100-1067 being predicted as highly disordered. Figure 1A also indicates that MICAL1 is predicted by ANCHOR2 to contain 4 MoRFs (residues 474-489, 634-682, 749-872, and 879-906) that cover 44.0% of its disordered segments, which corresponds to 20.3% of the entire sequence. This observation indicates that a very significant part of MICAL1 can be involved in disorder-based interactions with various partners.
Curiously, Figure 1B shows that human MICAL1 is characterized by high probability of spontaneous liquid-liquid phase separation (LLPS), pLLPS = 0.80, and contains 8 droplet-promoting regions (DPRs (residues 1-11, 182-192, 475-513, 613-632, 647-696, 733-843, 864-889, and 955-967), indicating that this protein is capable of spontaneous LLPS and can potentially serve as LLPS driver, and thereby can control the formation of membrane-less organelles [36]. Furthermore, one can fine several aggregation hot spots in this protein (residues 182-189, 488-501, 613-618, 625-631, 652-666, 683-696, 733-751, 832,-838, 866-872, and 955-967), which are can drive aggregation within the condensates generated by LLPS [37]. In line with the ANCHOR-2 outputs predicting the presence of four disorder-based interactions sites, MoRFs, capable of disorder-to-order transition at interaction with binding partners, Figure 1C shows that MICAL1 contains multiple regions with context-dependent interactions that change protein interaction behavior and binding modes under different cellular conditions (residues 7-35, 84-101, 174-189, 426-433, 437-451, 463-478, 488-501, 512-522, 592-608, 611-618, 634-649, 652-666, 683-699, 701-707, 729-738, 740-751, 832-838, 866-872, 885-896, 932-941, 952-970, 978-983, 990-997, 1000-1005, 1019-1037, 1040-1046, and 1048-1061) [38,39].
Figure 1D provides further support for the highly disordered status of human MICAL1 and shows that the C-terminal half of this protein is predicted as disordered by most of the tools included in the D2P2 platform. It also shows that IDRs have functional roles, containing multiple MoRFs and numerous PTMs (mostly phosphorylation sites). In line with these observations, Figure 1E represents the AlphaFold-modeled 3D structure, which indicates that the structure within the N-terminal part of the protein is predicted with higher confidence, whereas the C-terminal region has lower per-residue confidence score (pLDDT), with several regions being characterized by low (70 > pLDDT > 50) and very low (pLDDT < 50) scores, indicating that this regions can be disordered in isolation.
Human MICAL1 is known to exist in 4 isoforms generated by alternative splicing. The MICAL-1b contains 981 residues, being different from the canonical MICAL-1a by missing the 312-397 region [40]. As a result, intrinsic disorder propensity of this isoform is slightly increased, to PPIDRPONDR®VSL2 = 46.99% and ADSPONDR®VSL2 = 0.50±0.29. In the isoform 3 (332 residues), the long N-terminal region that includes the MO and CH domains and half of LIM domain (residues 1-735) is missing, whereas the 736-768 region is changed from YEQHPGDGHFYCLQHLPQTD HKAEGSDRGPESP to MPRLTFAPKGWPHPPTSLHPGQVTDQTTWWLFQ [41]. With PPIDRPONDR®VSL2 = 92.47% and ADSPONDR®VSL2 = 0.75±0.16, this shortest isoform is characterized by the most disordered nature among the other MICAL1 variants. Finally, in isoform 4 (1086 residues), the N-terminal methionine residue is changed to MSCLSHSSLPSCCPPQ EASM [42], and the global disorder level is slightly increased relative to the canonical isoform, to PPIDRPONDR®VSL2 = 47.24% and ADSPONDR®VSL2 = 0.50±0.29. The observation that disorder status of MICAL1 is affected by alternative splicing is in line with the known fact that polypeptide segments affected by alternative splicing are most often intrinsically disordered, supporting the idea that alternative splicing represents an important means for regulation of the IDP and IDR binding functions [43]. LLPS potential of MICAL1 is also regulated by alternative splicing, as MICAL1-1a, MICAL1-1b, MICAL1-3, and MICAL1-4 are characterized by the pLLPS of 0.8000, 0.8392, 0.9639, and 0.8457, respectively. It is tempting to hypothesize that one of the potential functions of the shortest MICAL1-3 isoform, which is the most disordered MICAL1 isoform missing the MO and CH domains and half of LIM domain, is related to the control of the biogenesis of some cellular MLOs due to its very high LLPS potential. Clearly, this hypothesis requires experimental validation.
To evaluate the interactivity of human MICAL1, we used STRING platform, where we used the threshold of 0.400 (medium confidence) for minimum required interaction score with the maximum interactors 500 in the 1st shell. Figure 1F represents the resulting PPI network centered at human MICAL1. This network is characterized by PPI enrichment value of <1.0×10⁻¹⁶, the number of nodes of 35 and the number of edges of 136, which significantly exceeds the 39 interactions expected for a random set of proteins of the same size and degree distribution drawn from the genome. The average local coefficient of this network is 0.676, indicating that the network has densely connected clusters. In fact, k-means clustering revealed that the MICAL1-centered network contains two clusters, where the first cluster includes 20 proteins related to the Sema3A PAK dependent axon repulsion and semaphorin-plexin signaling pathway involved in neuron projection guidance, and MASA syndrome, and the second cluster contains 15 proteins which are Rab subfamily of small GTPases, and proteins involved in RAB GEFs exchange GTP for GDP on RABs and endocytic recycling. Members of this network have 81, 22, and 39 Gene Ontology (GO) terms significantly enriched in Biological Process, Molecular Function, and Cellular Component categories, respectively. The most significantly enriched biological processes (i.e., the processes with the lowest false discovery rates, FRDs, defined as p-values corrected for multiple testing within each category using the Benjamini–Hochberg procedure) are actin polymerization or depolymerization (GO:0008154; p = 9.01×10⁻⁹), neuron projection development (GO:0031175; p = 3.18×10⁻⁸), plasma membrane bounded cell projection organization (GO:0120036; p = 8.85×10⁻⁸), endocytic recycling (GO:0032456; p = 1.36×10⁻⁷), and actin filament organization (GO:0007015; p = 1.36×10⁻⁷). Among the most enriched molecular functions associated with the members of this network are cytoskeletal protein binding (GO:0008092; p = 2.63×10⁻⁷), actin binding (GO:0003779; p = 5.95×10⁻⁷), GTP binding (GO:0005525; p = 1.61×10⁻⁶), GTPase activity (GO:0003924; p = 3.26×10⁻⁶), and semaphorin receptor activity (GO:0017154; p = 1.05×10⁻⁵). The most enriched cellular components are recycling endosome (GO:0055037; p = 1.08×10⁻⁷), insulin-responsive compartment (GO:0032593; p = 6.00×10⁻⁶), semaphorin receptor complex (GO:0002116; p = 7.61×10⁻⁶), recycling endosome membrane (GO:0055038; p = 1.05×10⁻⁵), and extracellular exosome (GO:0070062; p = 1.05×10⁻⁵). The most enriched KEGG (Kyoto Encyclopedia of Genes and Genomes) [44] pathways are axon guidance (hsa04360; p = 3.13×10⁻⁷), endocytosis (hsa04144; p = 0.0116), and tight junction (hsa04530; p = 0.0205). And among the 13 enriched pathways from the REACTOME pathway database [45,46] the most enriched are RAB geranylgeranylation (HSA-8873719; p = 1.32×10⁻¹¹), RAB GEFs exchange GTP for GDP on RABs (HSA-8876198; p = 9.14×10⁻¹¹), Sema3A PAK dependent axon repulsion (HSA-399954; p = 8.26×10⁻¹⁰), CRMPs in Sema3A signaling (HSA-399956; p = 8.26×10⁻¹⁰), and semaphorin interactions (HSA-373755 p = 1.36×10⁻⁸).
2.1.2. [F-actin]-Monooxygenase MICAL2 (UniProt ID: O94851)
MICAL2 is a methionine monooxygenase that oxidizes MET 44 and MET 47 on actin filaments to facilitate the actin disassembly. It regulates the dynamics of actin protein within the nucleus, by facilitating the breakdown of nuclear actin to the monomeric form G-actin [47]. This depolymerization of nuclear actin through redox reaction decreases the amount of nuclear G-actin, which allows the myocardin-related transcription factor (MRTF-A) to accumulate in the nucleus [47]. G-actin normally interacts with MRTF-A to assist its transportation out of the nucleus [47]. Lowering the G-actin levels in the nucleus facilitates the accumulation of MRTF-A within the nucleus, which is mediated through MICAL-2. The accumulation of MRTF-A promotes the formation of transcriptionally active complex with SRF (serum transcription factor). These complexes are important for mediating gene transcription in response to signals, such as signals generated by the G-protein coupled receptors and nerve growth factor [47]. These complexes are important for several cellular functions, such as neurite formation and cellular migration. In short, MICAL2 is responsible for the redox dependent regulation of nuclear actin, which in turn is regulating the SRF/MRTF-A signaling [47].
MICAL-2 is a 1957-residue-long protein encoded by the MICAL2 gene. It contains MO domain (residues 2-494), CH domain (residues 516-619), LIM-type zinc domain (residues 1000-1062), ProQ/FinO domain (residues 1627-1721), and bMERB domain (residues 1796-1945). There are also nuclear localization signals (residues 660-681) and region for interaction with MAPK1 (residues 1324-1363). LIM domains consist of two zinc binding motifs; the domain is very important in proteins involved in multiple interaction. Proteins with LIM domain are involved in developmental and cellular functions [48]. Proteins containing ProQ/FinO domain are capable of RNA binding and considered as RNA chaperones [49]. The bMERB function is to mediate interaction between MICAL proteins and the RAB protein, which are GTPases that play important roles in vesicular trafficking in the cell [34]. Since MICAL2 does not have C-terminal CC/RBD domain, it cannot be autoinhibited via the mechanism described for MICAL1.
As per UniProt and InterPro annotations, there are also eight IDRs in human MICAL2 (residues 660-714, 886-942, 1070-1143, 1168-1243, 1258-1345, 1361-1431, 1467-1626, and 1675-1779). In line with these observations, Figure 2A represents the RIDAO-generated disorder profile that clearly shows a very high level of intrinsic disorder in most of this protein sequence. Here, most of the long segment spanning residues 670-1957 have disorder score above 0.5. In fact, based on the outputs of PONDR® VLXT, PONDR® VSL2, PONDR® VL3, IUPred Short, IUPred long, PONDR® FIT, and MDP, the corresponding PPIDR values are 50.23%, 63.67%, 57.95%, 38.99%, 51.51%, 50.74% and 52.68%. There are also multiple MoRF regions at residue position 678-700, 714-752, 778-798, 834-845, 858-963, 1093-1114, 1122-1217, 1221-1239, 1242-1279, and 1680-1776 respectively (see Figure 2A). Also, human MICAL2 contains 7 phosphorylated serine residues at positions 515, 631, 696, 991, 1623, 1660, and 1688.
Figure 2B depicts results of the FuzDrop analysis of human MICAL2 and shows that this protein has a very high pLLPS value of 0.9946, indicating high LLPS potential of this protein and ability to serve as a droplet driver. Along its length, MICAL2 has a set of 10 DPRs, residues 1-13, 655-783, 875-950, 1072-1248, 1252-1438, 1474-1632, 1641-1654, 1685-1779, 1813-1844, and 1872-1922. Furthermore, Figure 2C shows that this protein is predicted to have a very large number of regions with cellular context dependent interactions (residues 10-26, 66-80, 84-95, 345-360, 496-504, 611-622, 653-665, 736-742, 776-781, 790-798, 811-817, 828-839, 848-856, 861-874, 883-903, 942-956, 986-999, 1071-1080, 1098-1104, 1142-1160, 1162-1167, 1189-1197, 1204-1210, 1242-1255, 1326-1331, 1341-1348, 1372-1383, 1473-1485, 1535-1541, 1551-1561, 1618-1657, 1664-1707, 1767-1792, 1800-1821, 1838-1858, and 1917-1941) indicating high binding potential of this protein.
Alternative splicing of MICAL2 mRNA is responsible for generation of 7 isoforms. The canonical form of the protein is isoform 7 consisting of 1957 residues and showing PPIDRPONDR®VSL2 = 63.67% and ADSPONDR®VSL2 = 0.63±0.30. Isoform 1 (1124 residues) differs from the canonical isoform by DEPTSPKRPKSIS → VHFSLPVLHPLLG change in the 1112-1124 region and by missing residues 1125-1957. It is characterized by PPIDRPONDR®VSL2 = 38.52% and ADSPONDR®VSL2 = 0.46±0.28. With PPIDRPONDR®VSL2 = 29.21% and ADSPONDR®VSL2 = 0.40±0.26, isoform 2 (784 residues) differs from the canonical form by missing regions 1-171, 740-986, and 1203-1957 and changes in the 1112-1202 region from DEPTSPKRPKSISEPQHSDAEGDAASPLPSEWTSVRISPGEEAAGQDVLAVRVLVTSEDSSSDTESDYG GSEGSHTEPCEEKPWRPGSPHL to GISTSFFRKVLGWPLRLPRDLCNWMQGLLQAAGLHIRDNAYNYCYMYELLSLGLPLLWAFSEVLAAMYRESEGSLESICNWVLRCFPVK LR. Residues 929-949 and 1125-1957 are missing in the isoform 3, which also has DEPTSPKRPKSIS → VHFSLPVLHPLLG replacement in region 1112-1124.
This isoform contains 1103 residues and is characterized by PPIDRPONDR®VSL2 = 38.53% and ADSPONDR®VSL2 = 0.45±0.27. In isoform 4 (979 residues), regions 740-929, 950-985, and 1203-1957 are missing, whereas the 1112-1202 region is changed similarly to change found in isoform 2. This isoform has PPIDRPONDR®VSL2 = 29.77% and ADSPONDR®VSL2 = 0.38±0.26. With the length of 934 residues, PPIDRPONDR®VSL2 = 29.23%, and ADSPONDR®VSL2 = 0.40±0.25, isoform 5 is different from the canonical form by missing regions 740-929 and 112-1957 and having changes in the 1112-1124 region identical to those found in isoform 3. Finally, isoform 6 (955 residues, PPIDRPONDR®VSL2 = 26.39%, and ADSPONDR®VSL2 = 0.37±0.26) has changed 1112-1202 region, which is identical to those of isoforms 2 and 4 and is missing regions 740-986 and 1203-1957. Similar to MICAL1, alternative splicing affects the LLPS potential of human MICAL2, as based on their pLLPS values the seven isoforms can be arranged as MICAL2-4 (0.2433) < MICAL2-2 (0.2540) < MICAL2-6 (0.2352) < MICAL2-5 (0.3923) < MICAL2-1 (0.5744) < MICAL2-3 (0.6380) < MICAL2-7/canonical (0.9946). Therefore, only two alternatively spliced MICAL2 isoforms, 2 and 7, are capable of spontaneous LLPS and can act droplet drivers. Although the probabilities of spontaneous LLPS of the five remaining isoforms are below the 0.6 threshold, all of them contain DPRs and therefore can serve as droplet clients.
Although D2P2 does not have information about the canonical form of human MICAL2, it contains the functional disorder profile of the alternatively spiced isoform 1, which is missing a very significant portion of the highly disordered C-terminal half of the canonical form. Figure 2D shows functional disorder profile for this truncated form. Despite missing most of the C-terminal IDR, this isoform still shows a high level of intrinsic disorder, where almost half of the protein is predicted to be intrinsically disordered. This long IDR contains multiple disorder-based ninding sites, MoRFs, and various PTM sites.
In line with high levels of predicted disorder Figure 2D represents the 3D structural model of MICAL2 and shows the presence of a substantial number of regions with low and very low per-residue confidence score values, which are mostly concentrated toward the C-terminus of the protein, whereas structure of the N-terminal region is predicted with very high confidence.
STRING-based analysis revealed that human MICAL2 forms a PPI network containing 17 nodes linked by 35 edges, which is larger than the 19 expected edges (see Figure 2E). Since the enrichment p-value of this network is 0.000439, it has more interactions than expected. Although the average node degree is 4.12, the network is characterized by the average local coefficient of 0.88. Analysis of functional enrichment of the members of the MICAL2-centered network revealed that among the 24 significantly enriched biological processes are vesicle docking involved in exocytosis (GO:0006904; p = 7.29×10⁻⁶), Golgi vesicle fusion to target membrane (GO:0048210; p = 5.07×10⁻⁵), regulation of exocytosis (GO:0017157; p = 5.07×10⁻⁵), protein secretion (GO:0009306; p = 0.00012), and actin cytoskeleton organization (GO:0030036; p = 0.00029). The most enriched molecular functions are GTPase activity (GO:0003924; p = 0.00097), GTP binding (GO:0005525; p = 0.0014), GDP binding (GO:0019003; p = 0.0156), nucleotide binding (GO:0000166; p = 0.0156), and NAD(P)H oxidase H2O2-forming activity (GO:0016174; p = 0.0157). The members of this network are most abundantly found in insulin-responsive compartment (GO:0032593; p = 0.00024), recycling endosome (GO:0055037; p = 0.00053), recycling endosome membrane (GO:0055038; p = 0.00058), synaptic vesicle (GO:0008021; p = 0.00058), and endosome (GO:0005768; p = 0.00058). Finally, the most enriched pathways from the REACTOME database are RAB geranylgeranylation (HSA-8873719; p = 6.67×10⁻⁶), RAB GEFs exchange GTP for GDP on RABs (HSA-8876198; p = 0.0012), translocation of SLC2A4 (GLUT4) to the plasma membrane (HSA-1445148; p = 0.0190), Spry regulation of FGF signaling (HSA-1295596; p = 0.0403), and post-translational protein modification (HSA-597592; p = 0.0403).
2.1.3. [F-actin]-Monooxygenase MICAL3 (UniProt ID: Q7RTP6)
Similar to other members of the MICAL family of proteins, MICAL3 is a flavoprotein monooxygenase involved in the redox-mediated F-actin disassembly, and, in the absence of actin, it also produces H2O2, functioning as a NADPH oxidase. MICAL3 operates as RAB effector protein and is crucial for the regulation of complexes involved in vesicular trafficking. This protein is a central player in the pathways regulating the transport of vehicles from Golgi apparatus to plasma membrane, serving as a linker between RAB8A and ESKL [50]. The monooxygenase enzymatic activity of protein is crucial for vesicular docking and fusion, as the mutated form of protein with an inactive monooxygenase domain leads to the accumulation of unfused vesicles [50]. It was emphasized that MICAL3 (and MICAL-L1, see below) are involved in cell division, but this action does not involve oxidoreduction, as the role of MICAL3 during cytokinesis does not require redox activity, as MICAL3 does not regulate actin levels during cytokinesis [51]. Instead, the Rab8A-positive vesicles are tethered to the midbody via direct interaction of MICAL3 with the centralspindlin component mitotic kinesin-like protein 1 (MKLP1 (also known as kinesin-like protein 5 or kinesin-like protein KIF23) and recruiting the adaptor protein ELKS/Rab6-interacting/CAST family member 1 (ERC1) [51].
Human MICAL3 is a 2002-residue-long protein encoded by MICAL3 gene. It includes the monooxygenase domain (residues 1-494), CH domain (residues 518-621), LIM domain (residues 762-824), a ProQ domain (residue 1627-1721), and CC/RBD (residues 1841-2002), which is also classifies as bMERB domain acting as a Rab effector domain. Furthermore, MICAL3 contains a nuclear localization signal (residues 663-684) and multiple PTM sites that are spread throughout the protein, such as serine phosphorylation at 509, 649, 687, 977, 1134, 1143, 1160, 1192, 1274, 1278, 1310, 1337, 1371, 1384, 1433, 1649, 1701, 1704, and 1912, as well as threonine phosphorylation at positions 887, 1276, 1341, 1454, and 1651. As per UniProt annotations, there are several long IDRs in this protein (residues 658-706, 835-883, 907-1313, 1335-1776, and 1791-1821), and these IDRs are characterized by excessive compositional biases containing polar, basic, and acidic residues or enriched in proline residues (e.g., 1239-1258 and 1456-1467 segments).
Figure 3 shows that human MICAL3 is expected to contain high levels of disorder. For example, Figure 3A shows the RIDAO plot illustrating the disorder profile of this protein, where the structure from the middle of protein towards the C terminus (residues 829-2002) is highly disordered. PPIDR values calculated from the outputs the predictors included to RIDAO, PONDR® VLXT, PONDR® VSL2, PONDR® VL3, IUPred Short, IUPred long, PONDR® FIT, and MDP, are 60.59%, 67.83%, 63.34%, 47.85%, 54.8%, 59.44%, and 60.28%, respectively, clearly classifying human MICAL3 as a highly disordered protein. Furthermore, ANCHOR-2 analysis showed that MoRF regions (i.e., regions with the ability to undergo disorder to order transition upon binding with their partner [52]) are abundant within the disordered segments of this protein and can be found at the following positions: 650-662, 697-726, 858-1344, 1354-1502, 1508-1553, and 1558-1707, 1725-1751, 1771-1805, and 1848-1853.
The results of the FuzDrop-based analysis of human MICAL3 are shown in Figure 3B that clearly indicates that this protein has a very high ability to LLPS. In fact, its pLLPS value of 0.9993 suggests that human MICAL3 can serve as a droplet driver, cotrolling the process of MLO formation. FuzDrop analysis predicts the existence of 12 DPR (residues 1-12, 70-81, 587-612, 645-706, 822-891, 897-1322, 1329-1586, 1598-1775, 1788-1819, 1834-1844, 1875-1890, and 1982-2002). There are 34 short aggregation spots that are scattered through the 2/3 of the C-terminal part of protein sequence. The protein is also predicted to contain almost 50 regions with context-dependent interactions (i.e., regions that change interaction behavior and binding modes under different cellular conditions) (see Figure 3C), supporting the ANCHOR-2-based analysis that revealed the MoRFs cover 47.1% of the MICAL3 sequence. This is further supported by Figure 3D presenting the D2P2-genearted functional disorder profile of this protein, where a very significant portion of a protein (~60%) is shown to be disordered and highly decorated with multiple PTMs, that are likely to modulate binding activities of numerous MoRFs found in this protein.
Additional support for the highly disordered nature of human MICAL3 is given by Figure 3E representing the 3D stricture of this protein modeled by AlphaFold. This predicted structure has the pLDDT confidence score of 58.13, which is further reflected in the fact that most of the protein is shown in form of “orange noodles” which represent regions with very low pLDDT values (below 50) that are expected to be unstructured in isolation.
Five MICAL3 isoforms are generated by alternative splicing. Canonical isoform is 2002-residue long and is characterized by PPIDRPONDR®VSL2 = 67.83%, ADSPONDR®VSL2 = 0.69±0.32, and pLLPS = 0.9993. MICAL3-2 (948 residues) is missing C-terminal half (residues 949-2002) and has 934-948 region changed from SSSESEMEEEGEEEE to RSARRAAGRPPATRP. This isoform is characterized by PPIDRPONDR®VSL2 = 32.59%, ADSPONDR®VSL2 = 0.42±0.26, and pLLPS = 0.5798. The MICAL3-3 isoform (976 residues), which in addition to the sequence changes found in MICAL2-2 has R → RQLTQERGASQPSCCLPGQVRPAPTPRWK change at position 746, shows PPIDRPONDR®VSL2 = 35.45%, ADSPONDR®VSL2 = 0.43±0.26, and pLLPS = 0.6162. In the MICAL2-4 isoform (966 residues), region 967-2002 is missing, whereas region 934-966 is changed from SSSESEMEEEGEEEEEEPRLPPSDLGGVPWKEA to RDWVSPWLPRMVSNS WAQMIHPPQPPTVLGSQM, resulting in PPIDRPONDR®VSL2 = 32.40%, ADSPONDR®VSL2 = 0.41±0.24, and pLLPS = 0.5957. Finally, MICAL3-5 isoform (1073 residues) has most alterations in the sequence, as it is missing the C-terminal region (residues 950-2002), has changed 971-949 region from GVNGLEEPSIAKRLRGTPERIELENYRLSLRQAEALQEVPEETQAEHNLSSVLDTGAEEDVASSSSE S EMEEEGEEEEE to LTSLFGWVARHSLGLCDKAKGMSQHLQSNISSFGQQVAQNPLDS FFMCQLLAFGVPFLYGLSEVLVQIRGEFHWQAVAQ, and Q to QQREKECSRTCPKK VITLSPPPTPPPCRAHGGQQTYRDLDADNRGKQSPHHERPEPEPPRRFFVDQWELSLS LRSSARPASPSSDSLRQKYIKMYTGGVSSLAEQIANQLQRKEQPKALLDKKEL change at position 747. This isoform is characterized by PPIDRPONDR®VSL2 = 36.16%, ADSPONDR®VSL2 = 0.43±0.26, and pLLPS = 0.5957.
Figure 3F shows that MICAL3 interacts with 31 partners and forms a relatively dense PPI network characterized by the average local clustering coefficient of 0.853 and containing 32 nodes connected by 89 edges (average node degree is 5.56). Since the expected number of edges for the random network of this size is 36, this MICAL3-centerd network has significantly more interactions than expected (PPI enrichment p-value is 3.79×10⁻¹⁴). Proteins in this PPI network are involved in the following biological processes: Golgi vesicle transport (GO:0048193; p = 4.57×10⁻⁷), vesicle-mediated transport (GO:0016192; p = 4.57×10⁻⁷), cellular component organization (GO:0016043; p = 4.57×10⁻⁷), endosomal transport (GO:0016197; p = 1.02×10⁻⁵), and neuron projection development (GO:0031175; p = 1.41×10⁻⁵). Among the most significantly enriched molecular functions of these proteins are GTPase activity (GO:0003924; p = 1.06×10⁻⁸), nucleoside-triphosphatase activity (GO:0017111; p = 2.95×10⁻⁸), GTP binding (GO:0005525; p = 2.99×10⁻⁷), semaphorin receptor activity (GO:0017154; p = 5.60×10⁻⁶), and anion binding (GO:0043168; p = 0.00011). These proteins are most significantly enriched in the following cellular components GO:0005794 (Golgi apparatus; p = 1.78×10⁻⁷), transport vesicle (GO:0030133; p = 1.09×10⁻⁶), exocytic vesicle (GO:0070382; p = 2.30×10⁻⁶), semaphorin receptor complex (GO:0002116; p = 3.93×10⁻⁶), and recycling endosome membrane (GO:0055038; p = 4.86×10⁻⁶). Finally, the most enriched pathways from the REACTOME database associated with the members of the MICAL3-centered PPI are RAB geranylgeranylation (HSA-8873719; p = 4.65×10⁻¹⁴), RAB GEFs exchange GTP for GDP on RABs (HSA-8876198; p = 3.68×10⁻¹¹), membrane trafficking (HSA-199991; p = 2.59×10⁻¹⁰), SEMA3A-Plexin repulsion signaling by inhibiting Integrin adhesion (HSA-399955; p = 6.53×10⁻⁶), and Sema3A PAK dependent Axon repulsion (HSA-399954; p = 8.84×10⁻⁶).
2.1.4. Human MICAL-Like Protein 1 (MICAL-L1; UniProt ID: Q8N3F8)
By modulating the actin cytoskeleton, human molecule interacting with CasL-like1 (MICAL-L1 protein, which is also known as MIRab13 for molecule interacting with Rab13) is involved in the extension and guidance of neurites, which are the extensions of neurons that form synapses and facilitate communication between nerve cells [9,53,54]. Furthermore, being a lipid binding protein, MICAL-L1 shows higher affinity for phosphatidic acid, which is enriched in recycling endosome membranes. C-terminus of the protein contains two hydrophobic residues through which the protein binds to the phosphatidic acid, and this interaction is vital for the anchoring of MICAL-L1 to the membrane structure and can also influence its role in membrane cargo trafficking [55]. As a result, MICAL-L1 is recruited to the endosome membranes, where it acts as a downstream effector of Rab proteins engaging cytosolic proteins to regulate membrane tubulation [55-58]. MICAL-L1 acts as one of the Rab8 effectors, regulates receptor recycling and recruits Rab8 and EH-domain containing protein 1 (EHD1) to tubular RE membranes that emanate from the perinuclear region [58]. MICAL-L1 also plays a role in endosomal functions, being involved in the late stages of the endocytosis. MICAL-L1 is localized to the tubular membranes and the C-terminal of the protein has coiled-coil region, necessary for this localization that plays an important role in the recycling of receptors and lipids [58]. The protein interacts with EDH1 that acts as a key regulator of endocytosis. Both proteins colocalize to the tubular membrane, indicating functional role in endocytic recycling. Depleting MICAL-L1 has consequences on the endocytic recycling process, it leads to the disruption of normal processing of these functions, suggesting the protein is integral to maintain the function of protein complexes in tubular membranes [58]. Along with this, the depletion also results in the loss of the interaction of Rab8a and EDH1 protein and their absence in tubular membrane [58]. By recruiting EHD1 to primary cilium where it is anchored to the centriole through interaction with tubulins, MICAL-L1 plays a role in ciliogenesis coordination [59].
MICAL-L1 is also crucial for the remodeling of the elongated tubular endosomal network (ETEN) that originates from endosomal recycling compartment in human dendritic cells in response to specific stimuli [59]. ETEN remodeling is very important for the stable delivery of membrane proteins to their designated locations, and is crucial for the antigen presentation and activation of T-cells pointing out the role of MICAL-L1 in immune response [60]. Furthermore, MICAL-L1 regulates endocytosed-EGF receptor trafficking [61], slow endocytic recycling of endocytosed proteins back to the plasma membrane [58], and in cargo protein delivery to the plasma membrane [55].
MICAL-L1 protein is 863-residue-long, which is encoded by the MICALL1 gene. Despite its multifunctionality, MICAL-L1 is a mostly uncharacterized member of the MICAL family containing an N-terminal CH domain (residues 2-108), a LIM domain (residues 162-225, two NPF motifs possessing asparagine-proline-phenylalanine sequences (residues 425-427 and 633-635), bMERB domain (residues 671-818), and C-terminal CC domain (residues 785-830) [58]. The bMERB domain is present in the MICAL family and EH domain-binding protein (EHBP) family, both playing a role in the endosomal trafficking [62]. Region 652-863 is known to mediates the interaction of MICAL-L1 with RAB13 and RAB35 and intramolecular interaction with the CH domain with two coiled-coil regions (residues 682-711, and 785-830) [61,63], whereas 700-863 region, which is necessary and sufficient to associate with tubular recycling endosome membranes, is known to mediate phosphatidic acid-binding and membrane tubulation [56]. There is also a long IDR (residues 224-670) containing multiple low complexity regions and regions with composition bias in human MICAL-L1. The protein contains serine phosphorylation sites at positions 295, 309, 318, 391, 471, 484, 578, 621, and 740.
Figure 4A represents the RIDAO-generated disorder profile of human MICAL-L1 and shows that this protein is predicted to have a long IDR located in the middle (residues 201-695). Therefore, it is not surprising that PPIDR values evaluated from the outputs of PONDR® VLXT. PONDR® VSL2, PONDR® VL3, IUPred Short, IUPred long, PONDR® FIT, and MDP mounts to 75.9%, 78.1%, 77.64%, 63.27%, 66.16%, 65.7%, and 70.57%, respectively. Figure 4A also shows that MICAL-L1 contains four MoRF regions (residues 136-149, 227-473, 478-686, and 837-855) predicted by ANCHOR-2, indicating that almost entire central IDR can serve as a protein binding platform. In line with these consideration, it was shown that MICAL-L1 acts as a hub connecting Rab8, Rab10, Rab35, Arf6, Eps15 homology domain protein 1 (EHD-1), and syndapin2 (an F-BAR protein) required for the formation and maintenance of endosomal tubules [56,63-66].
As per FuzDrop analysis, MICAL-L1 is characterized by a very high PLLPS value of 0.9990, suggesting that this protein has a strong tendency to undergo spontaneous LLPS and to form droplets (see Figure 4B). MICAL-L1 is predicted to contain 4 DPRs (residues 109-166, 219-669, 673-689, and 825-863) and 10 aggregation hot spots (residues 117-122, 159-166, 238-245, 316-337, 372-378, 429-435, 661-669, 673-682, 711-716, and 825-836) located within the DPR regions. Figure 4C indicates that MICAL-L1 has 15 regions with context-dependent interactions, with longest spanning regions at 159-179, 316-337, 661-682, 700-730, and 819-836. Figure 4D shows that the central intrinsically disordered region of this protein is predicted to have multiple PTMs and MoRFs. The AlphaFold predicted structure of human MICAL-L1 has pLLDT value of around 52% and contains a very significant number of “orange noodles”, reflecting high disorder content of this protein (see Figure 4E).
STRING analysis predicted 119 nodes and 3891 interactions for human MICAL-L1 with p-value of <1.0×10⁻¹⁶, indicating that this network is statistically significant. High degree of connectivity is indicated by an average node degree of 65.4 (see Figure 4F). The numbers of edges and nodes in MICAL-L1-centered network are higher than those in MICAL1, MICAL2, and MICAL3 networks. Curiously, it seems that the number of predicted nodes and interaction in MICAL PPI networks are proportional to the disorder status of the protein, suggesting that the interactivity of MICALs correlates with their flexibility or intrinsic disorder content. Proteins in MICAL-L1-centered PPI network are involved in the following biological processes: translation (GO:0006412; p = 2.75×10-85), cytoplasmic translation (GO:0002181; p = 1.20×10-71), organonitrogen compound biosynthetic process (GO:1901566; p = 2.55×10-51), cellular nitrogen compound biosynthetic process (GO:0044271; p = 3.97×10-48), and gene expression (GO:0010467; p = 2.28×10-40). The most enriched molecular functions include structural constituent of ribosome (GO:0003735; p = 8.50×10-55), RNA binding (GO:0003723; p = 8.73×10-40), translation initiation factor activity (GO:0003743; p = 7.21×10⁻³⁰), structural molecule activity (GO:0005198; p = 1.22×10⁻²⁹), and translation regulator activity (GO:0045182; p = 5.09×10⁻²⁹). Cellular components associated with members of this network are small ribosomal subunit (GO:0015935; p = 6.09×10-64), cytosolic small ribosomal subunit (GO:0022627; p = 1.82×10-57), ribosomal subunit (GO:0044391; p = 1.21×10-55), ribosome (GO:0005840; p = 1.33×10-55), and ribonucleoprotein complex (GO:1990904; p = 4.51×10-55). The most enriched KEGG pathways are ribosome (hsa03010; p = 2.06×10-58), RNA transport (hsa03013; p = 4.73×10⁻¹⁵), and endocytosis (hsa04144; p = 3.67×10⁻¹⁰). Among the 46 most enriched pathways from the REACTOME database are formation of the ternary complex, and subsequently, the 43S complex (HSA-72695; p = 2.20×10-80), ribosomal scanning and start codon recognition (HSA-72702; p = 2.20×10-80), translation initiation complex formation (HSA-72649; p = 9.31×10-79), GTP hydrolysis and joining of the 60S ribosomal subunit (HSA-72706; p = 2.39×10-74), and translation (HSA-72766; p = 3.42×10-73).
2.1.5. MICAL-L2 (MICAL-LIKE 2 or JRAB; UniProt ID: Q8IY33)
Molecule interacting with CasL-like 2 (MICAL-L2), which is also known as junctional Rab13-binding protein (JRAB), plays an important role in cell adhesion and cell spreading and contributes towards the neurite growth [67]. The role of MICAL-L2 in neurite growth is context-dependent, as this protein can both inhibit and promote neurite outgrowth. For example, although the neurite outgrowth is inhibited by expression of MICAL-L2/JRAB alone, this inhibitory effect is reversed by coexpression of MICAL-L2/JRAB with the dominant active form of Rab13 [67]. The process of neurite outgrowth regulation involves interaction with a small G protein Rab13, which stimulates the interaction of MICAL-L2/JRAB with actinin-4, an actin-binding protein localizes to the cell body and the tips of the neurites, suggesting that Rab13 and MICAL-L2/JRAB may act to transfer actinin-4 from the cell body to the tips of neurites, where it is involved in the reorganization of the actin cytoskeleton which results in neurite outgrowth [67]. When bound to Rab13, MICAL-L2/JRAB induces membrane ruffles [68]. Being an effector protein for Rab13, MICAL-L2/JRAB regulates the endocytic recycling of tight junctional cell adhesion molecule occludin and controls the adhesion and repulsion of epithelial cells [69]. The spatiotemporal regulation of actin cytoskeleton during collective cell migration is linked to the ability of MICAL-L2/JRAB to undergo a conformational change between its closed and open forms depending on the association with Rab13 [70].
MICAL-L2/JRAB protein is involved in tubulation of recycling endosomes directly and is activated by Rab8A [71]. MICAL-L2/JRAB protein induce liquid-liquid phase separation to drive the segregation of cytoplasmic contents to form compartment of distinct phases, a process critical for the regulation of tubular recycling endosomes [71]. The intrinsically disordered region located between the globular N- and C-terminal domains is important for the formation of condensates as it promotes the LLPS process [71]. The interaction of MICAL-L2/JRAB with Rab8A induces formation of a closed MICAL-L2/JRAB form (in which the N-terminal CH and LIM domains interact with the C-terminal CC domain) functioning in the tubulation of recycling endosomes. These data indicate that the biogenesis of tubular recycling endosomes involves two sequential MICAL-L2/JRAB-dependent steps, where the LLPS is first driven by MICAL-L2/JRAB and then the endosomal tubulation is promoted by the closed form of MICAL-L2/JRAB formed by interaction with Rab8A [71]. By forming the distinct Rab8-MICAL-L2/ JRAB and Rab13-MICAL-L2/JRAB complexes, MICAL-L2/JRAB coordinates the assembly of adherens junctions (AJs) and tight junctions (TJs), respectively [72]. Furthermore, MICAL-L2/JRAB was shown to control the transport of claudins, occludin, and E-cadherin to the plasma membrane (PM), as well as Rab8 regulated the Rab13-independent transport of E-cadherin to the PM [72].
MICAL-L2 is highly expressed and promotes cell migration and invasion in several cancer types, such as gastric cancer [73], ovarian cancer [74], breast cancer [75], lung cancer [76], and colon cancer [77]. The molecular mechanisms of MICAL-L2/JRAB involvement in different cancers is very diverse and depend on the cancer type. For example, MICAL-L2/JRAB is upregulated in ovarian cancer, which is a cancer with the highest mortality rate among the gynecologic malignancies [74]. Silencing the expression of MICAL-L2/JRAB prevents the proliferation and invasion of the cancerous cells, suggesting the role of the MICAL-L2/JRAB in the aggressive behavior of malignant cells [74]. The mutation of MICAL-L2/JRAB hindered the translocation of β-catenin to the nucleus, which stimulates the β-catenin/Wnt signaling pathway involved in the cell proliferation and migration, suggesting the possible involvement of MICAL-L2/JRAB protein in the ovarian cancer progression through the modulation of this pathway [75]. In breast cancer, MICAL-L2/JRAB interacts with DENN domain-containing protein 2B (DENND2B) leading to the localization of this protein to the cell surface, where it selectively activates Rab13 on membrane ruffles, at the dynamic leading edge of migrating cells required for cell migration and invasion [75]. Proliferation of lung cancer cells is facilitated by MICAL-L2/JRAB via the de-ubiquitination of c-Myc thereby blocking its degradation [76].
MICAL-L2/JRAB is involved in directing the cells to move together in groups by changing its conformation [70]. Therefore, the impaired conformational plasticity of this protein can disturb the group migration of cells and result in the loss of directionality [70]. MICAL-L2/JRAB is highly disordered as in the AlphaFold structure, most of the protein is highly unstructured. This high level of disorder may allow the conformationally flexible protein to govern the cells to migrate as single units [70].
MICAL-L2/JRAB is a 904-residue-long protein encoded by the MICALL2 gene. Similar to other MICAL proteins MICAL-L2/JRAB contains CH domain (residues 1-107, which is typically found in protein families involved in the actin binding, suggesting the role of protein in actin dynamic [78]), LIM domain (residues 186-248), bMERB domain (residues 723-874), CC domain (residues 735-771), and a regions mediating interaction with RAB13 required for transition from the closed to the opened conformation (residues 807-903). This protein also has a long IDR (residues 251-722) containing a multitude of segments with compositional bias, such as low complexity segments and segments enriched in proline residues, or segments with polar or basic and acidic residues.
Figure 5A shows that with PPIDR values of 72.01%, 79.98%, 78.1%, 61.39%, 65.71%, 71.9%, and 74.78% derived from the outputs of PONDR® VLXT, PONDR® VSL2, PONDR® VL3, IUPred Short, IUPred long, PONDR® FIT, and MDP, respectively, human MICAL-L2 is predicted as a highly disordered protein. In fact, this is the most disordered member of the human MICAL family. This protein has four MoRF regions (residues 132-168, 174-180, 249-270, and 276-740), that cover 58.7% of its sequence, suggesting that the human MICAL-L2 interactivity relies on intrinsic disorder and disorder-to-order transitions.
In line with the established capability of human MICAL-L2/JRAB to undergo LLPS and drive the formation of cellular biomolecular condensates [71], Figure 5B represents the results of the FuzDrop analysis revealing that most of the MICAL-L2/JRAB residues have a pDP value above 0.6, so it is indeed a droplet driver with the pLLPS value of 0.9997. This protein is predicted to contain the following droplet-promoting regions along its length: 107-185, 222-233, 245-674, 679-737, and 893-904. It also has 13 aggregation hot spots, with the most noticeable being 172-185, 265-281, 444-469, 578-597, and 679-700 (see Figure 5B).
Furthermore, Figure 5C indicates that the interactivity of human MICAL-L2/JRAB is expected to be dependent on cellular context, as it has a plethora of regions with the context dependent interactions that are scattered along the length of the protein. These regions are expected to behave differently based on the cellular environment and their binding partners, adding a layer of flexibility towards the adaptability of protein. Prevalence of functional intrinsic disorder in this protein is further illustrated by Figure 5D showing D2P2 disorder profile, where one can find multiple MoRFs and PTM sites within the central disordered region. Figure 5E provides another view of high intrinsic disorder content of human MICAL-L2/JRAB showing its AlphaFold-generated 3D structural model, which clearly contains a multitude of regions with very low pLDDT.
Human MICAL-L2 exists in five alternatively spliced isoforms. Canonical isoform is 904-residue long and is characterized by PPIDRPONDR®VSL2 = 79.98%, ADSPONDR®VSL2 = 0.78±0.28, and pLLPS = 0.9997. Isoform 2, which is 680-residue-long, has altered 1-48 and 656-904 regions, which are changed to MFLSSR and GPPPHPAAGDWPSLPASTFVTTGFGRSPLARKPECRAGRRRRRN LTFRANQGDPCPRPMSLLCLARR. As a result, this isoform has PPIDRPONDR®VSL2 = 84.41%, ADSPONDR®VSL2 = 0.82±0.25, and pLLPS = 0.9998. In isoform 3, the 1-570 region is changed to MALSSWAQGTSWAAKGFSRSFSLAEFS LLKPRAGSCRTQEPRKPADGQPWLRCSPCTGGQRIWVHGAHPATSPPIRQKGKLRPR GRESFPQGHTAQESQLGAPPLTPCPVLLMPPGRLAVGVSEGGVAMGRWQGEAQPPL QTPHSQHSFLTPRPLASHP, leading to PPIDRPONDR®VSL2 = 95.33%, ADSPONDR®VSL2 = 0.82±0.15, and pLLPS = 0.9974. Isoform 4 (572 residues) is generated by replacing the 571-904 region to GE. It is characterized by PPIDRPONDR®VSL2 = 72.38%, ADSPONDR®VSL2 = 0.74±0.32, and pLLPS = 0.9996. Finally, region 290240 is missing in isoform 5 (692 residues), which has PPIDRPONDR®VSL2 = 92.49%, ADSPONDR®VSL2 = 0.86±0.20, and pLLPS = 0.9996. Therefore, all isoforms of human MICAL-L2 are highly disordered and all are characterized by very high LLPS potential, suggesting that all of them can be related to the regulation of the biogenesis of cellular MLOs.
Figure 5F represents the STRING-generated PPI network centered at human MICAL-L2. The network includes 17 proteins involved in the 35 interactions. Although this network is not large (the average node degree is 4.12), it is characterized by the high average local clustering coefficient of 0.824. Since the expected number of edges for the random network of similar size is 18, the MICAL-L2 has significantly more interactions than expected (PPI enrichment p-value is 0.000175). The interaction of MICAL-L2 with actinins ACTN1, ACTN2, and ACTN4 (which are the F-actin cross-linking proteins anchoring actin to a variety of intracellular structures) highlights the involvement of this protein in the cytoskeleton organization, and actin remodeling.
Proteins in this MICAL-L2-centered PPI network are involved in the following biological processes: vesicle docking involved in exocytosis (GO:0006904; p = 6.36×10⁻⁶), vesicle-mediated transport to the plasma membrane (GO:0098876; p = 6.36×10⁻⁶), regulation of exocytosis (GO:0017157; p = 6.36×10⁻⁶), endosomal transport (GO:0016197; p = 6.36×10⁻⁶), and vesicle-mediated transport (GO:0016192; p = 6.36×10⁻⁶). The most enriched molecular functions include GDP binding (GO:0019003; p = 1.86×10⁻⁷), GTPase activity (GO:0003924; p = 2.64×10⁻⁷), GTP binding (GO:0005525; p = 7.31×10⁻⁷), myosin V binding (GO:0031489; p = 0.00025), and cytoskeletal protein binding (GO:0008092; p = 0.00033). Cellular components where these proteins are most significantly localized include cell junction (GO:0030054; p = 2.86×10⁻⁸), recycling endosome membrane (GO:0055038; p = 1.69×10⁻⁷), recycling endosome (GO:0055037; p = 1.69×10⁻⁷), synaptic vesicle (GO:0008021; p = 1.72×10⁻⁷), and secretory vesicle (GO:0099503; p = 8.84×10⁻⁷). The most enriched KEGG pathway is tight junction (hsa04530; p = 1.12×10⁻⁶). Among the most enriched pathways from the REACTOME database are RAB geranylgeranylation (HSA-8873719; p = 1.28×10⁻¹²), RAB GEFs exchange GTP for GDP on RABs (HSA-8876198; p = 6.84×10⁻¹²), membrane trafficking (HSA-199991; p = 1.03×10⁻⁸), nephrin family interactions (HSA-373753; p = 0.00052), and platelet activation, signaling and aggregation (HSA-76002; p = 0.00075).
2.2. Global Analysis of the Interactome of Human MICAL Proteins
Next, we checked the interactability of human MICAL proteins among themselves. This analysis revealed that at the used STRING setting (the threshold of 0.400 (medium confidence) for minimum required interaction score), MICAL1 interacted with MICAL2, MICAL3, and MICAL-L2, whereas MICAL-L1 was not included in the intra-set interactions. Then, we analyzed the global interactability of human MICALs by building their common interactome. This analysis revealed that the joint network of human MICALs includes 174 nodes connected by 4262 edges. The average node degree is 49, indicating that each individual protein in this PPI network is interacting with 49 other proteins. Since the expected number of edges for the random network of similar size is 1095, the PPI network centered at five human MICALs has significantly more interactions than expected (PPI enrichment p-value is <10-16). The average local clustering coefficient is 0.738, which means that the network tends to make clusters, as shown in Figure 6A.
In fact, applying the STRING-embedded k-means clustering protocol that finds a defined number of clusters based on their centroids found three distinct clusters in this network. Here, cluster 1 includes 127 members involved in the formation of the ternary complex, and subsequently, the 43S complex as well as in the cytoplasmic translation. The 31 members of the cluster 2 are involved in RAB GEFs exchange GTP for GDP on RABs and in Rab subfamily of small GTPases, whereas 16 members of cluster 3 are related to the semaphorin-plexin signaling pathway involved in neuron projection guidance, SEMA3A-plexin repulsion signaling by inhibiting integrin adhesion, and semaphorin receptor complex. Functional enrichment of the members of this network in term of GO terms associated with biological processes, molecular functions, and cellular components are shown Figures 6B, 6C, and 6D, respectively, whereas Figure 6D represents REACTOME pathways enrichment.
Although MICAL-L1 does not directly interact with other members of MICAL family, it is well-integrated into the joint MICAL network via its interactors. Since the number of nodes in this joint MICAL network (174) is smaller than the sum of the nodes in the PPI networks centered at the individual MICALs (35 + 17 + 32 + 119 + 17 = 220), the joint network contains 46 shared partners. Among partners shared by all five MICALs are NEDD9, RAB10, RAB13, RAB8A, and RAB8B. RAB15 is shared by MICAL1, MICAL2, MICAL3, and MICAL-L1. RAB35 is shared by MICAL1, MICAL3, MICAL-L1, and MICAL-L2. MICAL1, MICAL2, and MICAL3 share PLXN4. MICAL1 and MICAL3 share PLXNA1, PLXNA2, PLXNA3, RAB1A, RAB1B, and RAB6A, whereas MSRB1 is shared by MICAL1 and MICAL2, whereas EHD1 interacts with MICAL1 and MICAL-L1.
2.3. Global Analysis of the Prevalence of Intrinsic Disorder in MICAL Interactome
At the next stage, we evaluated the global prevalence of intrinsic disorder in proteins interacting with human MICALs. Figure 7 represents the results of this analysis and shows that these proteins are characterized by various levels of intrinsic disorder, being, in general, not very different from those observed in the entire human proteome. In fact, based on the seven per-residue disorder predictors used in this study (PONDR® VLXT, PONDR® VSL2, PONDR® VL3, PONDR® FIT, IUPRed_Short, IUPRed_Long, and MDP), the MICAL-interacting proteins are characterized by the mean PPIDR values of 36.5±17.5%, 38.7±22.7%, 34.2±24.2%, 28.7±19.4%, 19.9±14.7%, 20.5±19.5%, and 26.6±21.9%, respectively, in comparison with 34.1±20.3%, 43.6±26.2%, 36.6±29.0%, 30.4±24.0%, 21.2±19.3%, 22.8±24.8%, and 28.3±26.3% evaluated for the entire proteome. The mean ADS values of MICAL interactors are 0.38±0.13, 0.46±0.13, 0.41±0.15, 0.36±0.13, 0.29±0.10, 0.33±0.13, and 0.36±0.13, whereas the members of the human proteome are characterized by the mean ADS values of 0.36±0.17, 0.48±0.19, 0.42±0.19, 0.37±0.17, 0.28±0.14, 0.31±0.18, and 0.36±0.17. Based on the Mann-Whitney rank sum test, the observed difference in the median PPIDRMDP values between the MICAL-interacting proteins and members of the human proteome is not a statistically significant (P = 0.784); i.e., the difference is not great enough to exclude the possibility that the difference is due to random sampling variability. Similarly, difference between the ADSMDP values between these two groups are not statistically significant as well (P = 0.295).
Figure 8A provides another way to look at the global disorder predisposition of the MICAL-interacting by showing the PONDR® VSL2 score (ADS) vs. PONDR® VSL2 (%) (PPIDR) plot. Typically, PPIDR values are used to classify proteins as highly ordered, moderately disordered, and highly disordered, if their corresponding PPIDR values are below 10%, between 10% and 30%, and above 30%, respectively [79,80]. An additional angle is provided by the analysis of the protein ADS values that provides another means for protein classification as highly ordered, moderately disordered/flexible, or highly disordered if their ADS < 0.15, 0.15 ≤ ADS < 0.5, and ADS ≥ 0.5. Based on these criteria, the vast majority of MICAL interactors are clearly classified as moderately or highly disordered by PONDR® VSL2, and none of these proteins are predicted as highly ordered by both ADS and PPIDR (as none of the proteins is located in dark blue area). This analysis also shows that more than half of these proteins (56.9%) are predicted as highly disordered. For comparison, the analogous analysis of the entire human proteome (20,317 proteins) revealed that 0.4%, 5.1%, 33.7%, 21.0%, and 39.8% proteins were located within dark blue, cyan, dark pink, light pink, and red areas, respectively [81]. Therefore, with their 0.0% – 1.2% – 41.9% – 22.2% – 34.7% distribution, MICAL interactors are rather close to the whole proteome.
Figure 8B represents the results of global disorder analysis of human proteins interacting with MICALs in the form of the ΔCH-ΔCDF plot that can be used for further classification of proteins as mostly ordered, molten globule-like or hybrid, or highly disordered based on their positions within the resulting CH-CDF phase space [82-85]. This analysis provided further support to the idea that the MICAL-interacting proteins include noticeable levels of disorder, which are comparable to those found in human proteome, which contains 59.1%, 25/5%, 12.3%, and 3.1% proteins in quadrants Q1, Q2, Q3, and Q4, respectively [81].
Figure 8C shows correlation between interactability of the members of the MICAL interactome (in terms of their node degree) with their intrinsic disorder status and demonstrates rather unusual distribution where irrespectively of their disorder status proteins form two equal groups – with the mean node degrees of 10.3±7.9 and 86.4±5.9; i.e., well below and above of the average node degree of the entire joint MICAL interactome (49). This bimodal distribution of the node degrees over disorder propensity is caused by the fact that the first group with low mode degrees includes MICAL1, MICAL2, MICAL3, MICAL-L1, and (mostly) their interactors, whereas the group 2 contains MICAL-L2, which is the most connected protein in the analyzed interactome, and its interactors.
Next, we analyzed the LLPS predispositions of the members of the MICAL interactome using FuzDrop and looked at the correlation between the propensity of all the query proteins to undergo LLPS and their intrinsic disorder status. Figure 8D represents the results of this analysis as the pLLPS vs. PPIDR plot and clearly shows that all the proteins capable of spontaneous LLPS are predicted as highly disordered. These observations support the known notion that high levels of intrinsic disorder represent one of the important features of proteins undergoing LLPS.
On the other hand, Figure 8D shows that not all highly disordered proteins are expected to act as droplet-drivers. In fact, out of 79 droplet clients (i.e., proteins with the probabilities of spontaneous LLPS below the 0.6 threshold but containing DPRs), 37 are classified as highly disordered, being characterized by the PPIDRPONDR®VSL2 exceeding 30%. The remaining proteins in this category are moderately disordered. Figure 8D also shows that even among the 39 proteins not associated with LLPS in any way (i.e., showing pLLPS below 0.6 and not containing any DPRs) there were 9 highly disordered proteins: RPS28 (79.71%), RPS10 (61.82%), RPS19 (48.97%), RPS27L (47.62%), RPS7 (44.85%), CFL1 (36.75%), CFL2 (34.94%), MRPS7 (33.%), and RPS29 (31.34%). Therefore, although all analyzed in this study proteins capable of spontaneous LLPS (droplet drivers) and many droplet clients are highly disordered, not all highly disordered proteins can promote phase separation or become engaged in biomolecular condensate as clients. In other words, the correlation between disorder and LLPS propensity is not symmetric, as “high LLPS potential means high disorder propensity” is not equivalent to “high disorder propensity means high LLPS potential”. Furthermore, there is also a possibility that even mostly ordered proteins can find their way into some biomolecular condensates or MLS being bound to the droplet-clients or droplet-drivers. Finally, Figure 8C illustrates that there is no obvious correlation between the LLPS potential of a protein and its interactivity, as some LLPS drivers do not have many partners, and many proteins unrelated to LLPS are highly connected.
2.4. Functional Disorder Analysis of 5 Most Disordered MICAL Interactors
2.4.1. Protein Phosphatase 1 Regulatory Subunit 26 (PPP1R26; UniProt ID: Q5T8A7)
Protein phosphatase 1 regulatory subunit 26 (PPP1R26 also known as KIAA0649) is a 1209-residue-long inhibitor of the phosphatase activity of protein phosphatase 1 (PP1) complexes, which also can be involved in positive regulation of cell proliferation [86,87]. PPP1R26 was shown to interact with 1A6/DRIM (downregulated in metastasis), which, in its turn, interacts with several nucleolar proteins, such as nucleolin and DNA topoisomerase I [87]. Therefore, it is not surprising that this protein is in nucleus and nucleolus [87]. The same study revealed that PPP1R26 has oncogenic characteristics enhancing colony formation and allowing anchorage-independent growth [87]. Based on the whole transcriptome sequencing it was established that PPP1R26 was one of significantly mutated genes (SMGs) that was also tumor-specific disruptive gene (TDG) in oral squamous cell carcinoma (OSCC) [88]. In hepatocellular carcinoma (HCC), upregulation of PPP1R26 is significantly associated with metastasis and the poor survival of the patients, with this protein driving HCC progression by controlling glycolysis and epithelial-mesenchymal transition [89].
Surprisingly, little is known about this protein. Therefore, our bioinformatics analysis provides an important foundation for subsequent functional and structural analysis of PPP1R26, which is one of the MICAL-L1 interactors. RIDAO analysis revealed that this protein is highly disordered, possessing PONDR® VLXT, PONDR® VSL2, PONDR® VL3, IUPred Short, IUPred long, PONDR® FIT, and MDP PPIDR values of 73.95%, 97.77%, 95.12%, 71.22%, 87.68%, 85.61%, and 91.32%, respectively. In line with these observations, Figure 9A represents a functional disorder profile of human PPP1R26, which clearly shows that almost entire protein is disordered and contains multiple PTM sites and 30 MoRFs spread through entire sequence. AlphaFold-modeled structure of this protein is shown in Figure 9B and shows that, most of the structure is present in the form of loose loops and unstructured, with few α-helices that do not form a tightly packed core.
The FuzDRop analysis revealed the presence of multiple DPRs (residues 55-129, 143-225, 234-374, 377-465, 483-536, 545-697, 736-750, 754-839, 844-1081, 1096-1117, 1123-1145, and 1149-1209) scattered throughout the length of the protein that is predicted a very high pLLPS = 1.00, pointing out the high propensity of this protein to act as a droplet-driver. Although there is no direct evidence linking PPP1R26 to LLPS, the facts that this protein shows very high pLLPS and is predicted to be found in the nucleolus, which is one of the most studied MLOs, provide strong support to the idea that PPP1R26 can induce LLPS, potentially contributing to the formation of liquid-like droplets or condensates within cells (e.g., can play a role in the biogenesis of nucleolus). Furthermore, PPP1R26 has 23 aggregation hot spots (55-62, 86-114, 117-125, 144-154, 167-175, 183-191, 212-225, 240-247, 267-277, 295-317, 327-352, 362-374, 377-397, 448-456, 489-494, 592-612, 766-783, 876-886, 889-896, 952-965, 997-1002, 1043-1048, 1108-1117, 1123-1140, and 1149-1179) and 37 regions with context-dependent interactions. All these observations indicate that highly disordered human PPP1R26 might rely on intrinsic disorder, while interacting with its partners, and these interactions can be further modulated by PTM. Figure 9C shows that PPP1R26 is involved in interaction with 453 proteins forming a very dense and highly connected PPI network, where 454 nodes are linked by 42,808 edges, making this network clearly non-random, as it includes significantly (PPI enrichment p-value < 10-16) more edges than the expected 7461 interactions for a random set of proteins of the same size and degree distribution drawn from the genome. The average node degree of 189 is extremely high and indicates that on average each member of the network interacts with 189 partners.
Functional enrichment of this network revealed that its members are significantly enriched in 106, 47, and 64 gene ontology (GO) terms describing biological processes, molecular functions, and cellular components. Ranking of the enriched terms was done using the STRING-based statistical parameter “signal”, which is defined as a weighted harmonic mean between the observed/expected ratio (which is the ratio between the number of proteins in the analyzed network that are annotated with a term and the number of proteins that we expect to be annotated with this term in a random network of the same size that describes how large the enrichment effect is) and -log(FDR) (False Discovery Rate describing how significant the enrichment is). Based on this parameter, five of the most enriched biological processes are cytoplasmic translation (GO:0002181; signal = 11.98), translation (GO:0006412; signal = 11.81), peptide metabolic process (GO:0006518; signal = 8.8), mitochondrial translation (GO:0032543; signal = 8.38), and mitochondrial gene expression (GO:0140053; signal = 7.31). The most enriched molecular functions are structural constituent of ribosome (GO:0003735 signal = 15.01), translation factor activity, RNA binding (GO:0008135; signal = 5.48), delayed rectifier potassium channel activity (GO:0005251 signal = 5.03), translation regulator activity, nucleic acid binding (GO:0090079; signal = 4.88), and translation regulator activity (GO:0045182 signal = 4.7). The most enriched cellular components terms are ribosomal subunit (GO:0044391; signal = 14.48), ribosome (GO:0005840; signal = 13.16), cytosolic ribosome (GO:0022626; signal = 12.23), large ribosomal subunit (GO:0015934; signal = 11.66), and cytosolic large ribosomal subunit (GO:0022625 signal = 9.54). Close involvement of the members of this network in translation regulation and gene expression is further supported by the enriched terms from REACTOME pathways, as among 60 significantly enriched pathways, the most enriched are formation of a pool of free 40S subunits (HSA-72689; signal = 13.63), GTP hydrolysis and joining of the 60S ribosomal subunit (HSA-72706; signal = 13.47), eukaryotic translation elongation (HSA-156842 ; signal = 13.34), L13a-mediated translational silencing of Ceruloplasmin expression (HSA-156827; signal = 13.26), and translation (HSA-72766; signal = 13.18).
2.4.2. Serine/Arginine-Related Protein 53 (SRrp53; UniProt ID: Q96IZ7)
Serine/arginine-related protein 53 (SRrp53, also known as arginine/serine-rich coiled-coil protein 1, RCRC1) is a 344-residue-long protein involved in the alternative splicing and transcription regulation [90]. This protein belongs to the SR-related polypeptide protein family. It is localized to nuclear speckles, where it binds other SR-family proteins and the 35-kDa U2 small nuclear ribonucleoprotein (snRNP) auxiliary factor (U2AF35) [91]. It is also involved in transcription regulation repressing the transcriptional activity of the transcription factor oestrogen receptor β (ERβ), which plays pivotal roles in the central nervous, endocrine, cardiovascular and immune systems [92]. This activity is dependent on RSRC1 SUMOylation [92]. Polymorphism in human SRrp53/RCRC1 is associated with intellectual disability, hypotonia and schizophrenia [90].
SRrp53/RCRC1 has an arginine and serine-rich domain (residues 1-283) and a coiled coil domain (residues 180-236). This protein is predicted to have PONDR® VLXT, PONDR® VSL2, PONDR® VL3, IUPred Short, IUPred long, PONDR® FIT, and MDP PPIDR values of 90.12%, 91.02%, 88.6-%, 70.96%, 85.93%, 92.22%, and 89.92%, respectively. Its highly disordered status is illustrated by Figure 10A and 10B showing its functional disorder profile and AlphaFold-generated 3D structure, respectively. Protein is predicted to have nine MoRFs (residues 17-24, 31-104, 107-120, 157-201, 223-229, 232-245, 288-295, 299-319, and 315-325), as well as a multitude of different PTMs (phosphorylation, acetylation and ubiquitylation). In line with the established nuclear speckle localization of human SRrp53/RCRC1, this protein is predicted by FuzDrop to have pLLPS of 0.9987 and contain 3 DPRs (residues 1-185, 192-230, and 239-303), seven aggregation hot spots (residues 159-183, 192-201, 218-226, 243-248, 282-288,293-298, and 327-332), as well as nine regions with context-depended disorder (residues 159-183, 185-201, 218-226, 228-240, 243-248, 282-288, 293-298, 302-323, and 325-332). It is likely that the capability of SRrp53/RCRC1 to undergo LLPS, could be related to the role of this protein in forming splicing speckles or other RNA processing bodies.
Being 3.5-times shorter than PPP1R26 discussed in the previous section, human SRrp53/RCRC1 protein is a highly promiscuous binder that forms a dense and heavily populated PPI network containing 398 nodes linked by 38,487 edges, which significantly exceeds the 6845 expected edges (see Figure 10C). This complex network has an average node degree of 193 and an average local clustering coefficient of 0.776. Many of the 119, 39, and 84 significantly enriched GO terms related to biological processes, molecular functions and cellular components associated with the members of this network are linked to translation, ribosome biogenesis, RNA binding and transport, and spliceosome.
2.4.3. Myocardin-Related Transcription Factor A (MRTFA; UniProt ID: Q969V6)
Myocardin-related transcription factor A (MRTFA, also known as MKL/myocardin-like protein 1, megakaryoblastic leukemia 1 protein (MKL1), and megakaryocytic acute leukemia protein (MAL)), is a 931-residue-long transcription coactivator involved in the control of the expression of the genes to regulate the cytoskeleton during cell migration, development, and morphogenesis [93]. This activity relies on the interaction of MKL1/MAL/MRTFA with the serum response factor (SRF) transcription factor, with the activity of the resulting SRF-MRTFA complex being regulated by MRTFA binding to cellular globular actin (G-actin) via its RPEL repeats (core sequence RPxxxEL) as well as by filamentous actin (F-actin) in the nucleus. SRF-MRTFA complex couples cytoskeletal gene expression to cytoskeletal dynamics being responsive to the Rho GTPase-induced changes in the G-actin concentration [93]. MRTFA is found in cytoplasm [47] and nucleus [47,94], and its subcellular localization is tightly regulated by actin both in cytoplasm and nucleus, where MRTFA binding to G-actin in cytoplasm masks the nuclear localization signal (NLS) and thereby inhibits nuclear import, whereas binding to the nuclear G-actin stimulates nuclear export of MRTFA to the cytoplasm. MICAL2 regulates nuclear localization of MRTFA by mediating nuclear actin depolymerization that leads to the decrease in the nuclear G-actin pool and consequent retention of MRTFA in the nucleus and formation of an active SRF-MRTFA complex [47]. A loss-of-function homozygous mutation of MRTFA is associated with immunodeficiency and severe susceptibility to bacterial infection [93]. Deregulated activity of MRTFA in transgenic mice with selective endothelial Progerin expression resulted in the development of the myocardial and perivascular fibrosis, left ventricular hypertrophy, and premature death [95].
MRTFA belongs to the MRTF family of transcription factors sharing evolutionary conserved domains essential for actin-binding, high-order chromatin organization, homo- and heterodimerization, and transcriptional activation [96]. Human MRTFA has a complex multidomain organization and includes an N-terminal region mediating interaction with suppressor of cancer cell invasion (SCAI) and beta-actin (ACTB) (residues 1-256) that contains intervening spacer sequences (residues 6-23 and 60-67) RPEL repeats (residues 24-29 and 50-67), a bipartite Nuclear localization signal (residues 27-65), a SAP domain (residues 347-381, named after three proteins known to contain it, SAF-A/B, Acinus, and PIAS), a coiled coil domain (residue 515-563), a transactivation domain (residues 564-931) and a multitude of low complexity regions and regions with other compositional biases (e.g., enriched in polar residues, proline residues, and basic and acidic residues). Each of the RPEL and intervening spacer motifs can bind autonomously to G-actin [97]. Mouse MRTFA that contains three RPEL motifs forms a pentavalent complex with G-actin [97]. Proteins with SAP domain are nuclear proteins involved in transcription, DNA repair, RNA processing, or apoptotic chromatin degradation. SAP motif also serves as a putative DNA-binding motif involved in chromosomal organization [98].
Figure 11 shows that human MRTFA is a highly disordered protein containing multiple MoRFs and different PTMs, which are capable of interacting with multiple partners. As per RIDAO analysis, is PONDR® VLXT, PONDR® VSL2, PONDR® VL3, IUPred Short, IUPred long, PONDR® FIT, and MDP PPIDR values are 80.23%, 93.69%, 92.24%, 59.42%, 77.85%, 83.64%, and 87.47%, respectively. FuzDrop-based analysis revealed that this protein has a very high pLLPS value of 0.9999 and contains 6 DPRs (residues 98-263, 272-343, 385-396, 432-485m 544-664, and 672-866). It also has 17 aggregation hot spots and 27 regions with context-dependent interactions. The presence of multiple disorder-based interactions sites (MoRFs) (Figure 11A) and the high overall level of intrinsic disorder (Figure 11A and Figure 11B) define the high binding promiscuity of human MRTFA, which is shown by STRING to form a rich PPI network with 147 nodes and 1398 edges, average node degree of 19, average local clustering coefficient of 0.63, and a PPI enrichment value of < 10-16.
2.4.4. ELKS/Rab6-Interacting/CAST Family Member 1 (ERC1; UniProt ID: Q8IUD2)
ELKS/Rab6-interacting/CAST family member 1 (ERC1, also known as Rab6-interacting protein 2 (RAB6IP2); the name ELKS is derived from protein rich in the amino acids E, L, K and S [99]) is a regulatory subunit of the IKK complex (IκB kinase or IkappaB kinase) [100], which is an enzyme complex that is involved in propagating the cellular response to inflammation acting as a central regulator of NF-κB activation [101]. ERC1 can also play roles in the organization of the cytomatrix at the nerve terminals active zone (CAZ) as well as vesicle trafficking at CAZ, and in the regulation of endosomes to Goldi apparatus by RAB6 [100]. ERC1 is a member of a family of RIM-binding proteins, with RIMs being regulators of neurotransmitter release at active zone. The protein is known to have multiple isoforms generated by alternative splicing. The canonical isoform is ELKS epsilon, which is a 1,116-residue-long protein characterized by PPIDRPONDR®VSL2 = 94.44%, ADSPONDR®VSL2 = 0.82±0.17, and pLLPS of 0.9912. The isoform 2 (ELKS beta, 992 residues) is different from the canonical form by missing regions 440-467 and 1017-116 and by having glutamate at position 783 changed to ESLTS and region 1009-1016 changed to DEEEGIWA [102]. As a result, this isoform is characterized by PPIDRPONDR®VSL2 = 98.89%, ADSPONDR®VSL2 = 0.85±0.12, and pLLPS of 0.9912. The isoform 3 (ELKS delta, 1088 residues) is missing 440-467 region and has PPIDRPONDR®VSL2 = 94.30%, ADSPONDR®VSL2 = 0.82±0.17, and pLLPS of 0.9962. In the isoform 4 (ELKS alpha, 948 residues), regions 440-467, 830-873, and 1017-1116 are missing, whereas glutamate at position 783 is changed to ESLTS and region 1009-1016 is changed to DEEEGIWA. This isoform has PPIDRPONDR®VSL2 = 98.84%, ADSPONDR®VSL2 = 0.85±0.12, and pLLPS of 0.9955. The isoform 5 (ELKS gamma) is the shortest version of ERC1 (720 residues). In addition to missing regions 224-523 and 1017-1116, it has changes at position 783 (E → ESLTS) and 1009-116 (IIQPLLEL → DEEEGIWA). It is characterized by PPIDRPONDR®VSL2 = 99.17%, ADSPONDR®VSL2 = 0.86±0.13, and pLLPS of 0.9986 [102]. Due to a premature stop codon in the mRNA leading to nonsense-mediated mRNA decay, ELKSs beta, alpha, and gamma may be produced at very low levels. Furthermore, in a papillary thyroid carcinoma, translocation t(10;12)(q11;p13) fuses ELKS to receptor-type tyrosine kinase RET [102].
Human ERC1 contains two coiled coil domains (residues 144-988 and 1060-1100) and a FIP-RBD domain (residues 1046-1108), which is a C-terminally located Rab-binding domain (RBD) found in a family of Rab11 interacting proteins (FIPs) that selectively recognize the active form of Rab11. Figure 12A shows that human ERC1/RAB6IP2 is predicted to have a high level of intrinsic disorder. This is further supported by the RIDAO outputs, which showed that the PONDR® VLXT, PONDR® VSL2, PONDR® VL3, IUPred Short, IUPred long, PONDR® FIT, and MDP PPIDR values evaluated for this protein were 68.28%, 94.44%, 91.22%, 36.11%, 65.23%, 79.93%, and 84.32%, respectively. There are 24 MoRFs and multiple phosphorylation and acetylation sites in this protein, with the N-terminal 200 residues containing 16 phosphorylation sites.
Figure 12B represents the AlphaFold-generated 3D structural model of this protein, which is dominated by the extremely long α-helices (residues 141-187, 194-250, 264-318, 324-369, 418-701, and 801-943), which do not form a compact core. These α-helices, especially the longest ones, cannot physically exist in unbound form and therefore represent “hallucinations”; i.e., plausible-looking structures where the real protein is actually unstructured. Note that these long α-helices are located within the very long N-terminal coiled coil domain.
FuzDrop analysis showed that human ERC1 can serve as droplet driver, since it has a high pLLPS of 0.9912 and contains 8 DPRs (residues 1-118, 172-193, 243-255, 625-704, 713-755, 855-873, 894-919, 945-969, and 973-1017). There are also numerous aggregation hot spots and regions with context-dependent interactions. These observations indicate that ERC1 can act as a scaffold protein generating a disorder-based platform for its binding partners. In line with the FuzDrop predictions, it was shown that ERC1 induces formation of cytoplasmic condensates with liquid-like properties that specifically host partners of a network relevant to cell motility, including liprin-α1 [103]. Importantly, in migrating cells, ERC1, liprin-α, and LL5 proteins (which are the pleckstrin homology-like domain family members) form polarized plasma membrane-associated platforms (PMAPs), which are liquid condensates associated with the regulation of cell motility [103].
Figure 12C represents the STRING-generated PPI network centered at human ERC1 and shows that this protein is engaged in interaction with 101 partners forming a network with 102 nodes and 673 edges. Among the 198 significantly enriched GO-terms related to biological processes that are neurotransmitter secretion (GO:0007269; signal = 4.57), vesicle-mediated transport in synapse (GO:0099003; signal = 4.3), synaptic vesicle cycle (GO:0099504; signal = 4.23), neurotransmitter transport (GO:0006836; signal = 3.78), and synaptic vesicle exocytosis (GO:0016079; signal = 3.63). Among the 27 significantly enriched molecular function GO terms are syntaxin-1 binding (GO:0017075; signal = 1.43), syntaxin binding (GO:0019905; signal = 1.27), GTPase binding (GO:0051020; signal = 0.91), transmembrane transporter binding (GO:0044325; signal = 0.84), and myosin V binding (GO:0031489; signal = 0.82). Among the 92 significantly enriched cellular component GO terms are presynaptic active zone (GO:0048786; = 4.55), presynaptic active zone cytoplasmic component (GO:0098831; signal = 3.82), cell cortex region (GO:0099738; signal = 3.22), IkappaB kinase complex (GO:0008385; signal = 2.95), and presynapse (GO:0098793; signal = 2.82). Among the 53 significantly enriched KEGG pathways are NF-kappa B signaling pathway (hsa04064; signal = 3.44), NOD-like receptor signaling pathway (hsa04621; signal = 2.06), IL-17 signaling pathway (hsa04657; signal = 1.91), shigellosis (hsa05131; signal = 1.77), and RIG-I-like receptor signaling pathway (hsa04622; signal = 1.63). And among the 78 REACTOME pathways the most enriched are serotonin neurotransmitter release cycle (HSA-181429; signal = 5.59), dopamine neurotransmitter release cycle (HSA-212676; signal = 5.27), acetylcholine neurotransmitter release cycle (HSA-264642; signal = 4.24), norepinephrine neurotransmitter release cycle (HSA-181430; signal = 4.19), and glutamate neurotransmitter release cycle (HSA-210500; signal = 3.84).
2.4.5. EH Domain-Binding Protein 1-Like Protein 1 (EHBP1L1; UniProt ID: Q8N3D4)
EH domain-binding protein 1-like protein 1 (EHBP1L1) is a human 1,523-residue-long protein acting as RAB effector and playing a role in vesicle trafficking [34]. Together with adaptor proteins of actin regulators CD2-associated protein (CD2AP) and CBL-interacting protein of 85 kDa (CIN85), EHBP1L1 is involved in the length control of cilia, which are organelles that function in signal sensing and transduction and consist of axonemal microtubules and plasma membranes protruding from the cell surface to the extracellular region [104]. This protein is also involved in polarized exocytic trafficking in small intestinal epithelial cells [105]. During terminal erythropoiesis, promotes nuclear polarization and subsequent enucleation of erythroblasts is promoted by an apicobasal polarity regulator EHBP1L1 in coordination with Rab10, Bin1, and dynamin [106]. The formation of apically-destined vesicles at the recycling endosomes is dependent on EHBP1L1, Bin1, and dynamin 1 [107].
In renal cell carcinoma (RCC), interaction of EHBP1L1 with Janus kinase 1 (JAK1) stabilizes JAK1, leading to the formation of an immunosuppressive tumor microenvironment (TME) and thereby driving immune evasion [108].
EHBP1L1 possesses a Ca2+/phospholipid-binding (C2) domain (residues 8-157), a calponin homology (CH) domain (residues 1037-1142), a bivalent Mical/EHBP Rab binding (bMERB) domain (residues 1349-1501) mediating binding to the GTP-bound forms of RAB8, RAB10, RAB10, RAB13, and RAB15 [34], a coiled-coil domain (residues 1363-1515), and CAAX motif (residues 1520-1523) acting as a signal for prenylation and required for endosomal colocalization with RAB8 and RAB10 [34]. Because of the presence of the bMERB domain, EHBP1L1 has two Rab-binding sites and therefore, together with MICAL-1, MICAL-3, and MICAL-L2, belongs to the bivalent RAB8-family effectors [34]. In its farnesylated form, EHBP1L1 is preferentially localized to the intracellular structures resembling endosomes, where it colocalizes with constitutively active RAB8 and RAB10 [34].
Like the other proteins discussed in this section, human EHBP1L1 is predicted to have high level of disorder. For example, based on the RIDAO analysis, this protein is characterized by the PONDR® VLXT, PONDR® VSL2, PONDR® VL3, IUPred Short, IUPred long, PONDR® FIT, and MDP PPIDR values of 79.71%, 80.3%, 78.79%, 56.8%, 68.29%, 71.11%, and 74.06%, respectively. Figure 13A represents the functional disorder profile generated for EHBP1L1 by D2P2 and shows that it has multiple MoRFs that almost completely cover its long IDRs. The protein is also densely decorated by PTMs, indicating that the intrinsic disorder-based interactivity of EHBP1L1 can be regulated by PTMs. Figure 13B provides further support to the highly disordered nature of this protein by showing 3D structure model generated by AlphaFold. Here, with the exception to Ca2+/phospholipid-binding (C2) domain (residues 2-172), CH-domain (residues 1030-1143), and portion of CC domain (residues 1352-1445 and 1470-1508), for which the average per-residue model confidence score pLDDT values are 87.92, 87.33, and 83.49, very significant fraction of a protein is given by disordered loops with very low pLDDT < 50.
Based on the outputs of FuzDrop analysis, human EHBP1L1 is expected to serve as droplet driver, as it shows a very high pLLPS score of 0.9998 indicative of high potential of this protein to undergo spontaneous LLPS. Protein also includes 8 DPRs (residues 175-595, 648-665, 693-704, 817-864, 870-915, 919-929, 933-1041, and 1151-1369. Although currently, there is no experimental evidence that EHBP1L1 can have a role in the formation or regulation of biomolecular condensates, some of its functions are indicative of potential EHBP1L1-LLPS connections. Because of the aforementioned involvement of this protein in membrane trafficking and interactions with RAB8, BIN1, and dynamin, EHBP1L1 could be implicated in the formation of the biomolecular condensates at the endocytic recycling compartment (ERC, which is a cellular structure responsible for sorting and recycling proteins and lipids back to the cell membrane [105]) or in other membrane-associated processes.
In addition to 8 DPRs and 24 MoRFs, human EHBP1L1 contains 21 aggregation hot spots and more than 35 regions with context-dependent interactions. All this suggests that this protein might have high interaction potential. The capability of EHBP1L1 to interact with several proteins was already discussed. Figure 13C represents further support to the high interactivity of this protein by showing the STRING-generated PPI network centered at EHBP1L1. This network includes 49 nodes connected by 463 edges.
The network has an average local clustering coefficient of 0.886 and average node degree of 18.9. Members of this network are taking part in various biological processes such as protein transport from ciliary membrane to plasma membrane (GO:1903445; FDR = 0.0147), Golgi vesicle fusion to target membrane (GO:0048210; FDR = 0.000060), vesicle transport along actin filament (GO:0030050; FDR = 0.0102), vesicle docking involved in exocytosis (GO:0006904; FDR = 0.0036), and establishment of protein localization to plasma membrane (GO:0061951; FDR = 0.0050). The molecular functions represented are muscle alpha-actinin binding (GO:0051371; FDR = 9.26e-13), cadherin binding involved in cell-cell adhesion (GO:0098641; FDR = 0.0070), microfilament motor activity (GO:0000146; FDR = 0.0022), cell-cell adhesion mediator activity (GO:0098632; FDR = 0.0063), and GDP binding (GO:0019003; FDR = 0.0011). Cellular components, where these proteins are localized include filamentous actin (GO:0031941; FDR = 4.11e-61), unconventional myosin complex (GO:0016461; FDR = 0.00013), insulin-responsive compartment (GO:0032593; FDR = 0.0122), stress fiber (GO:0001725; FDR = 1.13e-09), and stereocilium tip (GO:0032426; FDR = 0.0432).
3. Materials and Methods
3.1. Protein Datasets
We have gathered five MICAL proteins of MICAL family for the comprehensive analysis of their intrinsic disorder predispositions through comprehensive literature review. We first retrieved the FASTA sequences of these proteins using UniPROT, and then ran these sequences though platforms discussed below. The global STRING analysis of all five proteins revealed 174 interactors within PPI network. We further analyzed these interactors by obtaining their FASTA sequences and submitting these sequences in RIDAO for disorder prediction analysis. Then the top 10 most disordered proteins were selected for the in-depth analysis.
3.2. Bioinformatics Tools Utilized in This Study
3.2.1. STRING
Protein-protein interactions research was carried out through STRING database. In the first stage of our study, we used the STRING database to conduct a global PPI network analysis of all five MICALs, identifying 174 interactors within the protein-protein interaction (PPI) network. In the second stage of Study, we used the platform to generate the PPI network for individual proteins using medium confidence and maximum number of interactor 500 in the 1st shell of the network [109].
3.2.2. RIDAO
Six well known predictors PONDR® VLXT, PONDR® VSL2, PONDR® VL3, IUPred Short, IUPred long, and PONDR® FIT are combined in one platform, Rapid Intrinsic Disorder Analysis Online (RIDAO), which is a web-based predictor, efficiently generating per-residue prediction of intrinsic disorder predisposition in individual query proteins or in protein datasets [110]. RIDAO also provides mean disorder prediction (MDP) by averaging outputs of individual predictors. The residues with the disorder score from 0.5 to 1.0 are considered as disordered, residues with disorder score between 0.15 and 0.5 are considered flexible, whereas residues with disorder score below 0.15 are classified as ordered. Base on their percent of predicted intrinsically disordered residues (PPIDR) values, proteins are traditionally classified as ordered, moderately disordered and highly disordered if their PPIDR < 10%, 10% ≤ PPIDR < 30%, and PPIDR ≥ 30%, respectively [79,80].
RIDAO uses the outputs from two binary predictors, the charge-hydropathy (CH) plot [111] and the cumulative distribution function (CDF) plot [84,112], to generate a CH-CDF phase diagram [85,113]. This allowed for the classification of proteins based on their location within the CH-CDF phase space. Proteins in Quadrant I can be categorized as ordered (predicted to be ordered by both models), Quadrant III can be categorized as native coils or pre-molten globules (disordered by both methods), Quadrant II can be categorized as hybrid proteins or putative native molten globules (ordered by CH but disordered by CDF), and Quadrant IV can be categorized as proteins that are disordered according to the CH plot but ordered by the CDF plot [84].
3.2.3. IUPred
IUPred2A [114,115] was used to predict intrinsic disorder tendencies, focusing on predictions of long disordered regions along with ANCHOR2-based prediction [116,117] of molecular recognition features (MoRFs); i.e., disorder-based binding site that represent short intrinsically disordered regions undergoing disorder to order transition upon interaction with their binding partner [118-121]. These features are present in many IDPs, with some of them being even capable to fold differently at interaction with different partners [122-124].
3.2.4. InterPro
3.2.5. FuzDrop
An internet platform FuzDrop that predicts the probability of proteins to undergo liquid-liquid phase separation (LLPS) was used to study regions of proteins contributing to 'fuzziness’, and to identify droplet drivers, enhancing our understanding of how the disorder impacts protein interaction capabilities [127]. The ability of a protein to have fuzziness can lead to the LLPS, which in turn gives rise to the membrane-less organelles (MLOs) or biomolecular condensates (BMCs), performing crucial cellular functions in body like stress granules and p-bodies [128].
3.2.6. AlphaFold
3D structures of query proteins were modeled using AlphaFold, which is an AI-based computational tool that predicts the 3D structure of a protein given its amino acid sequence [129]. Corresponding structural models were retrieved from the AlphaFold Protein Structure Database (https://alphafold.ebi.ac.uk/), which provides structure coverage for over 214 million protein sequences [130]. These models were used to correlate structural predictions with other results.
3.2.7. D2P2
Focused analysis of human MICALs was accomplished through D2P2 website (http://d2p2.pro), which seeks to present standardized and comprehensive disorder predictions for each of the currently mapped genes with molecular inscriptions [131]. To predict location of disordered regions that undergo binding-induced folding during protein-protein interactions, D2P2 presently combines ANCHOR outputs [116,117] with the outputs of PONDR® VLXT [132], PONDR® VSL2B [133], IUPred (both short and long forms) [114,115], PrDOS [134], PV2, and three variants of ESpritz (NMR, DisProt, and X-ray) [135]. Given the FASTA sequence or a protein/gene name, position of consensus intrinsic disordered regions in addition to range and length of Molecular Recognition Features (MoRFs) and positions of various posttranslational modifications (PTMs) is given by the D2P2 platform for each of the proteins analyzed in this study [131].
4. Conclusions
Our bioinformatics analysis of MICAL family protein demonstrated that all five key proteins are highly disordered with mean disorder prediction above 30%. Out of 174 interactors of MICALs, approximately 43.1% are also highly disordered. Furthermore, in-depth analysis of these proteins revealed that disorder indeed has functional implications. Notably, MICALs and their interactors were shown to be involved in multiple interactions. MICALs and many disordered MICAL interactors are predicted to have a high tendency to undergo LLPS, forming biomolecular condensates and membrane-less organelles. These characteristics support and highlight why these proteins play important roles in cellular functions. Diving deep into the disorder profiles of these proteins can help us to identify potential targets for diseases, such as neurodegeneration and cancer.
Author Contributions
Conceptualization, V.N.U.; methodology, V.N.U.; validation, H.N.A. and V.N.U.; formal analysis, H.N.A. and V.N.U.; investigation, H.N.A. and V.N.U.; data curation, H.N.A. and V.N.U.; writing—original draft preparation, H.N.A. and V.N.U.; writing—review and editing, H.N.A. and V.N.U.; visualization, V.N.U.; supervision, V.N.U. All authors have read and agreed to the published version of the manuscript.
Funding
This research received no external funding.
Institutional Review Board Statement
Not applicable.
Informed Consent Statement
Not applicable.
Data Availability Statement
The data are contained within the article.
Conflicts of Interest
The authors declare no conflicts of interest. The funders had no role in the design of the study; in the collection, analyses, or interpretation of data; in the writing of the manuscript; or in the decision to publish the results.
References
- Wu, H.; Yesilyurt, H.G.; Yoon, J.; Terman, J.R. The MICALs are a family of F-actin dismantling oxidoreductases conserved from Drosophila to humans. Scientific reports 2018, 8, 937. [Google Scholar] [CrossRef] [PubMed]
- Vitali, T.; Maffioli, E.; Tedeschi, G.; Vanoni, M.A. Properties and catalytic activities of MICAL1, the flavoenzyme involved in cytoskeleton dynamics, and modulation by its CH, LIM and C-terminal domains. Arch Biochem Biophys 2016, 593, 24–37. [Google Scholar] [CrossRef] [PubMed]
- Zucchini, D.; Caprini, G.; Pasterkamp, R.J.; Tedeschi, G.; Vanoni, M.A. Kinetic and spectroscopic characterization of the putative monooxygenase domain of human MICAL-1. Arch Biochem Biophys 2011, 515, 1–13. [Google Scholar] [CrossRef]
- Alto, L.T.; Terman, J.R. MICALs. Current Biology 2018, 28, R538–R541. [Google Scholar] [CrossRef]
- Giridharan, S.S.; Caplan, S. MICAL-family proteins: Complex regulators of the actin cytoskeleton. Antioxid Redox Signal 2014, 20, 2059–2073. [Google Scholar] [CrossRef]
- Rajan, S.; Terman, J.R.; Reisler, E. MICAL-mediated oxidation of actin and its effects on cytoskeletal and cellular dynamics. Frontiers in Cell and Developmental Biology 2023, 11, 1124202. [Google Scholar] [CrossRef]
- Grintsevich, E.E.; Ge, P.; Sawaya, M.R.; Yesilyurt, H.G.; Terman, J.R.; Zhou, Z.H.; Reisler, E. Catastrophic disassembly of actin filaments via Mical-mediated oxidation. Nat Commun 2017, 8, 2183. [Google Scholar] [CrossRef]
- Manta, B.; Gladyshev, V.N. Regulated methionine oxidation by monooxygenases. Free Radic Biol Med 2017, 109, 141–155. [Google Scholar] [CrossRef]
- Fremont, S.; Romet-Lemonne, G.; Houdusse, A.; Echard, A. Emerging roles of MICAL family proteins - from actin oxidation to membrane trafficking during cytokinesis. J Cell Sci 2017, 130, 1509–1517. [Google Scholar] [CrossRef]
- McGarry, D.J.; Armstrong, G.; Castino, G.; Mason, S.; Clark, W.; Shaw, R.; McGarry, L.; Blyth, K.; Olson, M.F. MICAL1 regulates actin cytoskeleton organization, directional cell migration and the growth of human breast cancer cells as orthotopic xenograft tumours. Cancer Lett 2021, 519, 226–236. [Google Scholar] [CrossRef]
- Prifti, E.; Tsakiri, E.N.; Vourkou, E.; Stamatakis, G.; Samiotaki, M.; Skoulakis, E.M.C.; Papanikolopoulou, K. Mical modulates Tau toxicity via cysteine oxidation in vivo. Acta Neuropathol Commun 2022, 10, 44. [Google Scholar] [CrossRef] [PubMed]
- Beuchle, D.; Schwarz, H.; Langegger, M.; Koch, I.; Aberle, H. Drosophila MICAL regulates myofilament organization and synaptic structure. Mech Dev 2007, 124, 390–406. [Google Scholar] [CrossRef] [PubMed]
- Fischer, E. Einfluss der Configuration auf die Wirkung der Enzyme. Berichte der deutschen chemischen Gesellschaft 1894, 27, 2985–2993. [Google Scholar] [CrossRef]
- Lemieux, R.U.; Spohr, U. How Emil Fischer was led to the lock and key concept for enzyme specificity. Adv Carbohydr Chem Biochem 1994, 50, 1–20. [Google Scholar]
- Beadle, G.W.; Tatum, E.L. Genetic Control of Biochemical Reactions in Neurospora. Proc Natl Acad Sci U S A 1941, 27, 499–506. [Google Scholar] [CrossRef]
- Anfinsen, C.B. The formation and stabilization of protein structure. Biochem J 1972, 128, 737–749. [Google Scholar] [CrossRef]
- Anfinsen, C.B. Principles that govern the folding of protein chains. Science 1973, 181, 223–230. [Google Scholar] [CrossRef]
- Anfinsen, C.B.; Haber, E.; Sela, M.; White, F.H., Jr. The kinetics of formation of native ribonuclease during oxidation of the reduced polypeptide chain. Proc Natl Acad Sci U S A 1961, 47, 1309–1314. [Google Scholar] [CrossRef]
- Dunker, A.K.; Babu, M.M.; Barbar, E.; Blackledge, M.; Bondos, S.E.; Dosztanyi, Z.; Dyson, H.J.; Forman-Kay, J.; Fuxreiter, M.; Gsponer, J.; et al. What's in a name? Why these proteins are intrinsically disordered: Why these proteins are intrinsically disordered. Intrinsically Disord Proteins 2013, 1, e24157. [Google Scholar] [CrossRef]
- Uversky, V.N.; Kulkarni, P. Intrinsically disordered proteins: Chronology of a discovery. Biophys Chem 2021, 279, 106694. [Google Scholar] [CrossRef]
- Ashraf, H.N.; Uversky, V.N. Intrinsic Disorder in the Host Proteins Entrapped in Rabies Virus Particles. Viruses 2024, 16, 916. [Google Scholar] [CrossRef] [PubMed]
- Mishra, P.M.; Verma, N.C.; Rao, C.; Uversky, V.N.; Nandi, C.K. Intrinsically disordered proteins of viruses: Involvement in the mechanism of cell regulation and pathogenesis. Prog Mol Biol Transl Sci 2020, 174, 1–78. [Google Scholar] [CrossRef] [PubMed]
- Uversky, V.N. Paradoxes and wonders of intrinsic disorder: Stability of instability. Intrinsically Disord Proteins 2017, 5, e1327757. [Google Scholar] [CrossRef]
- Kc, S.; Nguyen, K.; Nicholson, V.; Walgren, A.; Trent, T.; Gollub, E.; Romero, S.; Holehouse, A.S.; Sukenik, S.; Boothby, T.C. Disordered proteins interact with the chemical environment to tune their protective function during drying. bioRxiv 2024. [Google Scholar] [CrossRef]
- Darling, A.L.; Uversky, V.N. Intrinsic Disorder and Posttranslational Modifications: The Darker Side of the Biological Dark Matter. Front Genet 2018, 9, 158. [Google Scholar] [CrossRef]
- Owen, I.; Shewmaker, F. The Role of Post-Translational Modifications in the Phase Transitions of Intrinsically Disordered Proteins. Int J Mol Sci 2019, 20. [Google Scholar] [CrossRef]
- McGarry, D.J.; Castino, G.; Lilla, S.; Carnet, A.; Kelly, L.; Micovic, K.; Zanivan, S.; Olson, M.F. MICAL1 activation by PAK1 mediates actin filament disassembly. Cell Rep 2022, 41, 111442. [Google Scholar] [CrossRef]
- Zhang, Z.; Liu, R.; Wang, Y.; Wang, Y.; Shuai, Y.; Ke, C.; Jin, R.; Wang, X.; Luo, J. Phosphorylation of MICAL2 by ARG promotes head and neck cancer tumorigenesis by regulating skeletal rearrangement. Oncogene 2022, 41, 334–346. [Google Scholar] [CrossRef]
- Iakoucheva, L.M.; Brown, C.J.; Lawson, J.D.; Obradovic, Z.; Dunker, A.K. Intrinsic disorder in cell-signaling and cancer-associated proteins. J Mol Biol 2002, 323, 573–584. [Google Scholar] [CrossRef]
- Uversky, V.N. Targeting intrinsically disordered proteins in neurodegenerative and protein dysfunction diseases: another illustration of the D(2) concept. Expert Rev Proteomics 2010, 7, 543–564. [Google Scholar] [CrossRef]
- Uversky, V.N.; Oldfield, C.J.; Dunker, A.K. Intrinsically disordered proteins in human diseases: introducing the D2 concept. Annu Rev Biophys 2008, 37, 215–246. [Google Scholar] [CrossRef] [PubMed]
- Lucken-Ardjomande Hasler, S.; Vallis, Y.; Pasche, M.; McMahon, H.T. GRAF2, WDR44, and MICAL1 mediate Rab8/10/11-dependent export of E-cadherin, MMP14, and CFTR DeltaF508. J Cell Biol 2020, 219. [Google Scholar] [CrossRef] [PubMed]
- Alto, L.T.; Terman, J.R. Semaphorins and their Signaling Mechanisms. Methods Mol Biol 2017, 1493, 1–25. [Google Scholar] [CrossRef]
- Rai, A.; Oprisko, A.; Campos, J.; Fu, Y.; Friese, T.; Itzen, A.; Goody, R.S.; Gazdag, E.M.; Muller, M.P. bMERB domains are bivalent Rab8 family effectors evolved by gene duplication. Elife 2016, 5. [Google Scholar] [CrossRef]
- Horvath, M.; Schrofel, A.; Kowalska, K.; Sabo, J.; Vlasak, J.; Nourisanami, F.; Sobol, M.; Pinkas, D.; Knapp, K.; Koupilova, N.; et al. Structural basis of MICAL autoinhibition. Nat Commun 2024, 15, 9810. [Google Scholar] [CrossRef]
- Uversky, V.N. Intrinsically disordered proteins in overcrowded milieu: Membrane-less organelles, phase separation, and intrinsic disorder. Curr Opin Struct Biol 2017, 44, 18–30. [Google Scholar] [CrossRef]
- Vendruscolo, M.; Fuxreiter, M. Sequence Determinants of the Aggregation of Proteins Within Condensates Generated by Liquid-liquid Phase Separation. J Mol Biol 2022, 434, 167201. [Google Scholar] [CrossRef]
- Horvath, A.; Miskei, M.; Ambrus, V.; Vendruscolo, M.; Fuxreiter, M. Sequence-based prediction of protein binding mode landscapes. PLoS Comput Biol 2020, 16, e1007864. [Google Scholar] [CrossRef]
- Miskei, M.; Horvath, A.; Vendruscolo, M.; Fuxreiter, M. Sequence-Based Prediction of Fuzzy Protein Interactions. J Mol Biol 2020, 432, 2289–2303. [Google Scholar] [CrossRef]
- Gerhard, D.S.; Wagner, L.; Feingold, E.A.; Shenmen, C.M.; Grouse, L.H.; Schuler, G.; Klein, S.L.; Old, S.; Rasooly, R.; Good, P.; et al. The status, quality, and expansion of the NIH full-length cDNA project: the Mammalian Gene Collection (MGC). Genome Res 2004, 14, 2121–2127. [Google Scholar] [CrossRef]
- Hattori, A.; Okumura, K.; Nagase, T.; Kikuno, R.; Hirosawa, M.; Ohara, O. Characterization of long cDNA clones from human adult spleen. DNA Res 2000, 7, 357–366. [Google Scholar] [CrossRef] [PubMed]
- Ota, T.; Suzuki, Y.; Nishikawa, T.; Otsuki, T.; Sugiyama, T.; Irie, R.; Wakamatsu, A.; Hayashi, K.; Sato, H.; Nagai, K.; et al. Complete sequencing and characterization of 21,243 full-length human cDNAs. Nat Genet 2004, 36, 40–45. [Google Scholar] [CrossRef] [PubMed]
- Romero, P.R.; Zaidi, S.; Fang, Y.Y.; Uversky, V.N.; Radivojac, P.; Oldfield, C.J.; Cortese, M.S.; Sickmeier, M.; LeGall, T.; Obradovic, Z.; et al. Alternative splicing in concert with protein intrinsic disorder enables increased functional diversity in multicellular organisms. Proc Natl Acad Sci U S A 2006, 103, 8390–8395. [Google Scholar] [CrossRef]
- Kanehisa, M.; Furumichi, M.; Sato, Y.; Matsuura, Y.; Ishiguro-Watanabe, M. KEGG: biological systems database as a model of the real world. Nucleic Acids Res 2025, 53, D672–D677. [Google Scholar] [CrossRef]
- Milacic, M.; Beavers, D.; Conley, P.; Gong, C.; Gillespie, M.; Griss, J.; Haw, R.; Jassal, B.; Matthews, L.; May, B.; et al. The Reactome Pathway Knowledgebase 2024. Nucleic Acids Res 2024, 52, D672–D678. [Google Scholar] [CrossRef]
- Jassal, B.; Matthews, L.; Viteri, G.; Gong, C.; Lorente, P.; Fabregat, A.; Sidiropoulos, K.; Cook, J.; Gillespie, M.; Haw, R.; et al. The reactome pathway knowledgebase. Nucleic Acids Res 2020, 48, D498–D503. [Google Scholar] [CrossRef]
- Lundquist, M.R.; Storaska, A.J.; Liu, T.C.; Larsen, S.D.; Evans, T.; Neubig, R.R.; Jaffrey, S.R. Redox modification of nuclear actin by MICAL-2 regulates SRF signaling. Cell 2014, 156, 563–576. [Google Scholar] [CrossRef]
- Feuerstein, R.; Wang, X.; Song, D.; Cooke, N.E.; Liebhaber, S.A. The LIM/double zinc-finger motif functions as a protein dimerization domain. Proc Natl Acad Sci U S A 1994, 91, 10655–10659. [Google Scholar] [CrossRef]
- Olejniczak, M.; Storz, G. ProQ/FinO-domain proteins: another ubiquitous family of RNA matchmakers? Mol Microbiol 2017, 104, 905–915. [Google Scholar] [CrossRef]
- Grigoriev, I.; Yu, K.L.; Martinez-Sanchez, E.; Serra-Marques, A.; Smal, I.; Meijering, E.; Demmers, J.; Peranen, J.; Pasterkamp, R.J.; van der Sluijs, P.; et al. Rab6, Rab8, and MICAL3 cooperate in controlling docking and fusion of exocytotic carriers. Curr Biol 2011, 21, 967–974. [Google Scholar] [CrossRef]
- Liu, Q.; Liu, F.; Yu, K.L.; Tas, R.; Grigoriev, I.; Remmelzwaal, S.; Serra-Marques, A.; Kapitein, L.C.; Heck, A.J.; Akhmanova, A. MICAL3 Flavoprotein Monooxygenase Forms a Complex with Centralspindlin and Regulates Cytokinesis. J Biol Chem 2016, 291, 20617–20629. [Google Scholar] [CrossRef] [PubMed]
- Sharma, R.; Raicar, G.; Tsunoda, T.; Patil, A.; Sharma, A. OPAL: prediction of MoRF regions in intrinsically disordered protein sequences. Bioinformatics 2018, 34, 1850–1858. [Google Scholar] [CrossRef] [PubMed]
- Kobayashi, H.; Fukuda, M. Rab35 establishes the EHD1-association site by coordinating two distinct effectors during neurite outgrowth. J Cell Sci 2013, 126, 2424–2435. [Google Scholar] [CrossRef]
- Kobayashi, H.; Etoh, K.; Ohbayashi, N.; Fukuda, M. Rab35 promotes the recruitment of Rab8, Rab13 and Rab36 to recycling endosomes through MICAL-L1 during neurite outgrowth. Biol Open 2014, 3, 803–814. [Google Scholar] [CrossRef]
- Sikora, R.; Bun, P.; Danglot, L.; Alqabandi, M.; Bassereau, P.; Niedergang, F.; Galli, T.; Zahraoui, A. MICAL-L1 is required for cargo protein delivery to the cell surface. Biol Open 2021, 10. [Google Scholar] [CrossRef]
- Giridharan, S.S.; Cai, B.; Vitale, N.; Naslavsky, N.; Caplan, S. Cooperation of MICAL-L1, syndapin2, and phosphatidic acid in tubular recycling endosome biogenesis. Mol Biol Cell 2013, 24, 1776–1790. [Google Scholar] [CrossRef]
- Rahajeng, J.; Giridharan, S.S.; Naslavsky, N.; Caplan, S. Collapsin response mediator protein-2 (Crmp2) regulates trafficking by linking endocytic regulatory proteins to dynein motors. J Biol Chem 2010, 285, 31918–31922. [Google Scholar] [CrossRef]
- Sharma, M.; Giridharan, S.S.; Rahajeng, J.; Naslavsky, N.; Caplan, S. MICAL-L1 links EHD1 to tubular recycling endosomes and regulates receptor recycling. Mol Biol Cell 2009, 20, 5181–5194. [Google Scholar] [CrossRef]
- Xie, S.; Farmer, T.; Naslavsky, N.; Caplan, S. MICAL-L1 coordinates ciliogenesis by recruiting EHD1 to the primary cilium. J Cell Sci 2019, 132. [Google Scholar] [CrossRef]
- Compeer, E.B.; Boes, M. MICAL-L1-related and unrelated mechanisms underlying elongated tubular endosomal network (ETEN) in human dendritic cells. Commun Integr Biol 2014, 7, e994969. [Google Scholar] [CrossRef]
- Abou-Zeid, N.; Pandjaitan, R.; Sengmanivong, L.; David, V.; Le Pavec, G.; Salamero, J.; Zahraoui, A. MICAL-like1 mediates epidermal growth factor receptor endocytosis. Mol Biol Cell 2011, 22, 3431–3441. [Google Scholar] [CrossRef] [PubMed]
- Nahm, M.; Park, S.; Lee, J.; Lee, S. MICAL-like Regulates Fasciclin II Membrane Cycling and Synaptic Development. Mol Cells 2016, 39, 762–767. [Google Scholar] [CrossRef] [PubMed]
- Rahajeng, J.; Giridharan, S.S.; Cai, B.; Naslavsky, N.; Caplan, S. MICAL-L1 is a tubular endosomal membrane hub that connects Rab35 and Arf6 with Rab8a. Traffic 2012, 13, 82–93. [Google Scholar] [CrossRef] [PubMed]
- Jovic, M.; Kieken, F.; Naslavsky, N.; Sorgen, P.L.; Caplan, S. Eps15 homology domain 1-associated tubules contain phosphatidylinositol-4-phosphate and phosphatidylinositol-(4,5)-bisphosphate and are required for efficient recycling. Mol Biol Cell 2009, 20, 2731–2743. [Google Scholar] [CrossRef]
- Braun, A.; Pinyol, R.; Dahlhaus, R.; Koch, D.; Fonarev, P.; Grant, B.D.; Kessels, M.M.; Qualmann, B. EHD proteins associate with syndapin I and II and such interactions play a crucial role in endosomal recycling. Mol Biol Cell 2005, 16, 3642–3658. [Google Scholar] [CrossRef]
- Etoh, K.; Fukuda, M. Rab10 regulates tubular endosome formation through KIF13A and KIF13B motors. J Cell Sci 2019, 132. [Google Scholar] [CrossRef]
- Sakane, A.; Honda, K.; Sasaki, T. Rab13 regulates neurite outgrowth in PC12 cells through its effector protein, JRAB/MICAL-L2. Mol Cell Biol 2010, 30, 1077–1087. [Google Scholar] [CrossRef]
- Sakane, A.; Alamir Mahmoud Abdallah, A.; Nakano, K.; Honda, K.; Kitamura, T.; Imoto, I.; Matsushita, N.; Sasaki, T. Junctional Rab13-binding protein (JRAB) regulates cell spreading via filamins. Genes Cells 2013, 18, 810–822. [Google Scholar] [CrossRef]
- Nishimura, N.; Sasaki, T. Regulation of epithelial cell adhesion and repulsion: role of endocytic recycling. J Med Invest 2008, 55, 9–16. [Google Scholar] [CrossRef]
- Sakane, A.; Yoshizawa, S.; Nishimura, M.; Tsuchiya, Y.; Matsushita, N.; Miyake, K.; Horikawa, K.; Imoto, I.; Mizuguchi, C.; Saito, H.; et al. Conformational plasticity of JRAB/MICAL-L2 provides "law and order" in collective cell migration. Mol Biol Cell 2016, 27, 3095–3108. [Google Scholar] [CrossRef]
- Sakane, A.; Yano, T.A.; Uchihashi, T.; Horikawa, K.; Hara, Y.; Imoto, I.; Kurisu, S.; Yamada, H.; Takei, K.; Sasaki, T. JRAB/MICAL-L2 undergoes liquid-liquid phase separation to form tubular recycling endosomes. Commun Biol 2021, 4, 551. [Google Scholar] [CrossRef] [PubMed]
- Yamamura, R.; Nishimura, N.; Nakatsuji, H.; Arase, S.; Sasaki, T. The interaction of JRAB/MICAL-L2 with Rab8 and Rab13 coordinates the assembly of tight junctions and adherens junctions. Mol Biol Cell 2008, 19, 971–983. [Google Scholar] [CrossRef]
- Min, P.; Zhao, S.; Liu, L.; Zhang, Y.; Ma, Y.; Zhao, X.; Wang, Y.; Song, Y.; Zhu, C.; Jiang, H.; et al. MICAL-L2 potentiates Cdc42-dependent EGFR stability and promotes gastric cancer cell migration. J Cell Mol Med 2019, 23, 4475–4488. [Google Scholar] [CrossRef] [PubMed]
- Zhu, L.Y.; Zhang, W.M.; Yang, X.M.; Cui, L.; Li, J.; Zhang, Y.L.; Wang, Y.H.; Ao, J.P.; Ma, M.Z.; Lu, H.; et al. Silencing of MICAL-L2 suppresses malignancy of ovarian cancer by inducing mesenchymal-epithelial transition. Cancer Lett 2015, 363, 71–82. [Google Scholar] [CrossRef]
- Ioannou, M.S.; Bell, E.S.; Girard, M.; Chaineau, M.; Hamlin, J.N.; Daubaras, M.; Monast, A.; Park, M.; Hodgson, L.; McPherson, P.S. DENND2B activates Rab13 at the leading edge of migrating cells and promotes metastatic behavior. J Cell Biol 2015, 208, 629–648. [Google Scholar] [CrossRef]
- Min, P.; Zhang, L.; Wang, Y.; Qi, C.; Song, Y.; Bibi, M.; Zhang, Y.; Ma, Y.; Zhao, X.; Yu, M.; et al. MICAL-L2 Is Essential for c-Myc Deubiquitination and Stability in Non-small Cell Lung Cancer Cells. Front Cell Dev Biol 2020, 8, 575903. [Google Scholar] [CrossRef]
- Yang, Y.; Ye, F.; Xia, T.; Wang, Q.; Zhang, Y.; Du, J. High MICAL-L2 expression and its role in the prognosis of colon adenocarcinoma. BMC Cancer 2022, 22, 487. [Google Scholar] [CrossRef]
- Castresana, J.; Saraste, M. Does Vav bind to F-actin through a CH domain? FEBS Lett 1995, 374, 149–151. [Google Scholar] [CrossRef]
- Rajagopalan, K.; Mooney, S.M.; Parekh, N.; Getzenberg, R.H.; Kulkarni, P. A majority of the cancer/testis antigens are intrinsically disordered proteins. J Cell Biochem 2011, 112, 3256–3267. [Google Scholar] [CrossRef]
- Uversky, V.N. Analyzing IDPs in interactomes. In Intrinsically Disordered Proteins, Kragelund, B.B., Skriver, K., Eds.; Humana New York, NY, 2020; Volume Methods in Molecular Biology, pp. 895-945.
- Mohammed, A.S.; Uversky, V.N. Intrinsic Disorder as a Natural Preservative: High Levels of Intrinsic Disorder in Proteins Found in the 2600-Year-Old Human Brain. Biology (Basel) 2022, 11. [Google Scholar] [CrossRef]
- Sun, X.; Xue, B.; Jones, W.T.; Rikkerink, E.; Dunker, A.K.; Uversky, V.N. A functionally required unfoldome from the plant kingdom: intrinsically disordered N-terminal domains of GRAS proteins are involved in molecular recognition during plant development. Plant Mol Biol 2011, 77, 205–223. [Google Scholar] [CrossRef] [PubMed]
- Xue, B.; Oldfield, C.J.; Van, Y.Y.; Dunker, A.K.; Uversky, V.N. Protein intrinsic disorder and induced pluripotent stem cells. Mol Biosyst 2012, 8, 134–150. [Google Scholar] [CrossRef] [PubMed]
- Mohan, A.; Sullivan, W.J., Jr.; Radivojac, P.; Dunker, A.K.; Uversky, V.N. Intrinsic disorder in pathogenic and non-pathogenic microbes: discovering and analyzing the unfoldomes of early-branching eukaryotes. Mol Biosyst 2008, 4, 328–340. [Google Scholar] [CrossRef]
- Huang, F.; Oldfield, C.; Meng, J.; Hsu, W.L.; Xue, B.; Uversky, V.N.; Romero, P.; Dunker, A.K. Subclassifying disordered proteins by the CH-CDF plot method. Pac Symp Biocomput 2012, 128–139. [Google Scholar]
- Hendrickx, A.; Beullens, M.; Ceulemans, H.; Den Abt, T.; Van Eynde, A.; Nicolaescu, E.; Lesage, B.; Bollen, M. Docking motif-guided mapping of the interactome of protein phosphatase-1. Chem Biol 2009, 16, 365–371. [Google Scholar] [CrossRef]
- Yang, L.; Zhao, J.; Lu, W.; Li, Y.; Du, X.; Ning, T.; Lu, G.; Ke, Y. KIAA0649, a 1A6/DRIM-interacting protein with the oncogenic potential. Biochem Biophys Res Commun 2005, 334, 884–890. [Google Scholar] [CrossRef]
- Zhang, Q.; Zhang, J.; Jin, H.; Sheng, S. Whole transcriptome sequencing identifies tumor-specific mutations in human oral squamous cell carcinoma. BMC Med Genomics 2013, 6, 28. [Google Scholar] [CrossRef]
- Yang, Y.; Ren, P.; Liu, X.; Sun, X.; Zhang, C.; Du, X.; Xing, B. PPP1R26 drives hepatocellular carcinoma progression by controlling glycolysis and epithelial-mesenchymal transition. J Exp Clin Cancer Res 2022, 41, 101. [Google Scholar] [CrossRef]
- Perez, Y.; Menascu, S.; Cohen, I.; Kadir, R.; Basha, O.; Shorer, Z.; Romi, H.; Meiri, G.; Rabinski, T.; Ofir, R.; et al. RSRC1 mutation affects intellect and behaviour through aberrant splicing and transcription, downregulating IGFBP3. Brain 2018, 141, 961–970. [Google Scholar] [CrossRef]
- Cazalla, D.; Newton, K.; Caceres, J.F. A novel SR-related protein is required for the second step of Pre-mRNA splicing. Mol Cell Biol 2005, 25, 2969–2980. [Google Scholar] [CrossRef]
- Chen, L.; Li, W.; Qiu, W.; Ren, W.; Li, Q.; Han, B.; Zhou, L.; Cheng, L.; Zhang, H.; Ye, Q. RSRC1 SUMOylation enhances SUMOylation and inhibits transcriptional activity of estrogen receptor beta. FEBS Lett 2015, 589, 1476–1484. [Google Scholar] [CrossRef] [PubMed]
- Record, J.; Malinova, D.; Zenner, H.L.; Plagnol, V.; Nowak, K.; Syed, F.; Bouma, G.; Curtis, J.; Gilmour, K.; Cale, C.; et al. Immunodeficiency and severe susceptibility to bacterial infection associated with a loss-of-function homozygous mutation of MKL1. Blood 2015, 126, 1527–1535. [Google Scholar] [CrossRef] [PubMed]
- Brandt, D.T.; Baarlink, C.; Kitzing, T.M.; Kremmer, E.; Ivaska, J.; Nollau, P.; Grosse, R. SCAI acts as a suppressor of cancer cell invasion through the transcriptional control of beta1-integrin. Nat Cell Biol 2009, 11, 557–568. [Google Scholar] [CrossRef]
- Osmanagic-Myers, S.; Kiss, A.; Manakanatas, C.; Hamza, O.; Sedlmayer, F.; Szabo, P.L.; Fischer, I.; Fichtinger, P.; Podesser, B.K.; Eriksson, M.; et al. Endothelial progerin expression causes cardiovascular pathology through an impaired mechanoresponse. J Clin Invest 2019, 129, 531–545. [Google Scholar] [CrossRef]
- Scharenberg, M.A.; Chiquet-Ehrismann, R.; Asparuhova, M.B. Megakaryoblastic leukemia protein-1 (MKL1): Increasing evidence for an involvement in cancer progression and metastasis. Int J Biochem Cell Biol 2010, 42, 1911–1914. [Google Scholar] [CrossRef]
- Mouilleron, S.; Langer, C.A.; Guettler, S.; McDonald, N.Q.; Treisman, R. Structure of a pentavalent G-actin*MRTF-A complex reveals how G-actin controls nucleocytoplasmic shuttling of a transcriptional coactivator. Sci Signal 2011, 4, ra40. [Google Scholar] [CrossRef]
- Aravind, L.; Koonin, E.V. SAP - a putative DNA-binding motif involved in chromosomal organization. Trends Biochem Sci 2000, 25, 112–114. [Google Scholar] [CrossRef]
- Patwardhan, A.; Bardin, S.; Miserey-Lenkei, S.; Larue, L.; Goud, B.; Raposo, G.; Delevoye, C. Routing of the RAB6 secretory pathway towards the lysosome related organelle of melanocytes. Nat Commun 2017, 8, 15835. [Google Scholar] [CrossRef]
- Ducut Sigala, J.L.; Bottero, V.; Young, D.B.; Shevchenko, A.; Mercurio, F.; Verma, I.M. Activation of transcription factor NF-kappaB requires ELKS, an IkappaB kinase regulatory subunit. Science 2004, 304, 1963–1967. [Google Scholar] [CrossRef]
- Israel, A. The IKK complex, a central regulator of NF-kappaB activation. Cold Spring Harb Perspect Biol 2010, 2, a000158. [Google Scholar] [CrossRef]
- Nakata, T.; Kitamura, Y.; Shimizu, K.; Tanaka, S.; Fujimori, M.; Yokoyama, S.; Ito, K.; Emi, M. Fusion of a novel gene, ELKS, to RET due to translocation t(10;12)(q11;p13) in a papillary thyroid carcinoma. Genes Chromosomes Cancer 1999, 25, 97–103. [Google Scholar] [CrossRef]
- Sala, K.; Corbetta, A.; Minici, C.; Tonoli, D.; Murray, D.H.; Cammarota, E.; Ribolla, L.; Ramella, M.; Fesce, R.; Mazza, D.; et al. The ERC1 scaffold protein implicated in cell motility drives the assembly of a liquid phase. Sci Rep 2019, 9, 13530. [Google Scholar] [CrossRef] [PubMed]
- Iwano, T.; Sobajima, T.; Takeda, S.; Harada, A.; Yoshimura, S.I. The Rab GTPase-binding protein EHBP1L1 and its interactors CD2AP/CIN85 negatively regulate the length of primary cilia via actin remodeling. J Biol Chem 2023, 299, 102985. [Google Scholar] [CrossRef] [PubMed]
- Nakajo, A.; Yoshimura, S.; Togawa, H.; Kunii, M.; Iwano, T.; Izumi, A.; Noguchi, Y.; Watanabe, A.; Goto, A.; Sato, T.; et al. EHBP1L1 coordinates Rab8 and Bin1 to regulate apical-directed transport in polarized epithelial cells. J Cell Biol 2016, 212, 297–306. [Google Scholar] [CrossRef]
- Wu, J.; Moriwaki, K.; Asuka, T.; Nakai, R.; Kanda, S.; Taniguchi, M.; Sugiyama, T.; Yoshimura, S.I.; Kunii, M.; Nagasawa, T.; et al. EHBP1L1, an apicobasal polarity regulator, is critical for nuclear polarization during enucleation of erythroblasts. Blood Adv 2023, 7, 3382–3394. [Google Scholar] [CrossRef]
- Kunii, M.; Harada, A. Molecular mechanisms of polarized transport to the apical plasma membrane. Front Cell Dev Biol 2024, 12, 1477173. [Google Scholar] [CrossRef]
- Pan, Y.; Shu, G.; Fu, L.; Huang, K.; Zhou, X.; Gui, C.; Liu, H.; Jin, X.; Chen, M.; Li, P.; et al. EHBP1L1 Drives Immune Evasion in Renal Cell Carcinoma through Binding and Stabilizing JAK1. Adv Sci (Weinh) 2023, 10, e2206792. [Google Scholar] [CrossRef]
- Szklarczyk, D.; Kirsch, R.; Koutrouli, M.; Nastou, K.; Mehryary, F.; Hachilif, R.; Gable, A.L.; Fang, T.; Doncheva, N.T.; Pyysalo, S.; et al. The STRING database in 2023: protein-protein association networks and functional enrichment analyses for any sequenced genome of interest. Nucleic Acids Res 2023, 51, D638–D646. [Google Scholar] [CrossRef]
- Dayhoff, G.W., 2nd; Uversky, V.N. Rapid prediction and analysis of protein intrinsic disorder. Protein Sci 2022, 31, e4496. [Google Scholar] [CrossRef]
- Uversky, V.N.; Gillespie, J.R.; Fink, A.L. Why are "natively unfolded" proteins unstructured under physiologic conditions? Proteins 2000, 41, 415–427. [Google Scholar] [CrossRef]
- Oldfield, C.J.; Cheng, Y.; Cortese, M.S.; Brown, C.J.; Uversky, V.N.; Dunker, A.K. Comparing and combining predictors of mostly disordered proteins. Biochemistry 2005, 44, 1989–2000. [Google Scholar] [CrossRef] [PubMed]
- Huang, F.; Oldfield, C.J.; Xue, B.; Hsu, W.L.; Meng, J.; Liu, X.; Shen, L.; Romero, P.; Uversky, V.N.; Dunker, A. Improving protein order-disorder classification using charge-hydropathy plots. BMC Bioinformatics 2014, 15 Suppl 17, S4. [Google Scholar] [CrossRef]
- Dosztanyi, Z.; Csizmok, V.; Tompa, P.; Simon, I. The pairwise energy content estimated from amino acid composition discriminates between folded and intrinsically unstructured proteins. J Mol Biol 2005, 347, 827–839. [Google Scholar] [CrossRef] [PubMed]
- Meszaros, B.; Erdos, G.; Dosztanyi, Z. IUPred2A: context-dependent prediction of protein disorder as a function of redox state and protein binding. Nucleic Acids Res 2018, 46, W329–W337. [Google Scholar] [CrossRef]
- Dosztanyi, Z.; Meszaros, B.; Simon, I. ANCHOR: web server for predicting protein binding regions in disordered proteins. Bioinformatics 2009, 25, 2745–2746. [Google Scholar] [CrossRef]
- Meszaros, B.; Simon, I.; Dosztanyi, Z. Prediction of protein binding regions in disordered proteins. PLoS Comput Biol 2009, 5, e1000376. [Google Scholar] [CrossRef]
- Cheng, Y.; Oldfield, C.J.; Meng, J.; Romero, P.; Uversky, V.N.; Dunker, A.K. Mining alpha-helix-forming molecular recognition features with cross species sequence alignments. Biochemistry 2007, 46, 13468–13477. [Google Scholar] [CrossRef]
- Mohan, A.; Oldfield, C.J.; Radivojac, P.; Vacic, V.; Cortese, M.S.; Dunker, A.K.; Uversky, V.N. Analysis of molecular recognition features (MoRFs). J Mol Biol 2006, 362, 1043–1059. [Google Scholar] [CrossRef]
- Oldfield, C.J.; Cheng, Y.; Cortese, M.S.; Romero, P.; Uversky, V.N.; Dunker, A.K. Coupled folding and binding with alpha-helix-forming molecular recognition elements. Biochemistry 2005, 44, 12454–12470. [Google Scholar] [CrossRef]
- Vacic, V.; Oldfield, C.J.; Mohan, A.; Radivojac, P.; Cortese, M.S.; Uversky, V.N.; Dunker, A.K. Characterization of molecular recognition features, MoRFs, and their binding partners. J Proteome Res 2007, 6, 2351–2366. [Google Scholar] [CrossRef]
- Oldfield, C.J.; Meng, J.; Yang, J.Y.; Yang, M.Q.; Uversky, V.N.; Dunker, A.K. Flexible nets: disorder and induced fit in the associations of p53 and 14-3-3 with their partners. BMC Genomics 2008, 9 Suppl 1, S1. [Google Scholar] [CrossRef]
- Hsu, W.L.; Oldfield, C.; Meng, J.; Huang, F.; Xue, B.; Uversky, V.N.; Romero, P.; Dunker, A.K. Intrinsic protein disorder and protein-protein interactions. Pac Symp Biocomput 2012, 116–127. [Google Scholar]
- Hsu, W.L.; Oldfield, C.J.; Xue, B.; Meng, J.; Huang, F.; Romero, P.; Uversky, V.N.; Dunker, A.K. Exploring the binding diversity of intrinsically disordered proteins involved in one-to-many binding. Protein Sci 2013, 22, 258–273. [Google Scholar] [CrossRef] [PubMed]
- Paysan-Lafosse, T.; Blum, M.; Chuguransky, S.; Grego, T.; Pinto, B.L.; Salazar, G.A.; Bileschi, M.L.; Bork, P.; Bridge, A.; Colwell, L.; et al. InterPro in 2022. Nucleic Acids Res 2023, 51, D418–D427. [Google Scholar] [CrossRef]
- Blum, M.; Andreeva, A.; Florentino, L.C.; Chuguransky, S.R.; Grego, T.; Hobbs, E.; Pinto, B.L.; Orr, A.; Paysan-Lafosse, T.; Ponamareva, I.; et al. InterPro: the protein sequence classification resource in 2025. Nucleic Acids Res 2025, 53, D444–D456. [Google Scholar] [CrossRef]
- Hardenberg, M.; Horvath, A.; Ambrus, V.; Fuxreiter, M.; Vendruscolo, M. Widespread occurrence of the droplet state of proteins in the human proteome. Proc Natl Acad Sci U S A 2020, 117, 33254–33262. [Google Scholar] [CrossRef]
- Hirose, T.; Ninomiya, K.; Nakagawa, S.; Yamazaki, T. A guide to membraneless organelles and their various roles in gene regulation. Nature Reviews Molecular Cell Biology 2023, 24, 288–304. [Google Scholar] [CrossRef]
- Jumper, J.; Evans, R.; Pritzel, A.; Green, T.; Figurnov, M.; Ronneberger, O.; Tunyasuvunakool, K.; Bates, R.; Zidek, A.; Potapenko, A.; et al. Highly accurate protein structure prediction with AlphaFold. Nature 2021, 596, 583–589. [Google Scholar] [CrossRef]
- Varadi, M.; Bertoni, D.; Magana, P.; Paramval, U.; Pidruchna, I.; Radhakrishnan, M.; Tsenkov, M.; Nair, S.; Mirdita, M.; Yeo, J.; et al. AlphaFold Protein Structure Database in 2024: providing structure coverage for over 214 million protein sequences. Nucleic Acids Res 2024, 52, D368–D375. [Google Scholar] [CrossRef]
- Oates, M.E.; Romero, P.; Ishida, T.; Ghalwash, M.; Mizianty, M.J.; Xue, B.; Dosztanyi, Z.; Uversky, V.N.; Obradovic, Z.; Kurgan, L.; et al. D(2)P(2): database of disordered protein predictions. Nucleic Acids Res 2013, 41, D508–516. [Google Scholar] [CrossRef]
- Li, X.; Romero, P.; Rani, M.; Dunker, A.K.; Obradovic, Z. Predicting Protein Disorder for N-, C-, and Internal Regions. Genome Inform Ser Workshop Genome Inform 1999, 10, 30–40. [Google Scholar] [PubMed]
- Peng, K.; Radivojac, P.; Vucetic, S.; Dunker, A.K.; Obradovic, Z. Length-dependent prediction of protein intrinsic disorder. BMC Bioinformatics 2006, 7, 208. [Google Scholar] [CrossRef] [PubMed]
- Ishida, T.; Kinoshita, K. PrDOS: prediction of disordered protein regions from amino acid sequence. Nucleic Acids Res 2007, 35, W460–464. [Google Scholar] [CrossRef] [PubMed]
- Walsh, I.; Martin, A.J.; Di Domenico, T.; Tosatto, S.C. ESpritz: accurate and fast prediction of protein disorder. Bioinformatics 2012, 28, 503–509. [Google Scholar] [CrossRef]
Figure 1.
Functional disorder analysis of human MICAL1 (UniProt ID: Q8TDZ2). A. Per-residue disorder profile generated by RIDAO. The outputs of PONDR® VLXT, PONDR® VSL2, PONDR® VL3, PONDR® FIT, IUPred long, and IUPred short are shown by black, red, green, pink, blue, and yellow lines, respectively. The output of the ANCHOR-2 algorithm is shown by dark yellow circles connected by dark yellow lines. Mean disorder profile (or mean disorder prediction, MDP) calculated as an average of outputs of these six predictors is shown by dashed dark pink line, whereas error distribution is shown as light pink shadow. In this per-residue disorder analysis, a disorder score was assigned to each residue. A residue with disorder scores equal to or above 0.5 is considered as disordered and a residue with disorder score below 0.5 is predicted as ordered. Residues/regions with disorder scores between 0.15 and 0.5 were considered as ordered but flexible. The corresponding thresholds are shown by solid (0.5) and long-dashed lines (0.15). Positions of the predicted disorder-based binding sites (MoRF regions) are defined as regions with the scores exceeding the 0.5 threshold. B. Evaluation of LLPS potential of human MICAL1 using FuzDrop in a form of the residue-based droplet-promoting probability (pDP) distribution. Residues with pDP ≥ 0.60 is capable to promote LLPS. Droplet-promoting regions (DPRs) are defined by at least five consecutive residues with pDP ≥ 0.60. Aggregation hot-spots are DPRs (pDP ≥ 0.60) that exhibit high interaction mode divergence (SBIND ≥ 2.2). Positions of DPRs and aggregation hot spots are shown by blue and orange bars, respectively. C. Sequence distribution of cellular context dependent interactability. Regions with context-dependent interactions change protein interaction behavior and binding modes under different cellular conditions. These residues can be ordered or disordered with SBIND ≥ 2.25. D. Functional disorder profile generated by D2P2 shows the outputs of several disorder predictors such as PONDR® VLXT, PONDR® VSL2b, PrDOS, IU-Pred and Espritz. Consensus disorder predictions are shown by blue-green-white bar, where blue indicates regions are where the disorder predictions intersect the SCOP domain prediction and green indicates regions represent disorder that is not found within a predicted SCOP domain. The colored bar highlighted by blue and green shade represents the consensus disorder prediction. Above this consensus bar, line with numbered, colored bars show the predicted locations of SCOP (Structural Classifications of Proteins) domains. Yellow zigzagged bars show positions of MoRFs, whereas colored circles in the bottom of the plot show the positions of predicted PTMs. E. 3D structure of MICAL1 modeled by AlphaFold. Structure is colored based on the AlphaFold-generated per-residue confidence score (pLDDT) that ranges between 0 and 100, where orange, yellow, cyan, and blue colors correspond to the segments predicted by AlphaFold with very high very low (pLDDT < 50), low (70 > pLDDT > 50), high (90 > pLDDT > 70), and (pLDDT > 90) confidence. F. Protein-protein interaction (PPI) network generated by STRING using seven types of evidence shown by differently colored lines: a black line represents co-expression evidence; a blue line – co-occurrence evidence; a green line - neighborhood evidence; a light blue line – database evidence; a purple line – experimental evidence; a red line – the presence of fusion evidence; and a yellow line – text mining evidence.
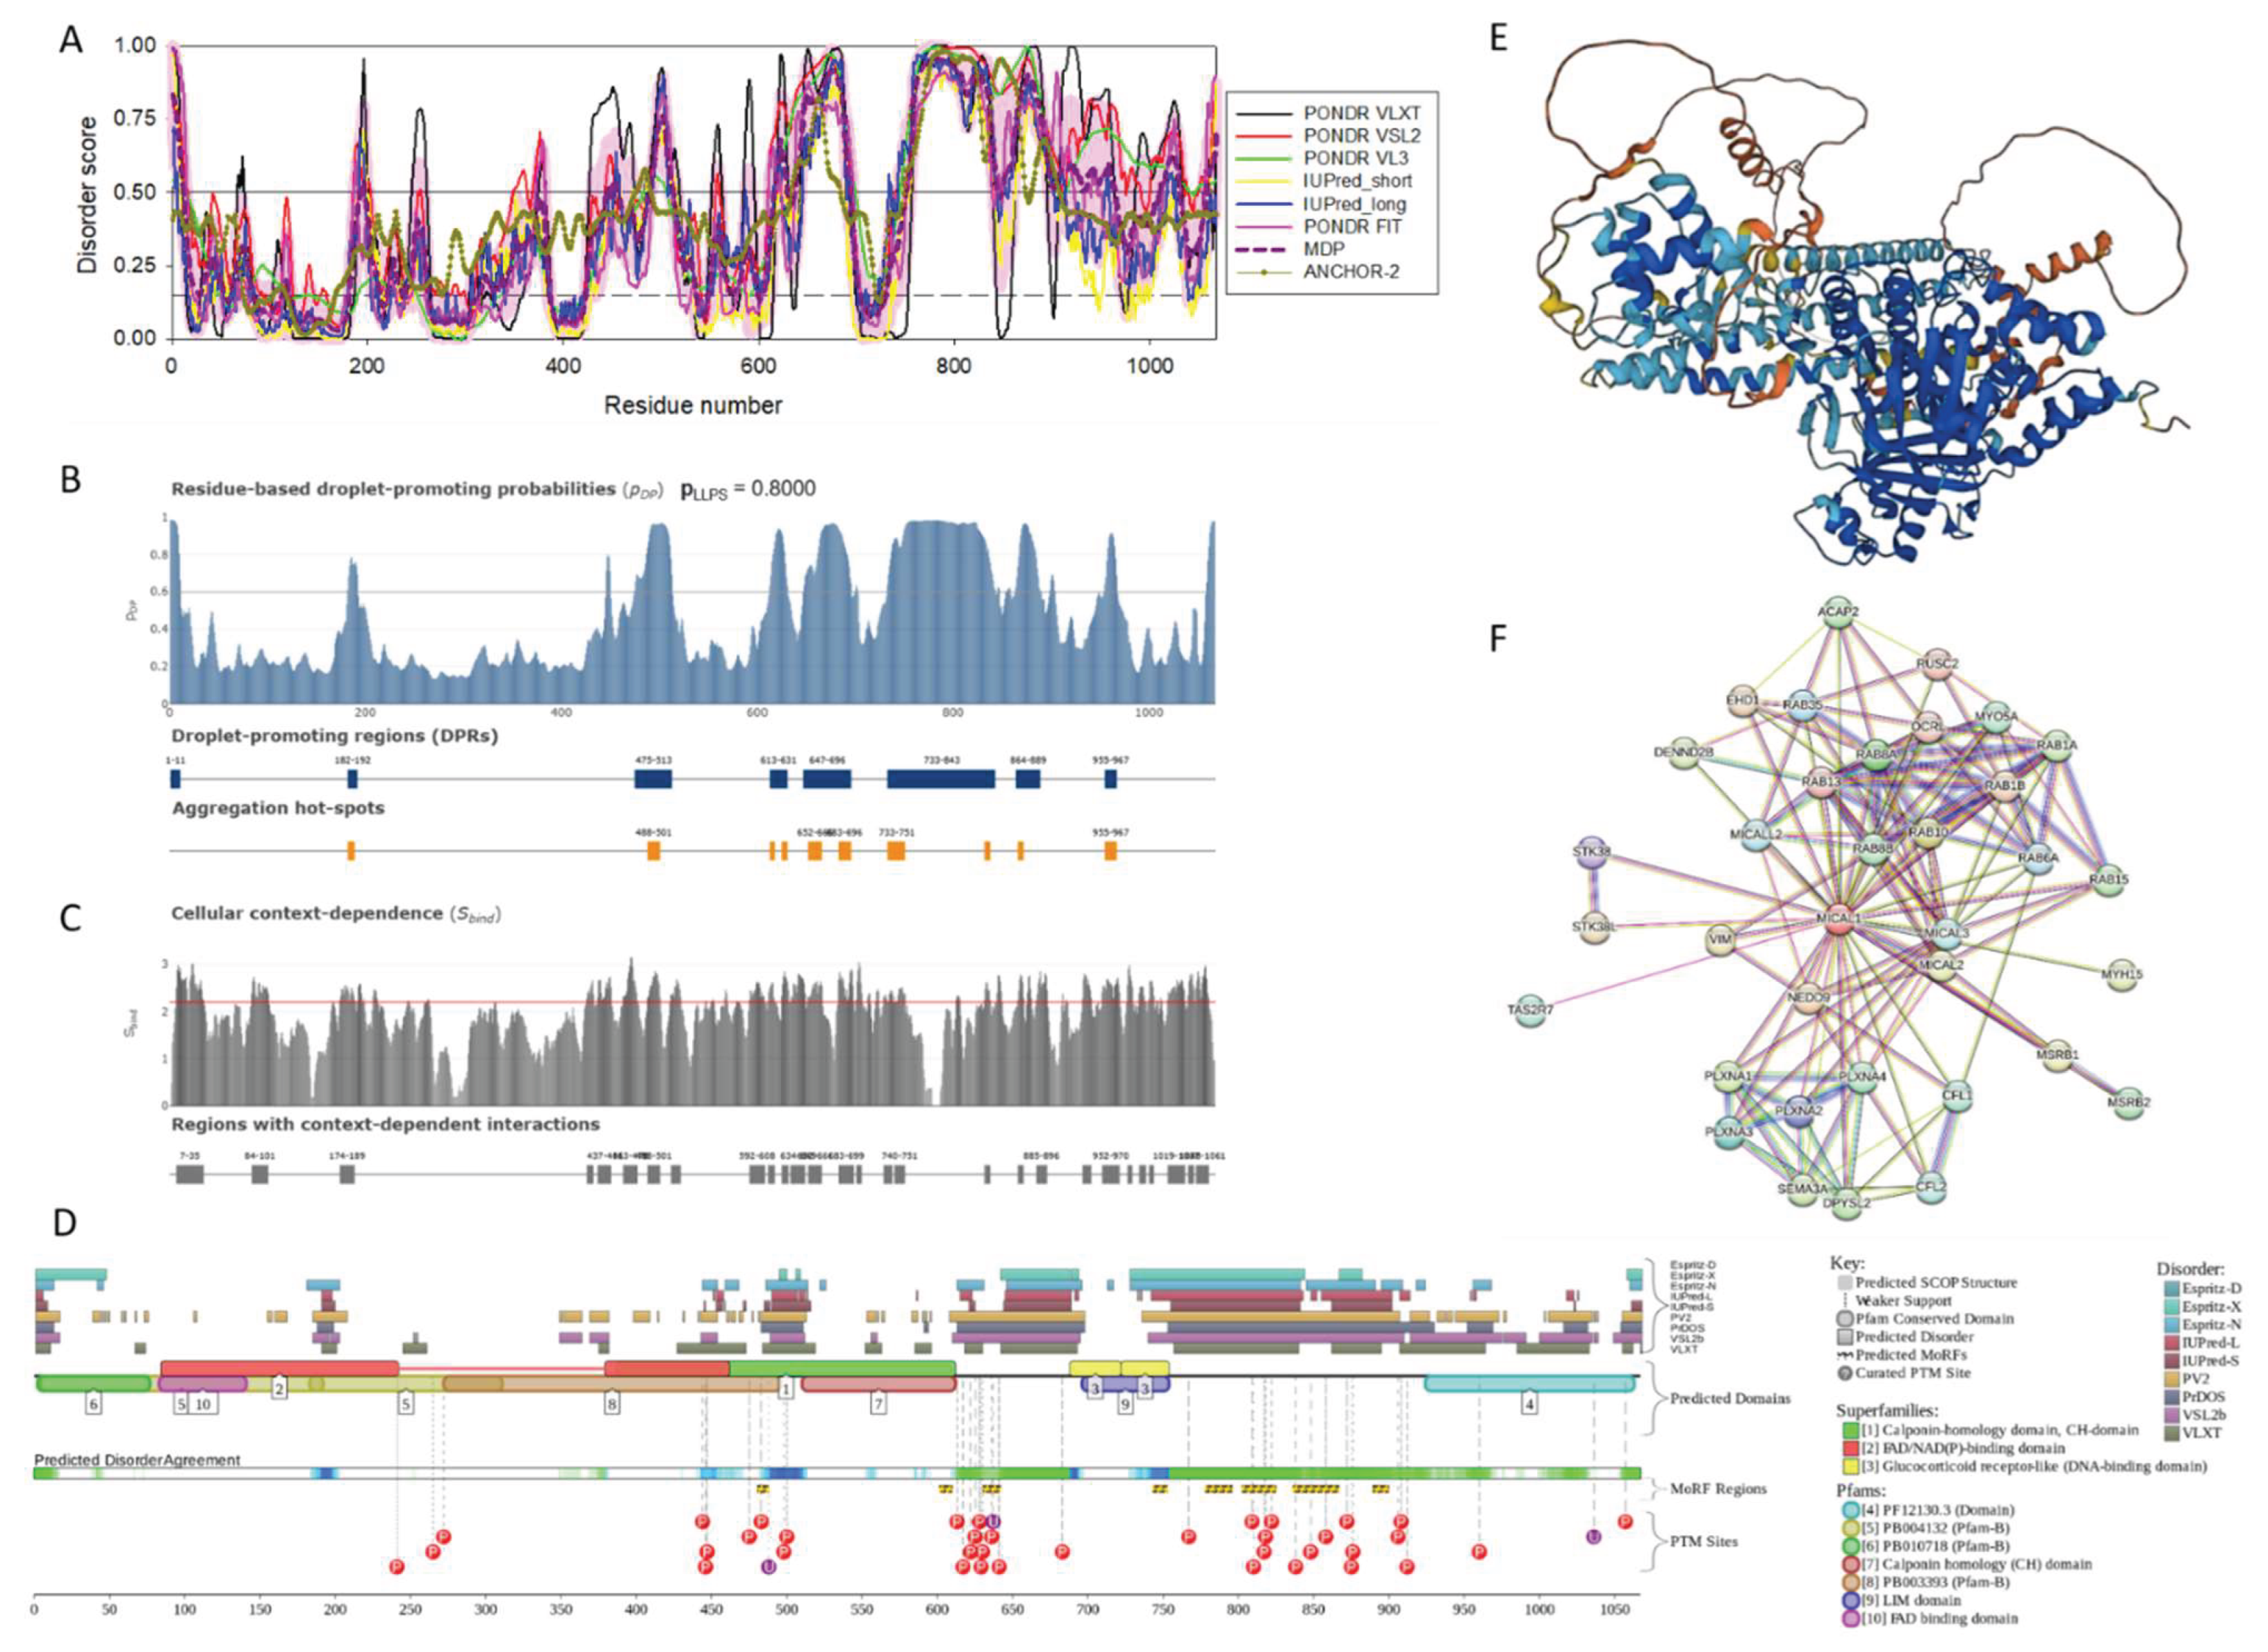
Figure 2.
Functional disorder analysis of human MICAL2 (UniProt ID: O94851). A. RIDAO-generated per-residue intrinsic disorder propensity profile. B. Evaluation of LLPS potential of human MICAL2 using FuzDrop. C. Sequence distribution of cellular context dependent interactability. D. Functional disorder profile generated by D2P2 for the alternatively spliced isoform 1 of human MICAL2. E. 3D structure of MICAL2 modeled by AlphaFold. F. MICAL2-centered PPI network generated by STRING.
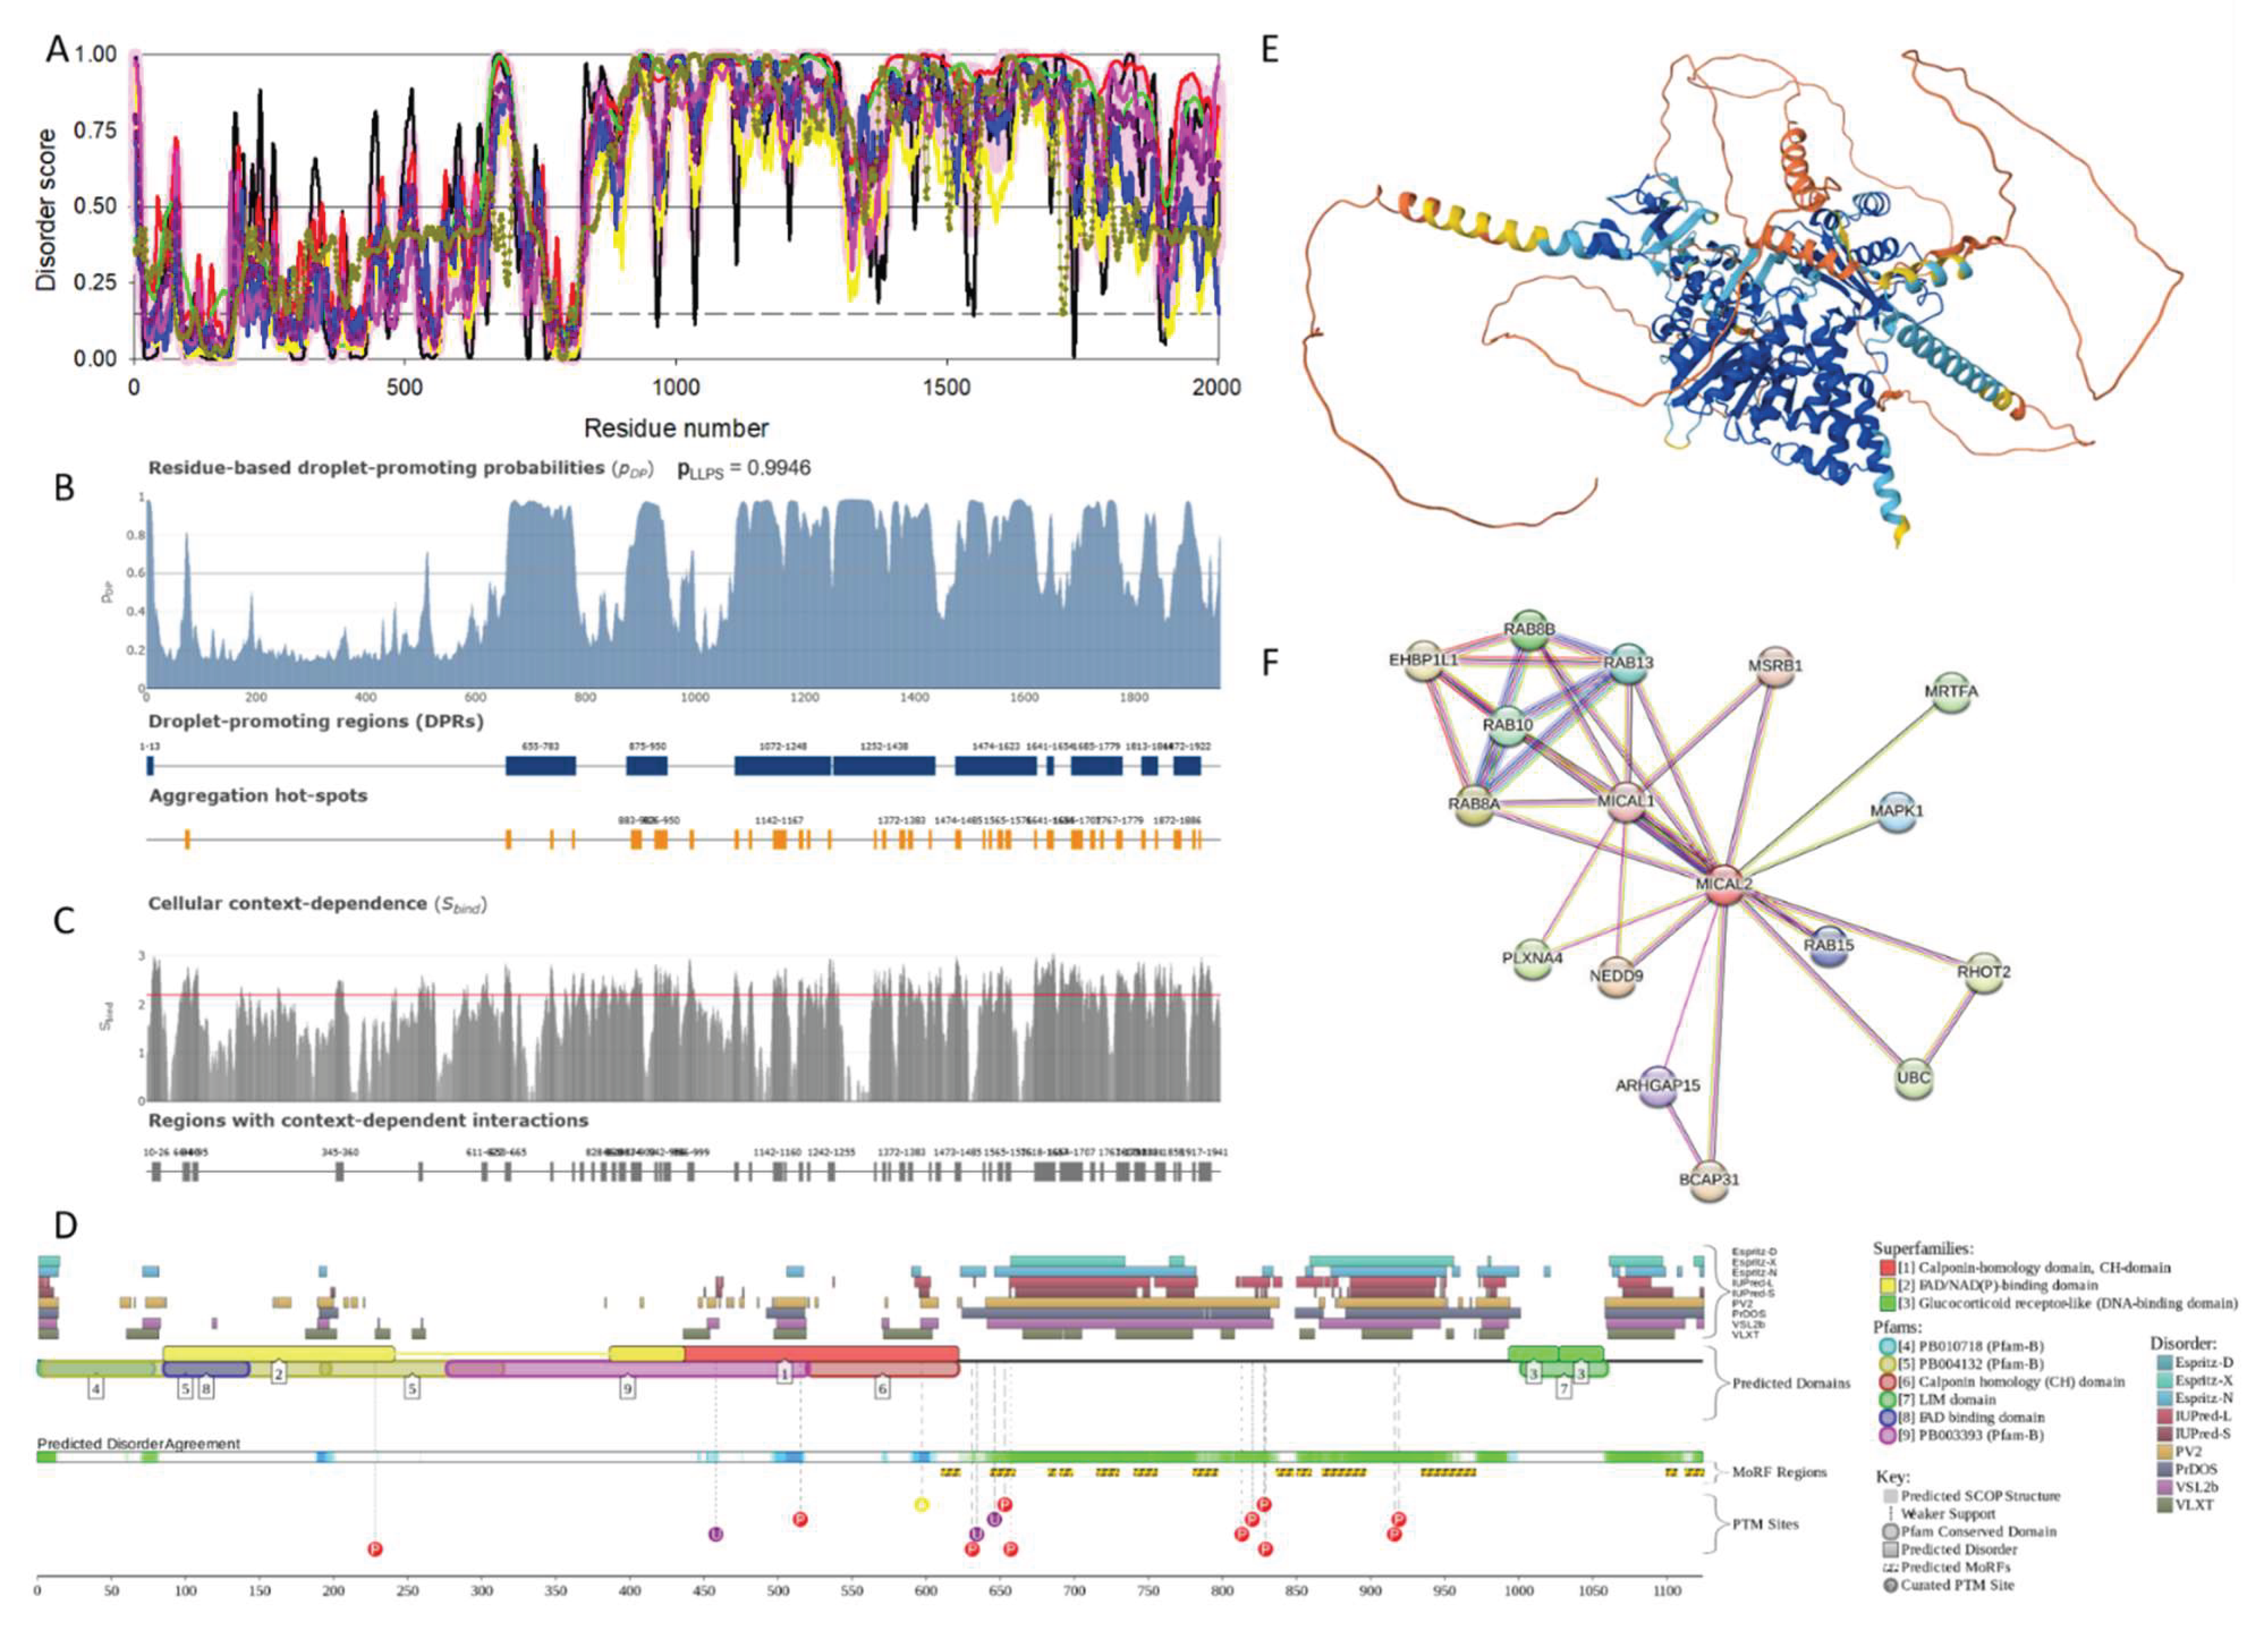
Figure 3.
Functional disorder Functional disorder analysis of human MICAL3 (UniProt ID: Q7RTP6). A. RIDAO-generated per-residue intrinsic disorder propensity profile. B. Evaluation of LLPS potential of human MICAL3 using FuzDrop. C. Sequence distribution of the MICAL3 cellular context dependent interactability. D. Functional disorder profile generated by D2P2. E. 3D structure of MICAL3 modeled by AlphaFold. F. MICAL3-centered PPI network generated by STRING.
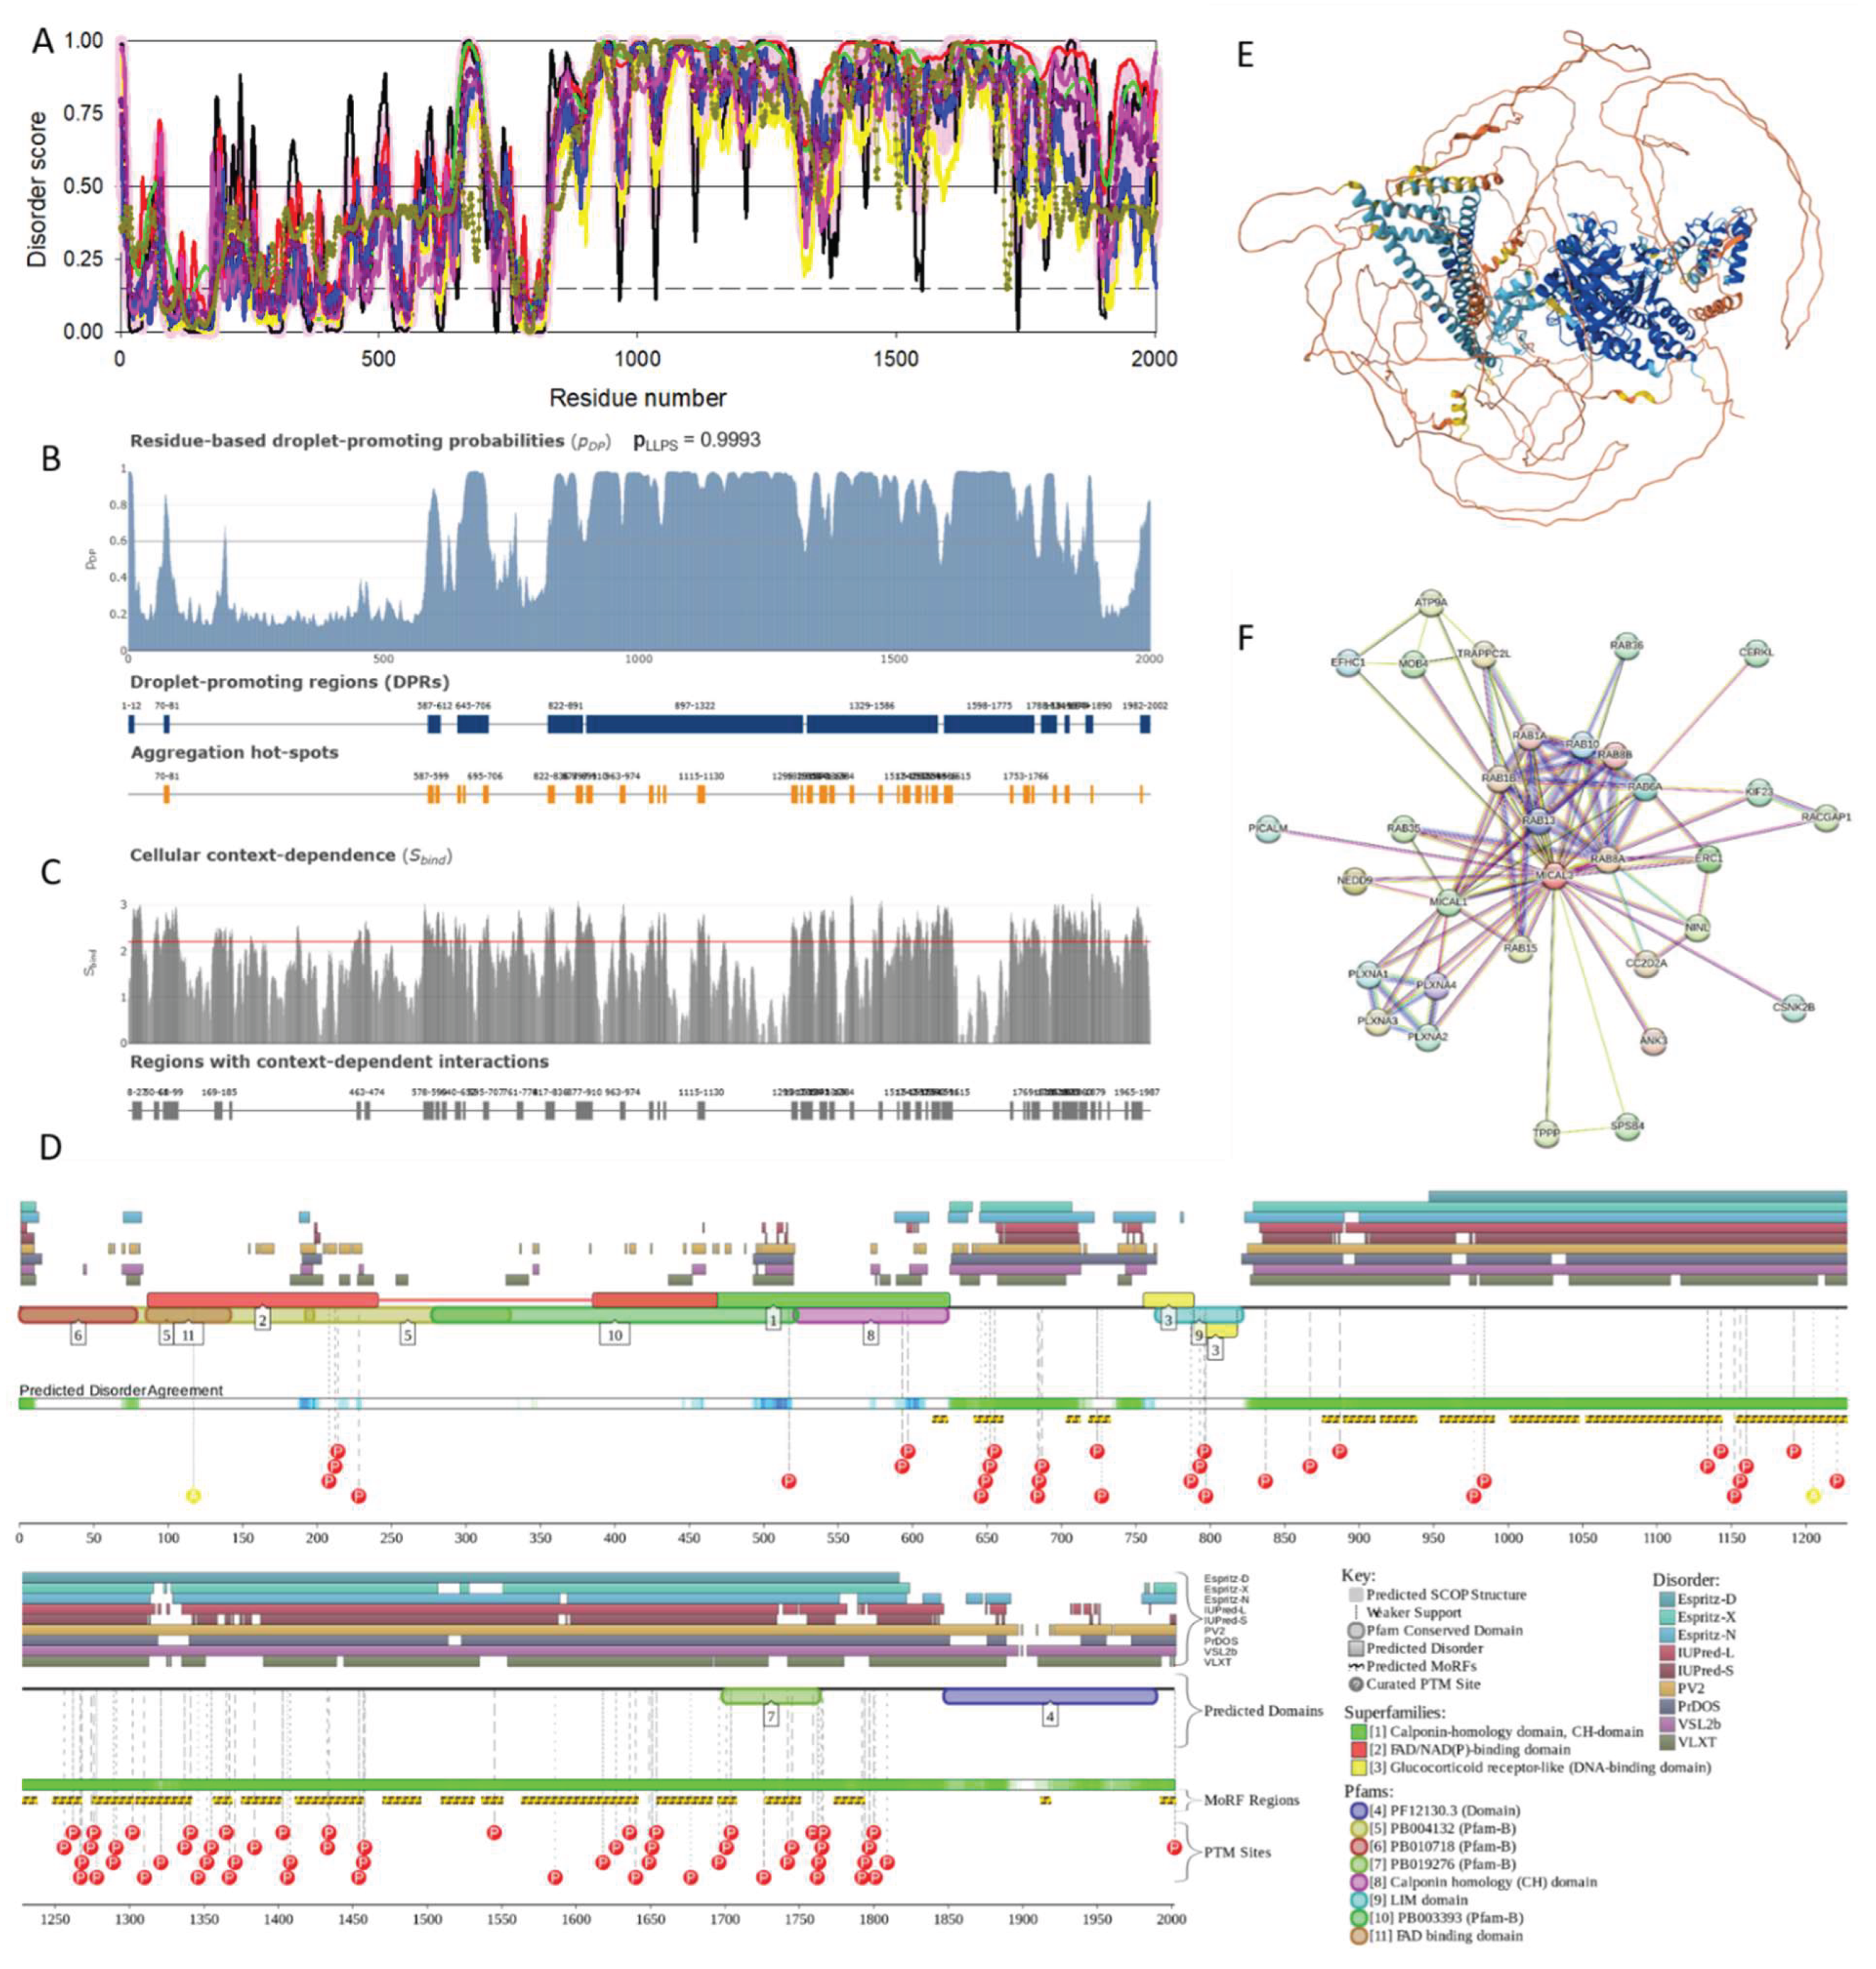
Figure 4.
Functional disorder analysis of human MICAL-L1 (UniProt ID: Q8N3F8). A. RIDAO-generated per-residue intrinsic disorder propensity profile. B. Evaluation of LLPS potential of human MICAL-L1 using FuzDrop. C. Sequence distribution of the MICAL-L1 cellular context dependent interactability. D. Functional disorder profile generated by D2P2 platform. E. 3D structure of MICAL-L1 modeled by AlphaFold. F. STRING-generated PPI network centered at MICAL-L1.
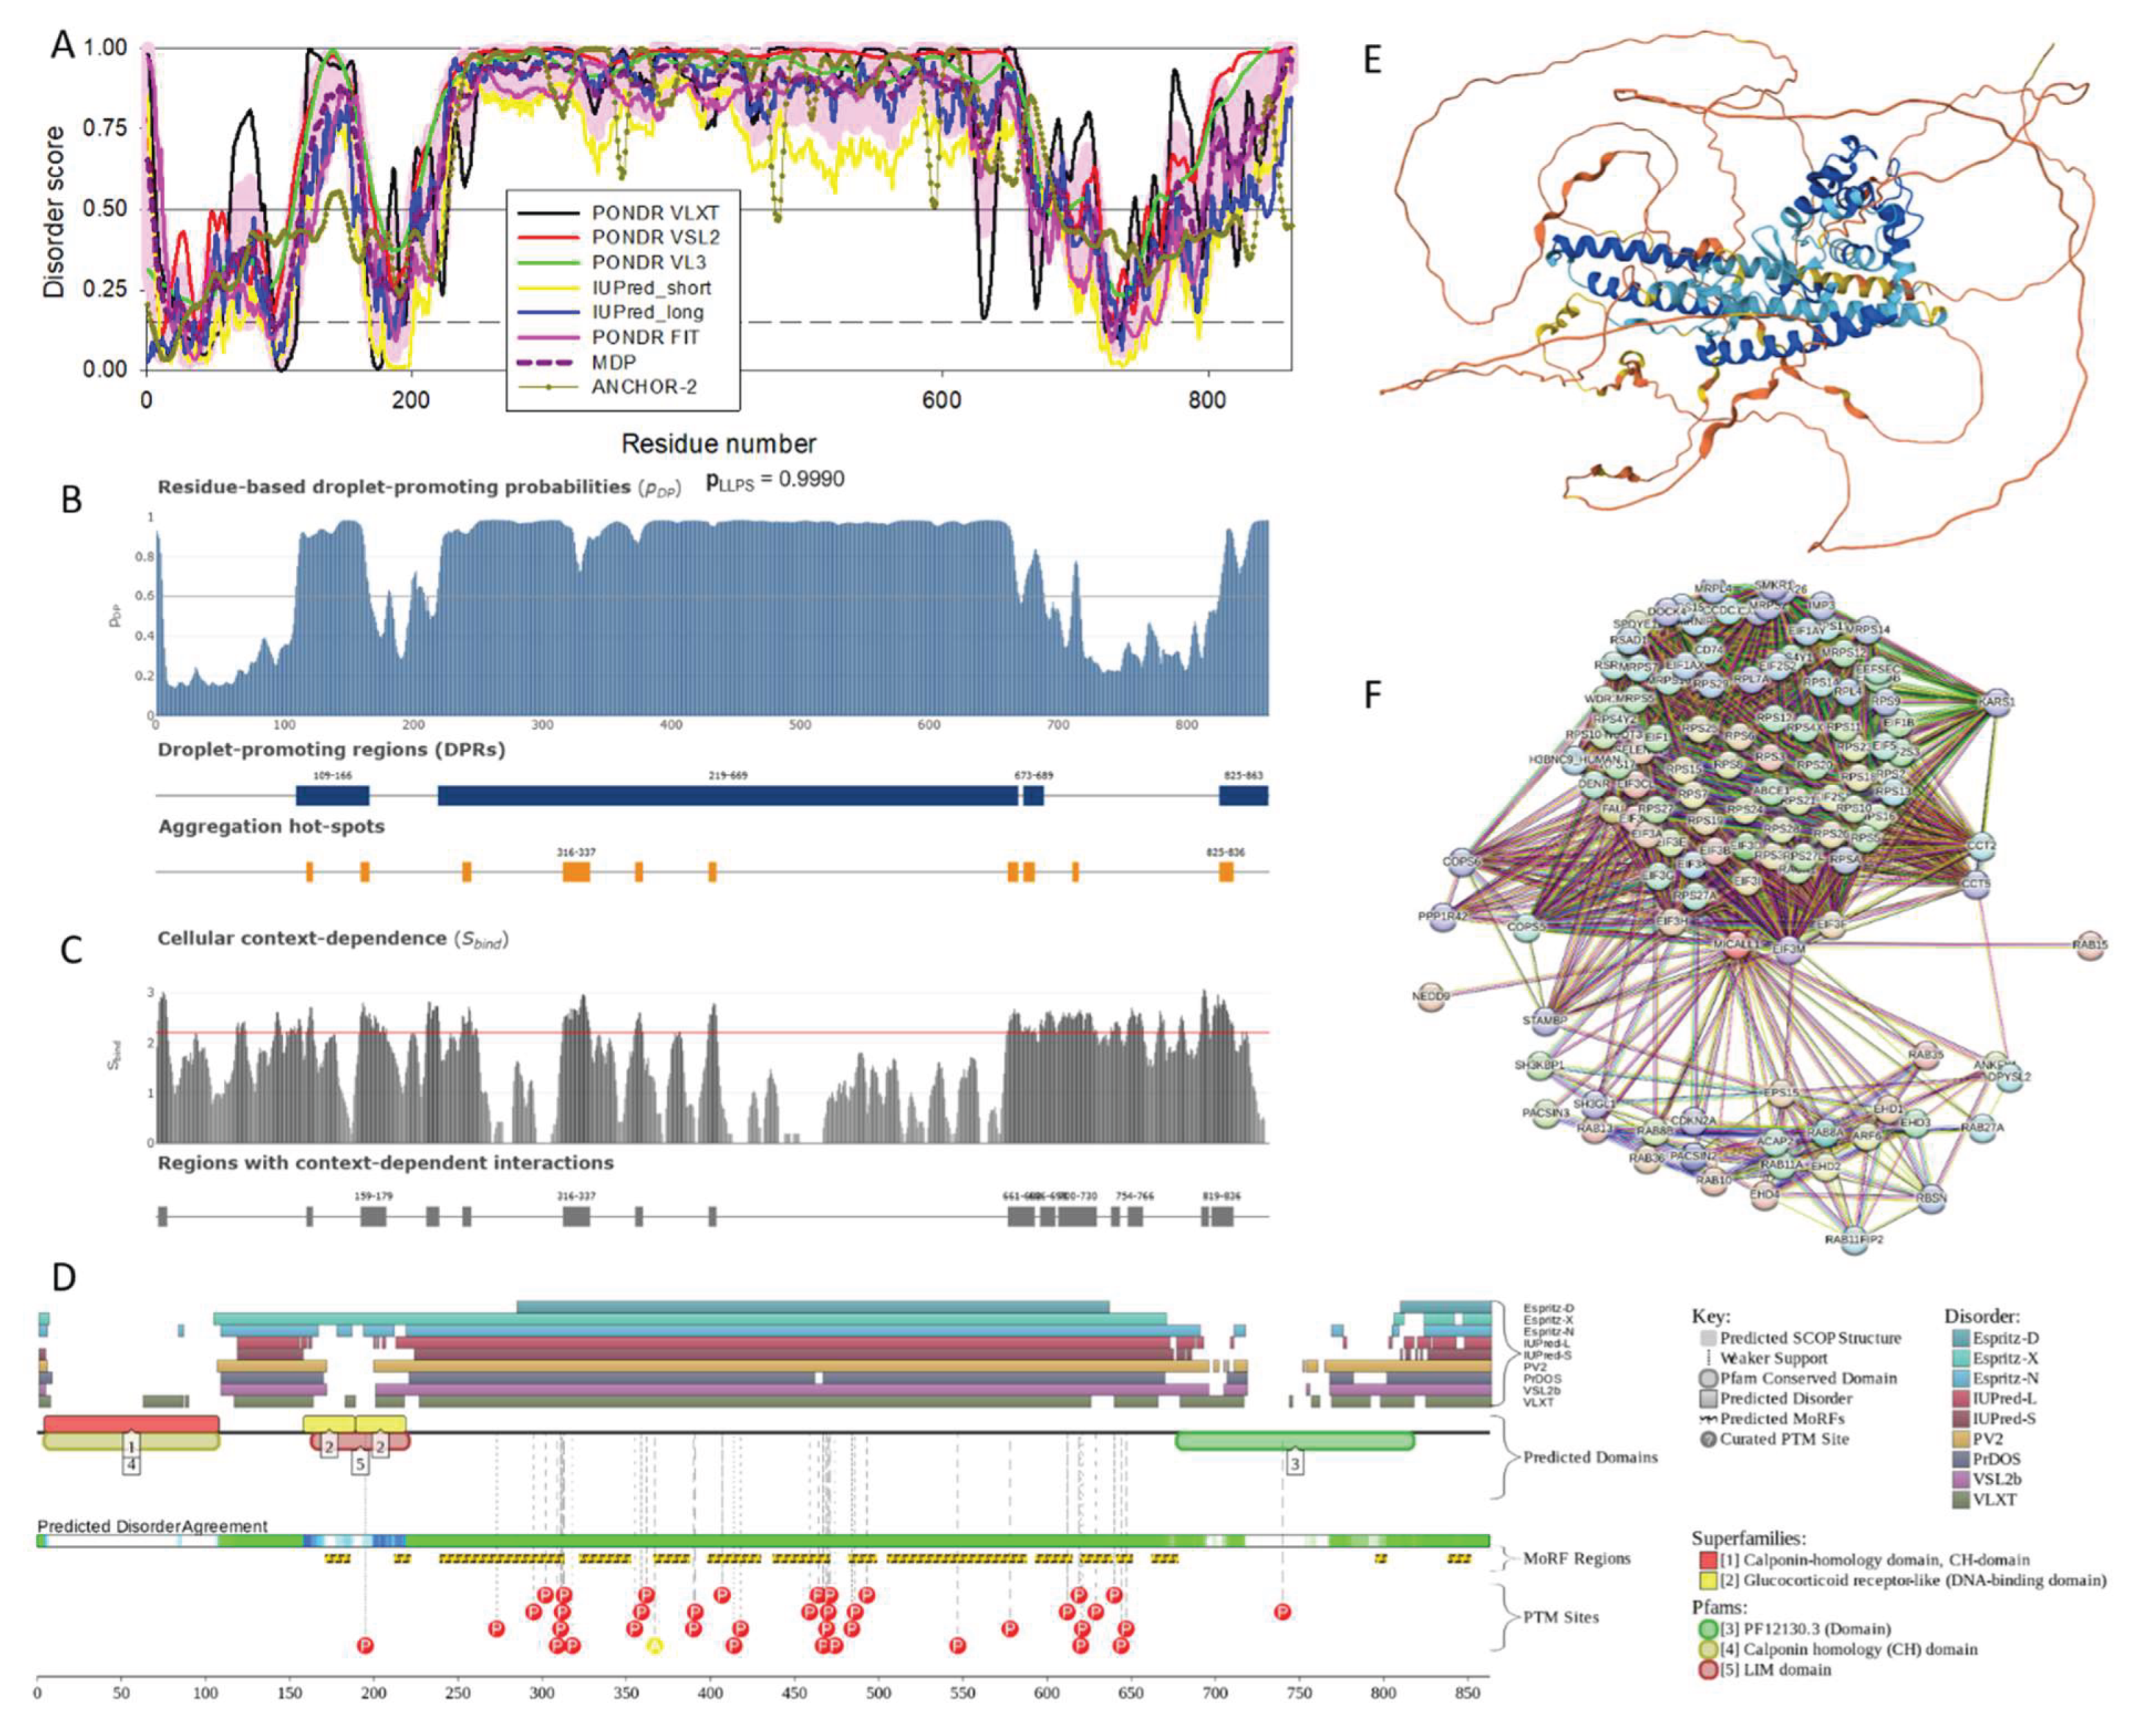
Figure 5.
Functional disorder analysis of human MICAL-L2 (UniProt ID: Q8IY33). A. RIDAO-generated per-residue intrinsic disorder propensity profile. B. Evaluation of LLPS potential of human MICAL-L2 using FuzDrop. C. Sequence distribution of the MICAL-L2 cellular context dependent interactability. D. D2P2-generated functional disorder profile. E. 3D structure of MICAL-L2 modeled by AlphaFold. F. STRING-generated PPI network centered at MICAL-L2.
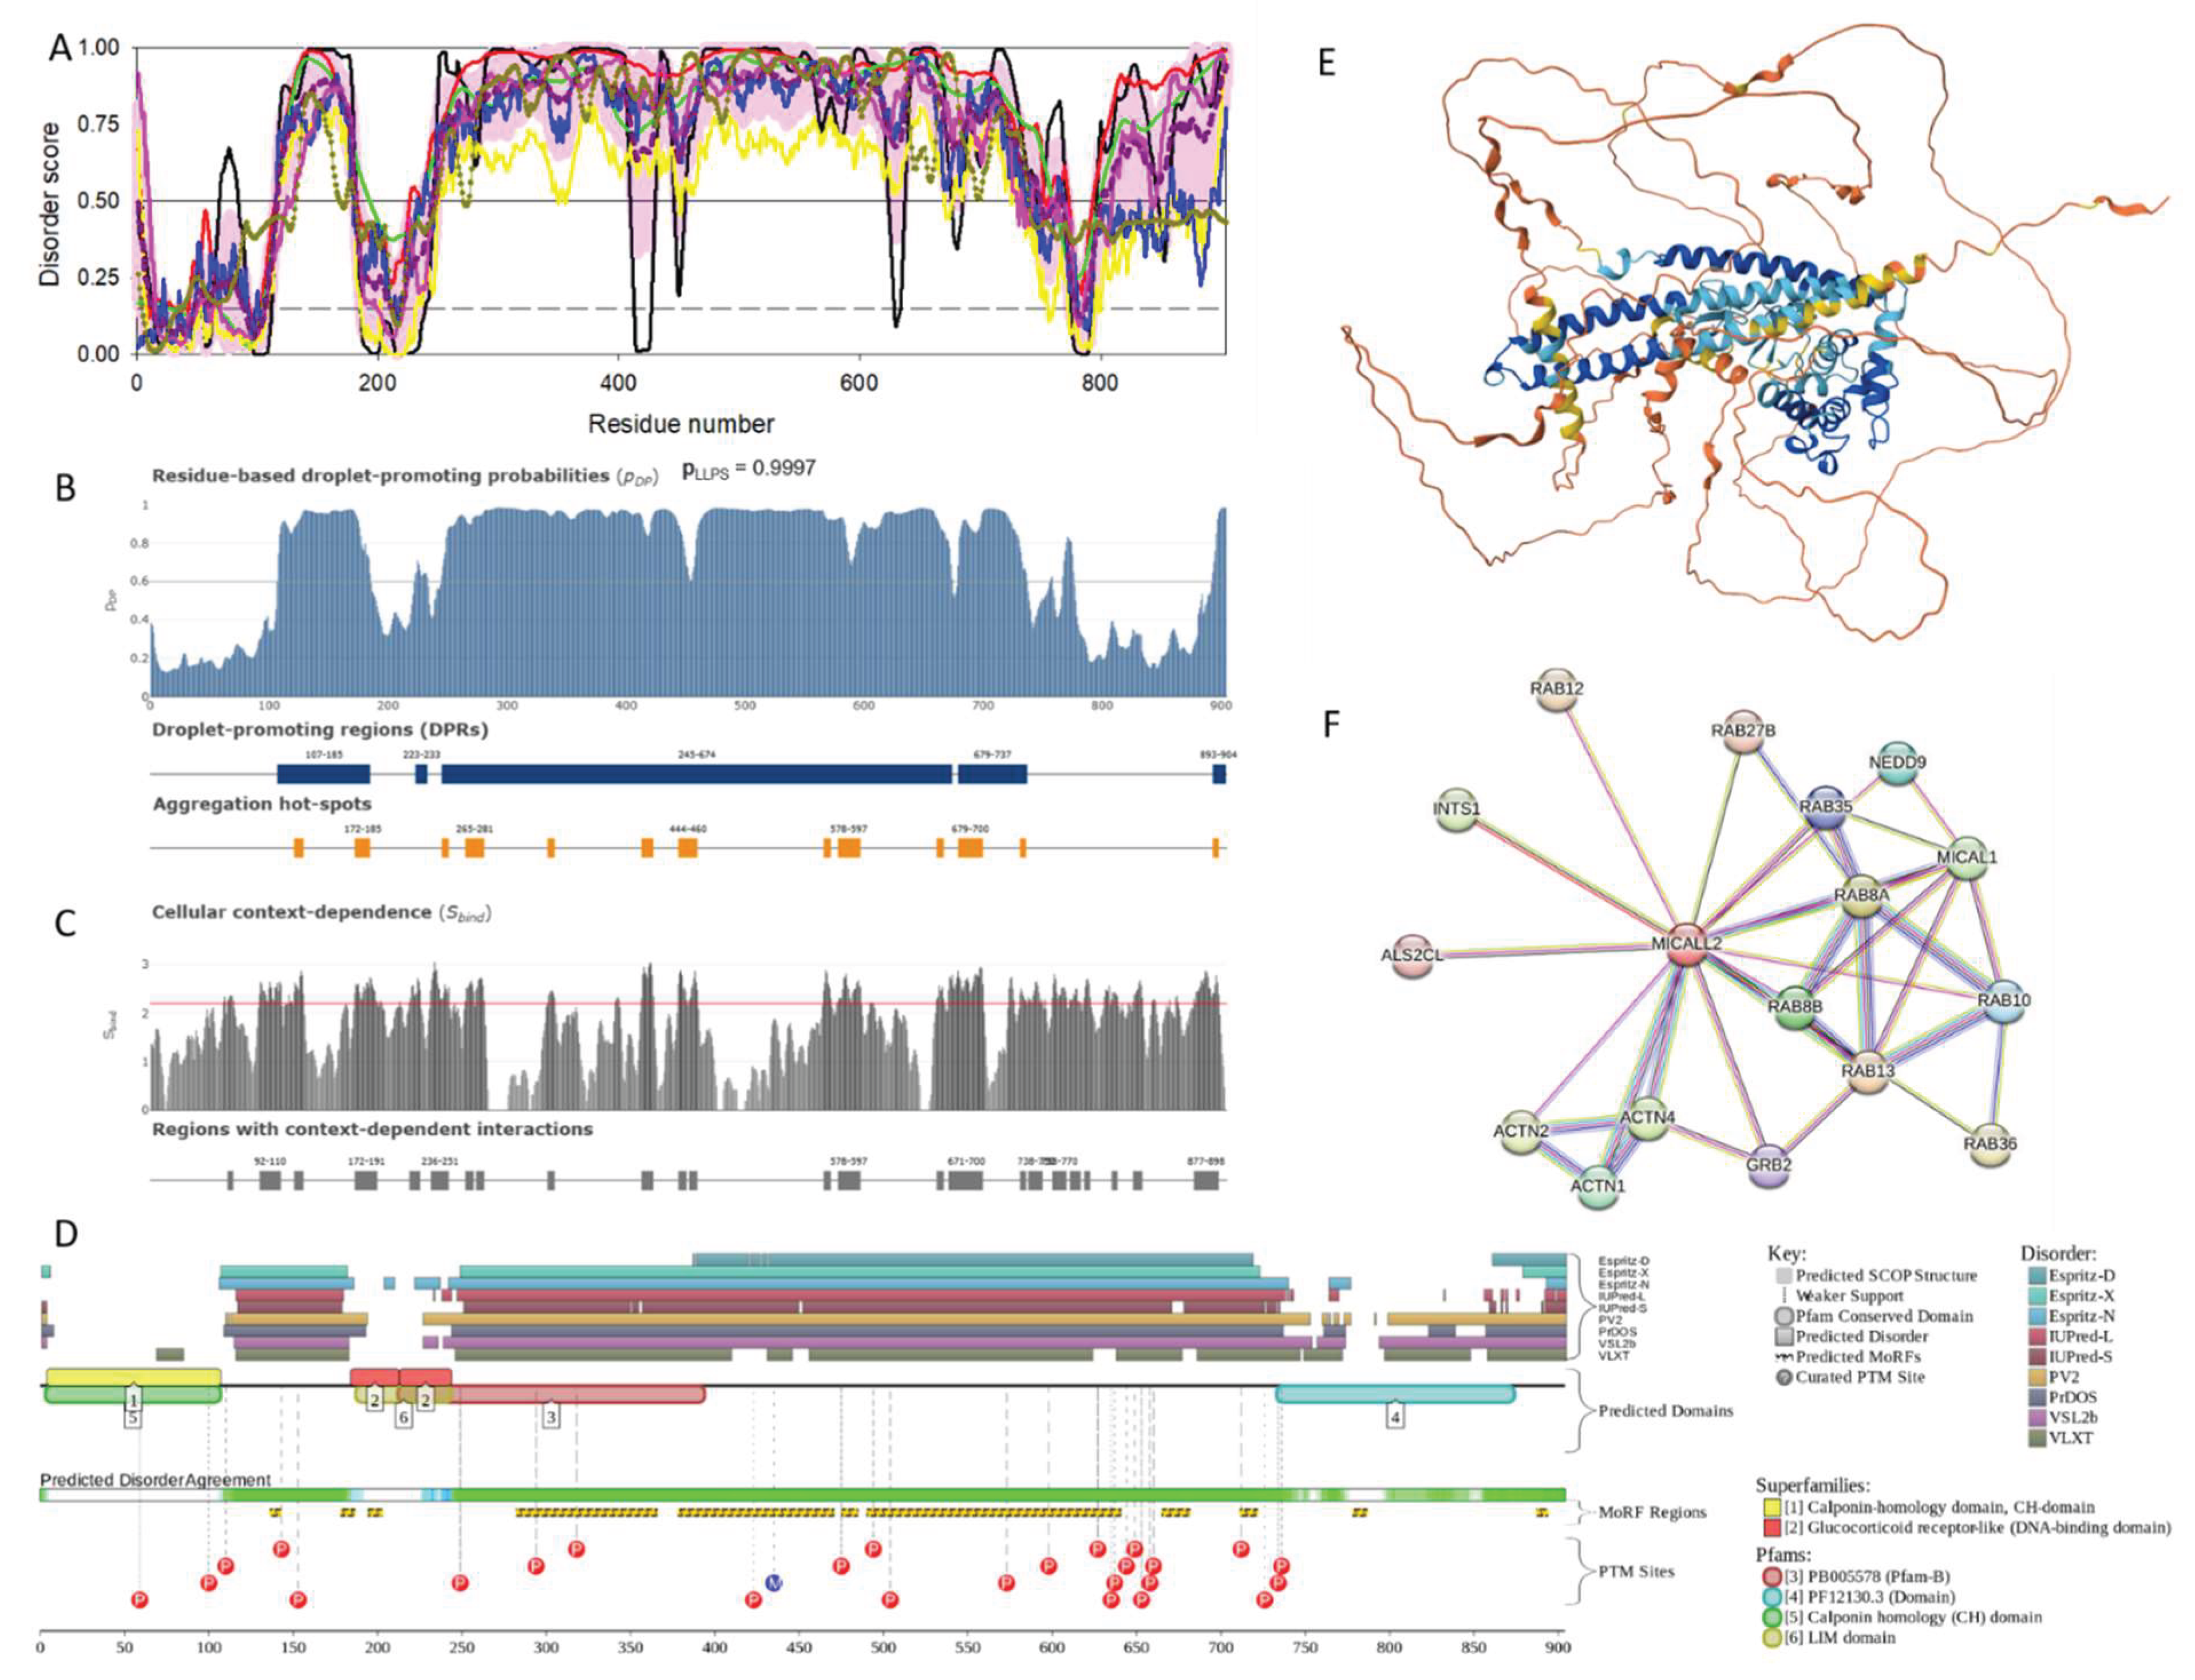
Figure 6.
STRING-based analysis of the global interactivity of human MICAL proteins. A. STRING-generated PPI network centered at five human MICALs. Network is colored according to three clusters identified by STRING-embedded k-means clustering protocol.
Figure 6.
STRING-based analysis of the global interactivity of human MICAL proteins. A. STRING-generated PPI network centered at five human MICALs. Network is colored according to three clusters identified by STRING-embedded k-means clustering protocol.
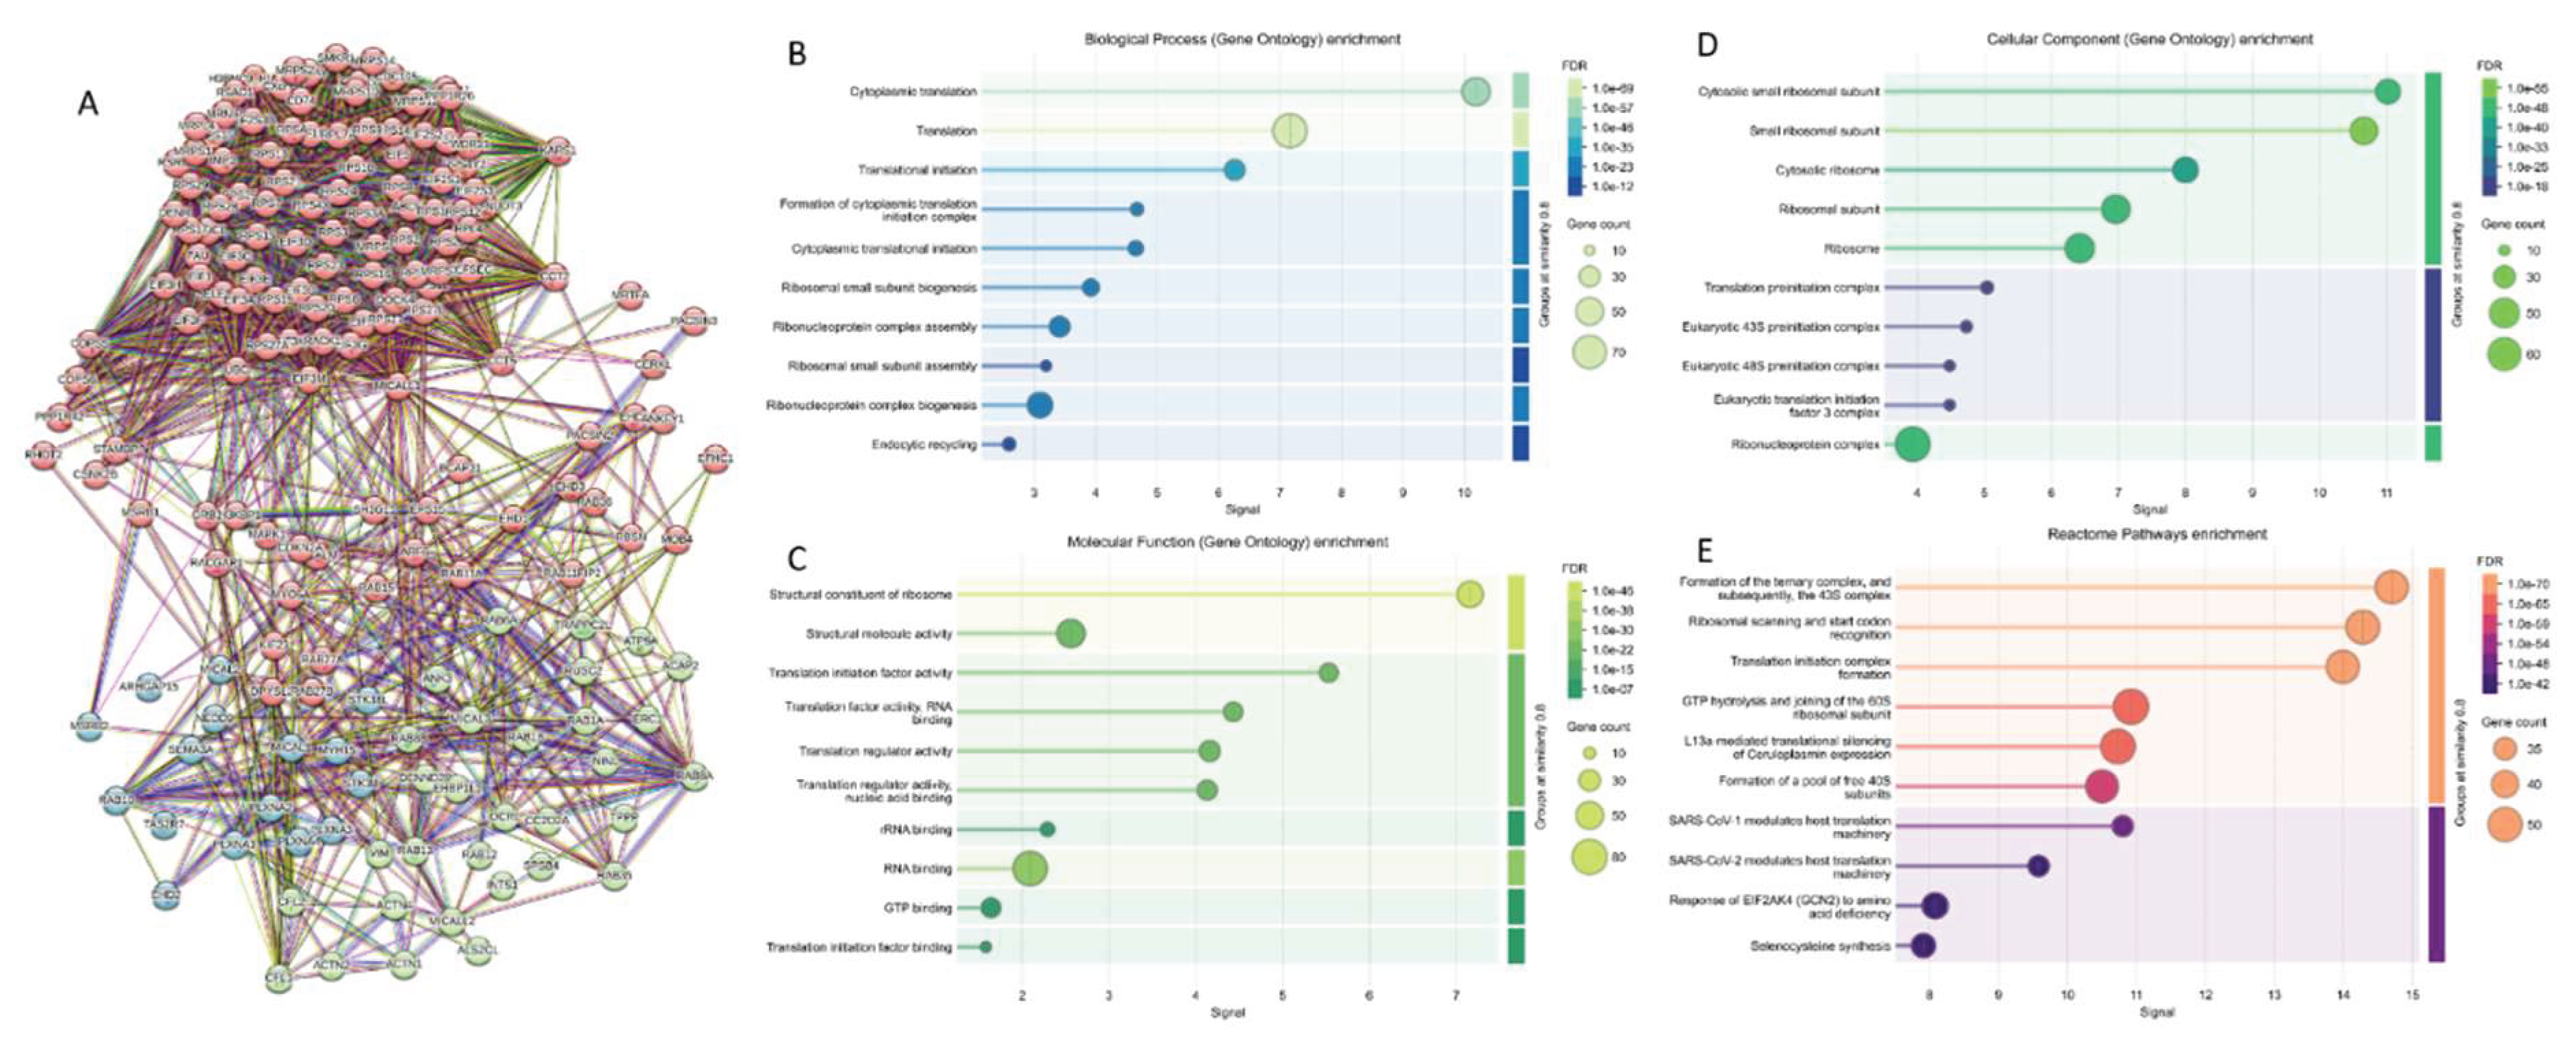
Figure 7.
Global disorder analysis of the intrinsic disorder predispositions of MICAL interactors (green boxes) and members of human proteome (gray) human proteins by seven per-residue disorder predictors (PONDR® VLXT, PONDR® VSL2, PONDR® VL3, IUPRed_Short, IUPRed_Long, PONDR® FIT, and MDP). A. Distributions of proteins based on their percentage of predicted intrinsically disordered residues (PPIDR) values. Horizontal lines in these plots show 10% (dotted lines) and 30% PPIDR thresholds. B. Distributions of proteins based on their average disorder score (ADS) values, which are calculated for each query protein as a protein length-normalized sum of all the per-residue disorder scores. In these plots, the horizontal lines represent 0.15 (dotted lines) and 0.5 ADS thresholds, respectively.
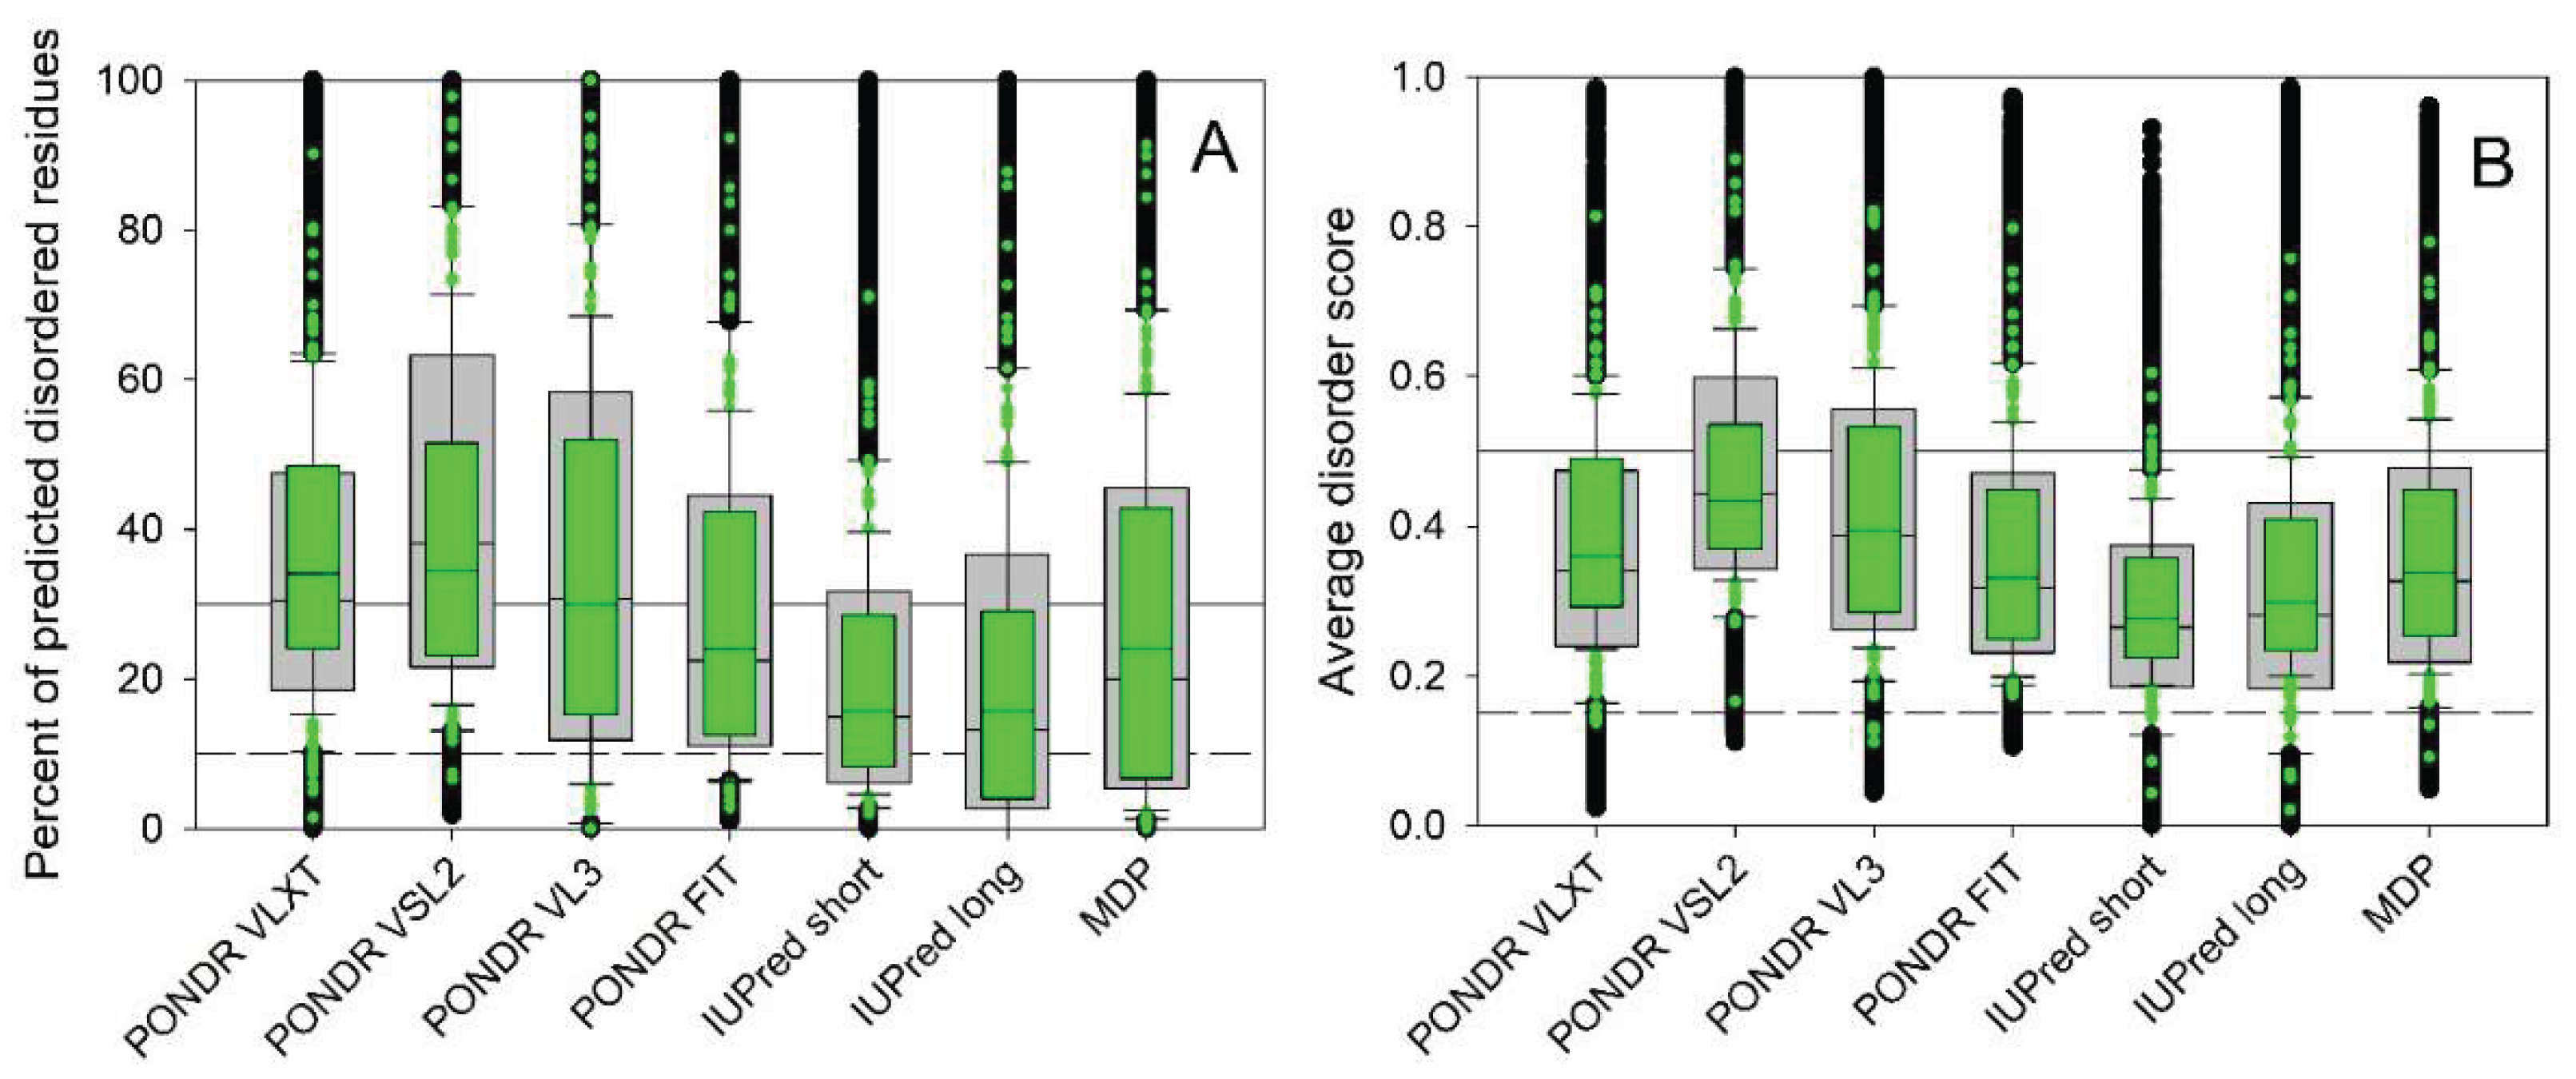
Figure 8.
Global disorder analysis of human MICAL-interacting proteins. A. The PONDR® VSL2 score (ADS) vs. PONDR® VSL2 (%) (PPIDR) plot. Here, each point corresponds to a query protein, coordinates of which are evaluated from the corresponding PONDR® VSL2 data as its ADS and PPIDR values. Color blocks are used to visualize proteins based on the accepted classification, with red, pink/light pink, and blue/light blue regions containing highly disordered, moderately disordered, and ordered proteins, respectively (see the text). Dark blue or pink areas correspond to the regions where PPIDR agrees with ADS, whereas areas in which only one of these criteria applies are shown by light blue or light pink. Data for the MICAL interactome is shown by gray circles, whereas the positions of individual MICALs are shown by differently colored symbols. B. Charge-Hydropathy and Cumulative Distribution Function (CH-CDF) analysis of query proteins. The ΔCH-ΔCDF plot is a two-dimensional representation that integrates the CH plot, which correlates a protein's net charge with its hydrophobicity, and the CDF, which correlates the cumulative frequency of disorder scores with the disorder scores. In the resulting ΔCH-ΔCDF plot, the Y-axis (ΔCH) represents the protein's distance from the CH boundary, while the X-axis (ΔCDF) represents the deviation of a protein's disorder frequency from the CDF boundary. Proteins are then stratified into four quadrants: Quadrant 1 (bottom right) indicates proteins likely to be structured; Quadrant 2 (bottom left) includes proteins that may be in a molten globule state or lack a unique 3D structure; Quadrant 3 (top left) consists of proteins predicted to be highly disordered; Quadrant 4 (top right) captures proteins that present a mixed prediction of being disordered according to CH but ordered according to CDF. C. Analysis of the interactability of the members of MICAL interactome in a form of the dependence of the node degree on disorder content evaluated as PONDR® VSL2-based PPIDR. Vertical lines show 10% and 30% PPIDR thresholds, whereas the horizontal line corresponds to the average node degree of the analyzed joint MICAL interactome (49). D. Analysis of the LLPS predisposition of the human MICAL interactors with their intrinsic disorder propensity. Vertical lines show 10% and 30% PPIDR thresholds, whereas the horizontal line corresponds to the 0.6 pLLPS threshold. In plots C and D, circles are colored based on fthe relation of the corresponding proteins to LLPS, with droplet drivers and droplet clients shown by red and pink circles, and with proteins not related to LLPS (showing pLLPS below 0.6 and not containing DPRs) are shown by blue circles.
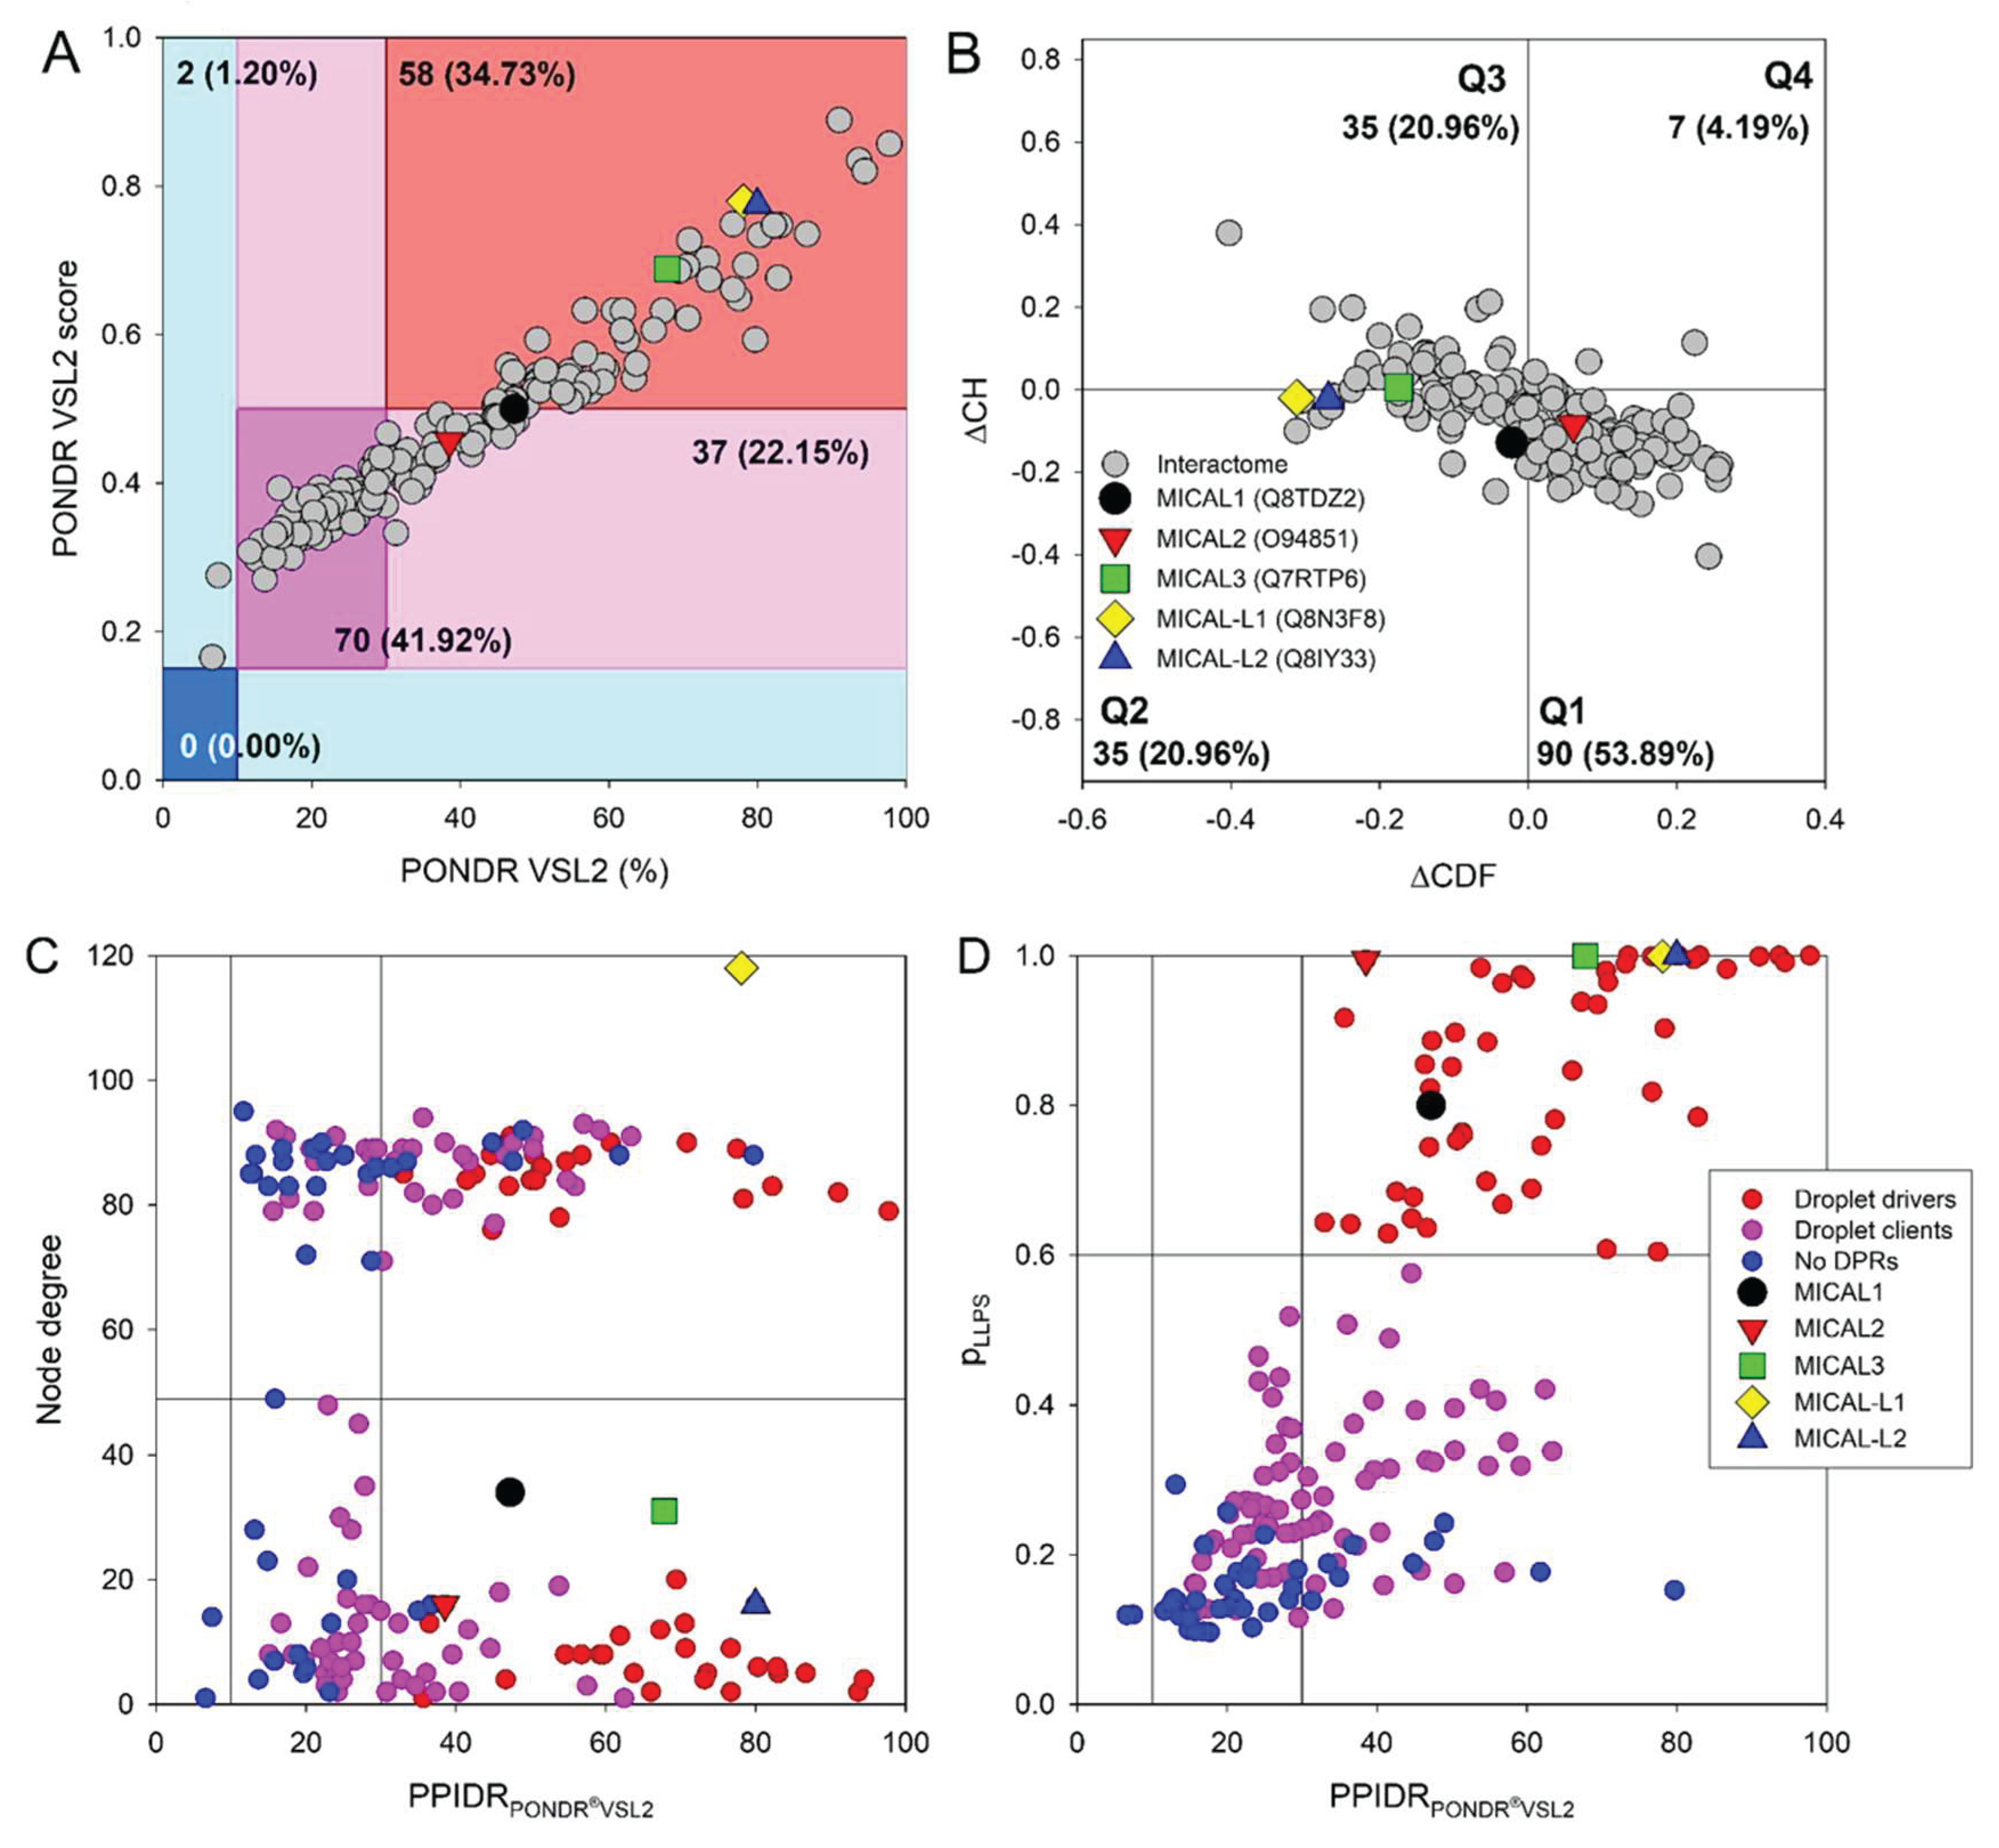
Figure 9.
Functional disorder analysis of human protein phosphatase 1 regulatory subunit 26 (UniProt ID: Q5T8A7). A. Functional disorder profile generated by D2P2. B. AlphaFold predicted 3D structure of the colored protein based on the pLDDT values. C. STRING-based analysis of the PPP1R26 interactivity. The interactive version of this network and related STRIB-based statistics can be found at the following permalink: https://version-12-0.string-db.org/cgi/network?networkId=bIgjF7Zm4xmu.
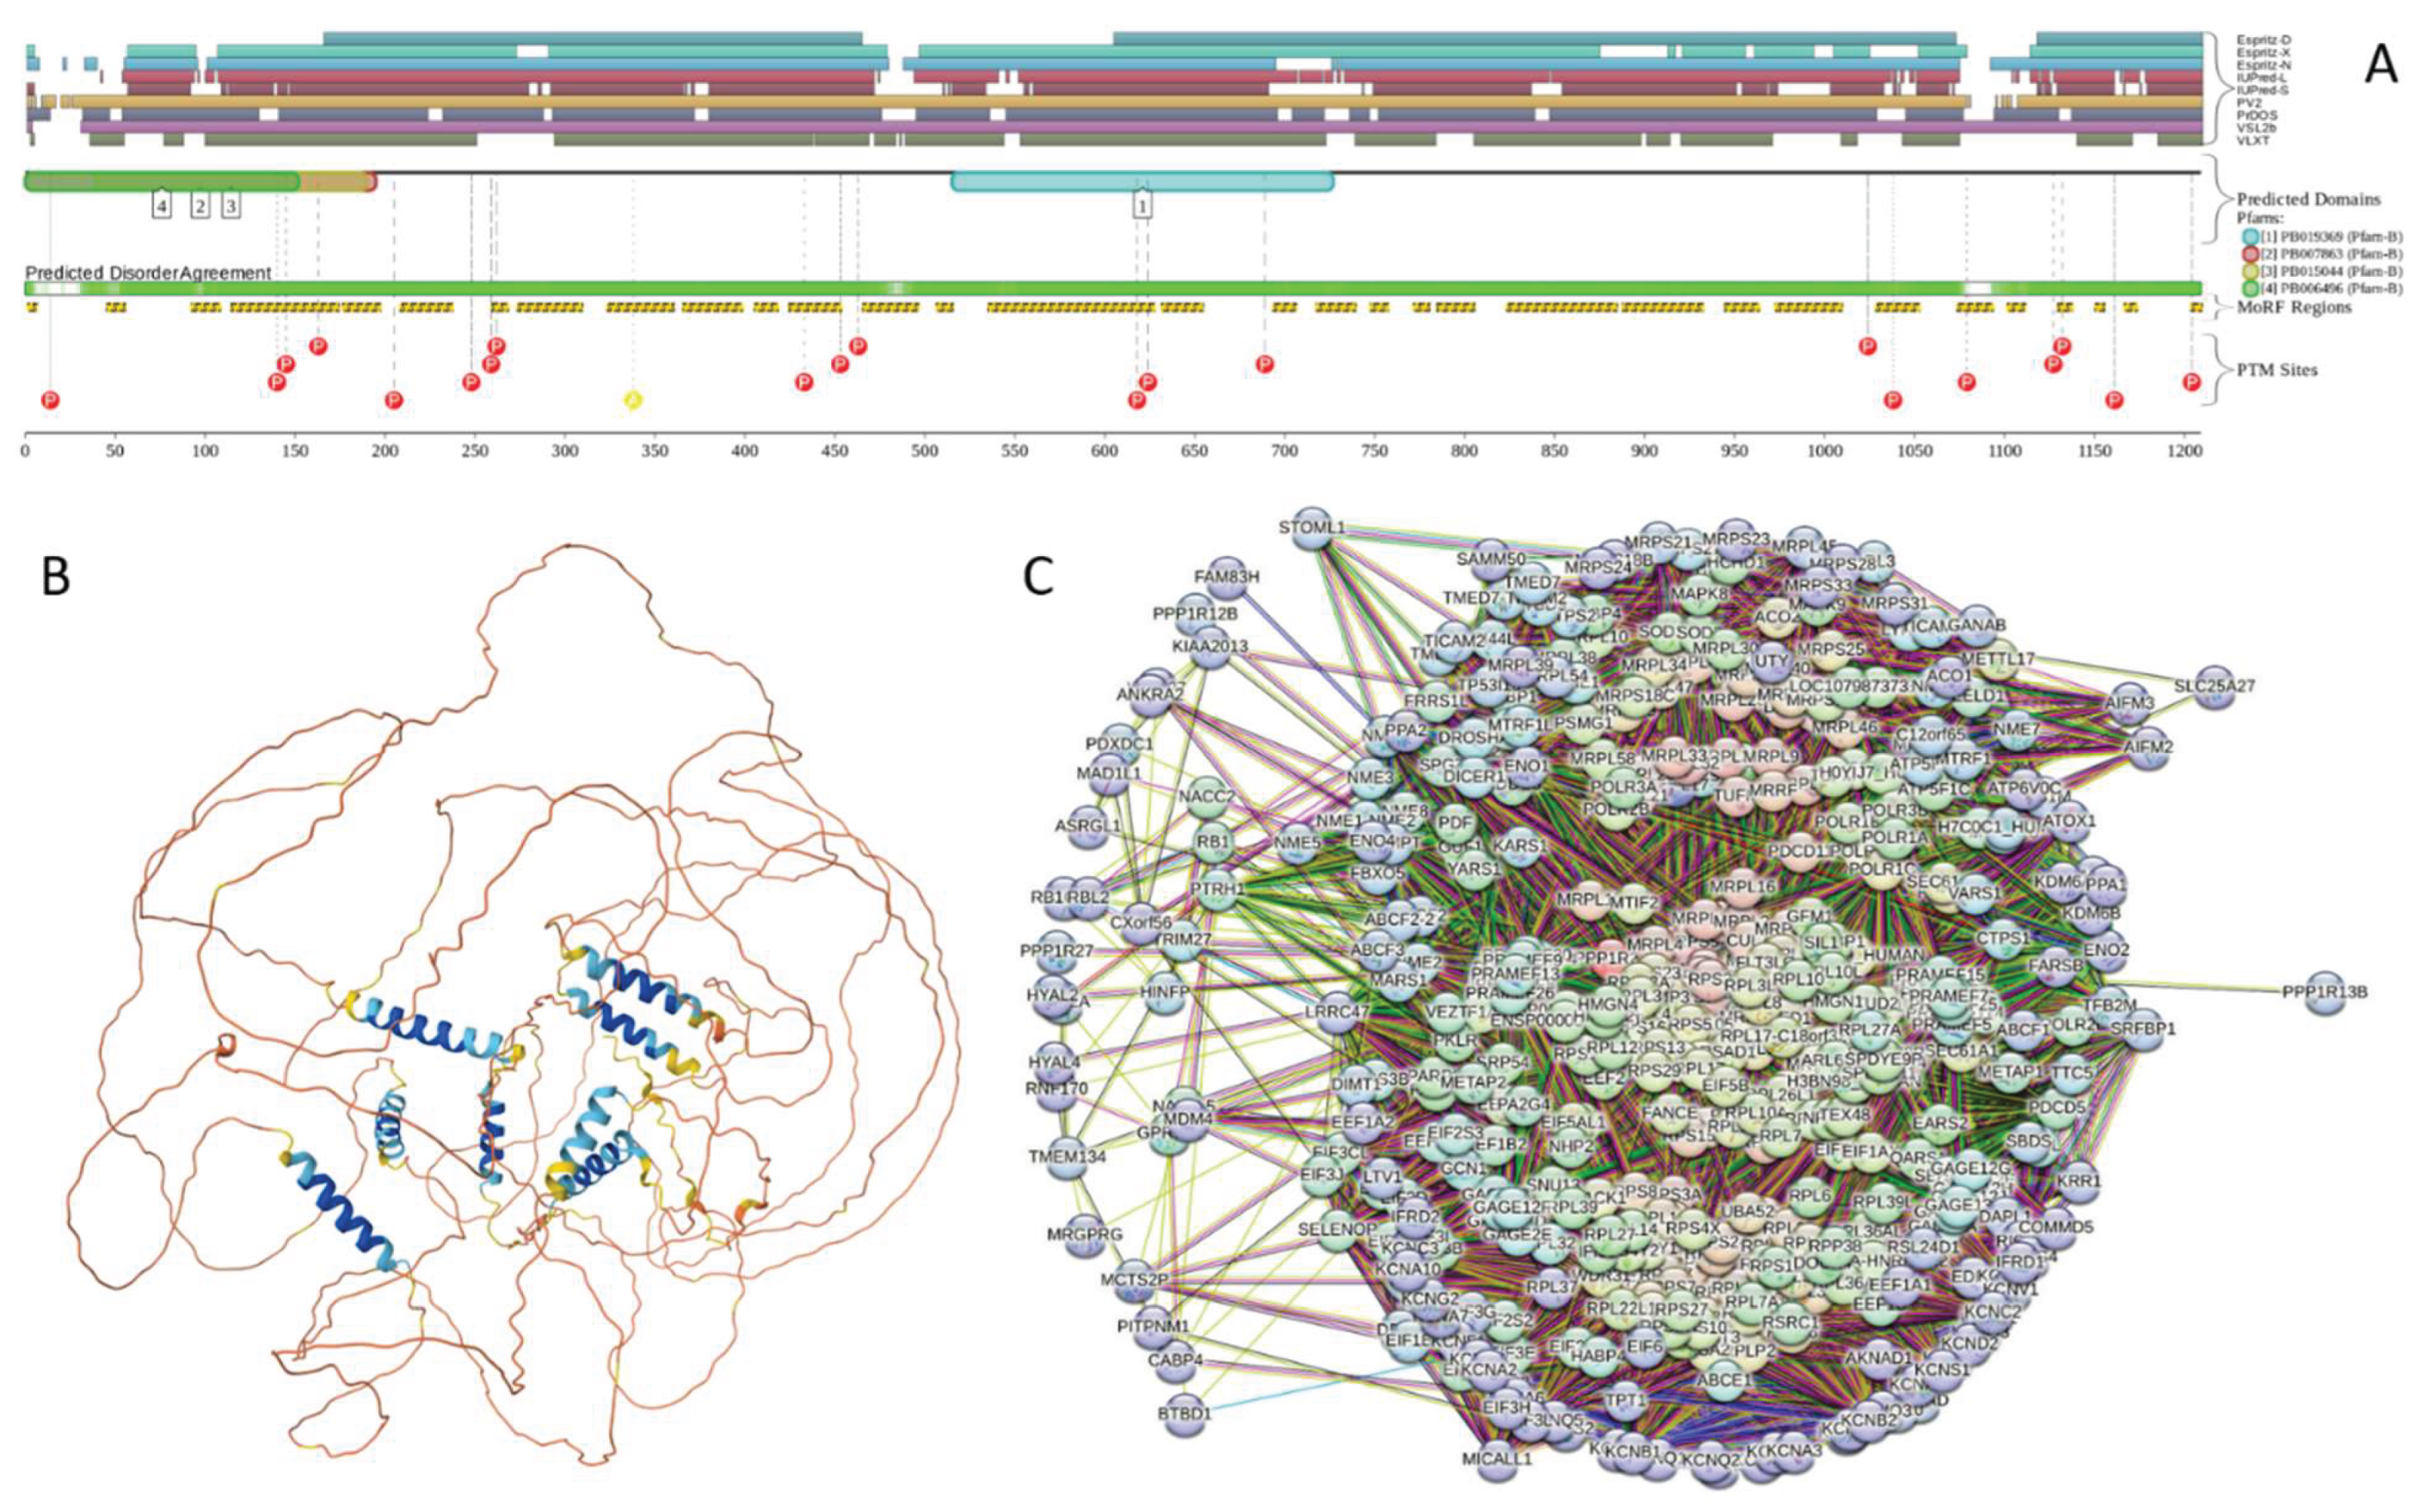
Figure 10.
Functional disorder analysis human SRrp53/RCRC1 protein (UniProt ID: Q96IZ7). A. Functional disorder profile generated by D2P2. B. AlphaFold predicted 3D structure of the protein colored based on the pLDDT values. C. STRING-based analysis of the SRrp53/RCRC1 interactivity. The interactive version of this network and can be found at the following permalink: https://version-12-0.string-db.org/cgi/network?networkId=bddlAoaa7aZe.
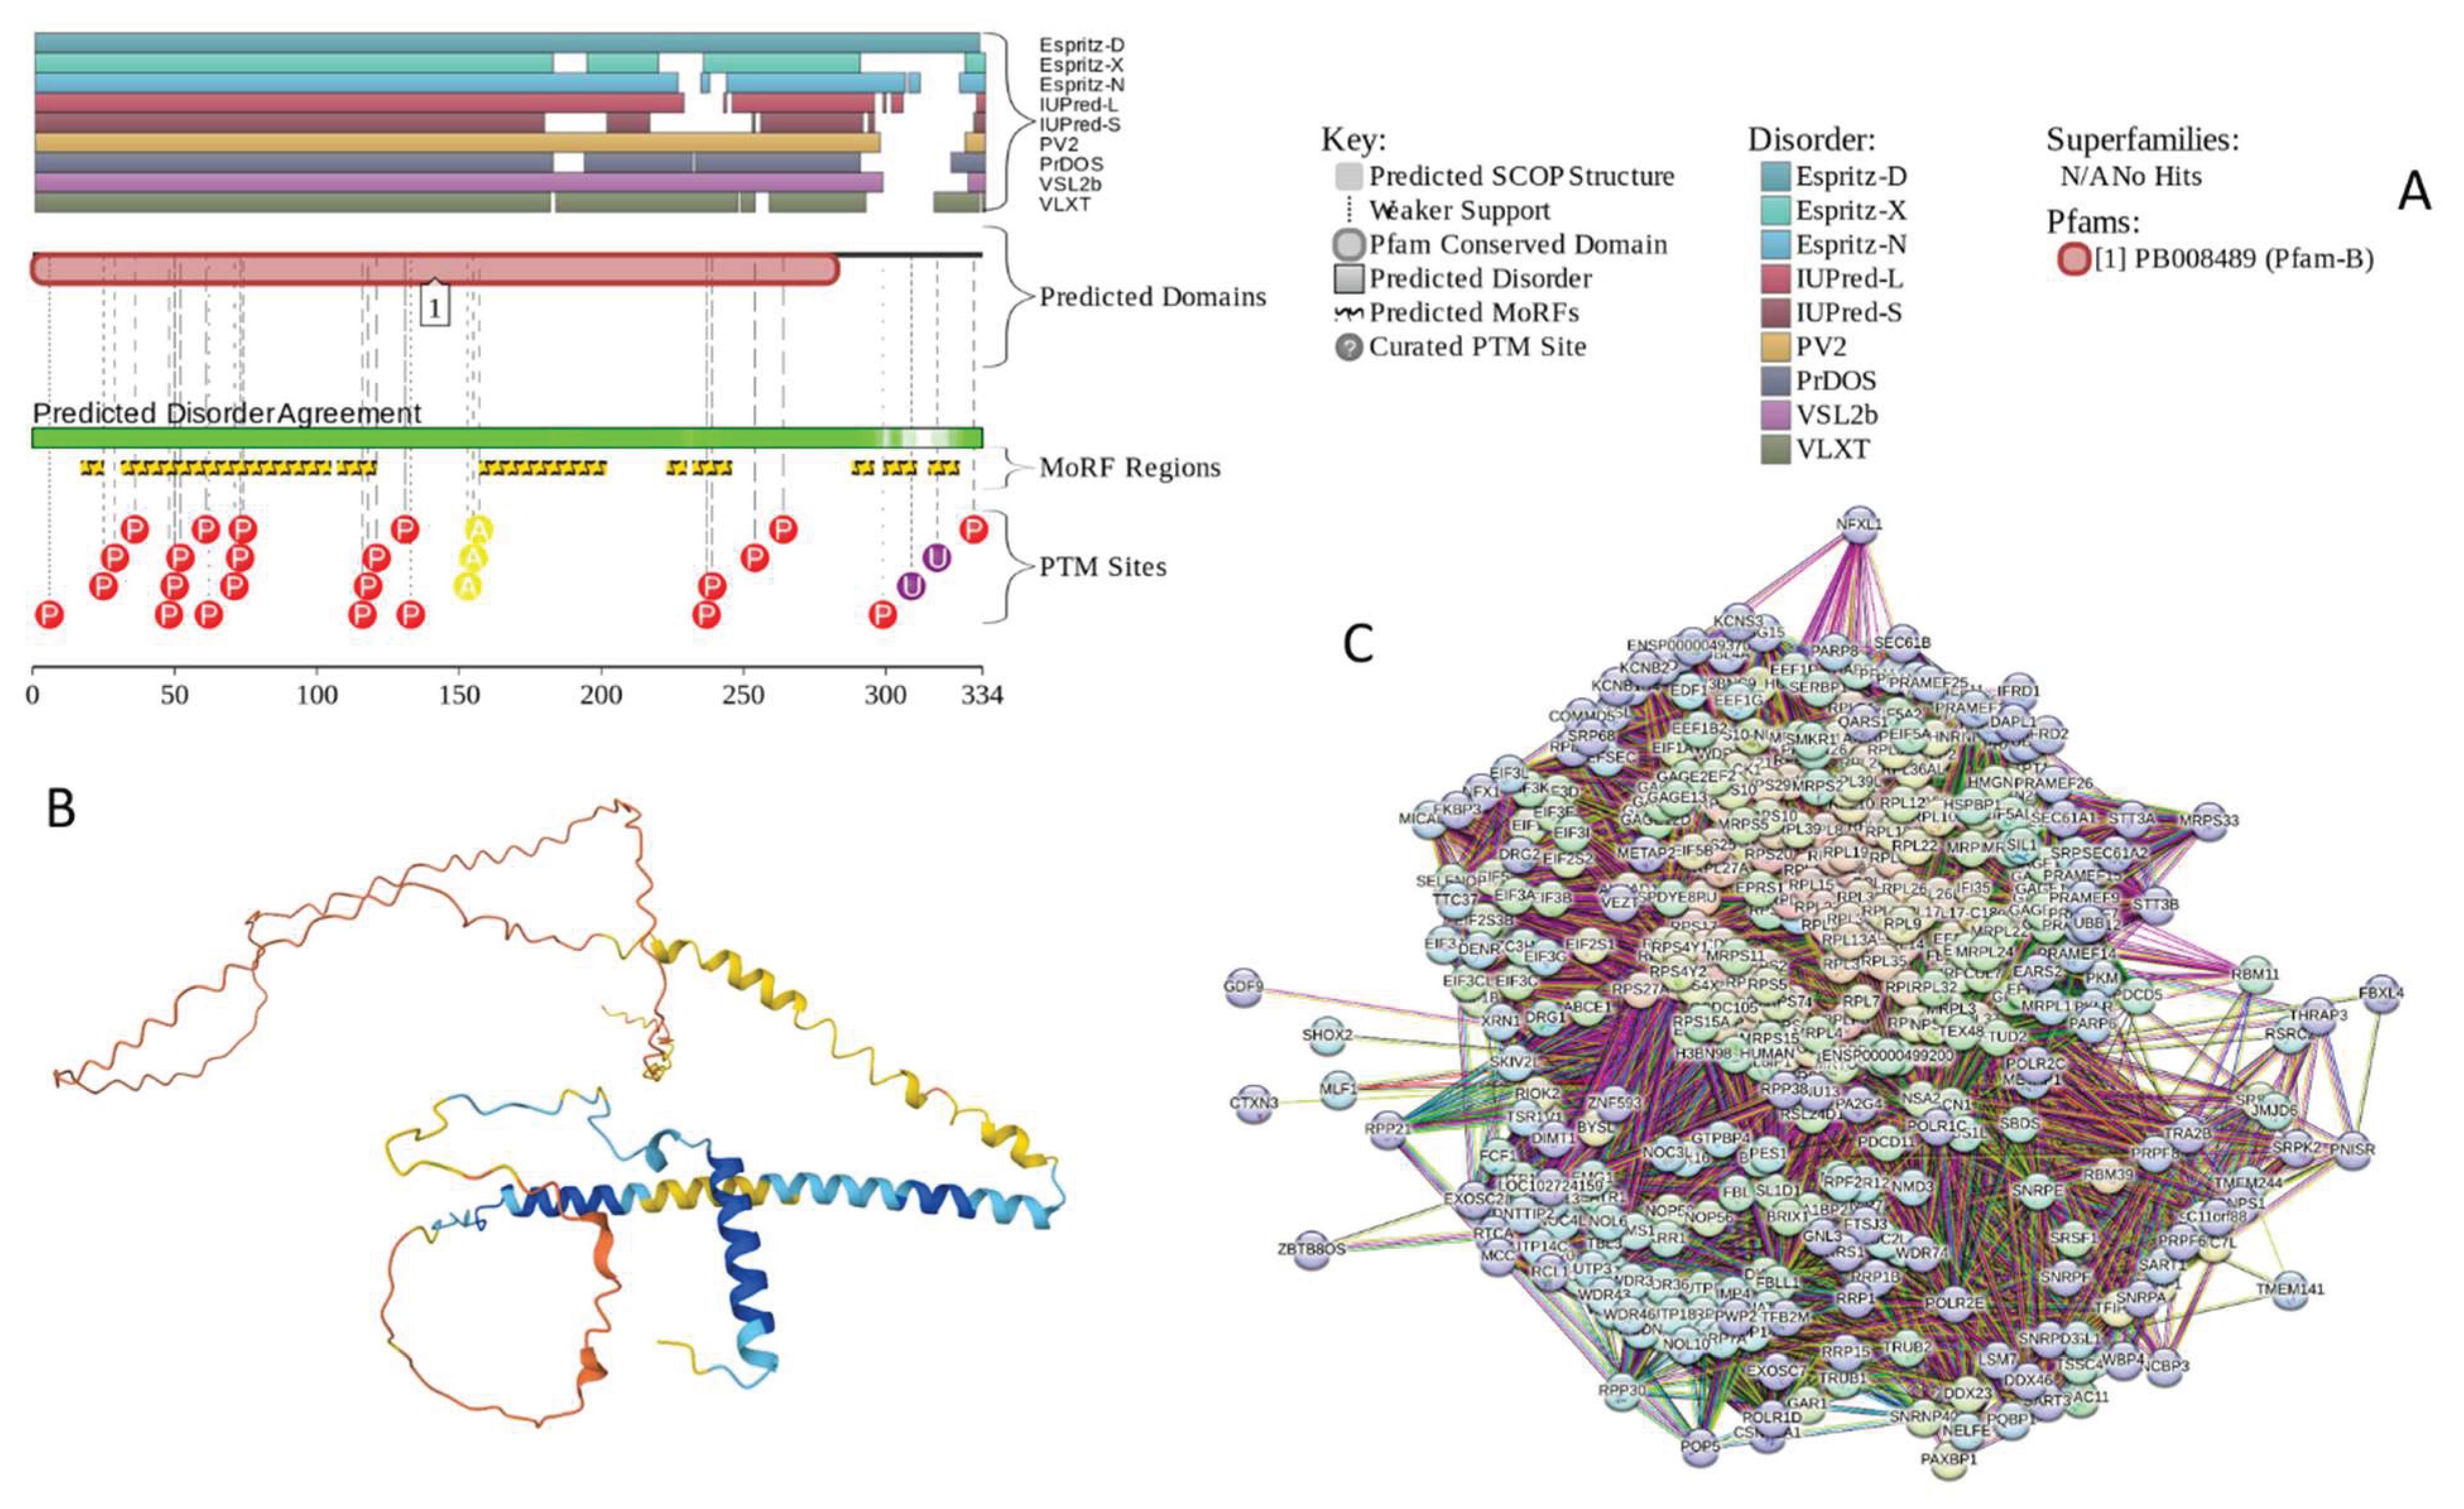
Figure 11.
Functional Disorder analysis of human MRTFA (UniProt ID: Q969V6). A. Functional disorder profile generated by D2P2. B. AlphaFold predicted 3D structure of the colored protein based on the pLDDT values. C. STRING-based analysis of the MRTFA interactivity. The interactive version of this network and can be found at the following permalink: https://version-12-0.string-db.org/cgi/network?networkId=bsOLdAARTyO5.
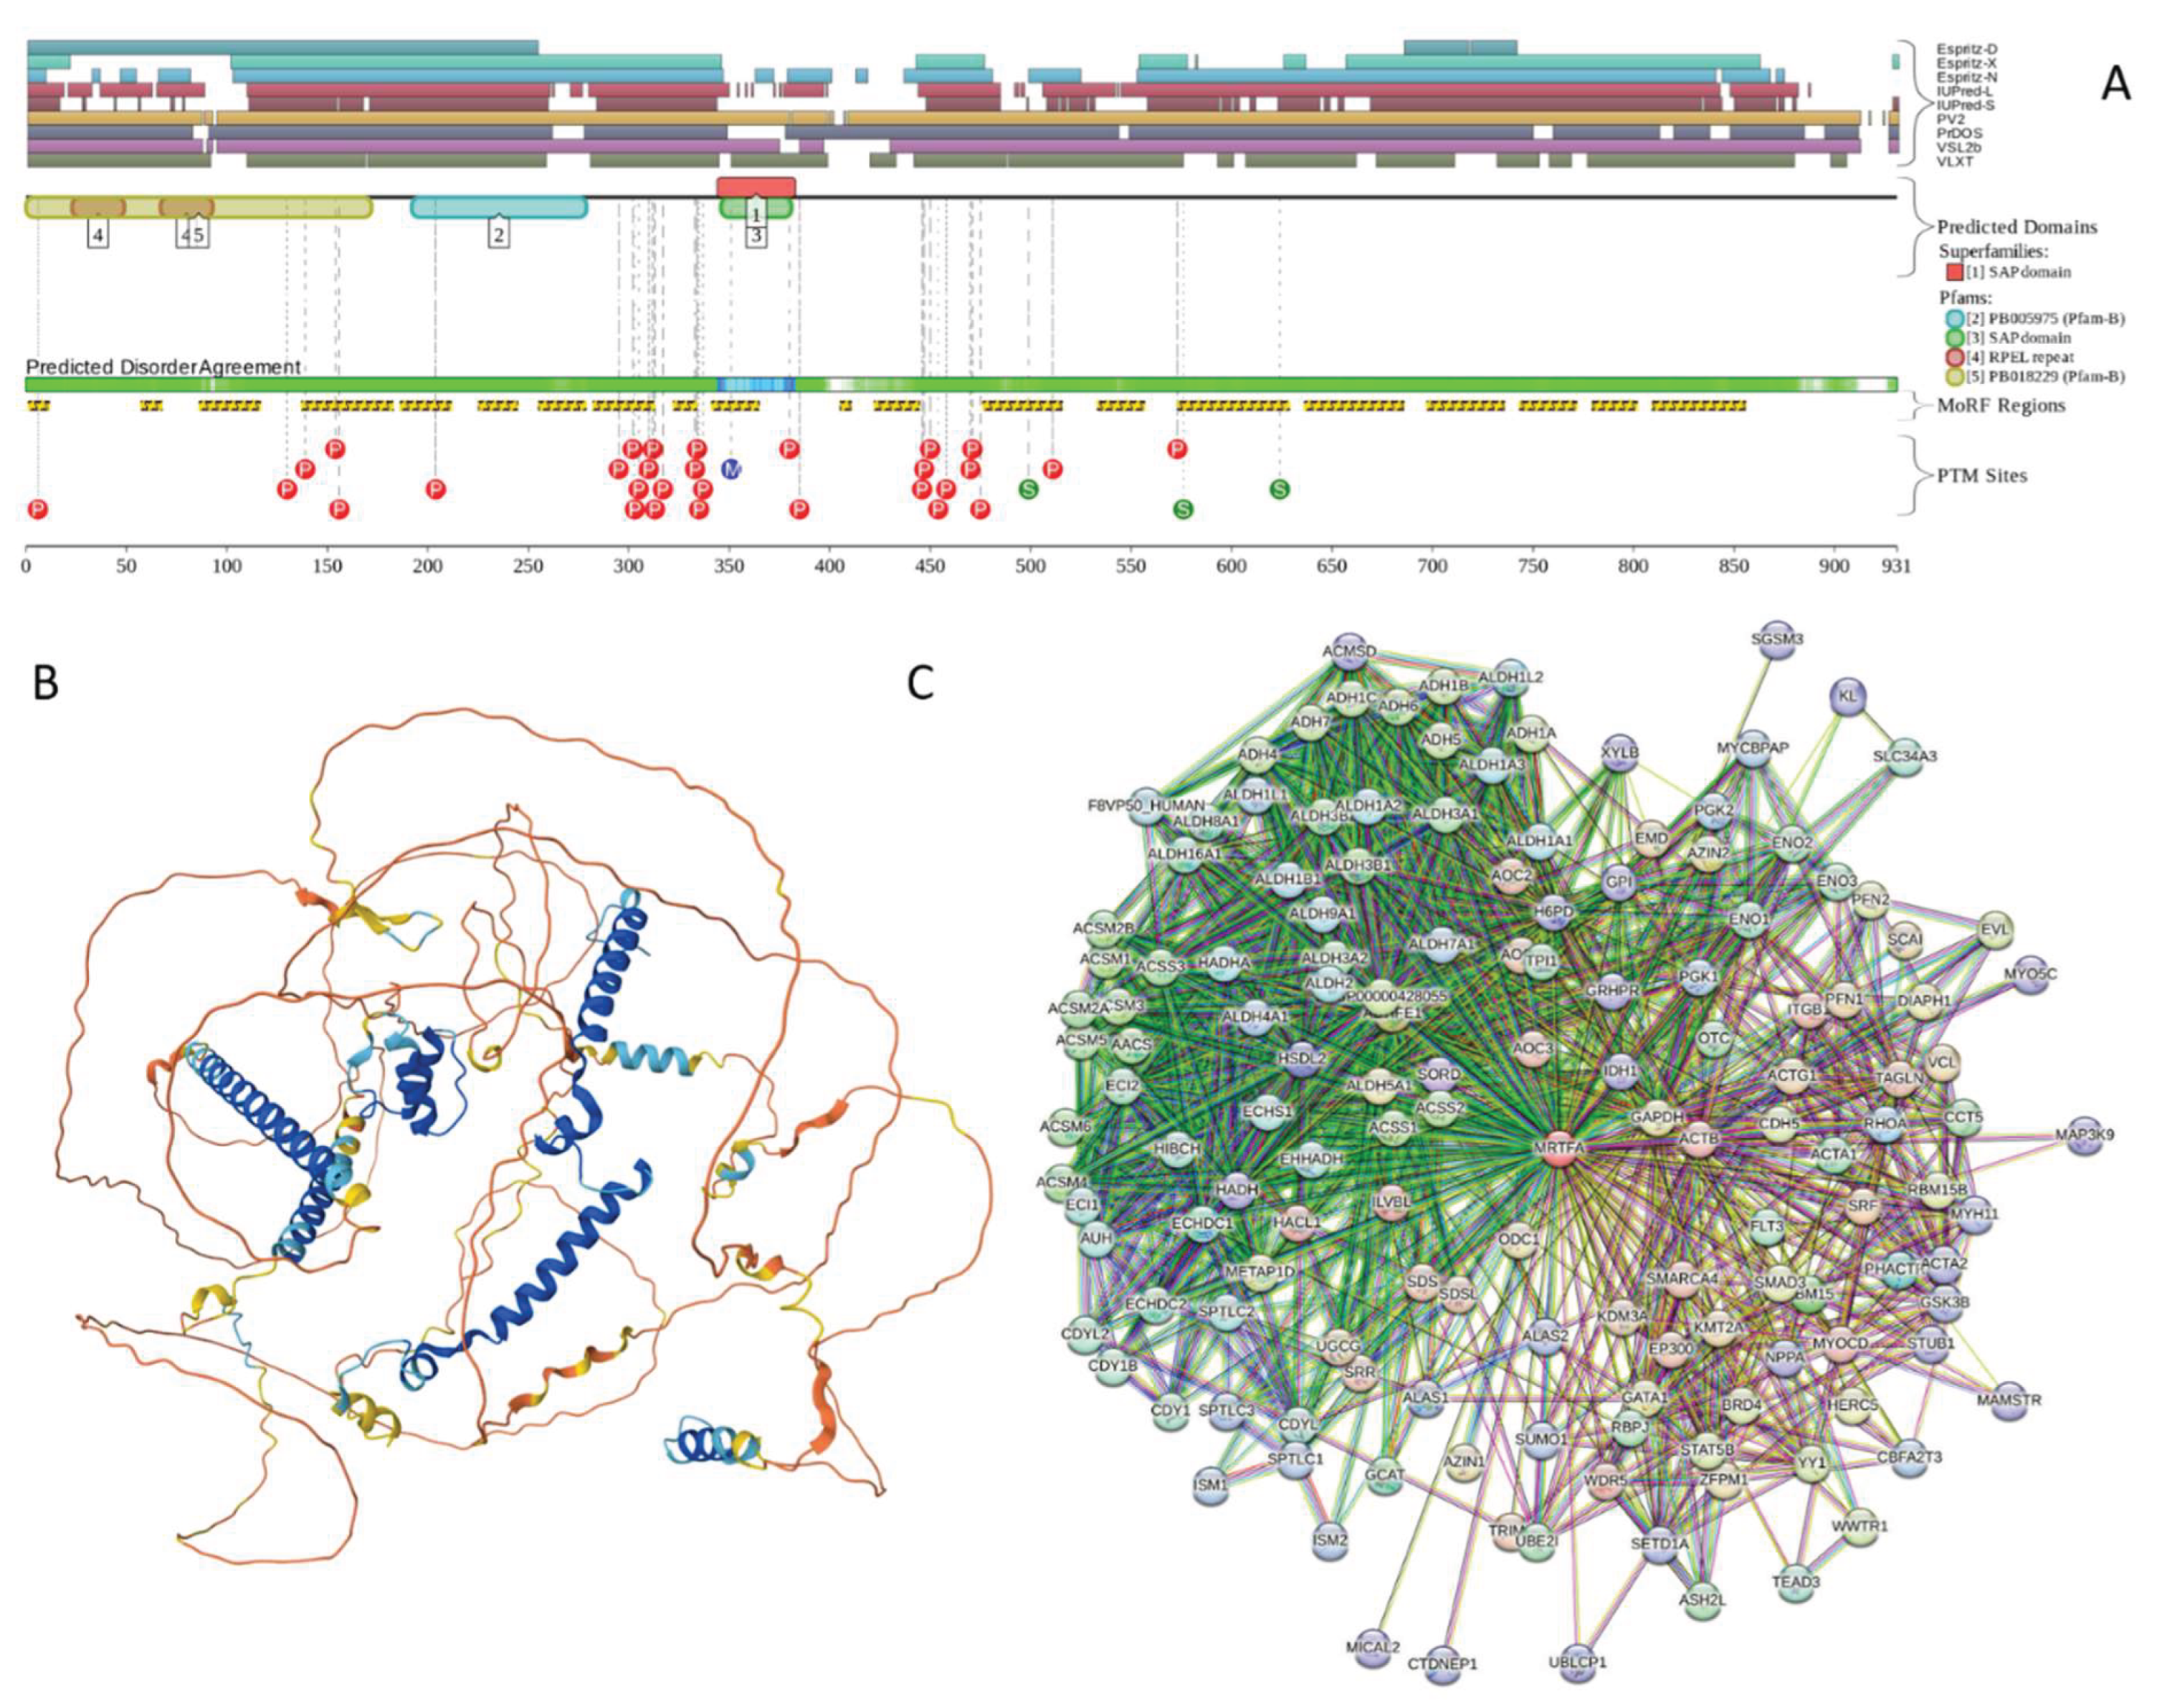
Figure 12.
Functional Disorder analysis of human ERC1 (UniProt ID: Q8IUD2). A. Functional disorder profile generated by D2P2. B. AlphaFold predicted 3D structure of the colored protein based on the pLDDT values. C. STRING-based analysis of the ERC1 interactivity. The interactive version of this network and can be found at the following permalink: https://version-12-0.string-db.org/cgi/network?networkId=bxenJL1ppLUh.

Figure 13.
Functional Disorder analysis of human EHBP1L1 (UniProt ID: Q8N3D4). A. Functional disorder profile generated by D2P2. B. AlphaFold predicted 3D structure of the protein colored based on the pLDDT values. C. STRING-based analysis of the EHBP1L1 interactivity. The interactive version of this network and can be found at the following permalink: https://version-12-0.string-db.org/cgi/network?networkId=benAs3m86coZ.
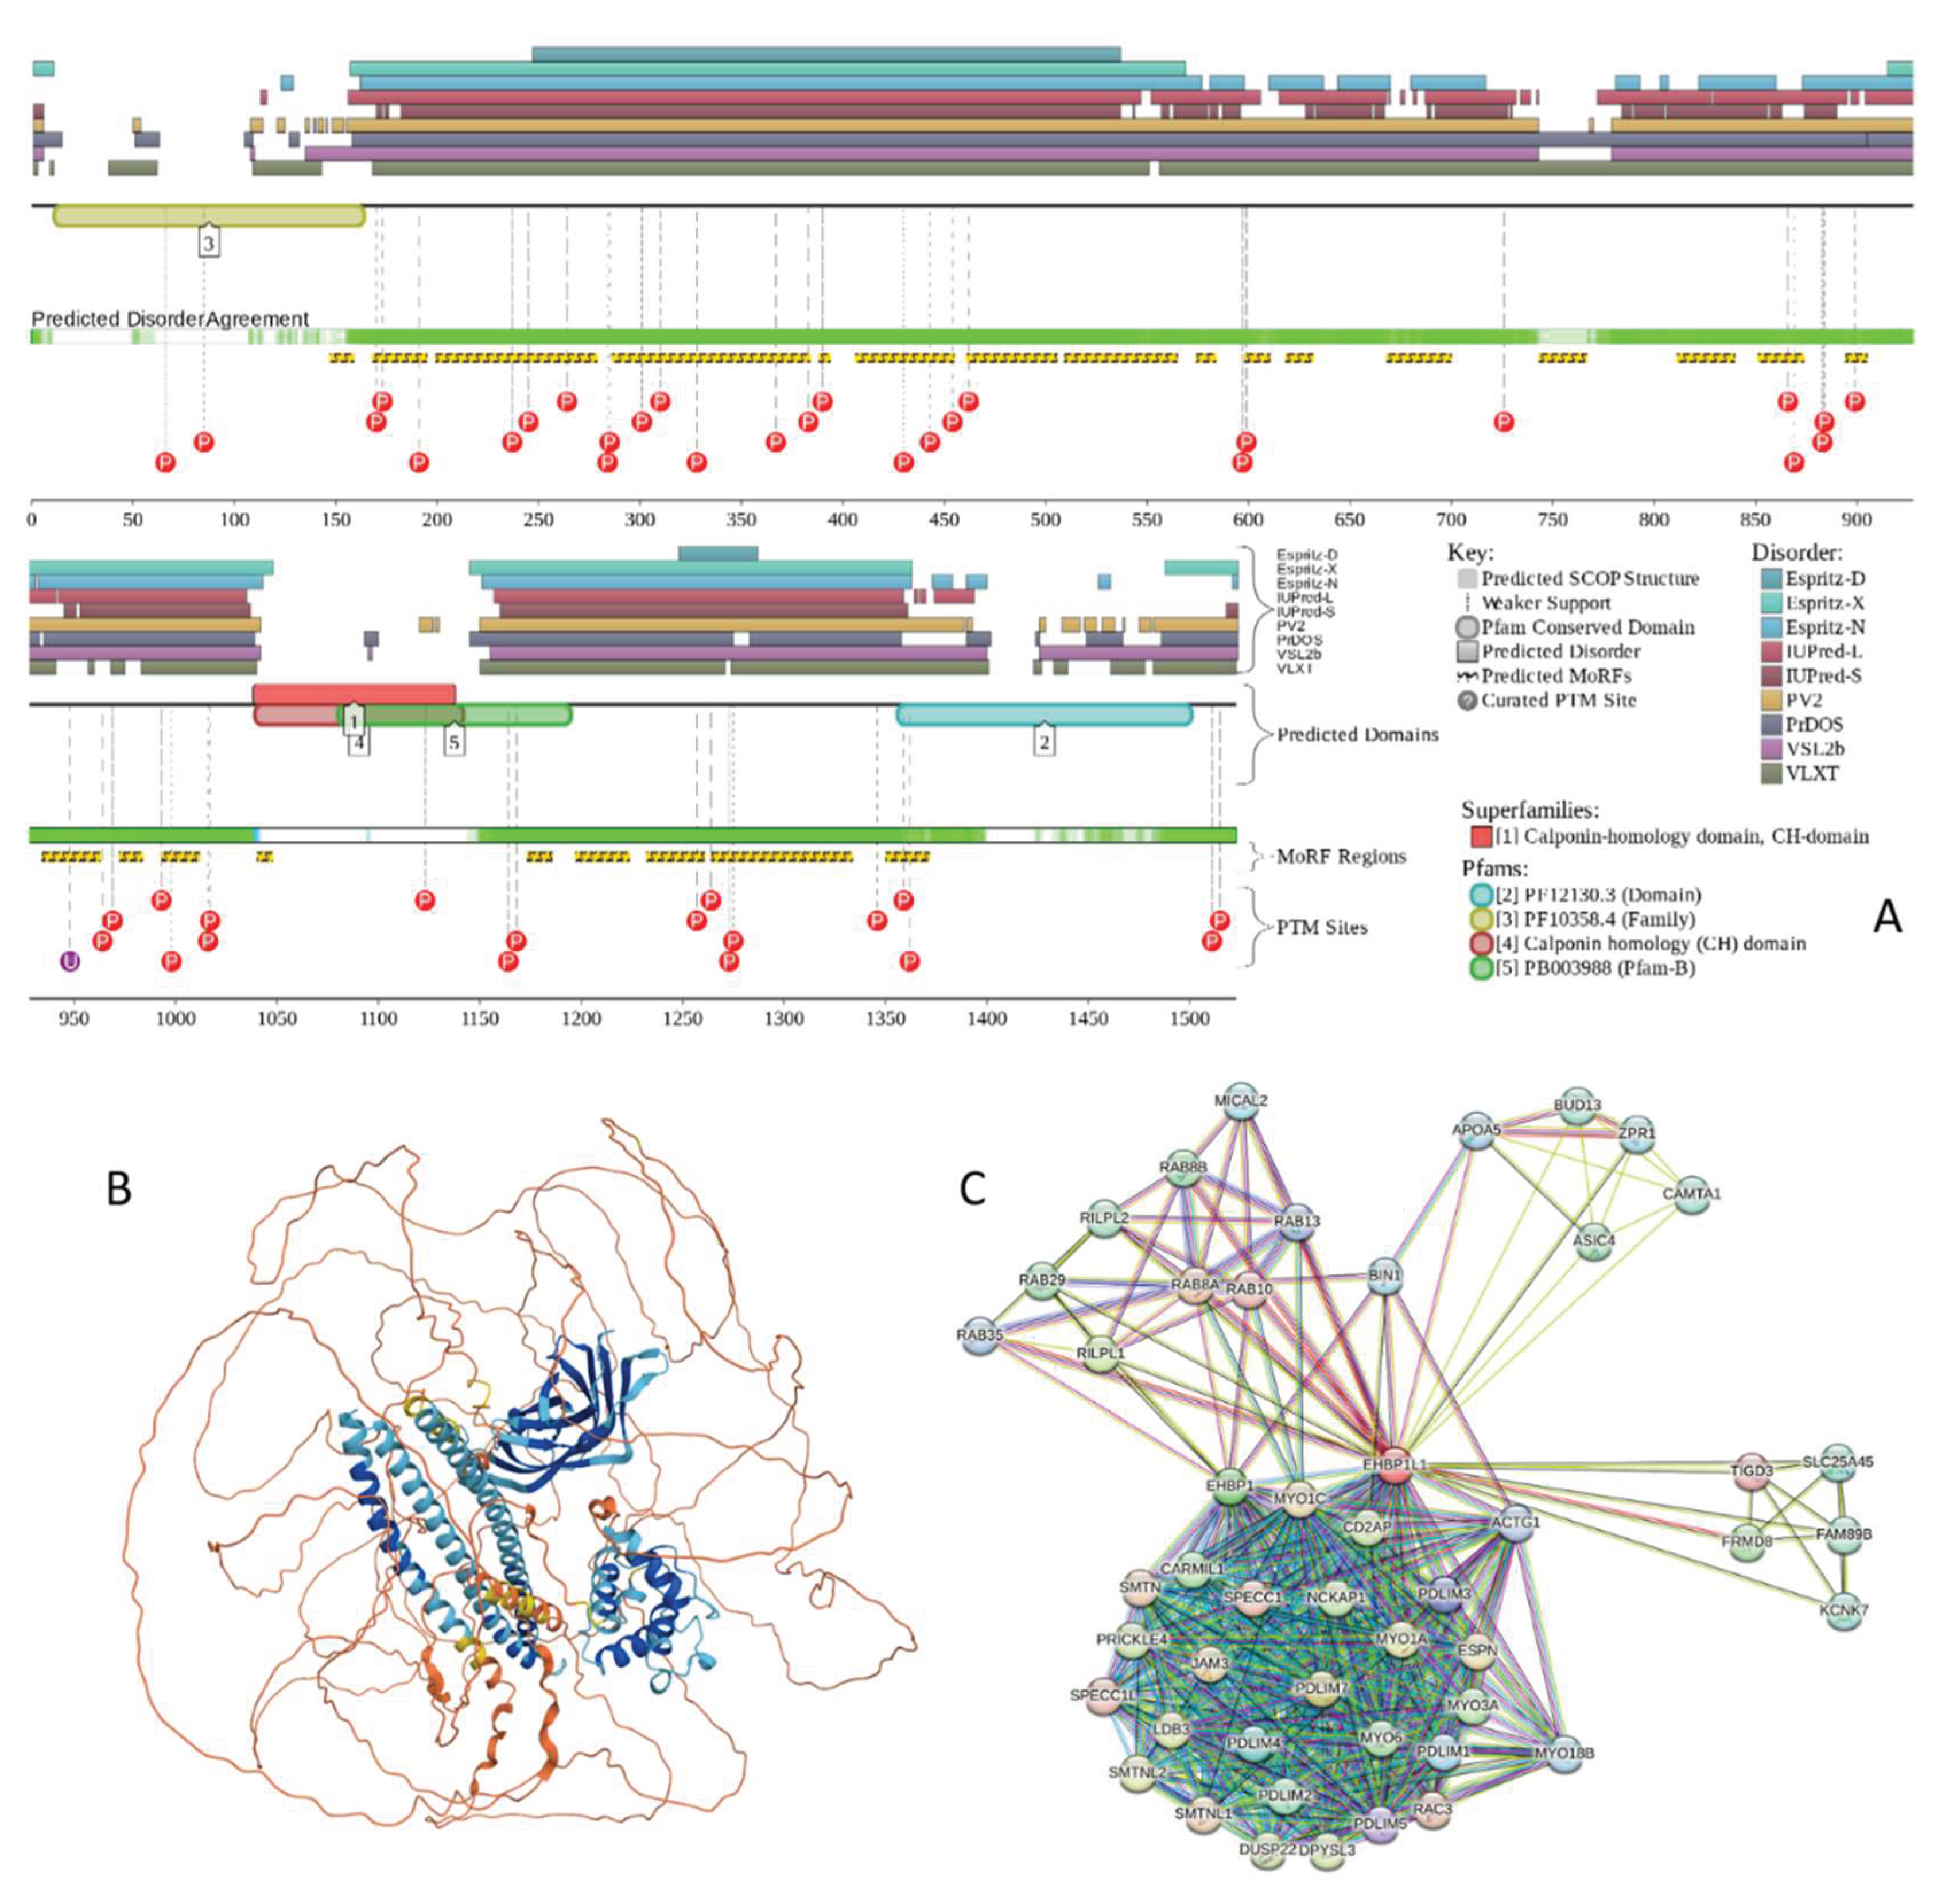
Disclaimer/Publisher’s Note: The statements, opinions and data contained in all publications are solely those of the individual author(s) and contributor(s) and not of MDPI and/or the editor(s). MDPI and/or the editor(s) disclaim responsibility for any injury to people or property resulting from any ideas, methods, instructions or products referred to in the content. |
© 2025 by the authors. Licensee MDPI, Basel, Switzerland. This article is an open access article distributed under the terms and conditions of the Creative Commons Attribution (CC BY) license (http://creativecommons.org/licenses/by/4.0/).
Copyright: This open access article is published under a Creative Commons CC BY 4.0 license, which permit the free download, distribution, and reuse, provided that the author and preprint are cited in any reuse.


