
Submitted:
25 May 2025
Posted:
26 May 2025
You are already at the latest version
Abstract
Numerous studies have linked short-term exposure to ambient air pollution with cardiopulmonary health outcomes, yet evidence regarding other health conditions remains limited. This study investigates associations between urban air pollutant concentrations and emergency department visits for a broader spectrum of health outcomes classified under ICD-10 Chapters II (neoplasms), III (blood diseases), IV (endocrine and metabolic disorders), and XVIII (symptoms and signs). Using a case-crossover design with conditional Poisson regression, relative risks were estimated for pollutant exposures, particularly nitrogen dioxide (NO₂), across multiple lag periods up to 14 days. The analysis incorporated stratified subgroup estimates, applying dynamic linear models and a novel transformation of pollutant concentration to better characterize concentration–response relationships. Results demonstrate consistent positive associations between NO₂ levels and emergency visits across all studied chapters, with the strongest effects observed within 0 to 3 days after exposure. While cumulative concentration–response functions were not computed due to data limitations, the methodology presented offers a flexible framework for modeling temporal risk patterns. These findings suggest that air pollution impacts a wider range of health outcomes than traditionally recognized, highlighting the need for broader consideration in environmental health research and public health policy.
Keywords:
air pollution
; emergency department visits
; case-crossover design
; urban air quality
; dynamic linear models
; environmental epidemiology
; short-term exposure
; public health policy
; non-cardiopulmonary effects
1. Introduction
Historically, environmental epidemiology has focused predominantly on respiratory diseases. Over time, its scope has gradually expanded to include cardiovascular conditions, mental health disorders, human behavior, skin diseases, and other health outcomes. If the emerging hypothesis—that air pollution affects nearly every organ in the human body—proves true, it could profoundly reshape the field [1]. This expanded understanding would not only redefine research priorities but also carry far-reaching implications for air pollution policy.
There is growing evidence of a positive association between exposure to ambient air pollution and a wide range of health conditions, extending beyond the respiratory system. For instance, short-term exposure to fine particulate matter (PM₂.₅)—particles with an aerodynamic diameter of 2.5 micrometers or less—has been linked to increased hospital admissions across seven major disease categories: endocrine, nervous system, digestive, nutritional and metabolic, circulatory, respiratory, musculoskeletal and connective tissue, and genitourinary diseases [2,3,4].
Similar associations have been observed across 35 minor disease categories in relation to same-day PM₂.₅ exposure, in both single- and two-pollutant models. These include conditions such as chronic skin ulcers, diabetes mellitus, anemia, liver disease, intestinal infections, gastrointestinal hemorrhage, urinary tract stones, renal failure, and back problems [5].
Daily ambient exposure to air pollutants—including fine particulate matter (PM₂.₅), coarse particulate matter (PM₁₀), sulfur dioxide (SO₂), and ground-level ozone (O₃)—has also been positively associated with lung cancer mortality. According to the International Classification of Diseases, 10th Revision (ICD-10; WHO, 2016, [6]), this includes malignant neoplasms of the trachea (code C33) and of the bronchus and lung (code C34) [7,8]. These associations varied by city, season, pollutant levels, and weather conditions, with evidence of synergistic effects on daily lung cancer mortality. Older adults and male lung cancer patients appeared especially vulnerable. Additionally, short-term exposure to SO₂ was specifically linked to increased lung cancer mortality (ICD-10 codes C33–C34) among males, with notable seasonal variation [9].
In children under five, daily exposure to PM₂.₅ has been significantly associated with a higher prevalence of moderate to severe anemia (ICD-10 codes D50–D64) and reduced hemoglobin levels [9]. Among older adults, short-term exposure to PM₂.₅, carbon content in particulate matter, ultrafine particles, and accumulation mode particles has been linked to changes in blood parameters related to anemia (ICD-10 codes D50–D89), including red blood cell count, hemoglobin concentration, hematocrit, mean corpuscular hemoglobin (MCH), and mean corpuscular hemoglobin concentration (MCHC) [10].
Exposure to volatile organic compounds (VOCs), carbon monoxide (CO), and nitrogen dioxide (NO₂) has also been associated with an increased risk of primary hypothyroidism (ICD-10 code E03) among individuals living near petrochemical complexes [11]. Additionally, short-term exposure to PM₂.₅ (lag 0) has been linked to significant increases in hospital outpatient visits for endocrine disorders (ICD-10 codes E00–E90), as well as digestive, urological (ICD-10 codes R30–R39), and dermatological conditions [12].
Dust outbreaks characterized by high concentrations of PM₁₀ and PM₂.₅ have been significantly associated with increased emergency department visits for respiratory conditions (ICD-10 codes R04.2–R06, R09.0–R09.3, R09.89), particularly among individuals under five and over 65 years of age [13].
The relationships identified above for these health categories warrant further investigation into the impact of urban air pollution. One such study explored associations between concentrations of urban air pollutants and adverse health outcomes in Toronto, Canada [14]. Specifically, it assessed the short-term effects of exposure to ambient air pollutants on multiple disease categories. The study focused geographically on the Census Division (CD) of Toronto, Ontario, which, as of 2016, had a population of 2,731,571 and a population density of approximately 4,334 people per square kilometer. The study population included individuals who visited emergency departments (EDs) and resided within the Toronto CD. The study period spanned from April 2004 to December 2015.
The health outcomes considered were classified according to the following ICD-10 categories [6]:
(a) C00–D48: Neoplasms (Chapter II)
(b) D50–D98: Diseases of the blood and blood-forming organs and certain disorders involving the immune mechanism (Chapter III)
(c) E00–E90: Endocrine, nutritional, and metabolic diseases (Chapter IV)
(d) R00–R99: Symptoms, signs, and abnormal clinical and laboratory findings, not elsewhere classified (Chapter XVIII)
The primary aim of this study was to provide evidence that various health conditions—many of which have not been thoroughly studied—are associated with air pollution concentration levels. The study examined associations between specific health outcomes and air pollutants, their lag effects, and demographic subgroups such as age and sex, and also season. This resulted in the creation of 18 strata categories, defined by sex (all, male, female), age group (under 11, 11–60, over 60), and season (warm period: April–September; cold period: October–March) [14].
The study employed well-established statistical methodologies and utilized reliable health and environmental datasets. Its findings contribute to a deeper understanding of the disease burden associated with acute fluctuations in urban air pollution levels.
2. Materials and Methods
Data on six ambient air pollutants—carbon monoxide (CO), nitrogen dioxide (NO₂), ozone (O₃), sulfur dioxide (SO₂), daily maximum 8-hour ozone (O₃H8), and fine particulate matter (PM₂.₅, with a diameter ≤2.5μm)—were compiled and merged with daily counts of ED visits [14]. Daily average concentrations were used to represent urban pollutant levels.
Additionally, the Air Quality Health Index (AQHI) was calculated based on NO₂, O₃, and PM₂.₅ concentrations. The coefficients used in the AQHI formula were derived from mortality risks in large Canadian cities [15], and the values were calculated as follows:
An alternative index (AQHIX) was also calculated, replacing O₃ with O₃H8 to emphasize ozone exposure. These two indexes were considered measures of exposure.
A total of 2,160 statistical models (15 lags × 18 strata × 8 air pollutants or index values) were developed for a given ICD-10 chapter (Chapters II–IV and XVIII), following the model specification:
ModelH = gnm(DCOUNT ~ AirPoll + ns(Temperature, 3) + ns(Humidity, 3)),
Here, DCOUNT represents the daily counts for each stratum. A quasi-Poisson model was chosen to account for over dispersed count data. The Cluster variable refers to groups of days defined by the structure “year: month: day of the week.” The EDVisits dataset contains daily counts of emergency department visits, pollutant concentrations, weather variables, and date information (Cluster) [16,17].
The coefficients (Beta) and standard errors (SE) for the considered air pollutants and indexes were estimated using a case-crossover (CC) design [18,19]. This was implemented via the model above. In this classical CC approach, a time-stratified technique was applied to define controls for cases. The Cluster variable grouped days belonging to the same month and weekday. The CC design inherently adjusts for time-invariant characteristics such as chronic health conditions or socioeconomic status.
Only two values from the model—the coefficients (Beta) and standard errors (SE)—were used in the study. The primary objective was to develop concentration–response functions (C-RFs). Nonlinear functions were constructed to represent the relative risks (RR) associated with lagged exposures. Lags from 0 to 14 days were considered, i.e., from the same day of exposure up to two weeks prior.
The primary outputs of the model were the estimated slope (β) and its standard error (SE). These values were used to compute relative risks (RR) and the corresponding 95% confidence intervals (95% CI), quantifying the health impact of air pollutant exposure. Relative risk was calculated for a 10-unit increase in pollutant concentration using the formula:
The 95% confidence interval was calculated as:
In the second methodological step, RR values were modeled as a function of lag time using a nonlinear cubic polynomial function of the form:
where x represents the lag in days (ranging from 0 to 14). The coefficients of the polynomial were estimated using the nlsLM function in R, which applies a nonlinear least squares optimization algorithm [20]. This approach enabled a detailed characterization of the temporal pattern of relative risk following exposure.
The data used, R scripts, and example results are available at the following location: https://github.com/szyszkowiczm/ICD10-C00D48-D50D89-E00E90-R00R99TORONTO_META. This repository allows for verification of the presented results and also provides the ability to obtain RR model coefficients as a function of lag for various combinations.
3. Results
The results are presented in two stages. In the first stage, the distribution of the estimated coefficients is shown using boxplots. This graphical presentation allows for visual identification of associations and how they change across the applied lag periods.
Figure 1, Figure 2, Figure 3 and Figure 4 provide a graphical summary of the results. Each figure displays 2,160 values, organized by air pollutant, stratification group, and lag period. The second stage of the analysis focuses on the analytical representation of risks. Using the estimated coefficients (Beta), relative risk functions RR(x) were derived. Importantly, these functions incorporate information from a set of 18 values corresponding to individual strata.
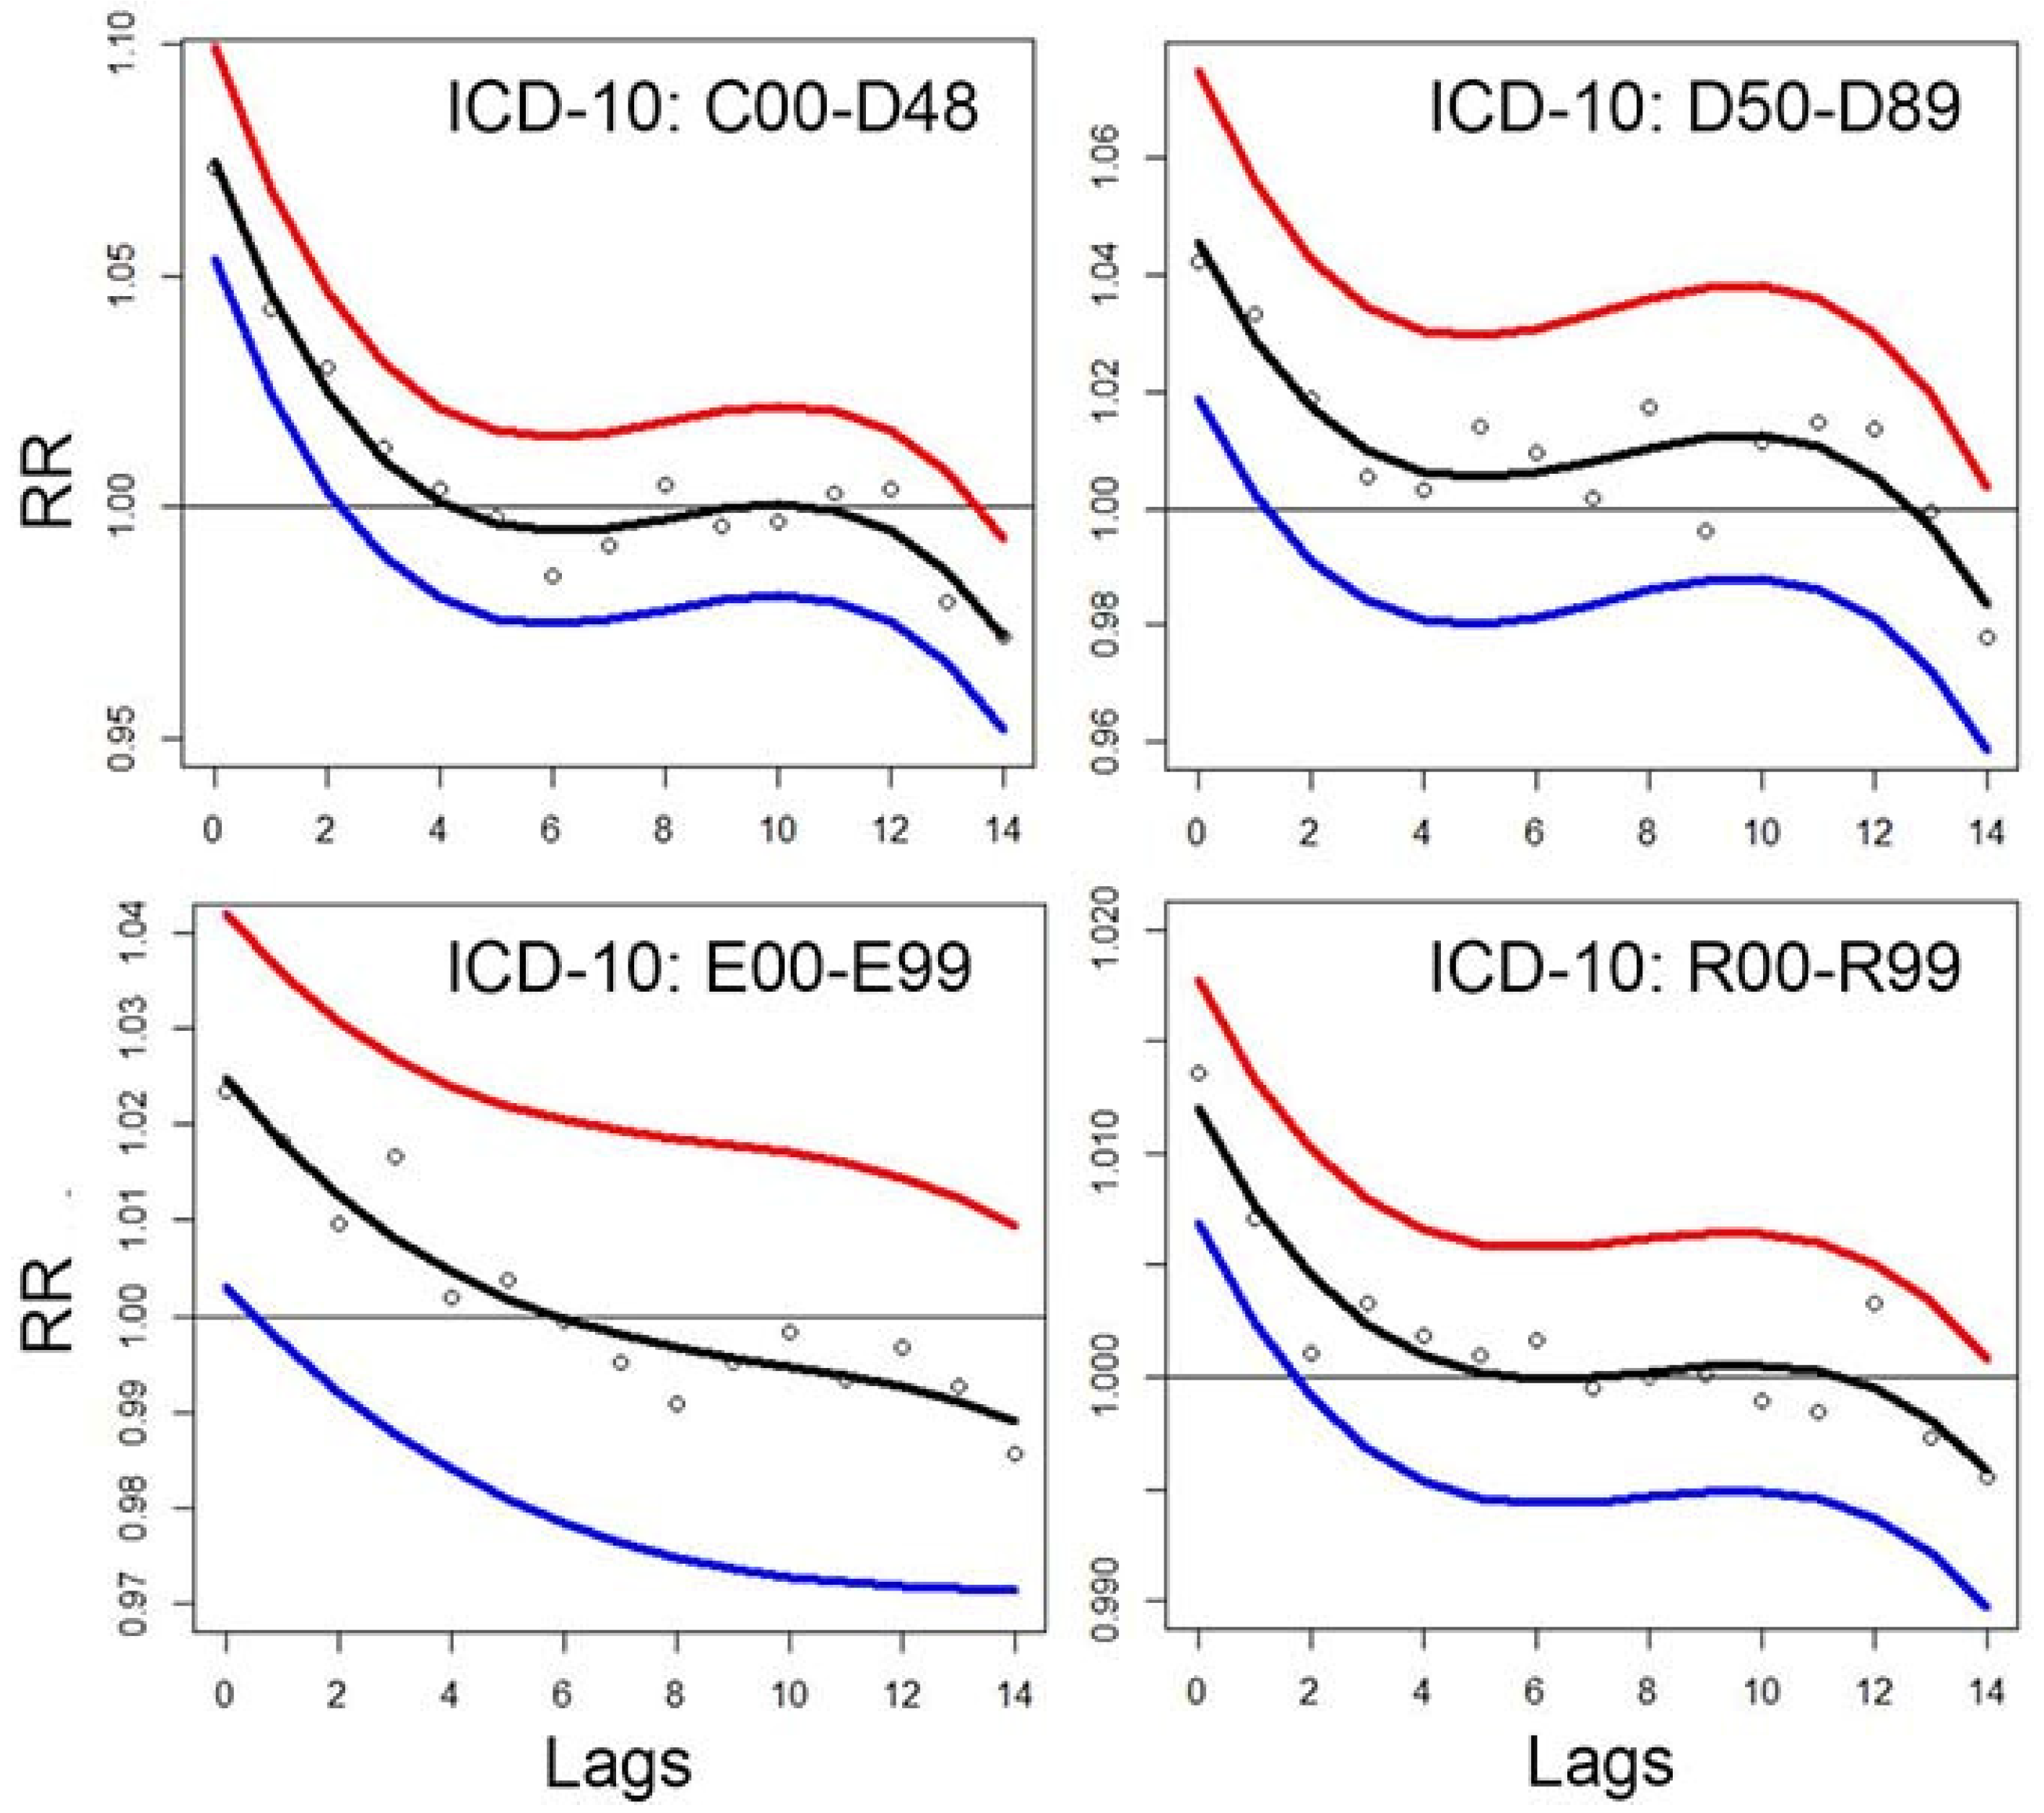
Figure 5 indicates that exposure on the same day or 1–2 days prior to the emergency department (ED) visit has the greatest health impact. For lag 0 (same-day exposure), the estimated relative risks (RR) are approximately 1.08, 1.04, 1.02, and 1.09 for Chapters II, III, IV, and XVIII, respectively. In contrast, for the longest lag periods, the associations diminish and are no longer statistically significant.
4. Discussion
Numerous studies have demonstrated positive correlations between short-term changes in ambient air pollution levels and cardiopulmonary health outcomes. The large number of related publications reflects the strong focus on this topic within thematic and cause-specific research [1]. The ratio of studies related to pulmonary versus cardiac outcomes highlights a traditional assumption in environmental epidemiology — namely, that “inhalation of polluted air affects the human respiratory system.”
A recent PubMed search using the keywords “air pollution pulmonary” yielded over 14,795 results, while “air pollution cardiac” returned 4,971 results. In contrast, a search for “air pollution depression” produced 934 results, and “air pollution mental” returned 1,580 results. These publication counts clearly illustrate the current research emphasis in the field of environmental health.
The present study examines four broad groups of health conditions, each corresponding to a specific chapter of the ICD-10 classification [6,14]. Although these health outcomes differ in nature, they were all analyzed using the same environmental exposure data and a consistent statistical methodology. This unified approach enables both the identification and comparison of effects across different health conditions. The aim is to demonstrate that, beyond traditionally studied diseases, other conditions may also be linked to ambient air pollution exposure. The results reveal consistent associations across all condition categories, particularly for lag periods ranging from 0 to 3 or 4 days.
The applied method is a case-control design based on a log-linear model. Consequently, relative risk is estimated using an exponential function: RR = exp(β × concentration). This model determines the concentration–response function (C-RF). The results shown in Figure 5 allow the tabulation of C-RFs for selected pollutant levels. These results also incorporate stratified data. Specifically, the median values from 18 estimation strata are used.
Several methodological techniques underpin this analysis. Little introduced the ADMODEL, a formal advertising response model incorporating distributed lag structures to account for delayed and cumulative effects of advertising on sales [21]. Over the years, various functional forms of distributed lag models have been developed to capture the decay patterns of such effects.
The first applications of dynamic linear models (DLMs) to air pollution and health outcomes appeared in the late 1990s and early 2000s. These foundational and highly cited studies marked the beginning of efforts to model short-term effects of air pollution on mortality and hospital admissions, while better capturing temporal dynamics and uncertainty than traditional models [22].
Since then, DLMs have been increasingly employed in environmental epidemiology to assess short-term effects of air pollution on emergency department (ED) visits. These models provide a flexible framework to capture time-varying associations between pollutant exposure and health outcomes, while accounting for temporal trends, seasonality, and autocorrelation. The technique has also been adapted for stratified or subgroup analyses. Researchers either stratify populations or include interaction terms in DLMs — or in extended forms such as distributed lag nonlinear models (DLNMs) — to assess heterogeneous effects [23,24].
In the current study, the model was used to compute responses to ambient nitrogen dioxide (NO₂) exposure (Figure 5). Let Z denote NO₂ concentration levels. Traditionally, such a crude variable is directly entered into statistical models to assess its relationship with health outcomes, yielding a C-RF of the form: C-RF(Z) = exp(β × Z)
For each lag period, a separate coefficient β is estimated, and the corresponding C-RF is derived. In this study, the models also incorporate stratified results — specifically, the medians from 18 subgroup estimates.
To better highlight the shape of the response function around average pollutant concentrations and reduce the influence of extreme values, the following transformation of Z is proposed:
where and LWF(Z) is a logistic weighted function:
In this formula, parameters A, μ, and τ control the shape of the transformation T(Z). The constant r is the range of Z, μ is a location parameter, and τ controls the curvature of the logistic function [25,26]. Model fitting involves estimating these parameters to optimize the goodness of fit of T(Z) within a linear combination of predictors. The estimation is performed using conditional Poisson regression (via the gnm model), within a case-crossover framework. Model quality can be assessed using the Akaike Information Criterion (AIC).
Given the log-linear nature of the model, the final concentration–response function takes the form:
Here, β is estimated jointly with the parameters defining the transformation T(Z). Once a series of C-RFs for statistically significant lags (p-value < 0.05) has been estimated, they can be aggregated into a single function with a common parametric form. This can be accomplished using least-squares approximation. The resulting parameters — A, μ, τ, and β — describe a response function representing the cumulative health risk associated with recent pollutant exposure.
This technique, however, is not implemented in the current study due to lack of access to raw data, including ED visits, air pollution levels, and weather variables. The method is instead described here as a possible alternative approach. Typically, such models provide more accurate fits of C-RFs and allow for better identification of potential exposure thresholds due to their flexibility.
5. Conclusions
This work contributes additional evidence that health outcomes classified under ICD-10 Chapters II–IV and XVIII are associated with ambient air pollution levels. The proposed technique enables the implementation of dynamic linear models and the integration of estimates obtained across various subgroups. The presented methodology shows promise for further research and application in environmental epidemiology.
Author Contributions
A single author.
Funding
This research received no external funding.
Institutional Review Board Statement
Not applicable.
Informed Consent Statement
Not applicable.
Data Availability Statement
The data used in this study are available at the following location https://github.com/szyszkowiczm/ICD10-C00D48-D50D89-E00E90-R00R99TORONTO. They are presented in the form (Beta, SE).
Use of Artificial Intelligence
AI was used to verify language editing and grammar. AI or AI-assisted tools were not used in drafting any aspect of this manuscript.
Conflicts of Interest
The author declares no conflicts of interest.
References
- Schraufnagel, D.E.; Balmes, J.R.; Cowl, C.T.; et al. Air pollution and noncommunicable diseases: a review by the Forum of International Respiratory Societies’ Environmental Committee, Part 2: Air Pollution and Organ Systems. Chest. 2019, 155(2):417–426.
- Gu, J.; Shi, Y.; Zhu, Y.; Chen, N.; Wang, H.; Zhang, Z.; Chen, T. Ambient air pollution and cause-specific risk of hospital admission in China: A nationwide time-series study. PLOS Med. 2020, 17, e1003188. [Google Scholar] [CrossRef] [PubMed]
- Szyszkowicz, M.; de Angelis, N. Ambient air pollution and emergency department visits in Toronto, Canada. Environ. Sci. Pollut. Res. 2021, 28, 28789–28796. [Google Scholar] [CrossRef] [PubMed]
- Szyszkowicz, M.; de Angelis, N. Urban Air Pollution and Emergency Department Visits for Cardiac and Respiratory Diseases. Adv. Environ. Eng. Res. 2021, 3, 1. [Google Scholar] [CrossRef]
- Szyszkowicz, M.; Schoen, S.; de Angelis, N. Air Pollution and Emergency Department Visits for Disease of the Genitourinary System. Environ. Heal. Insights 2021, 15. [Google Scholar] [CrossRef] [PubMed]
- World Health Organization. International Statistical Classification of Diseases and Related Health Problems; 10th Revision; World Health Organization: Geneva, Switzerland, 2016; Available online: https://icd.who.int/browse10/2016/en (accessed on 21 May 2025).
- Wang, N.; Mengersen, K.; Tong, S.; Kimlin, M.; Zhou, M.; Wang, L.; Yin, P.; Xu, Z.; Cheng, J.; Zhang, Y.; et al. Short-term association between ambient air pollution and lung cancer mortality. Environ. Res. 2019, 179, 108748. [Google Scholar] [CrossRef] [PubMed]
- Zhu, F.; Ding, R.; Lei, R.; Cheng, H.; Liu, J.; Shen, C.; Zhang, C.; Xu, Y.; Xiao, C.; Li, X.; et al. The short-term effects of air pollution on respiratory diseases and lung cancer mortality in Hefei: A time-series analysis. Respir. Med. 2019, 146, 57–65. [Google Scholar] [CrossRef] [PubMed]
- Morales-Ancajima, V.C.; Tapia, V.; Vu, B.N.; et al. Increased Outdoor PM2. 5 Concentration Is Associated with Moderate/Severe Anemia in Children Aged 6–59 Months in Lima, Peru. J. Environ. Public Health 2019, 2019, 16127845. [Google Scholar]
- Gao, K.; Chen, X.; Zhang, L.; Yao, Y.; Chen, W.; Zhang, H.; Han, Y.; Xue, T.; Wang, J.; Lu, L.; et al. Associations between differences in anemia-related blood cell parameters and short-term exposure to ambient particle pollutants in middle-aged and elderly residents in Beijing, China. Sci. Total. Environ. 2022, 816, 151520. [Google Scholar] [CrossRef] [PubMed]
- Zaccarelli-Marino, M.A.; Alessi, R.; Balderi, T.Z.; Martins, M.A.G. Association between the Occurrence of Primary Hypothyroidism and the Exposure of the Population Near to Industrial Pollutants in São Paulo State, Brazil. Int. J. Environ. Res. Public Heal. 2019, 16, 3464. [Google Scholar] [CrossRef] [PubMed]
- Wang, C.; Zhu, G.; Zhang, L.; Chen, K. Particulate matter pollution and hospital outpatient visits for endocrine, digestive, urological, and dermatological diseases in Nanjing, China. Environ. Pollut. 2020, 261, 114205. [Google Scholar] [CrossRef] [PubMed]
- Merrifield, A.; Schindeler, S.; Jalaludin, B.; Smith, W. Health effects of the September 2009 dust storm in Sydney, Australia: Did emergency department visits and hospital admissions increase? Environ. Health 2013, 12, 32–37. [Google Scholar] [CrossRef] [PubMed]
- Szyszkowicz, M.; Lukina, A.; Dinu, T. Urban Air Pollution and Emergency Department Visits for Neoplasms and Outcomes of Blood Forming and Metabolic Systems. Int. J. Environ. Res. Public Heal. 2022, 19, 5603. [Google Scholar] [CrossRef] [PubMed]
- Stieb, D.M.; Burnett, R.T.; Smith-Doiron, M.; Brion, O.; Shin, H.H.; Economou, V. A New Multipollutant, No-Threshold Air Quality Health Index Based on Short-Term Associations Observed in Daily Time-Series Analyses. J. Air Waste Manag. Assoc. 2008, 58, 435–450. [Google Scholar] [CrossRef] [PubMed]
- Armstrong, B.G.; Gasparrini, A.; Tobias, A. Conditional Poisson models: a flexible alternative to conditional logistic case cross-over analysis. BMC Med Res. Methodol. 2014, 14, 122–122. [Google Scholar] [CrossRef] [PubMed]
- Turner, H.; Firth, D. Generalized Nonlinear Models in R: An Overview of the gnm Package. (Version 1.1-1, 2020-02-02). Available online: https://cran.r-project.org/web/packages/gnm/vignettes/gnmOverview.pdf (accessed on 16 October 2021).
- Maclure, M. The Case-Crossover Design: A Method for Studying Transient Effects on the Risk of Acute Events. Am. J. Epidemiology 1991, 133, 144–153. [Google Scholar] [CrossRef] [PubMed]
- Janes, H.; Sheppard, L.; Lumley, T. Case-crossover analyses of air pollution exposure data: Referent selection strategies and their implications for bias. Epidemiology 2005, 16, 717–726. [Google Scholar] [CrossRef] [PubMed]
- R Core Team (2024). R: A Language and Environment for Statistical Computing. R Foundation for Statistical Computing, Vienna, Austria.
- Little, J.D.C. Models and managers: The concept of a decision calculus. Management Science. 1970; 16(8):B-466–B-485.
- Shaddick, G.; Wakefield, J. Modelling Daily Multivariate Pollutant Data at Multiple Sites. J. R. Stat. Soc. Ser. C (Applied Stat. 2002, 51, 351–372. [Google Scholar] [CrossRef]
- Gasparrini, A.; Armstrong, B.; Kenward, M.G. Distributed lag non-linear models. Stat. Med. 2010;29(21):2224–2234.
- Gasparrini, A. Distributed lag linear and non-linear models in R: The Package dlnm. J. Stat. Softw. 2011;43(8):1–20.
- Szyszkowicz, M.; Porada, E. A common concentration-response function based on the results applying lags. Zdr. Publicz- 2022, 132, 67–72. [Google Scholar] [CrossRef]
- Szyszkowicz, M. Concentration–Response Functions as an Essence of the Results from Lags. Int. J. Environ. Res. Public Heal. 2022, 19, 8116. [Google Scholar] [CrossRef] [PubMed]
Figure 1.
Distribution of coefficients (Beta) for air pollutants — Chapter II: C00–D48.
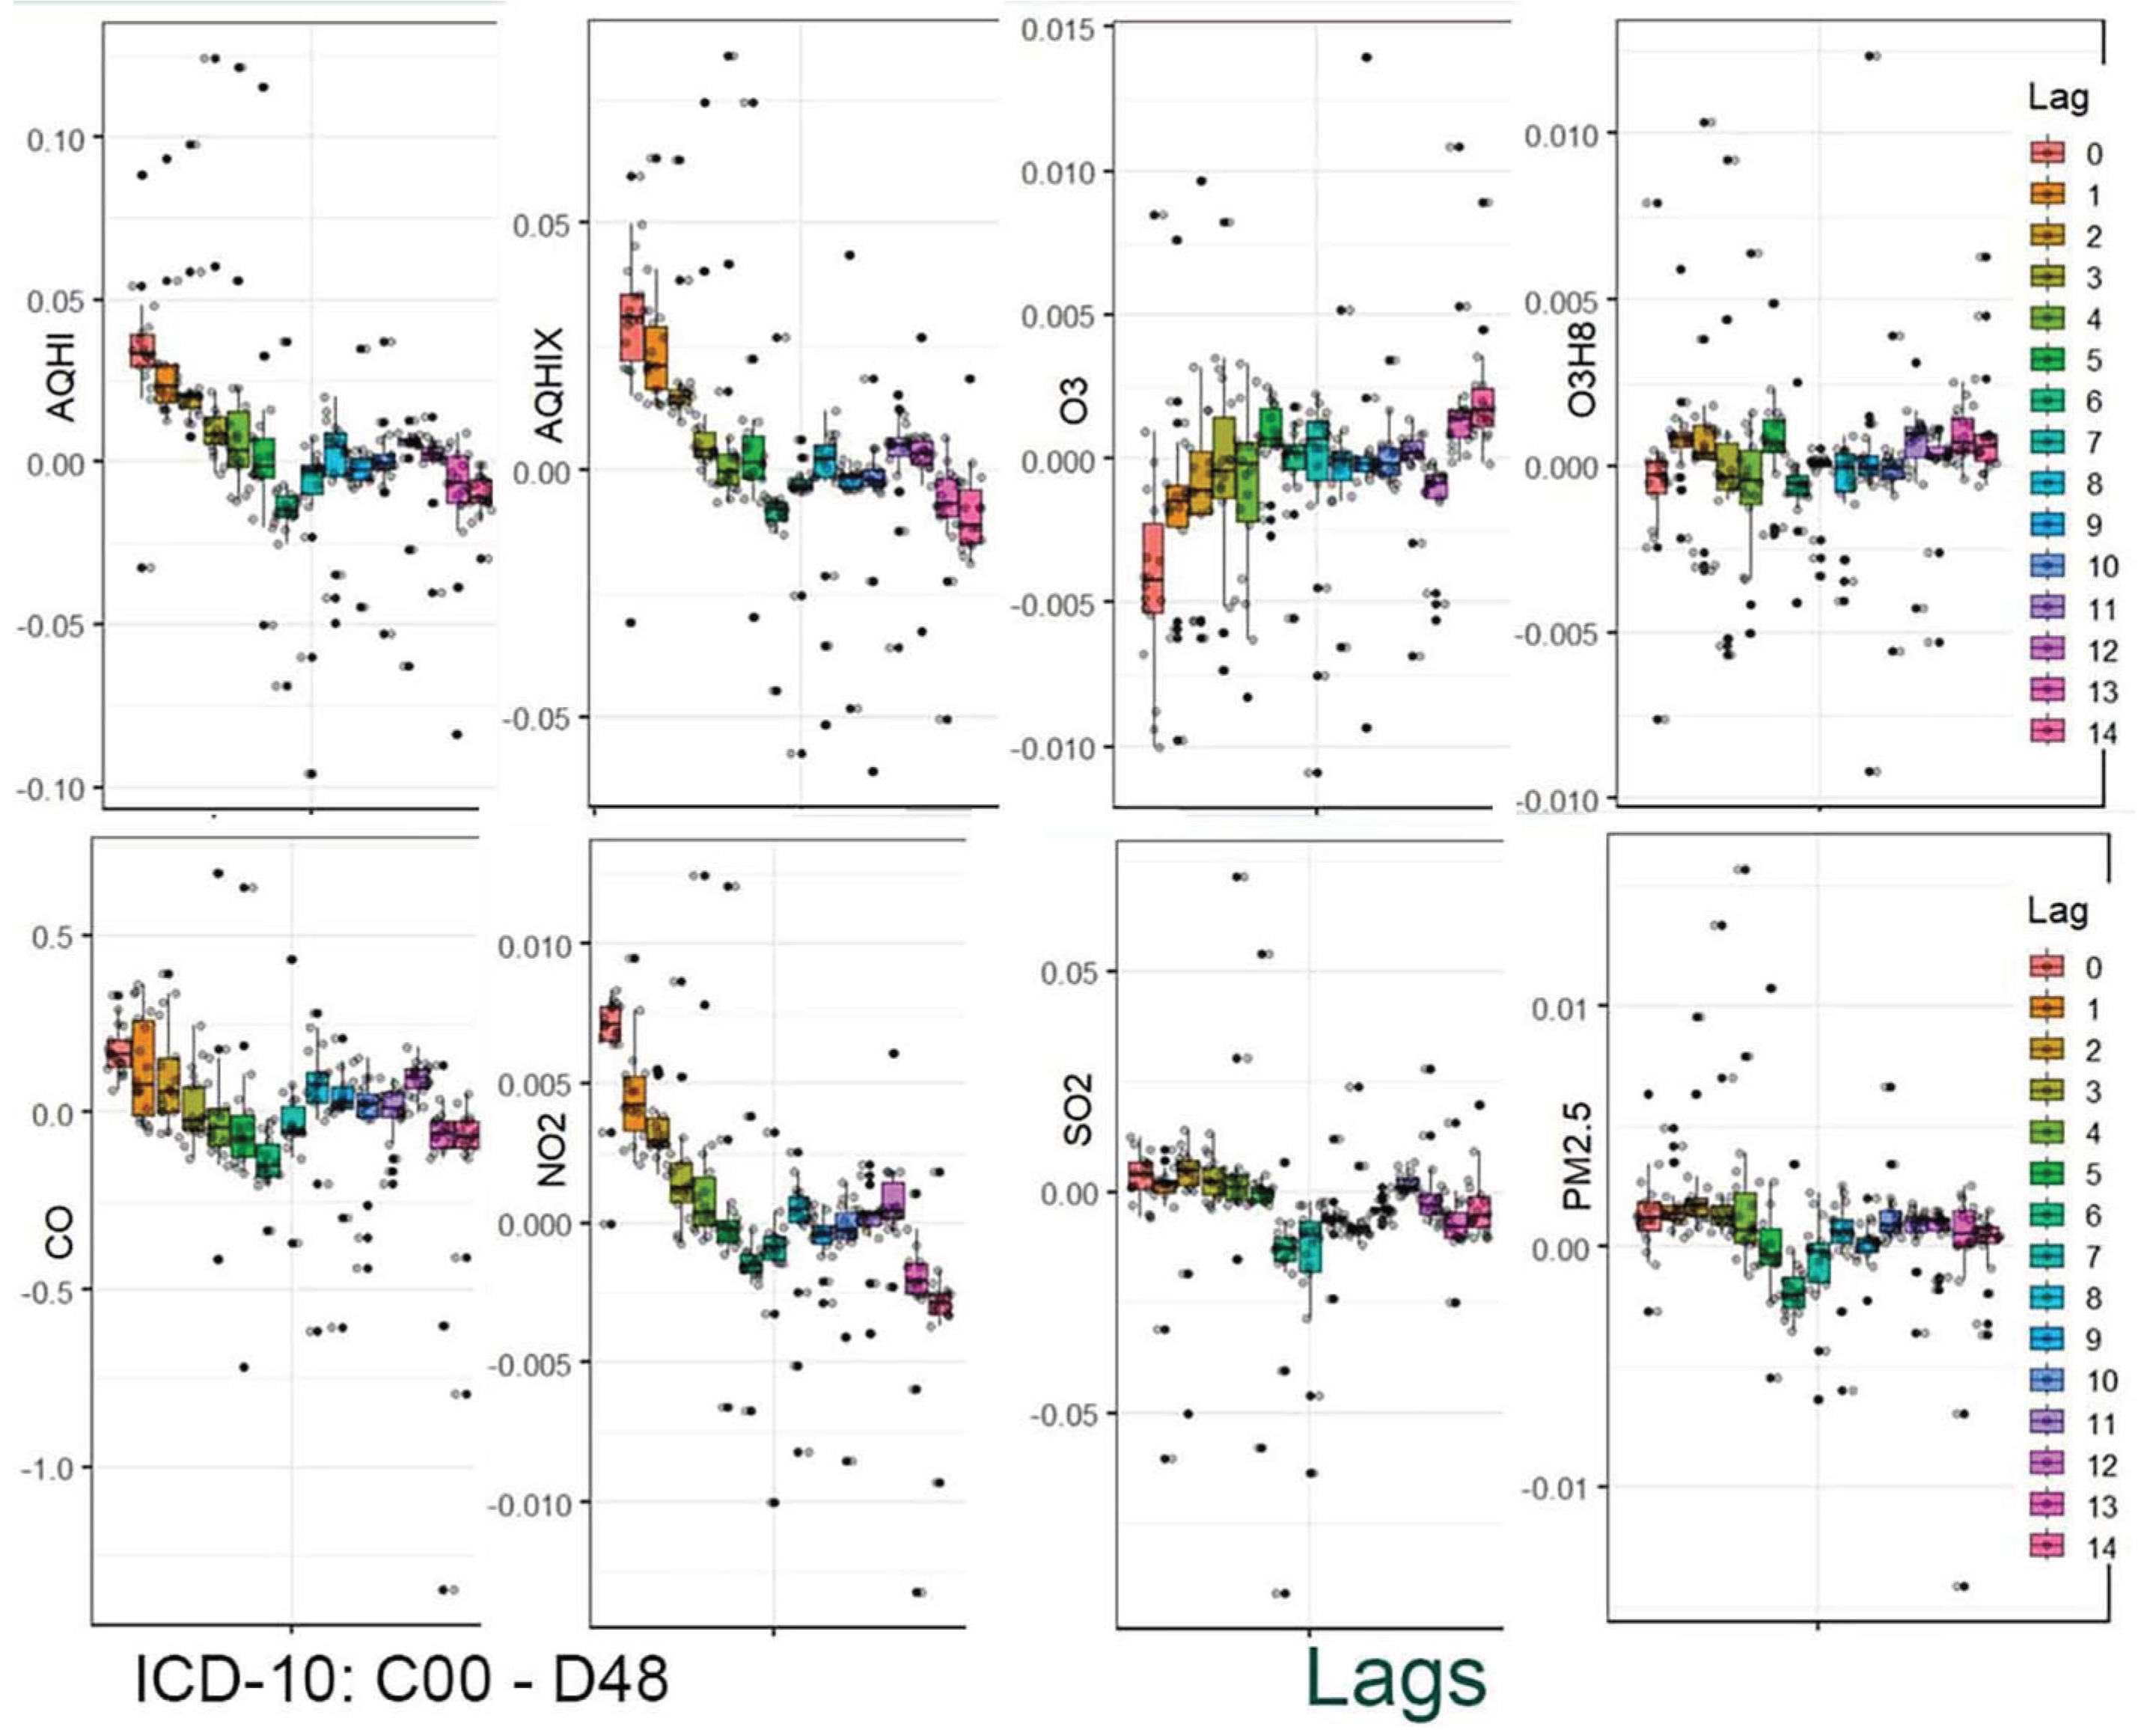
Figure 2.
Distribution of coefficients (Beta) for air pollutants — Chapter III: D50–D89.
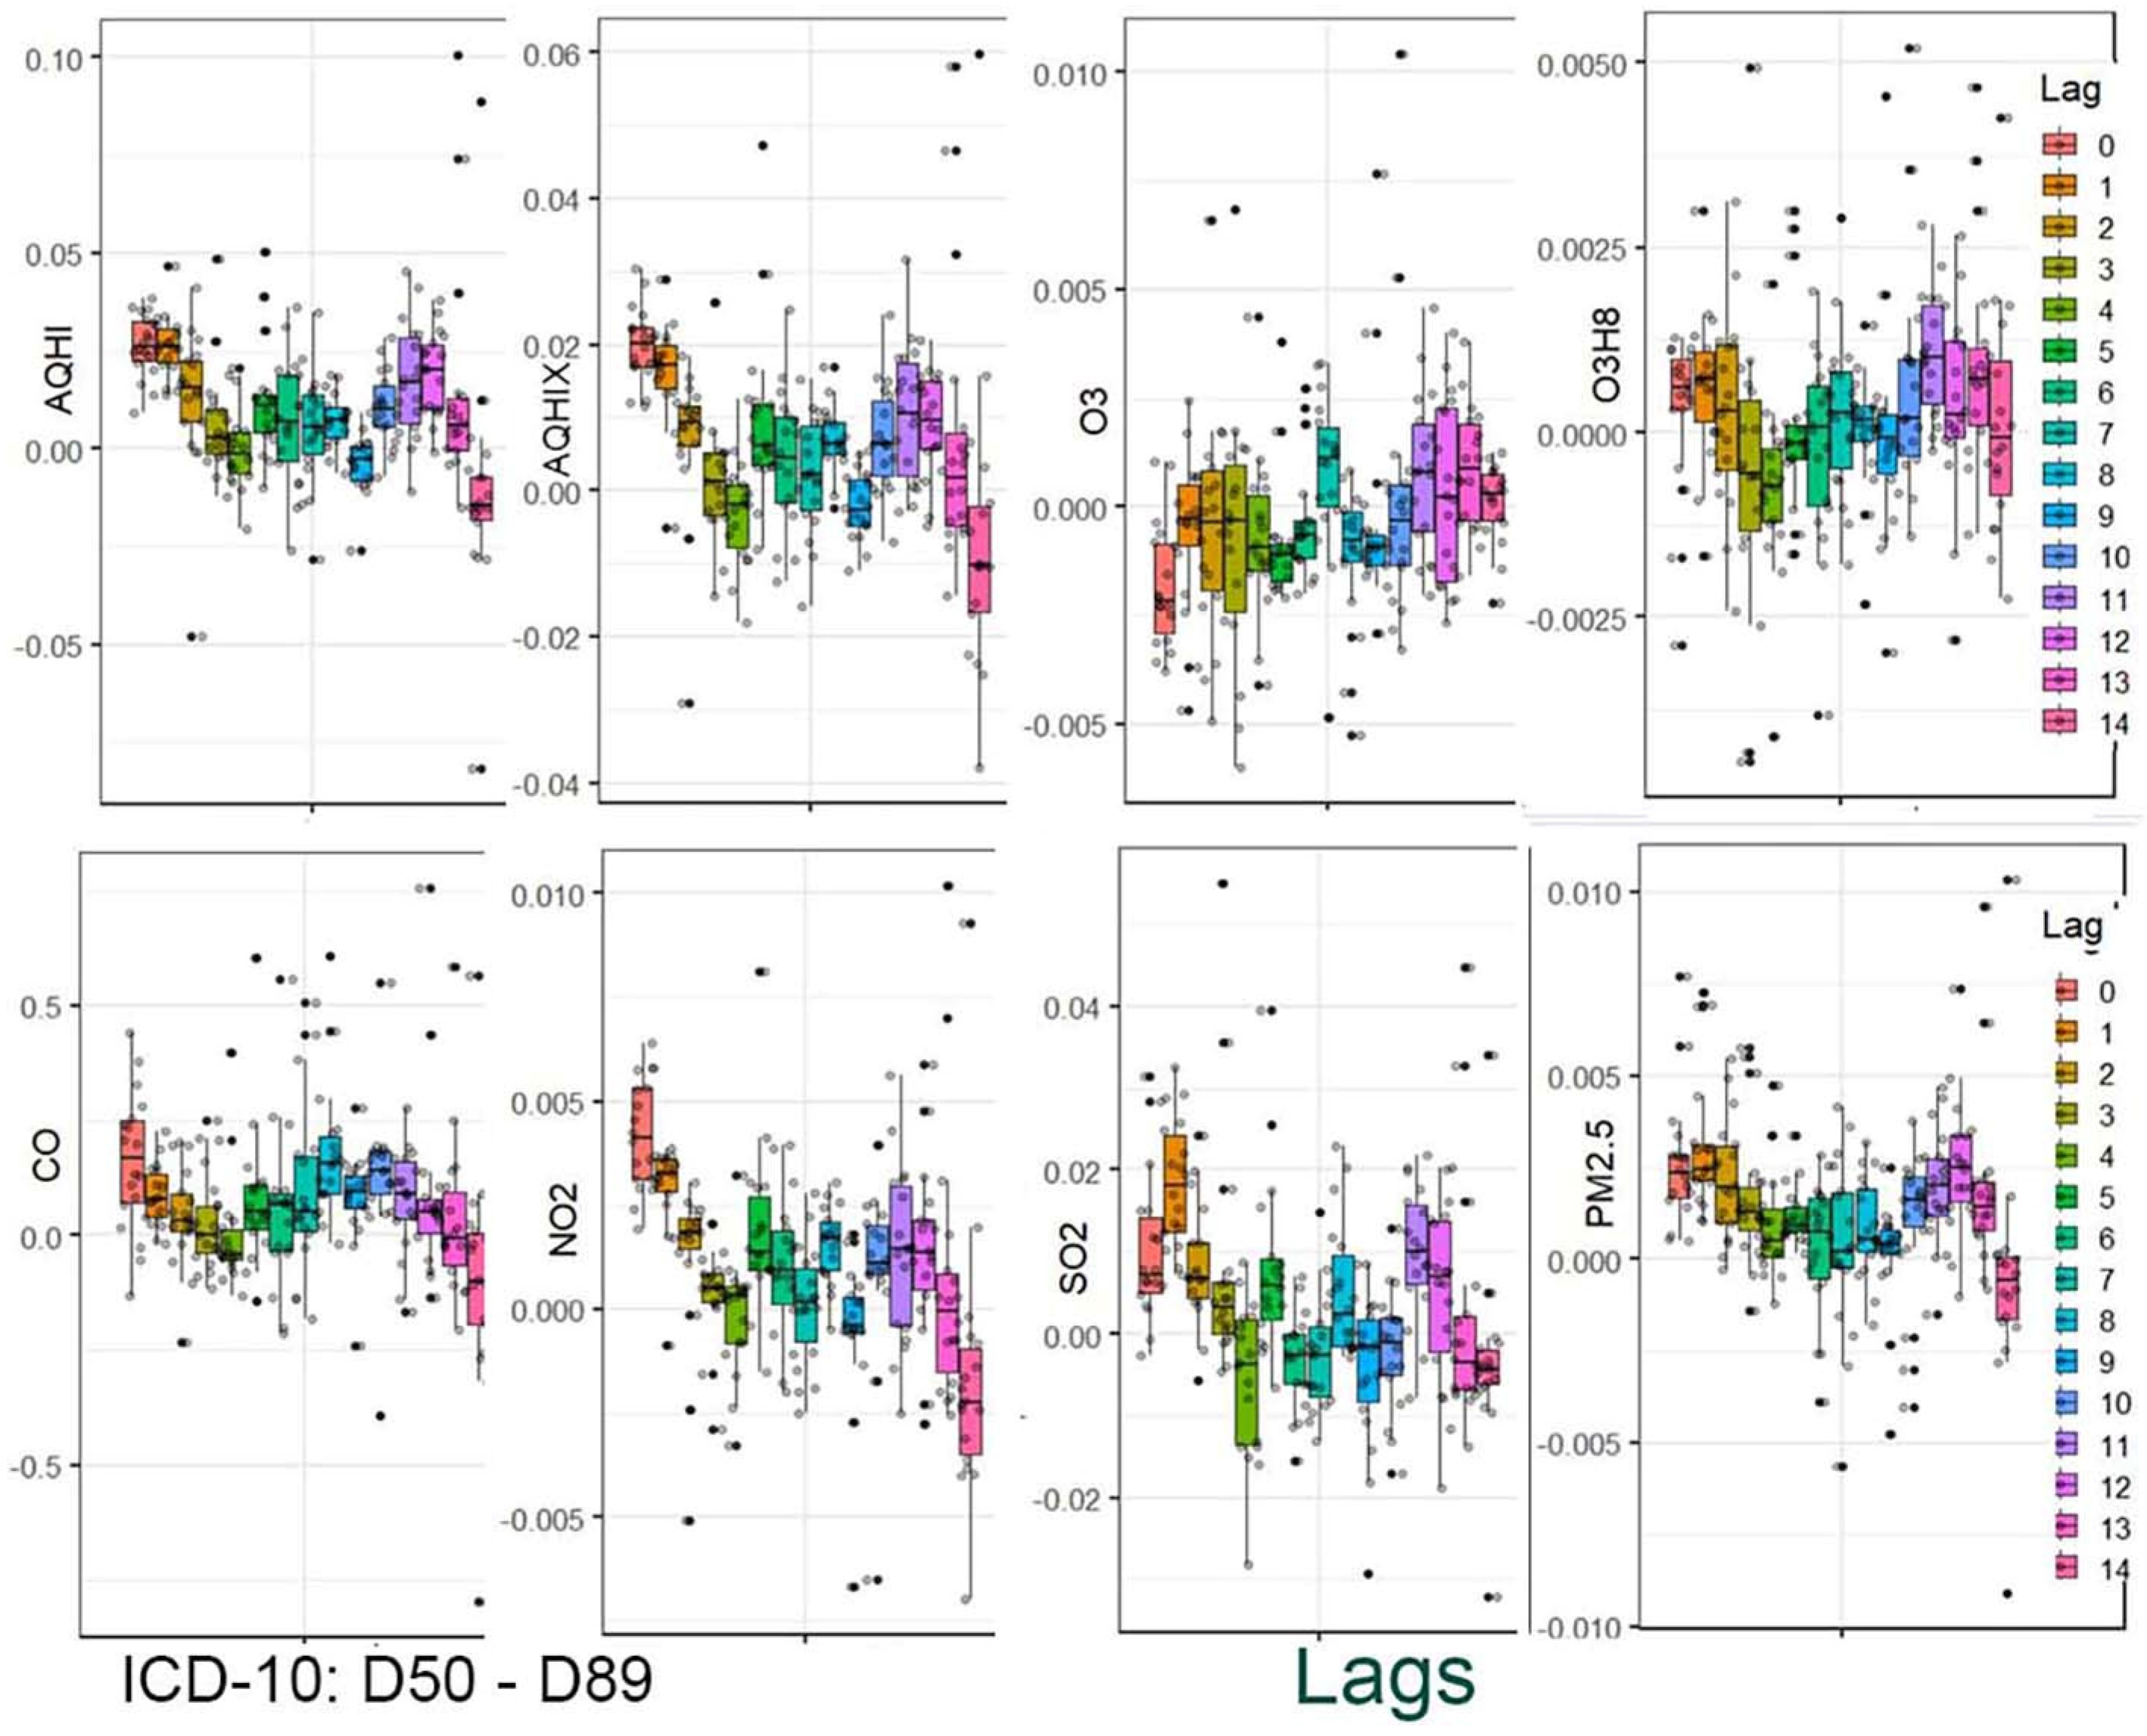
Figure 3.
Distribution of coefficients (Beta) for air pollutants — Chapter IV: E00–E99.
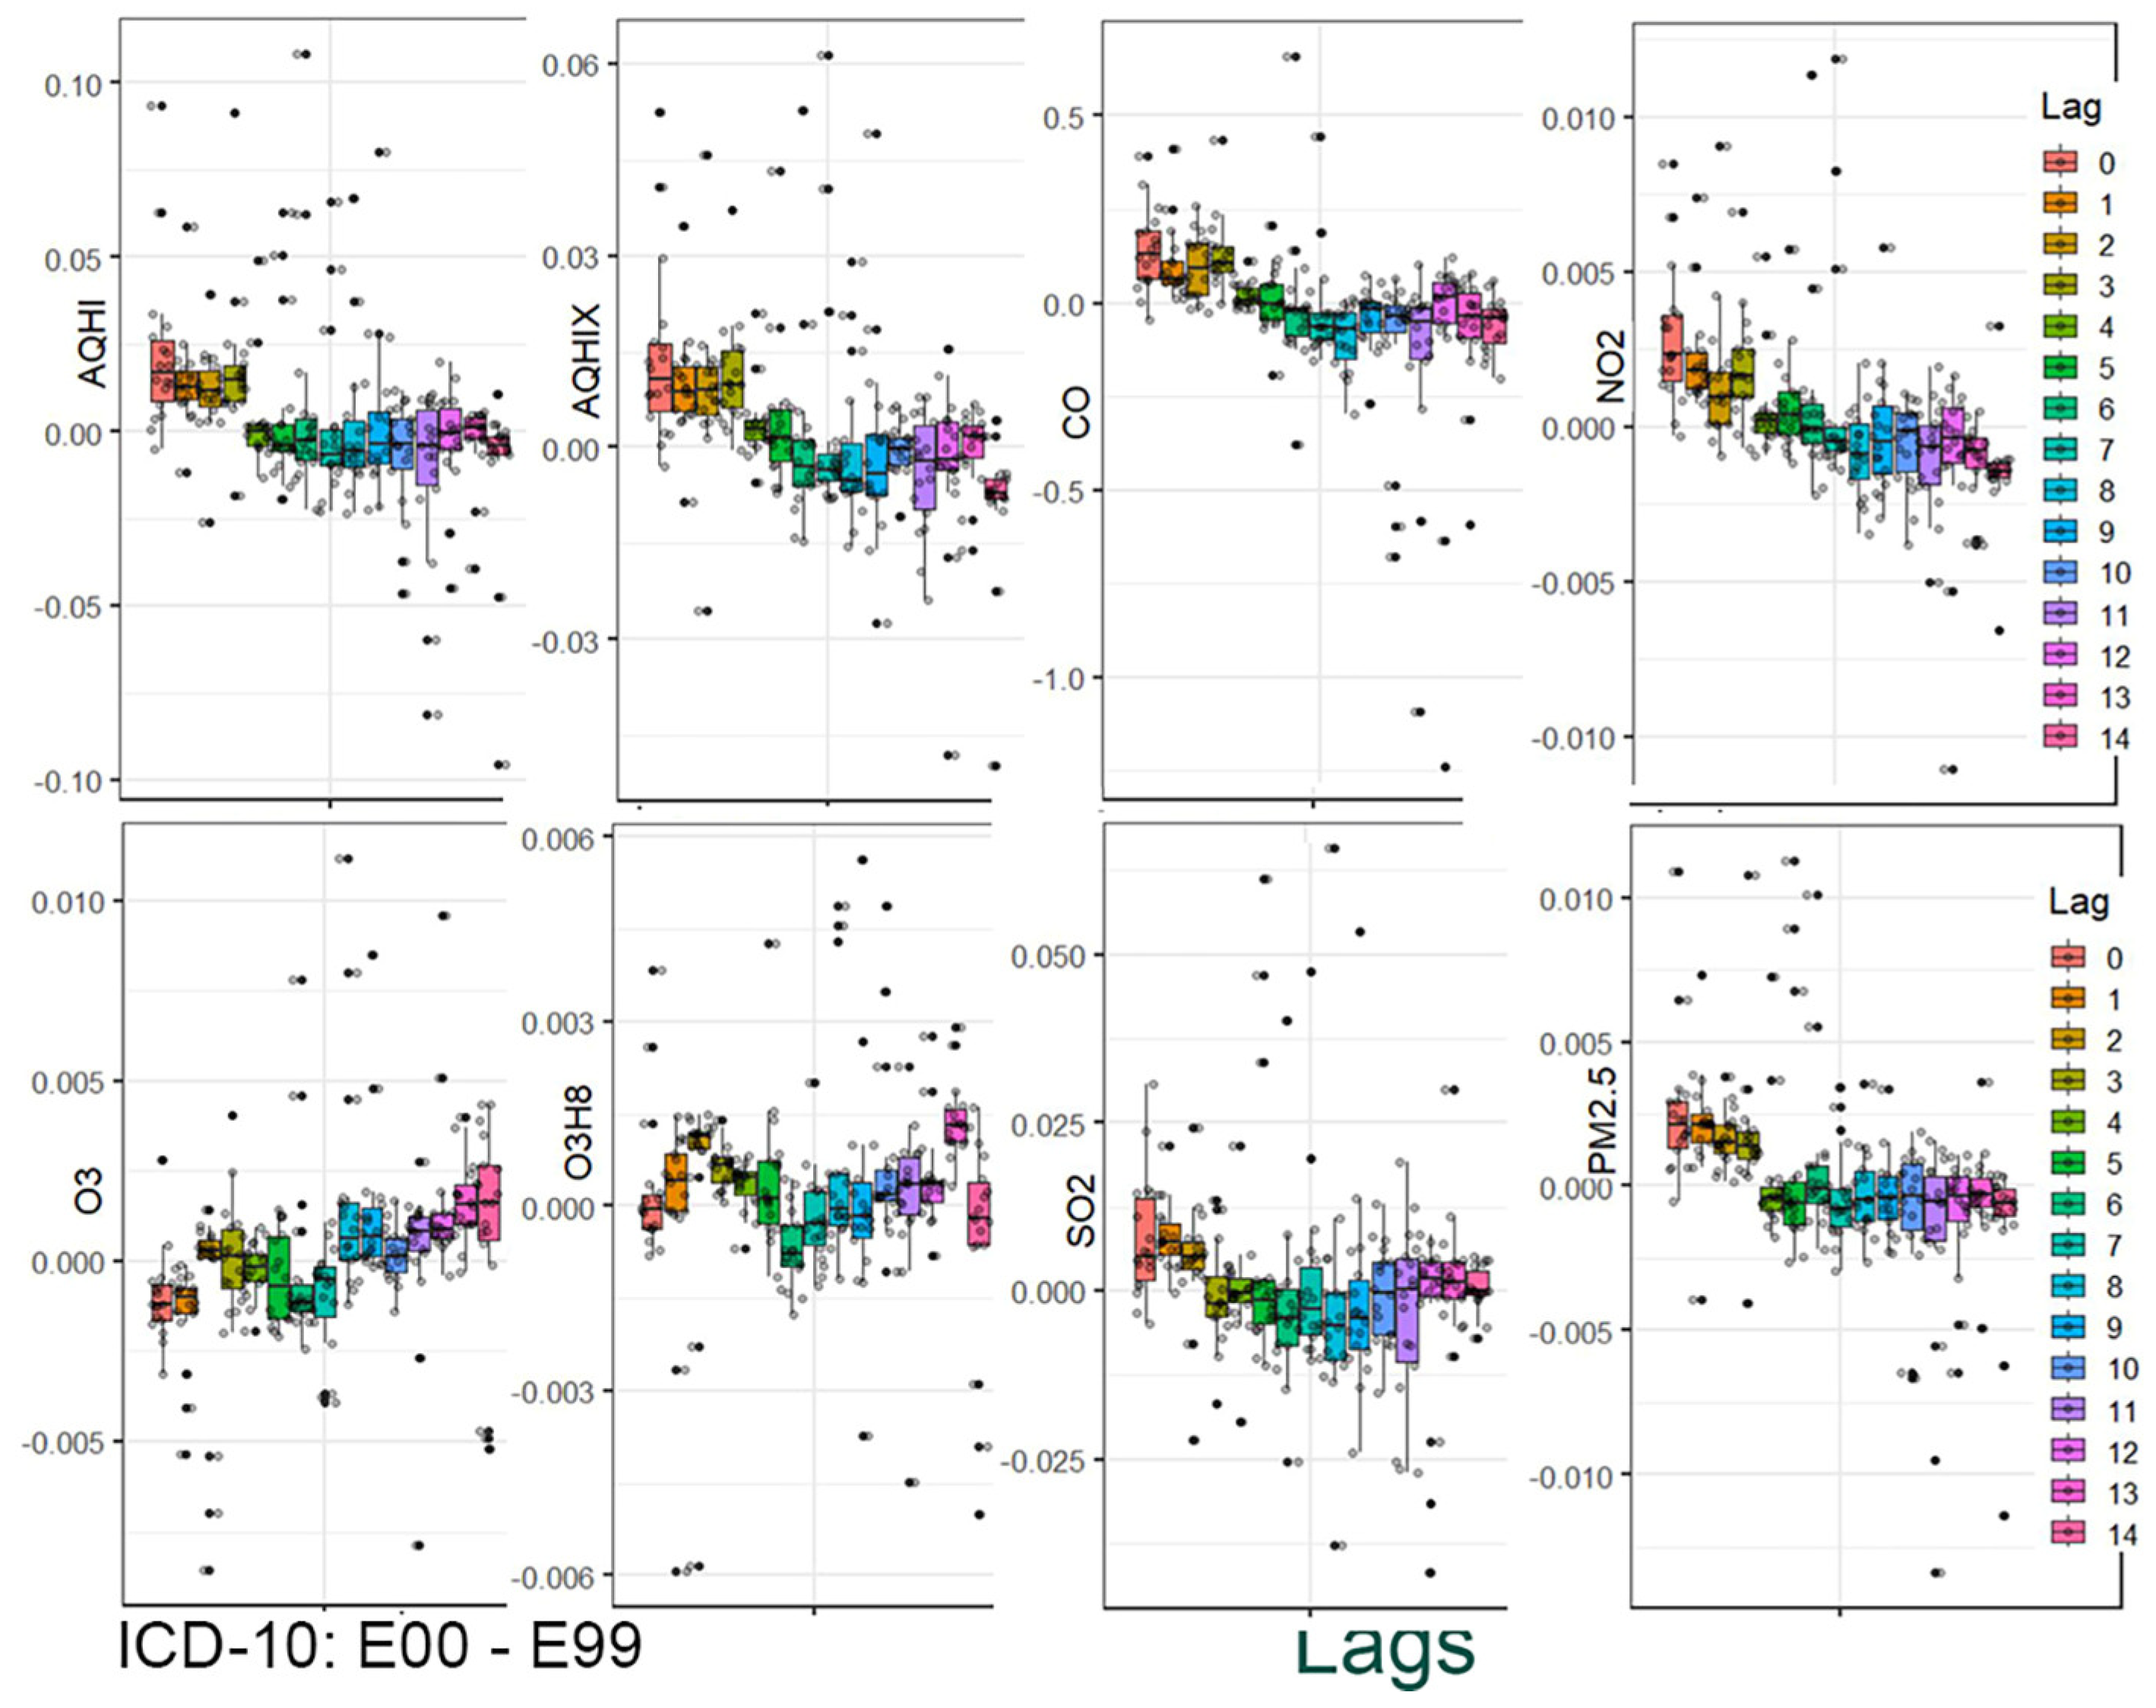
Figure 4.
Distribution of coefficients (Beta) for air pollutants — Chapter XVIII: R00–R99.
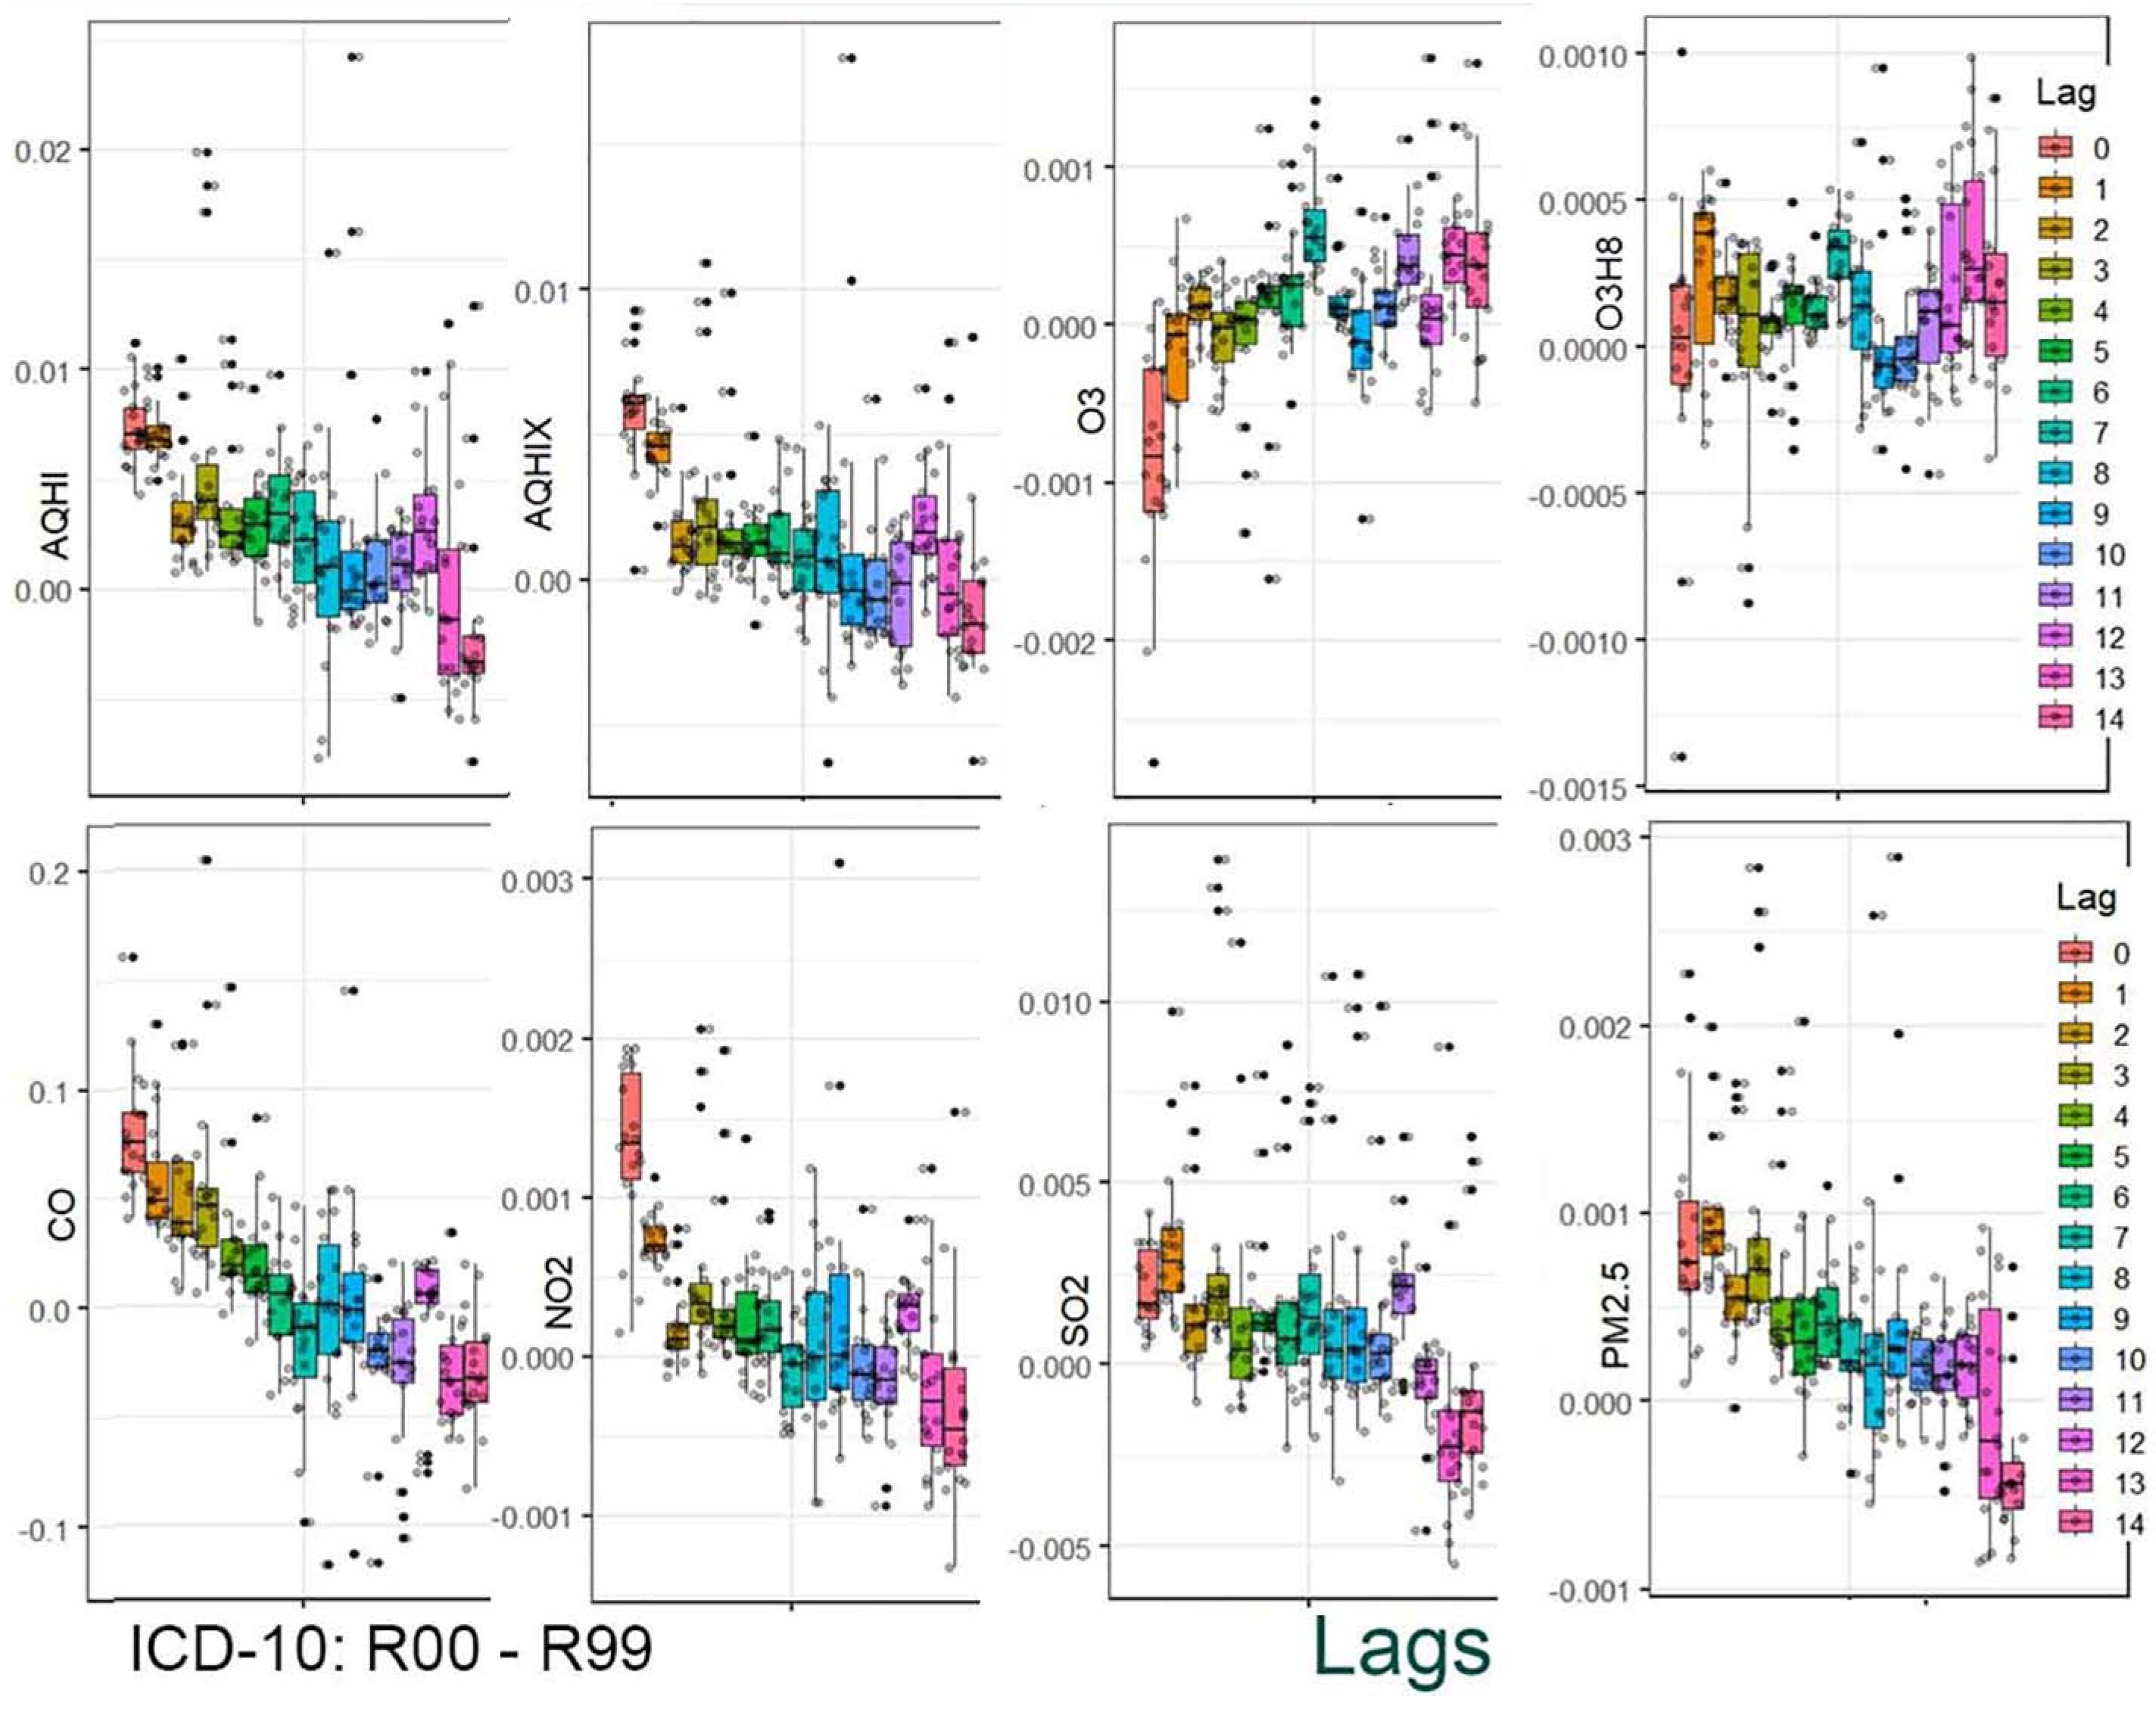
Figure 5.
Estimated relative risks (RR, black) along with their lower (blue) and upper (red) 95% confidence bounds for four disease categories. The points represent the median RR values. Estimates are presented for nitrogen dioxide (NO₂) concentration levels.
Figure 5.
Estimated relative risks (RR, black) along with their lower (blue) and upper (red) 95% confidence bounds for four disease categories. The points represent the median RR values. Estimates are presented for nitrogen dioxide (NO₂) concentration levels.
Disclaimer/Publisher’s Note: The statements, opinions and data contained in all publications are solely those of the individual author(s) and contributor(s) and not of MDPI and/or the editor(s). MDPI and/or the editor(s) disclaim responsibility for any injury to people or property resulting from any ideas, methods, instructions or products referred to in the content. |
© 2025 by the authors. Licensee MDPI, Basel, Switzerland. This article is an open access article distributed under the terms and conditions of the Creative Commons Attribution (CC BY) license (http://creativecommons.org/licenses/by/4.0/).
Copyright: This open access article is published under a Creative Commons CC BY 4.0 license, which permit the free download, distribution, and reuse, provided that the author and preprint are cited in any reuse.


