
Submitted:
24 March 2025
Posted:
26 March 2025
You are already at the latest version
Abstract
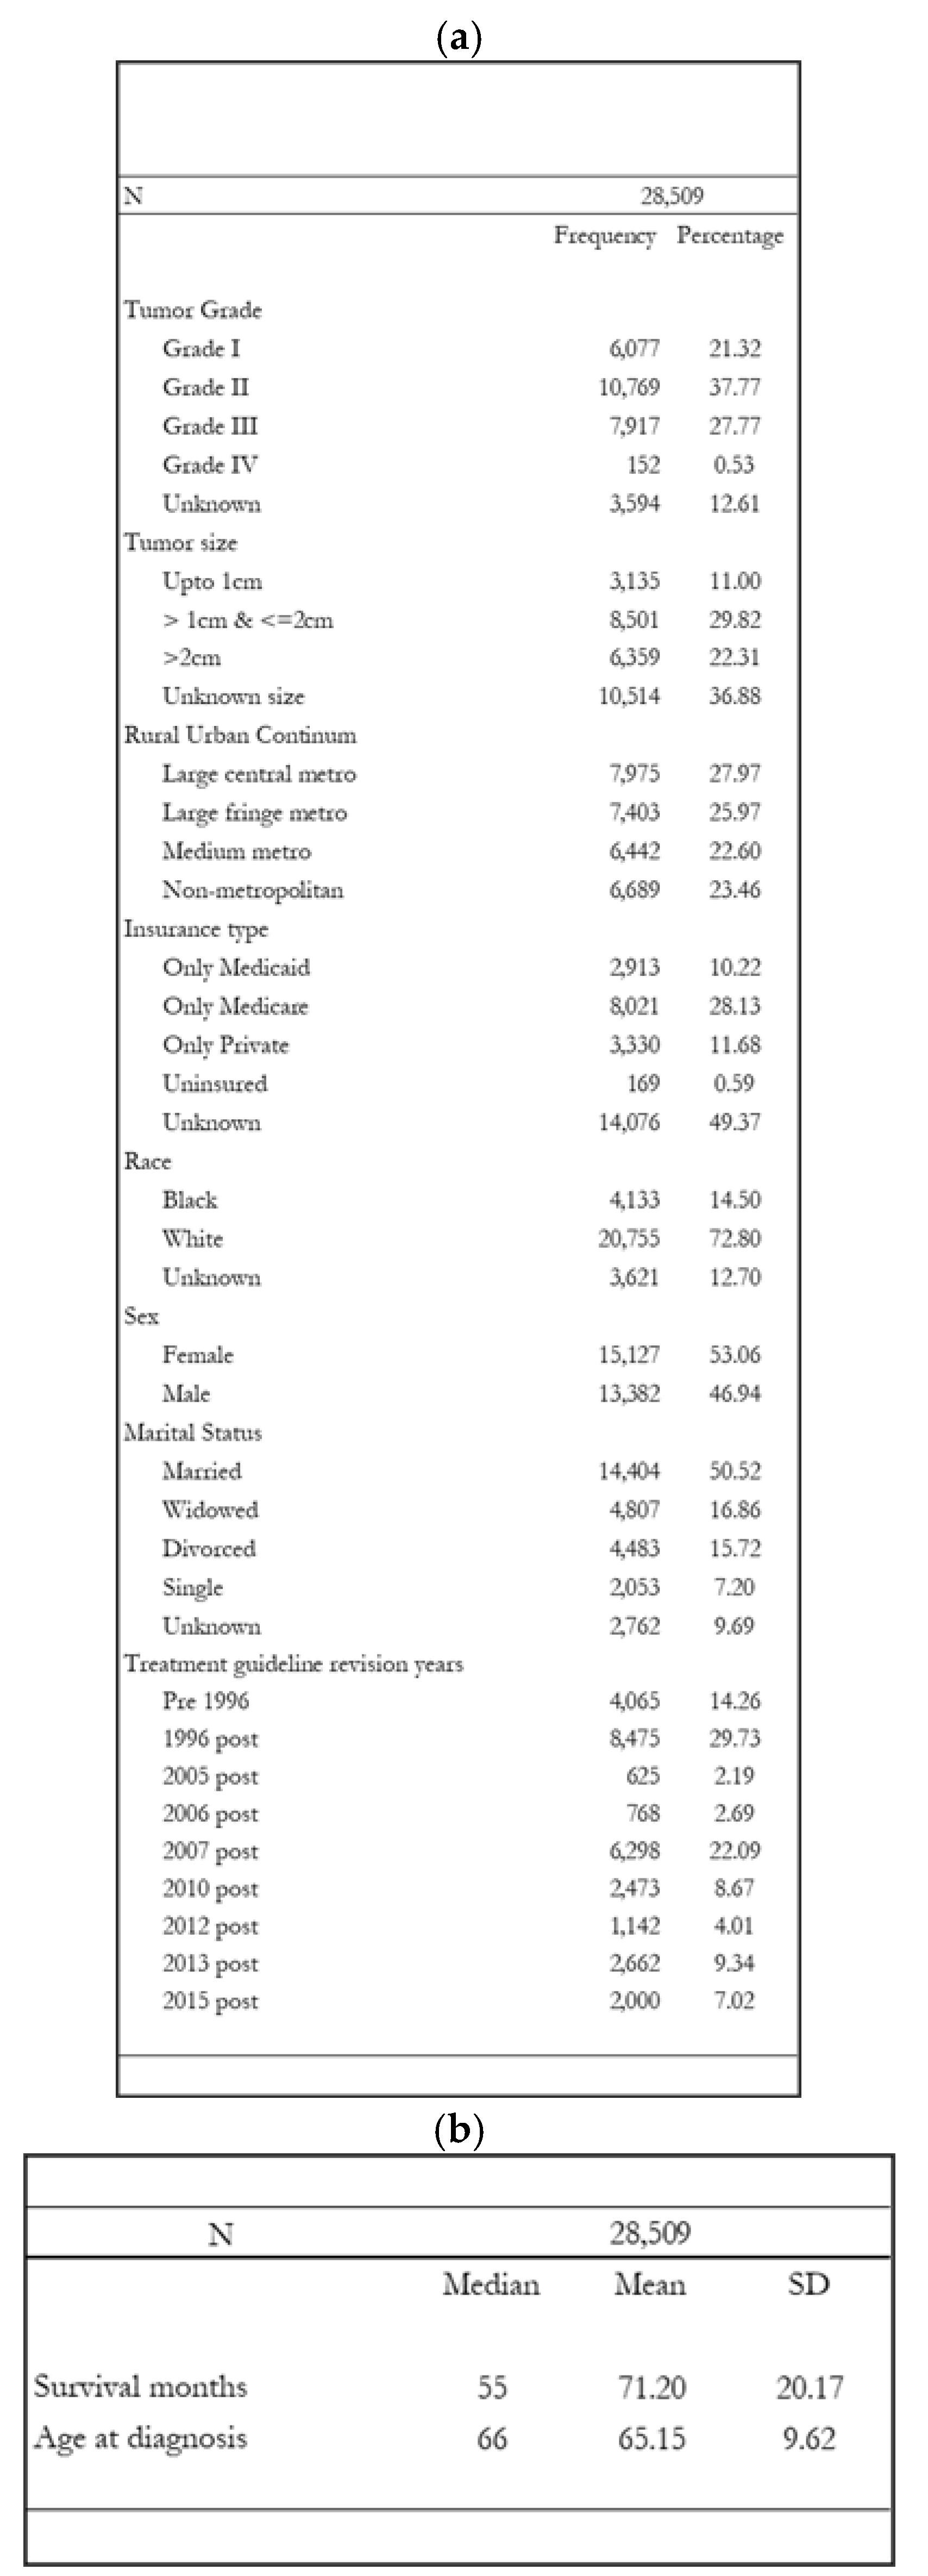
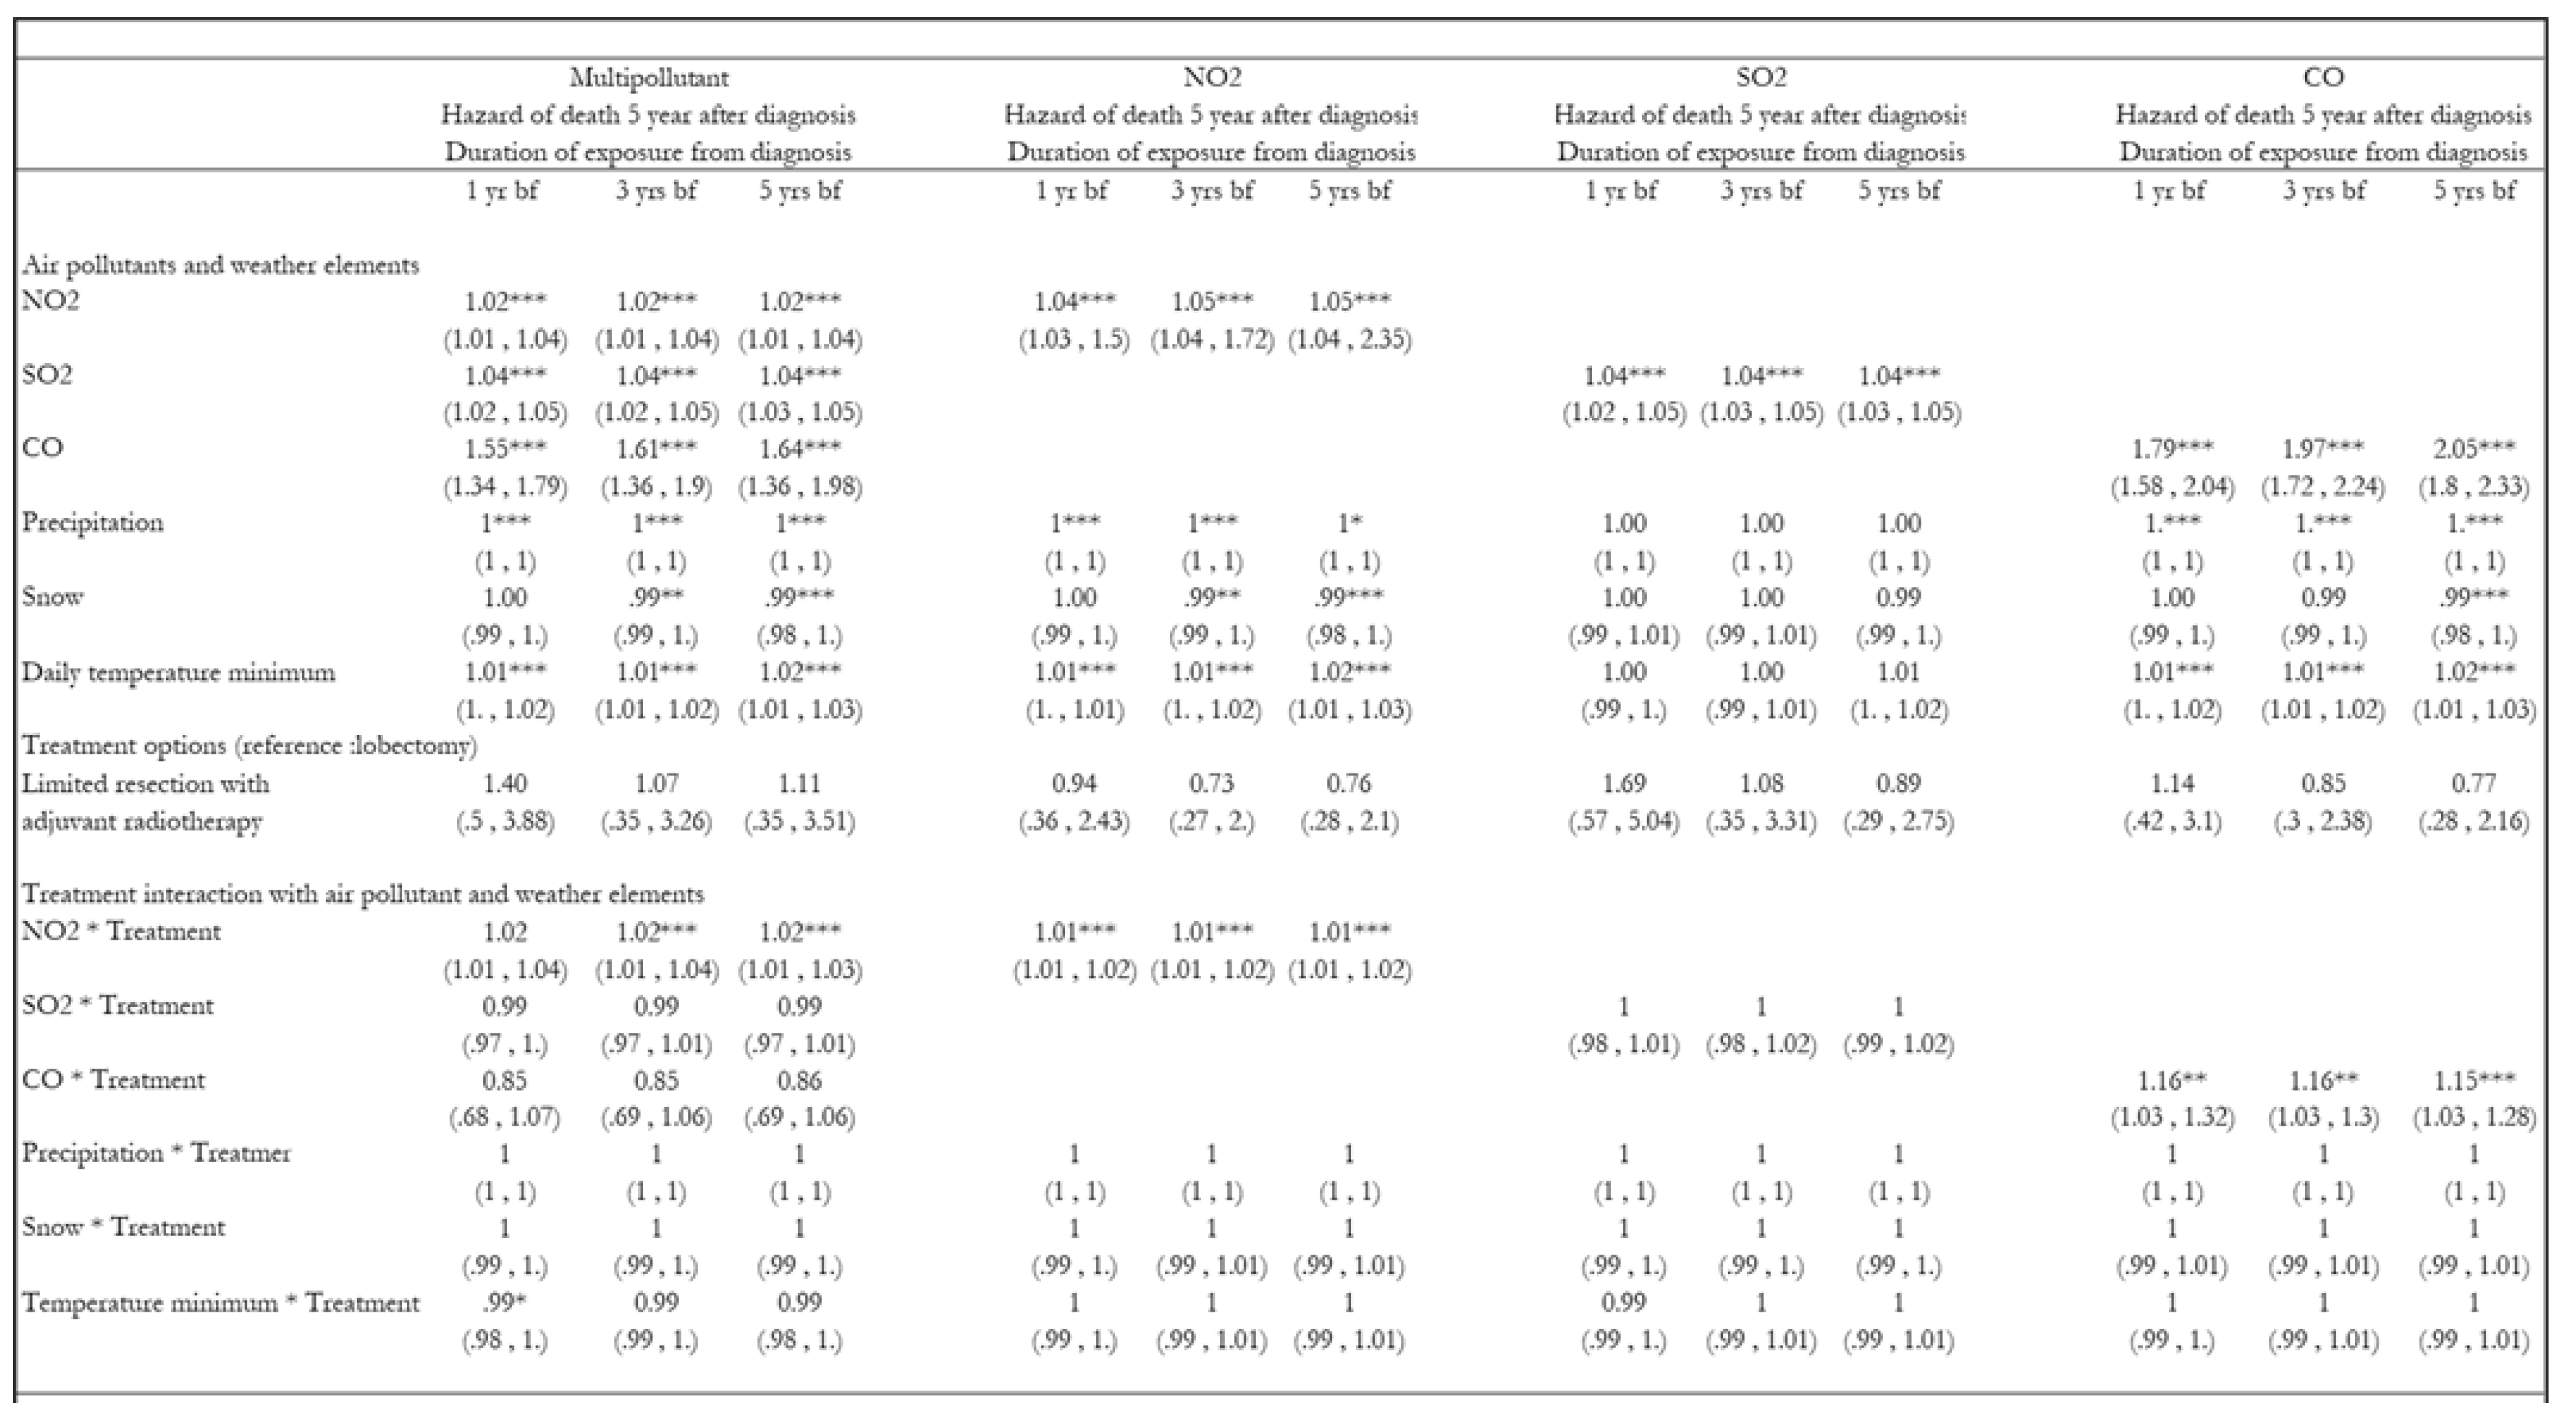
Background: Ambient air pollution is a modifiable determinant of lung cancer survival, affecting early-stage Non-Small Cell Lung Cancer (NSCLC) incidence and mortality. Methods: This retrospective cohort study examined the association of all-cause mortality and exposure to air pollution among stage 1A NSCLC-treated patients from the U.S. National Cancer Registry from 1988 to 2015. The Cox hazard model and Kaplan-Meier survival plots were provided. Air pollutants were included separately and together in the models, accounting for spatiotemporal weather variability affecting air pollution exposure levels pre and post-diagnosed lung cancer. Results: NO2 (above median sample mean=25.66 ppb, 12.97 ppb below median), SO2 (above median sample mean=3.98 ppb, 1.81 ppb below median), and CO (above median sample mean=1010.84 ppb, 447.91 ppb below median) air pollutant levels and weather conditions were calculated for county-day units. The median survival months for those exposed to above median NO2 is 27 months (SD=17.61 months) and 30 months (SD=15.93 months) for those exposed to below median. Multipollutant analyses indicated that an average monthly NO2 increase of 1 part per billion (ppb) in the county of NSCLC diagnosis was associated with 4%, 6%, and 9%; SO2 were 16%, 17%, and 17%; 53%, 51%, and 42% for CO increase in the all-cause mortality hazard rate one, three, and five years after diagnosis, respectively. Conclusion: It is vital to implement environmental policies that control emissions to reduce preventable deaths in stage 1A NSCLC patients with adenocarcinoma or squamous cell carcinoma histology types who reside in metropolitan areas.
Keywords:
Air Pollutants
; Weather
; NSCLC
; SEER
; Survival Analysis
1. Introduction
Several modifiable social determinants of health (SDOH) that improve lung cancer survival exist beyond smoking cessation (Strickland et al., 2015; Baxter et al., 2013; Eckel et al., 2016a). Ambient air pollution is a modifiable determinant of lung cancer survival(Aksoy, 1980; McKeon et al., 2022a; Pyo, Kim, and Kang 2022) and yet research exploring the dose- relationship association of ambient air pollution on lung cancer incidence and mortality in the United States (U.S.) is limited(McKeon et al. 2022b; C. S. Liu et al. 2023; Pyo, Kim, and Kang 2022; Eckel et al. 2016a). Air pollutants affect a specific type of lung cancer histology(Lamichhane et al. 2017; H. C. Lee et al. 2022; Moon et al. 2020; Pyo, Kim, and Kang 2022) therefore, it is essential to focus specifically on histology type and specific clinical stages of lung cancer to determine survival outcomes(McKeon et al. 2022a; Eckel et al. 2016a), but only few studies attempt to take that into account. Only one study to date has established a dose-response relationship between localized lung cancer survival and ambient air pollution exposure(Eckel et al. 2016a), but the study did not account for weather components that might affect exposure levels within the vicinity (Kim, Sheppard, and Kim 2009; Zanobetti & Peters 2015; Zheng et al. 2019; Tian et al. 2021).
Air pollutant levels differ geographically, affecting the level of exposure among patients in a longitudinal study. Changes in weather conditions also facilitate chemical reactions between primary pollutants (NO2, SO2, CO, and PM) and other atmospheric chemicals, resulting in secondary pollutant production. The weather components, such as temperature maximum, are also correlated with air pollutants as the rise in air pollutants aids in the urban heat island phenomenon(Wang, Guo, and Han 2021) . Hence, accounting for secondary pollutants such as ozone and weather components such as temperature maximum might provide biased estimation results in a given study context. Therefore, it is vital to understand the complex interaction of air pollutants in the presence of weather components, such as precipitation, snow, and temperature, which affect specific exposure levels and determine the survival outcomes of stage 1A TN0M0 NSCLC (Ngarambe et al., 2021).
Some studies in the literature that identify the dose-response relationship between ambient air pollution and lung cancer survival utilize interpolation or other data techniques to replace missing pollutant levels (Eckel et al., 2016a; McKeon et al., 2022a). The drawback of interpolating or extrapolating missing pollutant values without taking into account other environmental factors might inherently misclassify exposure assignments providing uncertain estimates due to the absence of relevant information such as natural events and weather components such as snow, precipitation, temperature interaction with other spatially and temporally dependant pollutants (Y. Liu, Zhou, and Lu 2020; Oji and Adamu 2020; De Sario, Katsouyanni, and Michelozzi 2013; Zanobetti and Peters 2015; Zheng et al. 2019; Tian et al. 2021; Kim, Sheppard, and Kim 2009). Moreover, a lack of sufficient variance in values exists when utilizing other methods compared to the methods of the nearest monitoring stations to assign exposure values and determine health outcomes (Kim, Sheppard, and Kim 2009).
Several factors affect standard treatment care receipt, an important confounder in determining survival outcomes for stage 1A NSCLC(Cao et al. 2018; Raman et al. 2022; Baig et al. 2020; Shen et al. 2021). The National Comprehensive Cancer Network (NCCN) treatment guidelines are referred by about 95% of U.S. oncologists to recommend standard treatment care. Changes in these guidelines, resulting from revisions over the past several decades, may affect who receives standard care for early-stage lung cancer. Differences in standard treatment receipt exist for early-stage lung cancer by treatment guideline revision year, race, geography, and insurance status, as established in an extended prior study (Patel et al., 2024). The trends in the type of treatment receipt and air pollution levels that are spatially and temporally dependent in the presence of weather elements for a more extended study period across diverse US state counties help identify close to the true causal relationships in similar survival studies (Eckel et al. 2016b; C. Liu et al. 2023). Hence, it is also crucial to identify whether ambient air pollution has a dose-response effect on lung cancer survival outcomes depending on the type of treatment received that includes the timespan of several US national treatment guideline revision years, pre-diagnosis exposure values to account for the cumulative effect, and state counties with differential time invariable confounders accounted in statistical analysis. To our knowledge, only limited studies have aimed to identify it for the U.S. representative population(McKeon et al. 2022b; Xu et al. 2013a; Eckel et al. 2016a) however, the studies did not account for the dose-response relationship in the presence of weather components in a homogenous sample of stage 1A NSCLC TN0M0. It also did not account for other primary air pollutants, such as SO2 and CO. Finally, the studies assigned exposure values from the month of diagnosis to death rather than considering pre-diagnosis exposures. This could lead to an absence of accounting for the carry-over effect on health outcomes from before diagnosis exposure.
Therefore, we aimed to evaluate whether exposure to specific levels of air pollutants is associated with survival outcomes among patients with stage 1A TN0M0 non-small cell lung cancer (NSCLC) undergoing treatment of choice, utilizing U.S. population-based cancer data and U.S. environmental air pollution data. Does accounting for any key confounders missing in previous similar studies reduce selection bias and provide close-to-true hazard ratios? How does treatment choice affect survival outcomes in the presence of exposure to the identified air pollutants? We hypothesize that there exists a difference in all-cause mortality hazards among treated individuals exposed to high versus low air pollution levels (Eckel et al., 2016a).
2. Methods
2.1. Study Design
This retrospective cohort study compared the survival outcomes between patients exposed to higher versus lower air pollution and those receiving different treatment types (i.e., limited resection with adjuvant radiotherapy and lobectomy) in single- and multi-pollutant models similar to pre-existing limited studies (Eckel et al. 2016b; Xu et al. 2013a). The pollutant model included NO2, SO2, and CO, adjusted for precipitation, snow, and daily minimum temperature values in both the single-pollutant and multi-pollutant models. The multi-pollutant model included NO2, SO2, and CO, along with weather components, whereas single-pollutant models consisted of one primary pollutant and weather components. The pollutant models were analyzed separately for three-time intervals (one, three, and five years) pre-diagnosis exposure model, for one year, three years, and five years of survival outcomes (post-diagnosis exposure) to determine the robustness of the estimates(C. S. Liu et al. 2023; McKeon et al. 2022b).
2.2. Data Sources and Construction of Analysis Data File
The SEER 18 Research Plus, Environment data, and AHRF were used from 1988 to 2015. The SEER 18 Research Plus data access request was approved on April 18, 2022, with reference number SAR0028589, to access the data through the SEER*Stat account. The AHRF collects data from over 50 national sources, aggregated at the county level, and is compiled by the Health Resources Services Administration’s (HRSA) Bureau of Health Professions for each of the nation's counties, using publicly available data (“Area Health Resources Files” n.d.).The Surveillance Research Program (SRP) of the National Cancer Institute (NCI) Division of Cancer Control and Population Sciences (DCCPS) supports SEER. SEER collects and publishes cancer incidence and survival data for every cancer case reported from 22 U.S. geographic areas, covering approximately 48 percent of the U.S. population, through population-based cancer registries. Registries routinely collect data on patient demographics, primary tumor site, tumor morphology, and stage at diagnosis, as well as the first course of treatment and follow-up for vital status (survival) (“Overview of the SEER Program” n.d.).
Agency-pregenerated daily summary air pollutant data files from 1988 to 2015 were downloaded from the following website: aqs.epa.gov/aqsweb/airdata/download_files.html. The air pollution gases raw data downloaded included ground-level Ozone (O3), Sulfur Dioxide (SO2), Carbon Monoxide (CO), and Nitrogen Dioxide (NO2). For particulate pollutants, the raw data downloaded were Particulate Matter (PM2.5 and PM10). We initially investigated the toxic precursor benzene among Hazardous Air Pollutants (HAPs) and Volatile Organic Compounds (VOCs); however, the high rate of missing values made it unfeasible to include them in the final data analysis file. The raw data files for weather were retrieved by using the following link in the computer to access the open ftp files: ftp://ftp.ncdc.noaa.gov/pub/data/ghcn/daily/by_year/. Zip files from 1988 to 2015 were downloaded by year and unzipped to retrieve the raw files.
The construction of the data file for the final analysis is shown in Figure 1, and the sample selection process is presented in Figure 2. AHRF files were converted from software-independent archival files to software-dependent files and subsequently cleaned before being merged with SEER data, using the year and county Federal Information Processing Standard (FIPS) code as the merging criterion. Similarly, after cleaning weather and air pollution data files for the study period, they were assigned to SEER registry patients by the nearest monitoring station method, as explained in the exposure assignment section of this paper.
2.3. Statistical Analysis and Empirical Model
Descriptive statistics, Kaplan–Meier survival graphs, and the Cox regression model (Eckel et al. 2016b; Xu et al. 2013a; McKeon et al. 2022b; C. S. Liu et al. 2023)were used to determine the sample demographics and time to all-cause mortality, with right censoring due to death or study end. The model examined the association between treatment type, air pollutants, weather, and survival, as well as the interactions between treatment types and air pollutants and between weather and treatment types while adjusting for patient demographics, clinical characteristics, and time-invariant unobserved variables, including the year of diagnosis and county FIPS. The duration dependence of hazards due to unobserved heterogeneity was accounted for in the model by including the year of diagnosis and county-specific, time-invariant, unobservable factors. Single-pollutant models and multi-pollutant models were computed, adjusting for the same covariates and dummy variables to determine whether the estimates were biased due to the independent variables omitted in the unadjusted model. The final model was examined for diagnostic criteria and model fit, including testing for multicollinearity between the exposure variables. After the preliminary analysis and diagnostics, the final regression models included NO2, SO2, CO, precipitation, daily minimum temperature, and snow accumulation variables.
Kaplan-Meier survival curves and dose-response relationships between adjusted NO2, SO2, and CO hazards were plotted by pollutant quartile groups (McKeon et al., 2022b) to determine survival probabilities and dose-response relationships. Survivor functions by pollutant groups were plotted for the nearest air pollution monitors up to 30 miles, the weather station at 20 miles with 25% monthly missing values, and up to 40 miles air pollution, 20 miles weather stations, and 50% missing monthly values(McKeon et al. 2022b; Eckel et al. 2016b). STATA 16 and Microsoft Excel were used for the data analysis.
The following empirical model analyzes survival outcomes for patients treated with fixed-effect dummy variables:
H(t)=h0(t).exp{β1.Treatment Typei + β2.Patient Demographicsi + β3.Clinical Characteristicsi + β4.Countyi + β6.Air Pollutantsi + β7.Weather Componentsi + β8.Air Pollutantsi × Treatment Typei + β9.Weather Componentsi × Treatment Typei + β10.Year of Diagnosisi}
where h0(t) is the baseline hazards, and exp(βs) is the hazard ratio or rate ratio. The variables Countyi and Year of Diagnosisi are county- and year-of-diagnosis time-invariant, unobservable factors. In the model, i indicates an individual patient. “Treatment Type” is a binary variable that takes the value “lobectomy” if the patient underwent a lobectomy and “limited resection with adjuvant radiotherapy” if the patient underwent a limited resection with adjuvant radiotherapy. Other treatment types were excluded because there were fewer observations within the radiotherapy and limited resection categories.
2.4. Sensitivity Analyses
The robustness of the effect was tested by estimating hazards using the average monthly median and maximum exposure values for one, three, and five years before and after diagnosis obtained from the corresponding daily exposure values. The confounding effect due to omitted exposure variables was assessed by running both single-pollutant and multi-pollutant models.
2.5. Ethical considerations
The University of Louisville ethics committee approved this study (IRB number 22.0281). The study is exempt under 45 CFR 46.101(b) in Category 4: Secondary research, for which consent is not required.
2.6. Sampling Strategy, Exposure Assignment, and Study Variables
2.6.1. Population and sample
The SEER 18 research plus cancer registry patients inclusion and exclusion criteria are explained in a prior published work(Patel et al. 2024), while the final included study sample is described in Figure 2 of the current paper. The final sample included patients with monthly exposure averages calculated from daily air pollution values and weather data, as well as the percentage of missing values for non-missing variables in the regression analysis, in addition to AHRF and SEER 18 files. The inclusion and exclusion criteria for weather and air pollution exposure values are described in the exposure assignment section of this paper. After preliminary analysis, patients with exposure up to five years before diagnosis were included in the final analysis and followed until death or the study cutoff from the date of diagnosis to five years after diagnosis. The reason for including these patients was to mitigate the compositional effect and misspecification error resulting from migration during the more extended study periods. Including patients post-five years after diagnosis and prior to five years before diagnosis, the exposure period is too long, a time frame that is more prone to migration chances. According to the U.S. Census Bureau's mobility data from 2017 to 2021, approximately 4% and 2% of people in the age groups 25-64 and 65, respectively, migrate to a different county. The information on the excluded sample of the study is provided in Appendix A Table A1a,b.
2.6.2. Exposure Assignment
Air pollution and weather exposure assignments for each patient are shown in Figure 3. We utilized the nearest monitor station method to assign pollutant concentration exposure values by closest monitor to each study participant’s location from the county centroid and included values of the three nearest neighboring monitors in the event one of the nearest monitors had a missing value for a given day in which case the data from second and third nearest monitor were utilized to assign exposure values (Rivera-González et al. 2015; McKeon et al. 2022b; Eckel et al. 2016b). Each patient in the final sample was assigned exposure from death or study cut-off (ten years after diagnosis) at one, three, five, and ten years before diagnosis. Exposure assignments were excluded when the nearest air pollution monitoring station was more than 40 miles away, the weather station was more than 20 miles away, and the percentage of missing monthly values exceeded 50%. Preliminary sample analysis of exposure assignments for air pollution ≤ 30 miles, weather ≤ 10 miles, and < 33.33% missing values determined a minimal sample size; therefore, the final analysis sample was least restrictive in terms of the distance of air pollution exposure assignments with the nearest monitoring station < 40 miles, weather station ≤ 20 miles, and missing monthly values ≤ 50%. We initially generated monthly values from daily values by keeping only those observations that were 10, 20, 30, and 40 miles away from the nearest monitoring station, with 50%, 33.33%, 25%, and 20% missing values for each mile within a month and calculated monthly mean, median, maximum, and interquartile range exposure (Figure 4) values for the same for up to 10 years before and 10 years after diagnosis month or until death. However, for our final analysis, we included exposure values, as mentioned previously in this paper.
Exposure assignment errors can be categorized as measurement and misspecification errors. A recent study relevant to the current study determined that long-term exposure assignment measurement errors are inevitable in epidemiological studies and are random. Although randomly present, the classical and Berkson measurement errors obtain biased results towards the null. If the studies find a statistically significant association, the estimates are smaller than the true effect size and are less likely to be undermined (Wei et al., 2022). One measure we have taken to control for larger misspecification errors is to restrict the study period to ten years, encompassing five years before and five years after diagnosis.
2.6.3. Independent Variables
Each weather and air pollution component continuous variable included the yearly average of monthly averages before diagnosis exposure of each patient, up to the time of death or study cut-off (whichever occurred first). The categorical treatment type variable included two categories: lobectomy and limited resection with adjuvant radiotherapy. Due to the limited number of radiotherapy observations and the few resection cases, including those two categories, it was not feasible to include them in the analysis. Surgery codes for wedge resection and segmentectomy were not differentiated in the data prior to 1998 (Razi et al., 2016). Hence, we adopted a conservative approach and combined the two types of surgery codes into one category, “Limited Resection,” as informed by the NCCN treatment guidelines and similar studies(Kates, Swanson, and Wisnivesky 2011; Mery et al. 2005). The radiation sequence with a variable of surgery from the data was utilized to aid in creating the treatment category of limited resection with adjuvant radiotherapy.
2.6.4. Outcome Variable
Survival time was calculated as the number of months of survival from the first diagnosis to death from any cause (all-cause mortality).
2.6.5 . Covariates
Tumor size categories were constructed as described by the American Lung Cancer Society (ALCS). Due to the limited number of observations in the category “up to 3 cm” and the absence of specific values, the category was merged with the “unknown tumor size' category (American Cancer Society, n.d.). SEER 18 Research Plus cancer registry data lacks information on tumor size before 2004, so the patients before the 2004 diagnosis had missing tumor size values. A more conservative approach was adopted in the current study, and observations with missing information were categorized into the unknown tumor size category. Likewise, for the insurance status information, no data were available before 2007, so an unknown category was constructed for insurance status information prior to 2007. Dummy variables for the county FIPS and year of diagnosis were constructed to account for time-invariant unobservable variables. The non-metropolitan rural-urban continuum category comprised small metropolitan, micropolitan, and non-core, as these three categories had very few observations, and there was not much demographic difference. Hence, the rural-urban continuum categorical variable comprises four categories: large central metro, large fringe metro, medium metro, and non-metropolitan.
3. Results
Overall, individuals exposed to above-median levels of air pollutants had a lower survival probability than those exposed to below-median levels, as reflected in the Kaplan-Meier survival estimates (Figure 5, Figure 6 and Figure 7). The single-pollutant model graphs did not appear to exhibit striking differences from their multi-pollutant counterparts, indicating the robustness of the results. Similarly, the 30 miles of air pollution nearest station values reflected similar directions of survival probability both in Kaplan-Meier survival estimates and statistical analysis.
Table 1. a Frequency statistics of study sample by above and below pollutant exposure median. b Descriptive statistics of study sample above and below pollutant exposure median
3.1. Hazards of Death Five Years After Diagnosis
The one- and three-year hazard estimates of death after diagnosis are robust, as indicated in Appendix A Tables 4 and 5. The all-cause mortality hazard of death for those exposed to NO2 increased by 4%, 6%, and 9%, with an average monthly increase of 1 ppb for one, three, and five years before diagnosis exposure, respectively (Table 2a). Those exposed to SO2 had an increase in all-cause mortality hazards by 16% and 17%, with an average increase in monthly averages of 1 ppb for one, three, and five years before diagnosis exposure. Those exposed to CO had an increase in all-cause mortality hazards of 53%, 51%, and 42%, with an average increase in monthly averages of 1 ppb for one, three, and five years before diagnosis exposure, respectively. Death hazards for those exposed to precipitation decreased by 2% and 3%, with an average monthly increase of one-tenth of a millimeter for one, three, and five years before diagnosis, respectively. Similarly, the hazards of death for those exposed to snowfall decreased by 10%, with an average monthly increase of one mm for five years before diagnosis exposure. The hazard effect modestly changed the effect size for single-pollutant models; however, the estimates remained significant.
The sensitivity analysis determined a similar effect direction, size, and statistical significance, except for one year after diagnosis. The hazards for the average maximum exposure values for NO2 and daily minimum temperature were no longer significant (Appendix A Table A2 and Table A3).
4. Discussion
The present study found that patients exposed to higher concentrations of NO2, SO2, and CO ambient air pollution before diagnosis had decreased survival after diagnosis. The results from prior similar studies are consistent (Eckel et al. 2016b; Xu et al. 2013b; McKeon et al. 2022c; C. Liu et al. 2023) with the existing study results regarding estimate direction for air pollutant NO2 in presence of weather elements and other prior excluded primary air pollutants i.e. SO2 and CO, eventhough we did not utilize intrapolation or extrapolation techniques supporting classical and berkson exposure error theories explained in exposure assignment section of this paper. It has also been determined that snowfall and precipitation decrease death events after diagnosis, which aligns with the logic that ambient air pollution concentration is lower during precipitation(De Sario, Katsouyanni, and Michelozzi 2013; Oji and Adamu 2020; Y. Liu, Zhou, and Lu 2020; Zanobetti and Peters 2015; Zheng et al. 2019; Tian et al. 2021). Although our study is the first of its kind and no relevant studies exist, other studies examining different health outcomes in the presence of air pollution exposure and survival outcomes in the absence of weather components are present. These findings align with the existing literature(Altorki et al. 2019; Rueth et al. 2012) and claim that lobectomy has increased surgery-associated morbidity post-lobectomy, if exposed to higher levels of air pollutant (C. Liu et al. 2023). Higher ambient air pollutants also affect lung function, as per a recent study which translates into increased death hazards (K. K. Lee et al. 2020).
The present study has several strengths as it utilizes key primary air pollutants such as SO2, CO, and weather components such as precipitation, snowfall, and daily minimum temperature to account for the confounding effects. Ozone and daily temperature maximum pose multicollinearity problems due to their inherent correlation with primary pollutants(Ngarambe et al. 2021) so they were excluded from the analysis. This exclusion aligns with Eckel et al. 2016 study(Eckel et al. 2016a), findings that ozone had a non-significant effect on survival outcomes, possibly because of multicollinearity. In addition, the study evaluated the effects of air pollutants and weather components before and after diagnosis exposure assignments to determine their cumulative effects.
Some of the limitations is the insufficient sample size for radiotherapy and limited resection. Therefore, determining the actual hazard rate using these treatment categories is difficult. In addition, the AHRF had significant missing values for area-level information relevant to the study, which could not be controlled for in the analysis. However, the county level and year of diagnosis dummy variables address these limitations for time-invariant unobserved variables. While differential yearl analysis i.e. one, three, and five years before and after diagnosis might help estimate if there are significant time varying confounders affecting overall estimates. Some of the missing contextual variables that could help reduce estimation bias were comorbidity score, cardiopulmonary function, lung function, hospital region, patient’s overall functional status, occupation, and surgeon expertise. Patient functional status and cardiopulmonary function are variables that seem to be negatively correlated with air pollution and weather exposure. However, they appear to be positively correlated with survival outcomes. In the absence of these variables, the derived biased estimates are underestimated. Hence, it was vital to account for key confounders in the present study. For the same reason, our study only measured associational relationships because we did not account for these identified unobserved confounders in the analysis, nor was the study designed to be a randomized control trial or natural experiment.
Moreover, the results of the current study are only generalizable to the population representative of the sample. As most monitors are present in metropolitan areas, potentially due to higher pollution levels, the results from the present study cannot be generalized to population outcomes in rural areas.
5. Implications for Practice and Policy
The survival of treated patients with stage 1A NSCLC is negatively associated with increased concentrations of ambient air pollutants such as NO2, SO2, CO, and daily minimum temperature. Hence, it is vital to implement environmental policies that control the emission or source of emission to reduce preventable deaths in stage 1A NSCLC patients with adenocarcinoma or squamous cell carcinoma histology types and other cardiopulmonary patients residing in metropolitan areas. It will not only help improve early stage lung cancer survival rates but also help reduce healthcare cost burdens due to increased air pollution exposure levels and associated reduced lung function or other complications.
Author Contributions
Conceptualization, N.P.; methodology, N.P. and S.K; software, N.P and S.K.; validation, N.P, S.K, B.L, and M.E.; formal analysis, N.P.; investigation, N.P.; resources, N.P, S.K, M.E..; data curation, N.P and S.K.; writing—original draft preparation, N.P.; writing—review and editing, N.P, S.K, B.L, D.A, and M.E; visualization, N.P and S.K.; supervision, S.K.; project administration, N.P. All authors have read and agreed to the published version of the manuscript.
Funding
This research received no external funding
Institutional Review Board Statement
The study was conducted in accordance with the Declaration of Helsinki, and approved by the Institutional Review Board (or Ethics Committee) of University of Louisville (IRB number 22.0281 on 08/01/2022). The University of Louisville ethics committee approved this study (IRB number 22.0281). The study is exempt according to 45 CFR 46.101(b) under Category 4: Secondary research, for which consent is not required.
Informed Consent Statement
Patient consent was waived as the study is exempt according to 45 CFR 46.101(b) under Category 4: Secondary research, for which consent is not required.
Data Availability Statement
The data that support the findings of this study are available from the authors but restrictions apply to the availability of these data, which were used under license from the NIH National Cancer Institute Surveillance, Epidemiology, and End Results (SEER) plus cancer registry, U.S. Environmental Protection Agency, The Global Historical Climatology Network daily (GHCNd), and Area Health Resource Files for the current study, and so are publicly available upon approved request. Data are, however, available from the authors upon reasonable request and with permission from the NIH NCI SEER plus cancer registry.
Acknowledgments
We would like to thank IT manager John Bartley of University of Louisville in helping us setup the remote supercomputer connection where about 2.5TB of data work could be stored/analyzed in order for us to conduct the current study effortlessly. We would also like to thank Hamid Zarie a PhD candidate of University of Louisville, School of Public Health who provided support with Python codes to retrieve 1988-2016 yearly software independent AHRF files for current study.
Conflicts of Interest
The authors declare no conflicts of interest.
Appendix A

Table A1.
a Excluded sample frequency statistics. b Excluded sample descriptive statistics.
 |
p values: * <0.1%, ** < 0.05%, *** < 0.01.
Table A2.
Hazards of death five years after diagnosis for annual average of monthly median values.
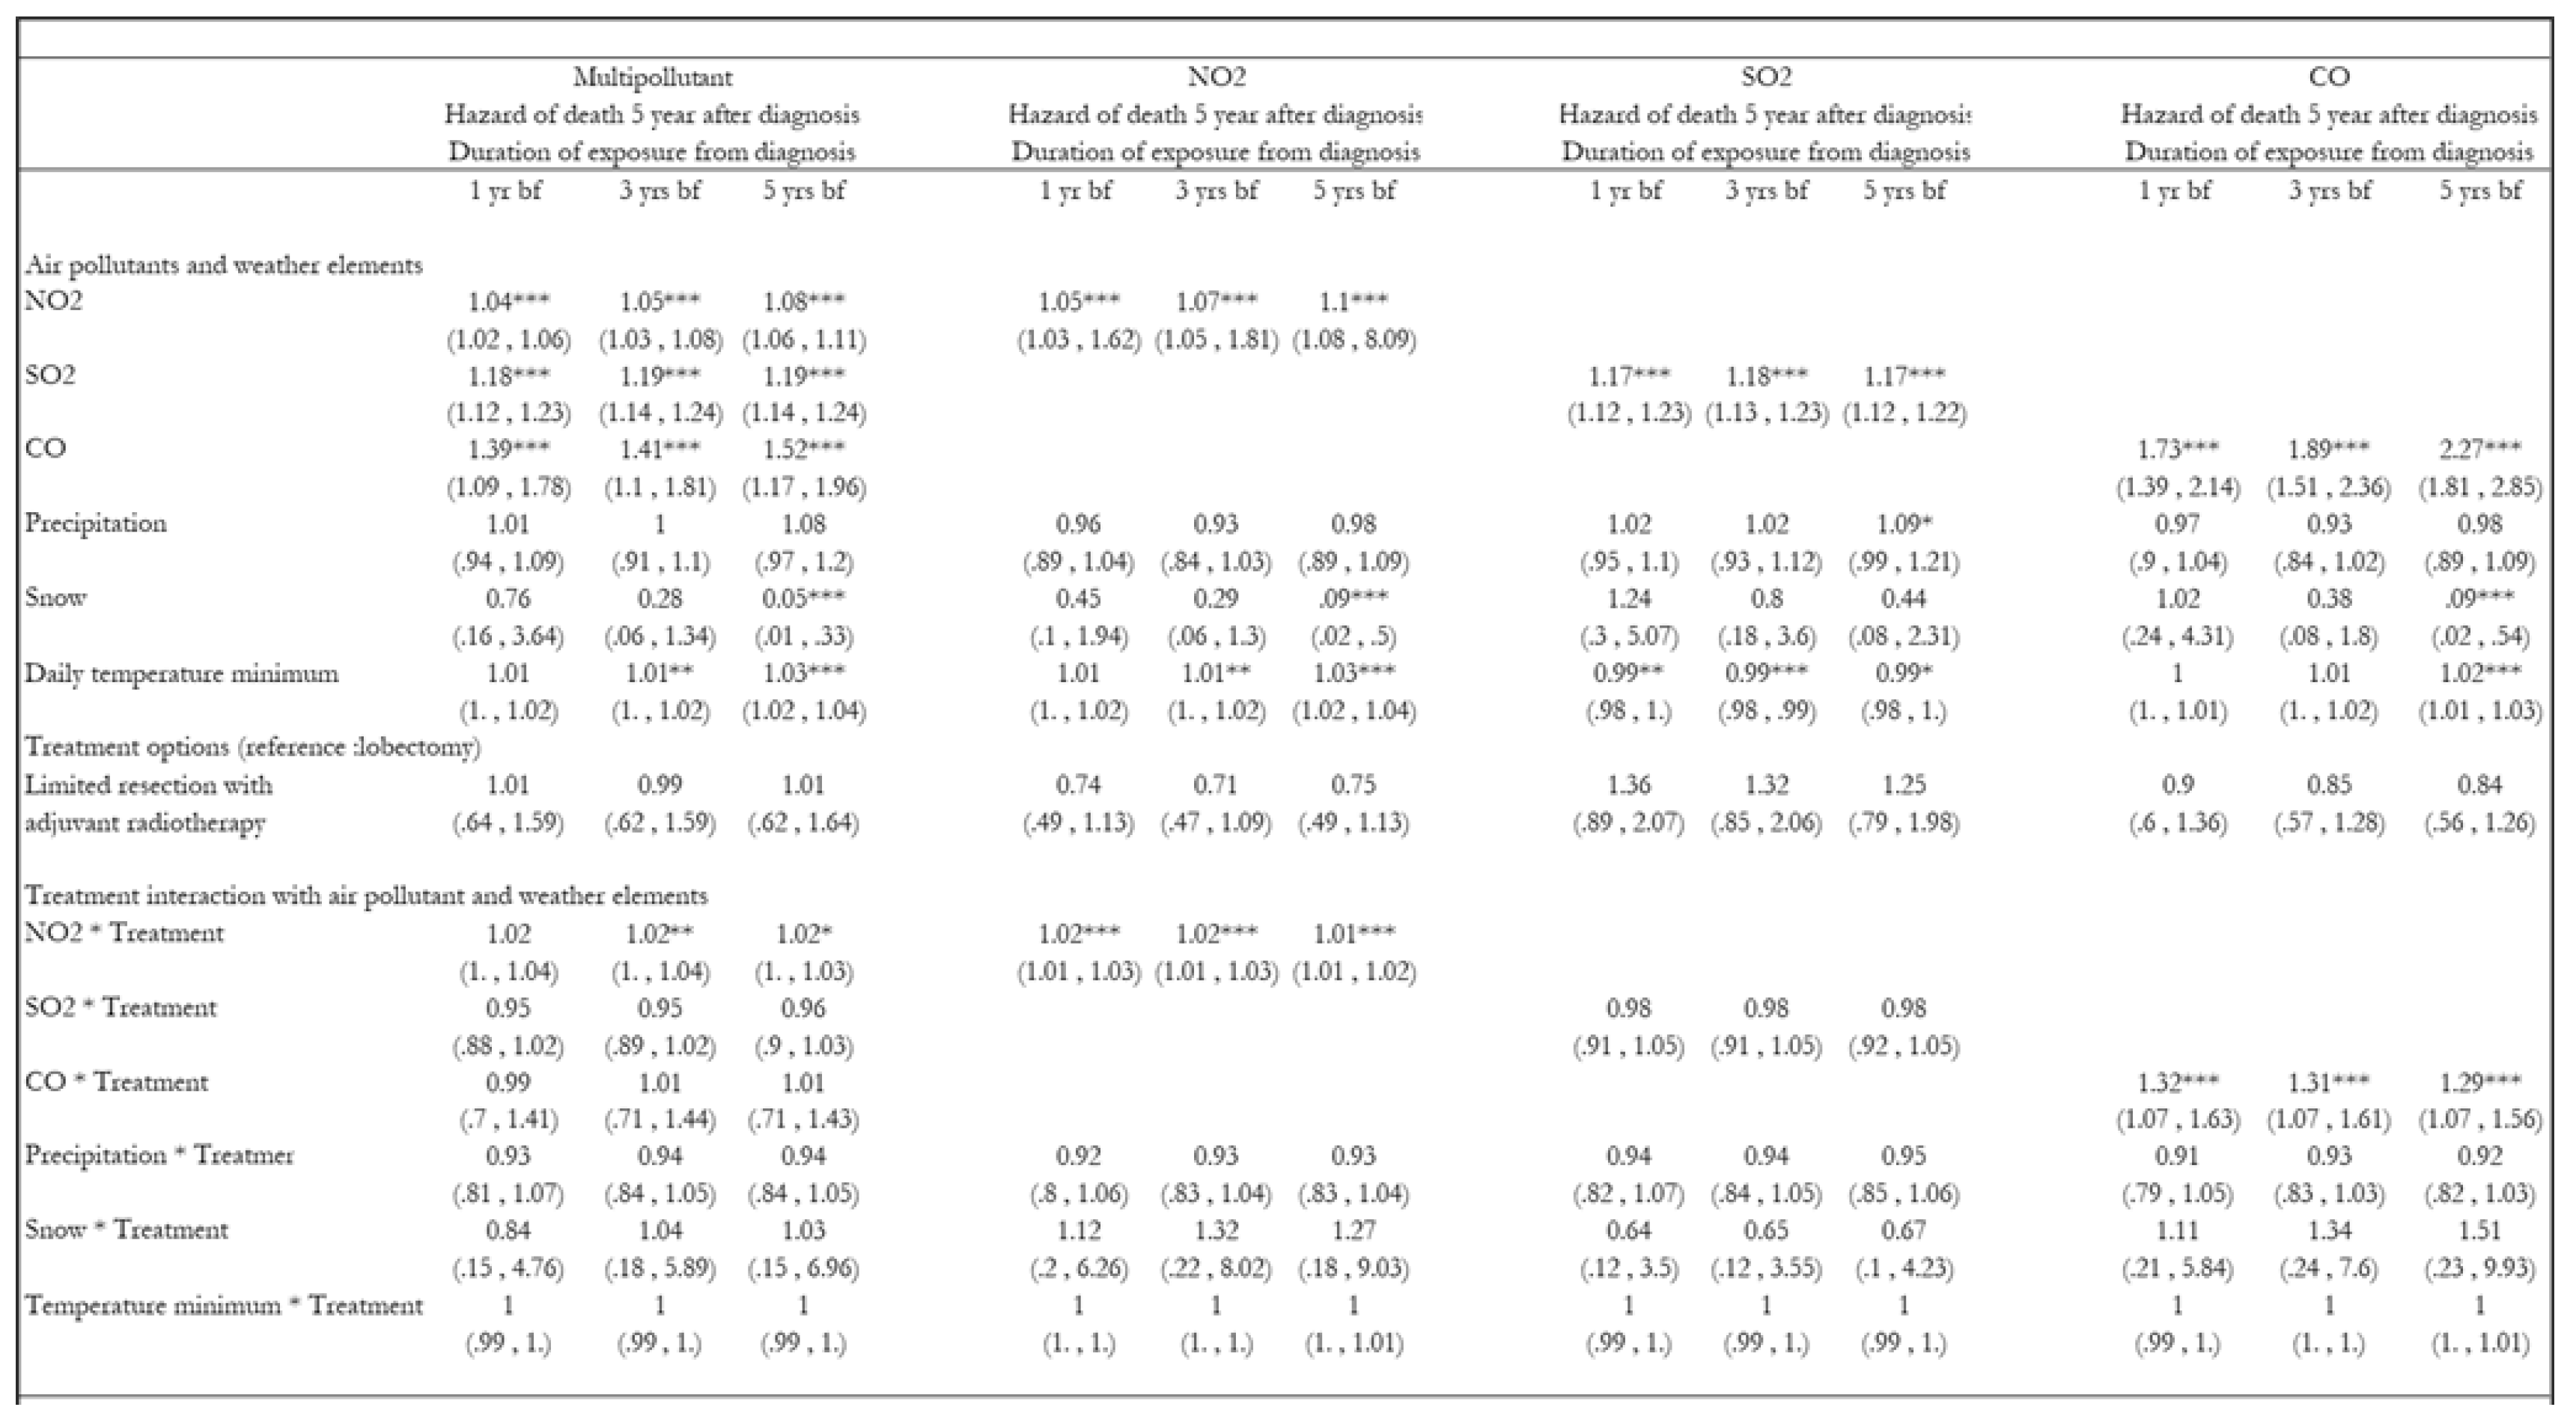 |
Table A3.
Hazards of death five years after diagnosis for annual average of monthly maximum values.
 |
References
- Aksoy, M. 1980. “Different Types of Malignancies Due to Occupational Exposure to Benzene: A Review of Recent Observations in Turkey.” Environmental Research 23 1: 181–90. [CrossRef]
- Altorki, Nasser K, Xiaofei Wang, Dennis Wigle, Lin Gu, Gail Darling, Ahmad S Ashrafi, Rodney Landrenau, et al. 2019. “Perioperative Mortality and Morbidity after Lobar versus Sublobar Resection for Early Stage Lung Cancer: A Post-Hoc Analysis of an International Randomized Phase III Trial (CALGB/ Alliance 140503)” 6 (12): 915–24. [CrossRef]
- American Cancer Society. n.d. “Non-Small Cell Lung Cancer Staging | Stages of Lung Cancer.” American Cancer Society. Accessed April 28, 2023. https://www.cancer.org/cancer/lung-cancer/detection-diagnosis-staging/staging-nsclc.html.
- “Area Health Resources Files.” n.d. Accessed July 13, 2024. https://data.hrsa.gov/topics/health-workforce/ahrf.
- Baig, Mirza Zain, Syed S. Razi, Joanna F. Weber, Cliff P. Connery, and Faiz Y. Bhora. 2020. “Lobectomy Is Superior to Segmentectomy for Peripheral High Grade Non-Small Cell Lung Cancer ≤2 Cm.” Journal of Thoracic Disease 12 (10): 5925–33. [CrossRef]
- Baxter, Lisa K, Kathie L Dionisio, Janet Burke, Stefanie Ebelt Sarnat, Jeremy A Sarnat, Natasha Hodas, David Q Rich, et al. 2013. “Exposure Prediction Approaches Used in Air Pollution Epidemiology Studies: Key Findings and Future Recommendations.” Journal of Exposure Science & Environmental Epidemiology 23 (6): 654–59. [CrossRef]
- Cao, Jinlin, Ping Yuan, Yiqing Wang, Jinming Xu, Xiaoshuai Yuan, Zhitian Wang, Wang Lv, and Jian Hu. 2018. “Survival Rates After Lobectomy, Segmentectomy, and Wedge Resection for Non-Small Cell Lung Cancer.” Annals of Thoracic Surgery 105 (5): 1483–91. [CrossRef]
- Eckel, Sandrah P., Myles Cockburn, Yu Hsiang Shu, Huiyu Deng, Frederick W. Lurmann, Lihua Liu, and Frank D. Gilliland. 2016a. “Air Pollution Affects Lung Cancer Survival.” Thorax 71 (10): 891–98. [CrossRef]
- Kates, Max, Scott Swanson, and Juan P Wisnivesky. 2011. “Survival Following Lobectomy and Limited Resection for the Treatment of Stage I Non-Small Cell Lung Cancer ≤ 1 Cm in Size: A Review of SEER Data.” CHEST 139 (3): 491–96. [CrossRef]
- Kim, Sun Young, Lianne Sheppard, and Ho Kim. 2009. “Health Effects of Long-Term Air Pollution: Influence of Exposure Prediction Methods.” Epidemiology 20 (3): 442–50. [CrossRef]
- Lamichhane, Dirga Kumar, Hwan-cheol Kim, Chang-min Choi, Myung-hee Shin, Young Mog Shim, Jong-han Leem, Jeong-seon Ryu, Hae-seong Nam, and Sung-min Park. 2017. “Lung Cancer Risk and Residential Exposure to Air Pollution : A Korean Population-Based Case-Control Study” 58 (6): 1111–18.
- Lee, Hung Chi, Yueh Hsun Lu, Yen Lin Huang, Shih Li Huang, and Hsiao Chi Chuang. 2022. “Air Pollution Effects to the Subtype and Severity of Lung Cancers.” Frontiers in Medicine 9 (March): 835026. [CrossRef]
- Lee, Kuan Ken, Rong Bing, Joanne Kiang, Sophia Bashir, Nicholas Spath, Dominik Stelzle, Kevin Mortimer, et al. 2020. “Articles Adverse Health Effects Associated with Household Air Pollution : A Systematic Review, Meta-Analysis, and Burden Estimation Study.” The Lancet Global Health 8 (11): e1427–34. [CrossRef]
- Liu, Changpeng, Dongjian Yang, Yuxi Liu, Heng Piao, Tao Zhang, Xi Li, Erjiang Zhao, Di Zhang, Yan Zheng, and Xiance Tang. 2023. “The Effect of Ambient PM2.5 Exposure on Survival of Lung Cancer Patients after Lobectomy.” Environmental Health: A Global Access Science Source 22 (1): 1–10.
- Liu, Cristina Su, Yaguang Wei, Mahdieh Danesh Yazdi, Xinye Qiu, Edgar Castro, Qiao Zhu, Longxiang Li, et al. 2023. “Long-Term Association of Air Pollution and Incidence of Lung Cancer among Older Americans: A National Study in the Medicare Cohort.” Environment International 181 (November): 108266. [CrossRef]
- Liu, Yansui, Yang Zhou, and Jiaxin Lu. 2020. “Exploring the Relationship between Air Pollution and Meteorological Conditions in China under Environmental Governance.” Scientific Reports 2020 10:1 10 (1): 1–11. [CrossRef]
- McKeon, Thomas P., Anil Vachani, Trevor M. Penning, and Wei Ting Hwang. 2022a. “Air Pollution and Lung Cancer Survival in Pennsylvania.” Lung Cancer 170 (June): 65–73. [CrossRef]
- Mery, Carlos M, Anastasia N Pappas, Raphael Bueno, Yolonda L Colson, Philip Linden, David J Sugarbaker, and Michael T Jaklitsch. 2005. “Similar Long-Term Survival of Elderly Patients with Non-Small Cell Lung Cancer Treated with Lobectomy or Wedge Resection within the Surveillance, Epidemiology, and End Results Database.” Chest 128 (1): 237–45. [CrossRef]
- Moon, Da Hye, Sung Ok Kwon, Sun Young Kim, and Woo Jin Kim. 2020. “Air Pollution and Incidence of Lung Cancer by Histological Type in Korean Adults: A Korean National Health Insurance Service Health Examinee Cohort Study.” International Journal of Environmental Research and Public Health 17 (3). [CrossRef]
- Ngarambe, Jack, Soo Jeong Joen, Choong Hee Han, and Geun Young Yun. 2021. “Exploring the Relationship between Particulate Matter, CO, SO2, NO2, O3 and Urban Heat Island in Seoul, Korea.” Journal of Hazardous Materials 403 (2): 123615. [CrossRef]
- Oji, Sunday, and Haruna Adamu. 2020. “Correlation between Air Pollutants Concentration and Meteorological Factors on Seasonal Air Quality Variation.” Journal of Air Pollution and Health 5 (1): 11–32. [CrossRef]
- “Overview of the SEER Program.” n.d. Accessed July 13, 2024. https://seer.cancer.gov/about/overview.html.
- Patel, Naiya, Seyed Karimi, Michael E. Egger, Bertis Little, and Demetra Antimisiaris. 2024. “Disparity in Treatment Receipt by Race and Treatment Guideline Revision Years for Stage 1A Non-Small Cell Lung Cancer Patients in the US.” Journal of Racial and Ethnic Health Disparities, June, 1–13.
- Pyo, Jung Soo, Nae Yu Kim, and Dong Wook Kang. 2022. “Impacts of Outdoor Particulate Matter Exposure on the Incidence of Lung Cancer and Mortality.” Medicina (Lithuania) 58 (9): 1–9.
- Raman, Vignesh, Oliver K. Jawitz, Marcelo Cerullo, Soraya L. Voigt, Kristen E. Rhodin, Chi-Fu Jeffrey Yang, Thomas A. D’Amico, David H. Harpole, Christopher R. Kelsey, and Betty C. Tong. 2022. “Tumor Size, Histology, and Survival After Stereotactic Ablative Radiotherapy and Sublobar Resection in Node-Negative Non-Small Cell Lung Cancer.” Annals of Surgery 276 (6): e1000–1007. [CrossRef]
- Razi, Syed S., Mohan M. John, Sandeep Sainathan, and Christos Stavropoulos. 2016. “Sublobar Resection Is Equivalent to Lobectomy for T1a Non–Small Cell Lung Cancer in the Elderly: A Surveillance, Epidemiology, and End Results Database Analysis.” Journal of Surgical Research 200 (2): 683–89. [CrossRef]
- Rivera-González, Luis O., Zhenzhen Zhang, Brisa N. Sánchez, Kai Zhang, Daniel G. Brown, Leonora Rojas-Bracho, Alvaro Osornio-Vargas, Felipe Vadillo-Ortega, and Marie S. O’Neill. 2015. “An Assessment of Air Pollutant Exposure Methods in Mexico City, Mexico.” Journal of the Air & Waste Management Association (1995) 65 (5): 581. [CrossRef]
- Rueth, Natasha M, Helen M Parsons, Elizabeth B Habermann, Shawn S Groth, Beth A Virnig, Todd M Tuttle, Rafael S Andrade, Michael A Maddaus, and Jonathan D’Cunha. 2012. “Surgical Treatment of Lung Cancer: Predicting Postoperative Morbidity in the Elderly Population.” The Journal of Thoracic and Cardiovascular Surgery 143 (6): 1314–23. [CrossRef]
- Sario, M. De, K. Katsouyanni, and P. Michelozzi. 2013. “Climate Change, Extreme Weather Events, Air Pollution and Respiratory Health in Europe.” European Respiratory Journal 42 (3): 826–43. [CrossRef]
- Shen, Jianfei, Weitao Zhuang, Congcong Xu, Ke Jin, Baofu Chen, Dan Tian, Crispin Hiley, Hiroshi Onishi, Chengchu Zhu, and Guibin Qiao. 2021. “Surgery or Non-Surgical Treatment of ≤8 Mm Non-Small Cell Lung Cancer: A Population-Based Study.” Frontiers in Surgery 8 (May). [CrossRef]
- Shi, Leiyu. 2008. Health Services Research Methods. Thomson/Delmar Learning.
- Strickland, Matthew J, Katherine M Gass, Gretchen T Goldman, and James A Mulholland. 2015. “Effects of Ambient Air Pollution Measurement Error on Health Effect Estimates in Time-Series Studies: A Simulation-Based Analysis.” Journal of Exposure Science & Environmental Epidemiology 25 (2): 160–66. [CrossRef]
- Tian, Xueying, Kangping Cui, Hwey Lin Sheu, Yen Kung Hsieh, and Fanxuan Yu. 2021. “Effects of Rain and Snow on the Air Quality Index, PM2.5 Levels, and Dry Deposition Flux of PCDD/Fs.” Aerosol and Air Quality Research 21 (8): 210158. [CrossRef]
- Wang, Linlin, Lihui Ge, Sibo You, Yongyu Liu, and Yi Ren. 2022. “Lobectomy versus Segmentectomy in Patients with Stage T (> 2 Cm and ≤ 3 Cm) N0M0 Non-Small Cell Lung Cancer: A Propensity Score Matching Study.” Journal of Cardiothoracic Surgery 17 (1): 110. [CrossRef]
- Wei, Yaguang, Xinye Qiu, Mahdieh Danesh Yazdi, Alexandra Shtein, Liuhua Shi, Jiabei Yang, Adjani A. Peralta, Brent A. Coull, and Joel D. Schwartz. 2022. “The Impact of Exposure Measurement Error on the Estimated Concentration-Response Relationship between Long-Term Exposure to PM2.5 and Mortality.” Environmental Health Perspectives 130 (7): 77006. [CrossRef]
- Xu, Xiaohui, Sandie Ha, Haidong Kan, Hui Hu, Barbara A. Curbow, and Claudia Tk Lissaker. 2013a. “Health Effects of Air Pollution on Length of Respiratory Cancer Survival.” BMC Public Health 13 (1): 1–9.
- Zanobetti, Antonella, and Annette Peters. 2015. “Disentangling Interactions between Atmospheric Pollution and Weather.” Journal of Epidemiology and Community Health 69 (7): 613. [CrossRef]
- Zheng, Zuofang, Guirong Xu, Qingchun Li, Conglan Chen, and Jiangbo Li. 2019. “Effect of Precipitation on Reducing Atmospheric Pollutant over Beijing.” Atmospheric Pollution Research 10 (5): 1443–53. [CrossRef]
Figure 1.
Data analysis file construction.
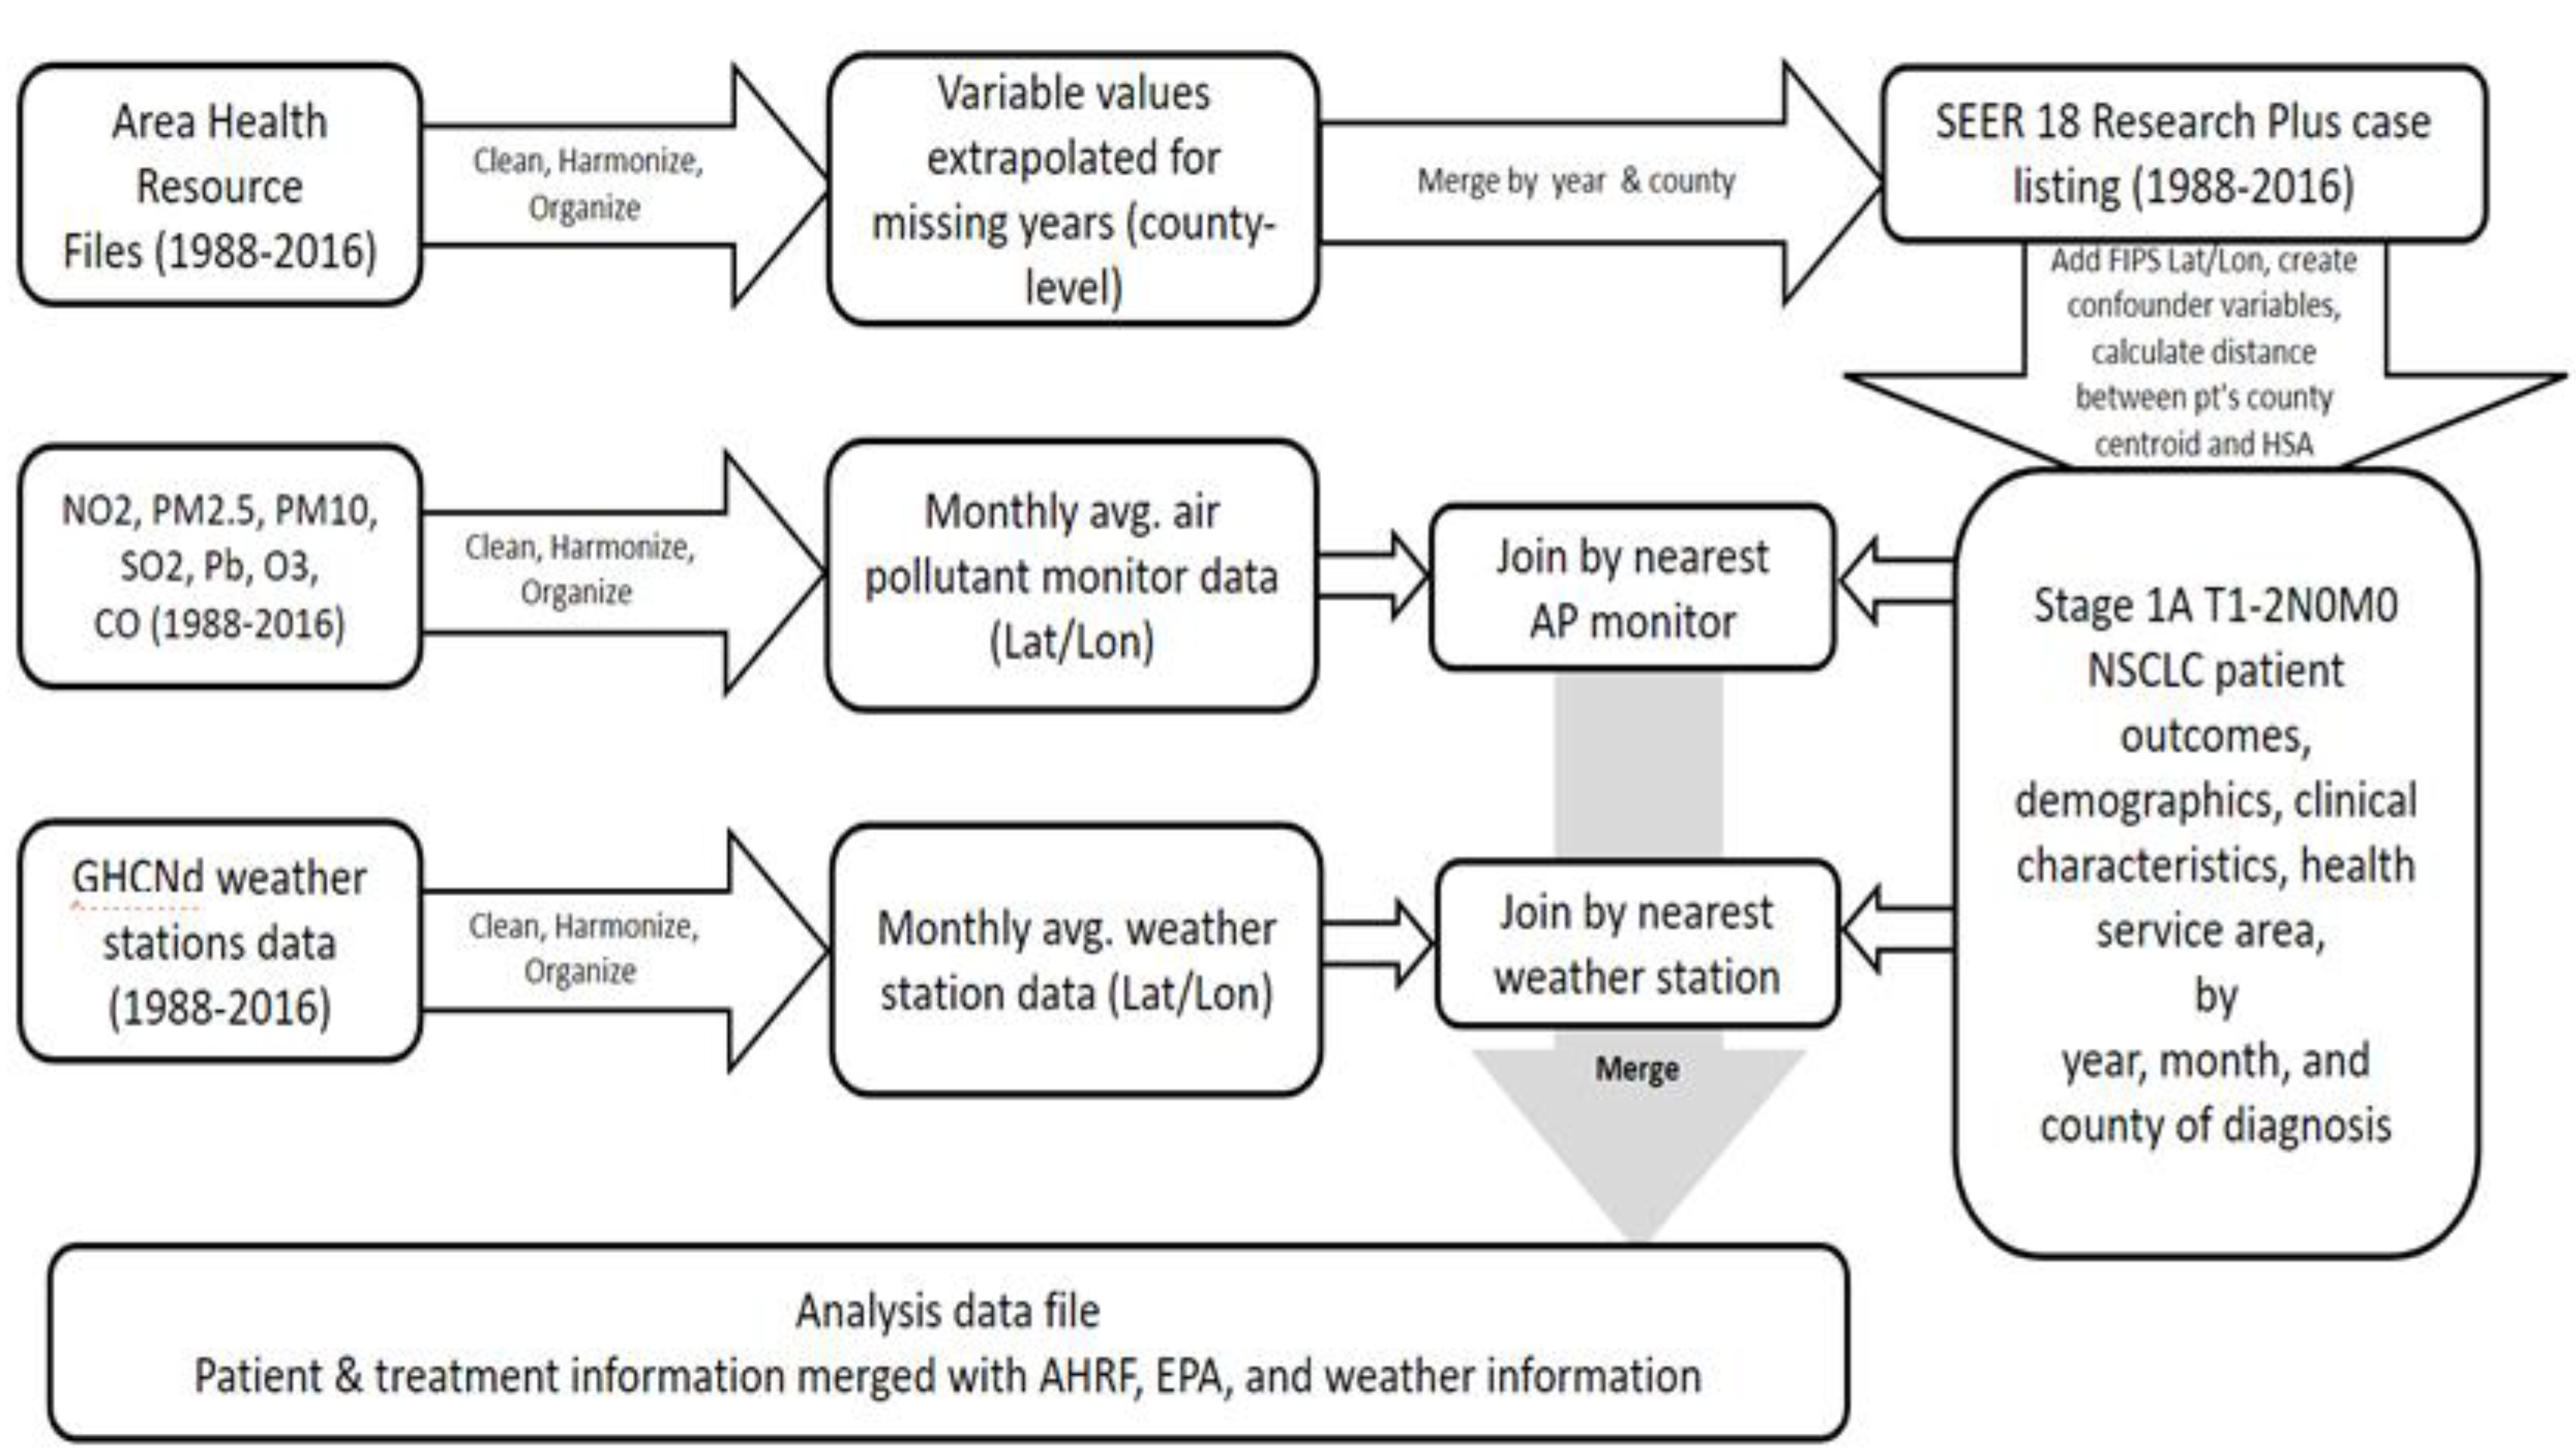
Figure 2.
Final study sample beyond SEER 18 research plus cancer registry data, an extension from prior work Patel et.al (2024).
Figure 2.
Final study sample beyond SEER 18 research plus cancer registry data, an extension from prior work Patel et.al (2024).
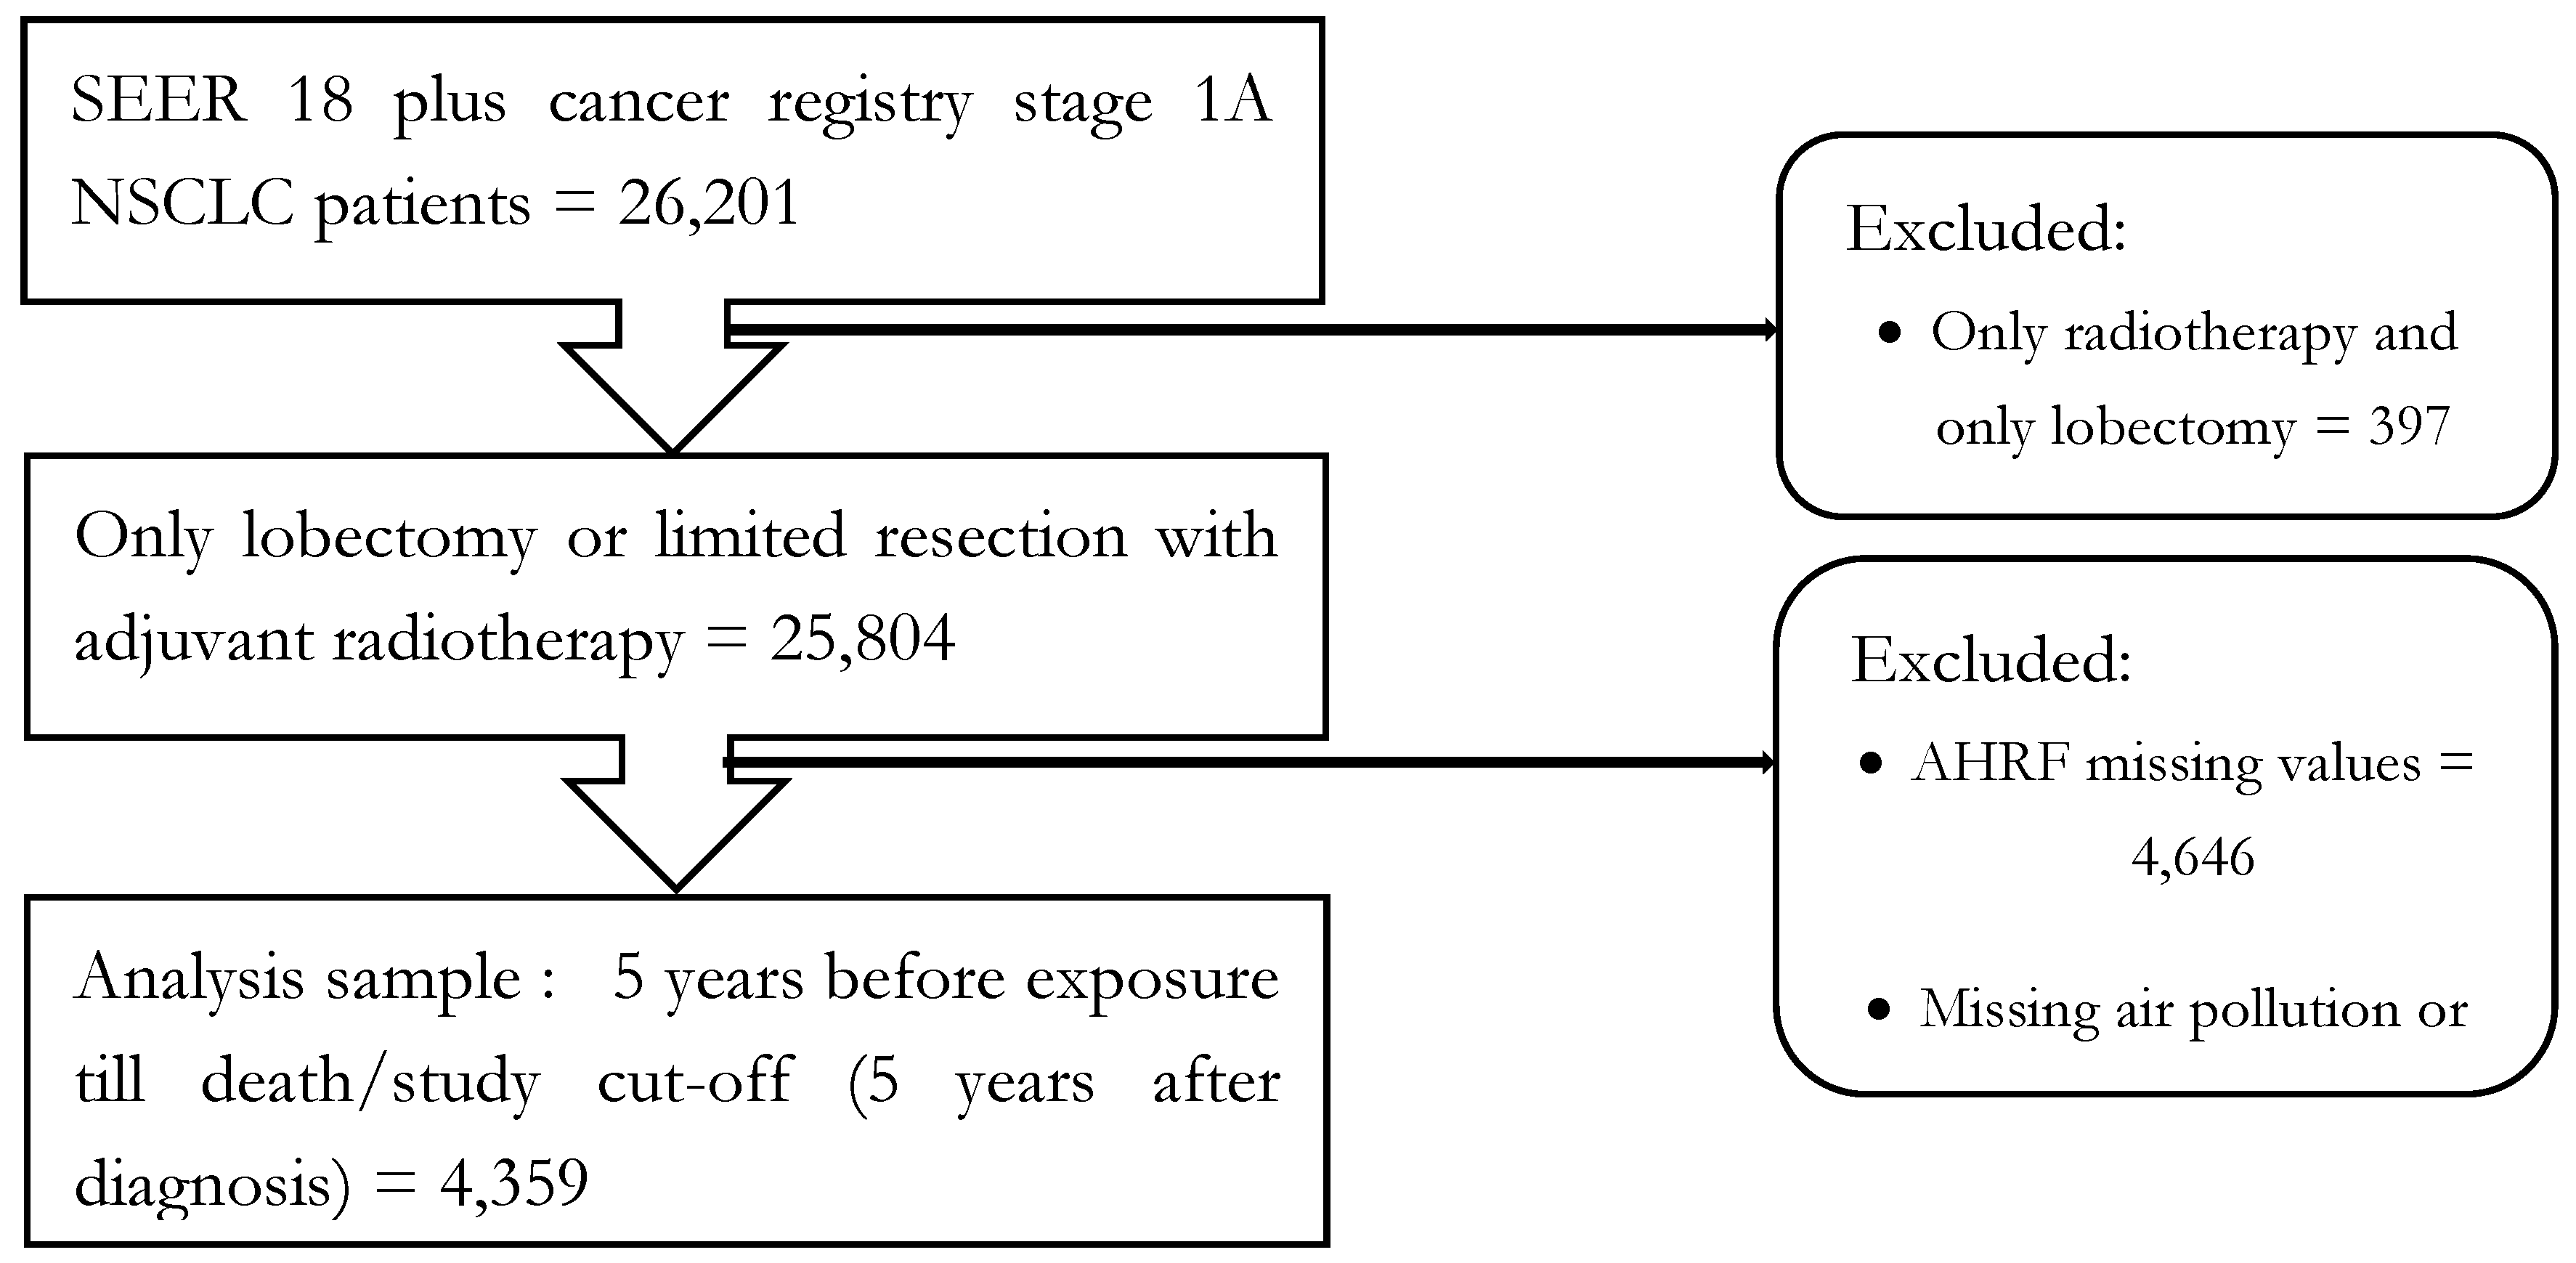
Figure 3.
Air pollution and weather exposure value assignment method to included SEER 18 research plus cancer registry patients.
Figure 3.
Air pollution and weather exposure value assignment method to included SEER 18 research plus cancer registry patients.
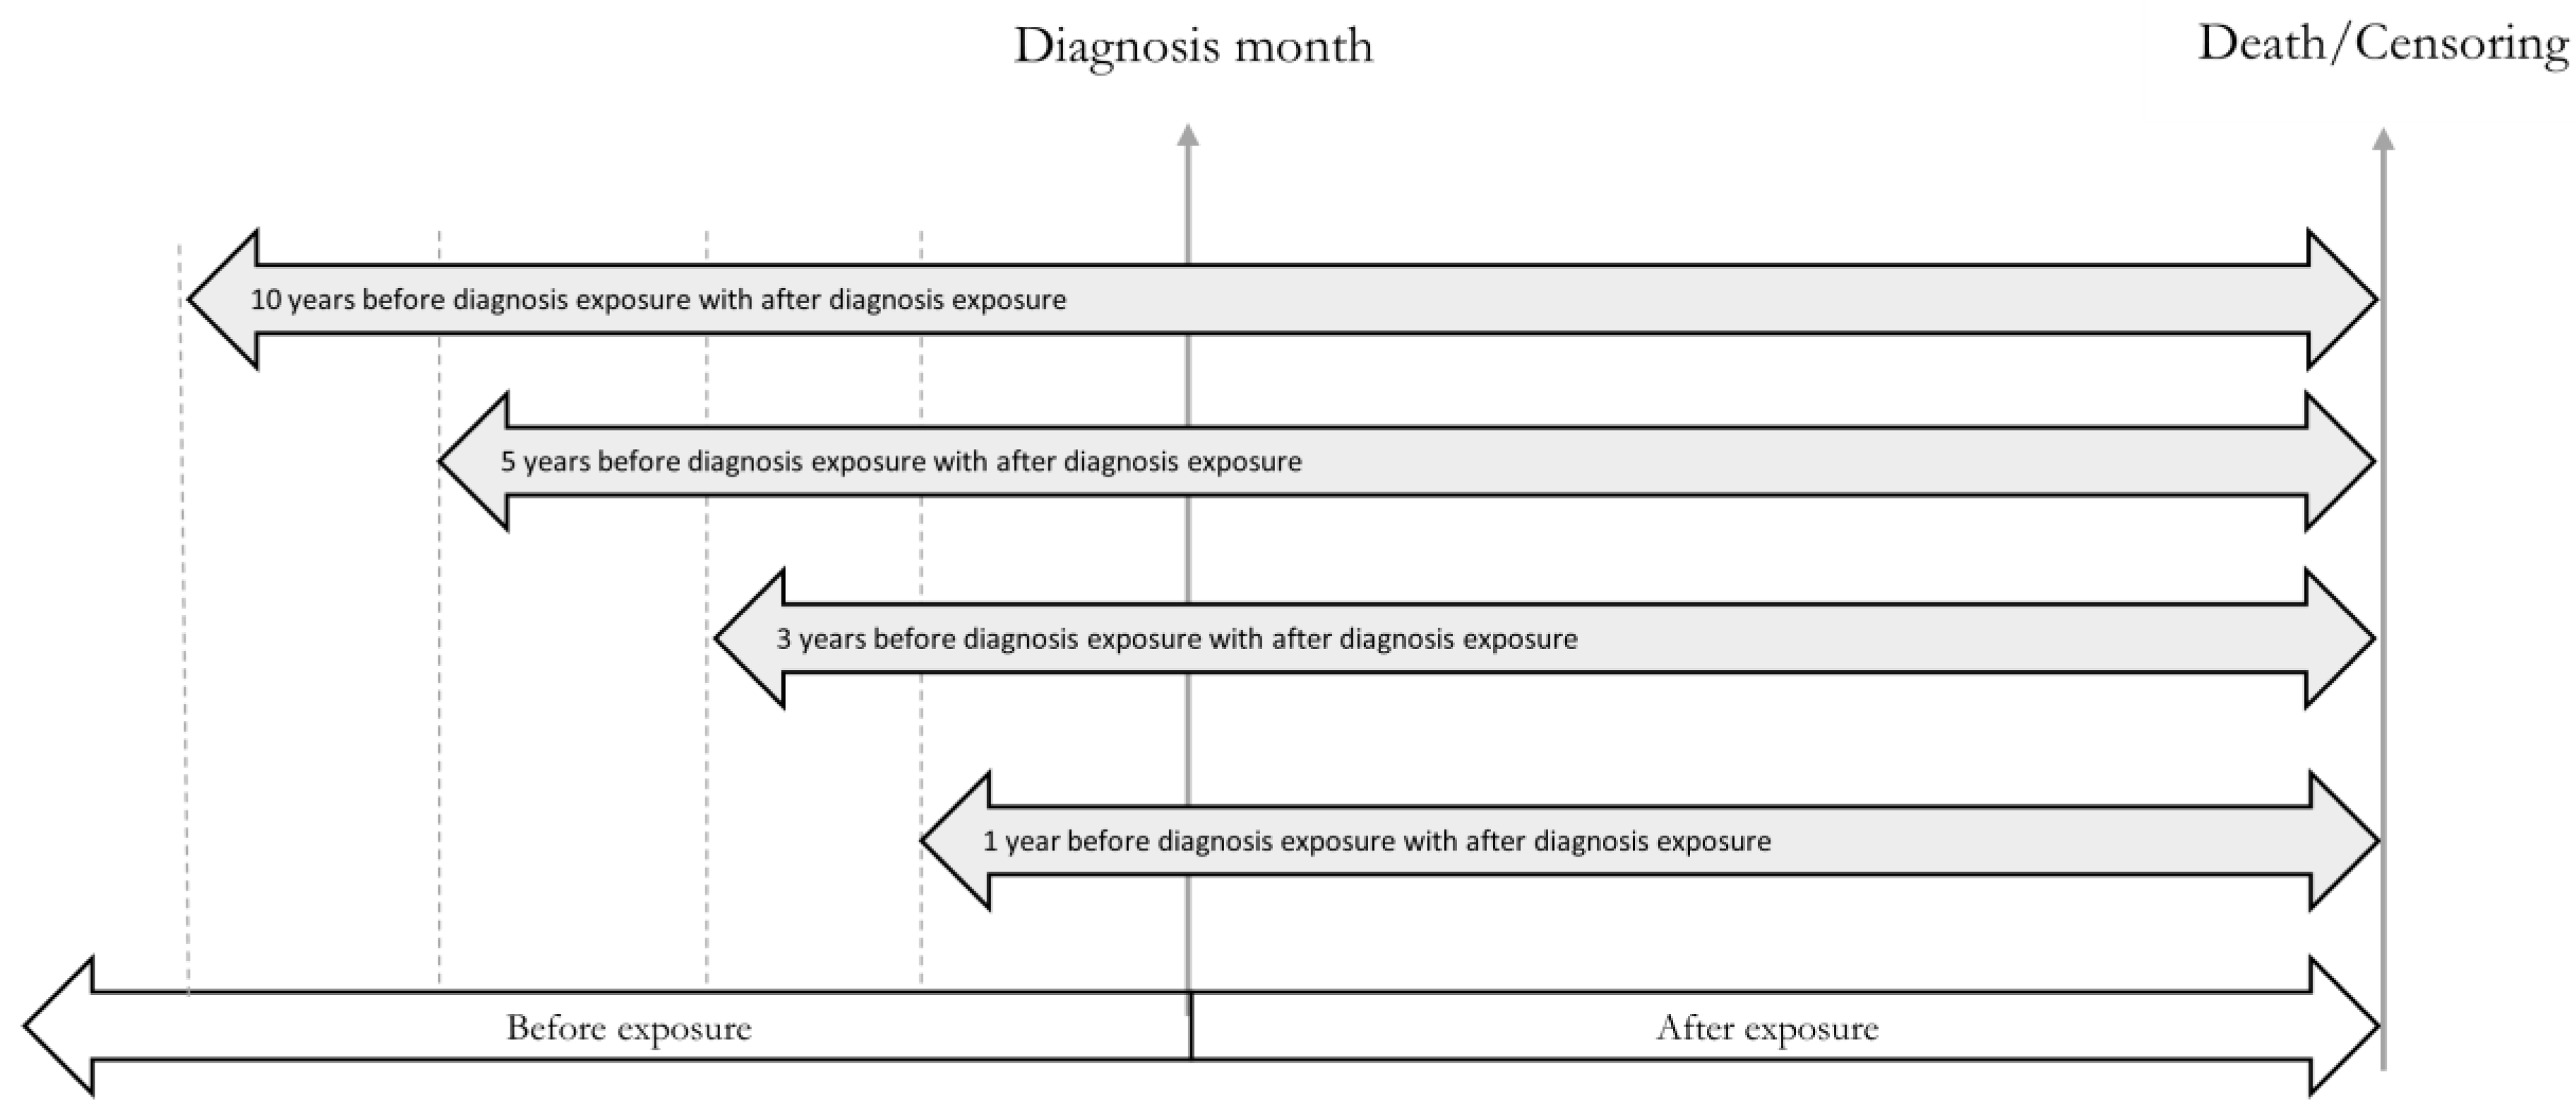
Figure 4.
Daily exposure value conversion method for air pollution and weather in a month into a yearly average of monthly values for each registry patient exposure assignment using the nearest monitoring technique.
Figure 4.
Daily exposure value conversion method for air pollution and weather in a month into a yearly average of monthly values for each registry patient exposure assignment using the nearest monitoring technique.
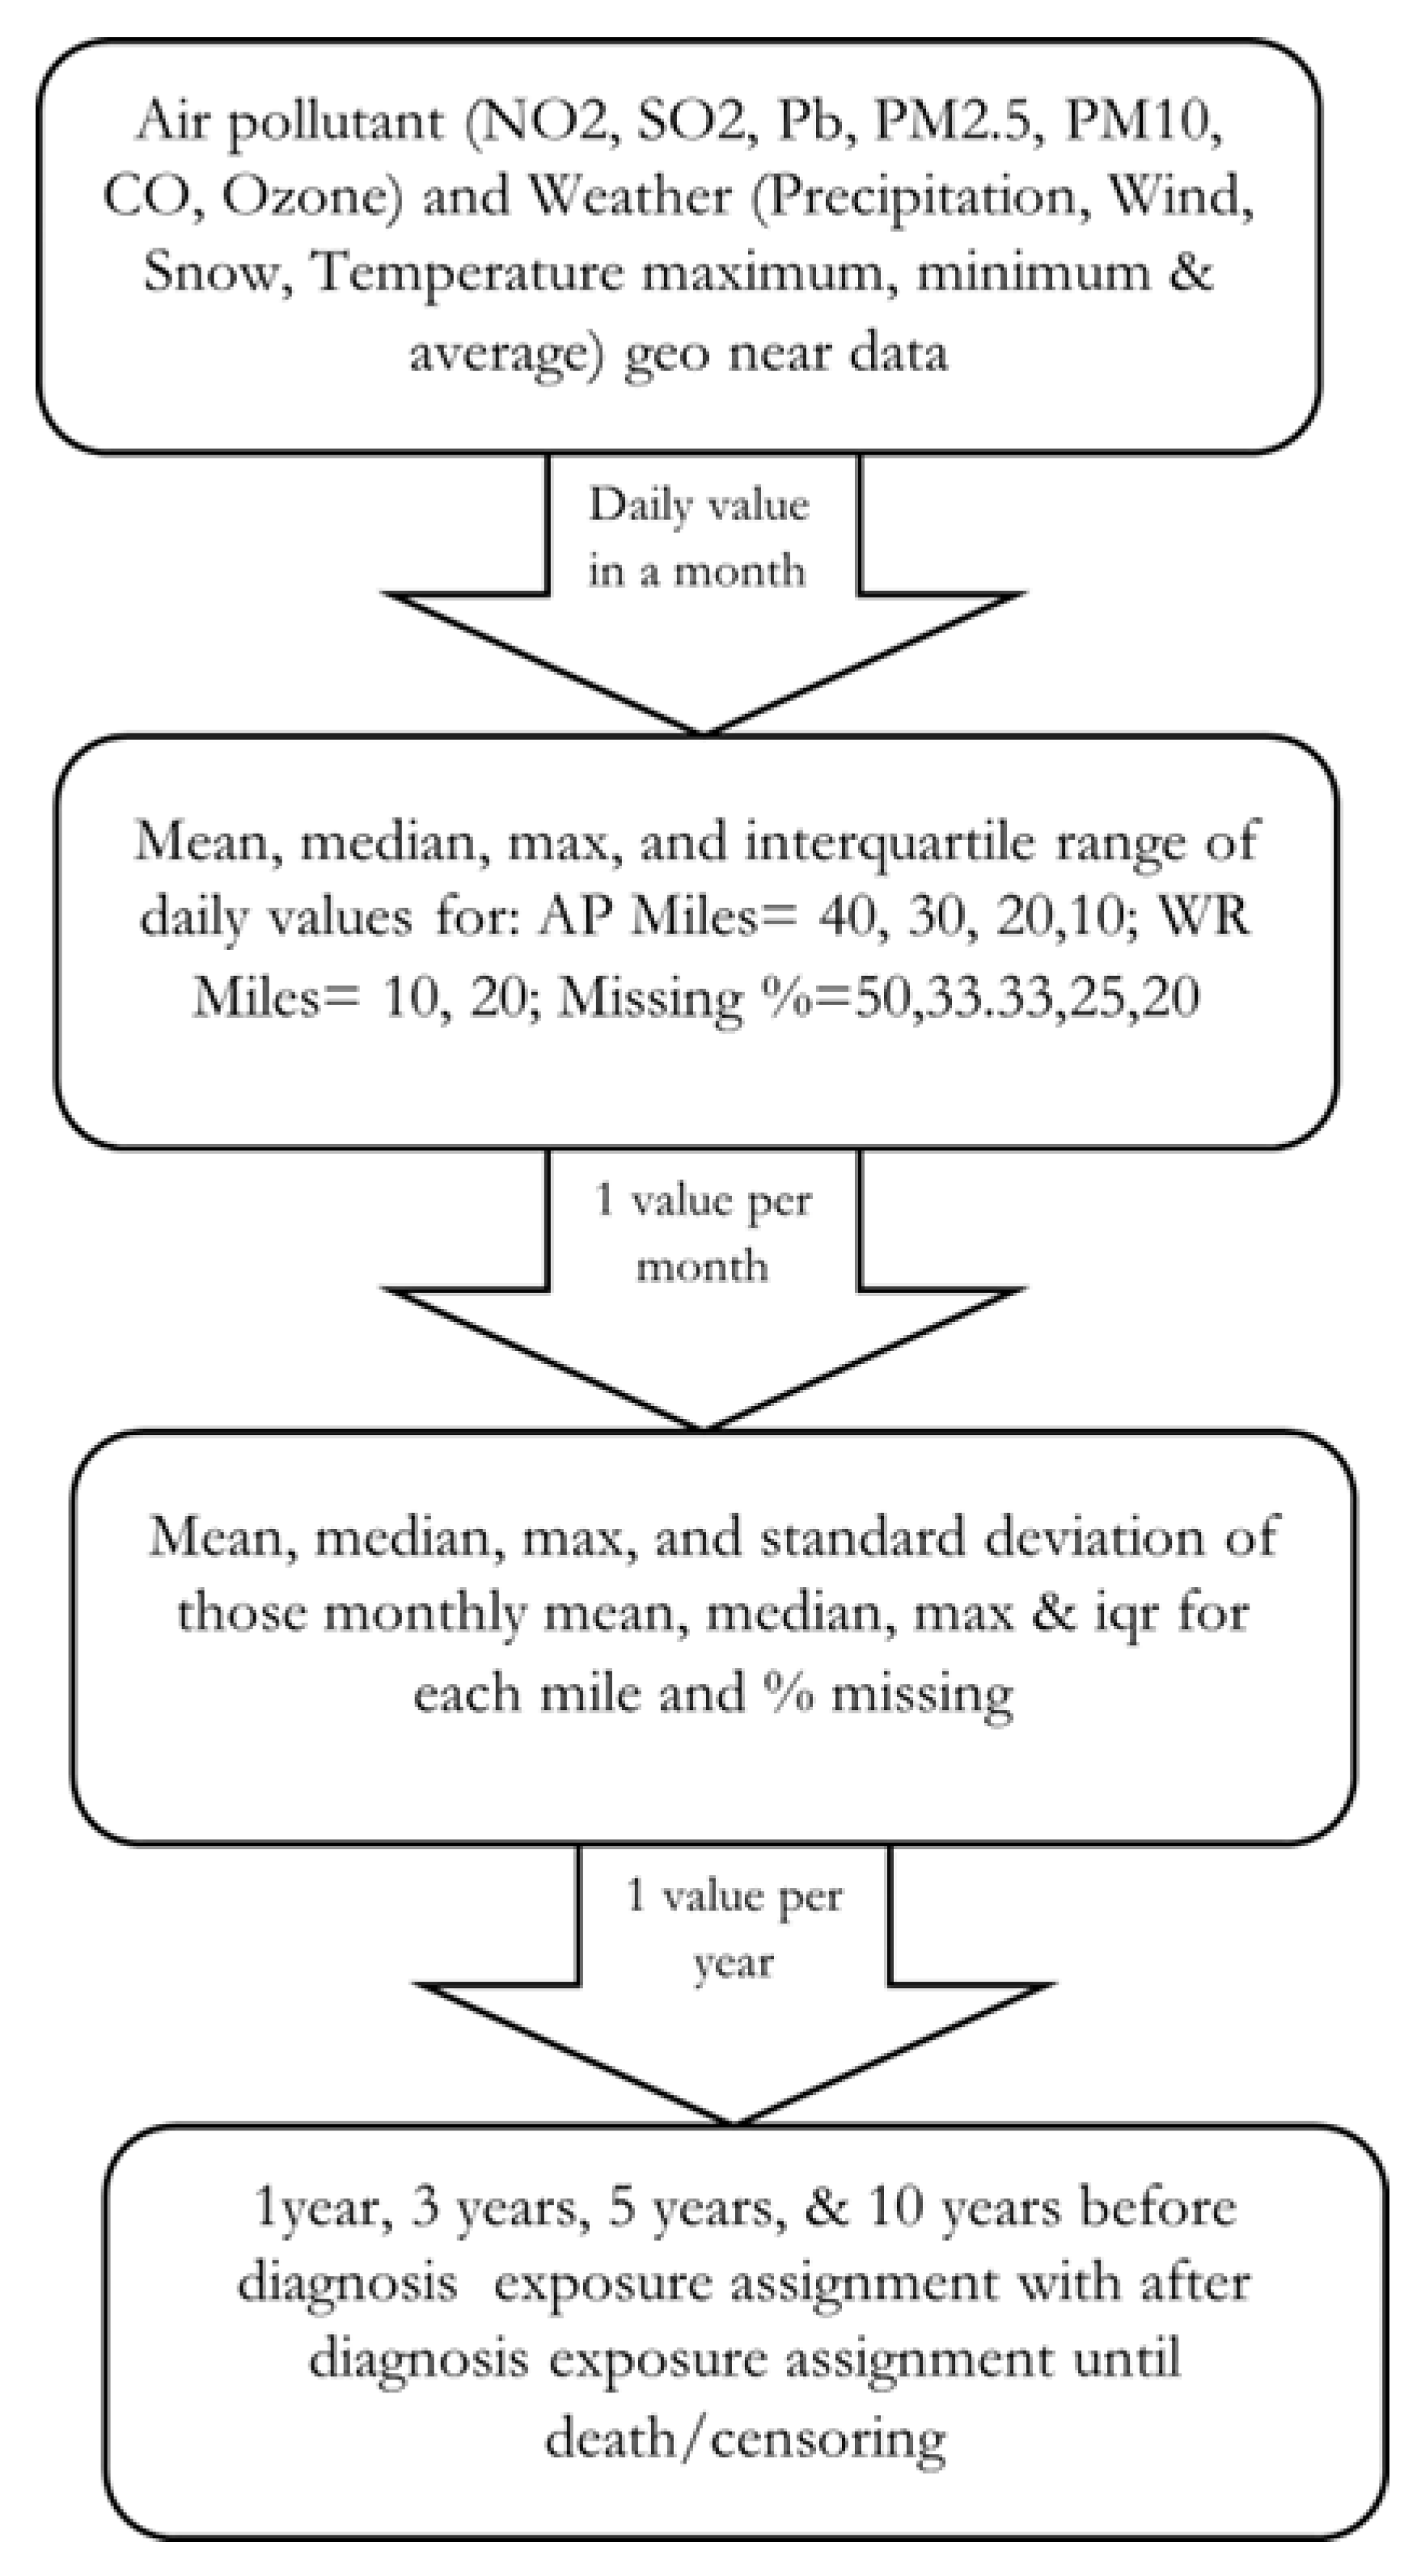
Figure 5.
Multi-pollutant Model: Kaplan-Meier survival estimates with 95% confidence interval by CO above and below median groups, up to 40 miles distance 50% missing for one, three, and five years pre-post diagnosis for above and below median exposure groups.
Figure 5.
Multi-pollutant Model: Kaplan-Meier survival estimates with 95% confidence interval by CO above and below median groups, up to 40 miles distance 50% missing for one, three, and five years pre-post diagnosis for above and below median exposure groups.
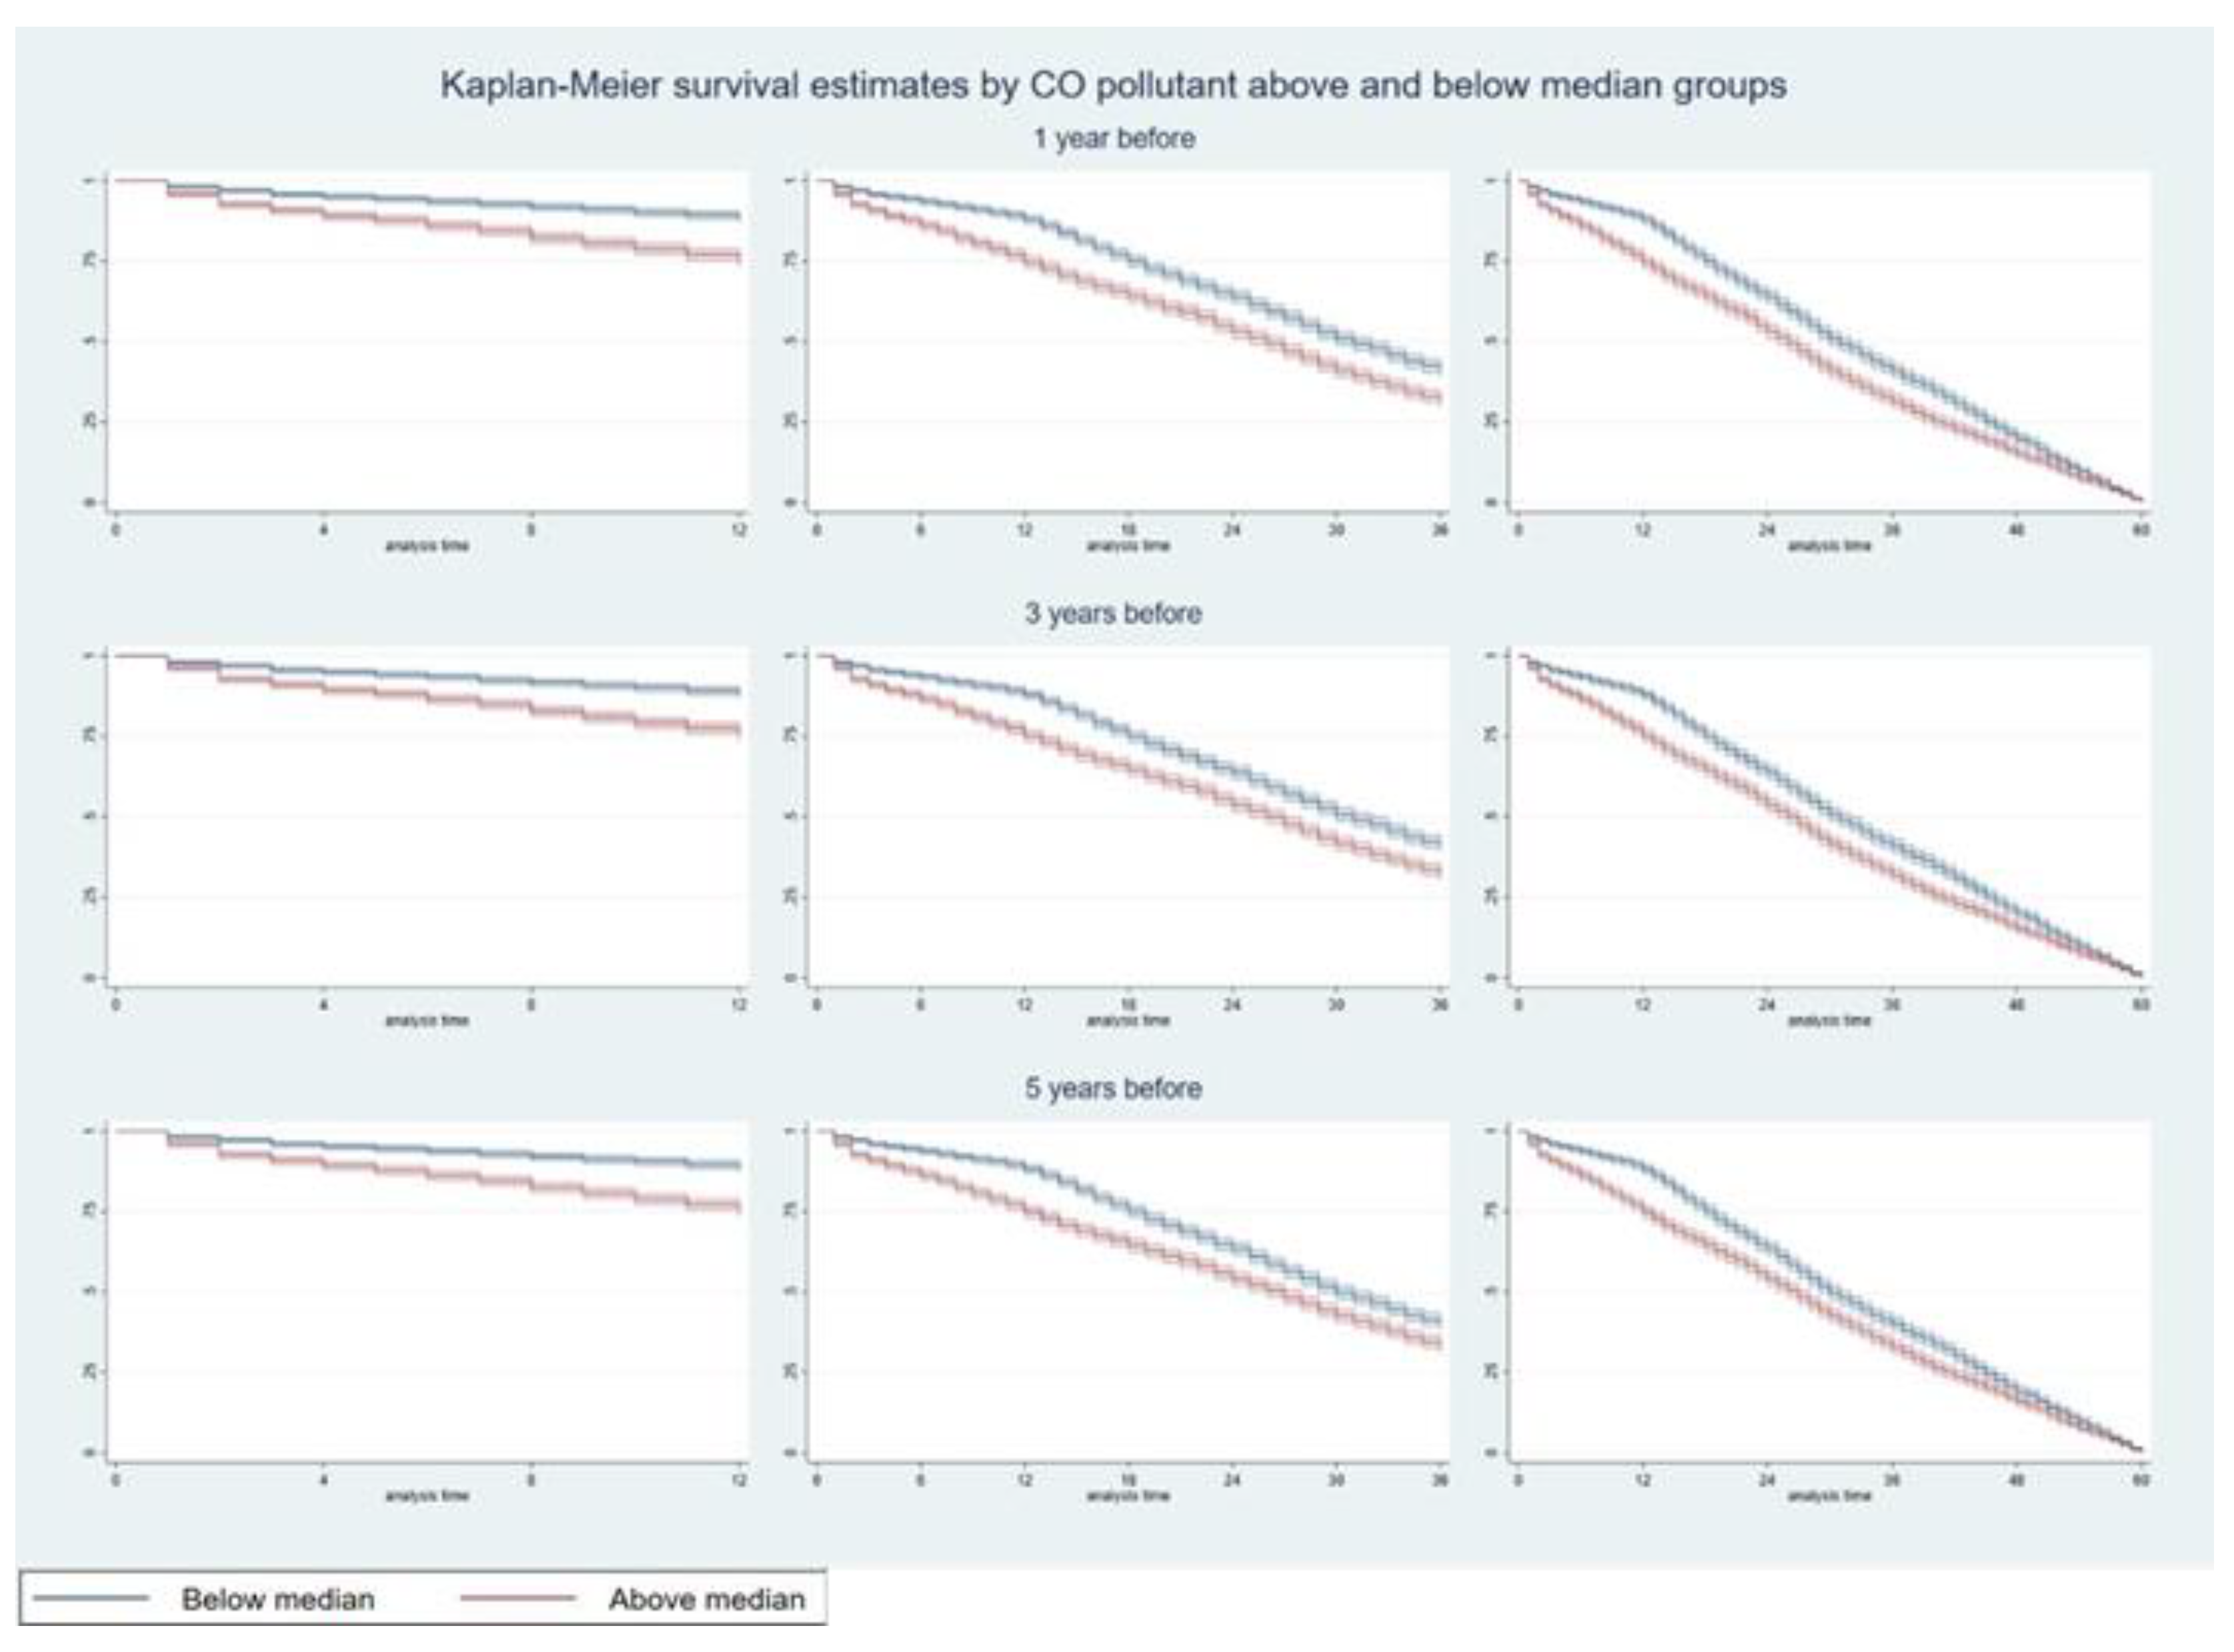
Figure 6.
Multi-pollutant Model: Kaplan-Meier survival estimates with 95% confidence interval by NO2 above and below median groups, up to 40 miles distance 50% missing for one, three, and five years pre-post diagnosis for above and below median exposure groups.
Figure 6.
Multi-pollutant Model: Kaplan-Meier survival estimates with 95% confidence interval by NO2 above and below median groups, up to 40 miles distance 50% missing for one, three, and five years pre-post diagnosis for above and below median exposure groups.
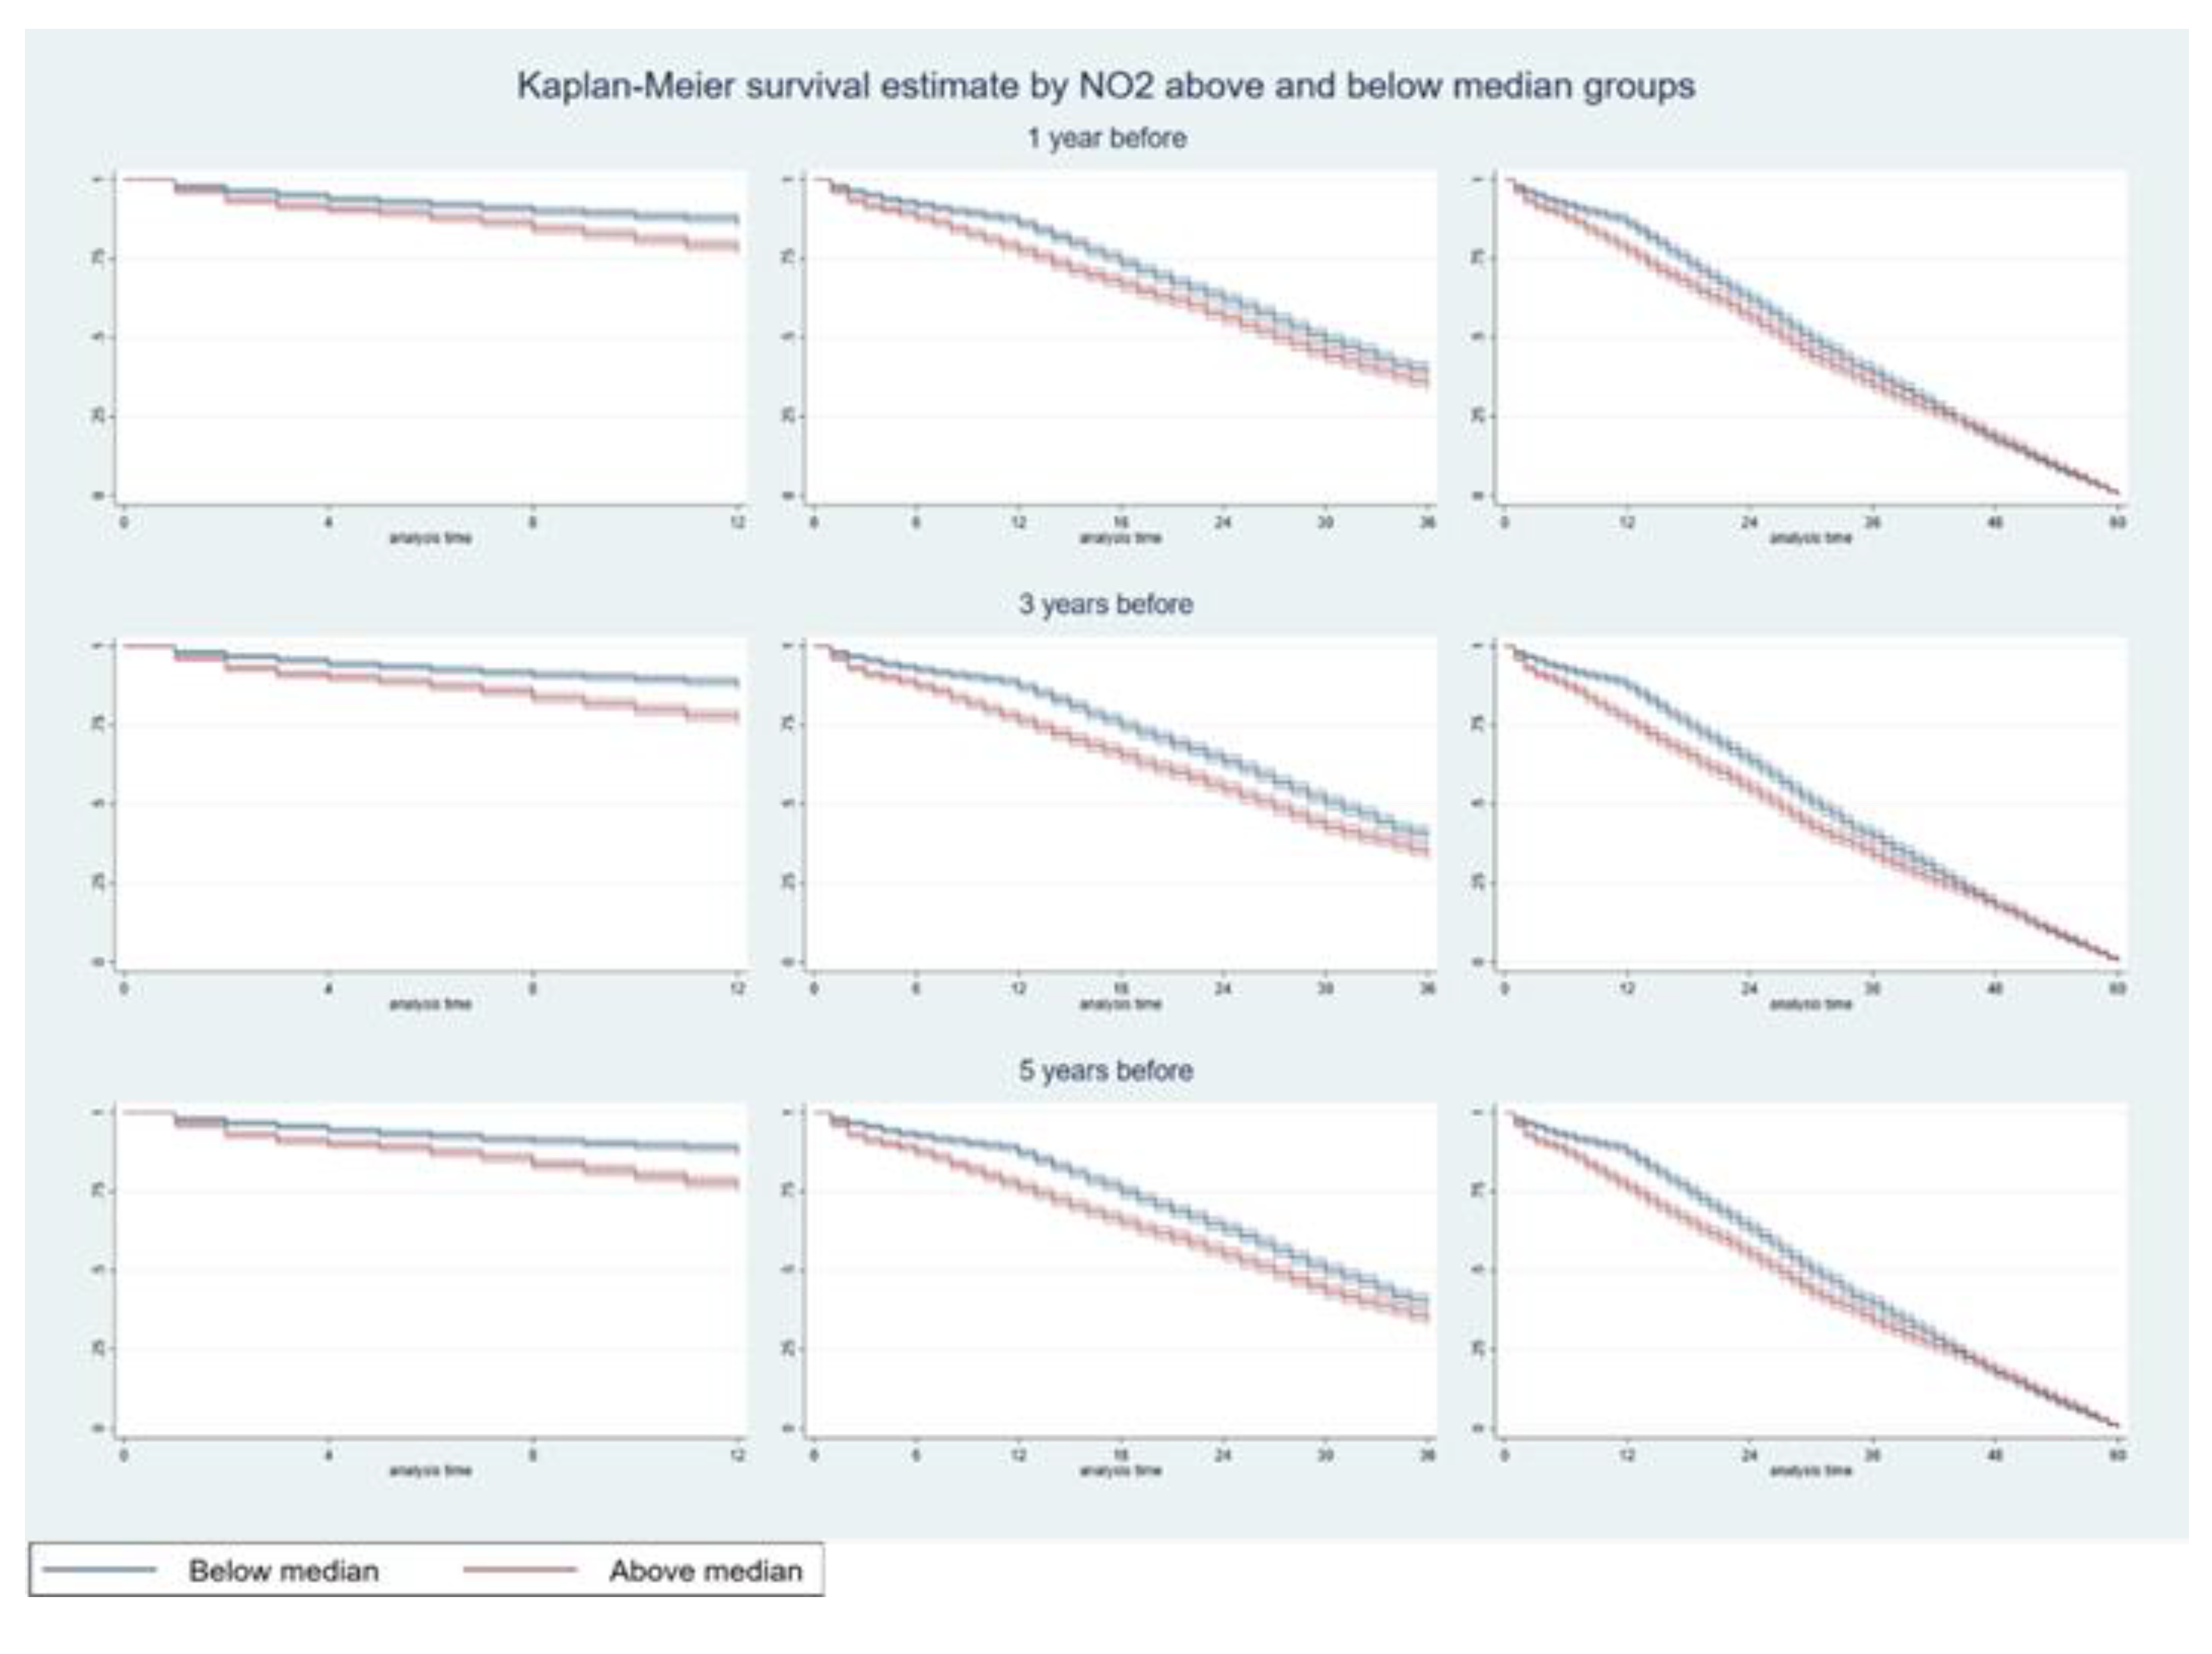
Figure 7.
Multi-pollutant Model: Kaplan-Meier survival estimates with 95% confidence interval by SO2 above and below median groups, up to 40 miles distance 50% missing for one, three, and five years pre-post diagnosis for above and below median exposure groups.
Figure 7.
Multi-pollutant Model: Kaplan-Meier survival estimates with 95% confidence interval by SO2 above and below median groups, up to 40 miles distance 50% missing for one, three, and five years pre-post diagnosis for above and below median exposure groups.
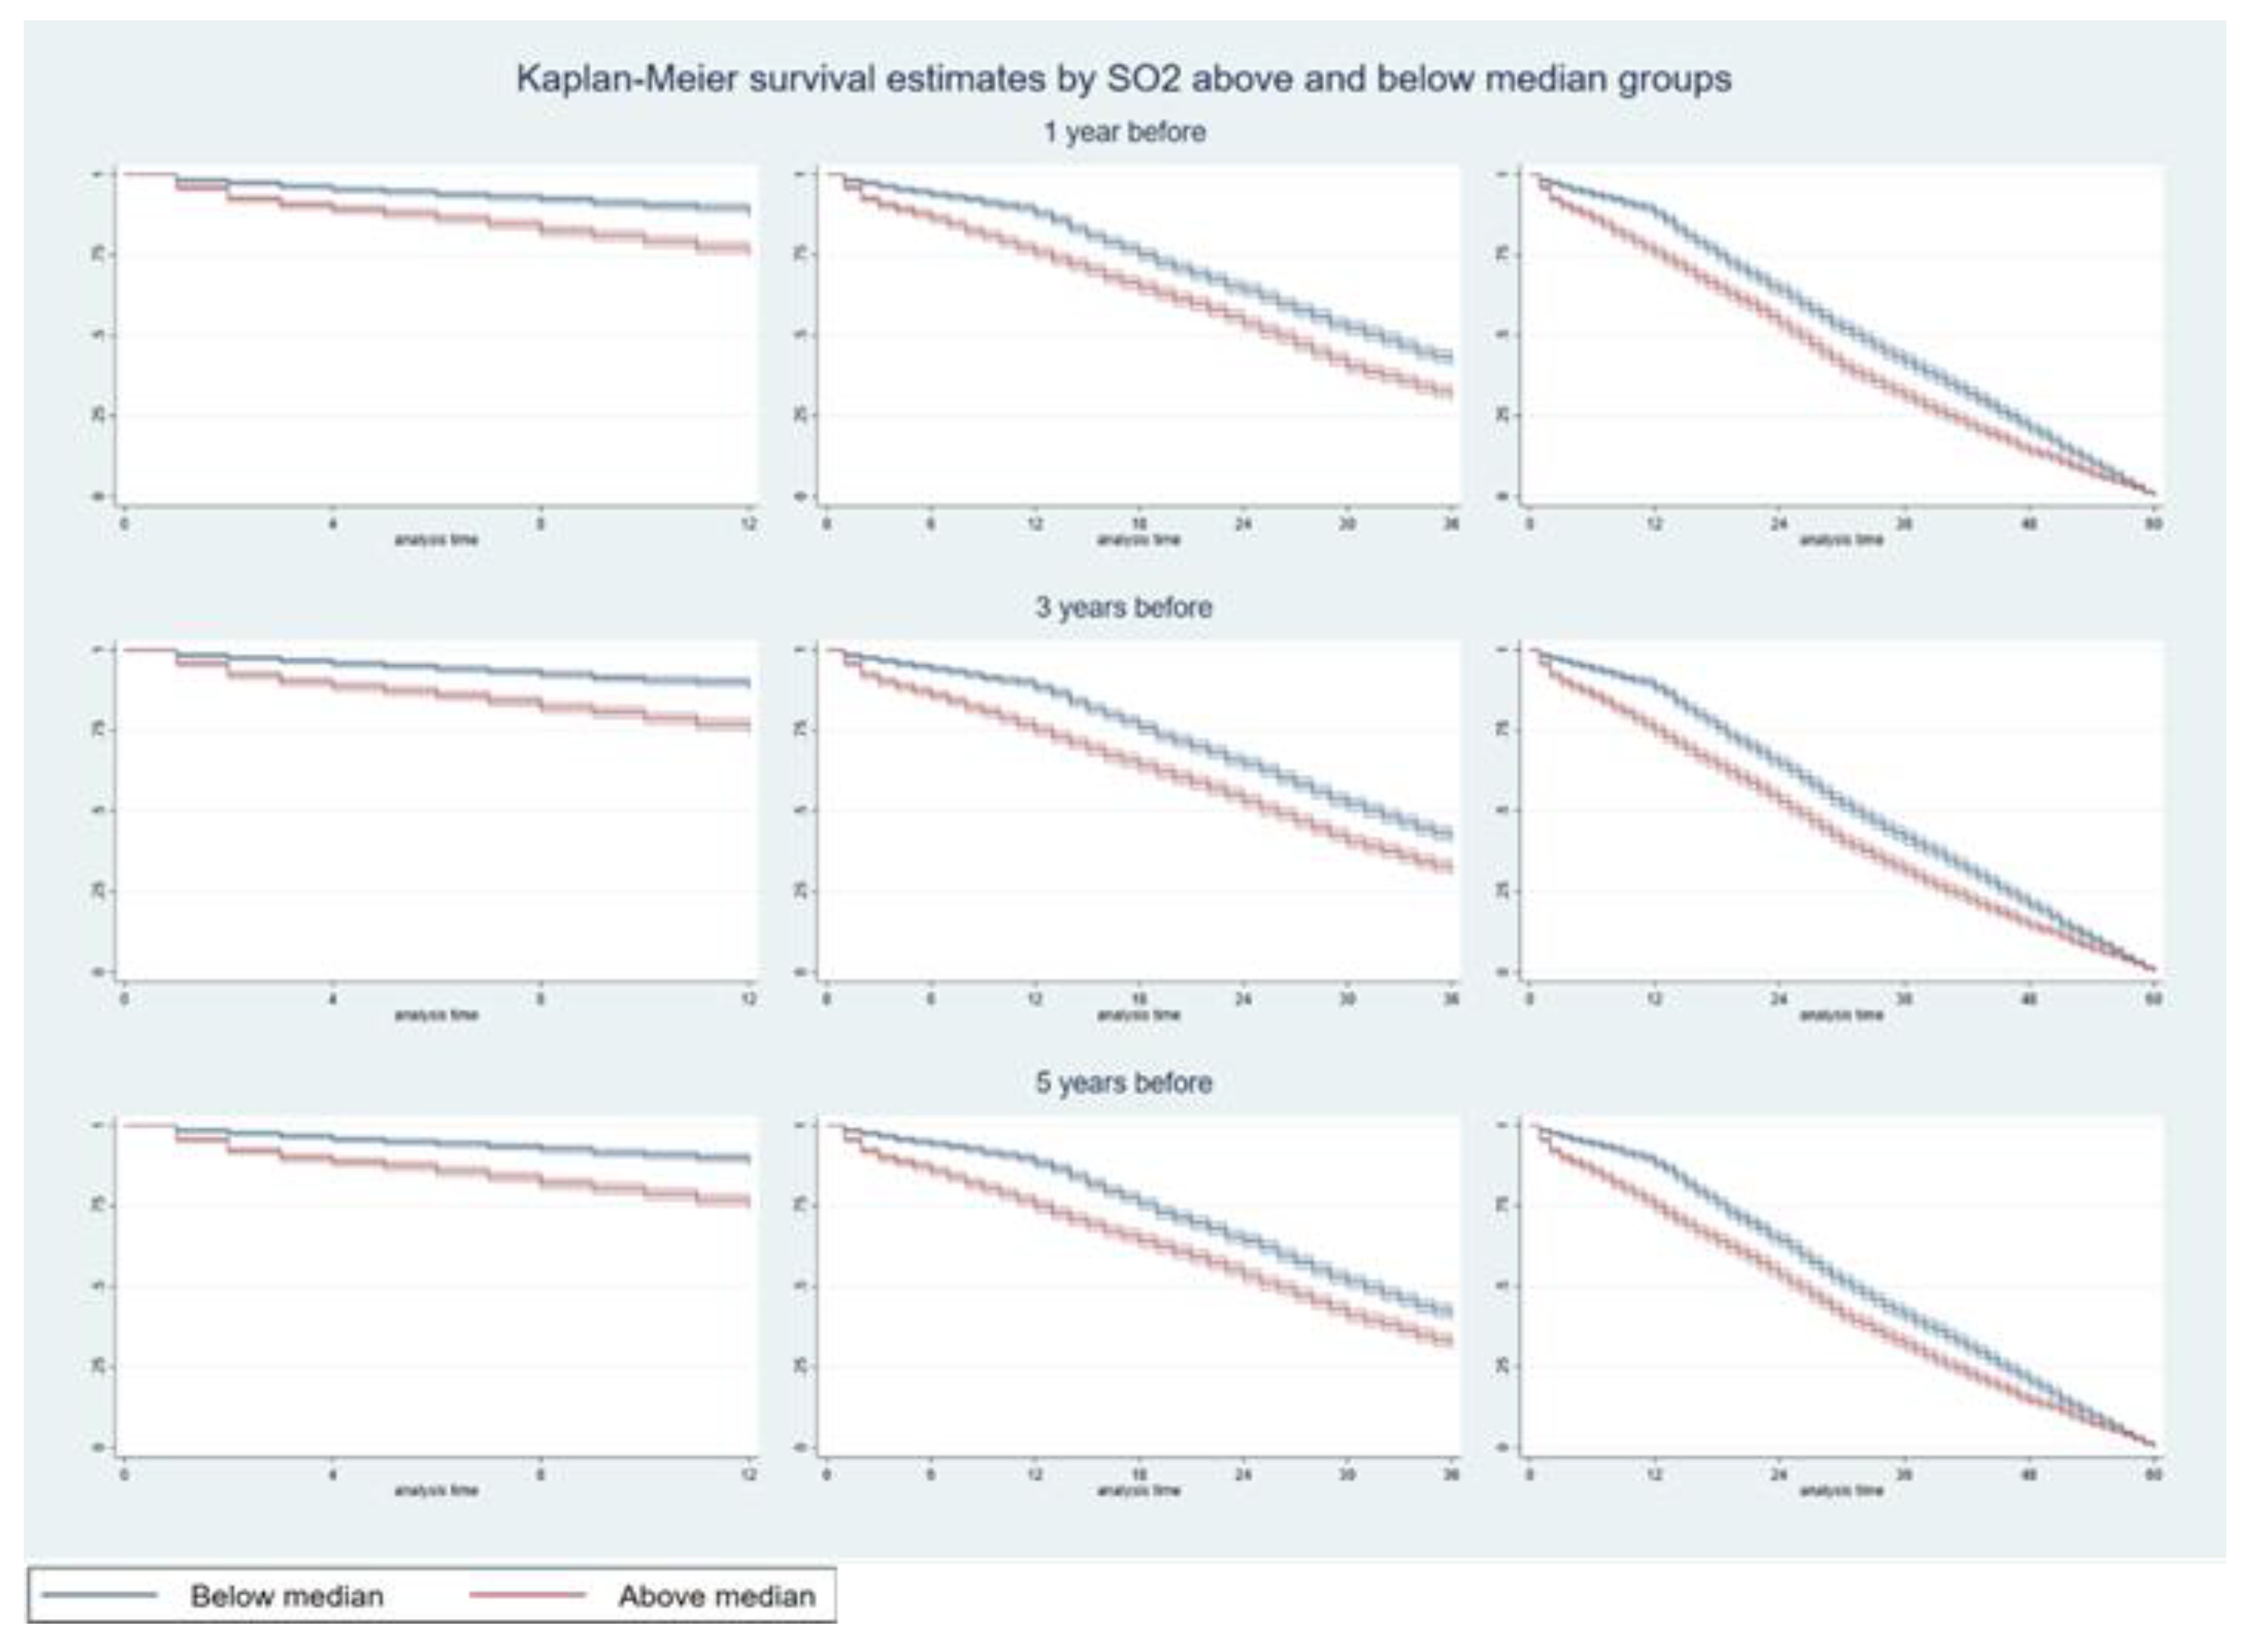
Table 1.
a Frequency statistics of study sample by above and below pollutant exposure median. b Descriptive statistics of study sample above and below pollutant exposure median
Table 1.
a Frequency statistics of study sample by above and below pollutant exposure median. b Descriptive statistics of study sample above and below pollutant exposure median
| (a) | ||||||||||
| Above median | Below median | |||||||||
| Frequency | Percentage | Frequency | Percentage | |||||||
| Tumor Grade | ||||||||||
| Grade I | 262 | 12.02 | 484 | 22.20 | ||||||
| Grade II | 877 | 40.25 | 929 | 42.61 | ||||||
| Grade III | 835 | 38.32 | 564 | 25.87 | ||||||
| Grade IV | 30 | 1.38 | 16 | 0.73 | ||||||
| Unknown | 175 | 8.03 | 187 | 8.58 | ||||||
| Tumor size | ||||||||||
| Upto 1cm | 42 | 1.93 | 198 | 9.08 | ||||||
| > 1cm & < = 2cm | 208 | 9.55 | 820 | 37.61 | ||||||
| > 2cm | 189 | 8.67 | 643 | 29.50 | ||||||
| Unknown size | 1,740 | 79.85 | 519 | 23.81 | ||||||
| Treatment type | ||||||||||
| Only lobectomy | 1,951 | 89.54 | 1,815 | 83.26 | ||||||
| Limited resection with adjuvant | 228 | 10.46 | 365 | 16.74 | ||||||
| Rural-Urban Continuum | ||||||||||
| Large central metro | 1,333 | 61.17 | 1,138 | 52.20 | ||||||
| Large fringe metro | 536 | 24.60 | 801 | 36.74 | ||||||
| Medium metro | 285 | 13.08 | 195 | 8.94 | ||||||
| Non - metropolitan | 25 | 1.15 | 46 | 2.11 | ||||||
| Insurance type | ||||||||||
| Only Medicaid | 35 | 1.61 | 125 | 5.73 | ||||||
| Only Medicare | 166 | 7.62 | 823 | 37.75 | ||||||
| Only Private | 69 | 3.17 | 468 | 21.47 | ||||||
| Uninsured | 6 | 0.28 | 16 | 0.73 | ||||||
| Unknown | 1,903 | 87.33 | 748 | 34.31 | ||||||
| Race | ||||||||||
| Black | 288 | 13.22 | 228 | 10.46 | ||||||
| White | 1,773 | 81.37 | 1,759 | 80.69 | ||||||
| Unknown | 118 | 5.42 | 193 | 8.85 | ||||||
| Sex | ||||||||||
| Female | 969 | 44.47 | 1,226 | 56.24 | ||||||
| Male | 1,210 | 55.53 | 954 | 43.76 | ||||||
| Marital Status | ||||||||||
| Married | 1,280 | 58.74 | 1,239 | 56.83 | ||||||
| Widowed | 380 | 17.44 | 277 | 12.71 | ||||||
| Divorced | 247 | 11.34 | 284 | 13.03 | ||||||
| Single | 224 | 10.28 | 278 | 12.75 | ||||||
| Unknown | 48 | 2.20 | 102 | 4.68 | ||||||
| N | 2,179 | 2,180 | ||||||||
| (b) | ||||||||||
| Above median | Below median | |||||||||
| Median | Mean | SD | Median | Mean | SD | |||||
| Survival months | 27 | 28.11 | 17.61 | 30 | 31.09 | 15.93 | ||||
| Panel A: Exposure to air pollutants before and after diagnosis | ||||||||||
| N02 exposure (ppb) | 22.25 | 25.66 | 3.61 | 12.71 | 12.97 | 3.61 | ||||
| S02 exposure (ppb) | 4.10 | 3.98 | 1.20 | 1.56 | 1.81 | 1.20 | ||||
| CO exposure (ppb) | 816.75 | 1010.84 | 214.13 | 371.03 | 447.91 | 214.13 | ||||
| Panel B: Weather conditions before and after diagnosis | ||||||||||
| Precipitation | 24.06 | 26.07 | 8.76 | 22.41 | 23.34 | 10.93 | ||||
| Snow | 0.98 | 1.14 | 1.15 | 0.10 | 1.28 | 1.54 | ||||
| Daily minimum temperature | 76.04 | 75.90 | 17.66 | 82.80 | 81.92 | 18.01 | ||||
| Panel C: Individual-level characteristics | ||||||||||
| Age at diagnosis | 69 | 67.76 | 8.52 | 68 | 66.38 | 9.13 | ||||
| Panel D: County-level characteristics | ||||||||||
| Population estimates | 881,490 | 3,154,905 | 3,762,147 | 933,141 | 1,281,174 | 920,018 | ||||
| Unemployment rate | 59 | 63.70 | 24.39 | 45 | 48.85 | 34.63 | ||||
| Percapita income | 30496 | 32920.76 | 10118.93 | 47146 | 47803.63 | 15097.07 | ||||
| Total # hospitals | 16 | 45.68 | 54.17 | 13 | 14.09 | 9.35 | ||||
| Total # hospital beds | 3797 | 10169.78 | 11463.38 | 3130 | 3184.55 | 1979.29 | ||||
| N | 2,179 | 2,180 | ||||||||
Table 2.
a. Hazards of death five years after diagnosis from air pollution, weather, and treatment type by annual average monthly mean. b. Hazards of death five years after diagnosis for study covariates by annual average monthly mean.
Table 2.
a. Hazards of death five years after diagnosis from air pollution, weather, and treatment type by annual average monthly mean. b. Hazards of death five years after diagnosis for study covariates by annual average monthly mean.
| (a) | ||||||||||||||||||||||||||||||||
| Multipollutant | NO2 | SO2 | CO | |||||||||||||||||||||||||||||
| Hazard of death 5 years after diagnosis | Hazard of death 5 years after diagnosis | Hazard of death 5 years after diagnosis | Hazard of death 5 years after diagnosis | |||||||||||||||||||||||||||||
| Duration of exposure from diagnosis | Duration of exposure from diagnosis | Duration of exposure from diagnosis | Duration of exposure from diagnosis | |||||||||||||||||||||||||||||
| 1 yr bf | 3 yrs. bf | 5 yrs. bf | 1 yr bf | 3 yrs. bf | 5 yrs. bf | 1 yr bf | 3 yrs. bf | 5 yrs. bf | 1 yr bf | 3 yrs. bf | 5 yrs. bf | |||||||||||||||||||||
| Air pollutants and weather components | ||||||||||||||||||||||||||||||||
| NO2 | 1.04*** | 1.06*** | 1.09*** | 1.06*** | 1.08*** | 1.11*** | ||||||||||||||||||||||||||
| (1.02, 1.06) | (1.04, 1.08) | (1.06, 1.12) | (1.04 , 1.29) | (1.06 , 1.68) | (1.08 , 5.82) | |||||||||||||||||||||||||||
| SO2 | 1.16*** | 1.17*** | 1.17*** | 1.15*** | 1.16*** | 1.15*** | ||||||||||||||||||||||||||
| (1.12 , 1.21) | (1.13 , 1.22) | (1.12 , 1.21) | (1.11 , 1.2) | (1.12 , 1.21) | (1.1 , 1.19) | |||||||||||||||||||||||||||
| CO | 1.53*** | 1.51*** | 1.42** | 1.90*** | 2.07*** | 2.32*** | ||||||||||||||||||||||||||
| (1.19 , 1.97) | (1.16 , 1.96) | (1.08 , 1.86) | (1.52 , 2.38) | (1.65 , 2.6) | (1.86 , 2.9) | |||||||||||||||||||||||||||
| Precipitation | 0.98** | 0.97*** | 0.97** | .98** | .98*** | 0.98 | 1 | 1 | 1 | .99* | .98** | 0.99 | ||||||||||||||||||||
| (0.97 , 1) | (0.95 , 0.99) | (0.95 , 1) | (.97 , 1.) | (.96 , .99) | (.96 , 1.01) | (.98 , 1.01) | (.98 , 1.01) | (.98 , 1.02) | (.97 , 1.) | (.96 , 1.) | (.97 , 1.01) | |||||||||||||||||||||
| Snow | 0.99 | 0.96 | 0.90** | 0.94 | .88*** | .82*** | 1 | 1.01 | 0.99 | 1 | 0.94 | .88*** | ||||||||||||||||||||
| (0.92 , 1.07) | (0.88 , 1.05) | (0.82 , 0.99) | (.87 , 1.01) | (.81 , .96) | (.75 , .89) | (.93 , 1.08) | (.93 , 1.1) | (.9 , 1.08) | (.93 , 1.07) | (.87 , 1.03) | (.8 , .96) | |||||||||||||||||||||
| Daily temperature minimum | 1.01 | 1.01** | 1.03*** | 1.01 | 1.01** | 1.03*** | .99** | .99** | 1 | 1.01 | 1.01 | 1.02*** | ||||||||||||||||||||
| (1 , 1.02) | (1 , 1.02) | (1.02 , 1.04) | (1. , 1.01) | (1. , 1.02) | (1.02 , 1.05) | (.99 , 1.) | (.98 , 1.) | (.99 , 1.01) | (1. , 1.01) | (1. , 1.02) | (1.01 , 1.03) | |||||||||||||||||||||
| Treatment options (reference :lobectomy) | ||||||||||||||||||||||||||||||||
| Limited resection with adjuvant radiotherapy | 0.95 | 0.89 | 0.97 | 0.70 | 0.63 | 0.67 | 1.34 | 1.24 | 1.14 | 0.93 | 0.79 | 0.75 | ||||||||||||||||||||
| (0.39 , 2.32) | (0.35 , 2.22) | (0.37 , 2.52) | (.31 , 1.57) | (.28 , 1.43) | (.29 , 1.54) | (.55 , 3.22) | (.5 , 3.08) | (.45 , 2.88) | (.4 , 2.16) | (.34 , 1.83) | (.32 , 1.72) | |||||||||||||||||||||
| Treatment interaction with air pollutant and weather components | ||||||||||||||||||||||||||||||||
| NO2 * Treatment | 1.01 | 1.02* | 1.02* | 1.01* | 1.01* | 1.01*** | ||||||||||||||||||||||||||
| (1 , 1.03) | (1 , 1.03) | (1 , 1.03) | (1 , 1.02) | (1 , 1.02) | (1 , 1.02) | |||||||||||||||||||||||||||
| SO2 * Treatment | 0.99 | 0.98 | 0.99 | 1.02 | 1.02 | 1.02 | ||||||||||||||||||||||||||
| (0.93 , 1.04) | (0.93 , 1.04) | (0.93 , 1.05) | (0.97 , 1.07) | (0.98 , 1.07) | (0.97 , 1.06) | |||||||||||||||||||||||||||
| CO * Treatment | 0.94 | 0.85 | 0.86 | 1.16 | 1.24** | 1.36*** | ||||||||||||||||||||||||||
| (0.68 , 1.29) | (0.60 , 1.21) | (0.60 , 1.22) | (0.95 , 1.43) | (1.04 , 1.48) | (1.16 , 1.60) | |||||||||||||||||||||||||||
| Precipitation * Treatment | 1 | 1.01 | 1.01* | 1.00 | 1.00 | 1.00 | 1 | 1.01* | 1.01** | 1.00 | 1.00 | 1.00 | ||||||||||||||||||||
| (0.99 , 1.01) | (1 , 1.02) | (1 , 1.02) | (0.99 , 1) | (0.99 , 1.01) | (0.99 , 1.01) | (1 , 1.01) | (1 , 1.02) | (1 , 1.02) | (0.99 , 1.01) | (0.99 , 1.01) | (0.99 , 1) | |||||||||||||||||||||
| Snow * Treatment | 1.10** | 1.14*** | 1.11** | 1.03 | 1.04 | 1.00 | 1.09** | 1.10** | 1.06 | 1.03 | 1.06 | 1.05 | ||||||||||||||||||||
| (1 , 1.2) | (1.03 , 1.25) | (1.01 , 1.23) | (0.96 , 1.10) | (0.97 , 1.12) | (0.93 , 1.07) | (1 , 1.18) | (1 , 1.2) | (0.97 , 1.17) | (0.95 , 1.12) | (0.98 , 1.14) | (0.97 , 1.13) | |||||||||||||||||||||
| Temperature minimum * Treatment | 1.00 | 1.01* | 1.01* | 1 | 1 | 1 | 1.01** | 1.01** | 1.01* | 1 | 1 | 1 | ||||||||||||||||||||
| (1 , 1.01) | (1 , 1.02) | (1 , 1.02) | (1 , 1.01) | (1 , 1.01) | (1 , 1.01) | (1 , 1.01) | (1 , 1.01) | (1 , 1.01) | (1 , 1.01) | (1 , 1.01) | (1 , 1.01) | |||||||||||||||||||||
| pvalue: * <0.1, ** <0.05, *** <0.01. | ||||||||||||||||||||||||||||||||
| (b) | ||||||||||||||||||||||||||||||||
| Multipollutant | NO2 | SO2 | CO | |||||||||||||||||||||||||||||
| Hazard of death 5 year after diagnosis | Hazard of death 5 year after diagnosis | Hazard of death 5 year after diagnosis | Hazard of death 5 year after diagnosis | |||||||||||||||||||||||||||||
| Duration of exposure from diagnosis | Duration of exposure from diagnosis | Duration of exposure from diagnosis | Duration of exposure from diagnosis | |||||||||||||||||||||||||||||
| 1 yr bf | 3 yrs. bf | 5 yrs. bf | 1 yr bf | 3 yrs. bf | 5 yrs. bf | 1 yr bf | 3 yrs. bf | 5 yrs. bf | 1 yr bf | 3 yrs. bf | 5 yrs. bf | |||||||||||||||||||||
| Race (reference: Black) | ||||||||||||||||||||||||||||||||
| Other | 1 | 1 | 1.01 | 1.02 | 1.02 | 1.03 | 0.99 | 0.98 | 0.98 | 1.02 | 1.01 | 1.02 | ||||||||||||||||||||
| (.87 , 1.16) | (.86 , 1.15) | (.87 , 1.16) | (.88 , 1.18) | (.88 , 1.18) | (.89 , 1.19) | (.86 , 1.14) | (.85 , 1.13) | (.85 , 1.13) | (.88 , 1.17) | (.88 , 1.17) | (.88 , 1.18) | |||||||||||||||||||||
| White | 0.97 | 0.96 | 0.97 | 0.98 | 0.98 | 0.99 | 0.96 | 0.95 | 0.95 | 0.97 | 0.97 | 0.97 | ||||||||||||||||||||
| (.88 , 1.07) | (.88 , 1.06) | (.88 , 1.07) | (.89 , 1.08) | (.89 , 1.08) | (.9 , 1.09) | (.87 , 1.06) | (.87 , 1.05) | (.86 , 1.05) | (.88 , 1.07) | (.88 , 1.07) | (.88 , 1.07) | |||||||||||||||||||||
| Sex (reference: Female) | ||||||||||||||||||||||||||||||||
| Male | 1.12*** | 1.12*** | 1.13*** | 1.12*** | 1.12*** | 1.13*** | 1.11*** | 1.11*** | 1.11*** | 1.12*** | 1.12*** | 1.12*** | ||||||||||||||||||||
| (1.05 , 1.19) | (1.05 , 1.19) | (1.06 , 1.2) | (1.05 , 1.19) | (1.06 , 1.19) | (1.06 , 1.2) | (1.04 , 1.17) | (1.04 , 1.18) | (1.04 , 1.18) | (1.05 , 1.19) | (1.05 , 1.19) | (1.05 , 1.19) | |||||||||||||||||||||
| Tumor Grade (reference: II) | ||||||||||||||||||||||||||||||||
| Grade III | 1.1*** | 1.1*** | 1.1*** | 1.09** | 1.09** | 1.09** | 1.12*** | 1.12*** | 1.12*** | 1.09** | 1.09** | 1.1** | ||||||||||||||||||||
| (1.02 , 1.19) | (1.02 , 1.19) | (1.02 , 1.19) | (1.01 , 1.18) | (1.01 , 1.17) | (1.01 , 1.18) | (1.04 , 1.2) | (1.04 , 1.2) | (1.04 , 1.2) | (1.01 , 1.18) | (1.02 , 1.18) | (1.02 , 1.18) | |||||||||||||||||||||
| Grade IV | 1 | 0.99 | 1 | 0.98 | 0.97 | 0.97 | 1.01 | 1.01 | 1.02 | 0.96 | 0.95 | 0.95 | ||||||||||||||||||||
| (.72 , 1.39) | (.71 , 1.37) | (.72 , 1.39) | (.7 , 1.38) | (.69 , 1.36) | (.68 , 1.37) | (.72 , 1.41) | (.72 , 1.42) | (.72 , 1.42) | (.68 , 1.37) | (.67 , 1.35) | (.67 , 1.34) | |||||||||||||||||||||
| Unknown | 0.95 | 0.94 | 0.94 | 0.95 | 0.95 | 0.95 | 0.94 | 0.94 | 0.94 | 0.94 | 0.94 | 0.94 | ||||||||||||||||||||
| (.85 , 1.06) | (.85 , 1.05) | (.85 , 1.06) | (.85 , 1.06) | (.85 , 1.06) | (.85 , 1.06) | (.84 , 1.05) | (.84 , 1.05) | (.84 , 1.04) | (.85 , 1.05) | (.84 , 1.05) | (.84 , 1.04) | |||||||||||||||||||||
| Grade I | 0.92** | 0.92** | 0.93** | 0.93* | 0.93* | 0.93* | 0.92** | 0.93** | 0.93* | 0.93* | 0.93* | 0.93* | ||||||||||||||||||||
| (.85 , 1.) | (.86 , 1.) | (.86 , 1.) | (.86 , 1.) | (.86 , 1.) | (.86 , 1.) | (.86 , 1.) | (.86 , 1.) | (.86 , 1.) | (.86 , 1.) | (.86 , 1.) | (.86 , 1.) | |||||||||||||||||||||
| Marital status (reference: Divorced) | ||||||||||||||||||||||||||||||||
| Married | 0.96 | 0.96 | 0.96 | 0.96 | 0.96 | 0.96 | 0.95 | 0.95 | 0.95 | 0.96 | 0.96 | 0.97 | ||||||||||||||||||||
| (.88 , 1.05) | (.88 , 1.06) | (.88 , 1.06) | (.88 , 1.05) | (.88 , 1.06) | (.88 , 1.06) | (.86 , 1.04) | (.86 , 1.04) | (.86 , 1.04) | (.88 , 1.05) | (.88 , 1.06) | (.88 , 1.06) | |||||||||||||||||||||
| Single | 0.98 | 0.98 | 0.98 | 0.98 | 0.98 | 0.99 | 0.96 | 0.95 | 0.95 | 0.96 | 0.97 | 0.97 | ||||||||||||||||||||
| (.87 , 1.1) | (.87 , 1.1) | (.87 , 1.1) | (.87 , 1.1) | (.87 , 1.11) | (.88 , 1.11) | (.85 , 1.08) | (.85 , 1.07) | (.84 , 1.07) | (.85 , 1.08) | (.86 , 1.09) | (.86 , 1.09) | |||||||||||||||||||||
| Unknown | 0.98 | 0.99 | 0.99 | 0.99 | 1 | 1 | 0.98 | 0.98 | 0.98 | 0.97 | 0.98 | 0.98 | ||||||||||||||||||||
| (.84 , 1.15) | (.85 , 1.16) | (.85 , 1.16) | (.84 , 1.16) | (.85 , 1.16) | (.85 , 1.16) | (.84 , 1.15) | (.83 , 1.15) | (.83 , 1.14) | (.83 , 1.14) | (.84 , 1.14) | (.84 , 1.14) | |||||||||||||||||||||
| Widowed | 0.98 | 0.98 | 0.99 | 0.98 | 0.99 | 0.99 | 0.96 | 0.96 | 0.96 | 0.97 | 0.98 | 0.98 | ||||||||||||||||||||
| (.87 , 1.1) | (.88 , 1.11) | (.88 , 1.12) | (.88 , 1.11) | (.88 , 1.11) | (.88 , 1.11) | (.85 , 1.08) | (.85 , 1.08) | (.86 , 1.08) | (.87 , 1.09) | (.87 , 1.1) | (.87 , 1.1) | |||||||||||||||||||||
| Tumor size (reference: up to 1cm) | ||||||||||||||||||||||||||||||||
| >1cm & <=2cm | 0.99 | 0.99 | 0.99 | 1 | 1 | 0.99 | 0.99 | 0.99 | 0.99 | 1.01 | 1.01 | 1 | ||||||||||||||||||||
| (.89 , 1.1) | (.89 , 1.1) | (.89 , 1.1) | (.9 , 1.11) | (.9 , 1.11) | (.89 , 1.1) | (.9 , 1.1) | (.89 , 1.09) | (.89 , 1.1) | (.91 , 1.12) | (.91 , 1.12) | (.9 , 1.11) | |||||||||||||||||||||
| >2cm | 1.02 | 1.02 | 1.02 | 1.02 | 1.02 | 1.02 | 1.02 | 1.01 | 1.02 | 1.03 | 1.02 | 1.03 | ||||||||||||||||||||
| (.91 , 1.14) | (.91 , 1.14) | (.91 , 1.15) | (.91 , 1.14) | (.91 , 1.14) | (.91 , 1.14) | (.91 , 1.14) | (.91 , 1.13) | (.91 , 1.13) | (.92 , 1.15) | (.92 , 1.15) | (.92 , 1.15) | |||||||||||||||||||||
| Unknown | 0.87 | 0.85 | 0.81 | 0.88 | 0.86 | 0.8 | 0.84 | 0.82 | 0.81 | 0.76 | 0.75 | 0.75 | ||||||||||||||||||||
| (.49 , 1.55) | (.47 , 1.57) | (.45 , 1.47) | (.49 , 1.56) | (.47 , 1.57) | (.45 , 1.45) | (.48 , 1.47) | (.47 , 1.44) | (.46 , 1.42) | (.42 , 1.38) | (.41 , 1.39) | (.41 , 1.36) | |||||||||||||||||||||
| Tumor histology (reference: squamous cell) | ||||||||||||||||||||||||||||||||
| Adenomas | 0.94 | 0.95 | 0.94 | 0.94* | 0.94 | 0.94 | 0.94* | 0.94 | 0.94 | 0.93* | 0.93* | 0.93* | ||||||||||||||||||||
| (.87 , 1.01) | (.88 , 1.02) | (.88 , 1.02) | (.87 , 1.01) | (.87 , 1.01) | (.87 , 1.01) | (.87 , 1.01) | (.87 , 1.01) | (.87 , 1.01) | (.87 , 1.01) | (.87 , 1.01) | (.87 , 1.01) | |||||||||||||||||||||
| Age at diagnosis | 1.01*** | 1.01*** | 1.01*** | 1.01*** | 1.01*** | 1.01*** | 1.01*** | 1.01*** | 1.01*** | 1.01*** | 1.01*** | 1.01*** | ||||||||||||||||||||
| (1 , 1.01) | (1 , 1.01) | (1 , 1.01) | (1 , 1.01) | (1 , 1.01) | (1 , 1.01) | (1 , 1.01) | (1 , 1.01) | (1 , 1.01) | (1 , 1.01) | (1 , 1.01) | (1 , 1.01) | |||||||||||||||||||||
| Insurance type (reference: Only Medicaid) | ||||||||||||||||||||||||||||||||
| Only Medicare | 0.93 | 0.93 | 0.95 | 0.94 | 0.94 | 0.95 | 0.94 | 0.94 | 0.95 | 0.92 | 0.92 | 0.92 | ||||||||||||||||||||
| (.81 , 1.07) | (.81 , 1.08) | (.82 , 1.1) | (.82 , 1.08) | (.82 , 1.08) | (.82 , 1.09) | (.82 , 1.09) | (.82 , 1.09) | (.83 , 1.1) | (.8 , 1.06) | (.79 , 1.06) | (.8 , 1.06) | |||||||||||||||||||||
| Only private | 0.97 | 0.97 | 0.99 | 0.97 | 0.96 | 0.97 | 1 | 0.99 | 1 | 0.95 | 0.94 | 0.95 | ||||||||||||||||||||
| (.84 , 1.12) | (.84 , 1.12) | (.85 , 1.14) | (.84 , 1.11) | (.84 , 1.11) | (.84 , 1.12) | (.87 , 1.15) | (.86 , 1.14) | (.87 , 1.15) | (.82 , 1.09) | (.82 , 1.09) | (.82 , 1.1) | |||||||||||||||||||||
| Uninsured | 1.27 | 1.31* | 1.35* | 1.17 | 1.19 | 1.22 | 1.22 | 1.23 | 1.22 | 1.15 | 1.17 | 1.2 | ||||||||||||||||||||
| (.92 , 1.76) | (.95 , 1.81) | (.98 , 1.86) | (.85 , 1.61) | (.87 , 1.64) | (.89 , 1.67) | (.89 , 1.68) | (.9 , 1.69) | (.89 , 1.68) | (.83 , 1.58) | (.86 , 1.61) | (.87 , 1.64) | |||||||||||||||||||||
| Unknown | 1.05 | 1.07 | 1.11 | 0.93 | 0.96 | 0.99 | 1.07 | 1.09 | 1.11 | 0.98 | 0.98 | 1.02 | ||||||||||||||||||||
| (.8 , 1.37) | (.82 , 1.4) | (.84 , 1.45) | (.71 , 1.21) | (.73 , 1.25) | (.76 , 1.29) | (.83 , 1.39) | (.84 , 1.41) | (.86 , 1.44) | (.74 , 1.28) | (.75 , 1.29) | (.77 , 1.34) | |||||||||||||||||||||
| Rural-Urban continuum (reference: Large central metro) | ||||||||||||||||||||||||||||||||
| Large fringe metro | 0.84 | 0.93 | 0.99 | 0.98 | 1.16 | 1.24 | 0.57 | 0.55 | 0.62 | 0.86 | 0.91 | 0.95 | ||||||||||||||||||||
| (.26 , 2.67) | (.28 , 3.12) | (.28 , 3.56) | (.34 , 2.84) | (.4 , 3.38) | (.41 , 3.78) | (.19 , 1.72) | (.18 , 1.66) | (.2 , 1.89) | (.29 , 2.58) | (.3 , 2.8) | (.29 , 3.12) | |||||||||||||||||||||
| Medium metro | 0.10*** | 0.07*** | 0.09*** | 0.11*** | 0.10*** | 0.14*** | 0.16*** | 0.15*** | 0.20*** | 0.12*** | 0.12*** | 0.20*** | ||||||||||||||||||||
| (.04 , .27) | (.03 , .2) | (.03 , .27) | (.04 , .3) | (.03 , .28) | (.05 , .42) | (.06 , .4) | (.06 , .4) | (.07 , .56) | (.05 , .31) | (.05 , .34) | (.07 , .58) | |||||||||||||||||||||
| Non-metropolitan | 0.45* | 0.46 | 1.14 | 0.53 | 0.64 | 1.92 | 0.23*** | 0.24*** | 0.32** | 0.37** | 0.36** | 0.70 | ||||||||||||||||||||
| (.18 , 1.1) | (.17 , 1.21) | (.37 , 3.53) | (.21 , 1.29) | (.24 , 1.68) | (.64 , 5.82) | (.1 , .56) | (.09 , .61) | (.11 , .95) | (.15 , .87) | (.14 , .91) | (.24 , 2.02) | |||||||||||||||||||||
| pvalue: * <0.1, ** <0.05, *** <0.01 | ||||||||||||||||||||||||||||||||
Disclaimer/Publisher’s Note: The statements, opinions and data contained in all publications are solely those of the individual author(s) and contributor(s) and not of MDPI and/or the editor(s). MDPI and/or the editor(s) disclaim responsibility for any injury to people or property resulting from any ideas, methods, instructions or products referred to in the content. |
© 2025 by the authors. Licensee MDPI, Basel, Switzerland. This article is an open access article distributed under the terms and conditions of the Creative Commons Attribution (CC BY) license (http://creativecommons.org/licenses/by/4.0/).
Copyright: This open access article is published under a Creative Commons CC BY 4.0 license, which permit the free download, distribution, and reuse, provided that the author and preprint are cited in any reuse.


