
Submitted:
22 May 2025
Posted:
26 May 2025
You are already at the latest version
Abstract
Miniaturization of measurement systems offers several advantages, including reduced sample and reagent volumes, improved control over experimental conditions, and the ability to multiplex complementary measurement modalities, thereby enabling new types of studies in microbial electrochemistry. We present a scalable glass-based microfluidic bioelectrochemical cell (µ-BEC) platform for multiplexed investigations of microbial extracellular electron uptake (EEU). The platform integrates eight independently addressable three-electrode cells in a 2×4 array, with transparent working electrodes that support simultaneous electrochemical analysis and optical imaging. Using Rhodopseudomonas palustris TIE-1 as a model phototroph, we measured EEU activity under light-dark cycling. Microfluidic flow was used to selectively remove planktonic cells, enabling isolation of the electron uptake signal associated with surface attached cells. These results demonstrate the µ-BEC as a robust and adaptable platform for probing microbial electron transfer, with broad potential for high-throughput and multimodal studies.
Keywords:
glass microfluidics
; scalable microfluidics
; microfluidic bioelectrochemical cell
; extracellular electron uptake
; Rhodopseudomonas palustris TIE-1
Introduction
Most life forms rely on oxidation-reduction (redox) reactions for energy generation, with the transfer of electrons between donor and acceptor chemical species at the core of this process. Microbes source the electrons needed for their metabolic processes from the environment via direct or indirect means. While most microbes utilize soluble electron donors or acceptors, in environments where they are limited, some microbes have evolved the ability to transfer electrons to or from external solids, through a process known as extracellular electron transfer (EET). This adaptation enables microbes to access critical energy resources in otherwise inhospitable redox-limited environments such as deep marine sediments, anoxic soils, and mineral-rich subsurfaces[1,2]. EET is bidirectional and can be classified based on the direction of electron flow. In reductive extracellular electron transfer (rEET), electrons are transported out of the cell to reduce external solid-phase electron acceptors. This form of EET is analogous to respiration, where the solidphase material serves as the terminal electron acceptor. Geobacter sulfurreducens[3] are examples of microbes capable of reducing Fe(III) oxides. Conversely, extracellular electron uptake (EEU) involves the flow of electrons into the cell from external solid-phase electron donors. Photoautotrophic bacteria, such as Rhodopseudomonas palustris[4], can couple EEU with CO₂ fixation allowing them to synthesize biomass from inorganic carbon.
EET has far-reaching significance in both ecological and biotechnological contexts. In natural systems, it plays a crucial role in microbial energy flow and biogeochemical cycling, particularly in anoxic and nutrient-limited environments[2]. Beyond its ecological importance, EET has substantial potential for applications in biotechnology and sustainable development. Microbes capable of EET are instrumental in bioremediation, where they facilitate the removal or immobilization of environmental pollutants. For example, species like Geobacter can reduce and immobilize toxic metals such as uranium[5,6] by transferring electrons to insoluble electron acceptors. Microbial fuel cells (MFCs) harness rEET to generate electricity from organic substrates. In these systems, microbes oxidize organic matter and transfer electrons to an anode, generating electrical current as a renewable energy source[7,8]. Microbial electrosynthesis (MES) represents another significant application of EET, specifically EEU. In MES systems, microbes use electrons from a cathode to reduce carbon dioxide into value-added bioproducts, including biofuels, bioplastics, and specialty chemicals[9,10,11]. Photoautotrophic microbes like Rhodopseudomonas palustris can couple EEU with light-driven carbon fixation, creating carbon neutral pathways to produce sustainable bioproducts[12].
Miniaturized electrochemical platforms have been developed to address the limitations of traditional reactors in the study of EET, which typically lack compatibility with multiplexing or high-resolution imaging. Examples include paper-based microbial fuel cell arrays[13,14,15], flexible textile-based systems[16,17,18], and PDMS-based microfluidic devices[19,20,21,22]. CNT-modified electrodes have improved biofilm-electrode interactions in confined systems[23,24], while integrated LED-based circuits have simplified electrogenicity screening in resource-limited settings[23].
Here, we report on a scalable glass-based microfluidic bioelectrochemical cell (µ-BEC) platform designed for multiplexed EEU measurements. The µ-BEC integrates eight three-electrode cells in a 2×4 layout with transparent working electrodes and microfluidic control, allowing simultaneous imaging and electrochemical analysis. We used Rhodopseudomonas palustris TIE-1 as a model organism to characterize EEU activity in response to light and assess the impact of planktonic versus biofilm-associated cells. Experiments in the µ-BEC confirmed light-dependent EEU in TIE-1 and enabled isolation of biofilm-specific electron uptake by removing planktonic cells through controlled microfluidic flow. These findings demonstrate the platform’s suitability for investigating phototrophic EEU and validate its potential for use in high-throughput and mechanistic studies.
Materials and Methods
Electrode Array Lithography, Deposition, Lift-Off and Annealing
Electrode-support layers were fabricated on 100-mm diameter, 500-µm thick borosilicate glass wafers (University Wafer, Boston, MA, USA). Prior to each lithography step, wafers were cleaned sequentially with acetone, methanol, and isopropanol, dried under nitrogen flow, and placed on a 120°C hot plate for 15 minutes to eliminate residual moisture. A layer of KL8020 HMDS Spin-On Primer (KemLab™, Livermore, CA, USA) was spin-coated (Apogee® Spin Coater, Cost Effective Equipment LLC, Rolla, MO, USA) and soft-baked for 3 minutes at 115°C to promote photoresist adhesion. Subsequently, LOR 10B (Kayaku Advanced Materials Inc., Westborough, MA, USA) and Microposit™ S1805™ (Kayaku Advanced Materials Inc., Westborough, MA, USA) were sequentially spin-coated to thicknesses of 1.5 µm and 0.6 µm and soft-baked for 10 minutes at 195°C and 1 minute at 115°C respectively. Electrode patterns were exposed by direct laser writing (DWL 66+, Heidelberg Instruments Mikrotechnik GmbH, Heidelberg, Germany) and developed using Microposit™ MFR-319 developer (Kayaku Advanced Materials Inc., Westborough, MA, USA). Residual photoresist was removed from the electrode areas by a 10-second exposure to a 100-Watt ozone plasma (PE-50 Plasma Asher, Plasma Etch Inc., Carson City, NV, USA) prior to thin-film deposition.
Counter electrodes and alignment marks were patterned and deposited by thermally evaporating a 20-nm thick chromium adhesion layer followed by a 250-nm thick gold layer (AUTO 306 Vacuum Coater, Edwards Vacuum, West Sussex, UK). Working electrodes were patterned and deposited by magnetron sputtering a 250-nm thick indium tin oxide (ITO) film (PVD 75, Kurt J. Lesker, Jefferson Hills, PA, USA). Pseudoreference electrodes were deposited through the sequential magnetron sputtering (PVD 75, Kurt J. Lesker, Jefferson Hills, PA, USA) of a 30-nm thick titanium adhesion layer and a 1000-nm thick silver layer. After each electrode deposition, lift-off was performed by immersion in a 65°C Remover PG bath (Kayaku Advanced Materials Inc., Westborough, MA, USA) for 1 hour, followed by transfer to a fresh room-temperature Remover PG bath for a minimum of 12 hours. Wafers were vacuum annealed at pressures below 1 × 10⁻⁶ Torr and 320°C for 30 minutes and cooled to room temperature under argon atmosphere (20 mTorr, 220 sccm) to enhance electrode adhesion and reduce working electrode sheet resistance.
Chlorination of the Pseudoreference Electrodes
The pseudoreference electrodes were further modified to contain a silver chloride (AgCl) layer through solution-based chlorination method. To protect the working and counter electrodes during chlorination, a layer of AZ P4620 photoresist (MicroChemicals GmbH, Ulm, Germany) was spin-coated and patterned to expose only the pseudoreference electrode surfaces. Exposed pseudoreference electrodes were cleaned in 10% hydrochloric acid (HCl), followed by chlorination in a 50 mM ferric chloride (FeCl₃) aqueous solution for 50 seconds, a stabilization step in a 3.5 M potassium chloride (KCl) aqueous solution for 5 seconds, and rinsing in deionized water. The protective AZ P4620 photoresist was subsequently removed by sequential washing in acetone, methanol, and isopropanol, and dried under nitrogen flow.
Application of a Patterned Proton Exchange Thin-Film Membrane on the Reference Electrode Surface
Pseudoreference electrodes were coated with a protective Nafion™ layer using a sacrificial polydimethylsiloxane (PDMS) microfluidic channel designed to selectively expose only the pseudoreference electrode surface while shielding the working and counter electrodes. PDMS channels were fabricated using a standard soft lithography process. SU-8 2100 photoresist (Kayaku Advanced Materials Inc., Westborough, MA, USA) was spin-coated to a 100-µm thickness and patterned to form a replica mold according to vendor-recommended parameters. The mold was silanized under vacuum for 12 hours using 1H,1H,2H,2H-Perfluorooctyltriethoxysilane (Sigma-Aldrich, St. Louis, MO, USA) to facilitate PDMS release. A 10:1 (base:curing agent) mixture of PDMS (SYLGARD™ 184 Silicone Elastomer Kit, Dow, Midland, MI, USA) was cast over the SU-8 mold and cured at room temperature for 48 hours on a level surface. Cured PDMS layers were cut to the desired dimensions, and 1-mm diameter inlet and outlet holes were created using a biopsy punch. PDMS channels were aligned to the electrode layer and brought into conformal contact. A 0.5% (w/w) Nafion™ solution diluted in 200 proof ethanol (Nafion™ 117 solution, Sigma-Aldrich, St. Louis, MO, USA) was introduced into the microfluidic channel inlet using a micropipette. After filling, the device was placed under vacuum inside a desiccator for 15 minutes to allow solvent evaporation, after which the PDMS channel was removed.
Microfluidic Channel Fabrication
Glass channels were fabricated from 100 mm × 100 mm, 1.5-mm thick soda-lime glass/chromium mask blanks (Telic Co., Santa Clarita, CA, USA). Mask blanks were precoated with a 5300-Å thick AZ1500 positive photoresist (Telic Co., Santa Clarita, CA, USA), and channel patterns were written using direct laser writing (DWL 66+, Heidelberg Instruments Mikrotechnik GmbH, Heidelberg, Germany). The exposed photoresist was developed for 120 seconds in an AZ® 400K developer bath (MicroChemicals GmbH, Ulm, Germany). Exposed chromium layers were etched using chrome etchant, and channels were isotropically etched to a depth of 100 µm using a solution of 49% (w/w) hydrofluoric acid (HF), 69% (w/w) nitric acid (HNO₃), and deionized water in a volumetric ratio of 2:1:6. Residual photoresist was removed by exposure to a 100-Watt oxygen plasma for 10 minutes (PE-50 Asher, Plasma Etch Inc., Carson City, NV, USA), followed by the removal of remaining chromium using chrome etchant.
Device Bonding and Packaging
Single electrode array devices and microfluidic channels were diced to final dimensions using a dicing saw (DAD 323, Disco Corporation, Tokyo, Japan). Inlet and outlet holes with a 1-mm diameter were drilled into the channel layers using diamond-coated glass drill bits. Electrode arrays and channel substrates were cleaned by sonication in an acetone bath for 3 minutes, followed by sequential rinsing with methanol, isopropanol, and deionized water. Residual moisture was removed by drying under nitrogen flow and placing the substrates on a 120°C hot plate for 15 minutes. Device layers were bonded using a stamp and stick method with a UV-curable adhesive (NOA 61, Norland Products, East Windsor, NJ, USA). Adhesive was spin-coated onto a 75-mm diameter, 500-µm thick silicon transfer wafer (University Wafer, Boston, MA, USA) at a spreading speed of 500 RPM for 10 seconds and a spin speed of 6000 RPM for 30 seconds (CEE 200X Spin Coater, Brewer Science, Rolla, MO, USA). A mask aligner (MJB3 UV 400, Karl Suss, Germany) was used to stamp the adhesive onto the channel layer, align the device layers, bring them into contact, and expose the adhesive to a UV dosage of 3 J cm⁻². The bonded devices were cured on a 60°C hot plate for 45 minutes followed by curing at room temperature for 72 hours.
Microfluidic Channel and Electrode Interfacing
Microfluidic adapters (Stand Alone Olive Fluidic 630, Microfluidic ChipShop) were glued on top of the inlet and outlet holes using an adhesive ring (Adhesive Ring Fluidic 699, Microfluidic ChipShop) and sealed with epoxy resin, followed by curing at room temperature for at least 24 hours. The assembled devices are then mounted in a custom-designed microscopy-compatible metal-plastic holder that offers individually accessible connections to each electrode lead on the microfluidic device electrode layer via pogo-pins (825 spring-loaded pogo pin header strip, Mill-Maxx).
Open Circuit Potential Measurements of the Pseudoreference Electrodes
Single pseudoreference electrodes were fabricated following the same procedures and materials as the 2 × 4 device arrays and diced to final dimensions of 20 mm × 20 mm. Titanium wires (Ultra-Corrosion-Resistant Grade 2 Titanium Wire, 0.025-inch diameter, McMaster-Carr, Elmhurst, IL, USA) were cut to length and bonded to the contact pads using silver epoxy (8331 Silver Conductive Epoxy Adhesive, MG Chemicals, Ontario, Canada) to form electrical connections to the pseudoreference electrode leads. The stability of four pseudoreference electrodes was evaluated by measuring their open circuit potential over 120 hours using a multi-channel potentiostat (PalmSens4 with MUX8-R2 Multiplexer, PalmSens, Houten, Netherlands) versus Ag/AgCl/3 M KCl reference electrodes (BASi Research Products, West Lafayette, IN, USA) in anoxic freshwater media bubbled with 50 kPa of 80% nitrogen and 20% carbon dioxide mixed gas. Measurements were conducted inside a Faraday cage.
Potential Calibration of the Pseudoreference Electrodes
Single three-electrode electrochemical cells were fabricated following the same procedures and materials as the 2 × 4 device arrays and diced to final dimensions of 20 mm × 20 mm. Titanium wires (Ultra-Corrosion-Resistant Grade 2 Titanium Wire, 0.025-inch diameter, McMaster-Carr, Elmhurst, IL, USA) were cut to length and bonded to the contact pads using silver epoxy (8331 Silver Conductive Epoxy Adhesive, MG Chemicals, Ontario, Canada) to establish electrical connections to the electrode leads. Single three-electrode cells were inserted into 100-mL bulk reactors along with standard Ag/AgCl/3 M KCl reference electrodes (BASi Research Products, West Lafayette, IN, USA). The ferricyanide/ferrocyanide redox couple was used as an internal redox standard by preparing a 1 mM potassium ferricyanide/potassium ferrocyanide solution in freshwater media. Cyclic voltammograms were recorded at a scan rate of 10 mV s⁻¹ using a multi-channel potentiostat (PalmSens4 with MUX8-R2 Multiplexer, PalmSens, Houten, Netherlands) versus both the Ag/AgCl/Nafion pseudoreference electrode and standard Ag/AgCl/3M KCl reference electrodes. Measurements were performed in both freshwater media for background current measurement and ferri/ferrocyanide solutions. All solutions were bubbled with a 50 kPa of 80% nitrogen and 20% carbon dioxide mixed gas for 90 minutes to remove dissolved oxygen. Experiments were conducted inside a Faraday cage to minimize background noise. Three independent samples were tested, with three repeated cyclic voltammetry measurements performed for each sample under each testing condition. Cyclic voltammogram data were analyzed using PSTrace Software (PalmSens), and oxidation and reduction peaks were identified after subtracting the average background current from the ferri/ferrocyanide cyclic voltammograms. The electrode potential was calibrated by measuring the difference in half-wave potentials between the pseudoreference electrodes and the standard Ag/AgCl/3M KCl reference electrodes.
Electrochemical Characterization of the µ-BEC Platform
The µ-BEC platform was electrochemically characterized using the ferricyanide/ferrocyanide redox couple ([Fe(CN)₆]³⁻/[Fe(CN)₆]⁴⁻) as an internal redox standard. Aqueous solutions of 1 mM potassium ferricyanide/potassium ferrocyanide in 1 M KCl and a separate 1 M KCl solution for background current measurements were prepared. Both solutions were bubbled with 50 kPa of 80% nitrogen and 20% carbon dioxide mixed gas for 60 minutes to remove dissolved oxygen. To eliminate trapped air within the microfluidic platform, 1 mL of isopropyl alcohol was initially introduced at a flow rate of 10 µL s⁻¹ using a microfluidic pump (KD Scientific, Holliston, MA, USA). This was followed by 2.5 mL of 1 M KCl solution at a flow rate of 1 µL s⁻¹ for background current measurement. Cyclic voltammograms were recorded under no-flow conditions using a multi-channel potentiostat (PalmSens4 with MUX8-R2 Multiplexer, PalmSens, Houten, Netherlands) with the µ-BEC device mounted on the microscope stage inside a Faraday cage. Scan rates of 5, 10, 15, 20, and 25 mV s⁻¹ were used, with three repeated measurements per scan rate. Between each measurement, 10 µL of fresh KCl solution was loaded at 1 µL s⁻¹. Following background measurements, 2.5 mL of 1 mM potassium ferricyanide/potassium ferrocyanide in 1 M KCl was introduced at a flow rate of 1 µL min⁻¹, and cyclic voltammetry was repeated under identical scan rate and loading conditions.
Cyclic voltammogram data were analyzed using PSTrace Software (PalmSens). Oxidation and reduction peaks were identified using the Autodetect Peaks function after subtraction of the average background current from the ferri/ferrocyanide voltammograms. Further data analysis and statistical processing were performed using Microsoft Excel (Microsoft Corporation, Redmond, WA, USA) and MATLAB (MathWorks, Natick, MA, USA). Linear regression analysis was used to evaluate the dependence of peak current on the square root of scan rate.
Culture and Characterization of the Model EEU Organism Rhodopseudomonas palustris TIE-1 Inside the µ-BEC Platform
Isopropyl alcohol, ethyl alcohol, and basal freshwater medium were prepared in sterile glass serum bottles and purged with 50 kPa of 80% nitrogen and 20% carbon dioxide for 30 minutes prior to use. The µ-BEC platform was loaded inside an anaerobic chamber using a syringe pump (KD Scientific, Holliston, MA, USA) with 1 mL of isopropyl alcohol at a flow rate of 10 µL s⁻¹ to remove trapped gas bubbles, followed by 2.5 mL of ethyl alcohol for sterilization. The platform was left to sit with the ethyl alcohol solution for 30 minutes, after which it was flushed with 2.5 mL of purged freshwater medium at a flow rate of 10 µL s⁻¹.
Cyclic voltammograms were recorded using a multi-channel potentiostat (PalmSens4 with MUX8-R2 Multiplexer, PalmSens, Houten, Netherlands) under both illuminated and dark conditions. Illumination was provided by a 60 W incandescent light bulb positioned 25 cm above the platform. Rhodopseudomonas palustris TIE-1 cells were cultured photoautotrophically in freshwater medium with 80% hydrogen and 20% carbon dioxide in sealed sterile glass serum bottles at 30°C with illumination from a 60 W incandescent light bulb positioned 25 cm above the bottles. Cultures were harvested at an optical density of 1.5 (OD₆₆₀ = 1.5), centrifuged at 5000 × g, washed three times with basal freshwater medium, and resuspended to a final optical density of 5.5 (OD₆₆₀ = 5.5). Prior to inoculation, the cell suspension was purged with 5 kPa of 80% nitrogen and 20% carbon dioxide for 30 minutes.
Approximately 0.5 mL of concentrated TIE-1 culture was loaded into the µ-BEC platform inside the anaerobic chamber at a flow rate of 10 µL min⁻¹. Cyclic voltammograms were recorded at 10 mV s⁻¹ under both illuminated and dark conditions. Following initial measurements, the working electrodes were poised at +100 mV vs. SHE for approximately 96 hours under continuous illumination from a 60 W incandescent light bulb positioned 25 cm above the platform to facilitate biofilm formation. After the incubation period, light on/off chronoamperometry experiments were performed in 30-second intervals over a 300-second total duration with three repeated measurements per electrochemical cell. Cyclic voltammograms were then recorded again under both illuminated and dark conditions at 10 mV s⁻¹.
After electrochemical characterization, unattached and planktonic cells were removed by flushing the platform with approximately 0.5 mL of freshwater medium (pre-purged with 5 kPa of 80% nitrogen and 20% carbon dioxide for 30 minutes) at a flow rate of 10 µL min⁻¹ inside the anaerobic chamber. Final cyclic voltammograms and light on/off chronoamperometry measurements were recorded as described previously.
Cyclic voltammetry data were analyzed using PSTrace Software (PalmSens). The average background current obtained in abiotic freshwater medium was subtracted from the inoculated voltammograms. Data were smoothed using the software’s smoothing function set to the high smoothing factor. Oxidation and reduction peaks were identified using the Autodetect Peaks function. Chronoamperometry data were analyzed using MATLAB (MathWorks, Natick, MA, USA).
Brightfield transmitted light images of each µ-BEC unit were acquired using an inverted microscope (Axio Observer Z.1, Zeiss, Oberkochen, Germany) equipped with a 2.5× objective (EC Plan-NEOFLUAR 2.5×/0.085 WD = 8.8 mm, Zeiss) at multiple time points: before cell inoculation, after inoculation, after the 96-hour incubation, and after planktonic cell removal.
Results and Discussion
Device Design and Fabrication
The final design of the µ-BEC platform consists of two primary components: a microfluidic channel layer and an electrode layer, both fabricated from glass to enable transmitted light optical imaging. Each device contains eight individual micro-bulk electrochemical cells (µ-BECs) arranged in a 2×4 format. A custom-designed, microscope-compatible metal and plastic holder was developed to provide individually addressable electrical connections to each electrode via spring-loaded pogo pins. Images of the fabricated layers and test assembly are shown in Figure 1.
Each µ-BEC unit consists of three concentric electrodes: a working electrode composed of indium tin oxide (ITO) to allow simultaneous electrochemical analysis and optical imaging, a gold counter electrode, and a silver pseudoreference electrode. All electrodes include chromium or titanium adhesion layers to promote film stability. The exposed surface areas of the working, counter, and pseudoreference electrodes were 1.96 mm², 5.93 mm², and 1.29 mm², respectively. These electrodes are enclosed within 4-mm diameter, 100-µm deep wells isotropically etched into the microfluidic channel layer. To enable efficient removal of planktonic cells during microbial experiments, each well is fluidically connected to its neighbors via 500-µm wide channels.
Electrode arrays were patterned using a lithography/metallization/lift-off approach adapted for microfabrication scalability and reproducibility. A two-step lift-off resist process was implemented to improve edge definition and avoid incomplete lift-off[25]. The undercut profile created by the lift-off resist inhibited the formation of continuous sidewall coverage during material deposition, particularly for sputtered films, and ensured clean removal of undesired material upon lift-off. The lift-off process was conducted via overnight immersion in remover solution without ultrasonication to avoid redeposition of detached materials, which can contaminate electrode surfaces and degrade performance. While more time-intensive, this method minimizes particle residue and preserves electrode integrity. Furthermore, an annealing step at 320°C was introduced for all electrodes to enhance adhesion, improve structural integrity, and reduce the risk of delamination[26].
The microfluidic wells and channels were created using wet-etching in fluorine-based chemistry. In this inherently isotropic etching technique, the exposed glass is theoretically removed equally in all directions and the initial masking pattern must take this into consideration when calculating the final dimensions. In addition to the hydrochloric acid, nitric acid was necessary to etch the lime (sodium oxide and calcium oxide) portion of the soda-lime glass. The roughness of the etched area is dependent on the concentration of the two acids, the solution stirring pattern and frequency, and the quality of the metal masking layer that can result in pin-hole defects[27,28]. The obtained etched channels had rough sidewalls that can result in gas bubble trapping, which can be mitigated in the future by ensuring better masking layer quality, using a lower etch rate, and switching to pure silicon dioxide (fused silica) as the support material[27,28,29].
The bonding of the two-layers required a method that does not oxidize, thermally stress, or cover/foul the electrode surface and is resistant to long exposures to aqueous solutions and allows for the sterilization of the device via ethanol-based solutions. Thus, plasma or high-temperature based techniques were not taken into consideration. Laser-cut polymer-based adhesive layers were tested; however, they were found to fail during the sterilization step or after exposing them to aqueous solutions over several hours. Additionally, the laser-cut adhesives had rough edges that resulted in debris detaching and fouling the electrode surfaces when the platforms were loaded with liquids. The stamp-and-stick method[30] allows for coating of the adhesive over only the glass channel non-etched area and is a method that relies on spreading of the adhesive between the two layers due to capillary forces. SU-8 2005 photoresist was initially tested, however due to the large contact area and worse wetting of the glass surface it was found to foul the surface of the electrodes before it spread uniformly across the regions that needed to be bonded. NOA 61 optical adhesive was tested and chosen due to its better affinity to the glass surfaces.
Chlorination of the Pseudoreference Electrodes
To enhance the stability of the silver pseudoreference electrodes, the electrodes were chemically chlorinated to form Ag/AgCl. Annealing conditions for improved adhesion[26] and the wet chlorination process[31] were adapted from previously reported methods for thin-film Ag/AgCl reference electrodes to ensure selective chlorination of only the pseudoreference electrode. Selectivity was achieved by applying a protective photoresist layer over the counter and working electrodes to prevent AgCl formation on these surfaces. Following chlorination, the protective photoresist was removed by sequential rinsing in acetone. The fabrication steps for the chlorination process are illustrated in Figure 2.
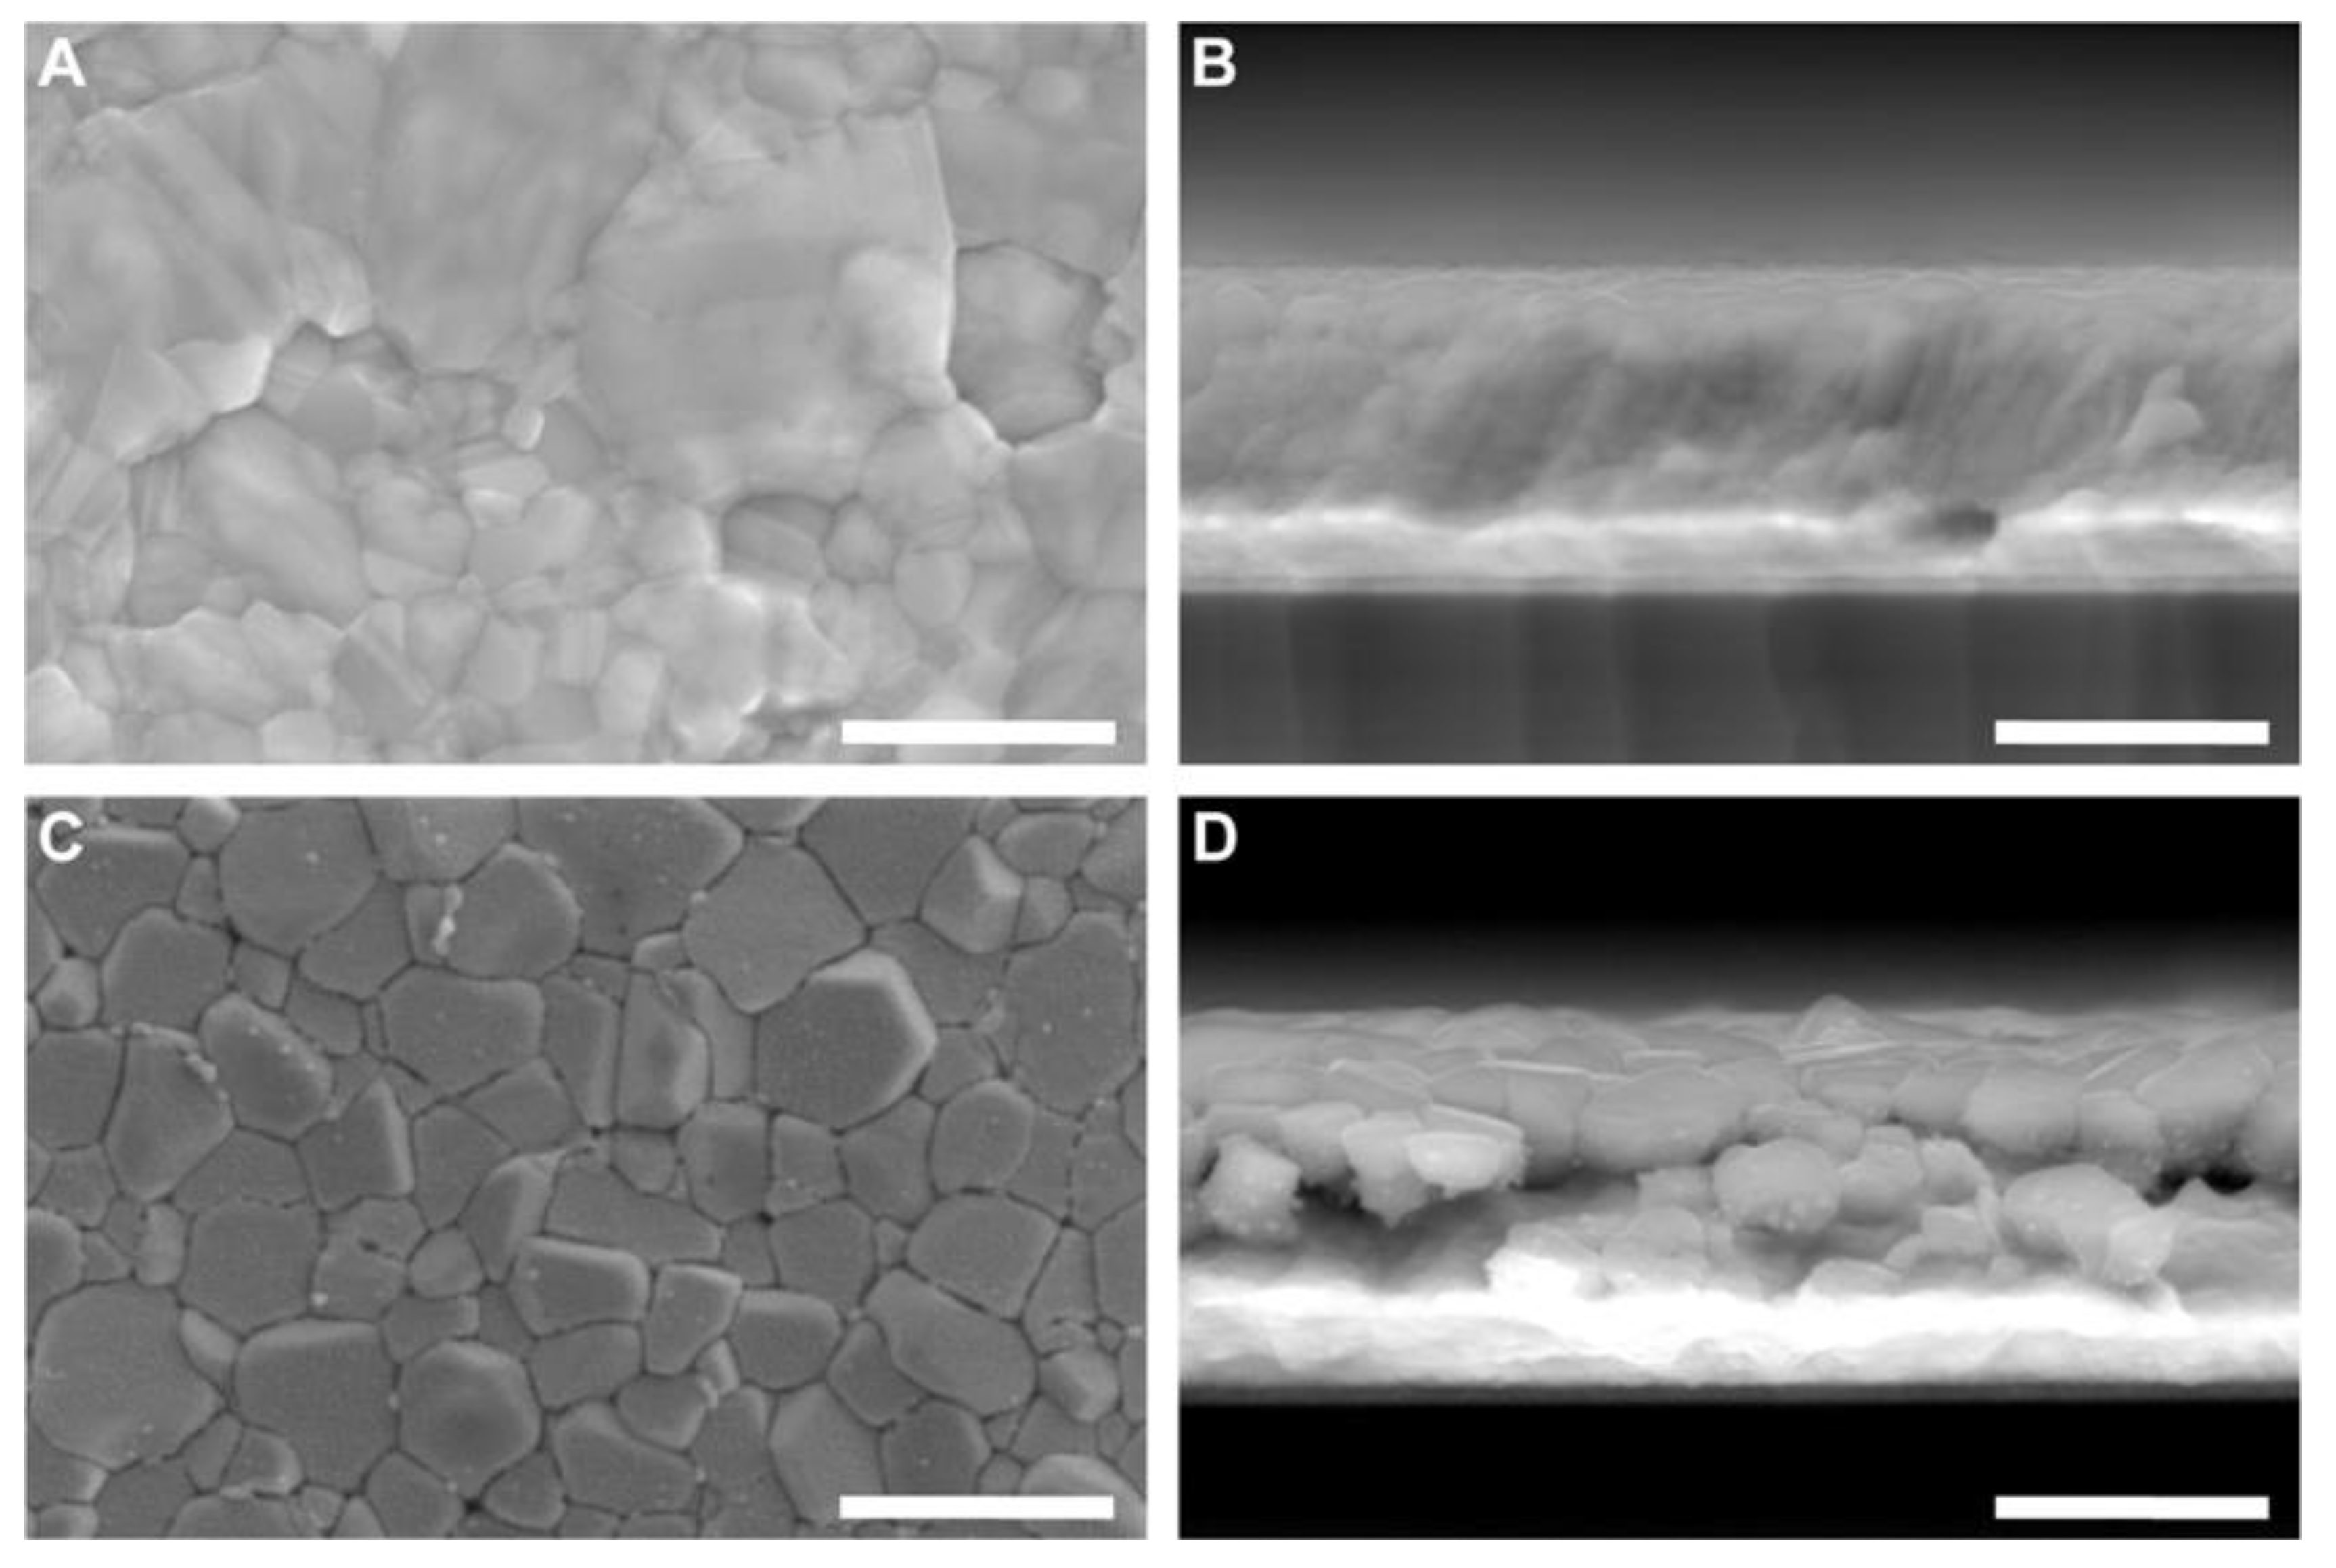
Scanning electron microscopy (SEM) images shown in Figure 3 depict the morphological changes of the pseudoreference electrodes before and after chlorination. Prior to chlorination, the silver surface exhibited a smooth morphology characteristic of thin-film Ag deposition. Post-chlorination, the surface displayed a granular AgCl structure, confirming successful conversion of silver to silver chloride. The observed surface morphology is consistent with previously reported chemically chlorinated Ag/AgCl electrodes[26,31].
Application of a Patterned Proton Exchange Thin-Film Membrane on the Reference Electrode Surface
To enhance the stability and longevity of the Ag/AgCl pseudoreference electrodes, a Nafion™ membrane was applied as a protective barrier. Nafion™, a cation-exchange polymer, minimizes AgCl dissolution while preserving electrochemical functionality. The use of polymeric coatings for thin-film pseudoreference electrodes has been previously demonstrated to prevent degradation and improve long-term stability[32].
For this study, a Nafion™ membrane deposition method based on drop-casting[26] was adapted to accommodate microfabricated, patterned electrodes. While conventional drop-casting is effective for macroscale electrodes, it is unsuitable for patterned microelectrode arrays, as it can lead to unintentional coating of adjacent electrodes and adversely affect electrochemical performance. To overcome this limitation, Nafion™ was selectively deposited onto the pseudoreference electrodes using a PDMS microfluidic channel.
SU-8 molds were fabricated to create PDMS microchannels with dimensions matched to the footprint of the pseudoreference electrode while excluding the working and counter electrodes. PDMS microchannels were aligned to and brought into conformal contact with the electrode layer, allowing localized confinement of the Nafion™ solution. This approach prevented solution spreading across the device and ensured that only the pseudoreference electrode was encapsulated within the polymer layer. Following Nafion™ introduction, the devices were placed under vacuum to facilitate solvent evaporation and membrane formation. Upon drying, the PDMS microchannels were carefully removed, leaving a well-defined Nafion™ membrane coating on the pseudoreference electrodes. The fabrication steps for Nafion™ membrane application are illustrated in Figure 2.
Figure 3.
Scanning electron microscope images of pseudoreference electrodes. before (A-B) and after (C-D) chemical chlorination. Scale bars correspond to 1 µm.
Figure 3.
Scanning electron microscope images of pseudoreference electrodes. before (A-B) and after (C-D) chemical chlorination. Scale bars correspond to 1 µm.
Testing the Stability of the Pseudoreference Electrodes
The stability of the pseudoreference electrodes was evaluated over a 120-hour period, corresponding to the typical incubation and testing duration for extracellular electron uptake (EEU)-capable bacteria previously reported in µ-BEC platforms[4,33]. Long-term potential stability is essential for ensuring reliable electrochemical measurements, as drift in electrode potential can introduce systematic errors and bias experimental outcomes. To assess pseudoreference electrode stability, open circuit potential (OCP) measurements were conducted in freshwater media against standard Ag/AgCl/3 M KCl reference electrodes. Results are presented in Figure 4.
The pseudoreference electrodes exhibited an average potential drift of –0.30 mV h⁻¹ with a standard deviation of 0.06 mV h⁻¹, corresponding to a coefficient of variation (CV) of 20.7%. This drift exceeded the 0.09 mV h⁻¹ reported in the reference study used for fabrication benchmarking[26], though the different testing media composition may have contributed to the observed discrepancy. Nonetheless, the measured drift falls within the midrange of values previously reported for Ag/AgCl pseudoreference electrodes[32].
The electrodes began at an average potential of 167 mV (standard deviation: 4.54 mV, CV: 2.7%) and concluded at 131 mV (standard deviation: 8.82 mV, CV: 6.7%), corresponding to a net potential change of –36 mV over the 120-hour testing period (standard deviation: 7.51 mV, CV: 21%). It is important to note that these measurements were performed relative to Ag/AgCl/3 M KCl reference electrodes, which themselves exhibit inter-electrode variability of approximately ±20 mV and intrinsic potential drift in solution. Consequently, a portion of the observed potential change may reflect instability in the reference electrode rather than the pseudoreference electrodes under test.
Potential Calibration of the Pseudoreference Electrodes
The calibration of Ag/AgCl pseudoreference electrodes was performed to establish a consistent reference potential for interpreting electrochemical measurements. This step was necessary due to previously reported variability in the potential of microfabricated Ag/AgCl pseudoreference electrodes relative to commercial Ag/AgCl reference electrodes, with differences ranging from 0 mV to 270 mV[32]. Calibration ensures that electrochemical data obtained from µ-BEC platforms can be referenced to standard electrochemical systems.
Calibration results are presented in Figure 5, which includes representative cyclic voltammograms and a comparison of half-wave potentials. Measurements were conducted sequentially in the same solution vessel using paired commercial and pseudoreference electrodes. Commercial Ag/AgCl/3 M KCl reference electrodes exhibited an average half-wave potential of 214 ± 0.58 mV (coefficient of variation: 0.27%), while microfabricated Ag/AgCl/NafionTM pseudoreference electrodes displayed an average half-wave potential of 174 ± 5.5 mV (coefficient of variation: 3.17%), corresponding to an average potential offset of –40 mV versus Ag/AgCl/3 M KCl.
Although ideal calibration would involve in situ measurement using the ferri/ferrocyanide redox couple both before and after biotic experiments to account for potential drift, this approach was not feasible due to limitations in the current µ-BEC design. As demonstrated in prior sections, the ferri/ferrocyanide redox probe irreversibly modifies the surface of the working electrodes, resulting in fouling. Additionally, the probe is toxic to microbial cells, precluding its use in live-cell experiments. While the fouling limitation could be mitigated by incorporating a dedicated calibration electrode into the system, addressing the cytotoxicity would require identification of a biocompatible redox standard. Despite these constraints, the low variability and drift observed in the pseudoreference electrode potentials suggest that the fabrication protocol—incorporating chemical chlorination and selective Nafion™ membrane deposition—yielded consistent and reliable reference electrodes for use in µ-BEC platforms.
Electrochemical Characterization of the µ-BEC Platform
Electrochemical characterization of the µ-BEC platform was performed using 1 mM of potassium ferri/ferrocyanide in 1 M KCl supporting electrolyte. To assess electrode stability under repeated cycling, three cyclic voltammograms (n = 3) were recorded for each scan condition.
Scan rate-dependent cyclic voltammograms are shown in Figure 6, with each subpanel corresponding to an individual µ-BEC unit. All tested cells exhibited well-defined, symmetric anodic and cathodic peaks that increased in magnitude with scan rate, characteristic of a diffusion-controlled, reversible redox couple.
Figure 7 presents cyclic voltammograms grouped by scan rate across all tested cells. As expected, peak currents increased with scan rate, and peak separation remained consistent. Average peak potential and current values for each cell (n = 3 cyclic voltammograms) are shown in Figure 8. Anodic and cathodic peak potentials remained stable across scan rates, with standard deviations of less than 6 mV and 2 mV, respectively. Anodic peak currents displayed greater variability than cathodic currents (standard deviation <0.42 µA vs. <0.11 µA), likely due to the oxidation process’s heightened sensitivity to surface heterogeneities and capacitive background effects on ITO electrodes[34]. Small variations in electrode morphology may result in broader anodic peaks and reduced current reproducibility. Trends in average peak potentials and currents are summarized in Table 1 and Table 2.
To further evaluate redox reversibility, Randles–Ševčík analysis was performed for each cell, with results shown in Figure 9. Anodic and cathodic peak currents exhibited a linear relationship with the square root of scan rate across all cells, with average R² values of 0.9989 and 0.9997 as displayed in Table 3. These results confirm that the redox process is predominantly diffusion controlled and that the µ-BEC platform exhibits reliable and predictable electrochemical behavior.
Coefficients of variation (CVs) for peak potentials and currents across four µ-BEC cells are reported in Table 4. CVs for peak potentials were low, averaging 1.73% for cathodic and 0.84% for anodic peaks, indicating consistent redox behavior and pseudoreference electrode performance across the platform. CVs for peak currents were higher (7.14% anodic, 2.27% cathodic), attributable to variations in the electroactive surface area of each working electrode. Such differences may result from microfluidic channel misalignment during device assembly or minor inconsistencies in ITO patterning or fouling. Despite these factors, the low variance in current and potential values confirms the platform’s suitability for reliable, repeatable electrochemical measurements and comparative analyses, comparable to other multi-electrode microfluidic systems.
Characterization of the Model EEU Organism Rhodopseudomonas palustris TIE-1 Inside the µ-BEC Platform
Rhodopseudomonas palustris TIE-1 was selected as the model organism for evaluating microbial EEU in the µ-BEC platform due to its previously demonstrated link between phototrophic EEU and carbon fixation[4]. TIE-1 served as a benchmark for assessing the reproducibility, resolution, and sensitivity of the µ-BEC platform developed in this work.
Figure 10 presents the chronoamperometric response of the platform over a 96-hour incubation period under continuous illumination at a poised potential of +100 mV vs. SHE. Across all four µ-BEC cells, current densities remained low and stable in the nanoampere range (~1–1.5 nA). A gradual shift toward more negative current values was observed over time, suggesting slow biofilm formation. Transient current spikes were attributed to external disturbances, such as brief openings of the Faraday cage during incubation.
Figure 11 and Figure 12 show the light on/off chronoamperometric responses across three repeated cycles, before and after planktonic cell removal. Shaded regions indicate light-off intervals, while illuminated periods are shown in white. All cells exhibited consistent negative shifts in current during light-on conditions, indicative of phototrophic EEU. Despite the low current magnitudes, the directional and repeatable light responses were preserved. After media replacement and removal of planktonic cells, a baseline shift in background current was observed across all cells (Figure 13), with light-off current density increasing by an average of 105.4 ± 21 nA cm⁻² (CV ~20%), likely due to changes in ionic strength or surface wetting behavior following medium exchange. This shift highlights the platform’s sensitivity to small environmental changes and underscores the importance of current normalization.
To enable comparison across cells, currents were normalized to each cell’s light-off baseline. The first light on/off cycle before and after planktonic cell removal is shown in Figure 14. After normalization, all cells exhibited light-induced current uptake, even following removal of planktonic cells. However, the magnitude of uptake was generally lower in the post-wash condition (Figure 15), indicating that loosely attached or suspended cells contributed to electron transfer in earlier measurements.
Brightfield transmitted light images of each µ-BEC cell are shown in Figure 16. Gas bubbles were observed in several wells, partially obstructing the working electrode surface. This obstruction likely reduced the effective electroactive area, contributing to variability in current density, particularly in cells with lower measured signals.
The current densities measured in this study (~5 nA cm⁻²) were lower than those previously reported for TIE-1 (~100 nA cm⁻²). Although both platforms share similarly small working volumes, several factors may explain the reduced signal. Variability in medium handling and CO₂ purging could result in lower dissolved CO₂ levels, which are essential for TIE-1 photoautotrophic growth. Additionally, gas bubble formation may have reduced apparent current density as the obstruction of the working electrode area was not accounted for in current density calculations. The values observed here are more consistent with those measured in Rhodovulum sulfidophilum AB26[33] study using a previous version of the µ-BEC platform, indicating that bioelectrochemical responses can vary with biological strain and experimental conditions. Overall, the data supports the platform’s ability to detect EEU while emphasizing the influence of organism-specific and environmental factors.
Cyclic voltammograms recorded under illuminated conditions are shown in Figure 17. Following incubation, distinct anodic peaks emerged in all four cells. These features were absent in abiotic controls and Day 0 measurements, suggesting the peaks resulted from biofilm development or the accumulation of redox-active compounds. While anodic peaks do not directly reflect EEU, which are represented by cathodic current at the working electrode, they may correspond to the oxidation of cytochromes or other metabolic intermediates[35] produced by TIE-1. The decrease in anodic peak intensity after planktonic cell removal and their absence under dark conditions (Figure 18) further support a biological origin associated with light-driven metabolism and/or surface colonization. In contrast, cathodic features were less well-defined, likely due to the low absolute current magnitude and overlap with capacitive background currents, consistent with the low currents observed in the chronoamperometry data.
Conclusions
We developed a scalable, glass-based microfluidic bioelectrochemical cell (µ-BEC) platform designed for multiplexed studies of extracellular electron uptake (EEU) in phototrophic microbes. The platform integrates optical transparency, electrochemical stability, and microfluidic control in a compact format compatible with high-resolution imaging and parallelized measurement. Fabrication innovations—including a two-step lift-off resist process, annealing of electrode materials, and selective application of protective coatings—enabled the production of reliable three-electrode microreactors with stable pseudoreference potentials.
Using Rhodopseudomonas palustris TIE-1 as a model organism, we demonstrated light-dependent electron uptake and isolated biofilm-specific contributions to EEU by removing planktonic cells under controlled flow. Chronoamperometric measurements revealed reproducible light responses, while cyclic voltammetry captured the appearance of biologically derived redox features in a subset of devices following incubation. While the absolute current densities measured were lower than previously reported for TIE-1, differences in dissolved gas availability, surface fouling, and effective electrode area likely contributed to these variations. Despite these limitations, the platform reproducibly detected phototrophic EEU and responded sensitively to environmental and experimental perturbations.
Acknowledgments
This work was supported by the following grant to J.M.M.: DEPSCoR grant (FA9550-21-1-0211). Additional support from grants to A.B.: The David and Lucile Packard Foundation Fellowship (201563111), the U.S. Department of Energy (grant number DESC0014613), and the U.S. Department of Defense, Army Research Office (grant number W911NF-18-1-0037), Gordon and Betty Moore Foundation, National Science Foundation (Grant Number 2021822, Grant Number 2124088, Grant Number 2117198, and Grant Number 2300081), the U.S. Department of Energy by Lawrence Livermore National Laboratory under Contract DEAC5207NA27344 (LLNL-JRNL-812309). A.B. was also funded by a Collaboration Initiation Grant, an Office of the Vice-Chancellor of Research Grant, an International Center for Energy, Environment, and Sustainability Grant and a SPEED grant from Washington University in St. Louis. This work was also supported by the NSF award under NSF-CAREER 1846005 to J.A.V.B.
References
- L. Shi et al., "Extracellular electron transfer mechanisms between microorganisms and minerals," Nature Reviews Microbiology, vol. 14, no. 10, pp. 651-662, 2016/10/01 2016. [CrossRef]
- D. R. Lovley and D. E. Holmes, "Electromicrobiology: the ecophysiology of phylogenetically diverse electroactive microorganisms," Nature Reviews Microbiology, vol. 20, no. 1, pp. 5-19, 2022/01/01 2022. [CrossRef]
- D. R. Lovley, J. F. Stolz, G. L. Nord, and E. J. P. Phillips, "Anaerobic production of magnetite by a dissimilatory iron-reducing microorganism," Nature, vol. 330, no. 6145, pp. 252-254, 1987/11/01 1987. [CrossRef]
- M. S. Guzman et al., "Phototrophic extracellular electron uptake is linked to carbon dioxide fixation in the bacterium Rhodopseudomonas palustris," Nature Communications, vol. 10, no. 1, p. 1355, 2019/03/22 2019. [CrossRef]
- D. R. Lovley, E. J. P. Phillips, Y. A. Gorby, and E. R. Landa, "Microbial reduction of uranium," Nature, vol. 350, no. 6317, pp. 413-416, 1991/04/01 1991. [CrossRef]
- L. Cologgi Dena, M. Speers Allison, A. Bullard Blair, D. Kelly Shelly, and G. Reguera, "Enhanced Uranium Immobilization and Reduction by Geobacter sulfurreducens Biofilms," Applied and Environmental Microbiology, vol. 80, no. 21, pp. 6638-6646, 2014/11/01 2014. [CrossRef]
- A. E. Franks and K. P. Nevin, "Microbial Fuel Cells, A Current Review," Energies, vol. 3, no. 5, pp. 899-919doi: 10.3390/en3050899.
- D. R. Lovley, "Bug juice: harvesting electricity with microorganisms," Nature Reviews Microbiology, vol. 4, no. 7, pp. 497-508, 2006/07/01 2006. [CrossRef]
- D. R. Lovley and K. P. Nevin, "Electrobiocommodities: powering microbial production of fuels and commodity chemicals from carbon dioxide with electricity," Current Opinion in Biotechnology, vol. 24, no. 3, pp. 385-390, 2013/06/01/ 2013. [CrossRef]
- P. Nevin Kelly, L. Woodard Trevor, E. Franks Ashley, M. Summers Zarath, and R. Lovley Derek, "Microbial Electrosynthesis: Feeding Microbes Electricity To Convert Carbon Dioxide and Water to Multicarbon Extracellular Organic Compounds," mBio, vol. 1, no. 2, pp. 10.1128/mbio.00103-10, 2010. [CrossRef]
- R. Karthikeyan, R. Singh, and A. Bose, "Microbial electron uptake in microbial electrosynthesis: a mini-review," Journal of Industrial Microbiology and Biotechnology, vol. 46, no. 9-10, pp. 1419-1426, 2019. [CrossRef]
- T. O. Ranaivoarisoa, R. Singh, K. Rengasamy, M. S. Guzman, and A. Bose, "Towards sustainable bioplastic production using the photoautotrophic bacterium Rhodopseudomonas palustris TIE-1," Journal of Industrial Microbiology and Biotechnology, vol. 46, no. 9-10, pp. 1401-1417, 2019. [CrossRef]
- M. Tahernia, M. Mohammadifar, Y. Gao, W. Panmanee, D. J. Hassett, and S. Choi, "A 96-well high-throughput, rapid-screening platform of extracellular electron transfer in microbial fuel cells," Biosensors and Bioelectronics, vol. 162, p. 112259, 2020/08/15/ 2020. [CrossRef]
- M. Tahernia, M. Mohammadifar, D. J. Hassett, and S. Choi, "A portable papertronic sensing system for rapid, high-throughput, and visual screening of bacterial electrogenicity," Biosensors and Bioelectronics, vol. 165, p. 112348, 2020/10/01/ 2020. [CrossRef]
- M. Tahernia, M. Mohammadifar, D. J. Hassett, and S. Choi, "A fully disposable 64-well papertronic sensing array for screening electroactive microorganisms," Nano Energy, vol. 65, p. 104026, 2019/11/01/ 2019. [CrossRef]
- N. H. Park, J. Kim, and Y. Ahn, "Fabric-based self-pumping, single-stream microfluidic fuel cell," Electrochimica Acta, vol. 446, p. 142106, 2023/04/01/ 2023. [CrossRef]
- J. Kim, H. G. Kong, and Y. Ahn, "Textile-Based Membraneless Microfluidic Double-Inlet Hybrid Microbial–Enzymatic Biofuel Cell," ACS Applied Materials & Interfaces, vol. 16, no. 33, pp. 43661-43669, 2024/08/21 2024. [CrossRef]
- Y. Kwon, D. Hong, and Y. Ahn, "Monolayer textile-based co-laminar flow biocompatible enzymatic biofuel cell," Energy Conversion and Management, vol. 301, p. 118042, 2024/02/01/ 2024. [CrossRef]
- M. P. Zarabadi, F. Paquet-Mercier, S. J. Charette, and J. Greener, "Hydrodynamic Effects on Biofilms at the Biointerface Using a Microfluidic Electrochemical Cell: Case Study of Pseudomonas sp," (in eng), Langmuir, vol. 33, no. 8, pp. 2041-2049, Feb 28 2017. [CrossRef]
- M. A. Amirdehi, L. Gong, N. Khodaparastasgarabad, J. M. Sonawane, B. E. Logan, and J. Greener, "Hydrodynamic interventions and measurement protocols to quantify and mitigate power overshoot in microbial fuel cells using microfluidics," Electrochimica Acta, vol. 405, p. 139771, 2022/02/10/ 2022. [CrossRef]
- L. Gong, N. Khodaparastasgarabad, D. M. Hall, and J. Greener, "A new angle to control concentration profiles at electroactive biofilm interfaces: Investigating a microfluidic perpendicular flow approach," Electrochimica Acta, vol. 431, p. 141071, 2022/11/01/ 2022. [CrossRef]
- N. Khodaparastasgarabad, M. Couture, and J. Greener, "A microfluidic study of acetate conversion kinetics in a microbial electrolysis cell: The role of age, concentration and flow on biofilm permeability," Sensors and Actuators B: Chemical, vol. 412, p. 135779, 2024/08/01/ 2024. [CrossRef]
- H.-M. Cho, H. Ha, and Y. Ahn, "Co-laminar Microfluidic Microbial Fuel Cell Integrated with Electrophoretically Deposited Carbon Nanotube Flow-Over Electrode," ACS Sustainable Chemistry & Engineering, vol. 10, no. 5, pp. 1839-1846, 2022/02/07 2022. [CrossRef]
- C. H. Lee, H. Ha, Y. Ahn, and H. Liu, "Performance of single-layer paper-based co-laminar flow microbial fuel cells," Journal of Power Sources, vol. 580, p. 233456, 2023/10/01/ 2023. [CrossRef]
- S.-C. Chang and J. M. Kempisty, "Lift-off Methods for MEMS Devices," MRS Online Proceedings Library, vol. 729, no. 1, p. 23, 2003/01/01 2003. [CrossRef]
- H.-R. Lim, N. Hillman, Y.-T. Kwon, Y.-S. Kim, Y.-H. Choa, and W.-H. Yeo, "Ultrathin, long-term stable, solid-state reference electrode enabled by enhanced interfacial adhesion and conformal coating of AgCl," Sensors and Actuators B: Chemical, vol. 309, p. 127761, 2020/04/15/ 2020. [CrossRef]
- C. Iliescu, F. E. H. Tay, and J. Miao, "Strategies in deep wet etching of Pyrex glass," Sensors and Actuators A: Physical, vol. 133, no. 2, pp. 395-400, 2007/02/12/ 2007. [CrossRef]
- C. Iliescu, J. Jing, F. E. H. Tay, J. Miao, and T. Sun, "Characterization of masking layers for deep wet etching of glass in an improved HF/HCl solution," Surface and Coatings Technology, vol. 198, no. 1, pp. 314-318, 2005/08/01/ 2005. [CrossRef]
- C. Iliescu and F. E. Tay, "Wet etching of glass," in CAS 2005 Proceedings. 2005 International Semiconductor Conference, 2005., 2005, vol. 1: IEEE, pp. 35-44.
- S. Satyanarayana, R. N. Karnik, and A. Majumdar, "Stamp-and-stick room-temperature bonding technique for microdevices," Journal of Microelectromechanical Systems, vol. 14, no. 2, pp. 392-399, 2005. [CrossRef]
- T. Y. Kim, S. A. Hong, and S. Yang, "A Solid-State Thin-Film Ag/AgCl Reference Electrode Coated with Graphene Oxide and Its Use in a pH Sensor," Sensors, vol. 15, no. 3, pp. 6469-6482, 2015. [Online]. Available: https://www.mdpi.com/1424-8220/15/3/6469.
- M. W. Shinwari, D. Zhitomirsky, I. A. Deen, P. R. Selvaganapathy, M. J. Deen, and D. Landheer, "Microfabricated reference electrodes and their biosensing applications," (in eng), Sensors (Basel), vol. 10, no. 3, pp. 1679-715, 2010. [CrossRef]
- D. Gupta et al., "Photoferrotrophy and phototrophic extracellular electron uptake is common in the marine anoxygenic phototroph Rhodovulum sulfidophilum," The ISME Journal, vol. 15, no. 11, pp. 3384-3398, 2021/11/01 2021. [CrossRef]
- R. Frank et al., "Electrochemical restructuring of thin layer indium tin oxide electrode arrays for optimized (bio)electrocatalysis," Electrochimica Acta, vol. 259, pp. 449-457, 2018/01/01/ 2018. [CrossRef]
- D. Xing, Y. Zuo, S. Cheng, J. M. Regan, and B. E. Logan, "Electricity Generation by Rhodopseudomonas palustris DX-1," Environmental Science & Technology, vol. 42, no. 11, pp. 4146-4151, 2008/06/01 2008. [CrossRef]
Figure 1.
Microfluidic bio-electrochemical cell (µ-BEC) platform. (A) Side (i) and top (ii) views of single µ-BEC; (B) Fabricated microfluidic channel layer (i) and multi-electrode layer (ii); (C) Inset of fabricated µ-BEC (i) and assembled device inside the microscopy and electrochemical measurements compatible holder.
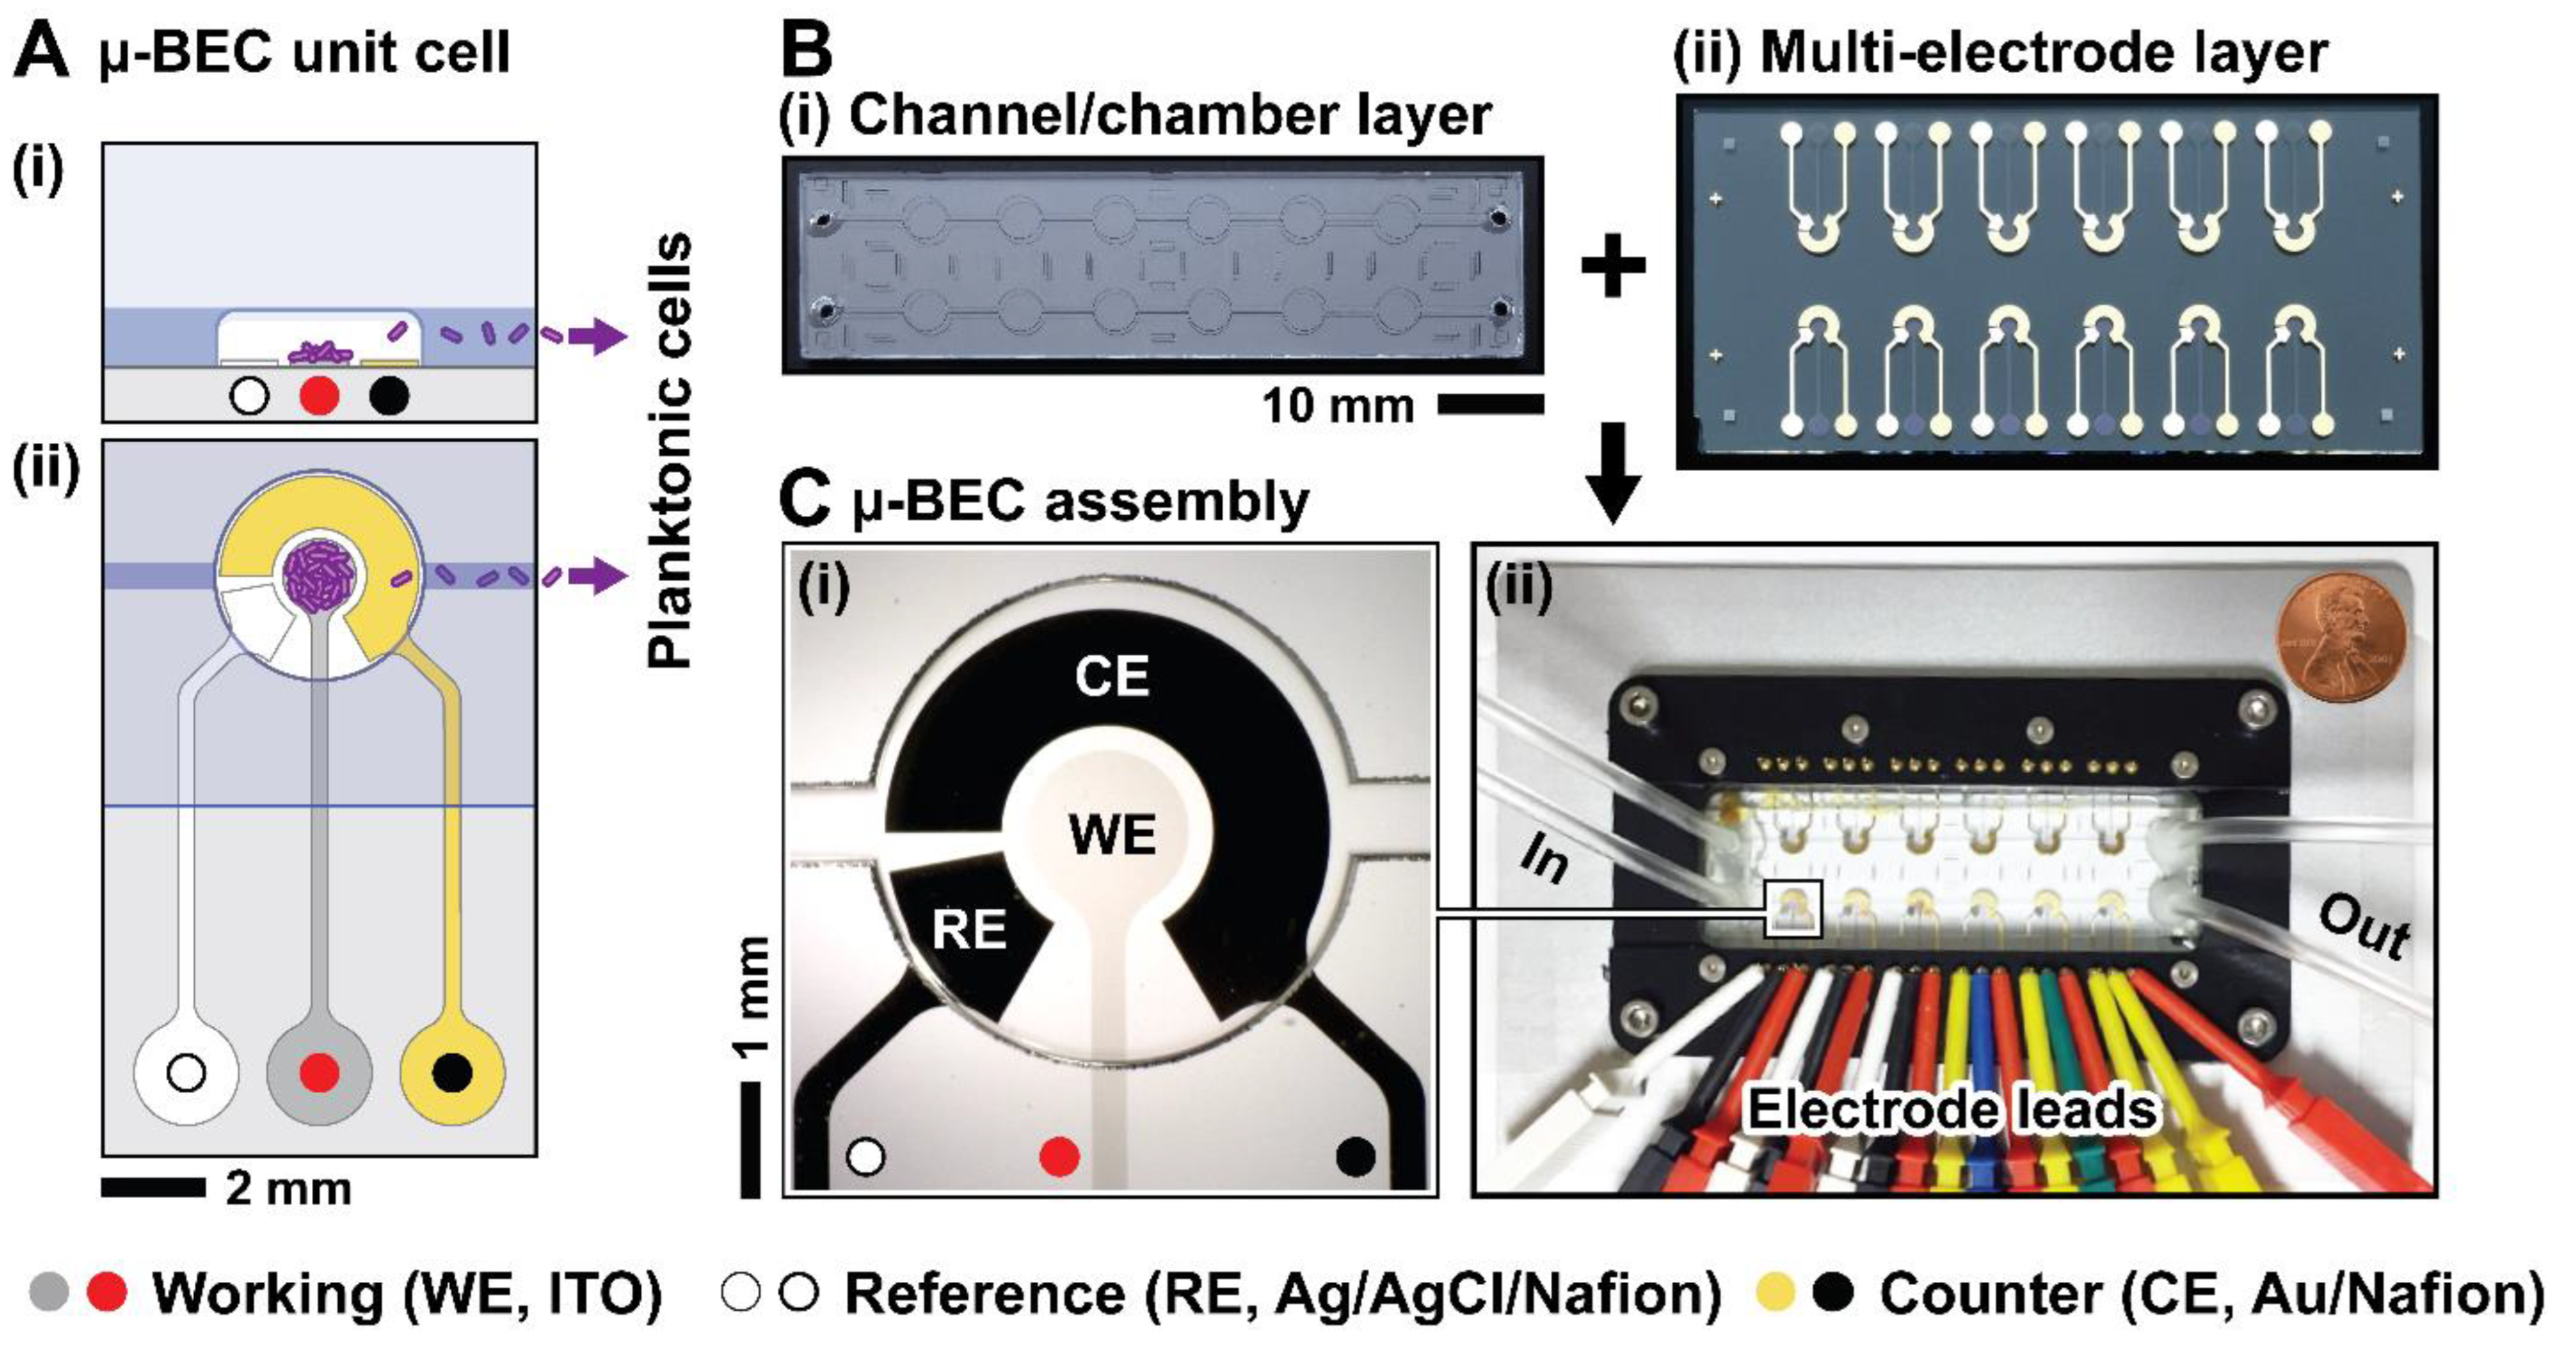
Figure 2.
µ-BEC platform fabrication steps. 1(a-f) electrode layer lithography, metallization, and lift-off; 2(a-f) reference electrode chlorination; 3(a-f) Nafion layer application.
Figure 2.
µ-BEC platform fabrication steps. 1(a-f) electrode layer lithography, metallization, and lift-off; 2(a-f) reference electrode chlorination; 3(a-f) Nafion layer application.
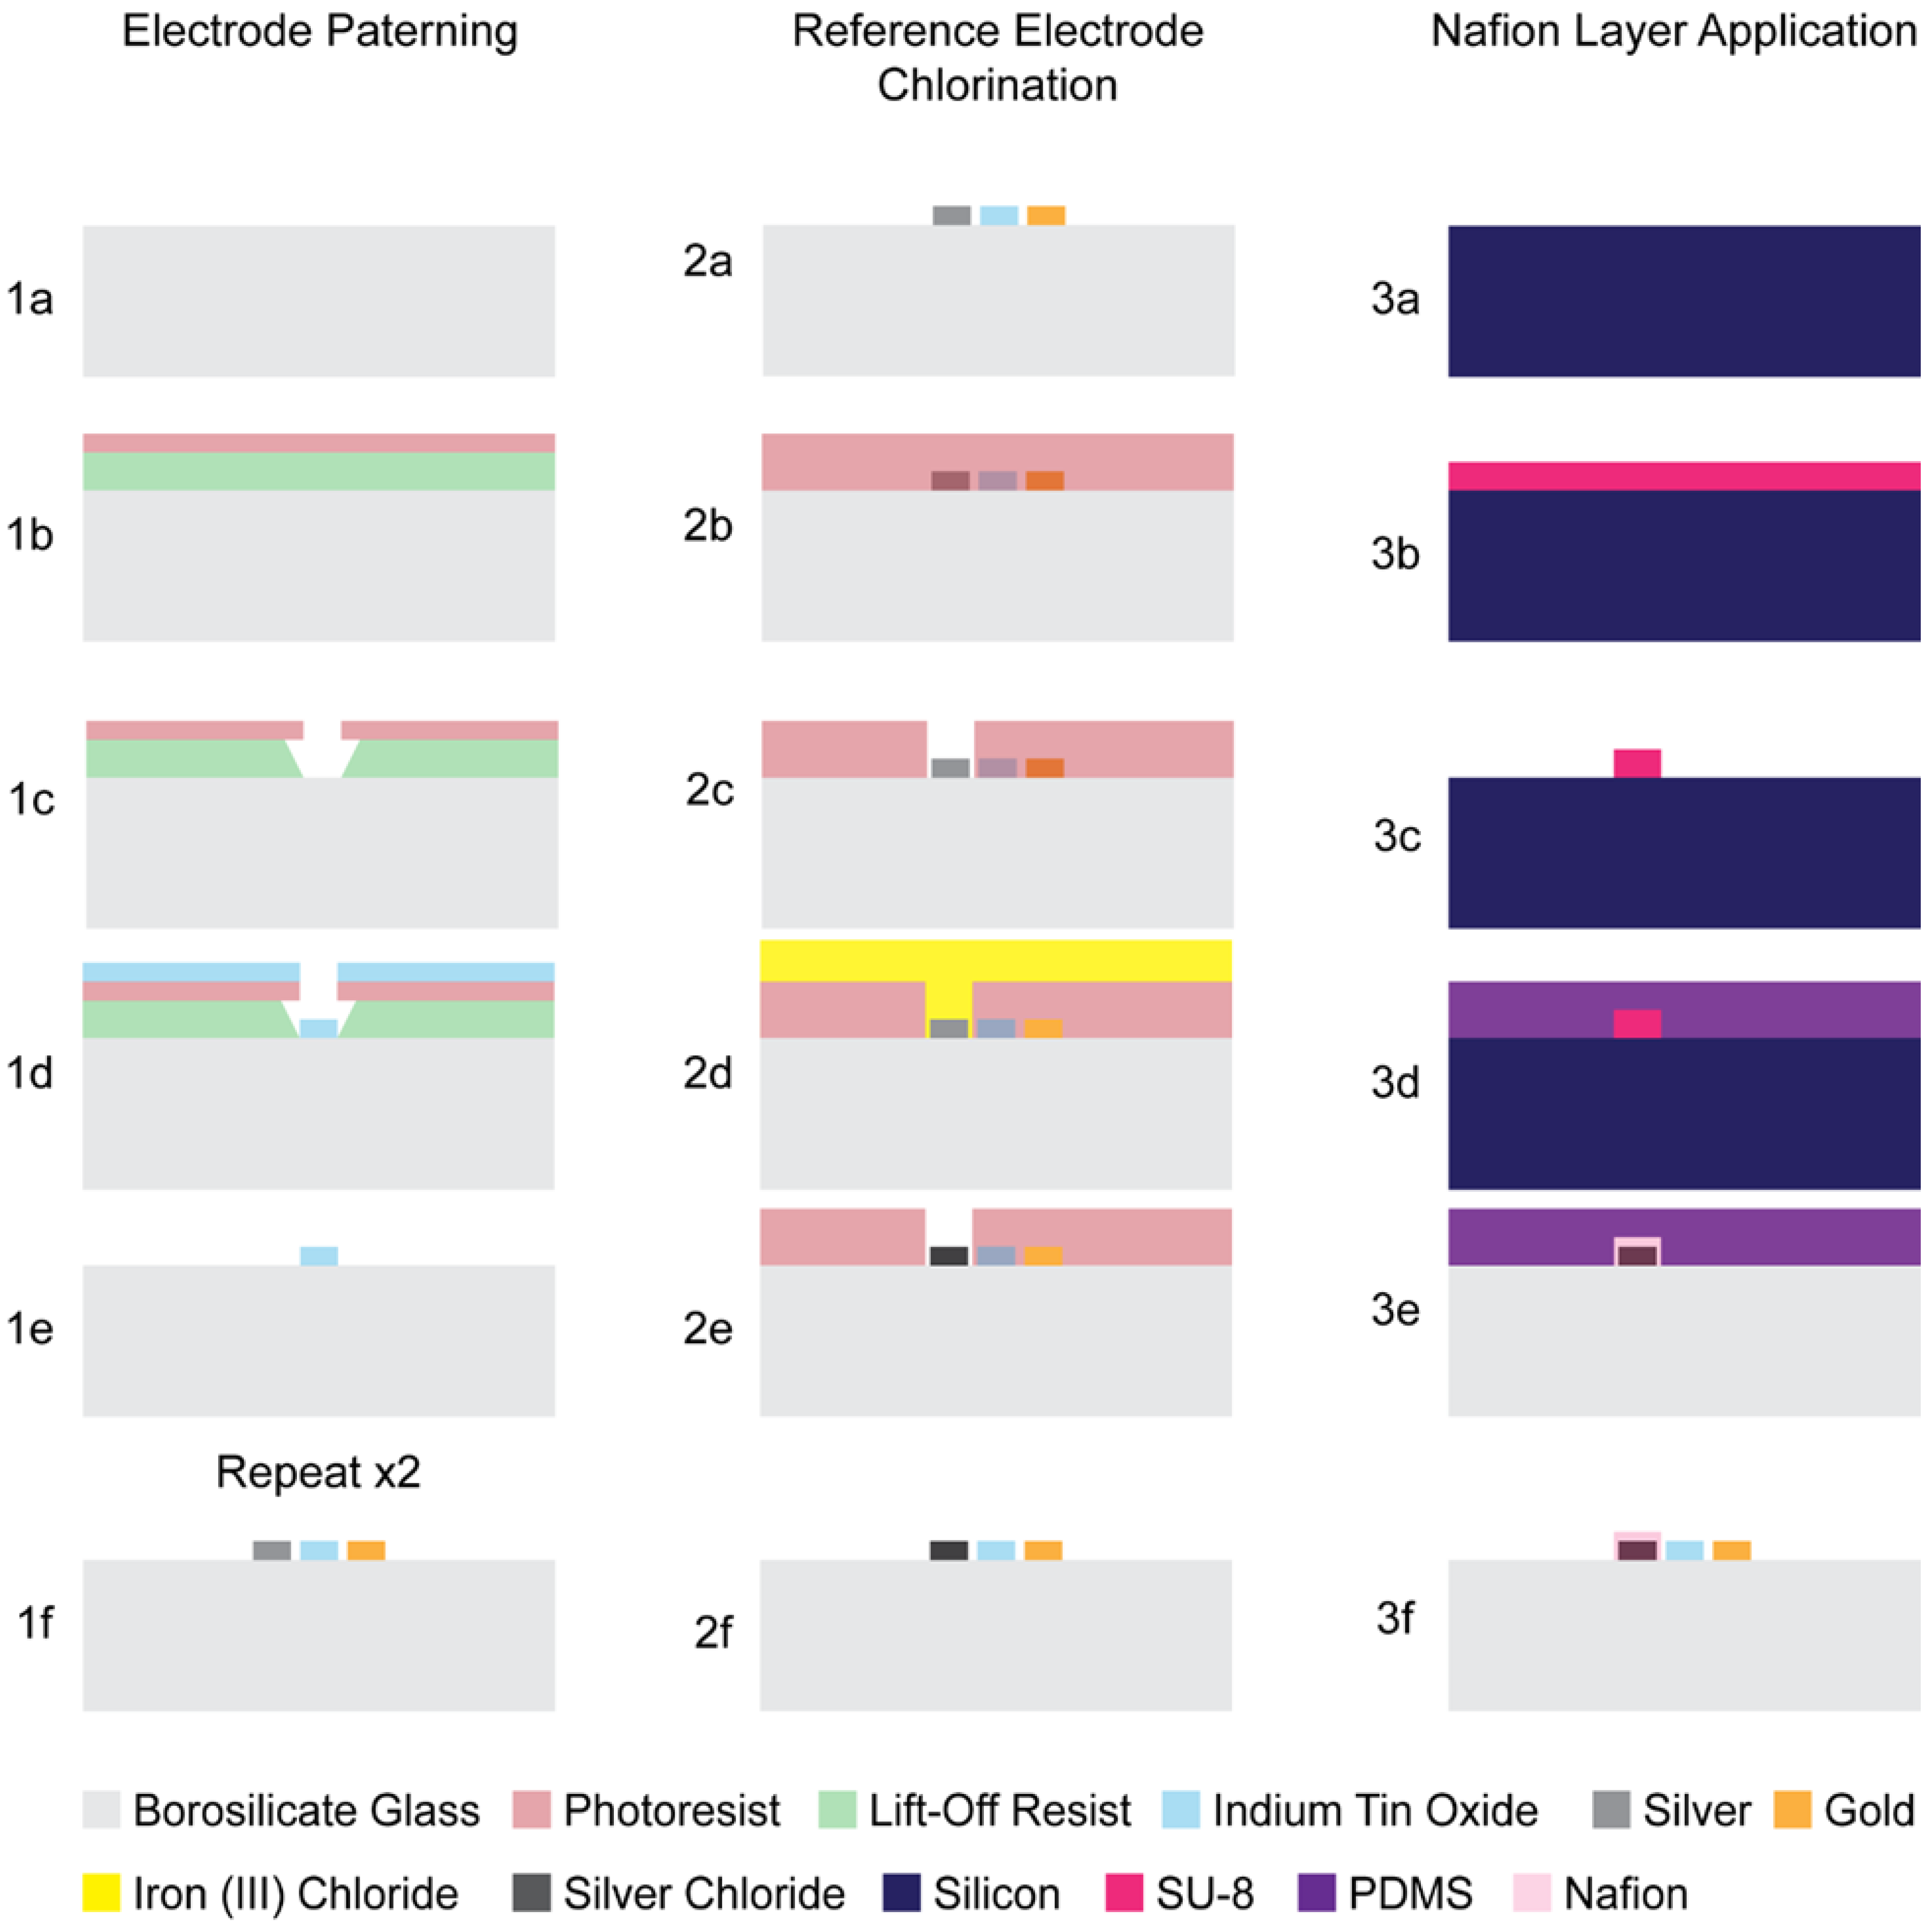
Figure 4.
Open circuit potential of pseudoreference electrode in freshwater media. Average value across three samples with shaded area representing ± standard deviation.
Figure 4.
Open circuit potential of pseudoreference electrode in freshwater media. Average value across three samples with shaded area representing ± standard deviation.
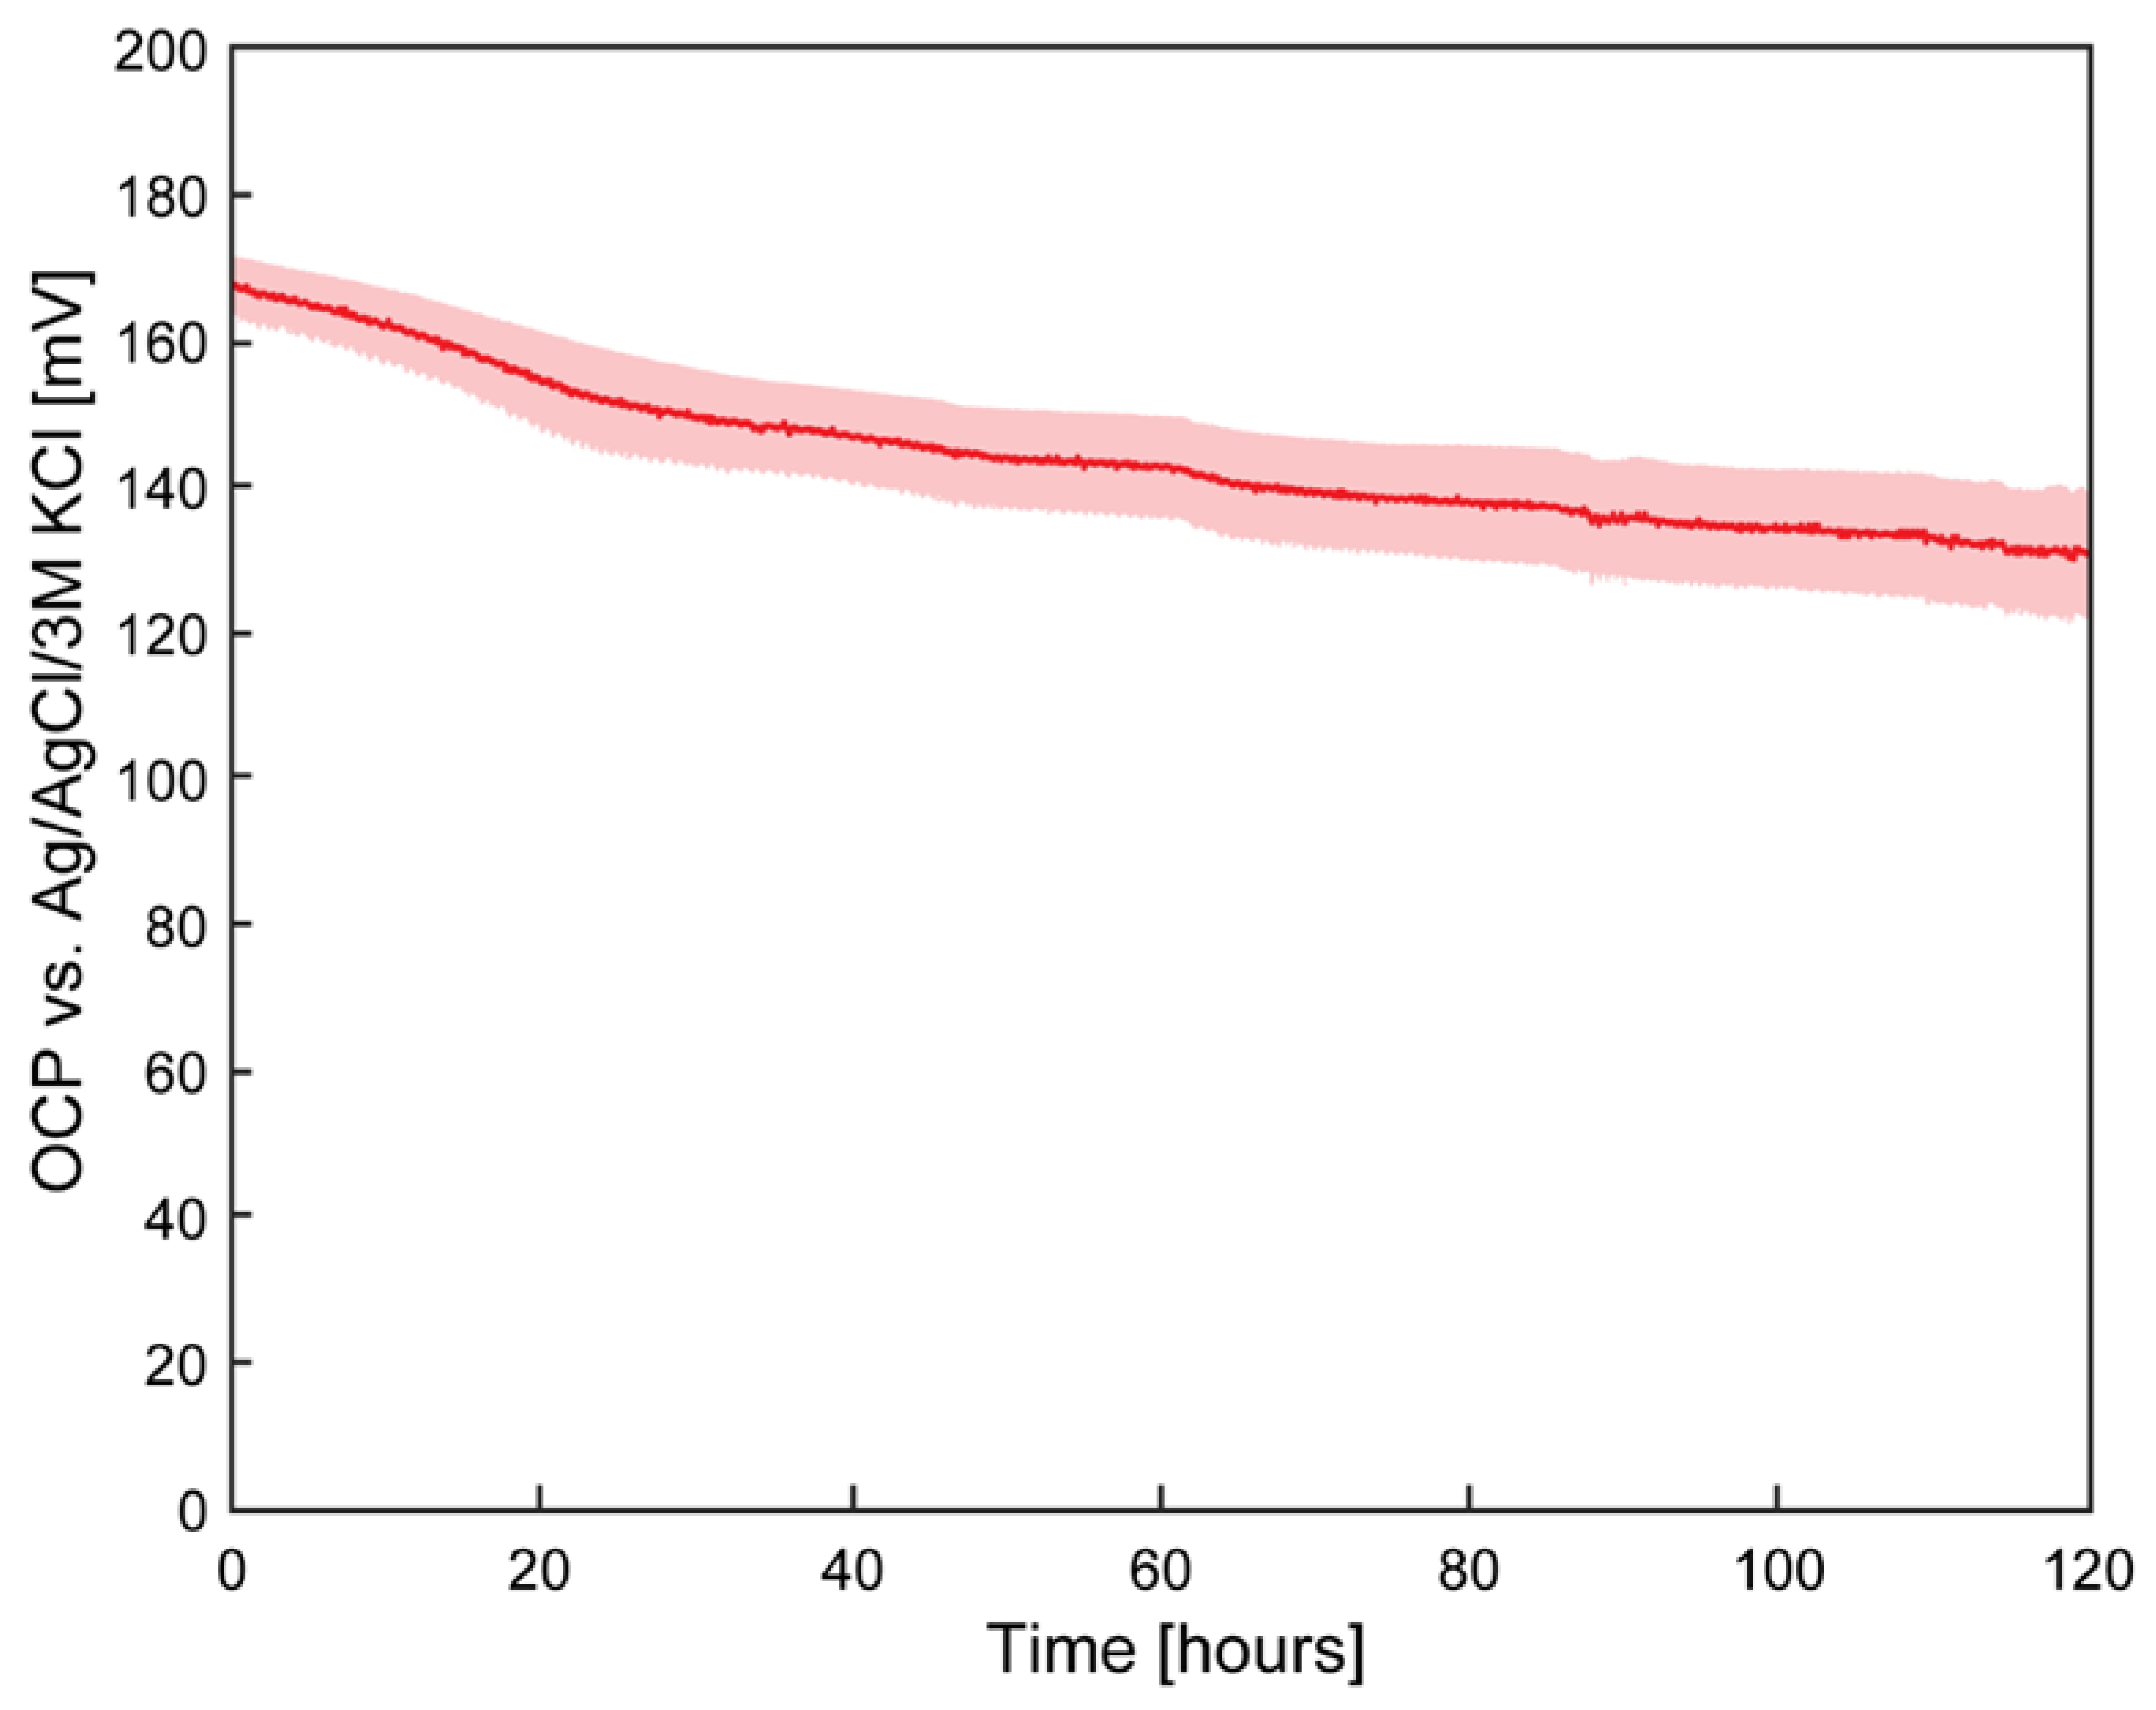
Figure 5.
Pseudoreference electrode potential calibration. Cyclic voltammograms at 10 mV/s of 1 mM ferri/ferrocyanide in 1 M potassium chloride solution versus the pseudoreference electrode (doted blue) and Ag/AgCl/3M KCl (red); B Average half-wave potential values for each tested electrochemical cell and overall average across the three cells of the pseudoreference electrode (blue) and Ag/AgCl/3M KCl (red). Error bars represent +/- standard deviation.
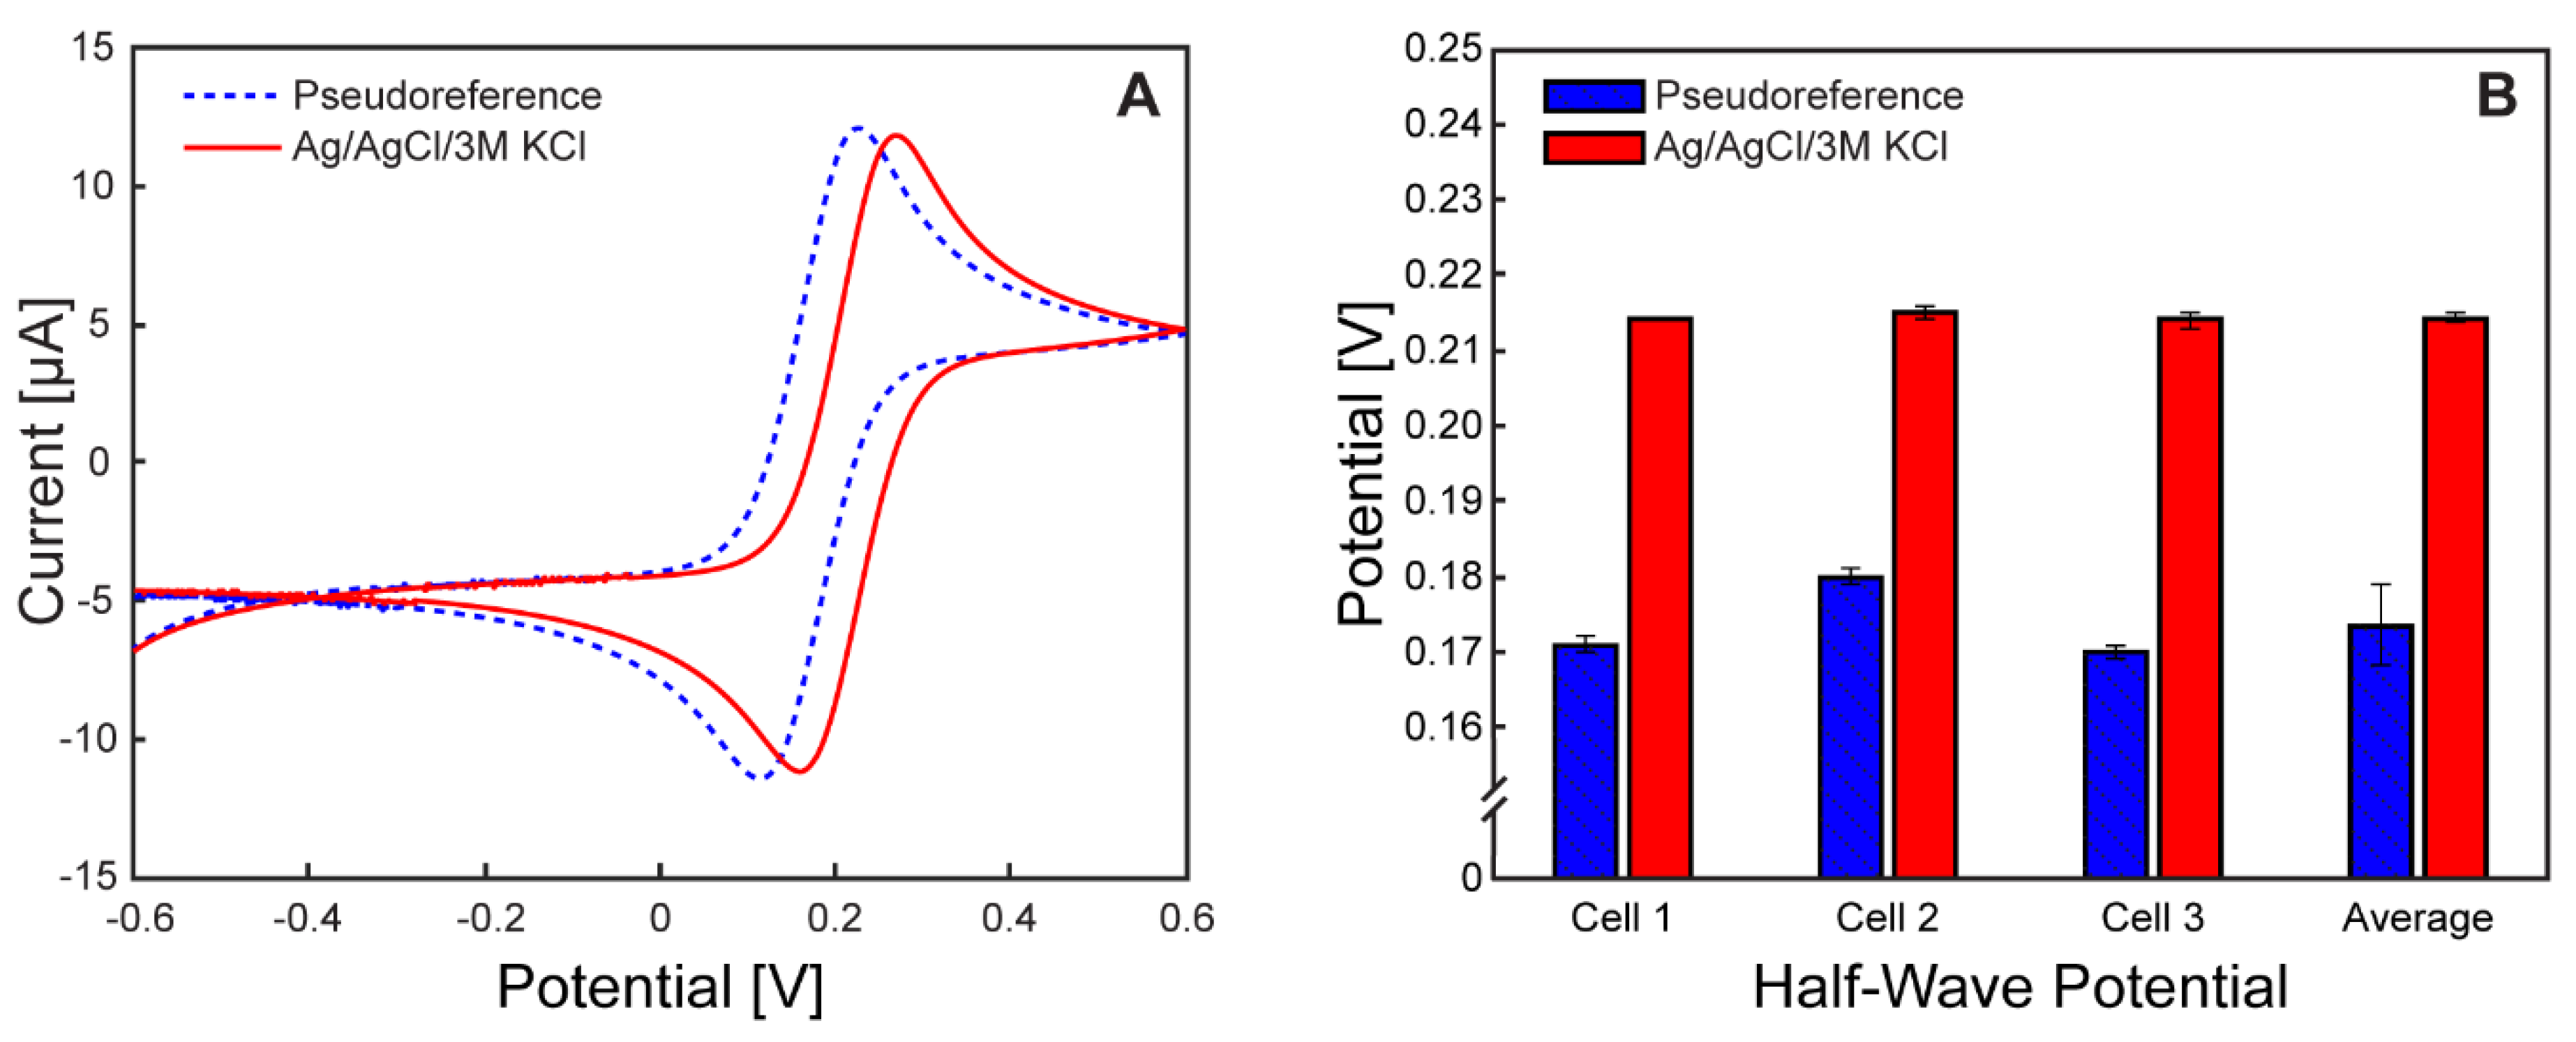
Figure 6.
Cyclic voltammograms of the ferri/ferrocyanide redox probe within each µ-BEC cell. Scan rates: 5 mV/s (green), 10 mV/s (blue), 15 mV/s (red), 20 mV/s (yellow) and 25 mV/s (purple). Subfigures A-D correspond to µ-BEC cells 1-4 on the platform.
Figure 6.
Cyclic voltammograms of the ferri/ferrocyanide redox probe within each µ-BEC cell. Scan rates: 5 mV/s (green), 10 mV/s (blue), 15 mV/s (red), 20 mV/s (yellow) and 25 mV/s (purple). Subfigures A-D correspond to µ-BEC cells 1-4 on the platform.
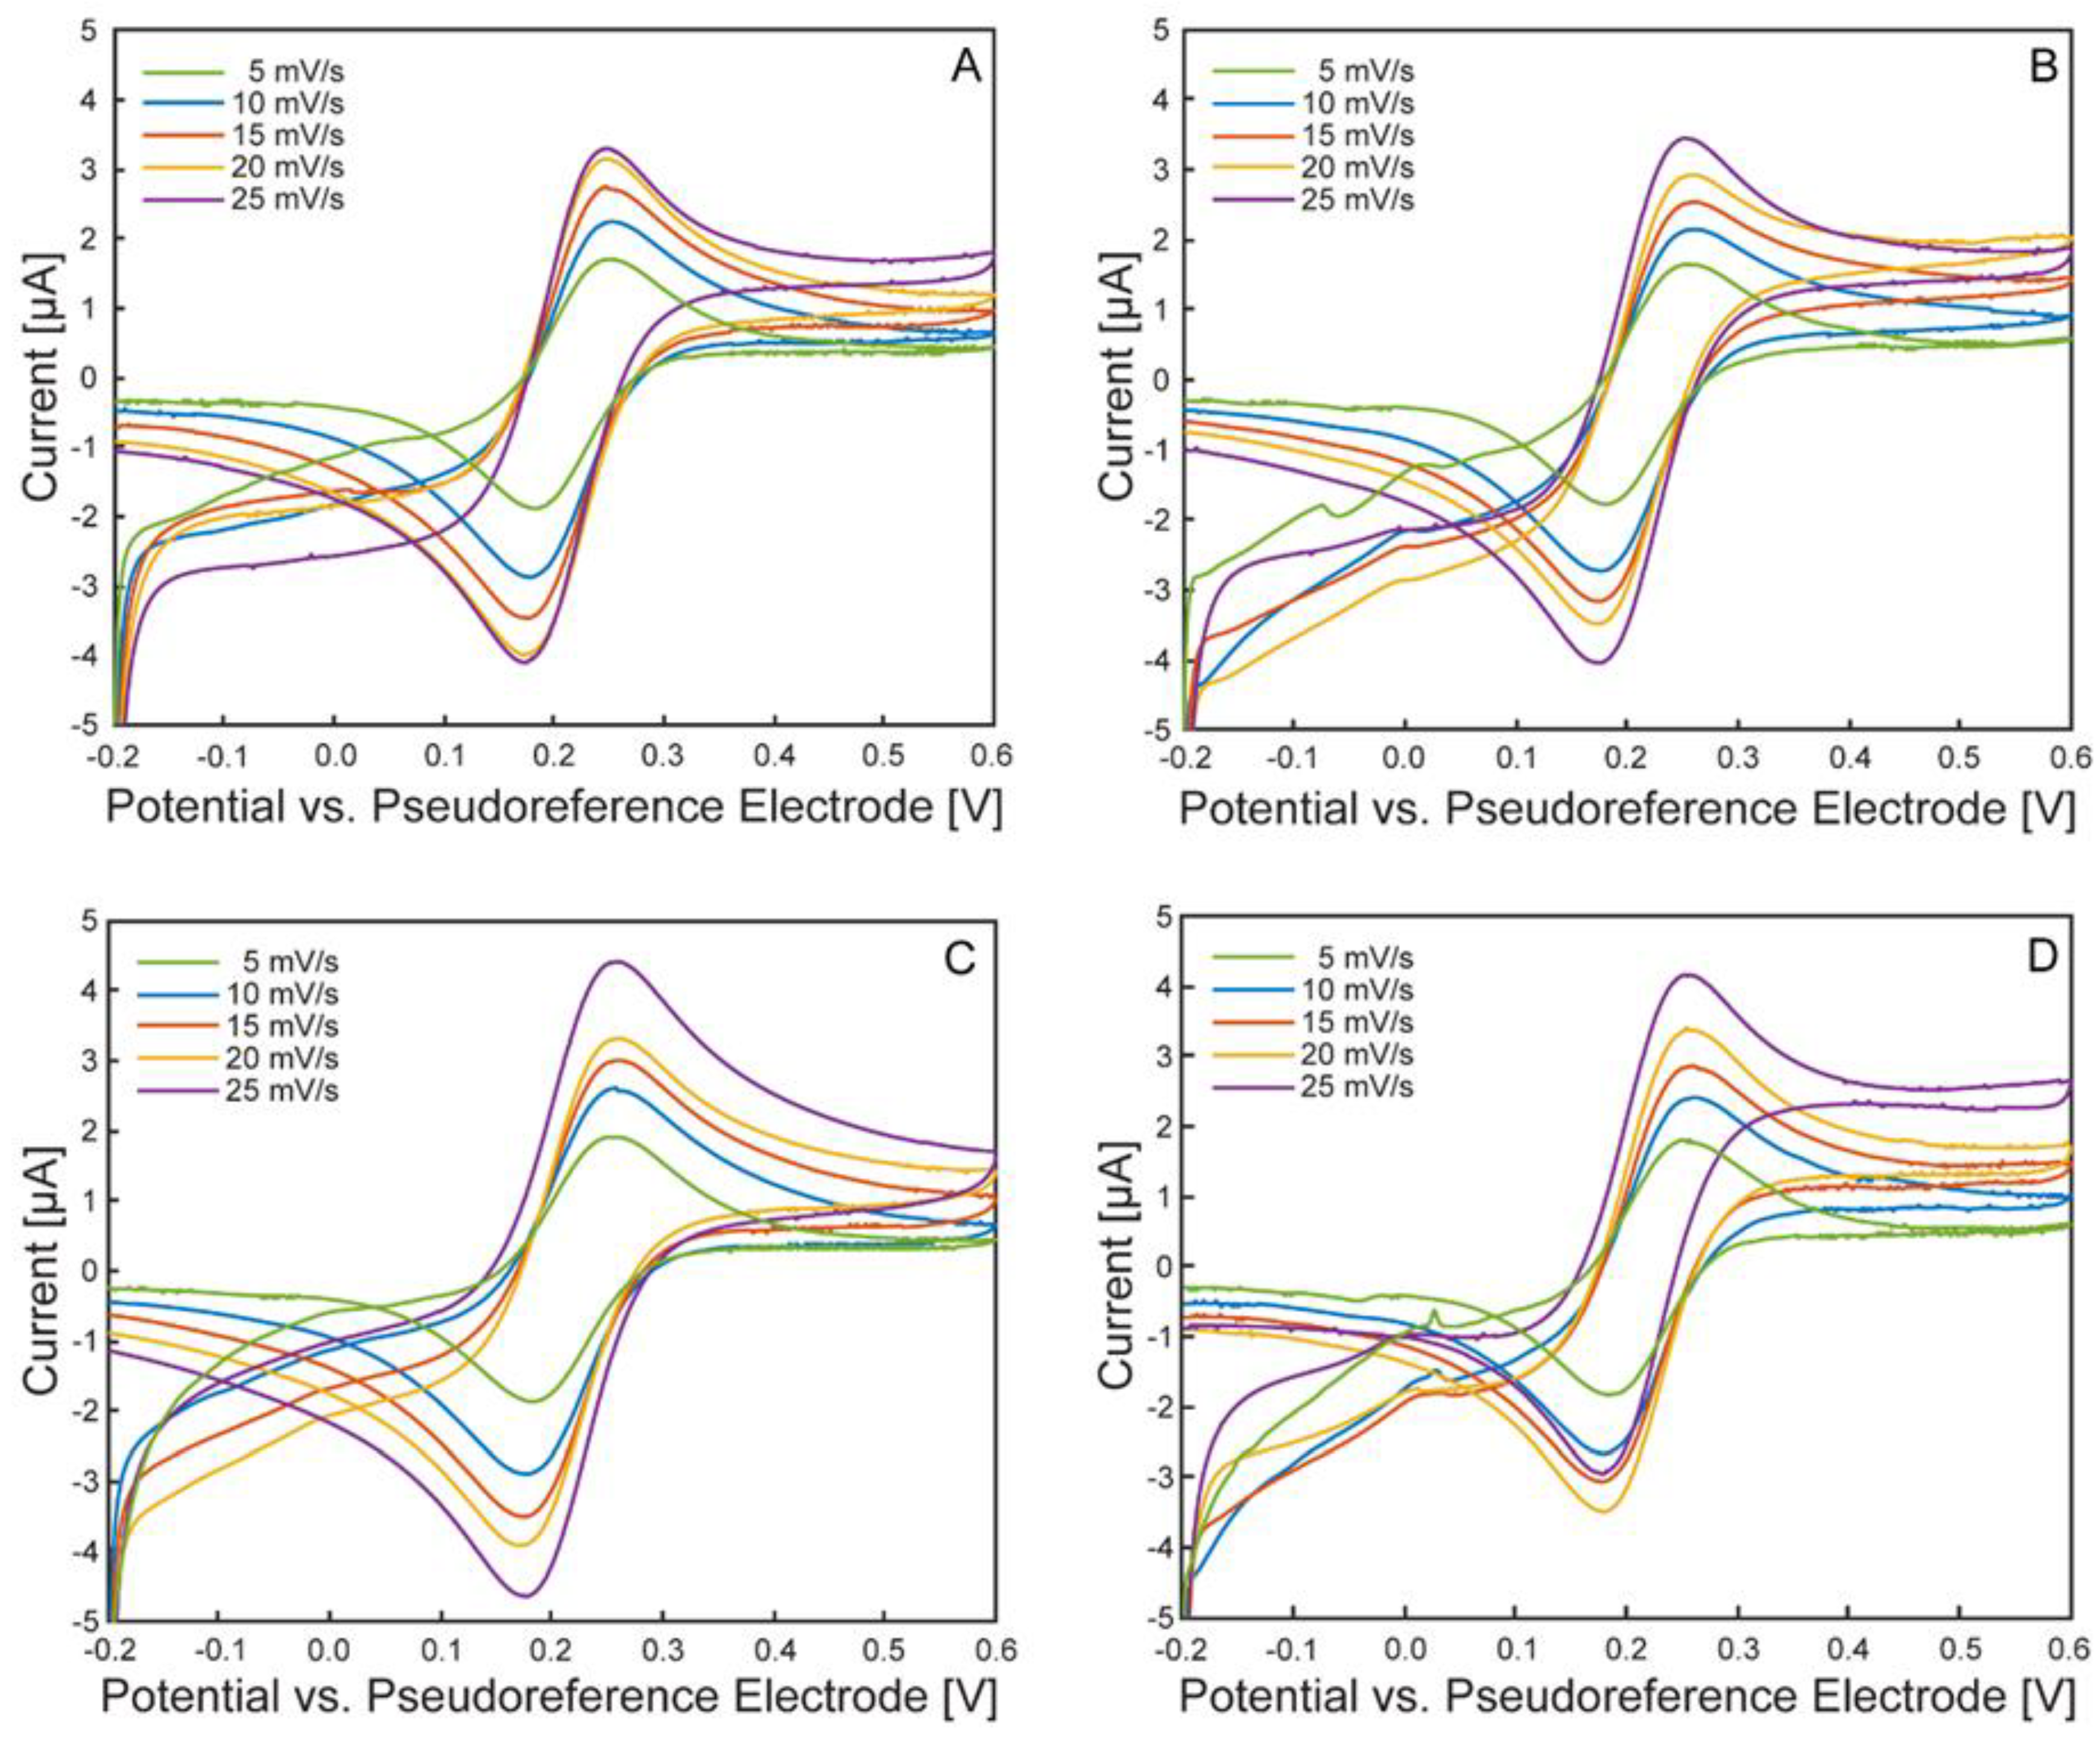
Figure 7.
Cyclic voltammograms at different scan rates of the ferri/ferrocyanide redox probe. µ-BEC cell 1 (blue), cell 2 (red), cell 3 (yellow), cell 4 (purple). Subfigures A-E correspond to scan rates of 5, 10, 15, 20, 25 mV/s.
Figure 7.
Cyclic voltammograms at different scan rates of the ferri/ferrocyanide redox probe. µ-BEC cell 1 (blue), cell 2 (red), cell 3 (yellow), cell 4 (purple). Subfigures A-E correspond to scan rates of 5, 10, 15, 20, 25 mV/s.
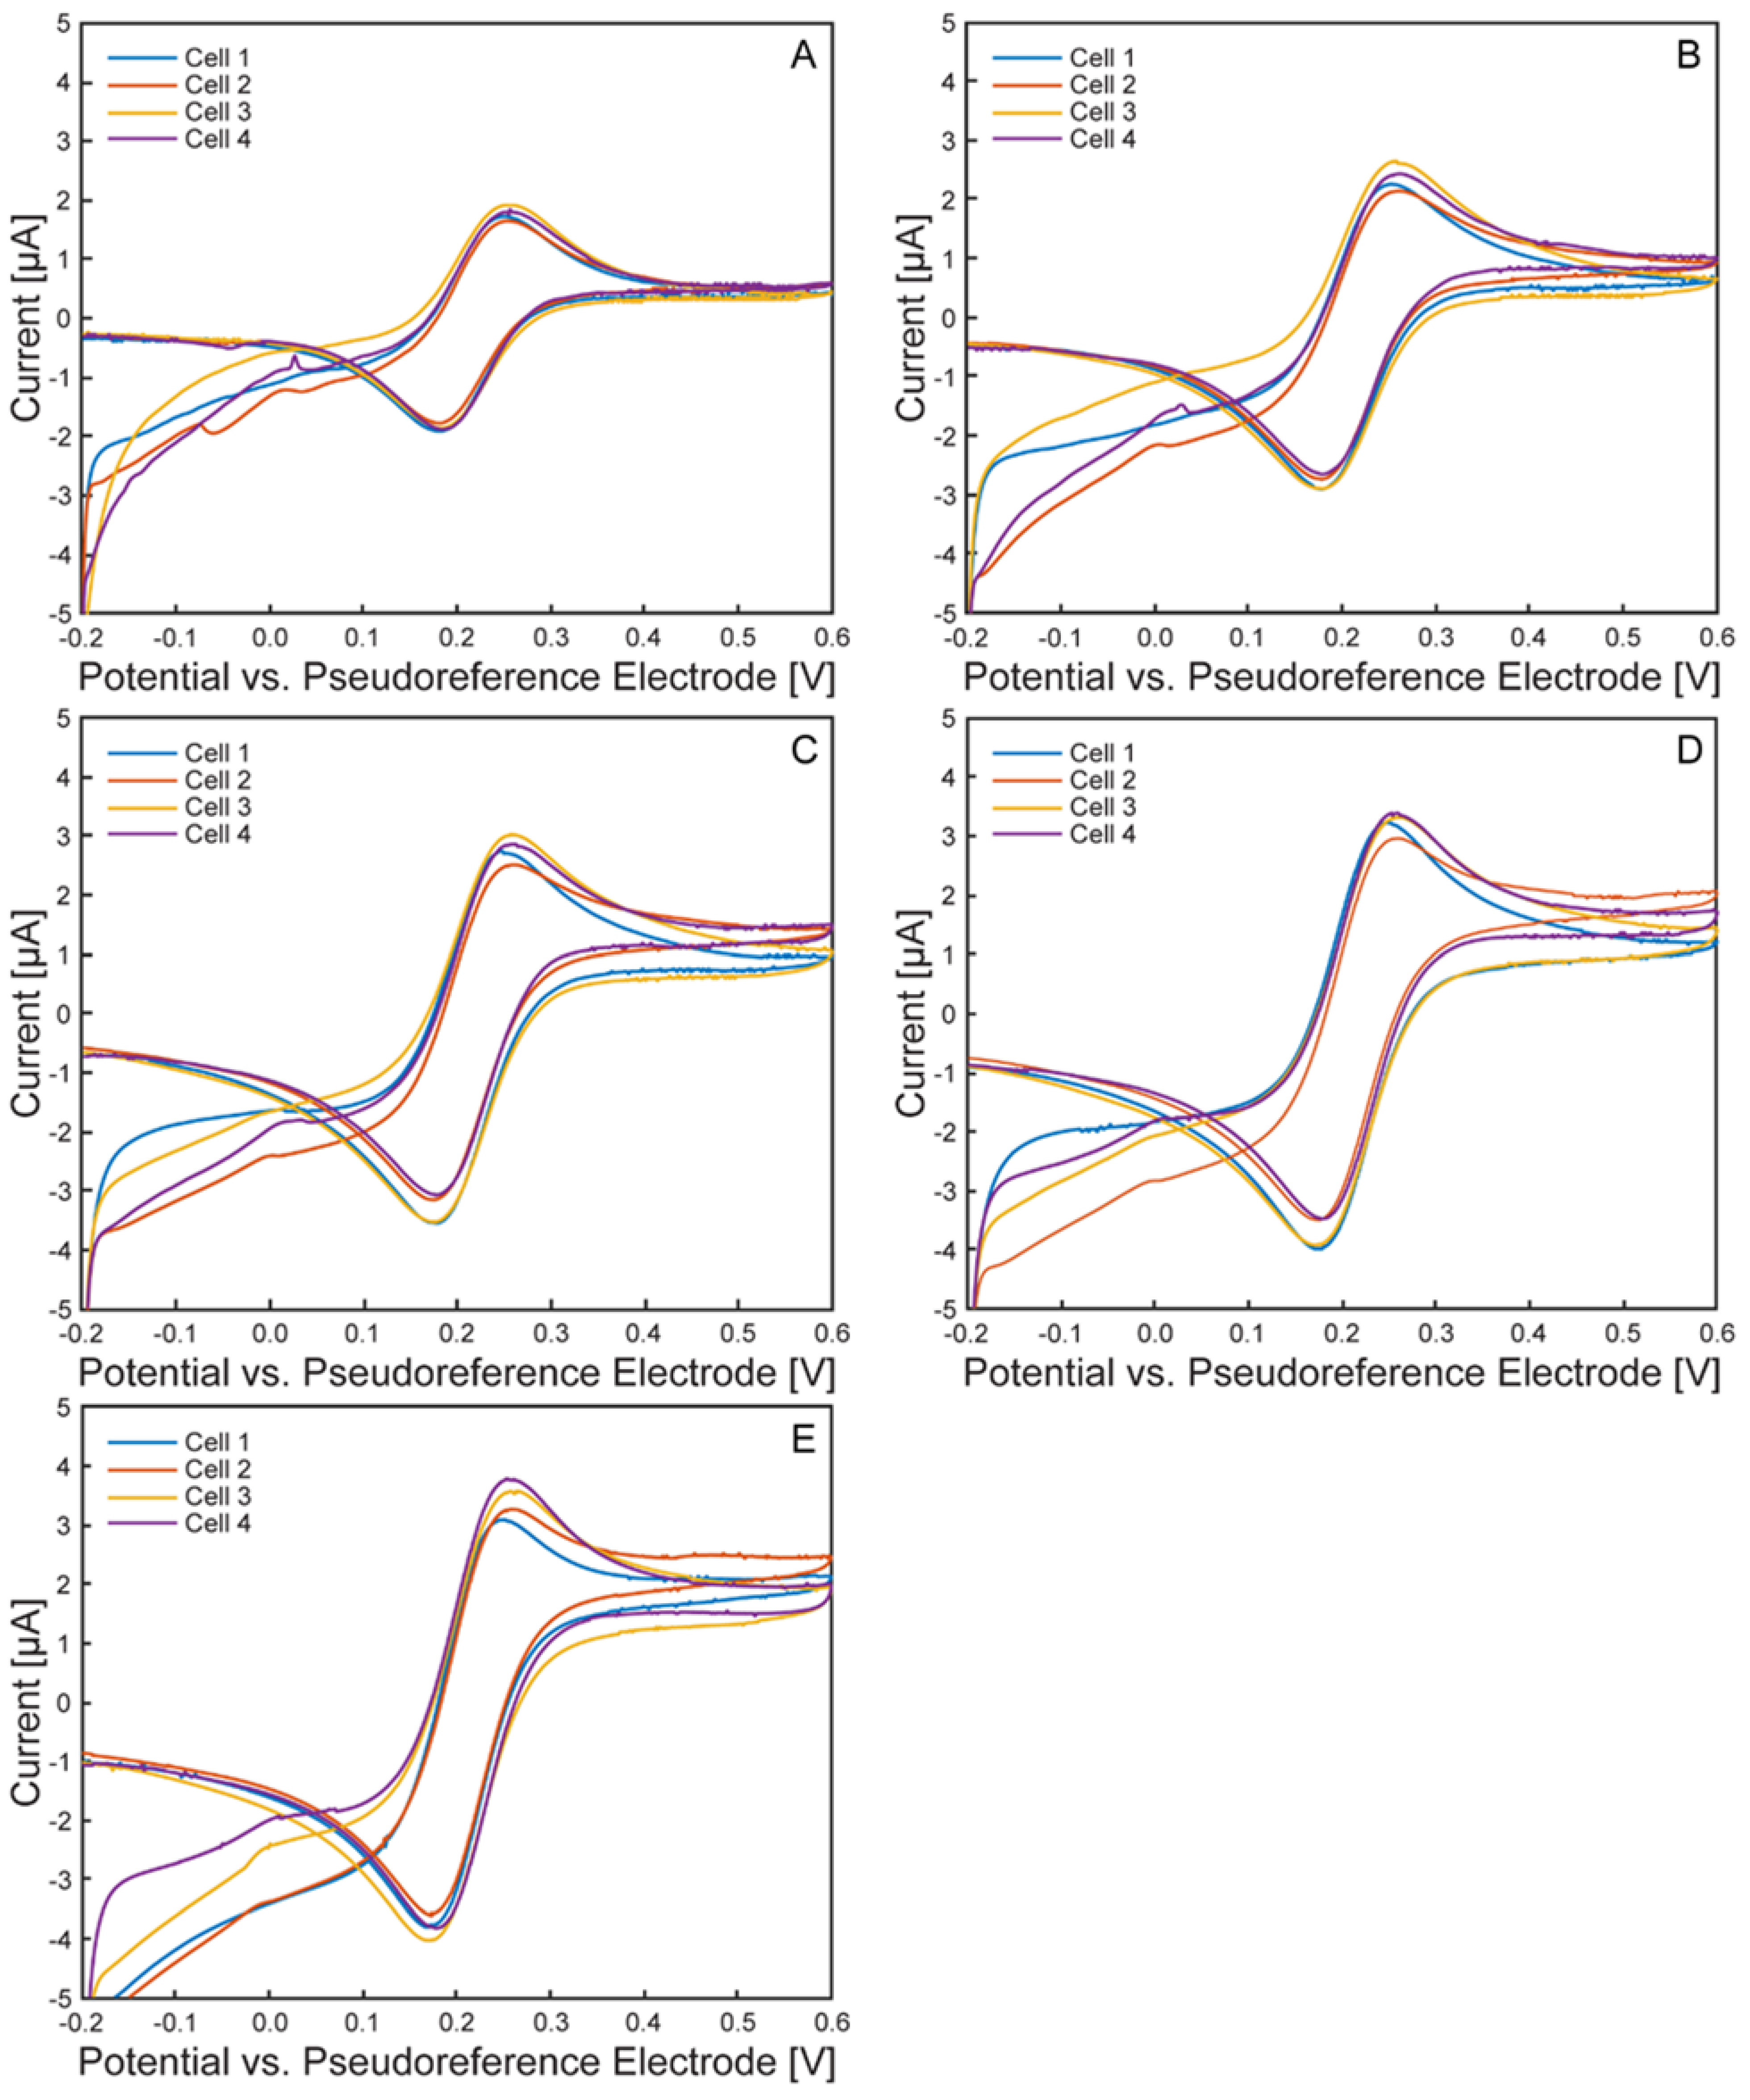
Figure 8.
Average anodic and cathodic peak potentials and currents of the ferri/ferrocyanide redox probe. Cell 1 (blue), cell 2 (red), cell 3 (yellow), cell 4 (purple), average across all cells (green). Error bars represent +/- standard deviation.
Figure 8.
Average anodic and cathodic peak potentials and currents of the ferri/ferrocyanide redox probe. Cell 1 (blue), cell 2 (red), cell 3 (yellow), cell 4 (purple), average across all cells (green). Error bars represent +/- standard deviation.
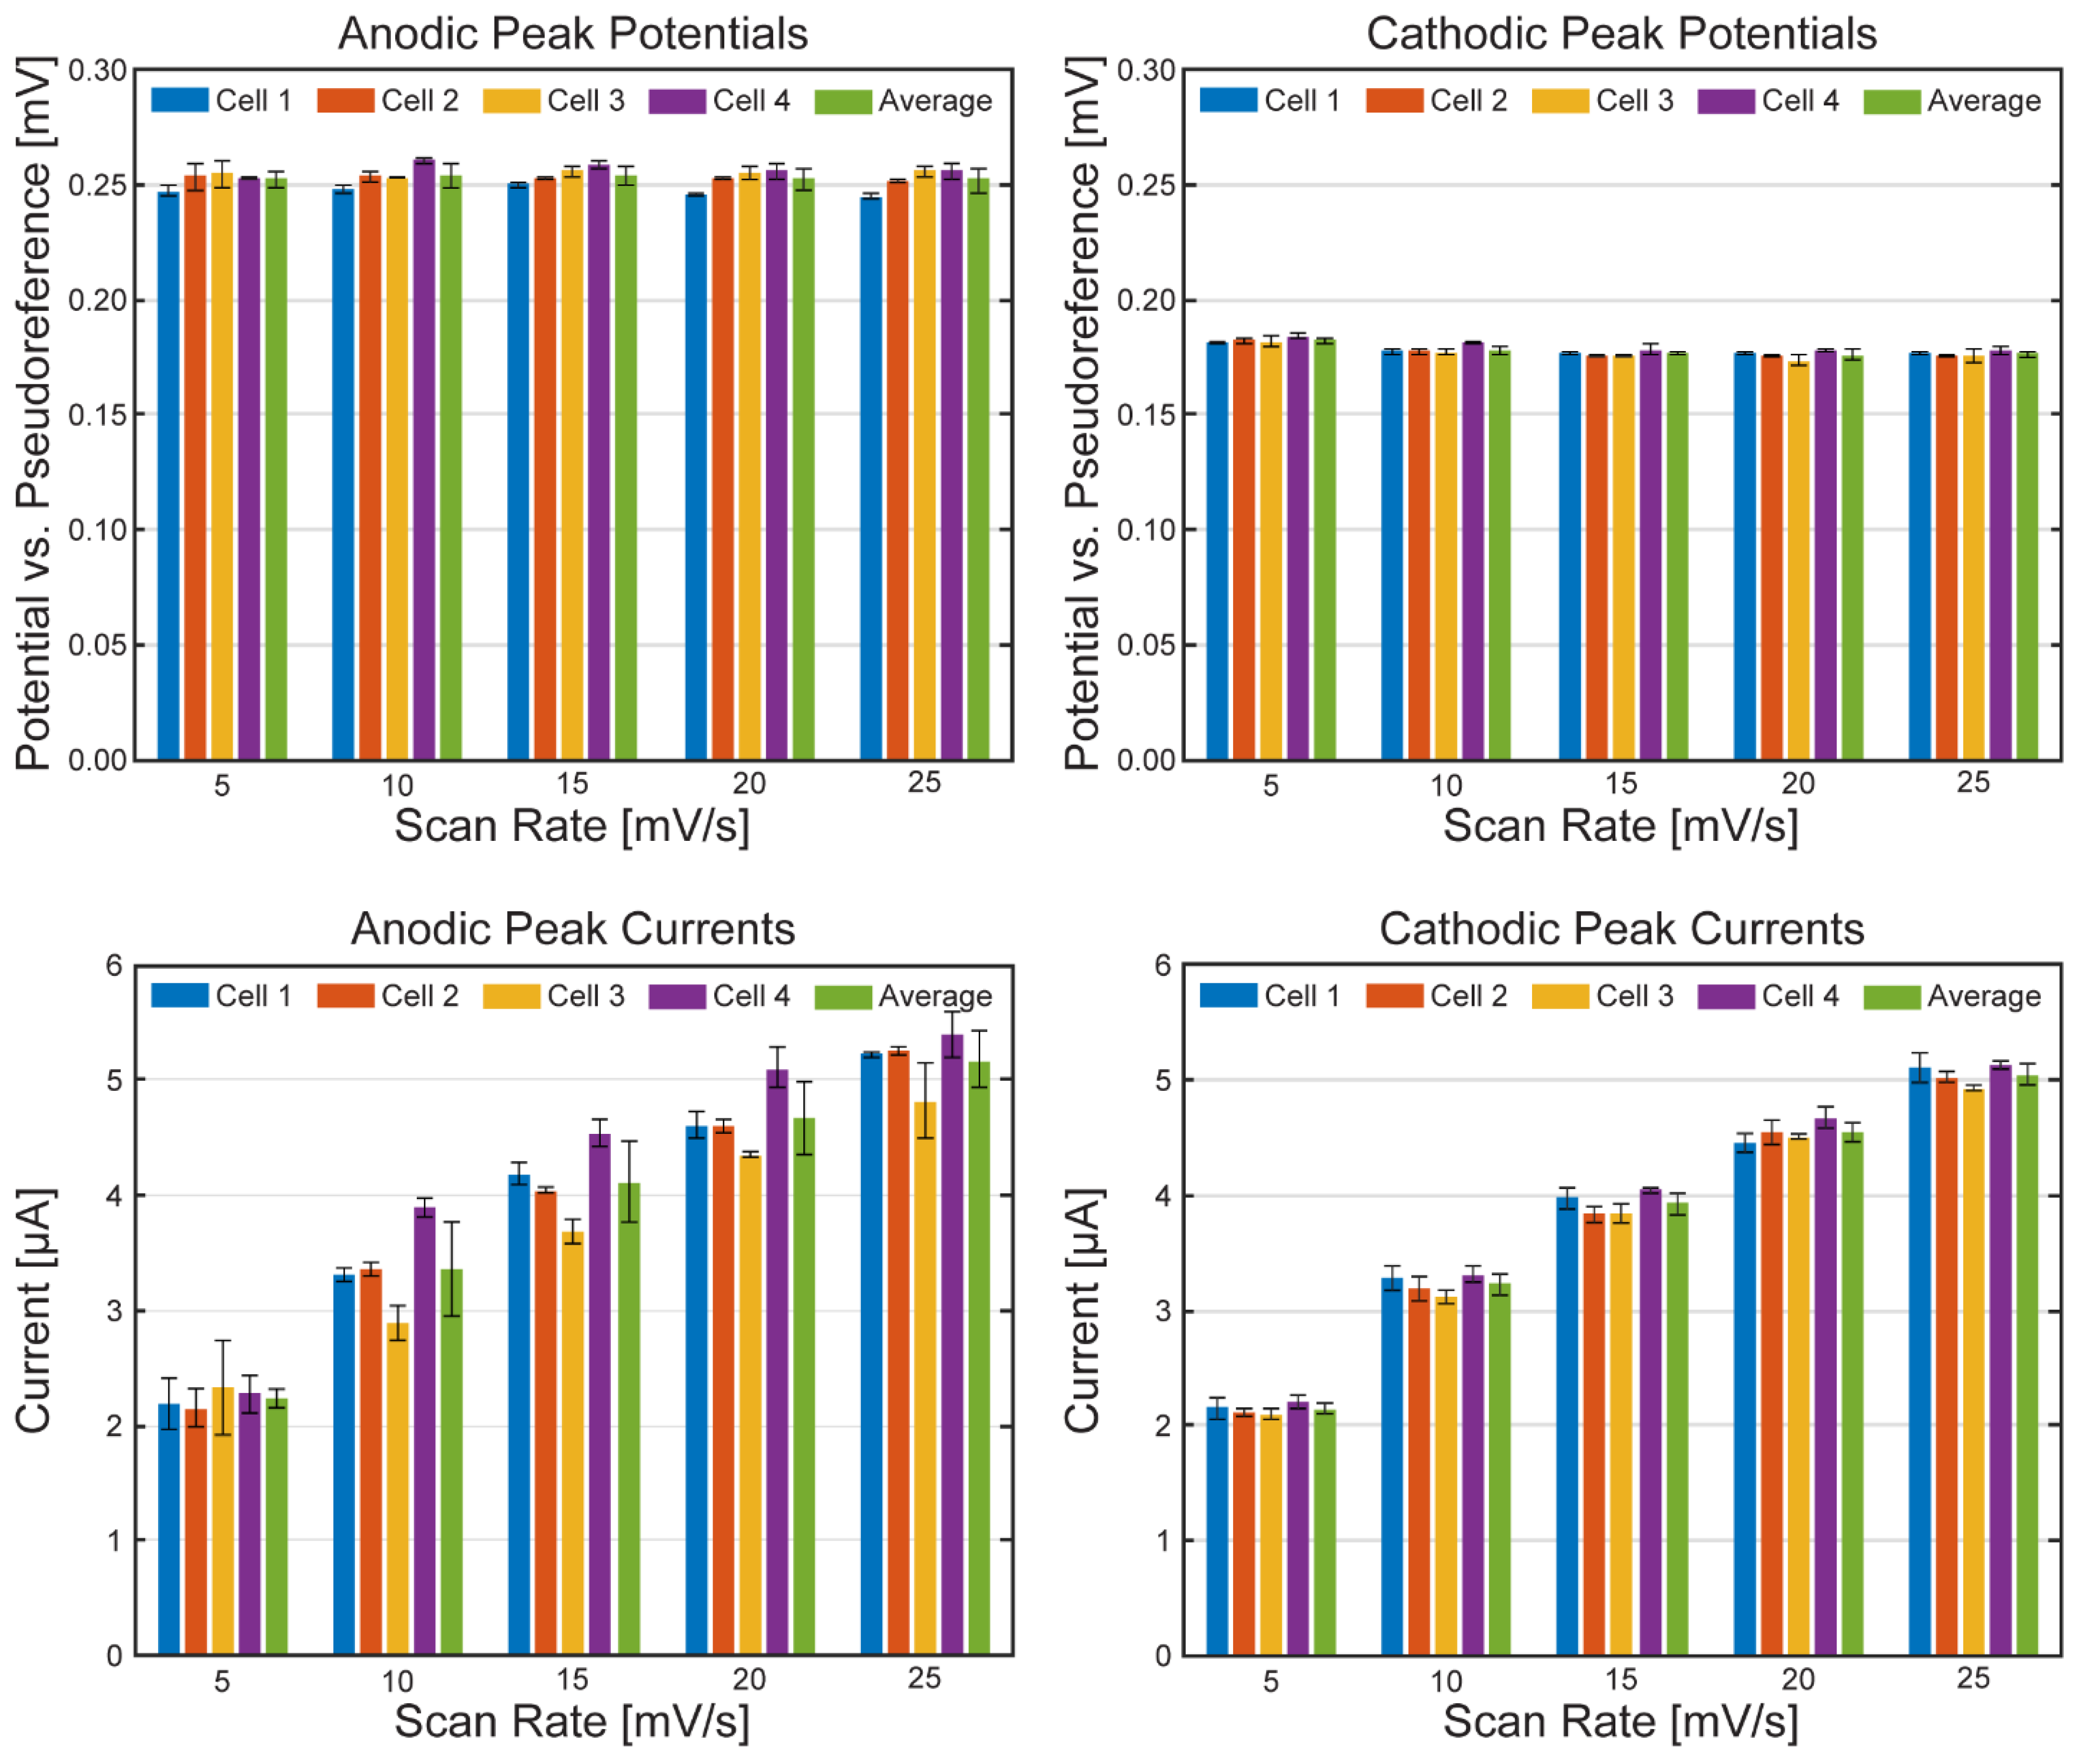
Figure 9.
Randles–Ševčík fits for each µ-BEC cell. Linear regression fits of the anodic (doted blue) and cathodic (red) sweeps of the ferri/ferrocyanide redox probe inside the µ-BEC platform in cell 1 (A), cell 2 (B), cell 3 (C), and cell 4 (D).
Figure 9.
Randles–Ševčík fits for each µ-BEC cell. Linear regression fits of the anodic (doted blue) and cathodic (red) sweeps of the ferri/ferrocyanide redox probe inside the µ-BEC platform in cell 1 (A), cell 2 (B), cell 3 (C), and cell 4 (D).
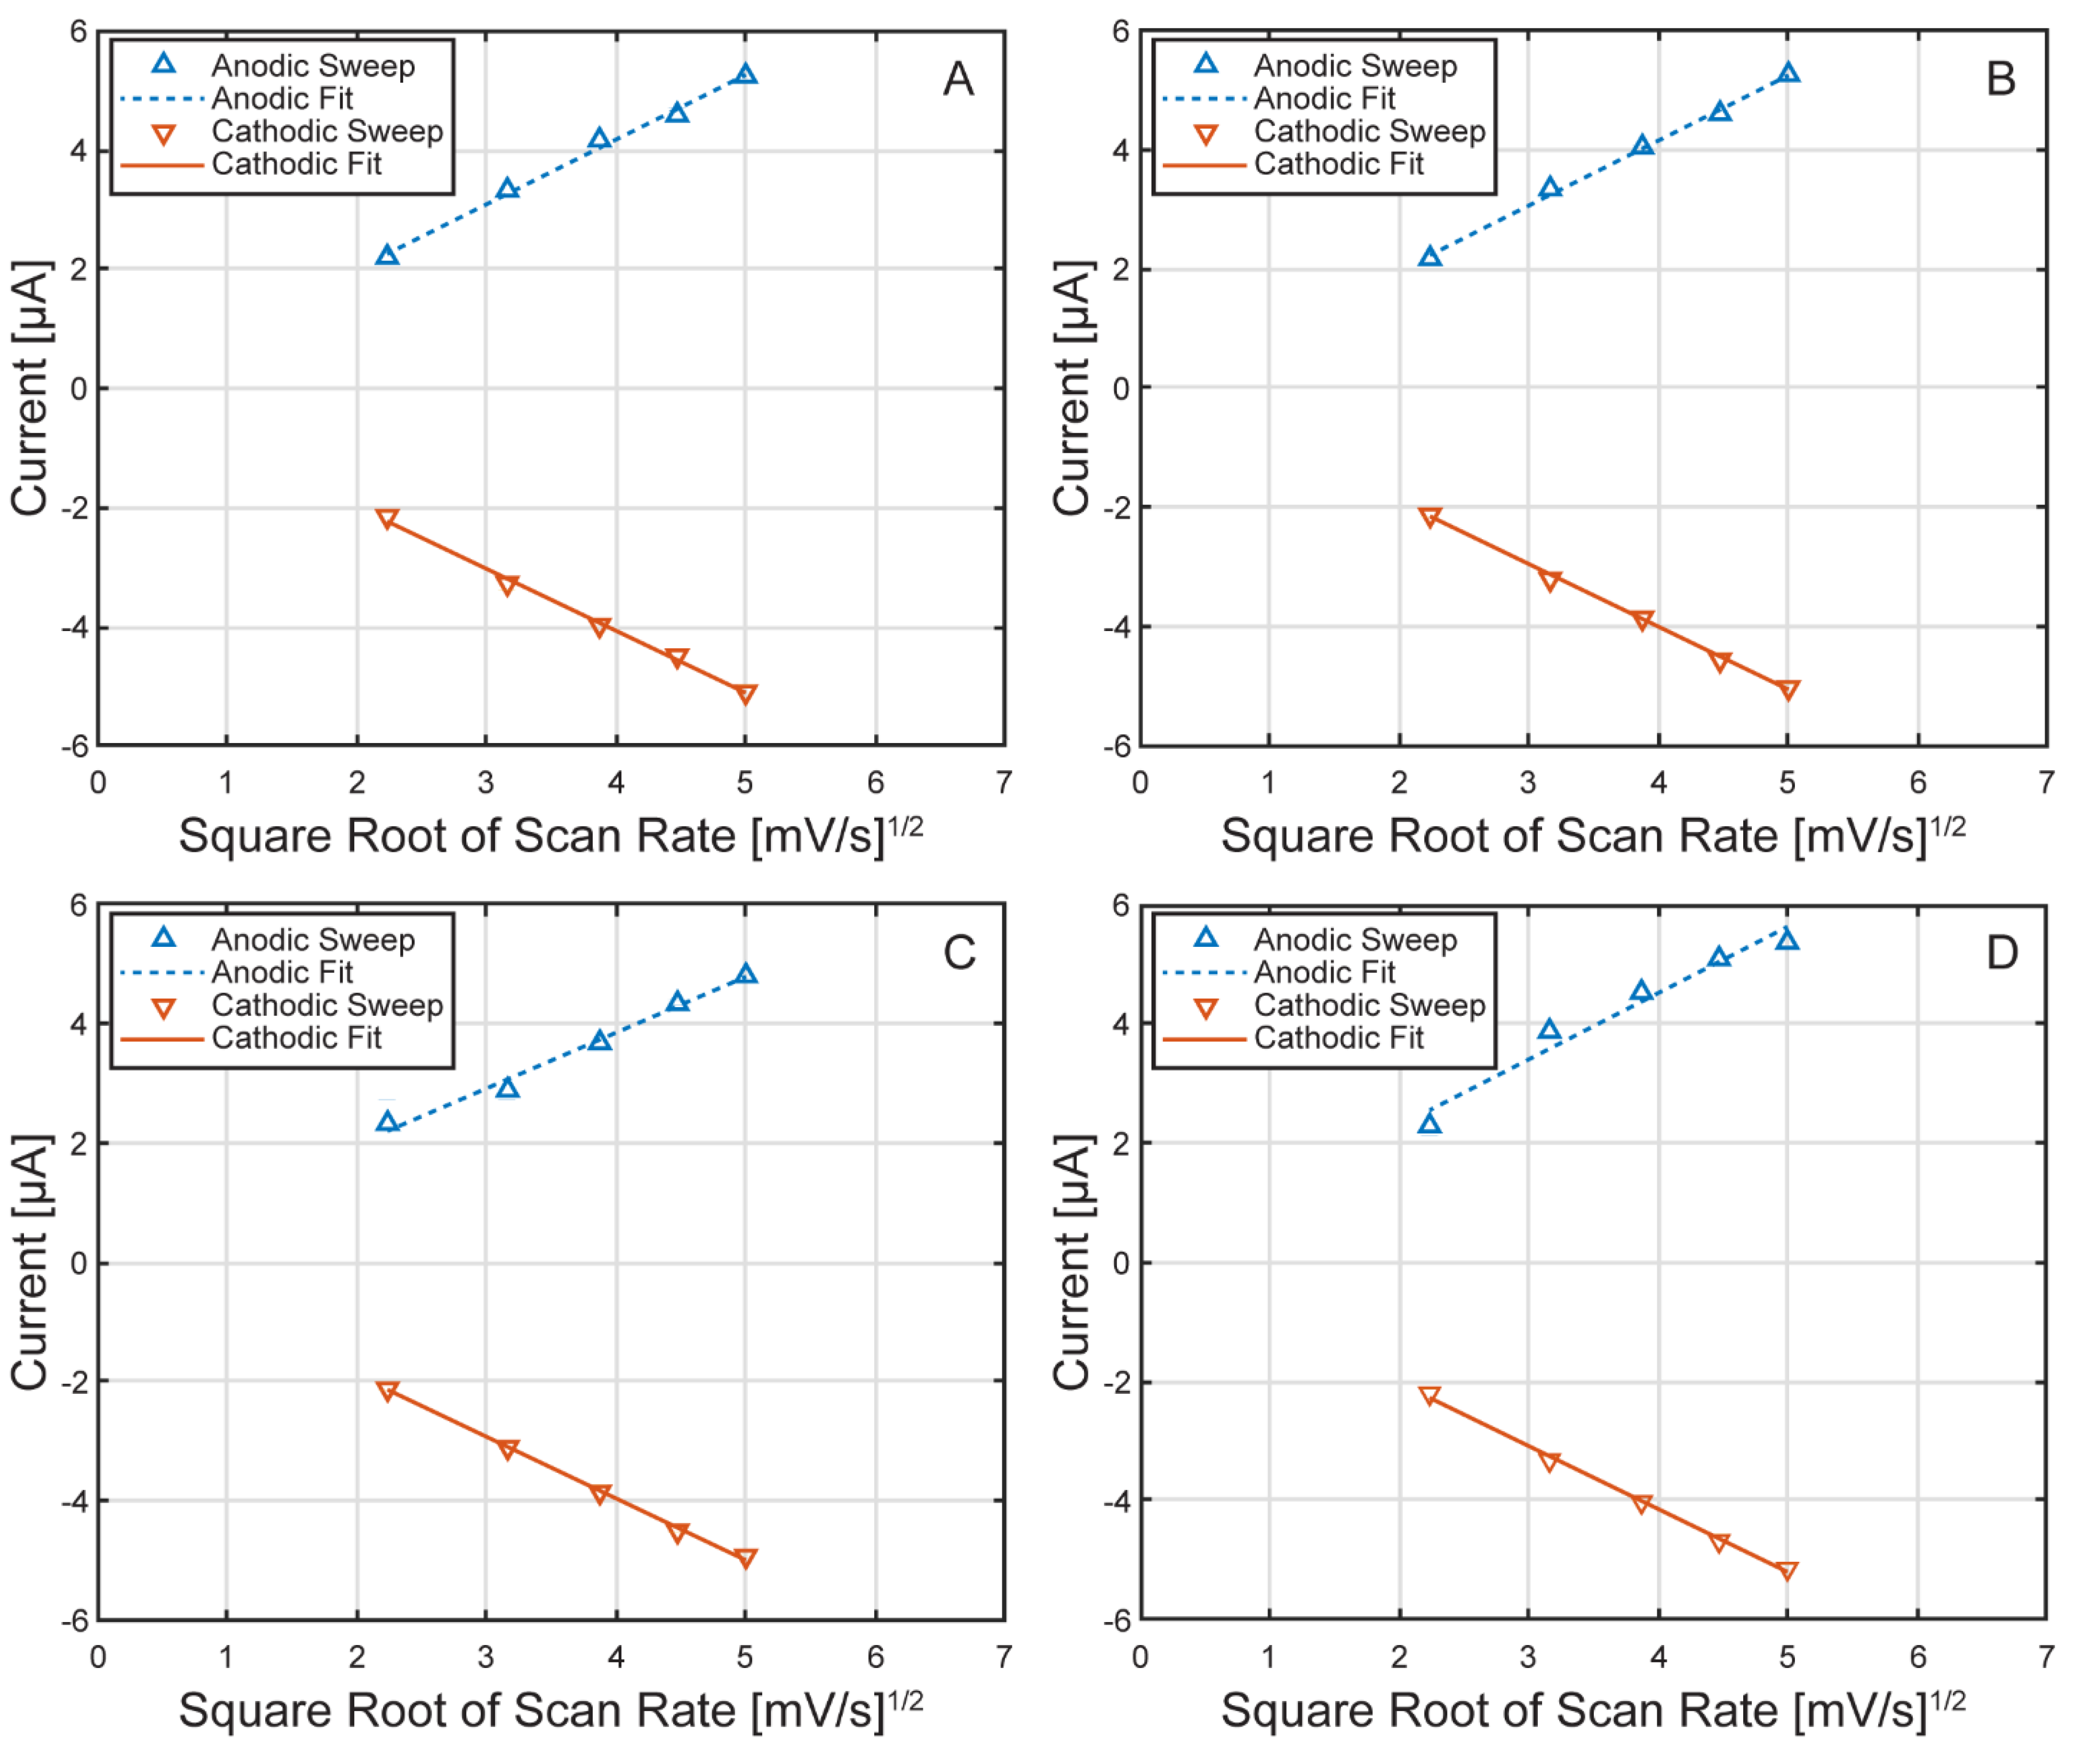
Figure 10.
Electron uptake by TIE-1 cells under illuminated conditions. 60 W incandescent light-bulb illumination and working electrode poised at +100 mV vs SHE. cell 1 (blue), cell 2 (red), cell 3 (yellow), cell 4 (purple).
Figure 10.
Electron uptake by TIE-1 cells under illuminated conditions. 60 W incandescent light-bulb illumination and working electrode poised at +100 mV vs SHE. cell 1 (blue), cell 2 (red), cell 3 (yellow), cell 4 (purple).
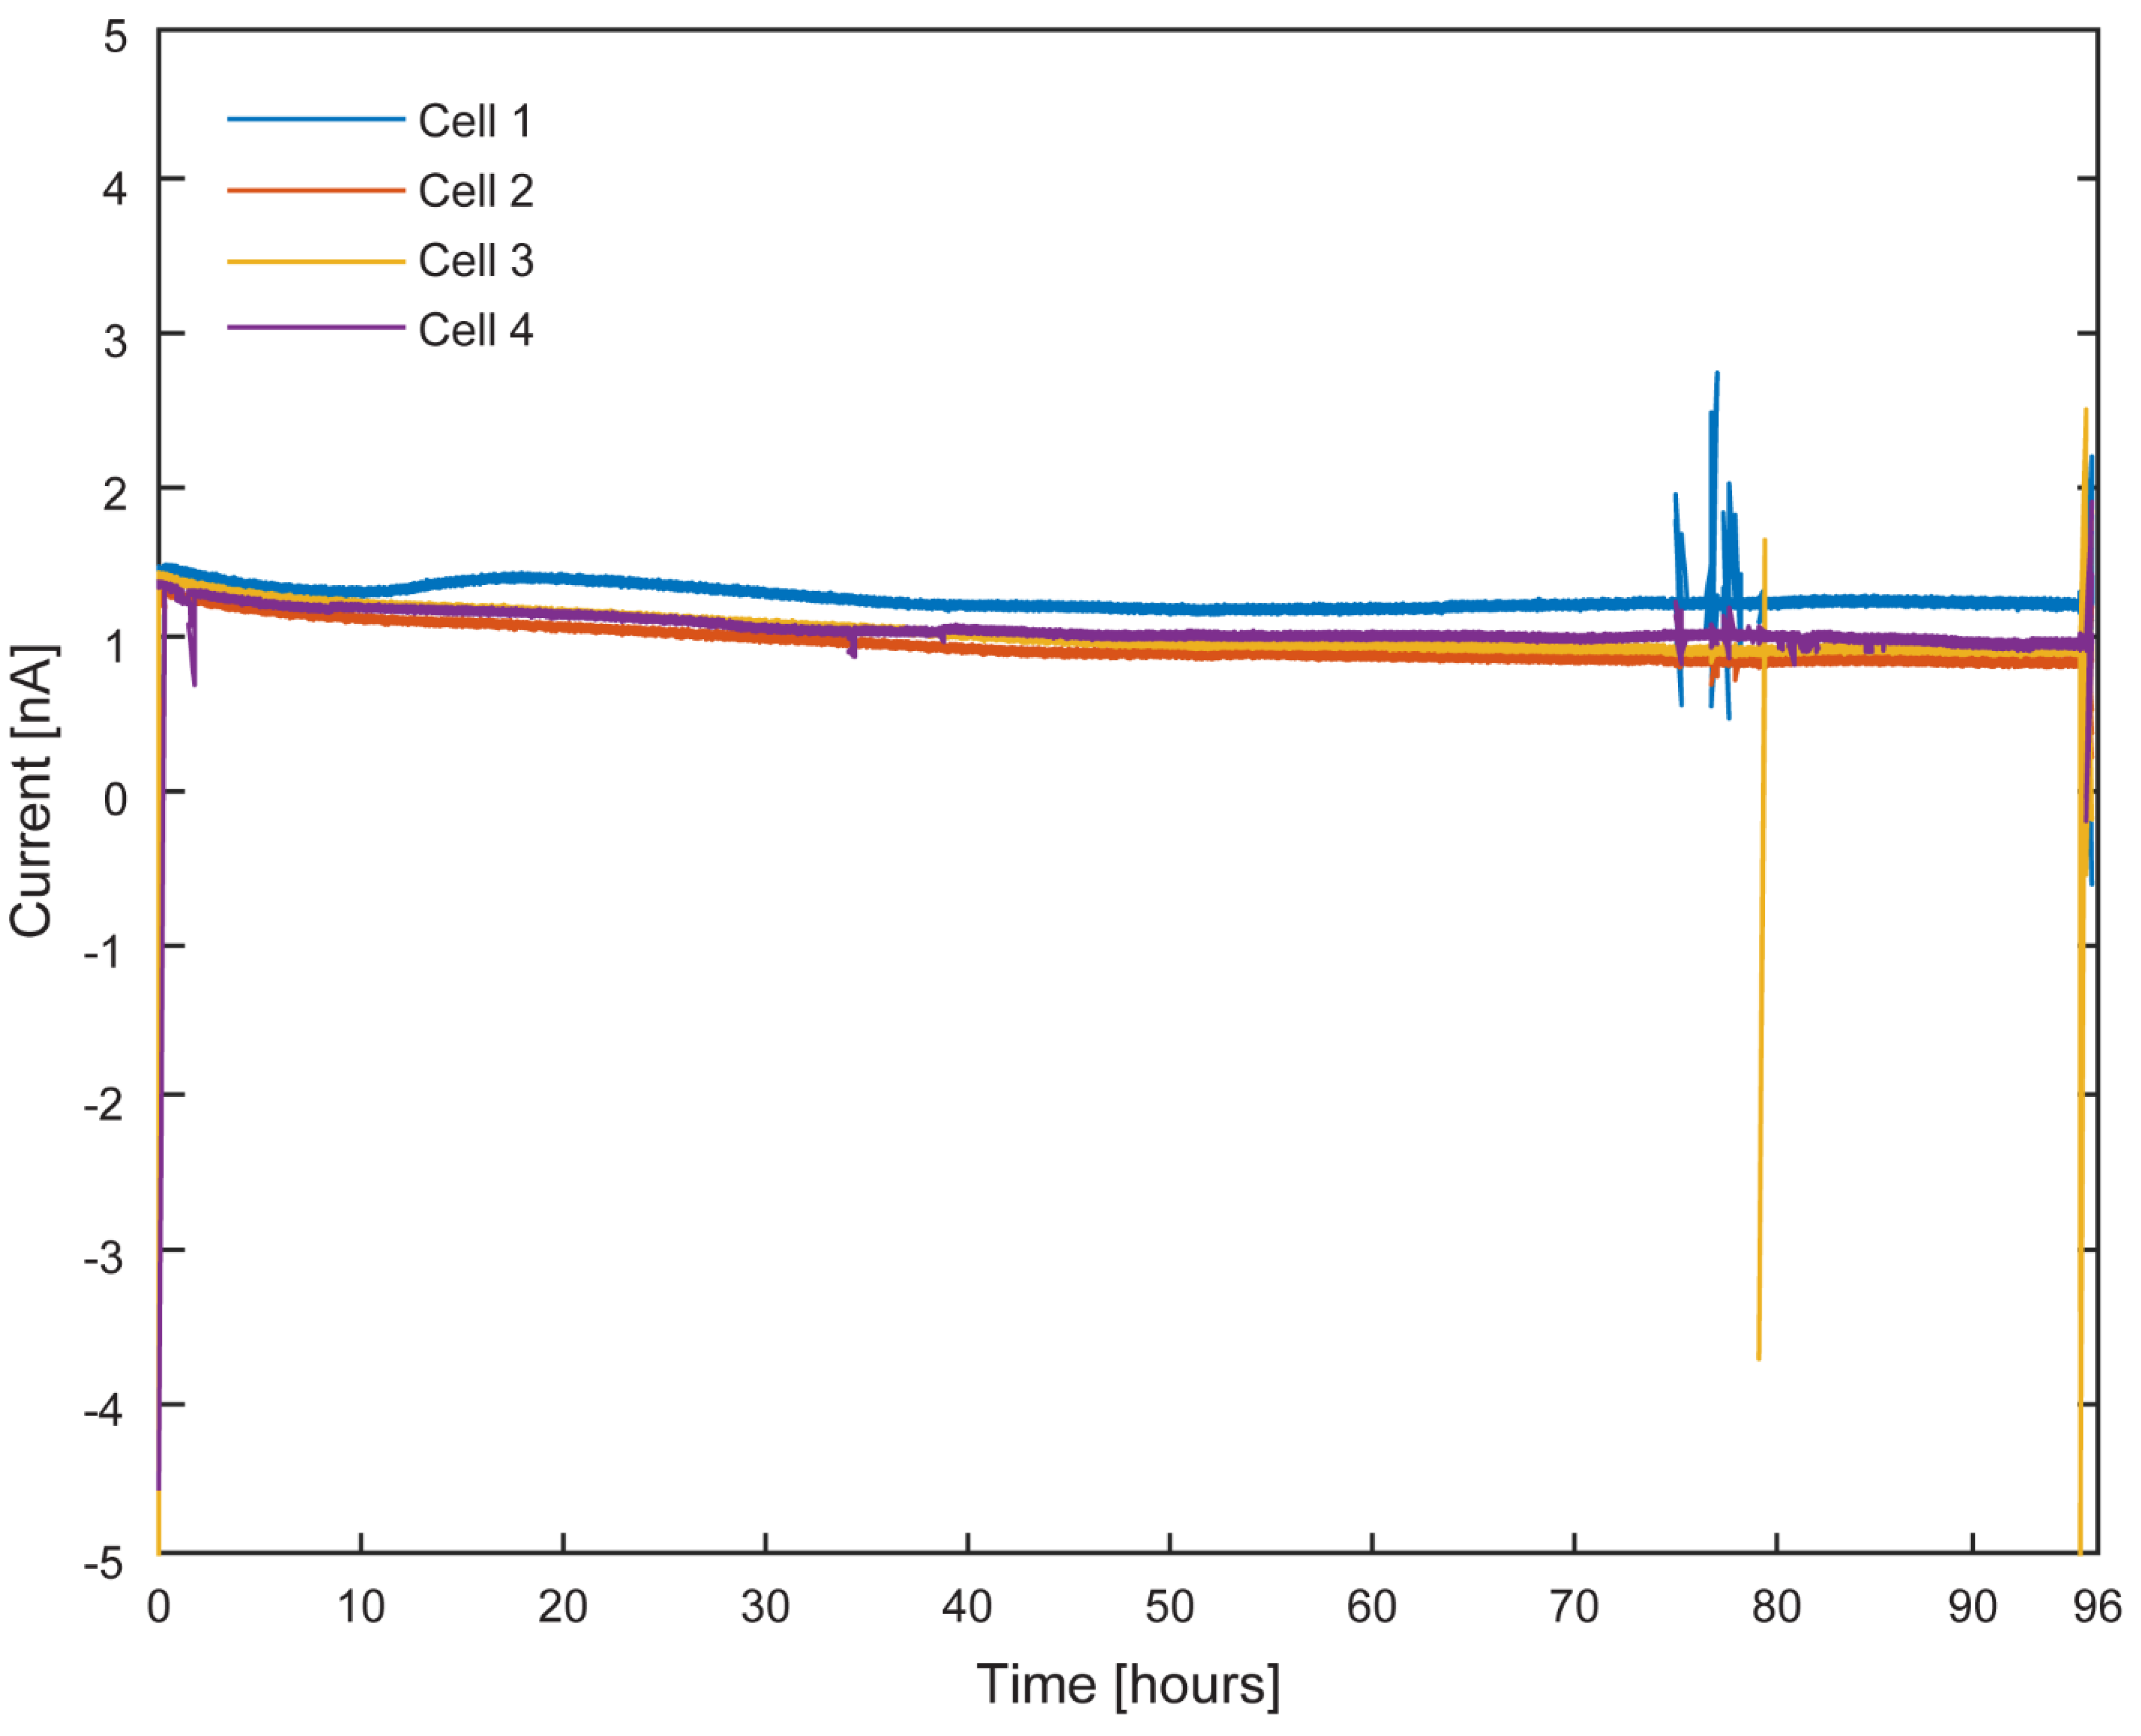
Figure 11.
Electron uptake by TIE-1 cells under light on and off conditions with planktonic cells. Overlayed runs of light on (white region) and light off (shaded region) under 60 W incandescent light-bulb illumination and working electrode poised at +100 mV vs SHE. Cell 1 (A), cell 2 (B), cell 3 (C), cell 4 (D).
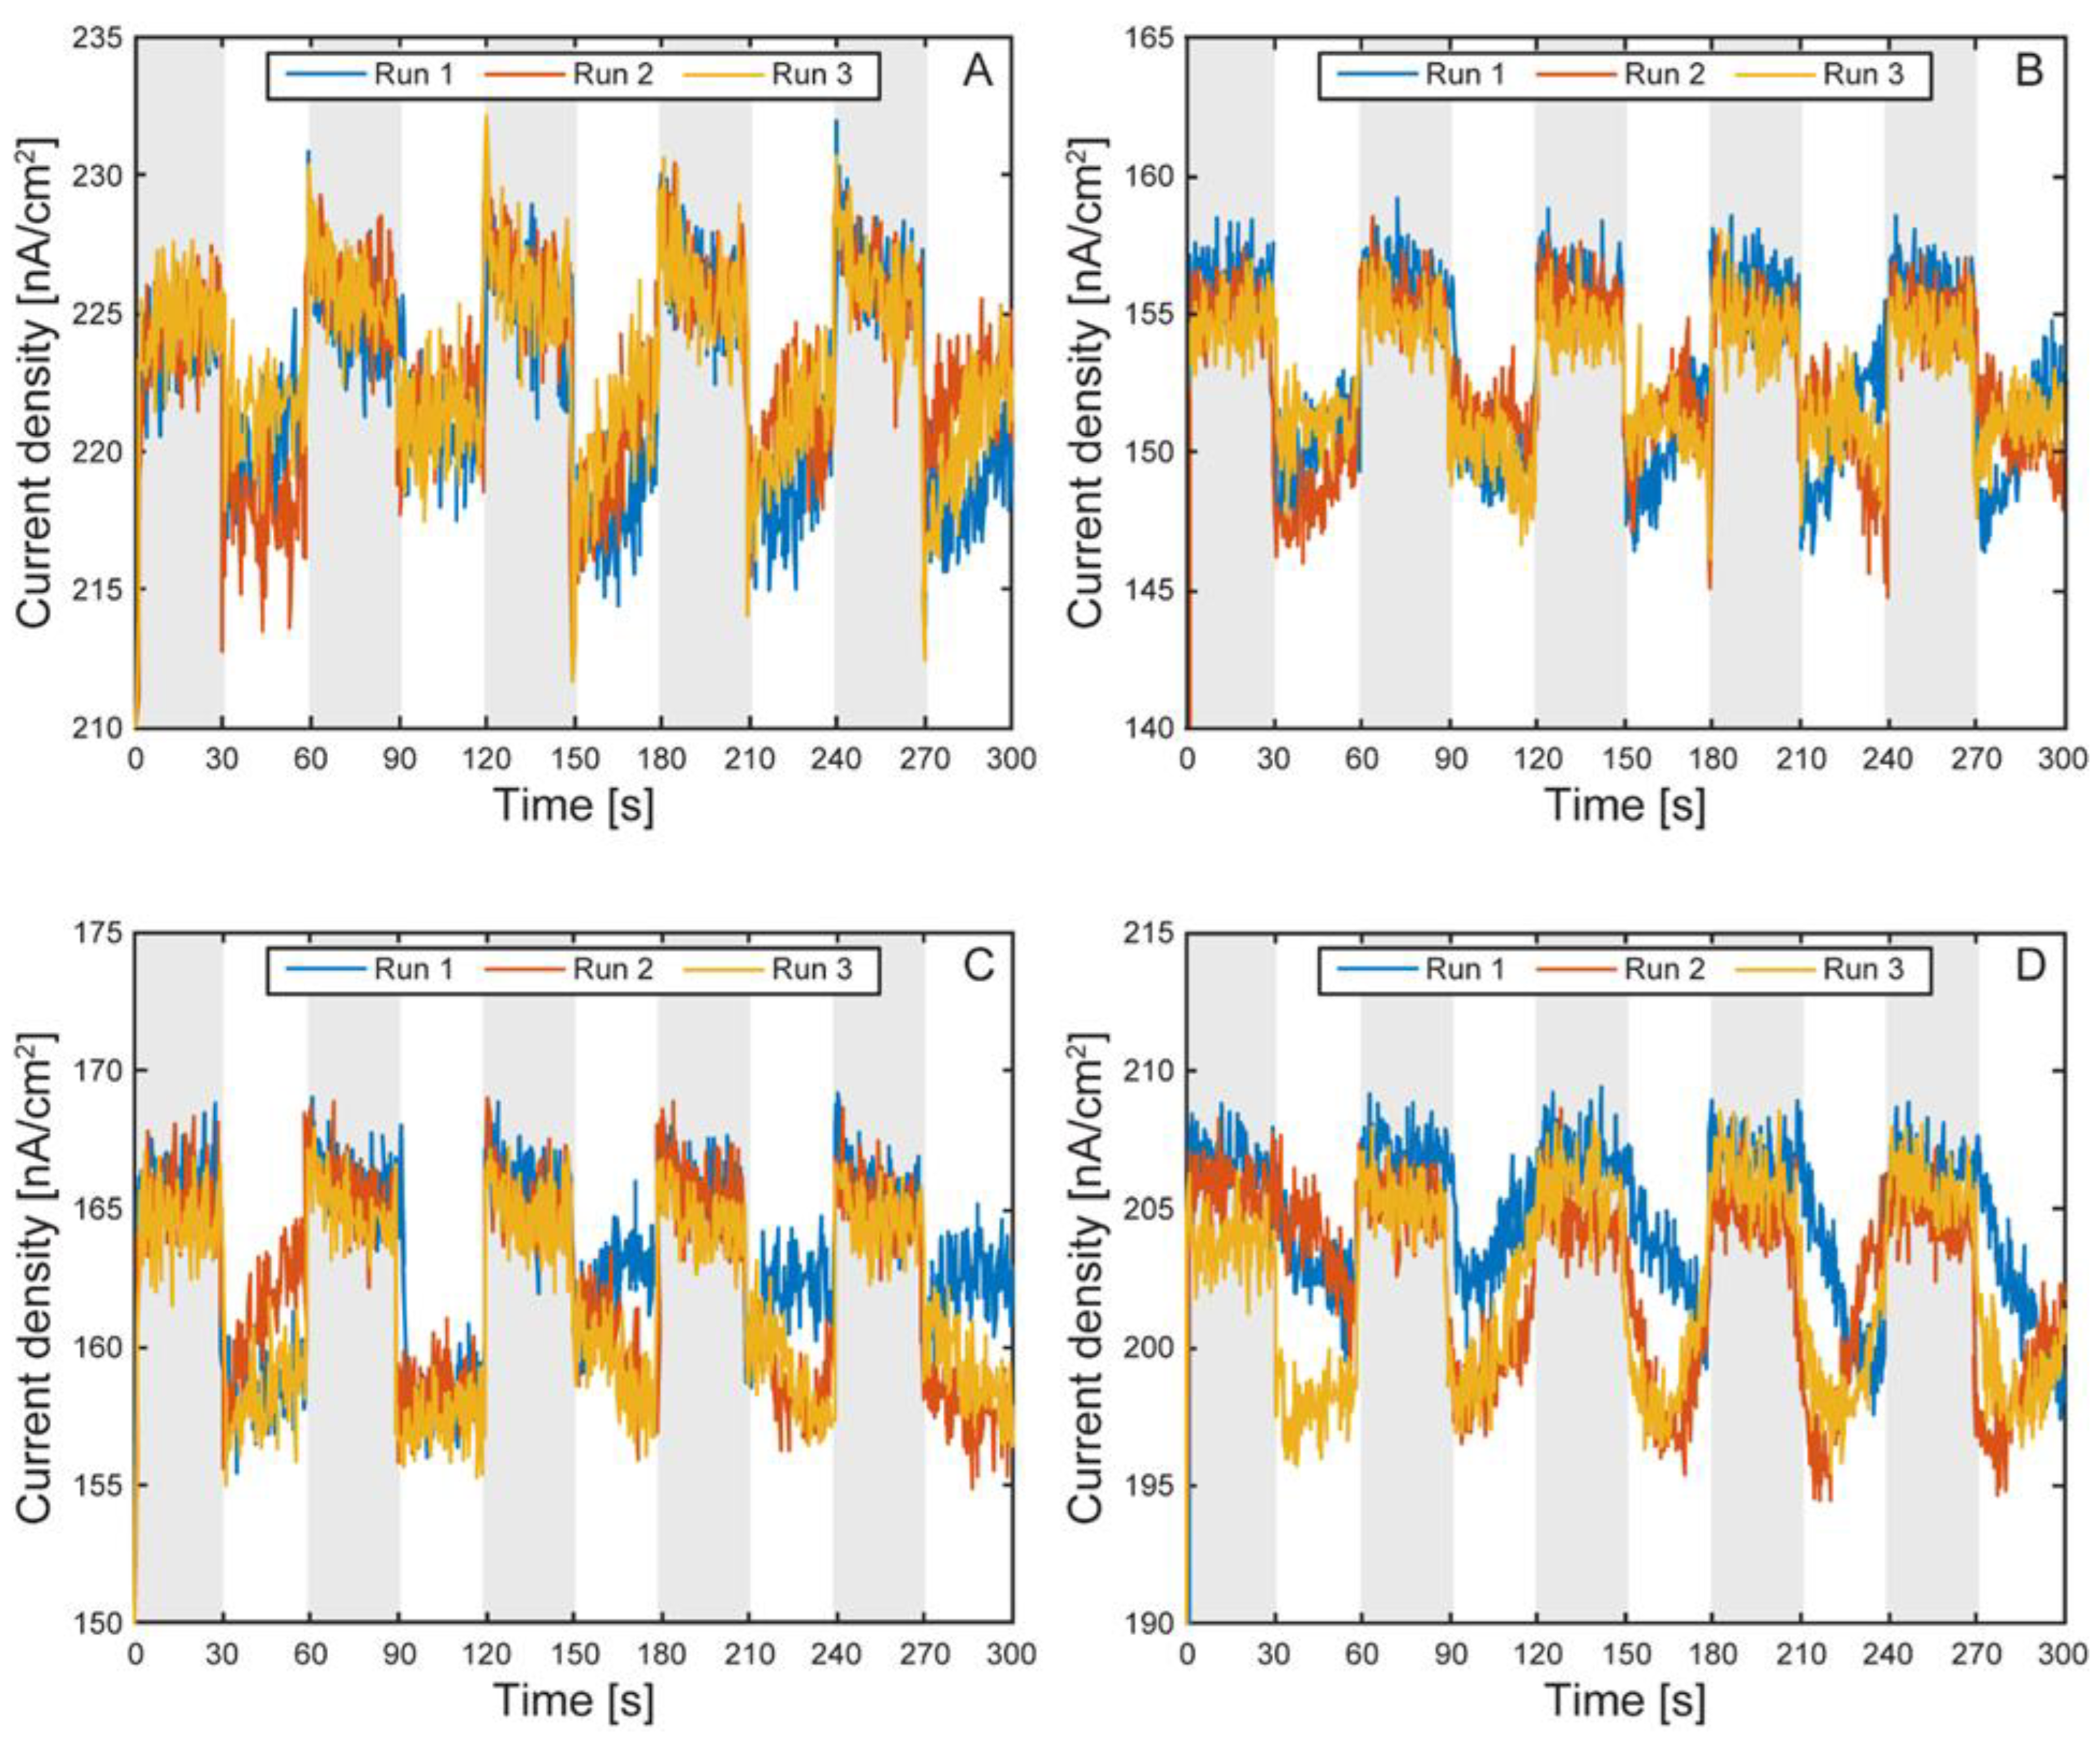
Figure 12.
Electron uptake by TIE-1 cells under light on and off conditions without planktonic cells. Overlayed runs of light on (white region) and light off (shaded region) under 60 W incandescent light-bulb illumination and working electrode poised at +100 mV vs SHE. Cell 1 (A), cell 2 (B), cell 3 (C), cell 4 (D).
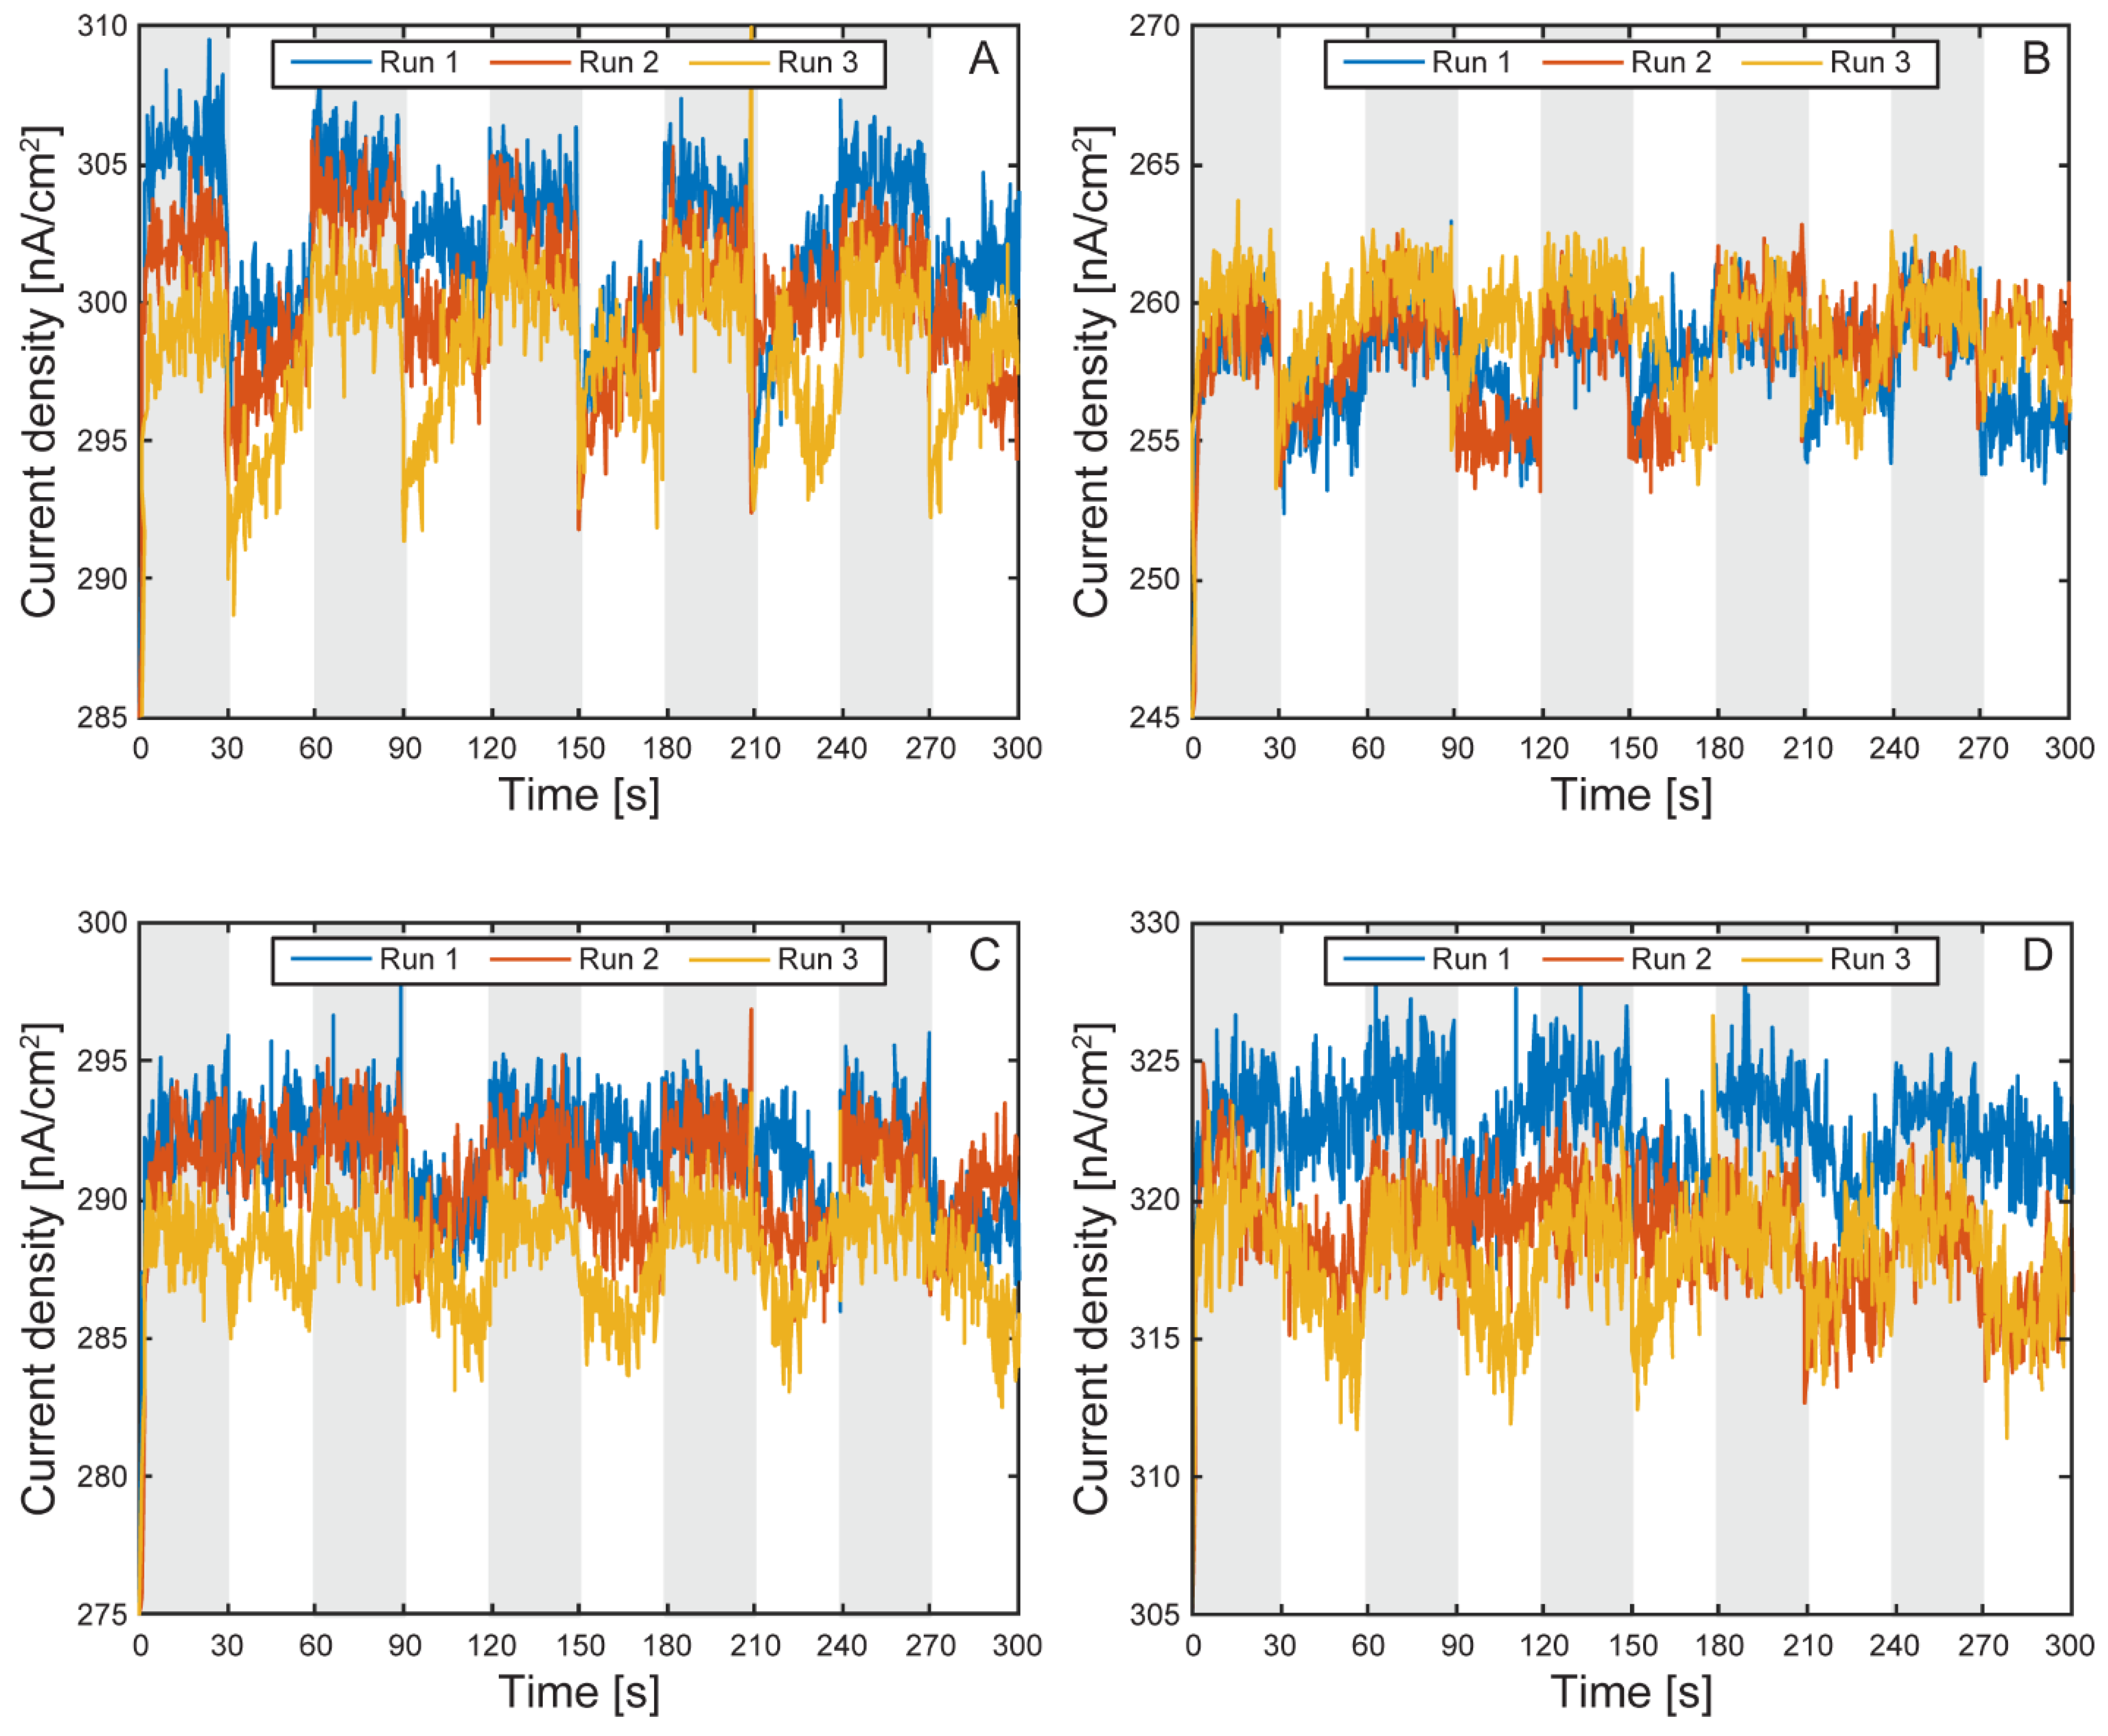
Figure 13.
Electron uptake comparison by TIE-1 cells under light on and off conditions with and without planktonic cells. Light on (white region) and light off (shaded region) under 60 W incandescent light-bulb illumination and working electrode poised at +100 mV vs SHE. Cell 1 (A), cell 2 (B), cell 3 (C), cell 4 (D).
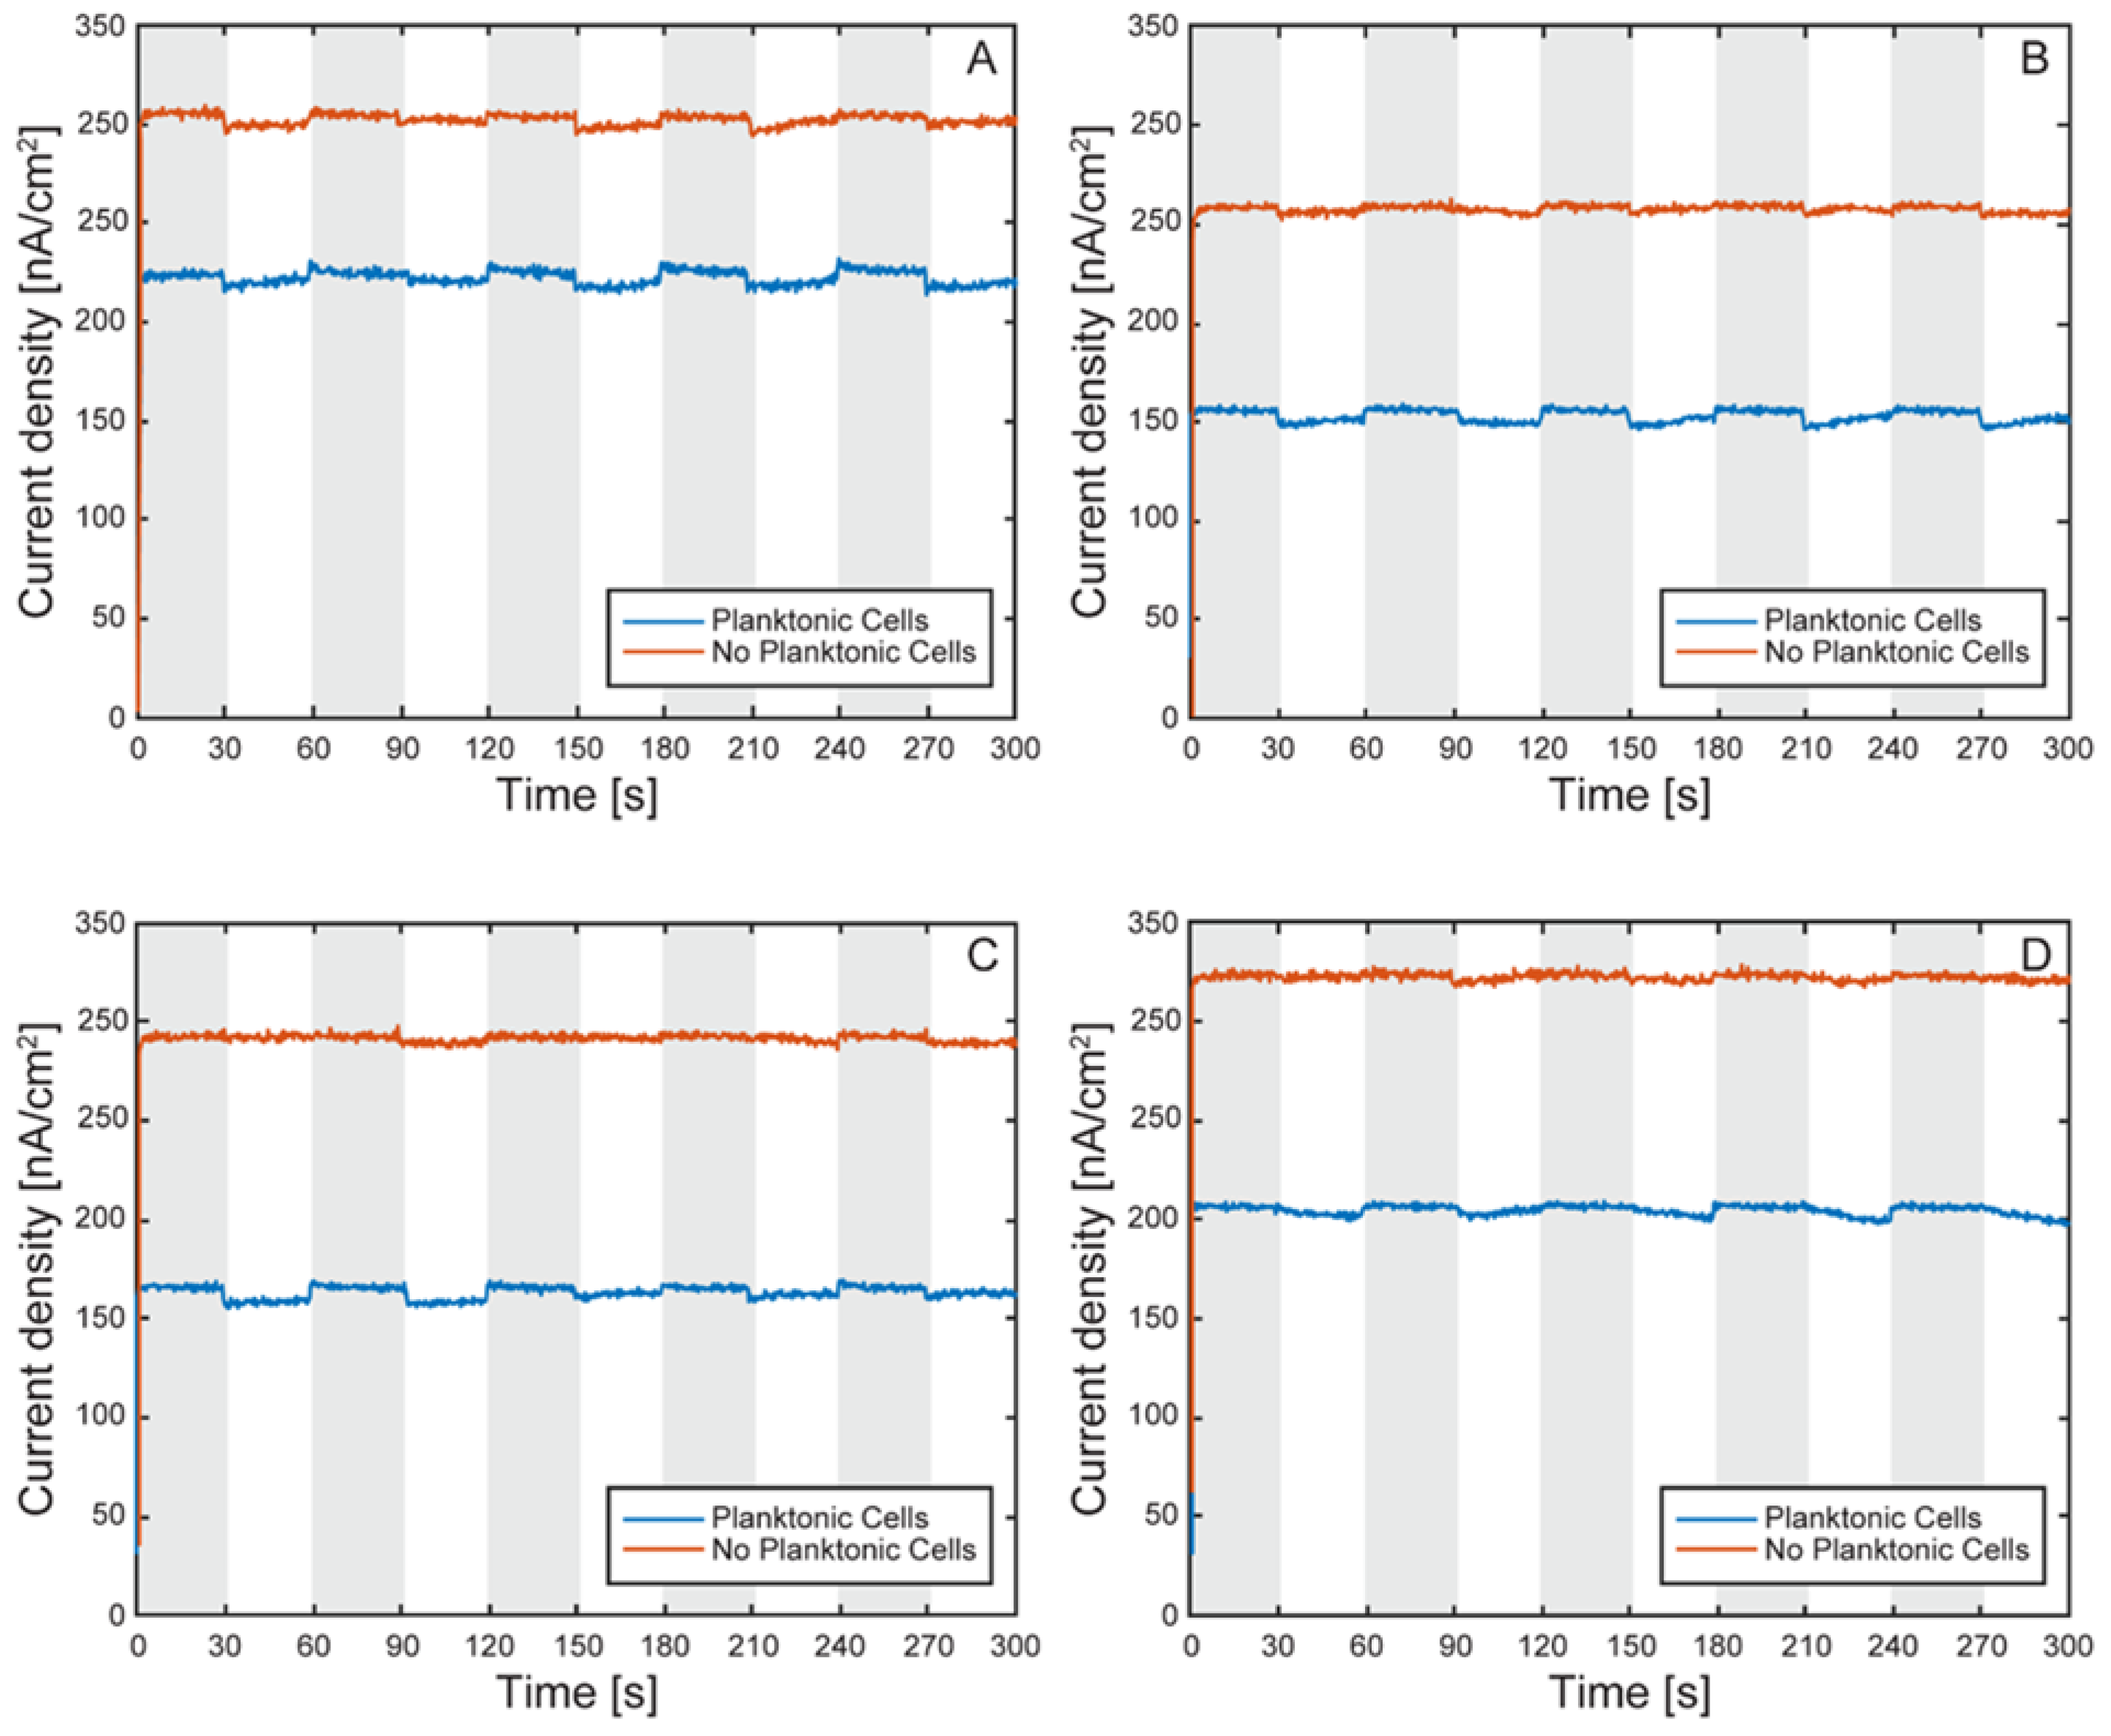
Figure 14.
Normalized electron uptake comparison by TIE-1 cells under light on and off conditions with and without planktonic cells. Light on (white region) and light off (shaded region) under 60 W incandescent light-bulb illumination and working electrode poised at +100 mV vs SHE. Cell 1 (A), cell 2 (B), cell 3 (C), cell 4 (D).
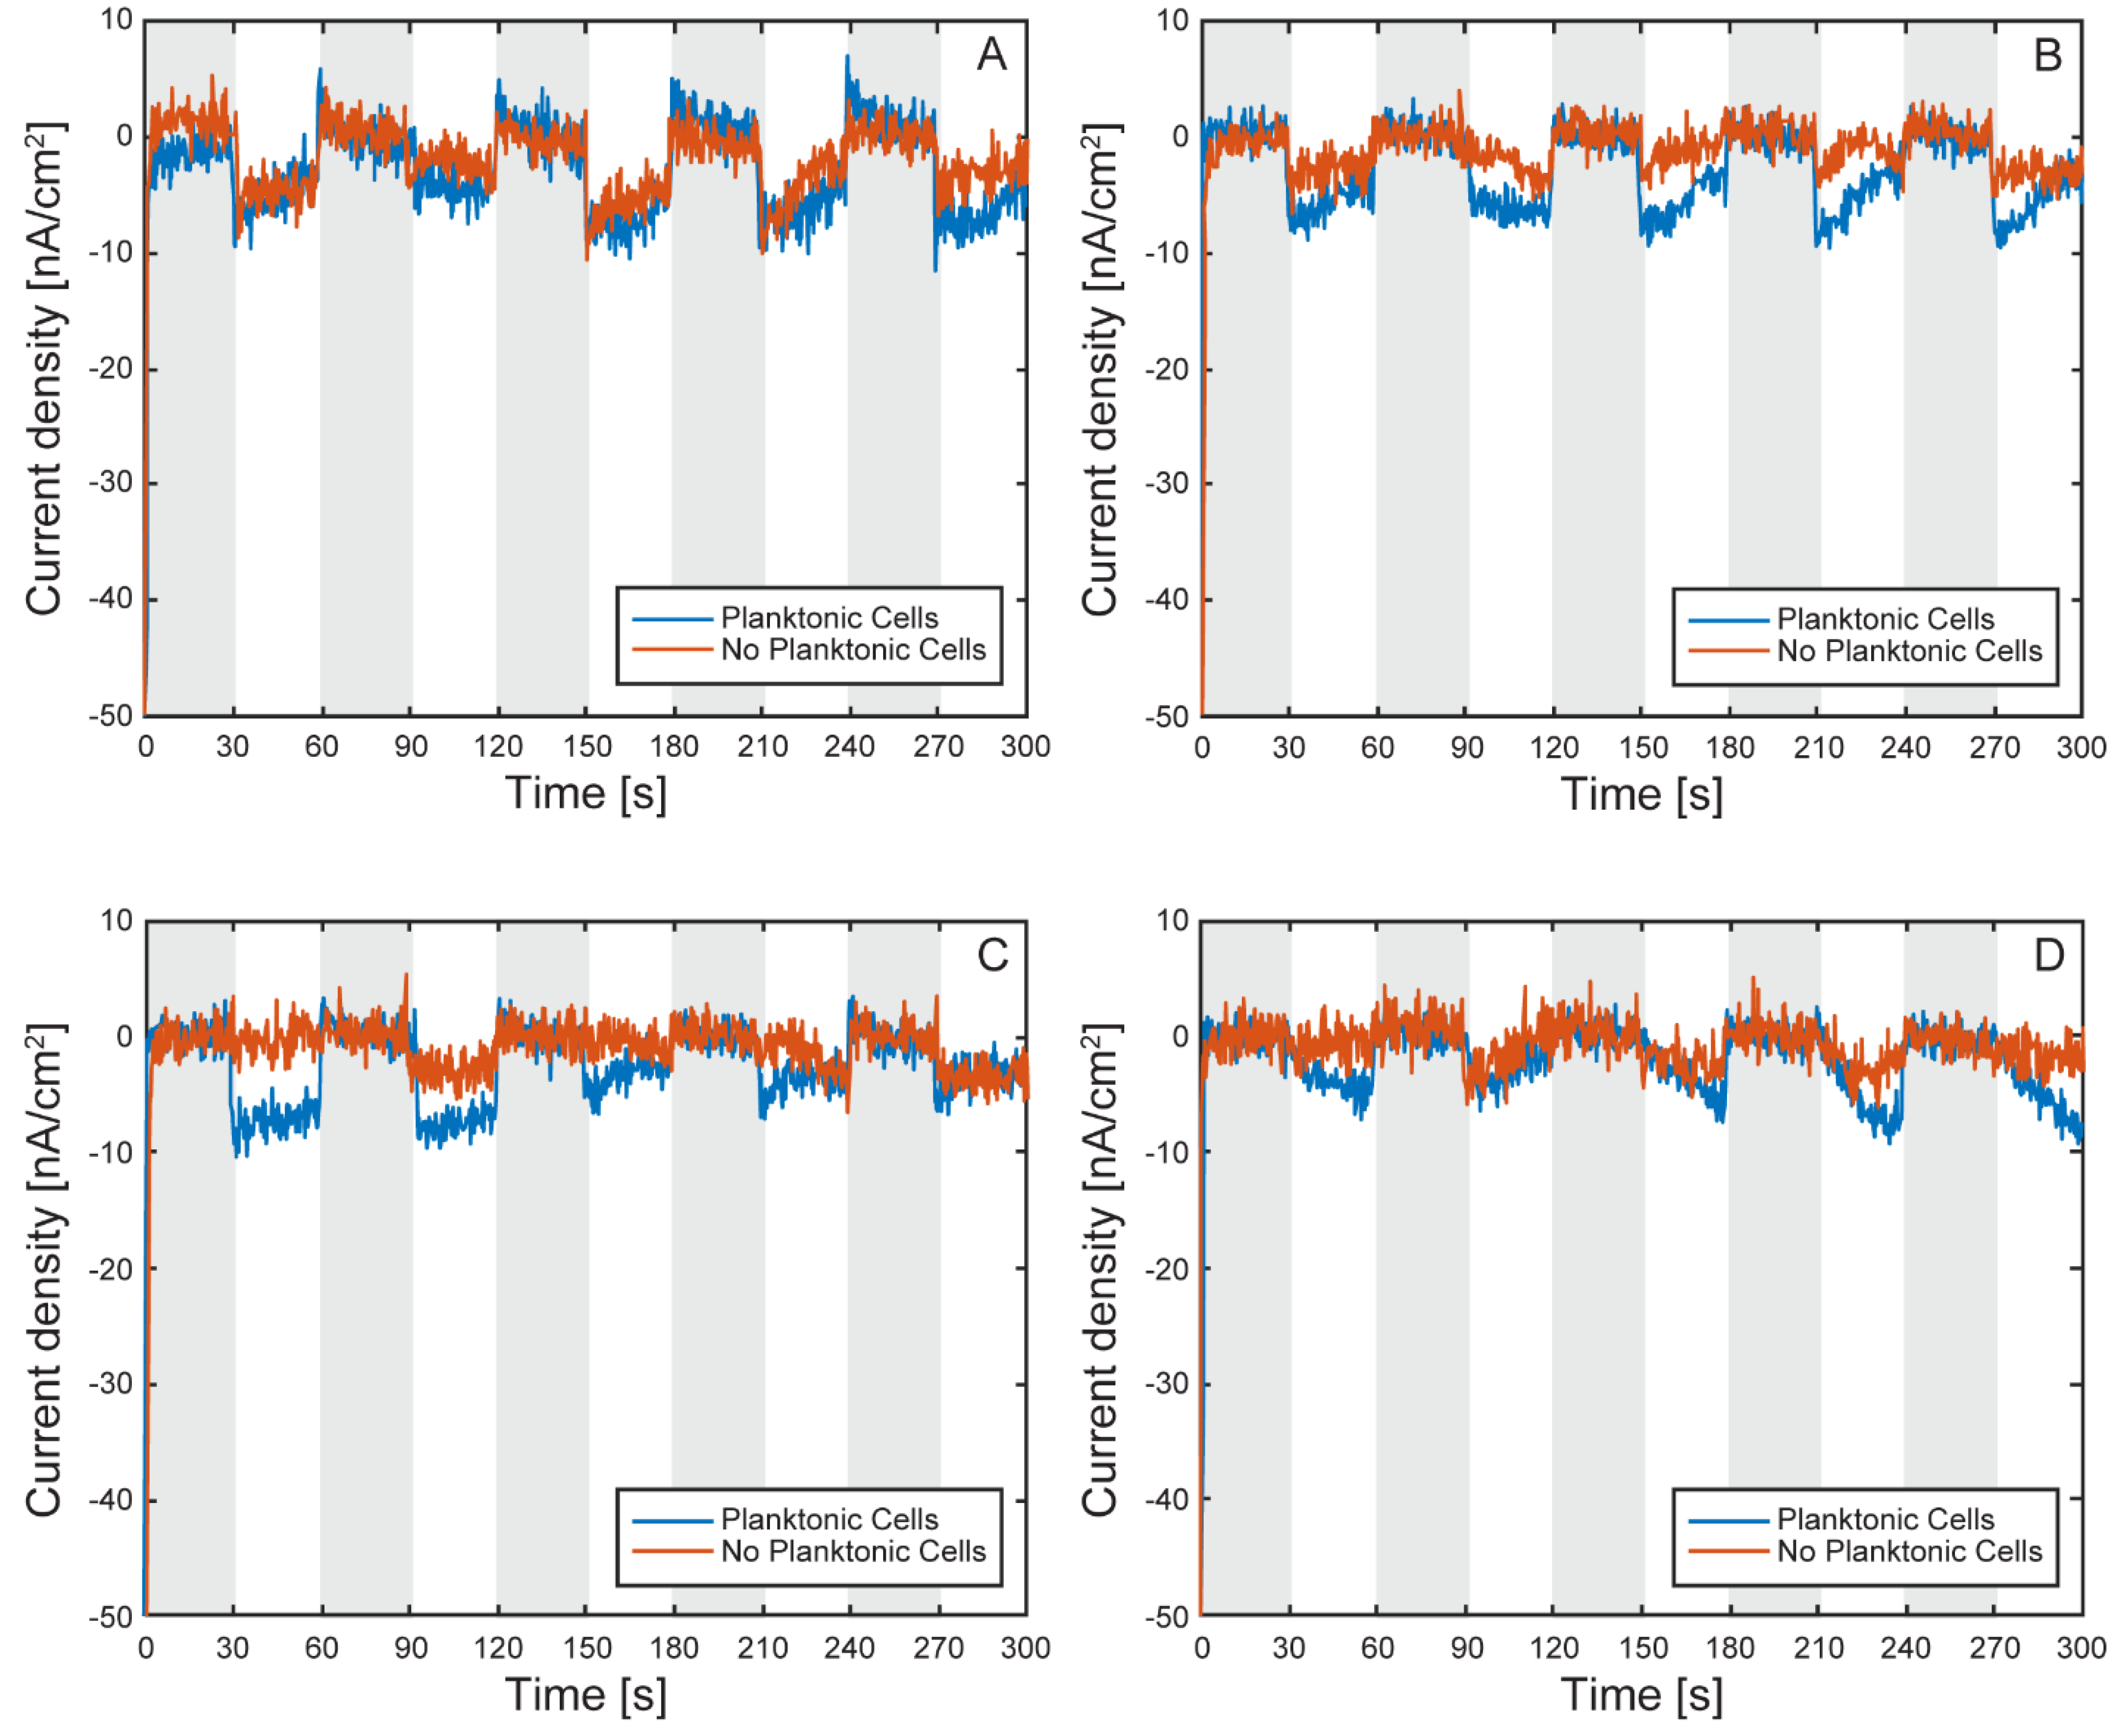
Figure 15.
Average current uptake by TIE-1 cells under illuminated conditions versus dark conditions. With planktonic cells (blue) or without planktonic cells (red) under 60 W incandescent light-bulb illumination and working electrode poised at +100 mV vs SHE. Error bars represent standard deviation.
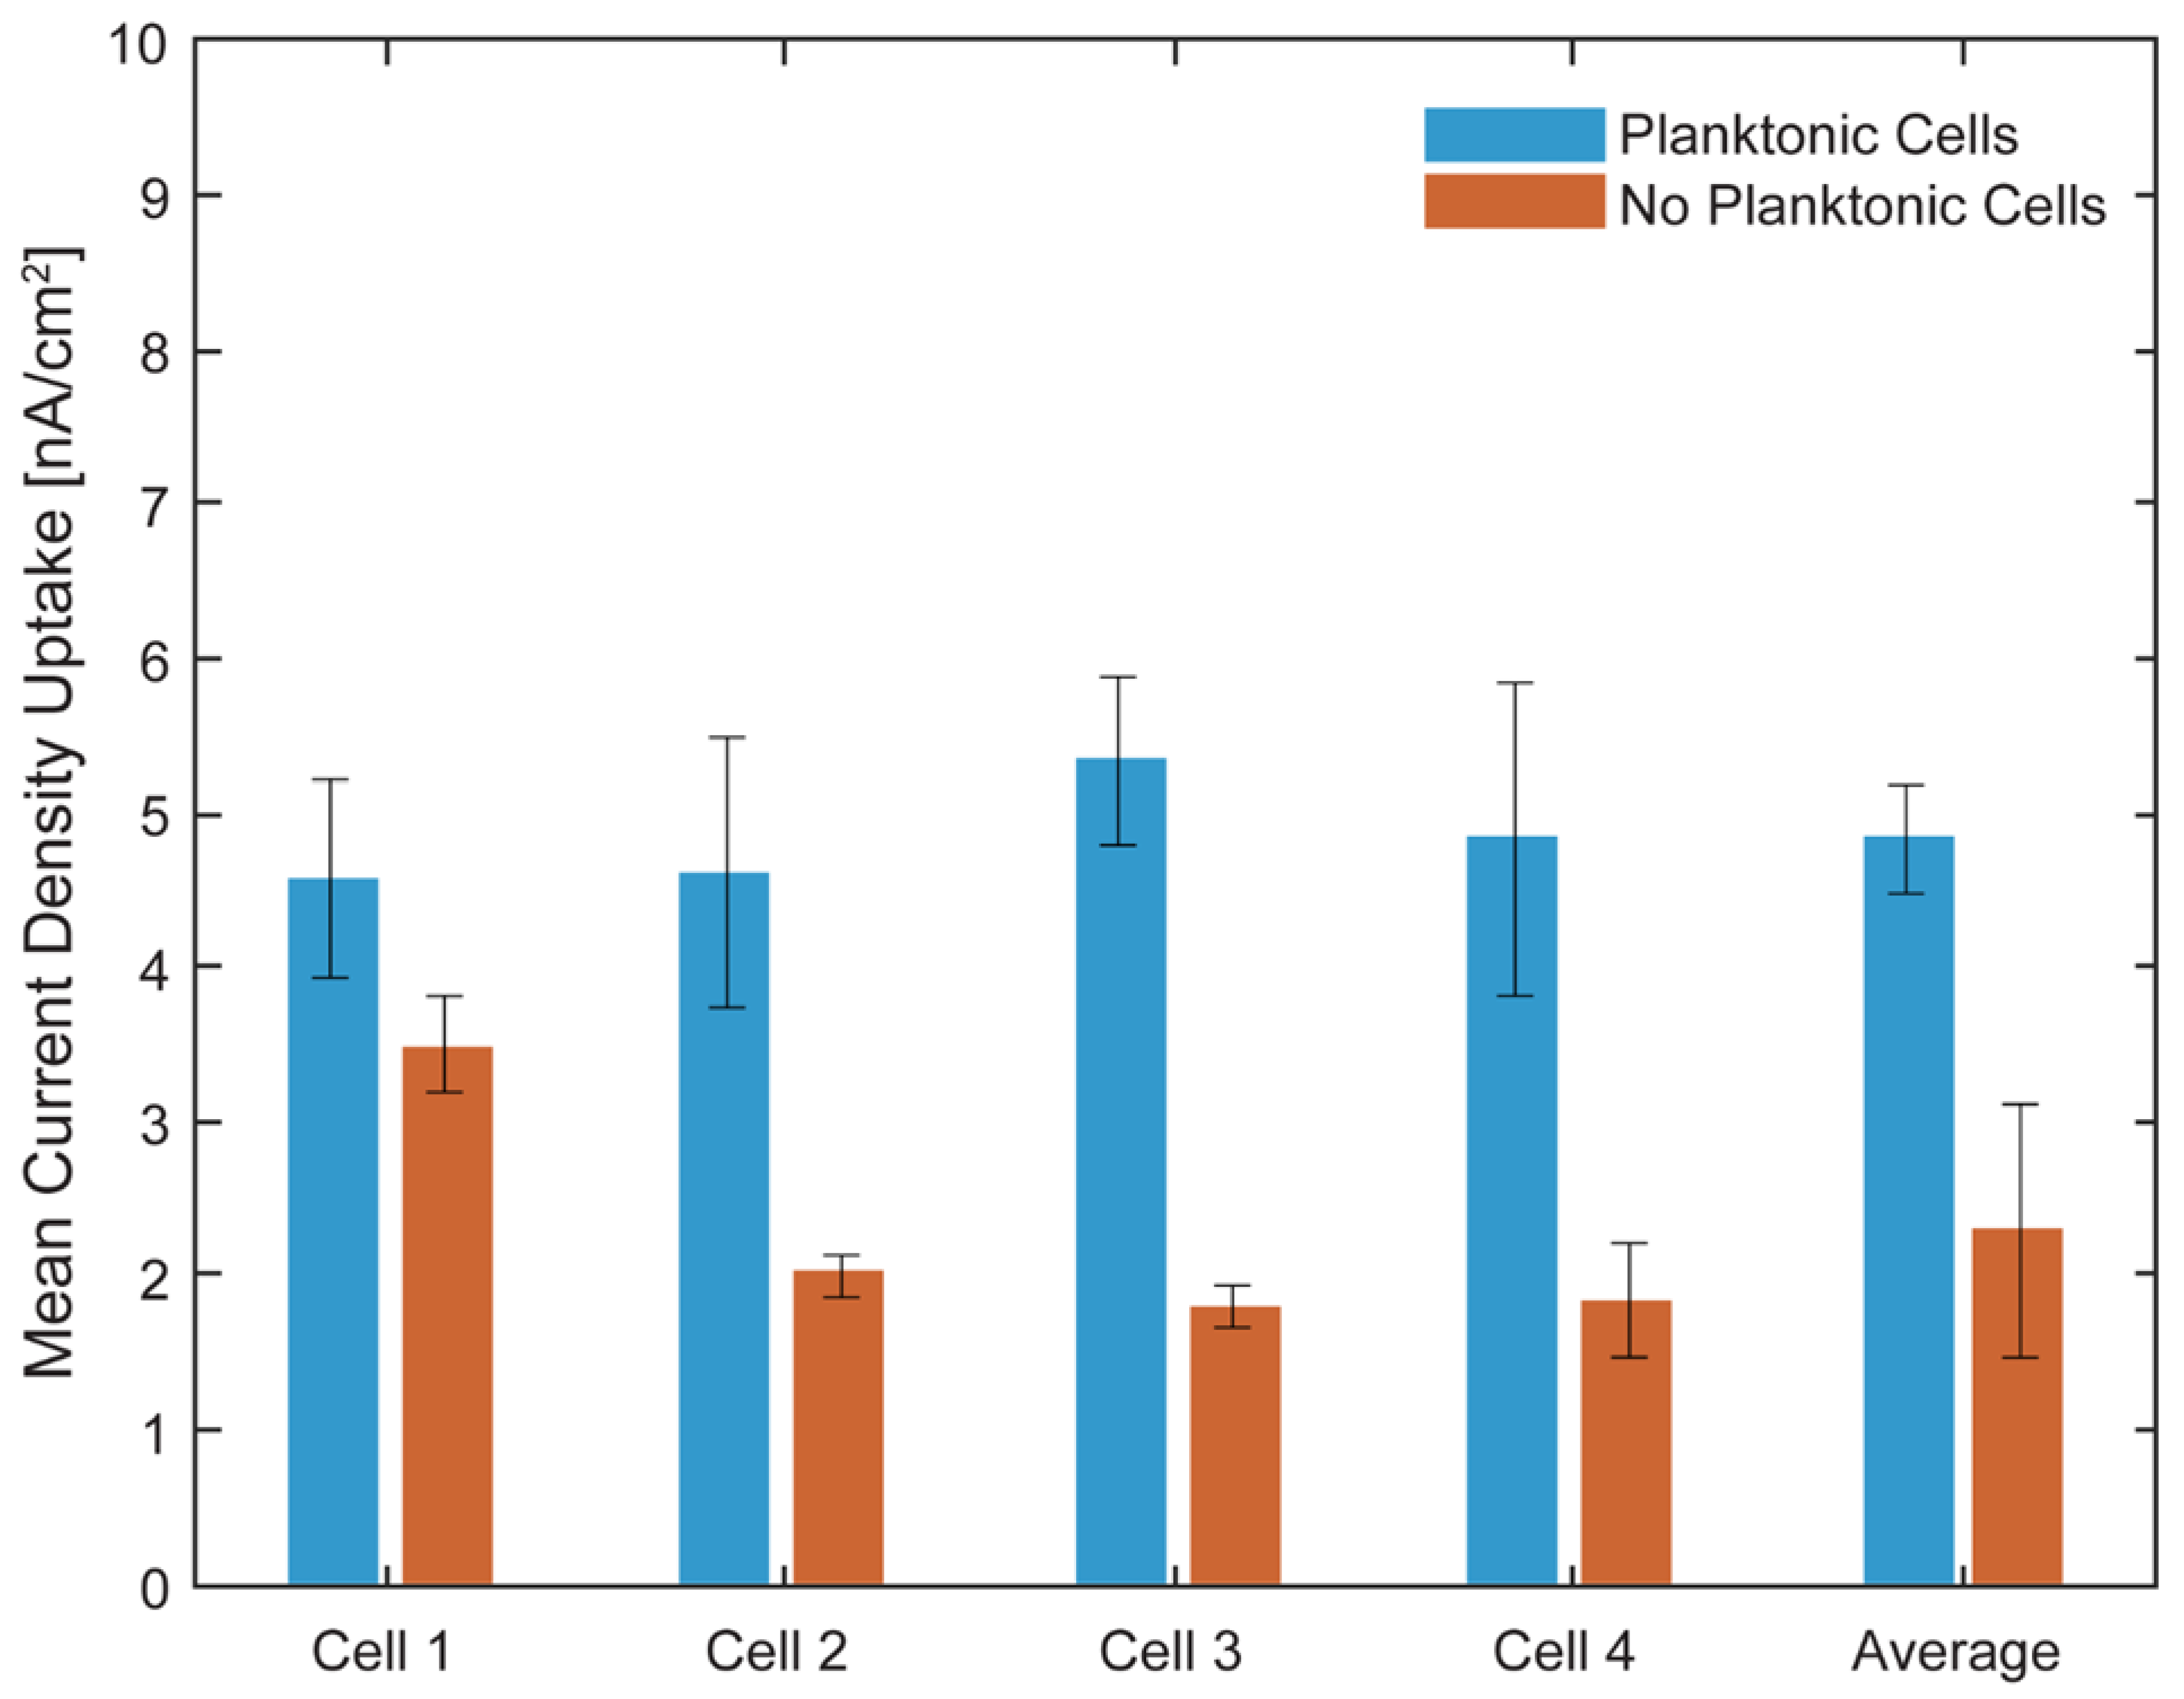
Figure 16.
Brightfield microscopy images of μ-BECs. Cells 1-4 (subfigures A-D) in the µ-BEC platform before loading with TIE-1 cells (1), after loading with TIE-1 cells on Day 0 (2), after loading with TIE-1 cells on Day 4 (3), after removal of planktonic cells on Day 4 (4).
Figure 16.
Brightfield microscopy images of μ-BECs. Cells 1-4 (subfigures A-D) in the µ-BEC platform before loading with TIE-1 cells (1), after loading with TIE-1 cells on Day 0 (2), after loading with TIE-1 cells on Day 4 (3), after removal of planktonic cells on Day 4 (4).
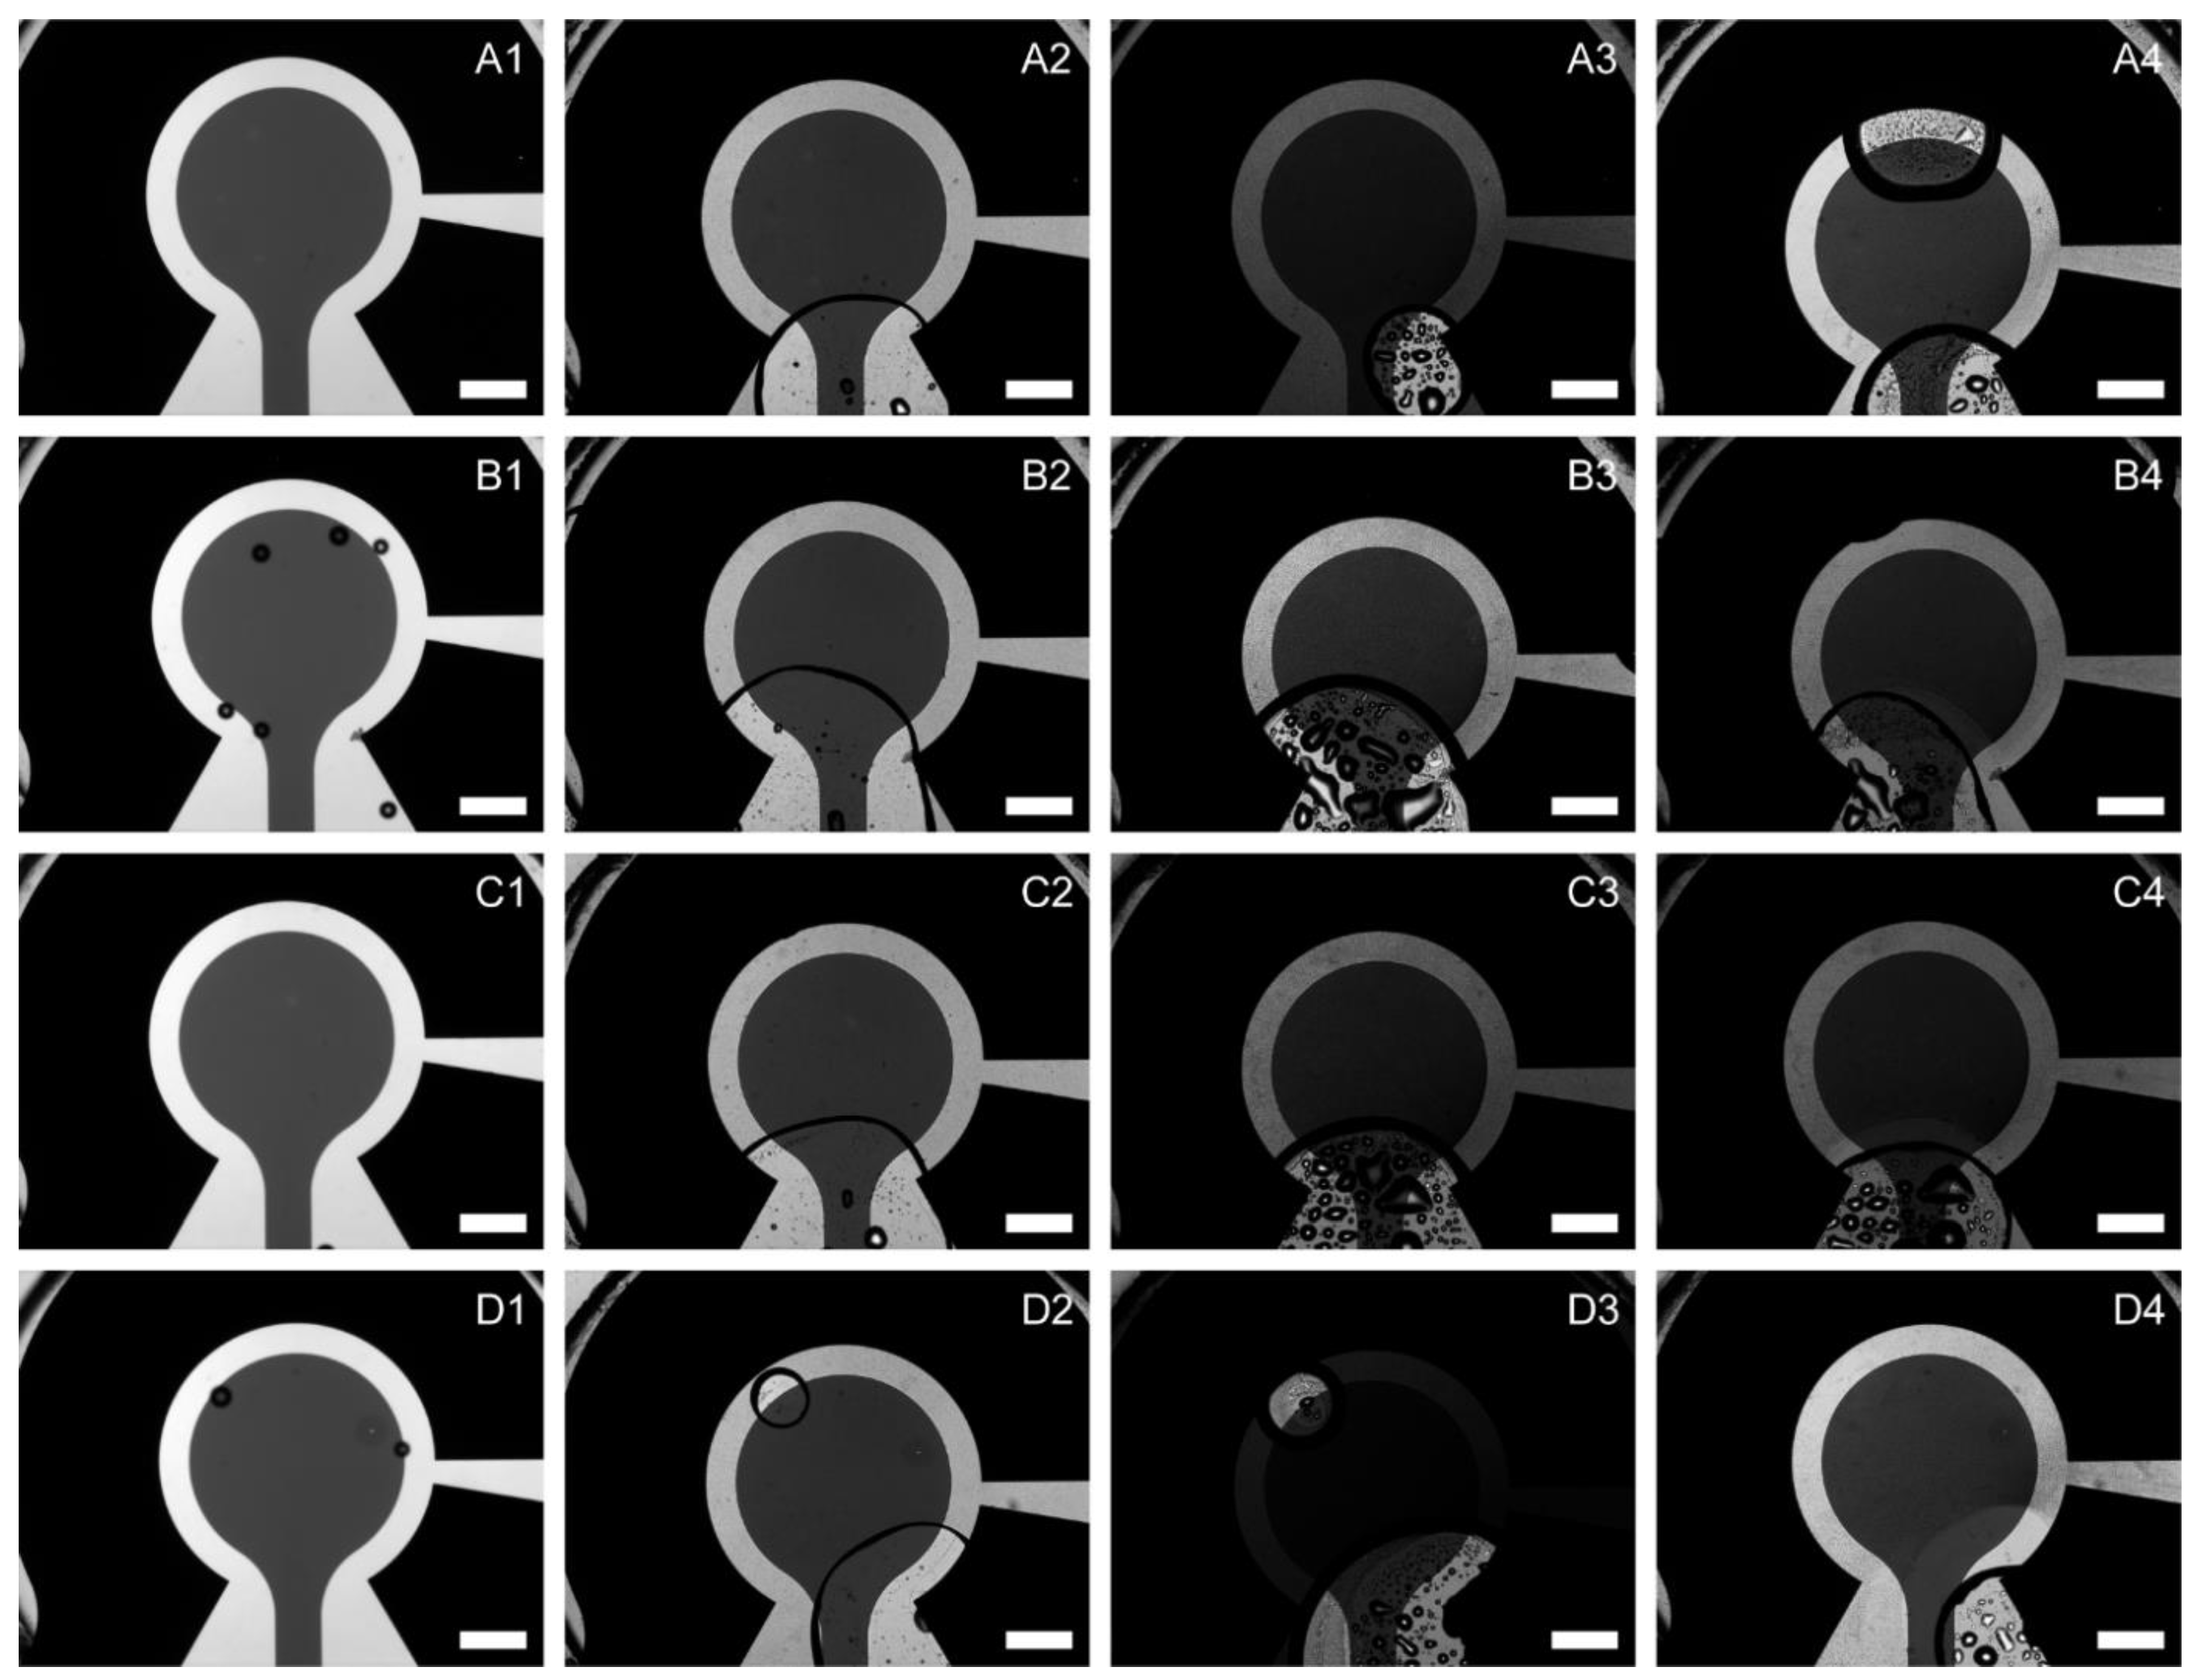
Figure 17.
Comparison of cyclic voltammograms within each μ-BEC cell under illuminated conditions. Cyclic voltammograms at 10 mV/s of abiotic freshwater media (blue), TIE-1 with planktonic cells on Day 0 (red), TIE-1 with planktonic cells on Day 4 (yellow), TIE-1 without planktonic cells on Day 4 (purple) in the µ-BEC platform cells 1-4 (A-D).
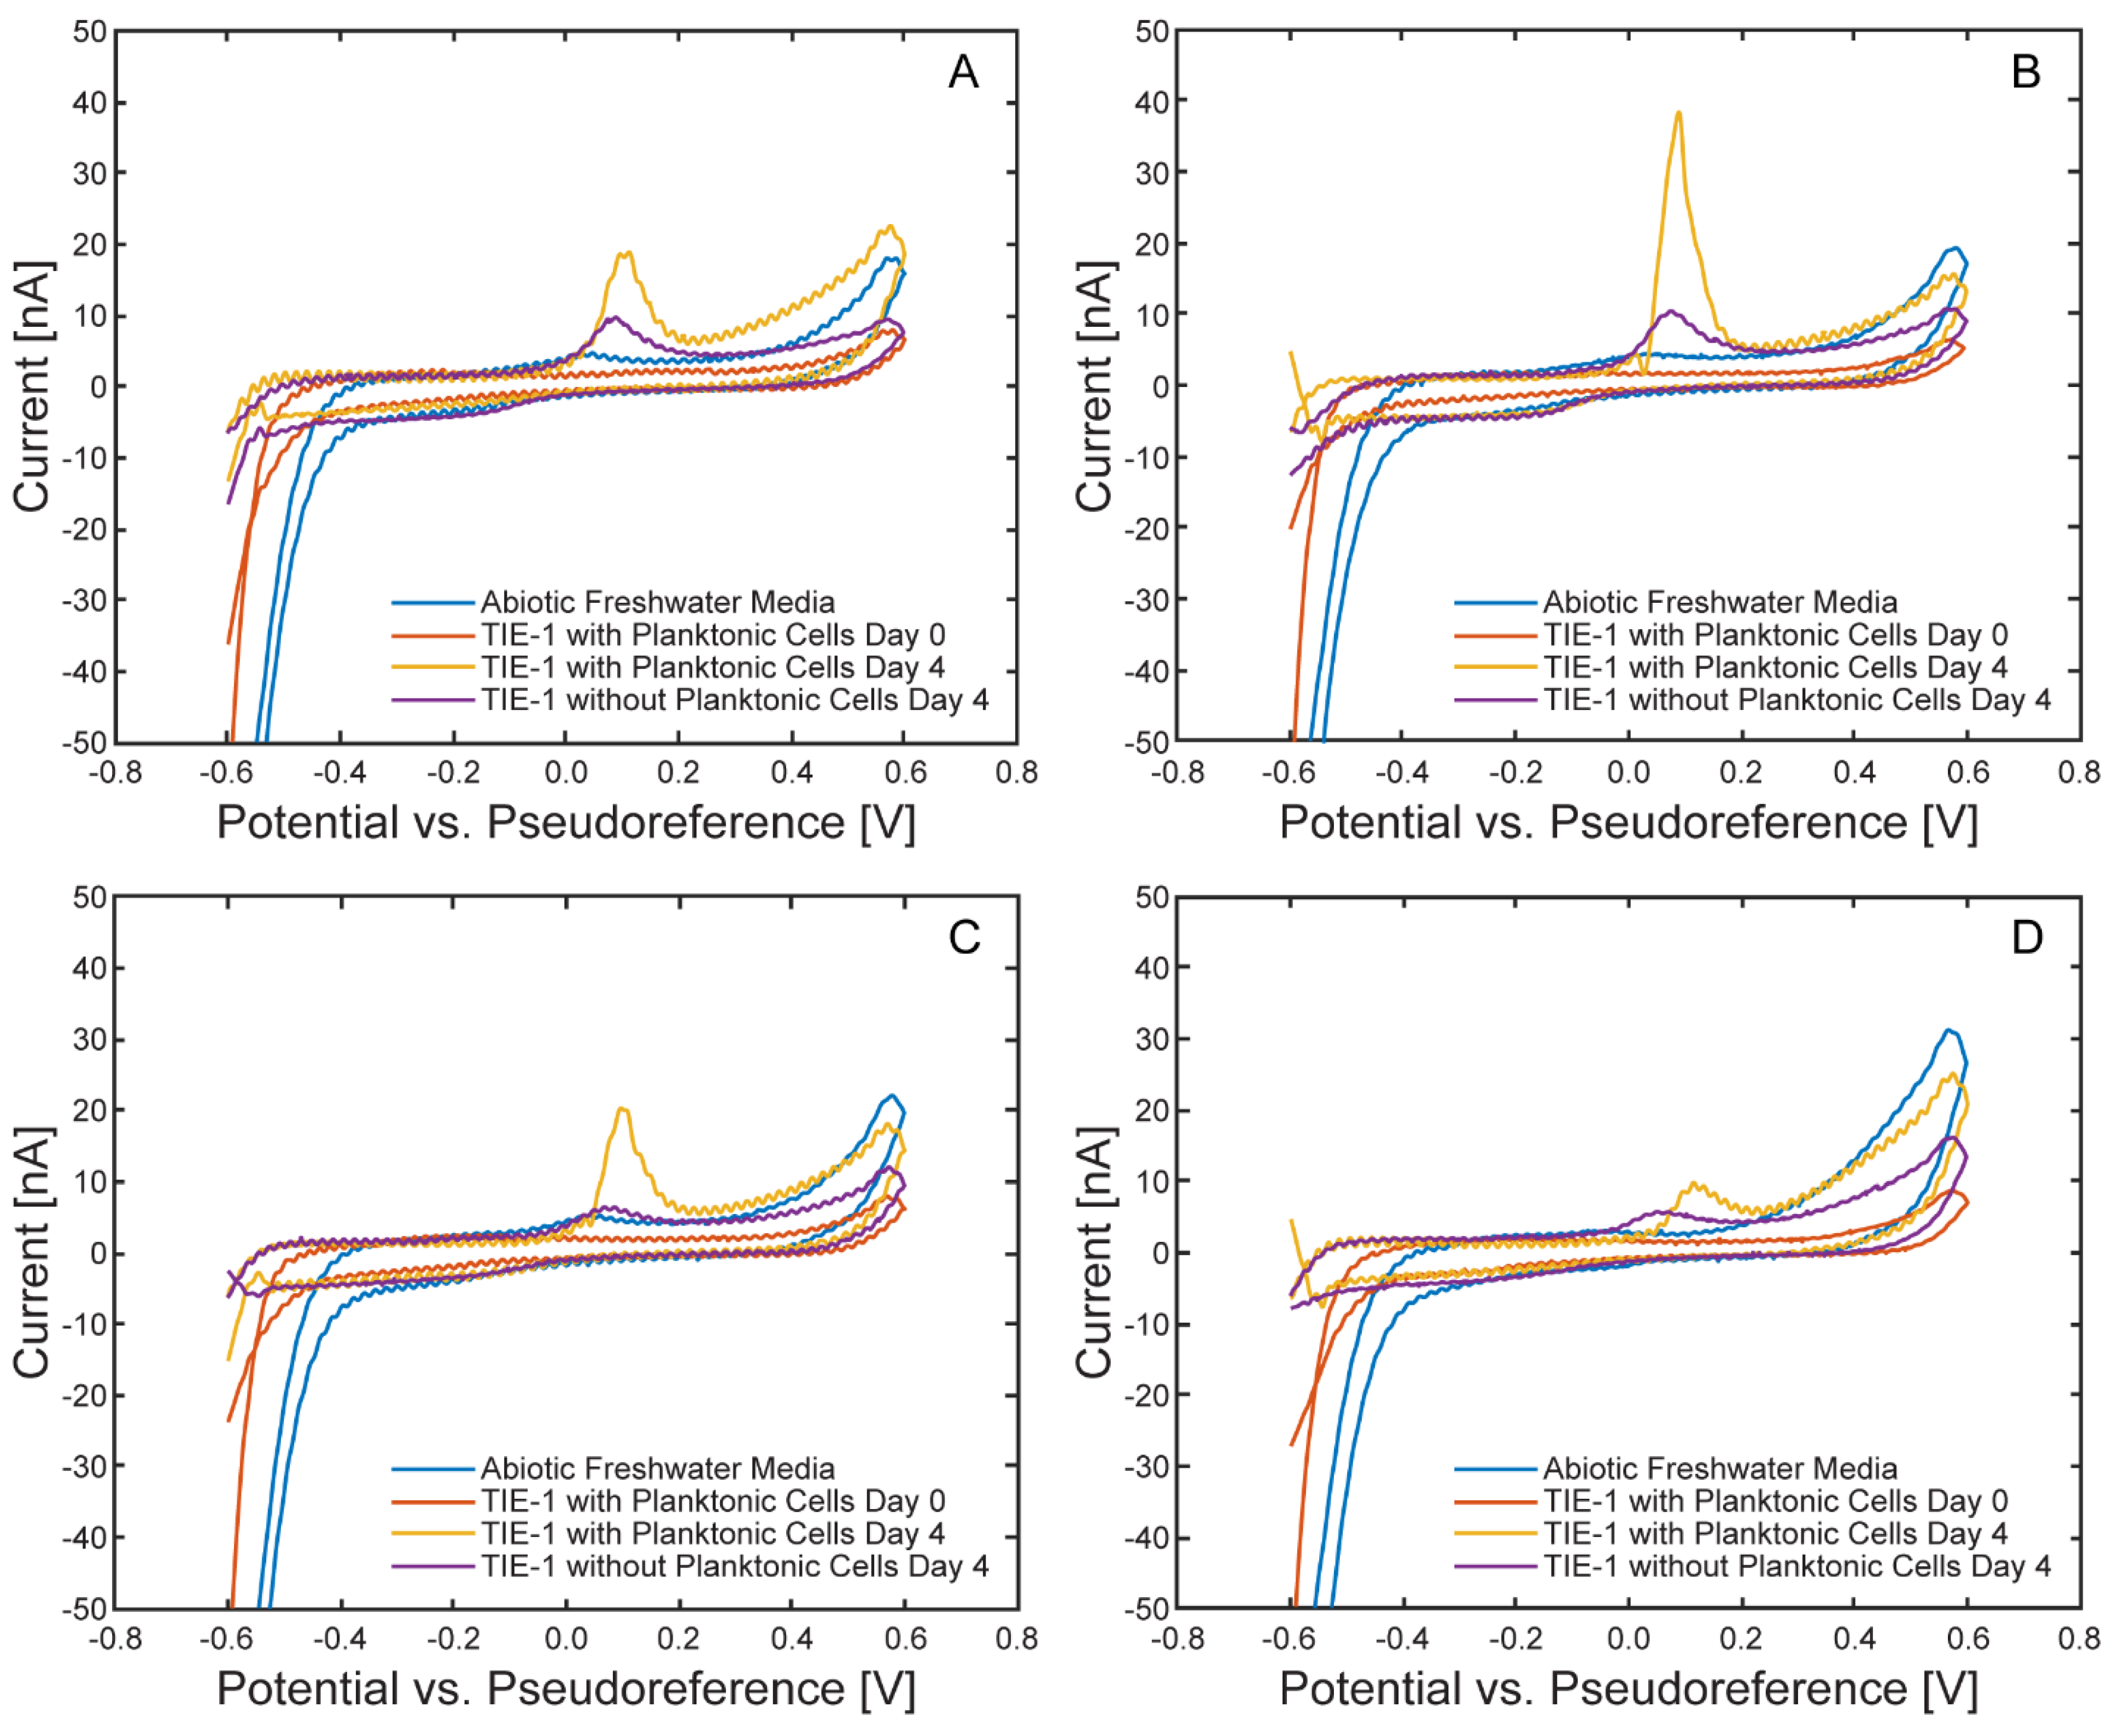
Figure 18.
Comparison of cyclic voltammograms within each μ-BEC cell under dark conditions. Cyclic voltammograms at 10 mV/s of abiotic freshwater media (blue), TIE-1 with planktonic cells on Day 0 (red), TIE-1 with planktonic cells on Day 4 (yellow), TIE-1 without planktonic cells on Day 4 (purple) in the µ-BEC platform cells 1-4 (A-D).
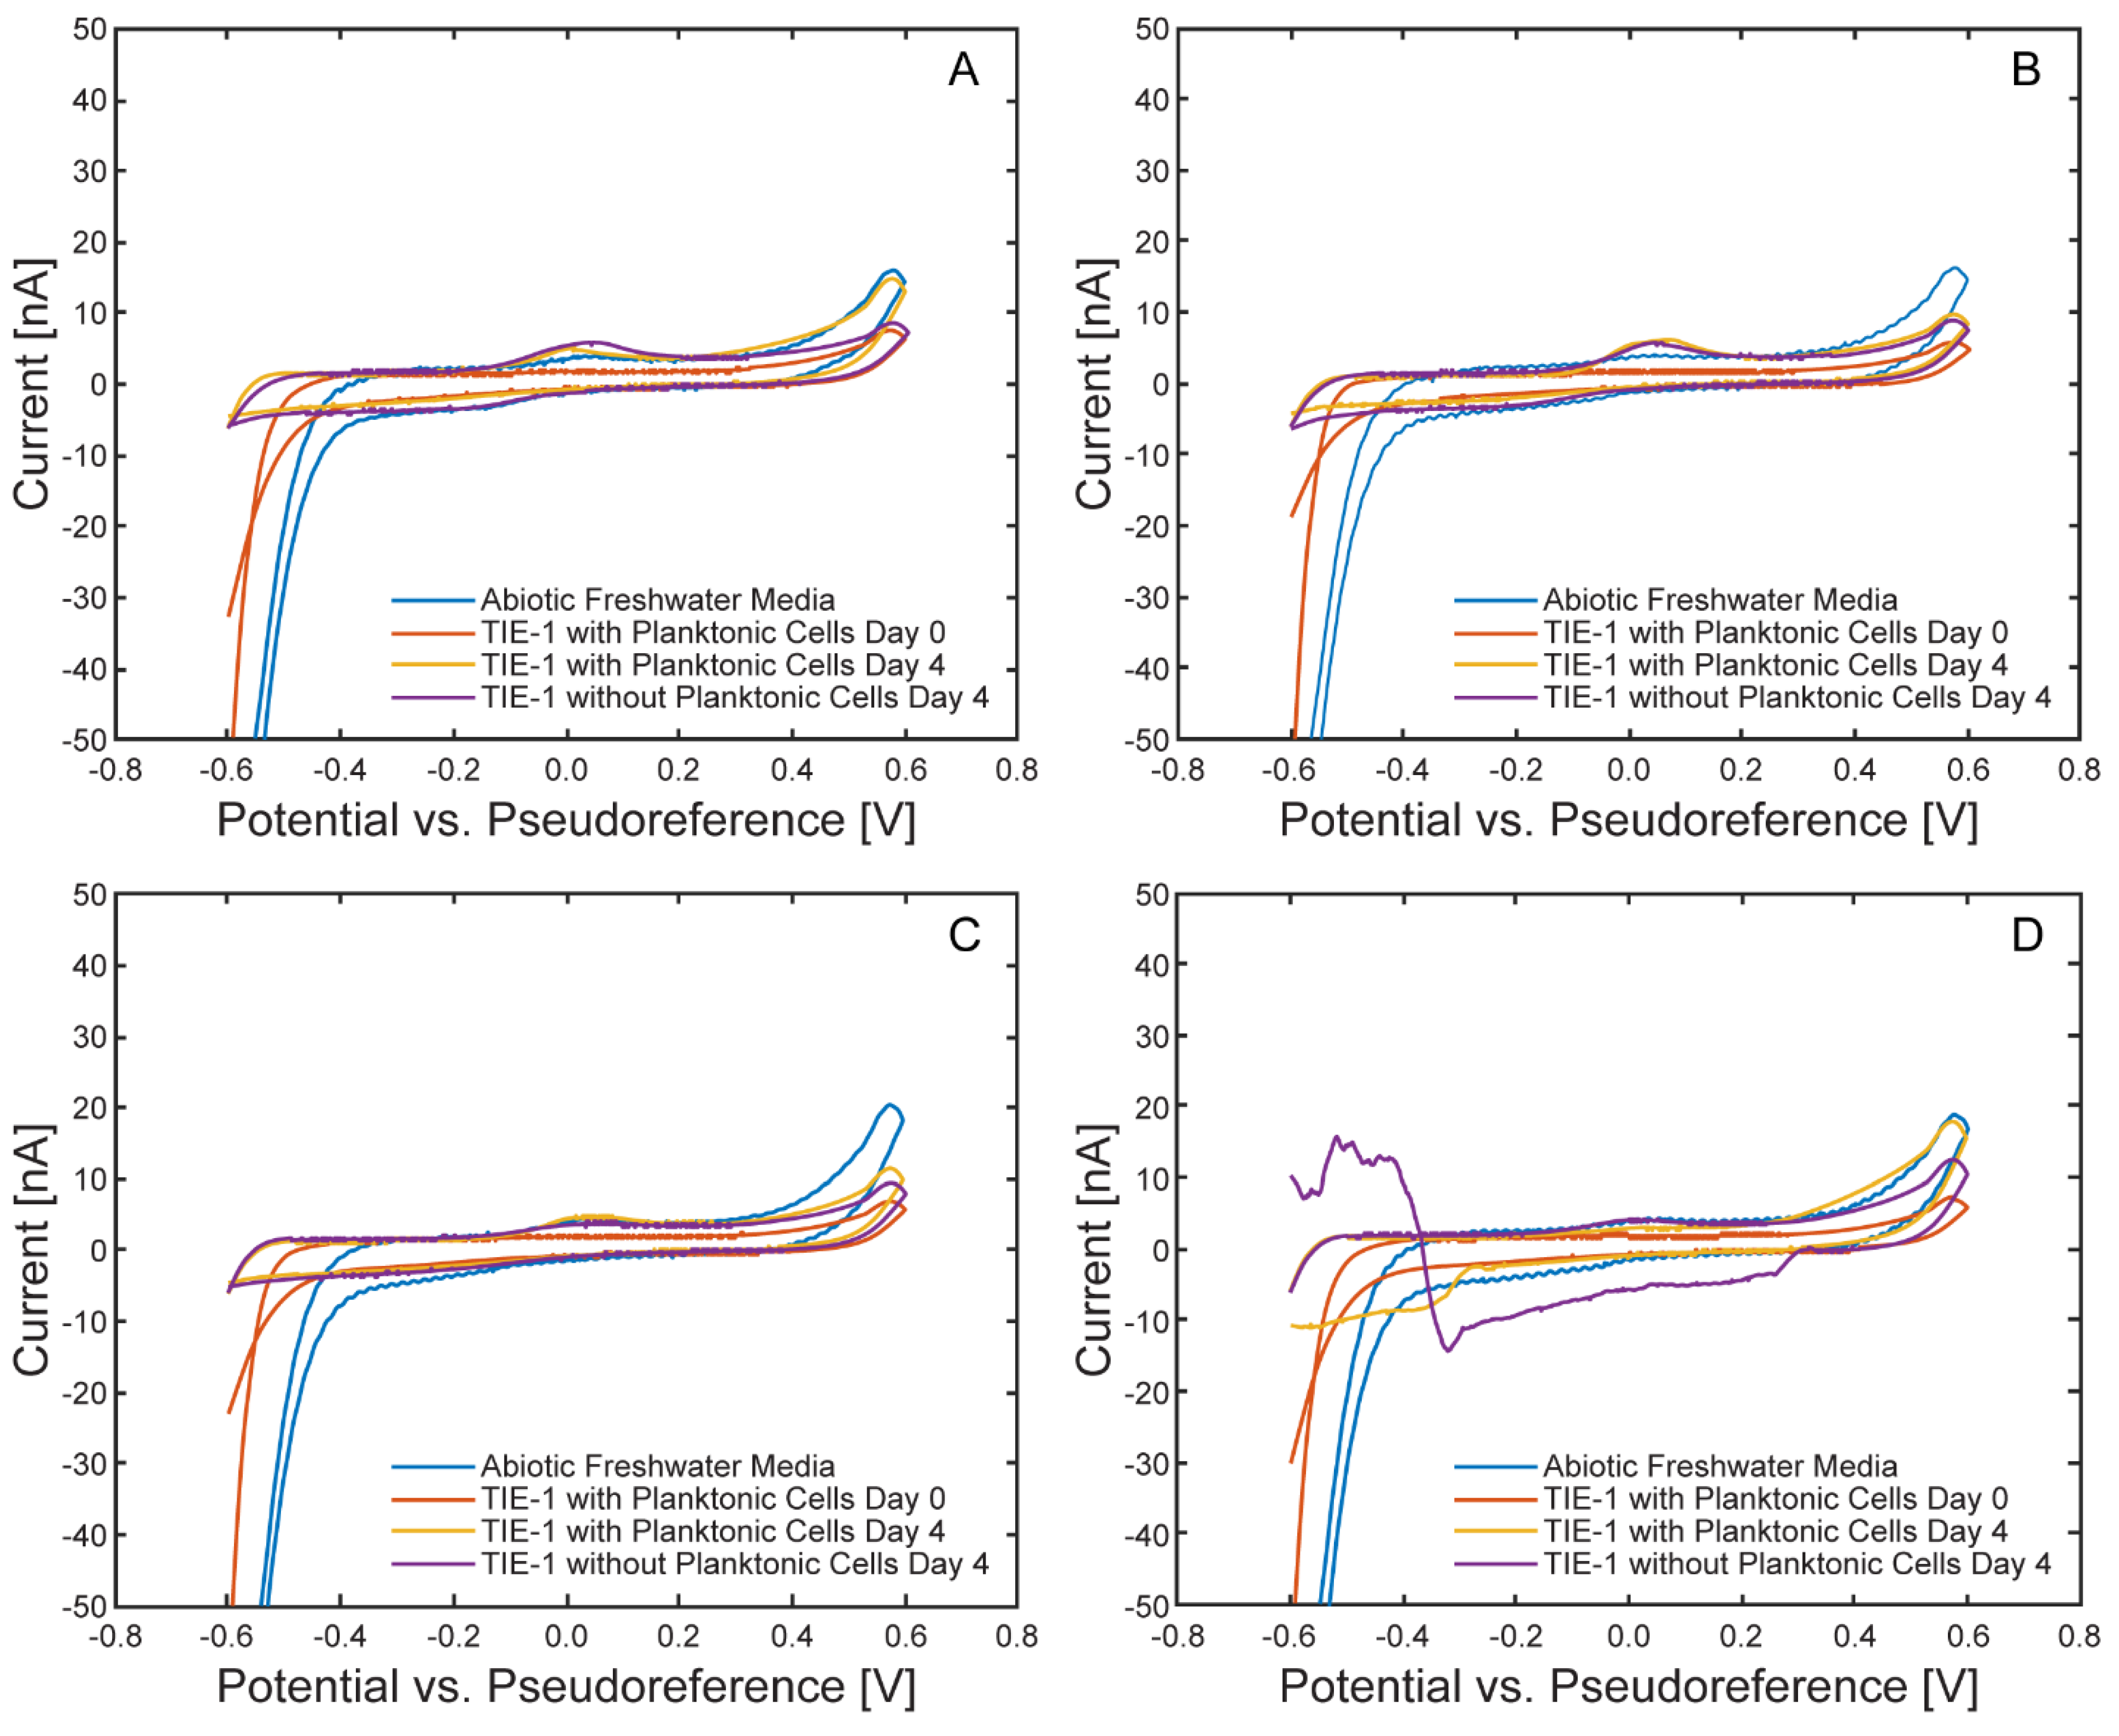

Table 1.
Anodic and cathodic peak potentials of the ferri/ferrocyanide redox probe inside the µ-BEC platform. Potential reported versus the pseudoreference electrode.
Table 1.
Anodic and cathodic peak potentials of the ferri/ferrocyanide redox probe inside the µ-BEC platform. Potential reported versus the pseudoreference electrode.
| Scan Rate | Anodic Peak Potential [mV] | Cathodic Peak Potential [mV] | ||
|---|---|---|---|---|
| Average | Standard Deviation | Average | Standard Deviation | |
| 5 mV/s | 252 | 3.25 | 182 | 1.29 |
| 10 mV/s | 254 | 5.21 | 178 | 1.90 |
| 15 mV/s | 254 | 3.75 | 177 | 1.12 |
| 20 mV/s | 252 | 4.50 | 176 | 2.05 |
| 25 mV/s | 252 | 5.20 | 176 | 1.13 |
Table 2.
Anodic and cathodic peak currents of the ferri/ferrocyanide redox probe inside the µ-BEC platform. Potential reported versus the pseudoreference electrode.
Table 2.
Anodic and cathodic peak currents of the ferri/ferrocyanide redox probe inside the µ-BEC platform. Potential reported versus the pseudoreference electrode.
| Scan Rate | Anodic Peak Current [µA] | Cathodic Peak Potential [µA] | ||
|---|---|---|---|---|
| Average | Standard Deviation | Average | Standard Deviation | |
| 5 mV/s | 2.24 | 0.08 | 2.15 | 0.05 |
| 10 mV/s | 3.36 | 0.41 | 3.23 | 0.09 |
| 15 mV/s | 4.12 | 0.35 | 3.93 | 0.10 |
| 20 mV/s | 4.67 | 0.31 | 4.55 | 0.09 |
| 25 mV/s | 5.17 | 0.25 | 5.05 | 0.09 |
Table 3.
Randles–Ševčík linear regression fit constants and R-squared values for the ferri/ferrocyanide redox probe.
Table 3.
Randles–Ševčík linear regression fit constants and R-squared values for the ferri/ferrocyanide redox probe.
| Cell Number | Anodic Fit Constant | Anodic R-Squared | Cathodic Fit Constant | Cathodic R-Squared |
|---|---|---|---|---|
| 1 | 3.30E-05 | 9.994E-01 | 3.21E-05 | 9.997E-01 |
| 2 | 3.29E-05 | 9.995E-01 | 3.17E-05 | 9.997E-01 |
| 3 | 3.05E-05 | 9.992E-01 | 3.13E-05 | 9.997E-01 |
| 4 | 3.58E-05 | 9.973E-01 | 3.27E-05 | 9.998E-01 |
| Average | 3.30E-05 | 9.989E-01 | 3.20E-05 | 9.997E-01 |
| Standard Deviation | 2.17E-06 | 1.041E-03 | 6.03E-07 | 5.00E-05 |
| CV (%) | 6.56 | 0.10 | 1.88 | 0.01 |
Table 4.
Coefficients of variance for anodic and cathodic peak potentials and currents of the ferri/ferrocyanide redox probe inside the µ-BEC platform.
Table 4.
Coefficients of variance for anodic and cathodic peak potentials and currents of the ferri/ferrocyanide redox probe inside the µ-BEC platform.
| Scan Rate | Coefficient of Variance [%] | |||
|---|---|---|---|---|
| Anodic Peak Potential | Anodic Peak Current | Cathodic Peak Potential | Cathodic Peak Current | |
| 5 mV/s | 1.29 | 3.46 | 0.71 | 2.33 |
| 10 mV/s | 2.05 | 12.25 | 1.06 | 2.65 |
| 15 mV/s | 1.47 | 8.51 | 0.64 | 2.61 |
| 20 mV/s | 1.79 | 6.74 | 1.17 | 2.01 |
| 25 mV/s | 2.06 | 4.76 | 0.64 | 1.77 |
| Average | 1.73 | 7.14 | 0.84 | 2.27 |
Disclaimer/Publisher’s Note: The statements, opinions and data contained in all publications are solely those of the individual author(s) and contributor(s) and not of MDPI and/or the editor(s). MDPI and/or the editor(s) disclaim responsibility for any injury to people or property resulting from any ideas, methods, instructions or products referred to in the content. |
© 2025 by the authors. Licensee MDPI, Basel, Switzerland. This article is an open access article distributed under the terms and conditions of the Creative Commons Attribution (CC BY) license (http://creativecommons.org/licenses/by/4.0/).
Copyright: This open access article is published under a Creative Commons CC BY 4.0 license, which permit the free download, distribution, and reuse, provided that the author and preprint are cited in any reuse.


