
Submitted:
22 May 2025
Posted:
23 May 2025
You are already at the latest version
Abstract
Climate change resulting from human development necessitates increased land use, food, and energy consumption, underscoring the need for sustainable development. Incorporating various feedstock into value-added liquid fuels and bioproducts is essential for achieving sustainability. Most biomass consists of cell walls, which serve as a primary carbon source for bioenergy and biorefinery processes. This structure contains a cellulose core where lignin and hemicelluloses are crosslinked and embedded in a pectin matrix, forming diverse polysaccharide architectures across different species and tissues. Nineteen agro-industrial wastes were analyzed for their potential use in a circular economy. The analysis included cell wall composition, saccharification, and calorific potential. Thermal capacity and degradation were similar among the evaluated wastes. The feedstocks of corn cob, corn straw, soybean husk, and industrial paper residue exhibited a higher saccharification capacity despite having lower lignin and uronic acid contents, with cell walls comprising 30% glucose and 60% xylose. Therefore, corn, soybean, industrial paper residue, and sugarcane are more promising for bioethanol production. Additionally, duckweed, barley, sorghum, wheat, rice, bean, and coffee residues could serve as feedstocks for other by-products in green chemistry, generating valuable products. Our findings show that agro-industrial residues display a variety of polymers that are functional for various applications in different industry sectors.
Keywords:
feedstock
; pectin
; hemicellulose
; cellulose
; saccharification
1. Introduction
Population growth is projected to reach 9 billion people by 2050 [1]. This growth, coupled with climate change, necessitates an increase in land use, food, and energy production, requiring sustainable development to ensure health and well-being for society. The International Panel on Climate Change (IPCC) assessed the effects of global warming in various scenarios, indicating that new carbon capture and storage systems are essential to mitigate climate change [2]. A notable measure is Biomass Energy with Carbon Capture and Storage (BECCs), which “combines energy from biomass with geological carbon capture and storage” [3]. Therefore, to achieve sustainability, various feedstocks, such as valuable liquid biofuels and other value-added by-products, are crucial for replacing oil consumption [3].
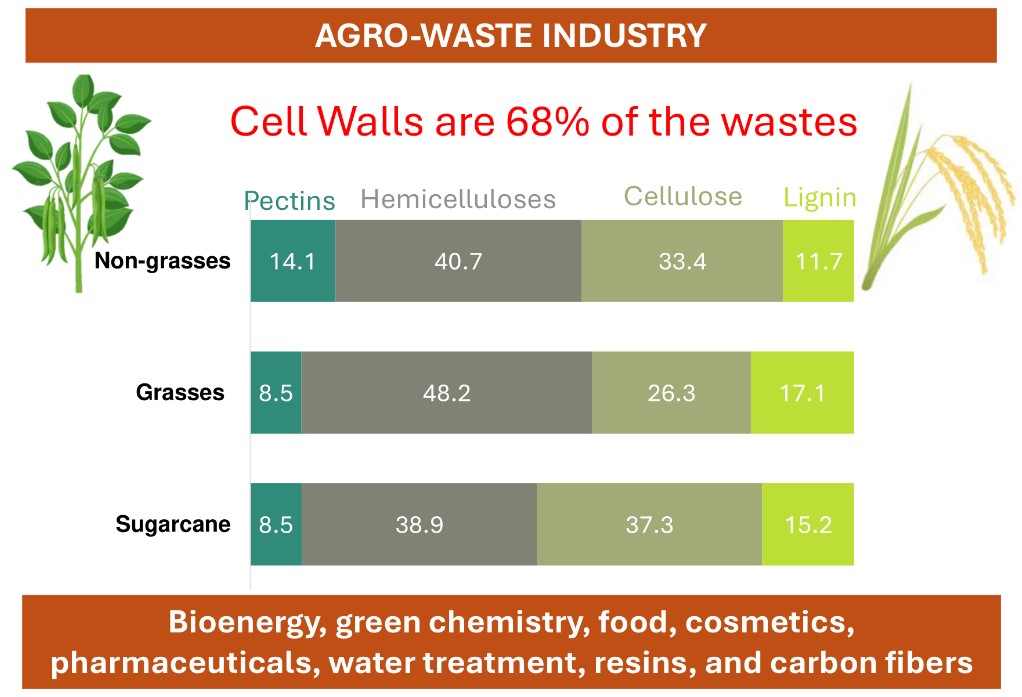
Productive chains that lead to a circular economy utilize feedstock until its depletion [4]. The circular economy replaces the end-of-life concept with sustainability to fully optimize feedstocks by reducing, reusing, recycling, and recovering [5,6]. The primary available feedstock is plant biomass, in which atmospheric carbon is assimilated through photosynthesis and primarily transformed into cell wall polysaccharides [7]. The cell wall is a rigid and complex structure consisting of pectins, hemicellulose, cellulose, lignin, and proteins that surround each plant cell. This structure is organized around a cellulose core to which hemicellulose and lignin are firmly attached and crosslinked, immersed in a pectin matrix [8]. The primary cell wall is expandable, constituting 90% of its dry weight in polysaccharides. Despite their proportion and composition, these polysaccharides vary among plants and are classified as types I, II, and III [8,9]. The Type I cell wall is found in dicots and monocots and consists of approximately 30% pectins, 30% hemicellulose, 30% cellulose, and 10% proteins, with xyloglucan as the main hemicellulose [10]. The Type II cell wall occurs in grasses, where glucuronoarabinoxylan acts as the major crosslinking glycan with cellulose, and lower levels of pectin are present [8]. Additionally, grasses contain β-glucan, another type of hemicellulose. Type III cell walls are observed in some ferns with high mannan levels [9]. The secondary cell wall forms after cell growth and elongation during the differentiation of the xylem, phloem, and transfer cells, involving the deposition of cellulose, hemicellulose, and lignin [10].
Cell walls exhibit diverse architecture and chemical compositions across various species and organs [8,11]. Considering the quantitative importance of cell walls in plant biomass for bioenergy production, it is crucial to characterize and elucidate the chemical structures and interactions among the polymers of different cell walls from distinct biomasses through physical, chemical, and genetic analyses to enhance bioenergy production and additional applications [12].
Despite the diversity of biomass, agro-industrial wastes are categorized as waste from wood product industries, municipal solid waste, agricultural residues, and energy crops [13]. Worldwide, 181.5 billion tons of lignocellulosic biomass are produced annually [14]. Among these, 4.6 million tons are agricultural waste; yet only 1.2 billion tons have further applications [15]. Most biomass residues from crops (husks, seeds, roots, bagasse, molasses, leaves, stems, straws, and bark) are underutilized, although they are promising feedstocks for biotechnological products [16].
The wall can be utilized to produce metabolites of industrial interest through green chemistry, including macromolecules, oxidized products, phenols, hydrocarbons, organic acids, and syngas products, as well as various biofuels such as bioethanol, biogas, biobutanol, biomethane, biohydrogen, biochar, Sustainable Aviation Fuel (SAF), and biogasoline [3]. Depending on the composition and architecture of the wall, it could be applied to diverse applications.
Furthermore, lignocellulosic materials resist saccharification and enzyme hydrolysis [17], necessitating efficient pretreatments for second-generation ethanol production [14]. Understanding the composition and properties of agro-waste is essential for improving cocktail formulations and effectively pretreating biomass to release monosaccharides or oligosaccharides that microorganisms can metabolize to produce various compounds. The basic units that constitute biomass—carbon, nitrogen, hydrogen, oxygen, and inorganic compounds—are crucial for calculating the calorific potential and other uses of these materials. This work aims to characterize 19 agro-industrial wastes and assess their potential in biorefinery. It is hypothesized that the cell wall composition of grasses and non-grasses studied in 19 agro-industrial wastes with varying polysaccharide compositions can be utilized in distinct applications for biorefinery.
2. Materials and Methods
2.1. Agro-Wastes Evaluated
Nineteen agro-wastes (Table 1) were obtained and analyzed for cell wall composition, chemical properties, and thermal performance. Sugarcane (Saccharum var SP80-3280), energy cane V2 (Saccharum var Vertix 2), energy cane V3 (Saccharum var Vertix 3), sugarcane bagasse from industry (Saccharum spp.), barley bagasse (Hordeum vulgare), sorghum residue (Sorghum bicolor), corn cob (Zea mays), corn straw (Zea mays), wheat bran (Triticum), rice husk (Oryza sativa), soybean straw (Glycine max), soybean residues (leaves +stalk), soybean husk, coffee husk (Coffea spp.), bean straw (Phaseolus vulgaris), duckweed (Lemna minor 8627), tree pruning residue, eucalyptus chip (Eucalyptus spp.), and industry paper residue (pulp and paper milled sludge) were dried at 50 °C and ground in a ball mill until a fine powder was obtained.
2.2. Compositional Characterization by Fourier Infrared Spectroscopy (FT-IR)
The chemical composition of the samples was evaluated using FT-IR. The infrared spectrophotometer IRPrestige-21 (Shimadzu, Japan), equipped with an attenuated total reflectance (ATR) accessory and a germanium crystal, was utilized. All spectra were recorded between 4,000 and 650 cm⁻¹, with a resolution of 4 cm⁻¹ and a minimum of 60 scans.
2.3. Elemental Composition and Calorific Power
To evaluate the energetic potential of different agro-waste physicochemical properties, thermal gravimetric analysis (TGA) and differential scanning calorimetry (DSC) were performed to determine the high heating value (HHV) and identify the peaks of the maximum mass degradation rate as a function of temperature. The ball-milled samples were dried using air circulation at 80 °C (Tecnal TE-394/2) until they reached a constant mass, then sieved through a Tyler 60 mesh, homogenized, and quartered. Ash content was determined following the ASTM D 2974 protocol [18], utilizing the microprocessor temperature programmer (LLF9613) and analytical scale (Shimadzu AUX 220).
The elemental composition of agro-waste was analyzed using a CHN Perkin Elmer 2400 series II analyzer with 1.5 mg of each sample. The oxygen content was determined by gravimetric differences. The CHNS/Ash correlation was utilized to evaluate the HHV (Higher Heating Value) [kJ/Kg] of the agro-wastes, as reported by Basu (2013) [19] (Equation (1)).
HHV=349,1C+1178,3H+100,5S-103,4O-15,1N-21,1ASH
Where C, H, S, O, N, and ASH were mass fraction proportions.
The TGA/DSC was performed using 2-5 mg in the DTG-60H analyzer (Shimadzu), with a temperature gradient ranging from 303 K to 873 K and heating rates of 10 K·min⁻¹ and 30 K·min⁻¹. The experiments utilized an oxidative synthetic air composition of N₂/O₂ at 80/20 vol% and a flow rate of 50 mL·min⁻¹.
2.4. Lignin Quantification
Thirty mg of the agro-waste washed with 1 mL of water, ethanol, a 1:1 v/v mixture of ethanol and chloroform, and acetone at temperatures of 98 °C, 76 °C, 59 °C, and 54 °C, respectively, for 15 minutes each while maintaining constant stirring at 750 rpm [20]. After each extraction, the samples were centrifuged at 14,000 g for 5 minutes at room temperature (RT); the supernatants were discarded, and the final residue was dried at 45 °C. The resulting residue was then submitted for lignin determination using the acetyl bromide method [21,22]. The lignin levels were calculated as described by Xue et al. (2008) [23] (Equation (2)).
A=ε*c*l
Where ε = 23.35 l.g−1.cm−1 (for monocot and eudicot) or 17.75 l.g−1.cm−1 (for grasses) and l = 0.1 cm.
2.5. Cell Wall Obtention and Fractionation
The soluble sugars from 500 mg of pulverized waste were extracted thoroughly using 80% ethanol (v/v) at 80 °C. The residue was collected through centrifugation and dried at 50 °C. Starch from the alcohol-insoluble residue (AIR) was extracted twice with 90% DMSO (v/v). The de-starched AIR (cell wall) was subjected to extraction with 0.5% ammonium oxalate (pH 7.0) at 80 °C for pectin solubilization. All supernatants containing pectins were collected via centrifugation. The ammonium oxalate residues were further extracted with 3% sodium chloride (m/v) in 0.4% acetic acid (v/v) for 3 hours at 70 °C to remove lignin and obtain pectin along with soluble hemicelluloses [24]. The supernatant containing soluble polysaccharides was recovered as mentioned. The sodium chlorite residues were extracted with sodium borohydride at room temperature. The supernatants containing hemicelluloses were neutralized using glacial acetic acid. Additionally, the obtained residue primarily consisted of cellulose. After all extractions, the residues were washed with distilled water, frozen, and freeze-dried. The supernatants from ammonium oxalate, sodium chloride, and 4M NaOH were dialyzed, frozen, and freeze-dried. The yields of the cell wall fractions were determined gravimetrically. This procedure followed the one described by De Souza [11] and Gorshkova [25] with modifications.
2.6. Neutral Monosaccharides Hydrolysis and Quantification
Two mg of the de-starched cell wall and the cell fractions (ammonium oxalate, sodium chloride, 4M NaOH, and residue) were hydrolyzed with 1 mL of 2 M trifluoroacetic acid (TFA) at 100 °C for 3 hours while stirring continuously at 750 rpm. The supernatants were vacuum-dried and resuspended in 1 mL of distilled water. The residue fraction primarily contains cellulose; therefore, 2 mg of this fraction was pre-hydrolyzed with 100 μL of 72% H2SO4 (v/v) at 30 °C for 30 minutes, diluted to 4% (v/v), and then heated at 100 °C for 1 hour. The supernatants from sulfuric acid hydrolysis were collected by centrifugation at 14,000 g for 10 minutes at room temperature and analyzed. The monosaccharides were identified and quantified using HPAEC-PAD with a CarboPac SA10 column (ICS 5,000, Thermo-Dionex®). The sugars were eluted isocratically with 0.8% sodium hydroxide at 200 mM (1 min.mL-1) and detected by a post-column containing 500 mM (0.5 min.mL-1). The sugars arabinose, galactose, glucose, xylose, fucose, rhamnose, and mannose were quantified using a standard curve.
2.7. Uronic Acid Determination
Five mg of the de-starched cell wall was submitted to determine uronic acids as detailed by Filisetti-Cozzi & Carpita [26]. The samples were hydrolyzed in sulfuric acid (99.8%) on ice for 10 minutes while stirring. Deionized water was then added to the mixture and incubated on ice for another 10 minutes with stirring, repeating this procedure. The final hydrolysate was diluted to 10 mL to achieve a 4% concentration and centrifuged at 4,000 g for 10 minutes at room temperature. The colorimetric assay for uronic acid determination utilized the hydrolysis product with 4M sulfamic acid in potassium sulfamate solution (pH 1.6) and 75 mM sodium borate in sulfuric acid, heated at 100 °C for 20 minutes. The reaction was cooled on ice for 10 minutes, after which m-hydroxyphenyl in 0.5% NaOH was added and vortexed. The samples were measured at 525 nm, with quantification based on the D-galacturonic acid curve (0.12-2.5 M) (C6H10O7 · H2O, mw 212.15 g/mol, ≥95% (TLC), Sigma-Aldrich®).
2.8. Cell Wall Saccharification
To evaluate the sugar release capacity of agro-wastes, 10 mg of the de-starched cell wall was pre-treated with 0.5 N NaOH for 30 minutes at 90 °C and washed three times with 25 mM sodium acetate buffer (pH 4.5) for saccharification. The enzyme blend Celic Ctec-II (Novozymes®) was added to the treated samples, which were diluted 1:1000 in 25 mM sodium acetate buffer (pH 5), and incubated for 16 hours at 50 °C. The released sugars were determined using the MBTH method [27]. For the enzymatic hydrolysis, 1 M NaOH and MBTH reagent (3 mg/mL MBTH and 1 mg/mL DTT) were added and incubated at 60 °C for 20 minutes. For color development, oxidizing reagent [0.2% FeNH4(SO4)], 0.2% sulfamic acid, and 0.1% HCl were added, and the samples were read at 620 nm, with a glucose standard curve of 50-200 nmol used for quantification.
2.9. Data Analysis
Statistical analysis was conducted using a one-way ANOVA test followed by Tukey’s test at a significance level of p ≤ 0.05 (R® version 4.2.1) to compare the various biomasses across each analyzed variable. Cell wall fractionation, monosaccharides, uronic acids, lignin analyses, and saccharification were performed in quintuplicate (n=5), while organic matter (C, H, O, N, S) and ash were analyzed in triplicate (n=3).
3. Results
The agro-wastes were grouped according to the primary cell wall type for data analysis. The classification of non-grasses (Type I) and grasses (Type II) cell walls was based on the levels of pectins, hemicelluloses, and cellulose, as well as the predominance of hemicellulose, as proposed by McCann & Roberts, [28] and Carpita & Gibeaut [8]. Nine wastes are classified as non-grasses (soybean residue, soybean husk, soybean straw, duckweed, coffee husk, bean straw, pruning tree residues, eucalyptus chip, and industry paper residue), while ten are classified as grasses (sugarcane bagasse, sugarcane, energy cane v2, energy cane v3, rice husk, barley bagasse, corn straw, corn cob, sorghum residue, and wheat bran).
3.1. Agro-Wastes Have Similar Industrial Characteristics
The FT-IR technique facilitated the identification of molecules in agro-industrial wastes by analyzing radiation wavelengths and intensities. The 19 waste samples displayed similar spectra, revealing characteristic peaks at 3,340 cm-1 (OH) to 2,290 cm-1 (C-H) (cellulose), 1,750 cm-1 and 1,630 cm-1 (C=O bonds from aromatic rings), along with peaks at 800 cm-1 and 1,050 cm-1 (C-O, C=C, and C-O-C polysaccharide bonds) (Figure 1). Since the spectra shown in Figure 1-D represent cell walls (alcohol-insoluble residues), and the more soluble low molecular weight materials have already been extracted, the vibrations common to most samples around 1,000 and 1,650 cm-1 likely originate from C-O and C-O-C stretchings associated with cellulose, mannans, and xylan. The vibrations near 1,650 cm-1 are typical for carbohydrates, as they indicate OH groups (O-H bending) and correlate with the high concentration of carbohydrates in the samples. Additionally, vibrations in this spectral region may represent C=O stretchings typical of lignin, which are also present in the samples. Overall, the FT-IR analyses confirm that the composition of the biomasses from the residues studied in this research consist mainly of carbohydrate polymers.
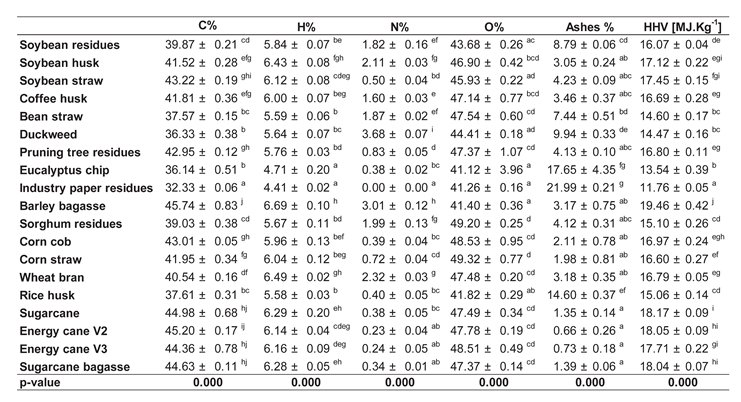
On average, the elemental composition of the agro-wastes consisted of 40.9% carbon, 5.9% hydrogen, 46% oxygen, 1.2% nitrogen, and 6% ash (Table 2). The average Higher Heating Value, indicating the energy stored in these materials, was 16.3 MJ/kg. The percentages of C and H in the samples correlated directly with the HHV, while N and O did not (Supplementary Figure S1). This confirms that carbohydrates are the primary compounds associated with the energy present in biomass. A clear distinction between Non-grasses and Grasses is evident in Figure 2, indicating that more energy is stored in the biomasses of grass-generated residues. Sugarcane residues show a significant difference toward higher HHV. Non-grass wall residues exhibited higher carbon and hydrogen content, which is reflected in the elevated oxygen content of grass walls (Table 2). The carbon content of sugarcane, energy cane V2, and V3, sugarcane bagasse, barley bagasse, and soybean straw were greater (~44%) than that of bean straw, eucalyptus chip, duckweed, and rice husk (~38%). The hydrogen content in eucalyptus chips (4.7%) and industry paper residues (4.42%) were the lowest recorded. The ash content varied from 0.96% to 23%. Non-grass ash was 3%, except for bean straw, duckweed, and industry paper residue, which contained 8.2%, 9.9%, and 22.9% ash, respectively. The ash content in some sugarcane-related materials (sugarcane, energy cane V2, energy cane V3, and sugarcane bagasse) was 1.1%, while rice husk contained 14.98% (Table 2).
The thermal composition displayed a similar pattern across the evaluated agro-wastes. However, the highest HHV was recorded in barley bagasse (18.93 MJ.Kg-1), followed by sugarcane bagasse (18.04 MJ.Kg-1), sugarcane (18.10 MJ.Kg-1), energy cane V2 (18.10 MJ.Kg-1), energy cane V3 (17.72 MJ.Kg-1), and soybean straw (17.42 MJ.Kg-1). In contrast, the lowest values were observed in eucalyptus chips (12.33 MJ.Kg-1) and industrial paper residues (11.76 MJ.Kg-1), indicating a reduction in energy content of up to 38% (Table 2). TGA results revealed a similar thermal degradation pattern among the 19 assessed agro-wastes. The maximum mass loss rate was found to occur at 600 K, while a secondary peak of lower magnitude was identified at 750 K (Figure 2).
The saccharification capacity was assessed to verify its potential for producing monosaccharides for the fermentative process of bioethanol production. Sugarcane, soybean husk, corn cob, corn straw, and industrial paper residue exhibited higher saccharification capacity (23.4 mg glc.mg CW-1) (Figure 3). Industrial paper residue (27.8 mg glc.mg CW-1), corn straw (26.0 mg glc.mg CW-1), corn cob (23.6 mg glc.mg CW-1), and soybean husk (23.3 mg glc.mg CW-1) demonstrated 13 times more saccharification capacity than duckweed (1.2 mg glc.mg CW-1), sorghum residue (1.9 mg glc.mg CW-1), pruning tree residue (2 mg glc.mg CW-1), soybean residue (2.2 mg glc.mg CW-1), and soybean straw (2.7 mg glc.mg CW-1) (Figure 3). Grass’ walls displayed slightly higher saccharification than non-grasses’ walls, measuring 14.2 and 10 mg glc.mg CW-1, respectively (Figure 3). The varying saccharification capacities of the different cell wall types and samples indicate compositional differences that require further evaluation.
3.2. Agro-Wastes Have Different Proportions of Cell Wall Domains
The materials resulting from the industrial process that represent non-grass cell walls contained, on average, 14% pectins, 17% soluble hemicelluloses, 24% hemicelluloses, 33% cellulose, and 12% lignin (Figure 4). The industry paper residue was rich in hemicelluloses and cellulose, comprising 41.8% hemicelluloses, 46.3% cellulose, and 5.6% lignin, while duckweed was pectin-rich, with 26.3% pectins and 30.5% pectins plus soluble hemicelluloses (Figure 4 and Supplementary Table S1). Conversely, the pruning tree residues and eucalyptus chips contained lignin (19.7% and 17.5%), hemicellulose (23.6% and 26.3%), and cellulose (33.1% and 40.4%) (Figure 4 and Supplementary Table S1). Furthermore, the various soybean wastes (husk, straw, and residue) exhibited different cellulose proportions (38.9%; 33.1%; 28.8%) and lignin levels (5.3%; 18.5%; 12.8%), with similar levels of pectins (16.7%; 10.3%; 18.2%), pectins plus soluble hemicelluloses (17.8%; 20.8%; 19.0%), and hemicelluloses (21.4%; 17.4%; 21.4%) (Figure 4 and Supplementary Table S1). Grass cell walls contained 9% pectins, 25% pectins plus soluble hemicelluloses, 23% hemicellulose, 26% cellulose, and 17% lignin (Figure 4 and Supplementary Table S1). Pectin levels were lower in sugarcane bagasse (3.4%), corn straw (3.9%), rice husk (5.2%), and barley bagasse (5.4%), which correspondingly had higher levels of hemicelluloses (19%; 28%; 33%; 21%) and cellulose (33.5%; 27%; 31.4%; 17.7%) (Figure 4 and Supplementary Table S1). Wheat bran was rich in hemicellulose (32.5% pectins plus soluble hemicelluloses and 32.6% hemicelluloses) (Figure 4 and Supplementary Table S1).
3.3. Fine Composition of the Cell Wall Agro-Wastes
The determination of uronic acid reflects the levels of galacturonic acid from pectin chains and glucuronic acid from some hemicelluloses, such as arabinoxylan, found in the samples. Non-grasses’ cell wall biomass has a higher pectin composition and therefore contains more galacturonic acid (65 μg.mg-1 CW on average) than grasses (type II walls) (44.9 μg.mg-1 CW on average) (Figure 5). Industrial paper residue and soybean husk showed lower levels of uronic acid (21.6 μg.mg-1 CW and 14.8 μg.mg-1 CW, respectively) in the non-grasses’ cell wall due to the extractive production phases in the industry (Figure 5). Conversely, eucalyptus chip (52.2 μg.mg-1 CW), pruning tree residue (62.7 μg.mg-1 CW), soybean straw (70.6 μg.mg-1 CW), soybean residue (72.4 μg.mg-1 CW), and duckweed (75.7 μg.mg-1 CW) exhibited medium levels. In contrast, coffee husk (92.5 μg.mg-1 CW) and bean straw (122.8 μg.mg-1 CW) displayed the highest content (Figure 5). For the grasses’ cell wall, wheat bran (13.6 μg.mg-1 CW) and sugarcane bagasse (15.1 μg.mg-1 CW) had the lowest levels, while rice husk (27.2 μg.mg-1 CW), corn straw (27.4 μg.mg-1 CW), barley bagasse (31.8 μg.mg-1 DW), and sorghum residue (44.3 μg.mg-1 CW) showed medium levels. Corn cob (62.9 μg.mg-1 CW), sugarcane (63.2 μg.mg-1 CW), energy cane V2 (64.6 μg.mg-1 CW), and energy cane V3 (98.6 μg.mg-1 CW) had varying levels (Figure 5).
The main composition of agro-waste in cell walls is shown in Figure 6. The biomasses representing non-grasses’ walls had an average of 1.2% fucose, 11.2% arabinose, 10.7% galactose, 2.9% rhamnose, 18.7% glucose, 50.8% xylose, and 4.6% mannose (Figure 6). Bean straw was particularly rich in galactose (21.1 μg.mg-1 CW) and glucose (173.8 μg.mg-1 CW) compared to coffee husk, duckweed, pruning tree residue, eucalyptus chip, and industrial paper residue (Supplementary Table S2). Coffee husk and bean straw had similar proportions of arabinose (around 28 μg.mg-1 CW), while all other non-grass wall waste samples exhibited lower proportions (0.2-3.2 μg.mg-1 CW). The eucalyptus chip was xylose-rich (83.1 μg.mg-1 CW), and the cell wall of the industrial paper residue was composed of 95% xylose (33.3 μg.mg-1 DW) and glucose (21.8 μg.mg-1 CW). Meanwhile, soybean husk showed higher levels of fucose (1.9 μg.mg-1 CW), galactose (19.1 μg.mg-1 CW), and rhamnose (3.8 μg.mg-1 DW) than other non-grasses’ walls (Figure 6 and Supplementary Table S2). Duckweed exhibited a distinct cell wall composition, characterized by high apiose content in pectin structures (Supplementary Table S2). Grass walls had approximately 0.2% fucose, 14.1% arabinose, 3.6% galactose, 0.5% rhamnose, 11.4% glucose, 69.2% xylose, and 1% mannose (Figure 6). Barley bagasse and wheat bran were rich in arabinose (100.1 μg.mg-1 CW and 80 μg.mg-1 CW, respectively), while wheat bran contained 48.2% glucose in its cell wall (208.7 μg.mg-1 CW) (Figure 6).
Cell wall fractionation enabled the characterization of monosaccharides across polysaccharide classes, facilitating the evaluation of fine cell wall structure. The ammonium oxalate fraction represents pectins, with Type I walls composed of 80% arabinose (20.9 μg.mg-1), galactose (19.5 μg.mg-1), glucose (20.5 μg.mg-1), and xylose (20.8 μg.mg-1). In the agro-wastes from Type II walls (grasses), these sugars accounted for 90% (Figure 7 and Supplementary Table S3). Arabinose levels were elevated in barley bagasse (40.5 μg.mg-1), galactose was highest in soybean husk (12.6 μg.mg-1) and duckweed (12.4 μg.mg-1), glucose peaked in sugarcane (64 μg.mg-1) and rice husk (62.8 μg.mg-1), and xylose was most abundant in energy cane V3 (76.2 μg.mg-1) compared to the other wastes (Figure 7 and Supplementary Table S3). In grasses, most of the ammonium oxalate fraction is composed of arabinoxylan-soluble hemicellulose and beta-glucan, exhibiting high glucose levels.
The sodium chloride fraction represents pectin methyl-esterified and soluble hemicelluloses. Non-grass sodium chlorite fractions were rich in xylose (43.5 μg.mg-1), with greater levels of arabinose (32.3 μg.mg-1), glucose (16.4 μg.mg-1), and galactose (10.4 μg.mg-1). A similar pattern was observed in grass cell walls, with 140.0 μg.mg-1 of xylose, 39.2 μg.mg-1 of arabinose, 19.4 μg.mg-1 of glucose, and 8.1 μg.mg-1 of galactose (Figure 7 and Supplementary Table S3). In both cell wall types, more than 70% of the 4M sodium hydroxide fraction (hemicelluloses) consisted of xylose (164.5 and 203.4 μg.mg-1), while the remaining 30% varied in composition among biomass sources (Figure 7 and Supplementary Table S3). Pruning tree residue had elevated levels of glucose (21.5 μg.mg-1), while wheat bran contained more arabinose (137.3 μg.mg-1).
The cellulose content was evaluated through sulfuric acid hydrolysis, constituting 86.6% of the residue fraction (see Figure 7 and Supplementary Table S3 for Glucose II and Residue II). Duckweed and wheat bran exhibited lower cellulose contents at 60% (181.7 μg·mg⁻¹) and 69% (346.2 μg·mg⁻¹), respectively (Figure 7 and Supplementary Table S3 - Glc II and Residue II). Non-cellulosic residue fractions from the non-grasses contained 0.2% fucose (0.6 μg·mg⁻¹), 0.2% arabinose (1 μg·mg⁻¹), 0.4% galactose (1 μg·mg⁻¹), 0.2% rhamnose (0.4 μg·mg⁻¹), 7.8% glucose (28.4 μg·mg⁻¹), 2.3% xylose (13.9 μg·mg⁻¹), 0.5% mannose (1.2 μg·mg⁻¹), and 2% apiose (present only in duckweed at 53.9 μg·mg⁻¹). The wall from grasses contained 0.1% fucose (0.5 μg·mg⁻¹), 0.3% arabinose (1.3 μg·mg⁻¹), 0.2% galactose (0.7 μg·mg⁻¹), 0.1% rhamnose (0.3 μg·mg⁻¹), 8.5% glucose (38.6 μg·mg⁻¹), 4% xylose (19.5 μg·mg⁻¹), and 0.1% mannose (0.6 μg·mg⁻¹) (see Figure 7 and Supplementary Table S3).
4. Discussion
4.1. Agro-Waste Characterization and Its Potential
Society is transitioning from a linear economy that disposes of all waste to a circular economy that reuses it [29]. The circular economy has become essential, with biomass playing a pivotal role in fostering a sustainable, low-carbon, and resource-efficient culture. Traditionally, these biomasses have been utilized for cooking, heating, civil construction, and the paper industry. However, they have recently begun producing high value-added biofuels and bioproducts. Biorefineries enhance the value of these materials, which are rich in cellulose, hemicellulose, and lignin [30].
The cell wall of the evaluated agro-wastes comprised 68% of the biomass (data not shown). Therefore, the available lignocellulosic material for application is significant. These complex structures have distinct compositions and, consequently, different interactions among the polysaccharides, resulting in a unique structure. The presence of OH groups in the region from 3340 cm-1 to 2290 cm-1 was identified and attributed to cellulose [31]. The peaks between 800 and 1050 cm-1 are associated with the C-O, C=C, and C-O-C bonds of cellulose, hemicelluloses, and pectins [32,33,34,35]. The FT-IR spectra are consistent across the various cell wall types due to the polysaccharide signatures, but additional differences are needed to fully distinguish the diversity of biomass (Figure 1).
The high carbon (41.34%) and hydrogen (5.98%) content of the agro-wastes (Table 2) indicates potential for gasification or liquid biofuel production (Shamsul et al., 2018). The higher heating value (HHV) is an important parameter for fuel quality as it represents the amount of heat released when one unit weight of the fuel is completely combusted and its products are cooled to 298 K (Majumder et al., 2008). The HHV for cell walls from non-grasses was 15.24 MJ.Kg-1, while for grasses it was 17.19 MJ.Kg-1 (Table 2). The highest HHV was observed for barley bagasse (18.93 MJ.Kg-1), whereas the lowest was for industrial paper residue (11.76 MJ.Kg-1) (Table 2). Thus, the difference in the samples’ HHV is 38%, which is significant concerning energy capacity. To evaluate the energy quality of the agro-wastes, thermogravimetric analysis (TGA) was conducted, along with the mass-loss curve as a function of temperature and its derivative. The thermal degradation pattern was similar across all agro-wastes (Figure 2), suggesting comparable behavior of the agro-wastes in a thermal reactor for energy conversion. Two mass-loss peaks (600K and 750K) were identified, indicating where volatiles pyrolyze and char oxidation occurs, respectively (Figure 2C,D). This corroborates with the findings of Krieger Filho et al. [36]. Each of these derivative peaks represents an independent degradation stage associated with a chemical reaction. Consequently, if the mass-loss rate derivative curve exhibits two peaks, the sample’s decomposition modeling should account for at least two reactions. Understanding the minimal number of reactions necessary to model sample degradation with the mass-loss rate data enables any optimization process—whether deterministic or heuristic—to determine the kinetic parameters.
For 2G bioethanol production, the monosaccharides glucose, mannose, galactose, and fucose are fermentable by yeasts and subsequently distilled [37]. The saccharification capacity was higher for industrial paper residue, corn straw, corn cob, soybean husk, and sugarcane (Figure 3), despite the fermentable sugar content (Figure 6 and Supplementary Table S2). Therefore, these biomasses should be allocated more effectively for biofuel production.
The pentoses xylose and arabinose (non-fermentable sugars) account for 61.9% of the wall of non-grasses and 83.3% of the wall of grasses in agro-industrial wastes (Figure 6). Therefore, effective cell wall pretreatment is essential, and pentose must be considered for fermentation to optimize ethanol conversion [38]. Pathways for xylose catabolism have been engineered into yeast lineages to enhance the conversion of biomass into ethanol [38,39].
4.2. Cell Wall Components and Their Polysaccharides Applications
Cellulose is the most abundant polysaccharide, formed by linear β-1,4 linked glucose, which provides strength to resist turgor pressure, maintain shape, and control cell size [40]. Typically, terrestrial plants contain about 40% cellulose in their cell walls [41]. The agro-industrial wastes with the highest cellulose content include industry paper residue (46%), eucalyptus chips (40%), soybean husk (39%), energy cane V2 (36%), and sugarcane bagasse (35%) (Figure 4 and Figure 7D, Supplementary Table S1). Therefore, these materials could be utilized in food, cosmetics, biomedical, and pharmaceutical applications [42]. The water absorption capacity of cellulose enables the formation of hydrogels, which are stabilized by ionic interactions and hydrogen bonds [43]. Consequently, cellulose can also serve as an emulsifier, film former, humectant, and anti-aging agent [44].
Hemicellulose and lignin cross-link to the cellulose core. Lignin is a phenolic compound composed of coupled 4-hydroxyphenylpropanoids that provide tissue resistance and protection against pathogens [45]. Lignin acts as a barrier to biofuel production because it contributes to cell wall resistance [17]. Therefore, the high lignin levels (16 to 22%) in energy cane V2, sorghum residue, sugarcane, eucalyptus chip, sugarcane bagasse, soybean straw, energy cane V3, and pruning tree residue make these materials unsuitable as biomass for biofuel production without lignin removal (Figure 4 and Supplementary Table S1). Conversely, duckweed and bean straw require less processing despite having lignin content of around 7% (Figure 4). However, the properties of lignin—including good biocompatibility, low toxicity, and elevated carbon content—enhance its potential for industrial applications as a high-value material [46]. Approximately 50-100 million tons of lignin are produced annually in the pulp and paper industry, with 95% used for energy generation [47,48]. Nevertheless, emerging technologies in green chemistry and biorefinery present promising opportunities. These phenolic compounds can be utilized as hydrogels, resins, carbon fibers, UV shielding, wearable electronics, flocculants, plastic composites, and biomaterials [46]. Furthermore, the catalytic depolymerization and conversion of lignin can yield syngas products (methanol, ethanol, DME, C1-C7 gases, and Fischer-Tropsch liquids), hydrocarbons (benzene, toluene, cyclohexene, and others), phenols (eugenol, cresol, catechol, resorcinol, syringol, coniferol, guaiacol), oxidized products (vanillin, DMSO, aromatic acids, aliphatic acids, aldehydes, quinones, cyclohexanol, syringaldehyde, and β-keto adipate), and macromolecules (pharmaceuticals, binders, composites, adhesives, extenders, fillers, etc.) [49].
Hemicellulose polysaccharides have an equatorial β-1,4-linked backbone structure that generates a range of xyloglucans, xylans, mannans, and mixed (β-1,4, β-1,3) linkage glucans. Xyloglucans consist of a glucose backbone with branches of xylose substituted with galactose, arabinose, and fucose, which are found in land plants, particularly in the primary walls of spermatophytes [50]. This hemicellulose predominates in the cell wall of non-grasses [8], as shown by the 4M NaOH fraction composition (Figure 7C and Supplementary Table S3). The levels of glucose and xylose account for 84.4% of the monosaccharide composition of the non-grasses’ walls (Figure 7C and Supplementary Table S3). Xyloglucans exhibit self-aggregating, water-retaining, gel-forming, and adsorption properties, which can be applied in wound dressings, mucosal protection, and ocular lubrication [51]. Additionally, xyloglucan is widely used as an additive in food and cosmetics due to its thickening and stabilizing properties [52].
The characteristics of grass walls feature arabinoxylan as the main hemicellulose [8]. Arabinoxylan belongs to the xylan group. Xylans have a backbone of β-1,4-xylose, with substitutions of α-1,2-glucuronosyl and 4-O-glucuronosyl residues, resulting in glucuronoxylans. When arabinose is attached to the O-2 and O-3 positions of the xylan chain, the polysaccharide is referred to as arabinoxylan and glucuronoarabinoxylan [50]. Among the cell walls of grasses, wheat bran has a 1:1 proportion of arabinose to xylose (Figure 7C and Supplementary Table S3). Arabinose constitutes 14%, while xylose accounts for 73% of the 4M NaOH fractions of the cell wall from grasses (Figure 7C). The arabinoxylans from corn, wheat, and sorghum exhibit high viscosity and can therefore be utilized in the food industry as emulsifiers and gelling agents [53]. Furthermore, arabinoxylans can form hydrogels and aerogels, serving as drug delivery systems [54]. Other applications of arabinoxylans include sunscreen, cement, oral granules, packaging, and treatments for osteoarthritis [55].
The hemicellulose with a β-1,4-mannose backbone is present in mannans and galactomannans (branches with galactose), while a non-repeating pattern of mannose and glucose is found in glucomannans and galactoglucomannans [50]. The monosaccharide mannose was observed in all fractions, with a higher concentration in the 4M fraction (Figure 7C). Mannose constituted 7% of the cell walls from non-grasses, which was higher than the percentage found in soybean residue, bean straw, soybean husk, pruning tree residue, and soybean straw (Figure 7C and Supplementary Table S3). In contrast, walls from grasses contained only 1% mannose (Figure 7C and Supplementary Table S3). Galactomannans and glucomannans are non-toxic and can therefore be utilized in the food, pharmaceutical, biomedical, cosmetics, and textile industries. One of their primary applications in food involves gel formation, coating, stiffeners, viscosity modifiers, and stabilizers [56].
A hemicellulose exclusive to grasses is β-glucan. This polysaccharide forms through the linkage of glucose units via β-1,3 and β-1,4 bonds. Despite its solubility and crosslinks with other polysaccharides, the glucose level identified in all fractions of the integrated cell wall was 11%. In the ammonium oxalate fraction, glucose levels were 26%; in sodium chlorite, 10%; and in 4M NaOH, 9%, when analyzed from sugarcanes, barley, sorghum, corn, wheat, and rice (Type II cell wall) (Figure 7). These polysaccharides may be considered prebiotics due to their effects on reducing glycemic levels and serum cholesterol, managing diabetes, controlling cardiovascular diseases, fighting cancer, aiding in hypertension, and promoting wound healing [57]. Additionally, β-glucan can be utilized in the food industry for thickening, stabilizing, emulsifying, and gelation, like pectins and galactomannans [58].
Pectins are complex polysaccharides featuring a homogalacturonan backbone composed of galacturonic acid, which is modified to form rhamnogalacturonan type I, rhamnogalacturonan type II, xylogalacturonan, and apiogalacturonan [59]. The concentration of pectins was 14% in Type I and 9% in Type II (see Figure 4 and Supplementary Table S1). The uronic acid dosages illustrated in Figure 5 evaluate the galacturonic and glucuronic acid contents in the different biomass cell walls. As expected, cell wall Type I exhibited a 31% higher uronic acid content, particularly in coffee husk and bean straw (Figure 5). The agro-waste classified as Type II primary cell walls ranged from 44.9 to 98.6 μg mg⁻¹ CW (Figure 5). Pectin composition reveals an abundance of arabinogalactans (arabinose and galactose), while non-grass walls contain higher amounts of rhamnose (Figure 7A,B). Among the evaluated agro-wastes, duckweeds possess distinct pectins, apiogalacturonans, and xylogalacturonans that consist of galacturonic acid backbones with O-2 and O-3 branches formed by apiose and xylose [59]. Apiose was detected in all duckweed cell wall fractions, and the whole cell wall composition was found to represent 44.7% of the overall composition (Supplementary Table S3). Carbohydrates containing apiose are widely utilized in biotechnology for defense and resistance against stresses, as well as in dermatological preparations, sunscreen, and emulsification bases [60,61,62,63,64]. The primary pectins found in plants are homogalacturonans (~65%) and rhamnogalacturonan Type I (~35%) [59]. The monosaccharide compositions shown in Figure 7A,B support these polymer findings. Pectins are a low-cost, highly available polysaccharide commonly employed in food (as gelling, thickening, stabilizing, and emulsifying agents), cosmetics (for stability and rheological properties), pharmaceuticals (for drug delivery, gene delivery, wound healing, cholesterol reduction, tissue engineering, synthetic membranes, and anticancer activities), biopolymers (films and packaging), and as adsorbents in effluent treatments [65]. Despite the diverse cell wall compositions, the pectin content and profile of duckweed, bean straw, soybean residue, soybean husk, and wheat bran indicate that these pectins can enhance the valorization of agro-industrial residues and facilitate the applications described above.
The segregation between wall non-grasses and grasses is illustrated in Figure 8. PC1 effectively grouped the cell wall types, demonstrating that sugarcanes exhibited elevated xylose in the 4M NaOH and sodium chlorite fractions, alongside sorghum and rice; corn displayed higher glucose levels in the 4M NaOH and residue; wheat contained more arabinose; bean straw was clustered towards the rhamnose of the ammonium oxalate fraction; and duckweed, despite its content of pectin, rhamnose, and apiose, also showed distinct characteristics; the wood biomasses exhibited elevated glucose levels. However, industrial paper residue exhibited lower lignin content (Figure 8 and Supplementary Table S3). This indicates that the composition of the cell walls and their types would influence the effectiveness of applications aimed at the circular economy.
5. Conclusions
The chemical composition of cell wall polysaccharides found in agro-industrial waste in Brazil highlights numerous industrial applications that offer green and sustainable options for value-added by-products, aligning with the principles of the circular economy. Exploring this potential is urgent, as it may significantly impact sustainability.
Supplementary Materials
The following supporting information can be downloaded at the website of this paper posted on Preprints.org.
Author Contributions
DP, AG, and MB planned and designed the experiment. DP and AG performed the laboratory analyses. MLTMP provided biomass. ACJ and ARA performed the FT-IR analysis and interpretation. HHV and GCKF performed the HHM and TGA analysis. DP and AG analyzed the data. DP, AG, and MB wrote the original draft, reviewed it, and edited it. All authors have read and agreed to the published version of the manuscript.
Funding
This research was funded by the Instituto Nacional de Ciência e Tecnologia do Bioetanol - INCT do Bioetanol, grant numbers FAPESP 2014/50884-5 and CNPq 465319/2014-9 and Centro de Pesquisa e Inovação de Gases de Efeito Estufa—RCGI/Shell/FUSP 371055 (FAPESP/Shell 2020/15230-5). A.G. (FAPESP 2019/13936-0) appreciates the fellowship.
Conflicts of Interest
The authors declare no conflicts of interest. The funders had no role in the design of the study; in the collection, analyses, or interpretation of data; in the writing of the manuscript; or in the decision to publish the results.
References
- HLPE High Level Panel of Experts. 2017. Nutrition and Food Systems. Committee o World Food Security (CFS) 2017, 44, 150.
- de Coninck, H.; Revi, A.; Babiker, M.; Bertoldi, P.; Buckeridge, M.; Cartwright, A.; Dong, W.; Ford, J.; Fuss, S.; Hourcade, J.C.; et al. Strenthening and Implementing the Global Response. In Global warming of 1.5°C: Summary for policy makers; IPCC - The Intergovernmental Panel on Climate Change, 2018; pp. 313–443.
- Mishra, A.; Kumar, M.; Medhi, K. Biomass Energy with Carbon Capture and Storage (BECCS). In Current Developments in Biotechnology and Bioengineering: Sustainable Bioresources for the Emerging Bioeconomy; Elsevier, 2020; pp. 399–427 ISBN 9780444643094.
- Martinez-Burgos, W.J.; Bittencourt Sydney, E.; Bianchi Pedroni Medeiros, A.; Magalhães, A.I.; de Carvalho, J.C.; Karp, S.G.; Porto de Souza Vandenberghe, L.; Junior Letti, L.A.; Thomaz Soccol, V.; de Melo Pereira, G.V.; et al. Agro-Industrial Wastewater in a Circular Economy: Characteristics, Impacts and Applications for Bioenergy and Biochemicals. Bioresour Technol 2021, 341. [CrossRef]
- Mancini, S.D.; de Medeiros, G.A.; Paes, M.X.; de Oliveira, B.O.S.; Antunes, M.L.P.; de Souza, R.G.; Ferraz, J.L.; Bortoleto, A.P.; de Oliveira, J.A.P. Circular Economy and Solid Waste Management: Challenges and Opportunities in Brazil. Circular Economy and Sustainability 2021, 1, 261–282. [Google Scholar] [CrossRef]
- Yang, N.-H.N.; Bertassini, A.C.; Mendes, J.A.J.; Gerolamo, M.C. The ‘3CE2CE’ Framework—Change Management Towards a Circular Economy: Opportunities for Agribusiness. Circular Economy and Sustainability 2021, 1, 697–718. [Google Scholar] [CrossRef]
- Verbančič, J.; Lunn, J.E.; Stitt, M.; Persson, S. Carbon Supply and the Regulation of Cell Wall Synthesis. Mol Plant 2017, 11, 75–94. [Google Scholar] [CrossRef] [PubMed]
- Carpita, N.C.; Gibeaut, D.M. Structural Models of Primary Cell Walls in Flowering Plants: Consistency of Molecular Structure with the Physical Properties of the Walls during Growth. The Plant Journal 1993, 3, 1–30. [Google Scholar] [CrossRef]
- Silva, G.B.; Ionashiro, M.; Carrara, T.B.; Crivellari, A.C.; Tiné, M.A.S.S.; Prado, J.; Carpita, N.C.; Buckeridge, M.S. Cell Wall Polysaccharides from Fern Leaves: Evidence for a Mannan-Rich Type III Cell Wall in Adiantum Raddianum. Phytochemistry 2011, 72, 2352–2360. [Google Scholar] [CrossRef] [PubMed]
- McCann, M.C.; Carpita, N.C. Designing the Deconstruction of Plant Cell Walls. Curr Opin Plant Biol 2008, 11, 314–320. [Google Scholar] [CrossRef]
- de Souza, A.P.; Leite, D.C.C.; Pattathil, S.; Hahn, M.G.; Buckeridge, M.S. Composition and Structure of Sugarcane Cell Wall Polysaccharides: Implications for Second-Generation Bioethanol Production. Bioenergy Res 2013, 6, 564–579. [Google Scholar] [CrossRef]
- Sarkar, P.; Bosneaga, E.; Auer, M. Plant Cell Walls throughout Evolution: Towards a Molecular Understanding of Their Design Principles. J Exp Bot 2009, 60, 3615–3635. [Google Scholar] [CrossRef]
- Saini, J.K.; Saini, R.; Tewari, L. Lignocellulosic Agriculture Wastes as Biomass Feedstocks for Second-Generation Bioethanol Production: Concepts and Recent Developments. 3 Biotech 2015, 5, 337–353. [Google Scholar] [CrossRef]
- Ashokkumar, V.; Venkatkarthick, R.; Jayashree, S.; Chuetor, S.; Dharmaraj, S.; Kumar, G.; Chen, W.H.; Ngamcharussrivichai, C. Recent Advances in Lignocellulosic Biomass for Biofuels and Value-Added Bioproducts - A Critical Review. Bioresour Technol 2022, 344. [Google Scholar] [CrossRef]
- Dahmen, N.; Lewandowski, I.; Zibek, S.; Weidtmann, A. Integrated Lignocellulosic Value Chains in a Growing Bioeconomy: Status Quo and Perspectives. GCB Bioenergy 2019, 11, 107–117. [Google Scholar] [CrossRef]
- Arpit Singh, T.; Sharma, M.; Sharma, M.; Dutt Sharma, G.; Kumar Passari, A.; Bhasin, S. Valorization of Agro-Industrial Residues for Production of Commercial Biorefinery Products. Fuel 2022, 322. [Google Scholar] [CrossRef]
- Cesarino, I.; Araújo, P.; Domingues, A.P.; Mazzafera, P. An Overview of Lignin Metabolism and Its Effect on Biomass Recalcitrance. Brazilian Journal of Botany 2012, 35, 303–311. [Google Scholar] [CrossRef]
- ASTM D2974 Standard Test Methods for Determining the Water (Moisture) Content, Ash Content, and Organic Material of Peat and Other Organic Soils; Philadelphia, 1987.
- Basu, P. Biomass Gasification, Pyrolysis and Torrefaction: Practical Design and Theory. Biomass Gasification, Pyrolysis and Torrefaction: Practical Design and Theory 2013, 1–530. [CrossRef]
- Van Acker, R.; Vanholme, R.; Storme, V.; Mortimer, J.C.; Dupree, P.; Boerjan, W. Lignin Biosynthesis Perturbations Affect Secondary Cell Wall Composition and Saccharification Yield in Arabidopsis Thaliana. Biotechnol Biofuels 2013, 6, 46. [Google Scholar] [CrossRef] [PubMed]
- Fukushima, R.S.; Kerley, M.S. Use of Lignin Extracted from Different Plant Sources as Standards in the Spectrophotometric Acetyl Bromide Lignin Method. J Agric Food Chem 2011, 59, 3505–3509. [Google Scholar] [CrossRef]
- Fukushima, R.S.; Kerley, M.S.; Ramos, M.H.; Porter, J.H.; Kallenbach, R.L. Comparison of Acetyl Bromide Lignin with Acid Detergent Lignin and Klason Lignin and Correlation with in Vitro Forage Degradability. Anim Feed Sci Technol 2015, 201, 25–37. [Google Scholar] [CrossRef]
- Xue, F.C.; Chandra, R.; Berleth, T.; Beatson, R.P. Rapid, Microscale, Acetyl Bromide-Based Method for High-Throughput Determination of Lignin Content in Arabidopsis Thaliana. J Agric Food Chem 2008, 56, 6825–6834. [Google Scholar] [CrossRef]
- Carpita, N.C. Fractionation of Hemicelluloses from Maize Cell Walls with Increasing Concentrations of Alkali. Phytochemistry 1984, 23, 1089–1093. [Google Scholar] [CrossRef]
- Gorshkova, T.A.; Wyatt, S.E.; Salnikov, V. V; Gibeaut, D.M.; Lozovaya, V. V; Carpita, N.C.; Ibragimov, R. Cell-Wall Polysaccharides of Developing Flax Plants ’. 1996, 721–729. [CrossRef]
- Filisetti-Cozzi, T.M.C.C.; Carpita, N.C. Measurement of Uronic Acids without Interference from Neutral Sugars. Anal Biochem 1991, 197, 157–162. [Google Scholar] [CrossRef]
- Gomez, L.D.; Whitehead, C.; Barakate, A.; Halpin, C.; McQueen-Mason, S.J. Automated Saccharification Assay for Determination of Digestibility in Plant Materials. Biotechnol Biofuels 2010, 3. [Google Scholar] [CrossRef]
- McCann, M.C.; Roberts, K. Changes in Cell Wall Architecture during Cell Elongation. J Exp Bot 1994, 45, 1683–1691. [Google Scholar] [CrossRef]
- Leong, H.Y.; Chang, C.K.; Khoo, K.S.; Chew, K.W.; Chia, S.R.; Lim, J.W.; Chang, J.S.; Show, P.L. Waste Biorefinery towards a Sustainable Circular Bioeconomy: A Solution to Global Issues. Biotechnol Biofuels 2021, 14. [Google Scholar] [CrossRef] [PubMed]
- Usmani, Z.; Sharma, M.; Karpichev, Y.; Pandey, A.; Chandra Kuhad, R.; Bhat, R.; Punia, R.; Aghbashlo, M.; Tabatabaei, M.; Gupta, V.K. Advancement in Valorization Technologies to Improve Utilization of Bio-Based Waste in Bioeconomy Context. Renewable and Sustainable Energy Reviews 2020, 131. [Google Scholar] [CrossRef]
- Kumar, A.; Singh Negi, Y.; Choudhary, V.; Kant Bhardwaj, N. Characterization of Cellulose Nanocrystals Produced by Acid-Hydrolysis from Sugarcane Bagasse as Agro-Waste. Journal of Materials Physics and Chemistry 2014, 2, 1–8. [Google Scholar] [CrossRef]
- Fávaro, S.L.; Lopes, M.S.; Vieira de Carvalho Neto, A.G.; Rogério de Santana, R.; Radovanovic, E. Chemical, Morphological, and Mechanical Analysis of Rice Husk/Post-Consumer Polyethylene Composites. Compos Part A Appl Sci Manuf 2010, 41, 154–160. [Google Scholar] [CrossRef]
- Mondal, M.I.H.; Yeasmin, M.S.; Rahman, M.S. Preparation of Food Grade Carboxymethyl Cellulose from Corn Husk Agrowaste. Int J Biol Macromol 2015, 79, 144–150. [Google Scholar] [CrossRef]
- Shehzad, M.; Asghar, A.; Ramzan, N.; Aslam, U.; Bello, M.M. Impacts of Non-Oxidative Torrefaction Conditions on the Fuel Properties of Indigenous Biomass (Bagasse). Waste Manag Res 2020, 38, 1284–1294. [Google Scholar] [CrossRef]
- Silva, T.P.; Ferreira, A.N.; de Albuquerque, F.S.; de Almeida Barros, A.C.; da Luz, J.M.R.; Gomes, F.S.; Pereira, H.J.V. Box–Behnken Experimental Design for the Optimization of Enzymatic Saccharification of Wheat Bran. Biomass Convers Biorefin 2022, 12, 5597–5604. [Google Scholar] [CrossRef]
- Krieger Filho, G.C.; Costa, F.; Torraga Maria, G.F.; Bufacchi, P.; Trubachev, S.; Shundrina, I.; Korobeinichev, O. Kinetic Parameters and Heat of Reaction for Forest Fuels Based on Genetic Algorithm Optimization. Thermochim Acta 2022, 713, 179228. [Google Scholar] [CrossRef]
- van Maris, A.J.A.A.; Abbott, D.A.; Bellissimi, E.; van den Brink, J.; Kuyper, M.; Luttik, M.A.H.H.; Wisselink, H.W.; Scheffers, W.A.; van Dijken, J.P.; Pronk, J.T. Alcoholic Fermentation of Carbon Sources in Biomass Hydrolysates by Saccharomyces Cerevisiae: Current Status. Antonie van Leeuwenhoek, International Journal of General and Molecular Microbiology 2006, 90, 391–418. [Google Scholar] [CrossRef]
- Moysés, D.N.; Reis, V.C.B.; de Almeida, J.R.M.; de Moraes, L.M.P.; Torres, F.A.G. Xylose Fermentation by Saccharomyces Cerevisiae: Challenges and Prospects. Int J Mol Sci 2016, 17, 1–18. [Google Scholar] [CrossRef] [PubMed]
- Cunha, J.T.; Soares, P.O.; Romaní, A.; Thevelein, J.M.; Domingues, L. Xylose Fermentation Efficiency of Industrial Saccharomyces Cerevisiae Yeast with Separate or Combined Xylose Reductase/Xylitol Dehydrogenase and Xylose Isomerase Pathways. Biotechnol Biofuels 2019, 12, 20. [Google Scholar] [CrossRef] [PubMed]
- Saxena, I.M.; Brown, R.M. Cellulose Biosynthesis: Current Views and Evolving Concepts. Ann Bot 2005, 96, 9–21. [Google Scholar] [CrossRef]
- Ge, X.; Zhang, N.; Phillips, G.C.; Xu, J. Growing Lemna Minor in Agricultural Wastewater and Converting the Duckweed Biomass to Ethanol. Bioresour Technol 2012, 124, 485–488. [Google Scholar] [CrossRef] [PubMed]
- Liu, J.; Willför, S.; Xu, C. A Review of Bioactive Plant Polysaccharides: Biological Activities, Functionalization, and Biomedical Applications. Bioactive Carbohydrates and Dietary Fibre 2015, 5, 31–61. [Google Scholar] [CrossRef]
- Palantöken, S.; Bethke, K.; Zivanovic, V.; Kalinka, G.; Kneipp, J.; Rademann, K. Cellulose Hydrogels Physically Crosslinked by Glycine: Synthesis, Characterization, Thermal and Mechanical Properties. J Appl Polym Sci 2020, 137. [Google Scholar] [CrossRef]
- Seddiqi, H.; Oliaei, E.; Honarkar, H.; Jin, J.; Geonzon, L.C.; Bacabac, R.G.; Klein-Nulend, J. Cellulose and Its Derivatives: Towards Biomedical Applications. Cellulose 2021, 28, 1893–1931. [Google Scholar] [CrossRef]
- Liu, Q.; Luo, L.; Zheng, L. Lignins: Biosynthesis and Biological Functions in Plants. Int J Mol Sci 2018, 19. [Google Scholar] [CrossRef] [PubMed]
- Ma, C.; Kim, T.H.; Liu, K.; Ma, M.G.; Choi, S.E.; Si, C. Multifunctional Lignin-Based Composite Materials for Emerging Applications. Front Bioeng Biotechnol 2021, 9. [Google Scholar] [CrossRef]
- Aro, T.; Fatehi, P. Production and Application of Lignosulfonates and Sulfonated Lignin. ChemSusChem 2017, 10, 1861–1877. [Google Scholar] [CrossRef]
- Fabbri, F.; Bischof, S.; Mayr, S.; Gritsch, S.; Jimenez Bartolome, M.; Schwaiger, N.; Guebitz, G.M.; Weiss, R. The Biomodified Lignin Platform: A Review. Polymers (Basel) 2023, 15. [Google Scholar] [CrossRef] [PubMed]
- Schutyser, W.; Renders, T.; Van Den Bossche, G.; Van Den Bosch, S.; Koelewijn, S.-F.; Ennaert, T.; Sels, B.F. Catalysis in Lignocellulosic Biorefineries: The Case of Lignin Conversion. In Nanotechnology catalysis; Wiley-VCH Verlag GmbH & Co: Weinheim, Germany, 2017; pp. 587–584. [Google Scholar]
- Scheller, H.V.; Ulvskov, P. Hemicelluloses. Annu Rev Plant Biol 2010, 61, 263–289. [Google Scholar] [CrossRef] [PubMed]
- Esquena-Moret, J. A Review of Xyloglucan: Self-Aggregation, Hydrogel Formation, Mucoadhesion and Uses in Medical Devices. Macromol 2022, 2, 562–590. [Google Scholar] [CrossRef]
- Mishra, A.; Malhotra, A.V. Tamarind Xyloglucan: A Polysaccharide with Versatile Application Potential. J Mater Chem 2009, 19, 8528–8536. [Google Scholar] [CrossRef]
- Yan, J.; Jia, X.; Feng, L.; Yadav, M.; Li, X.; Yin, L. Rheological and Emulsifying Properties of Arabinoxylans from Various Cereal Brans. J Cereal Sci 2019, 90. [Google Scholar] [CrossRef]
- González-Estrada, R.; Calderón-Santoyo, M.; Carvajal-Millan, E.; De Jesús Ascencio Valle, F.; Ragazzo-Sánchez, J.A.; Brown-Bojorquez, F.; Rascón-Chu, A. Covalently Cross-Linked Arabinoxylans Films for Debaryomyces Hansenii Entrapment. Molecules 2015, Vol. 20, Pages 11373-11386 2015, 20, 11373–11386. [Google Scholar] [CrossRef]
- He, H.J.; Qiao, J.; Liu, Y.; Guo, Q.; Ou, X.; Wang, X. Isolation, Structural, Functional, and Bioactive Properties of Cereal Arabinoxylan─A Critical Review. J Agric Food Chem 2021, 69, 15437–15457. [Google Scholar] [CrossRef]
- Singh, S.; Singh, G.; Arya, S.K. Mannans: An Overview of Properties and Application in Food Products. Int J Biol Macromol 2018, 119, 79–95. [Google Scholar] [CrossRef] [PubMed]
- Yoo, H.-D.; Kim, D.; Paek, S.-H.; Oh, S.-E. Plant Cell Wall Polysaccharides as Potential Resources for the Development of Novel Prebiotics. Biomol Ther (Seoul) 2012, 20, 371–379. [Google Scholar] [CrossRef]
- Singla, A.; Gupta, O.P.; Sagwal, V.; Kumar, A.; Patwa, N.; Mohan, N.; Ankush; Kumar, D.; Vir, O.; Singh, J.; et al. Beta-Glucan as a Soluble Dietary Fiber Source: Origins, Biosynthesis, Extraction, Purification, Structural Characteristics, Bioavailability, Biofunctional Attributes, Industrial Utilization, and Global Trade. Nutrients 2024, 16, 900. [CrossRef]
- Mohnen, D. Pectin Structure and Biosynthesis. Curr Opin Plant Biol 2008, 11, 266–277. [Google Scholar] [CrossRef]
- Beck, E.; Hopf, H. Branched-Chain Sugars and Sugar Alcohols. Methods in Plant Biochemistry 1990, 2, 235–289. [Google Scholar] [CrossRef]
- Eckey-Kaltenbach, H.; Heller, W.; Sonnenbichler, J.; Zetl, I.; Schäfer, W.; Ernst, D.; Sandermann, H. Oxidative Stress and Plant Secondary Metabolism: 6″-O-Malonylapiin in Parsley. Phytochemistry 1993, 34, 687–691. [Google Scholar] [CrossRef]
- Mølhøj, M.; Verma, R.; Reiter, W.D. The Biostnthesis of the Branched-Chain Sugar D-Apiose in Plants: Functional Cloning and Characterization of a UDP-D-Apiose/UDP-D-Xylose Synthase from Arabidopsis. Plant Journal 2003, 35, 1781–1791. [Google Scholar] [CrossRef]
- Pičmanová, M.; Møller, B.L. Apiose: One of Nature’s Witty Games. Glycobiology 2016, 26, 430–442. [Google Scholar] [CrossRef] [PubMed]
- Zanutto, F.V.; Boldrin, P.K.; Varanda, E.A.; De Souza, S.F.; Sano, P.T.; Vilegas, W.; Dos Santos, L.C. Characterization of Flavonoids and Naphthopyranones in Methanol Extracts of Paepalanthus Chiquitensis Herzog by HPLC-ESI-IT-MSn and Their Mutagenic Activity. Molecules 2013, Vol. 18, Pages 244-262 2012, 18, 244–262. [CrossRef]
- Freitas, C.M.P.; Coimbra, J.S.R.; Souza, V.G.L.; Sousa, R.C.S. Structure and Applications of Pectin in Food, Biomedical, and Pharmaceutical Industry: A Review. Coatings 2021, 11. [Google Scholar] [CrossRef]
Figure 1.
Infrared spectrum of different agro-industrial wastes.
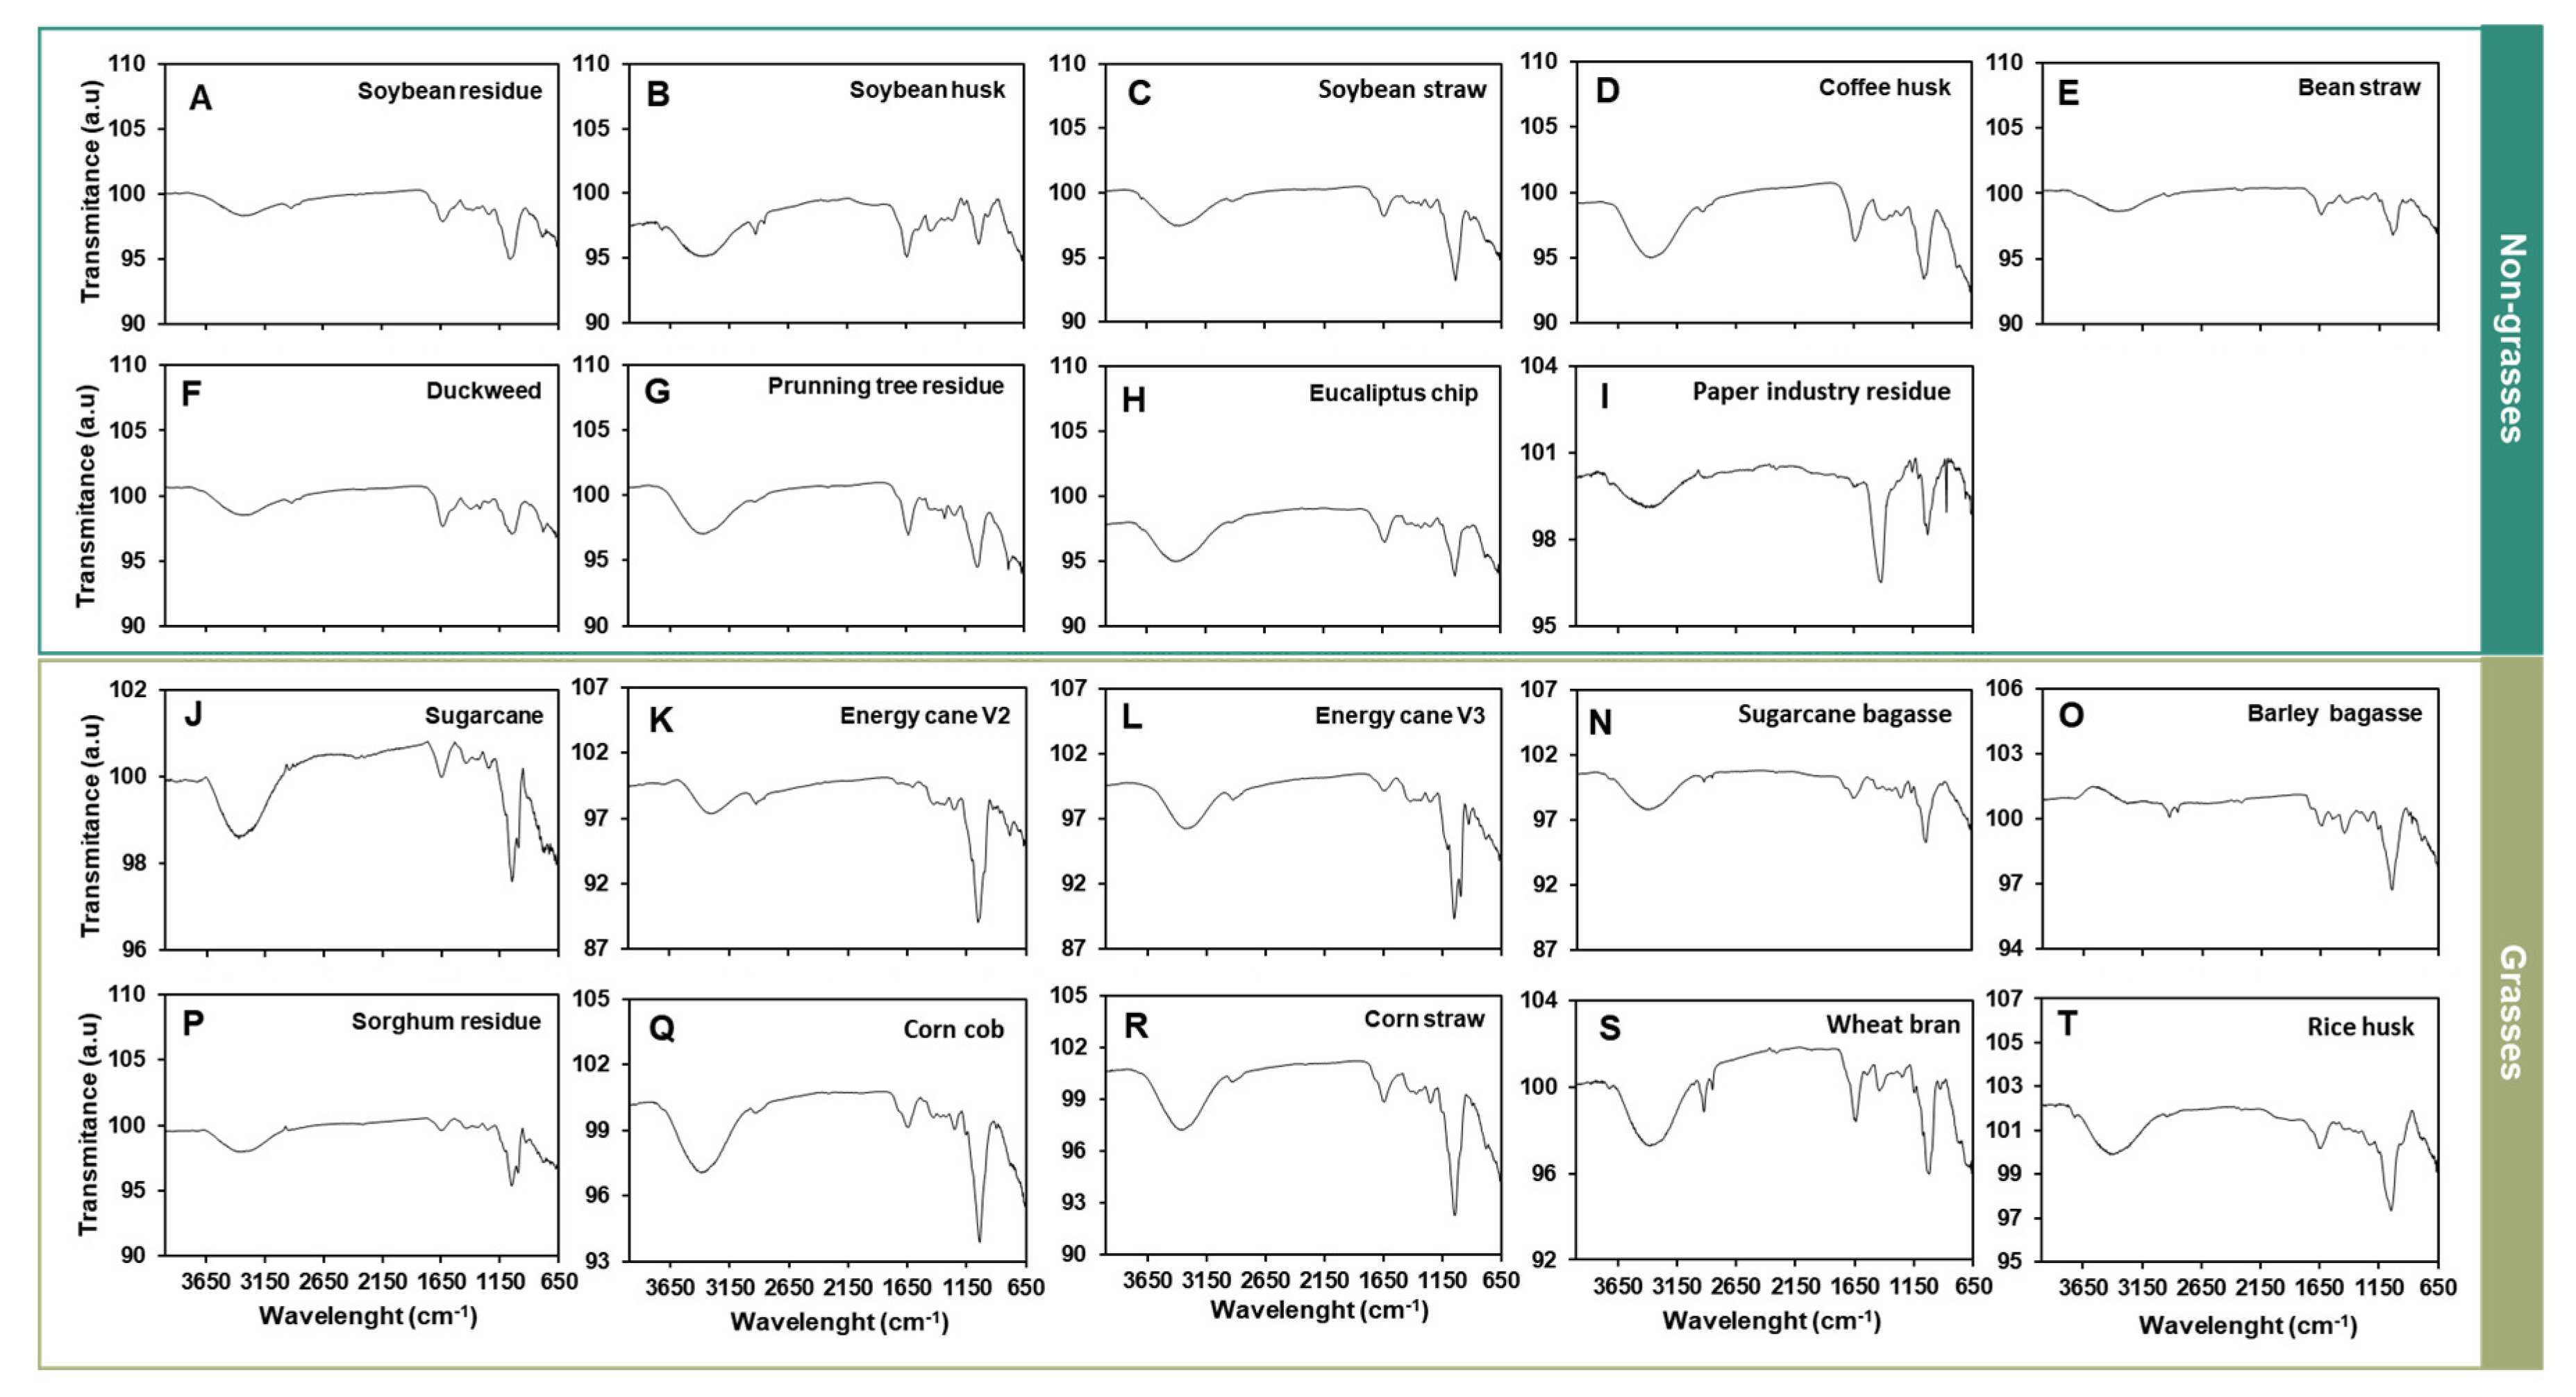
Figure 2.
TGA thermal degradation and its mass derivatives of different agro-wastes cell walls. A. Non-grasses cell wall TGA. B. Grasses’s cell wall TGA. C. Mass fraction derivative over the temperature of non-grasses wall. D. Mass fraction derivative over the temperature of grasses cell wall. The TGA thermal degradation was normalized mass over the temperature of the oxidative atmosphere.
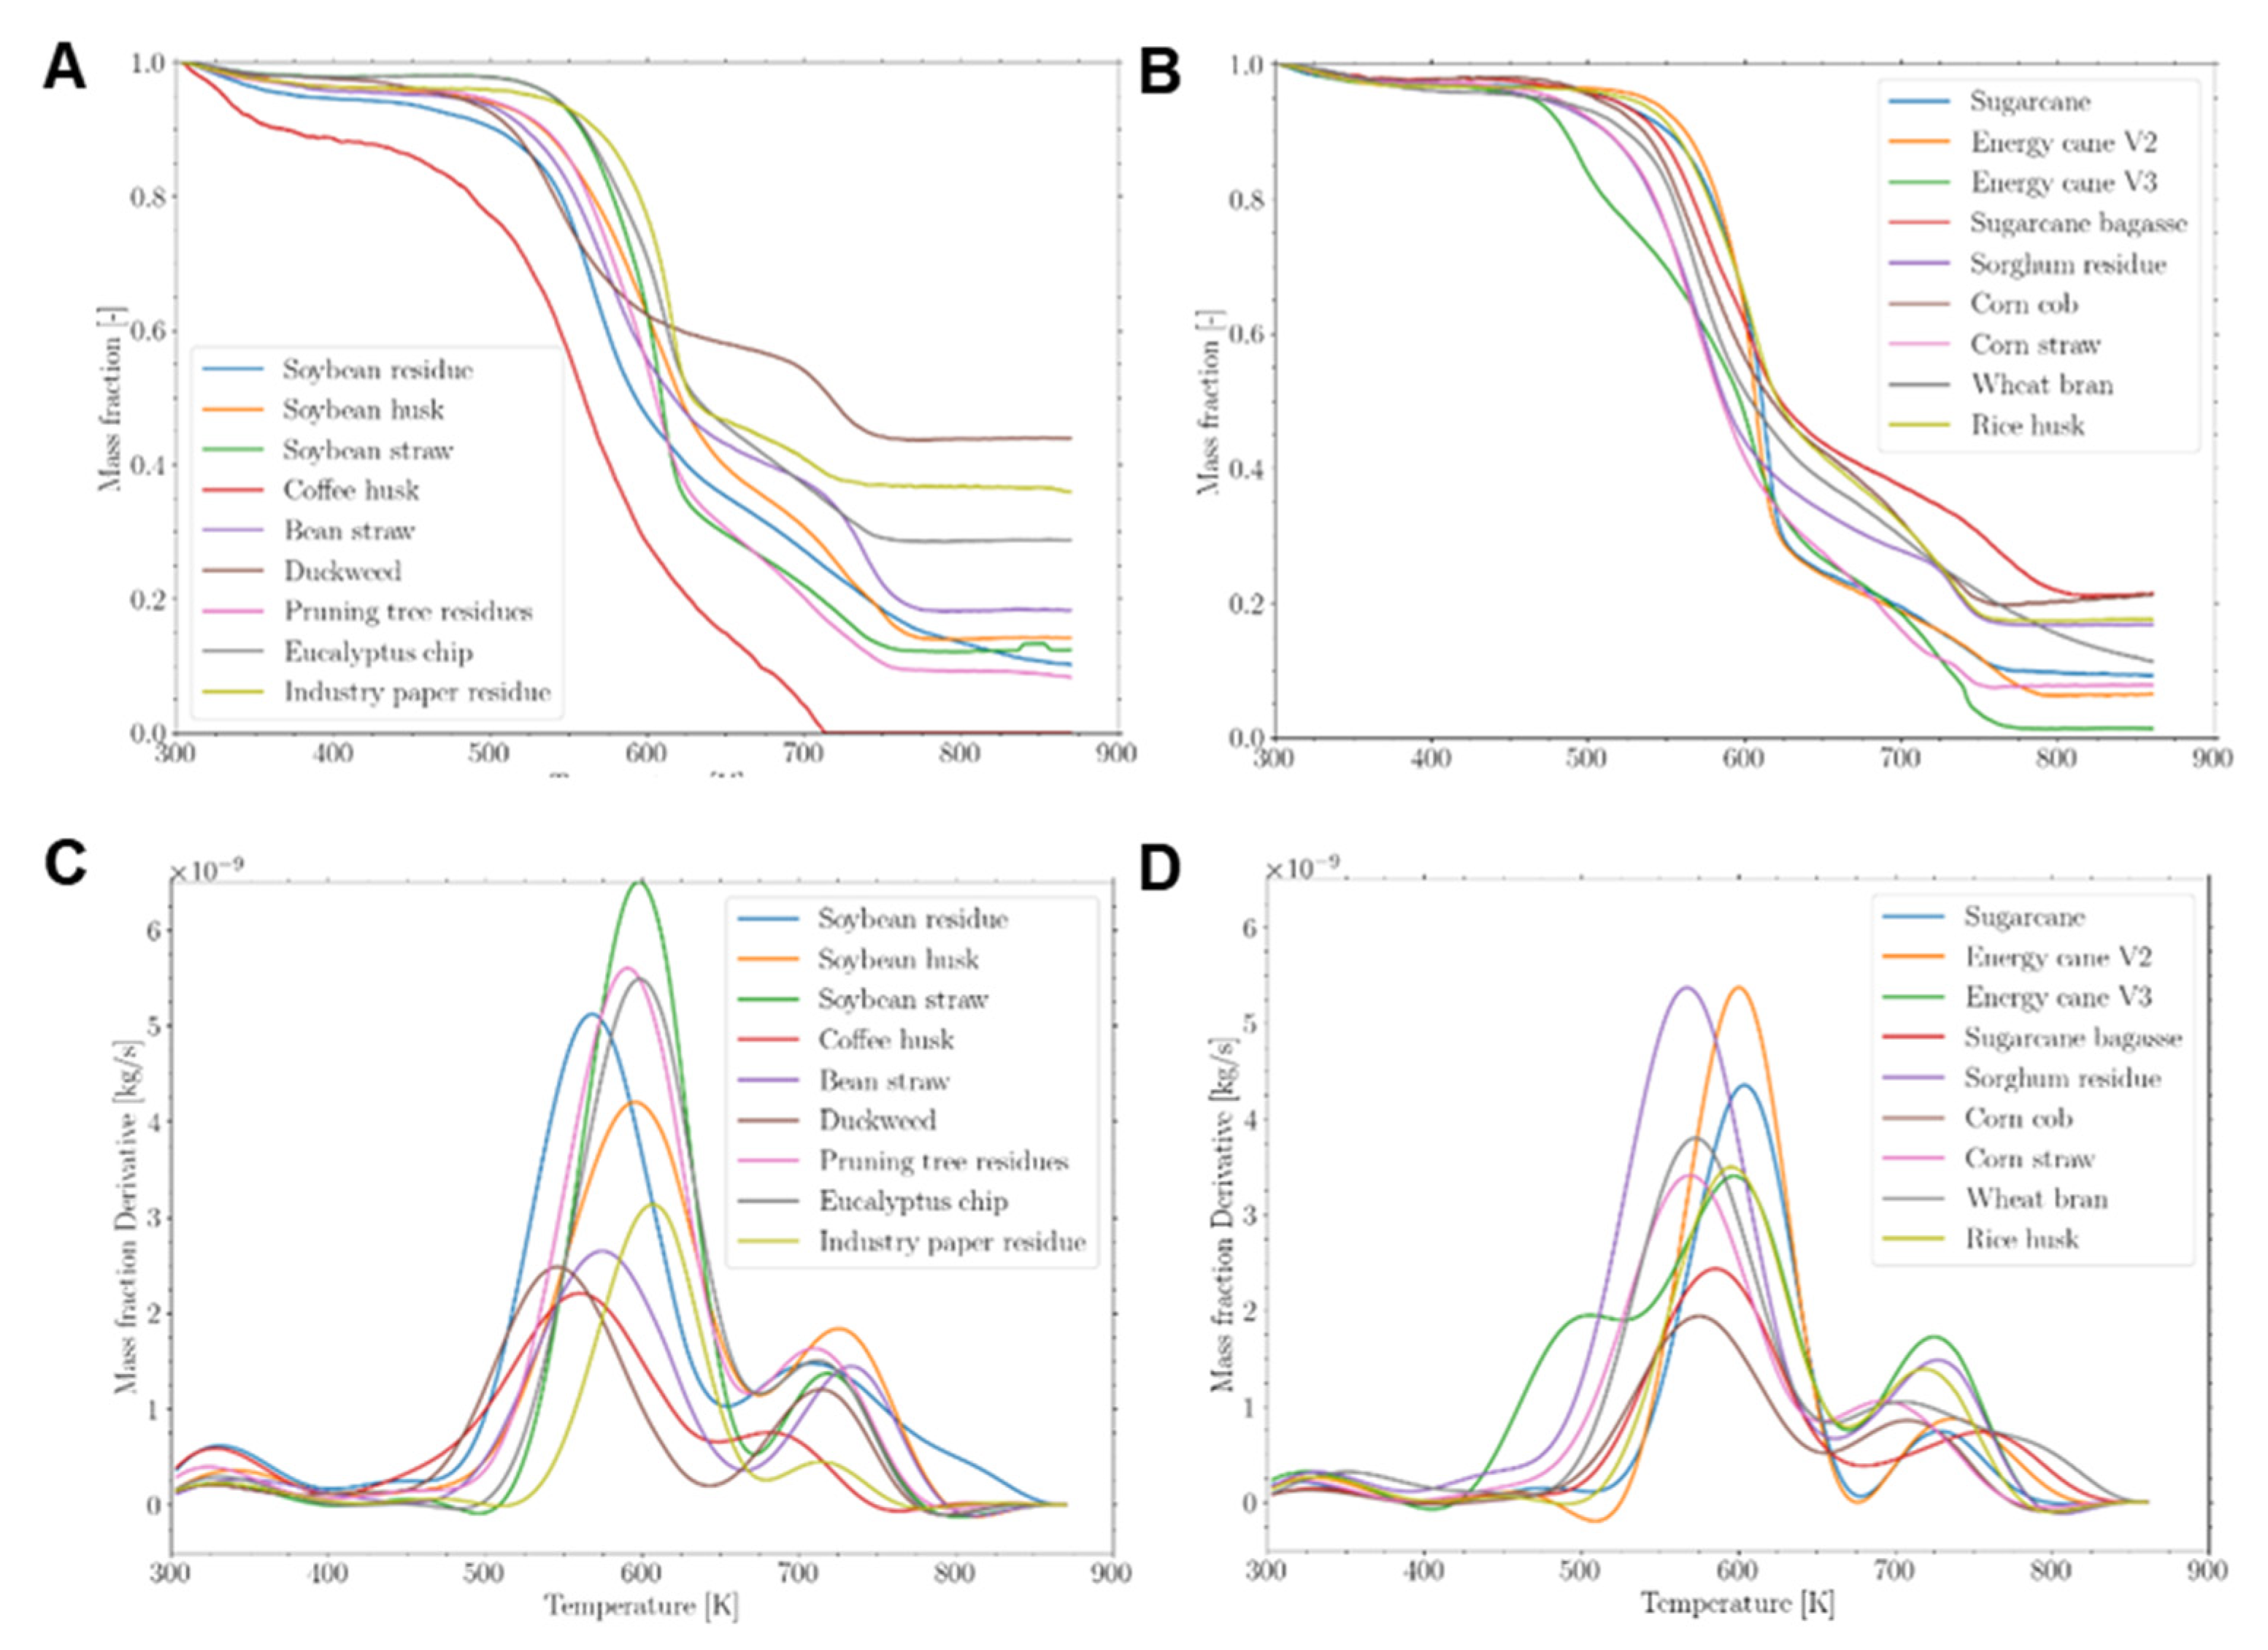
Figure 3.
Saccharification capacity of different agro-wastes cell walls. Data represented by percentage average ± std error (n=5). Different letters are statistically significant among biomasses compared to ANOVA-one way with Tukey’s test (p<0.05). Water-blue represents the data from non-grasses walls and brownish-green represents the data from grasses walls.
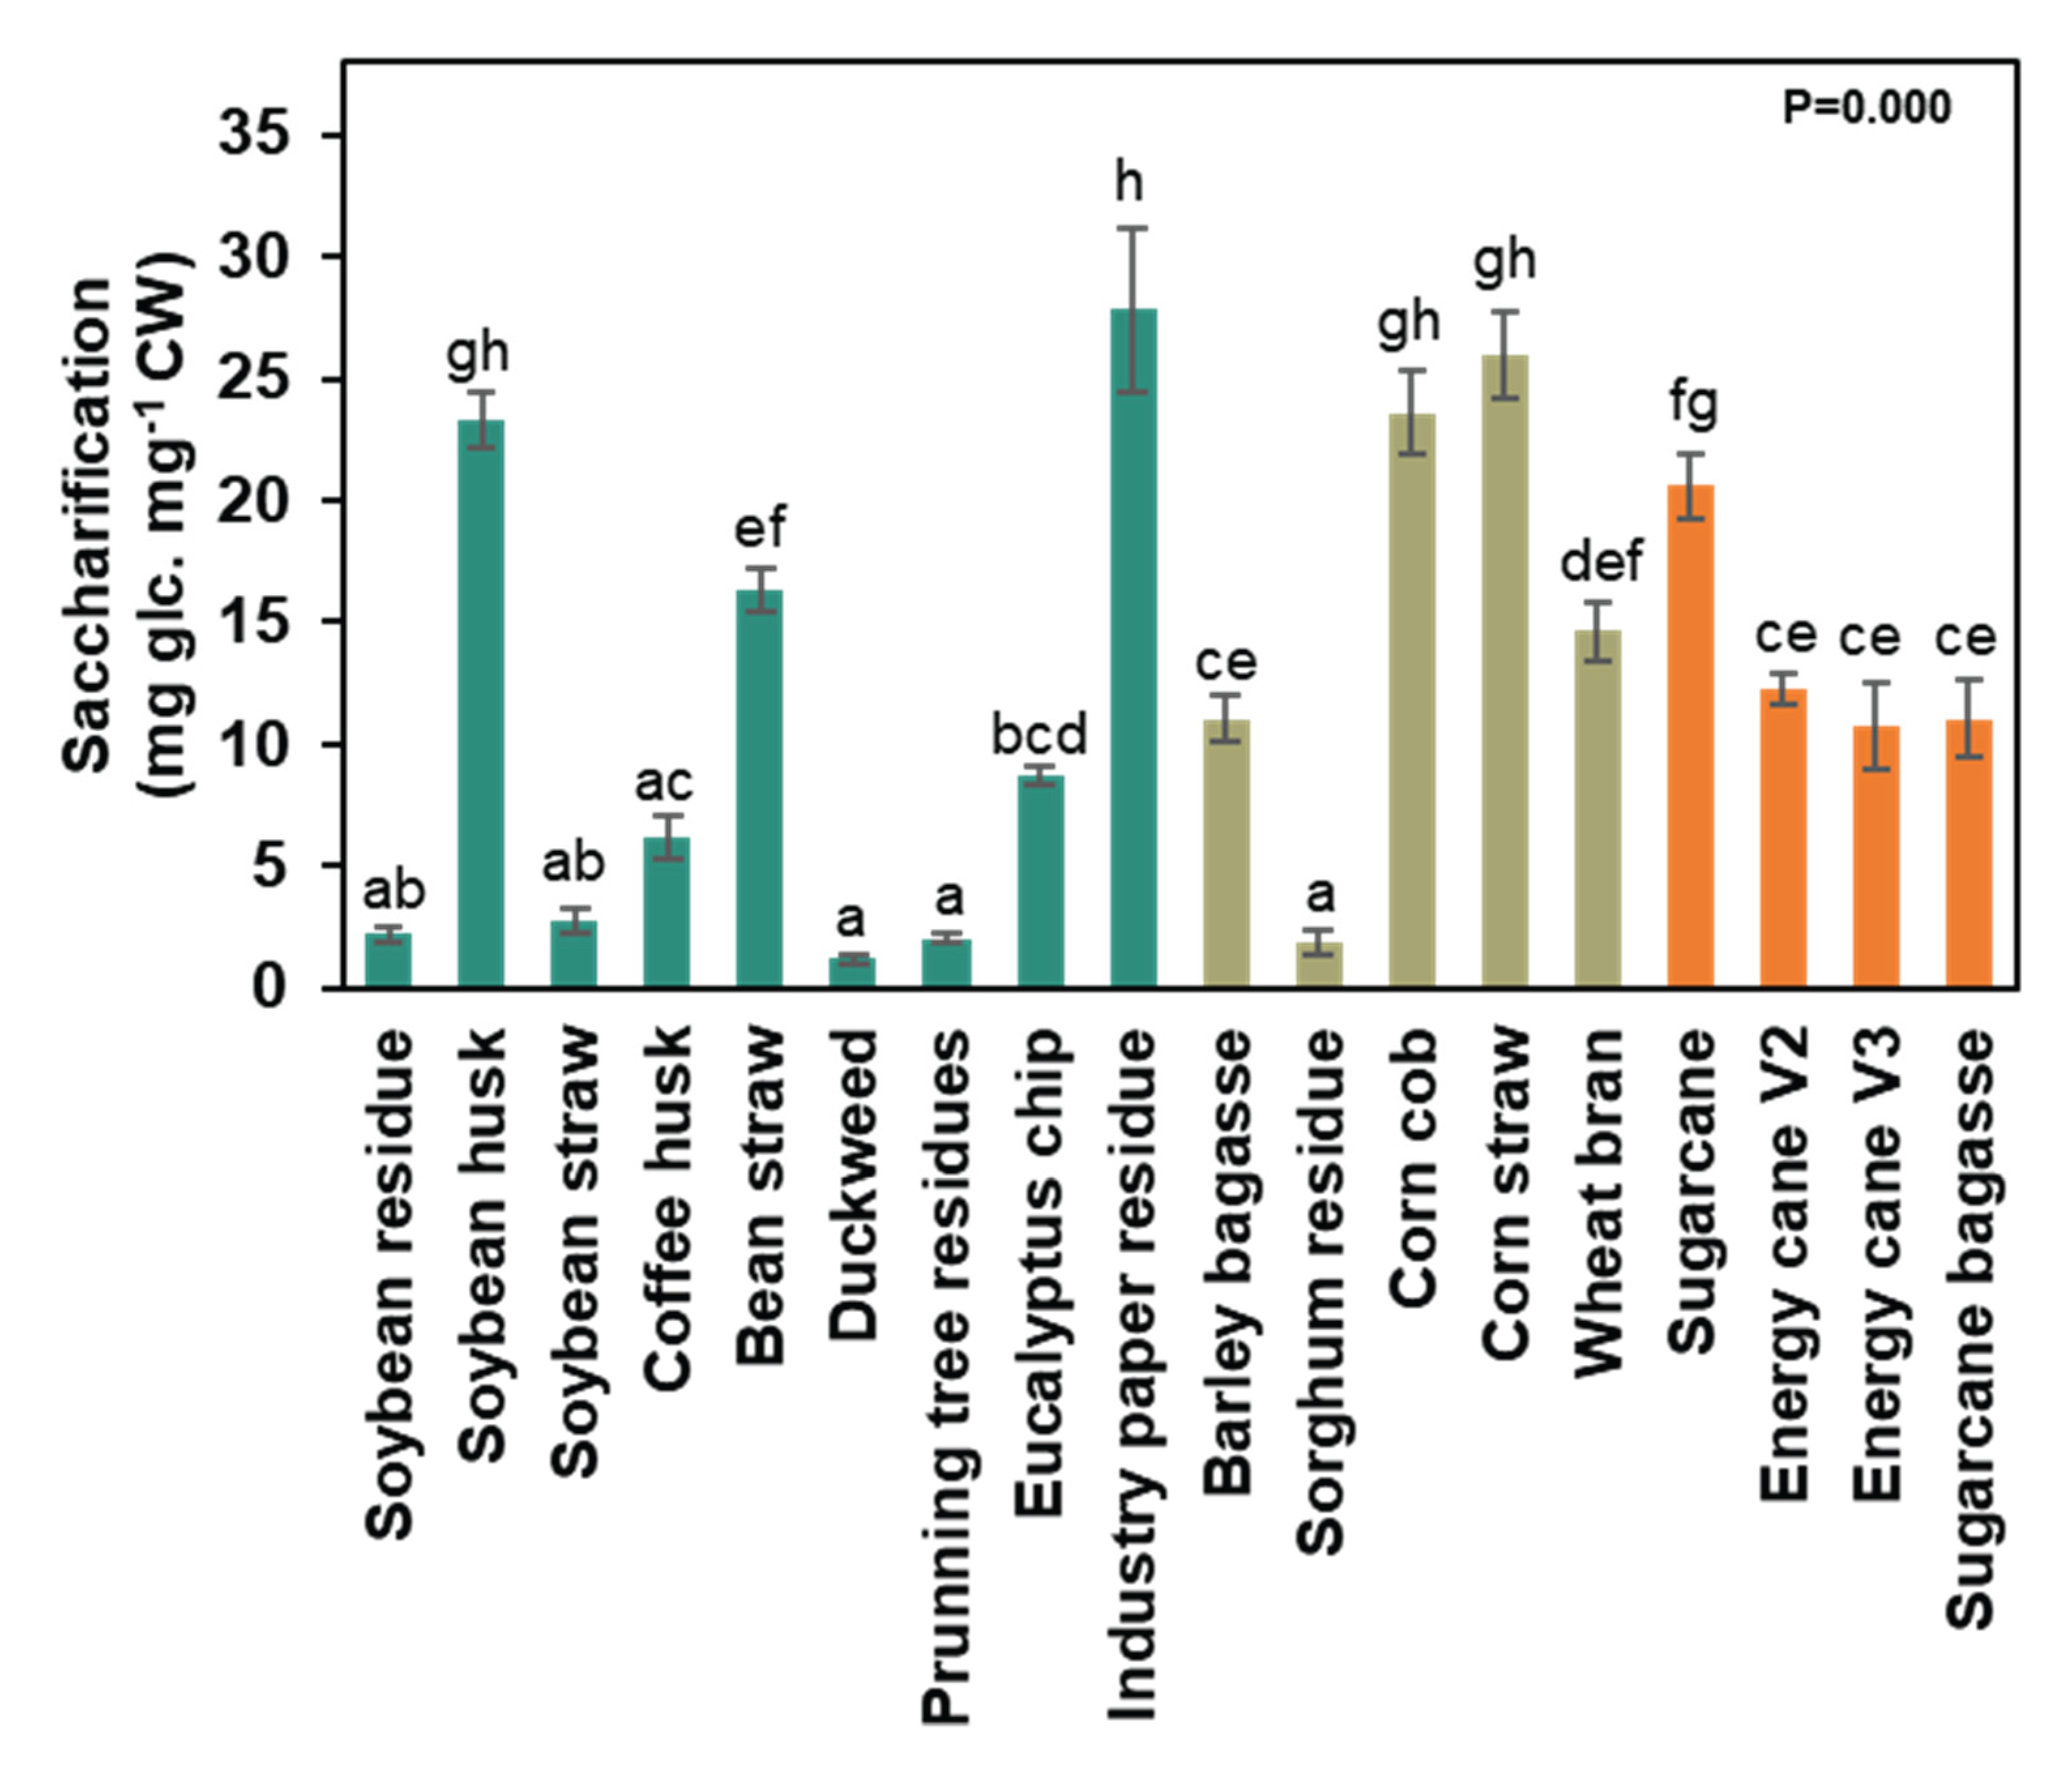
Figure 4.
Relative percentage of cell wall composition. A. Data summary from the non-grasses walls. B. Data summary from the grasses wall Type II. C. Cell wall composition of different agro-wastes. Data represented by percentage average ± std error (n=5). Pectins fraction represents the obtained from ammonium oxalate extraction, pectins+soluble hemicelluloses represent the obtained from the sodium chlorite extraction, hemicelluloses represent the obtained from the extraction of sodium hydroxide, and cellulose represents the residue from the fractionation process. A table with the values and statistics is in Supplementary Table S1.
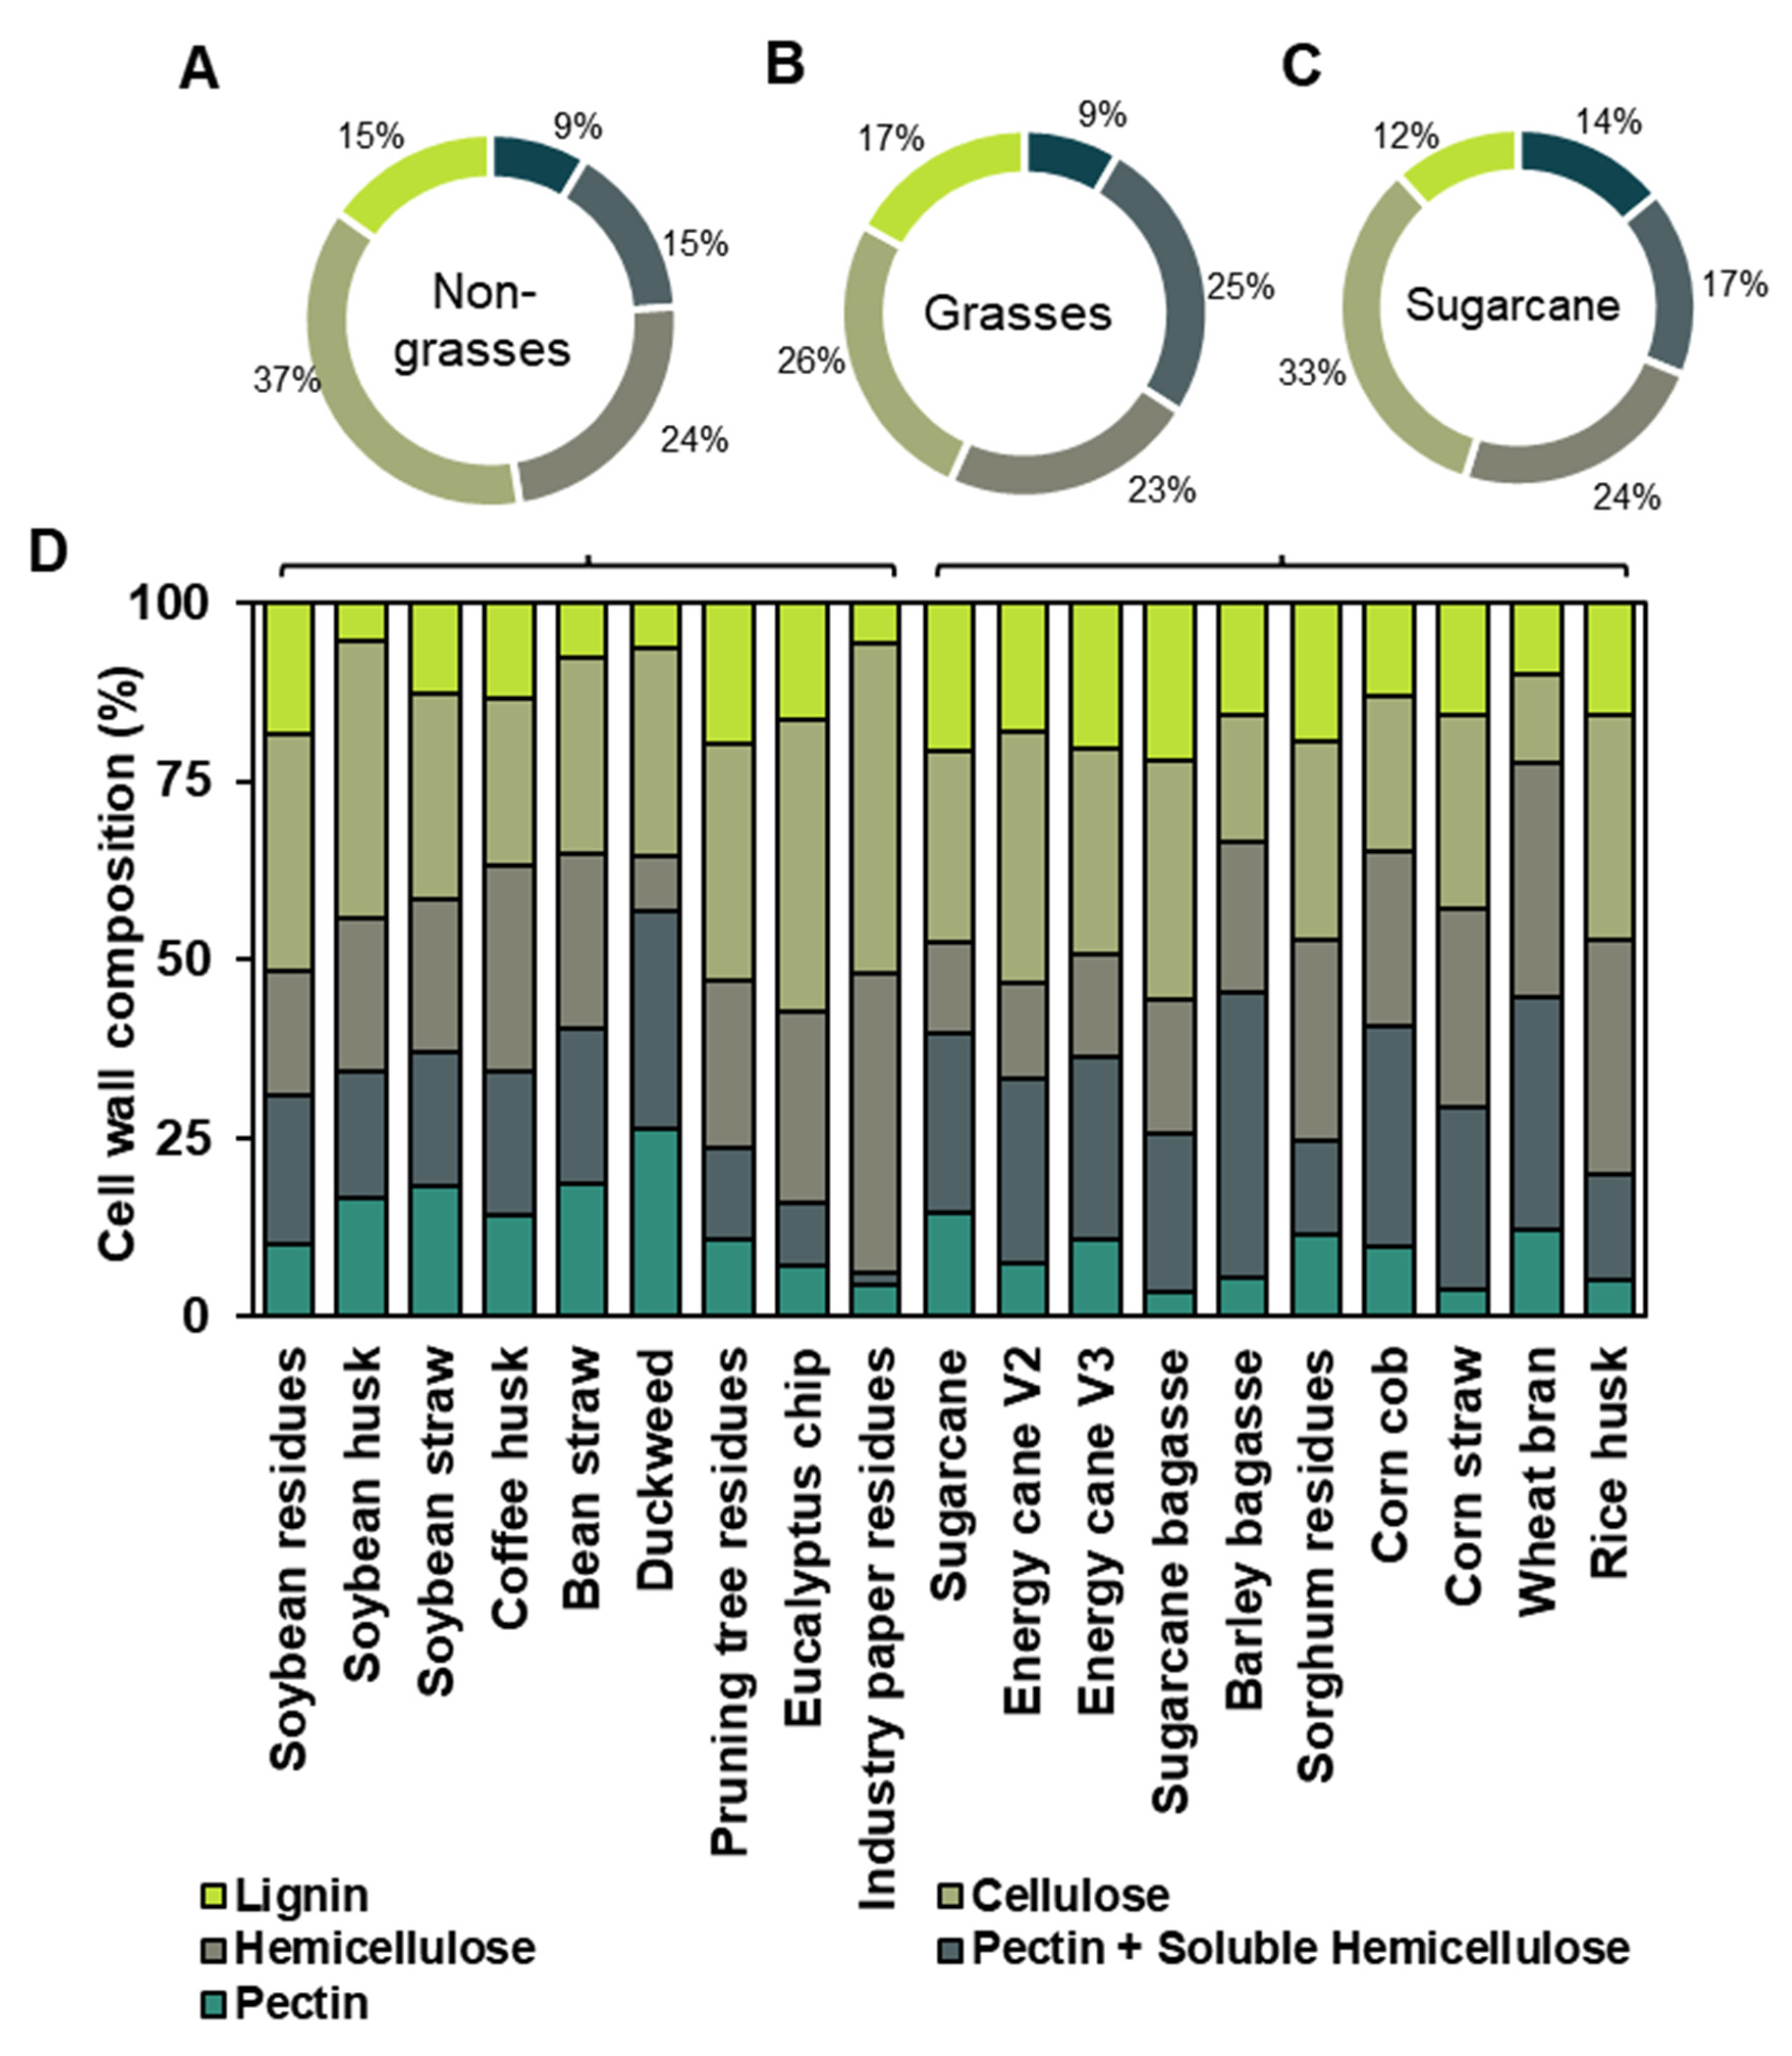
Figure 5.
Uronic acid levels in 19 distinct agro-wastes. Data represented by percentage average ± std error (n=5). Different letters are statistically significant among biomasses compared according to ANOVA-one way with Tukey’s post-hoc (p<0.05). Water-blue represents the data from Type I cell walls and brownish-green represents the data from Type II cell walls.
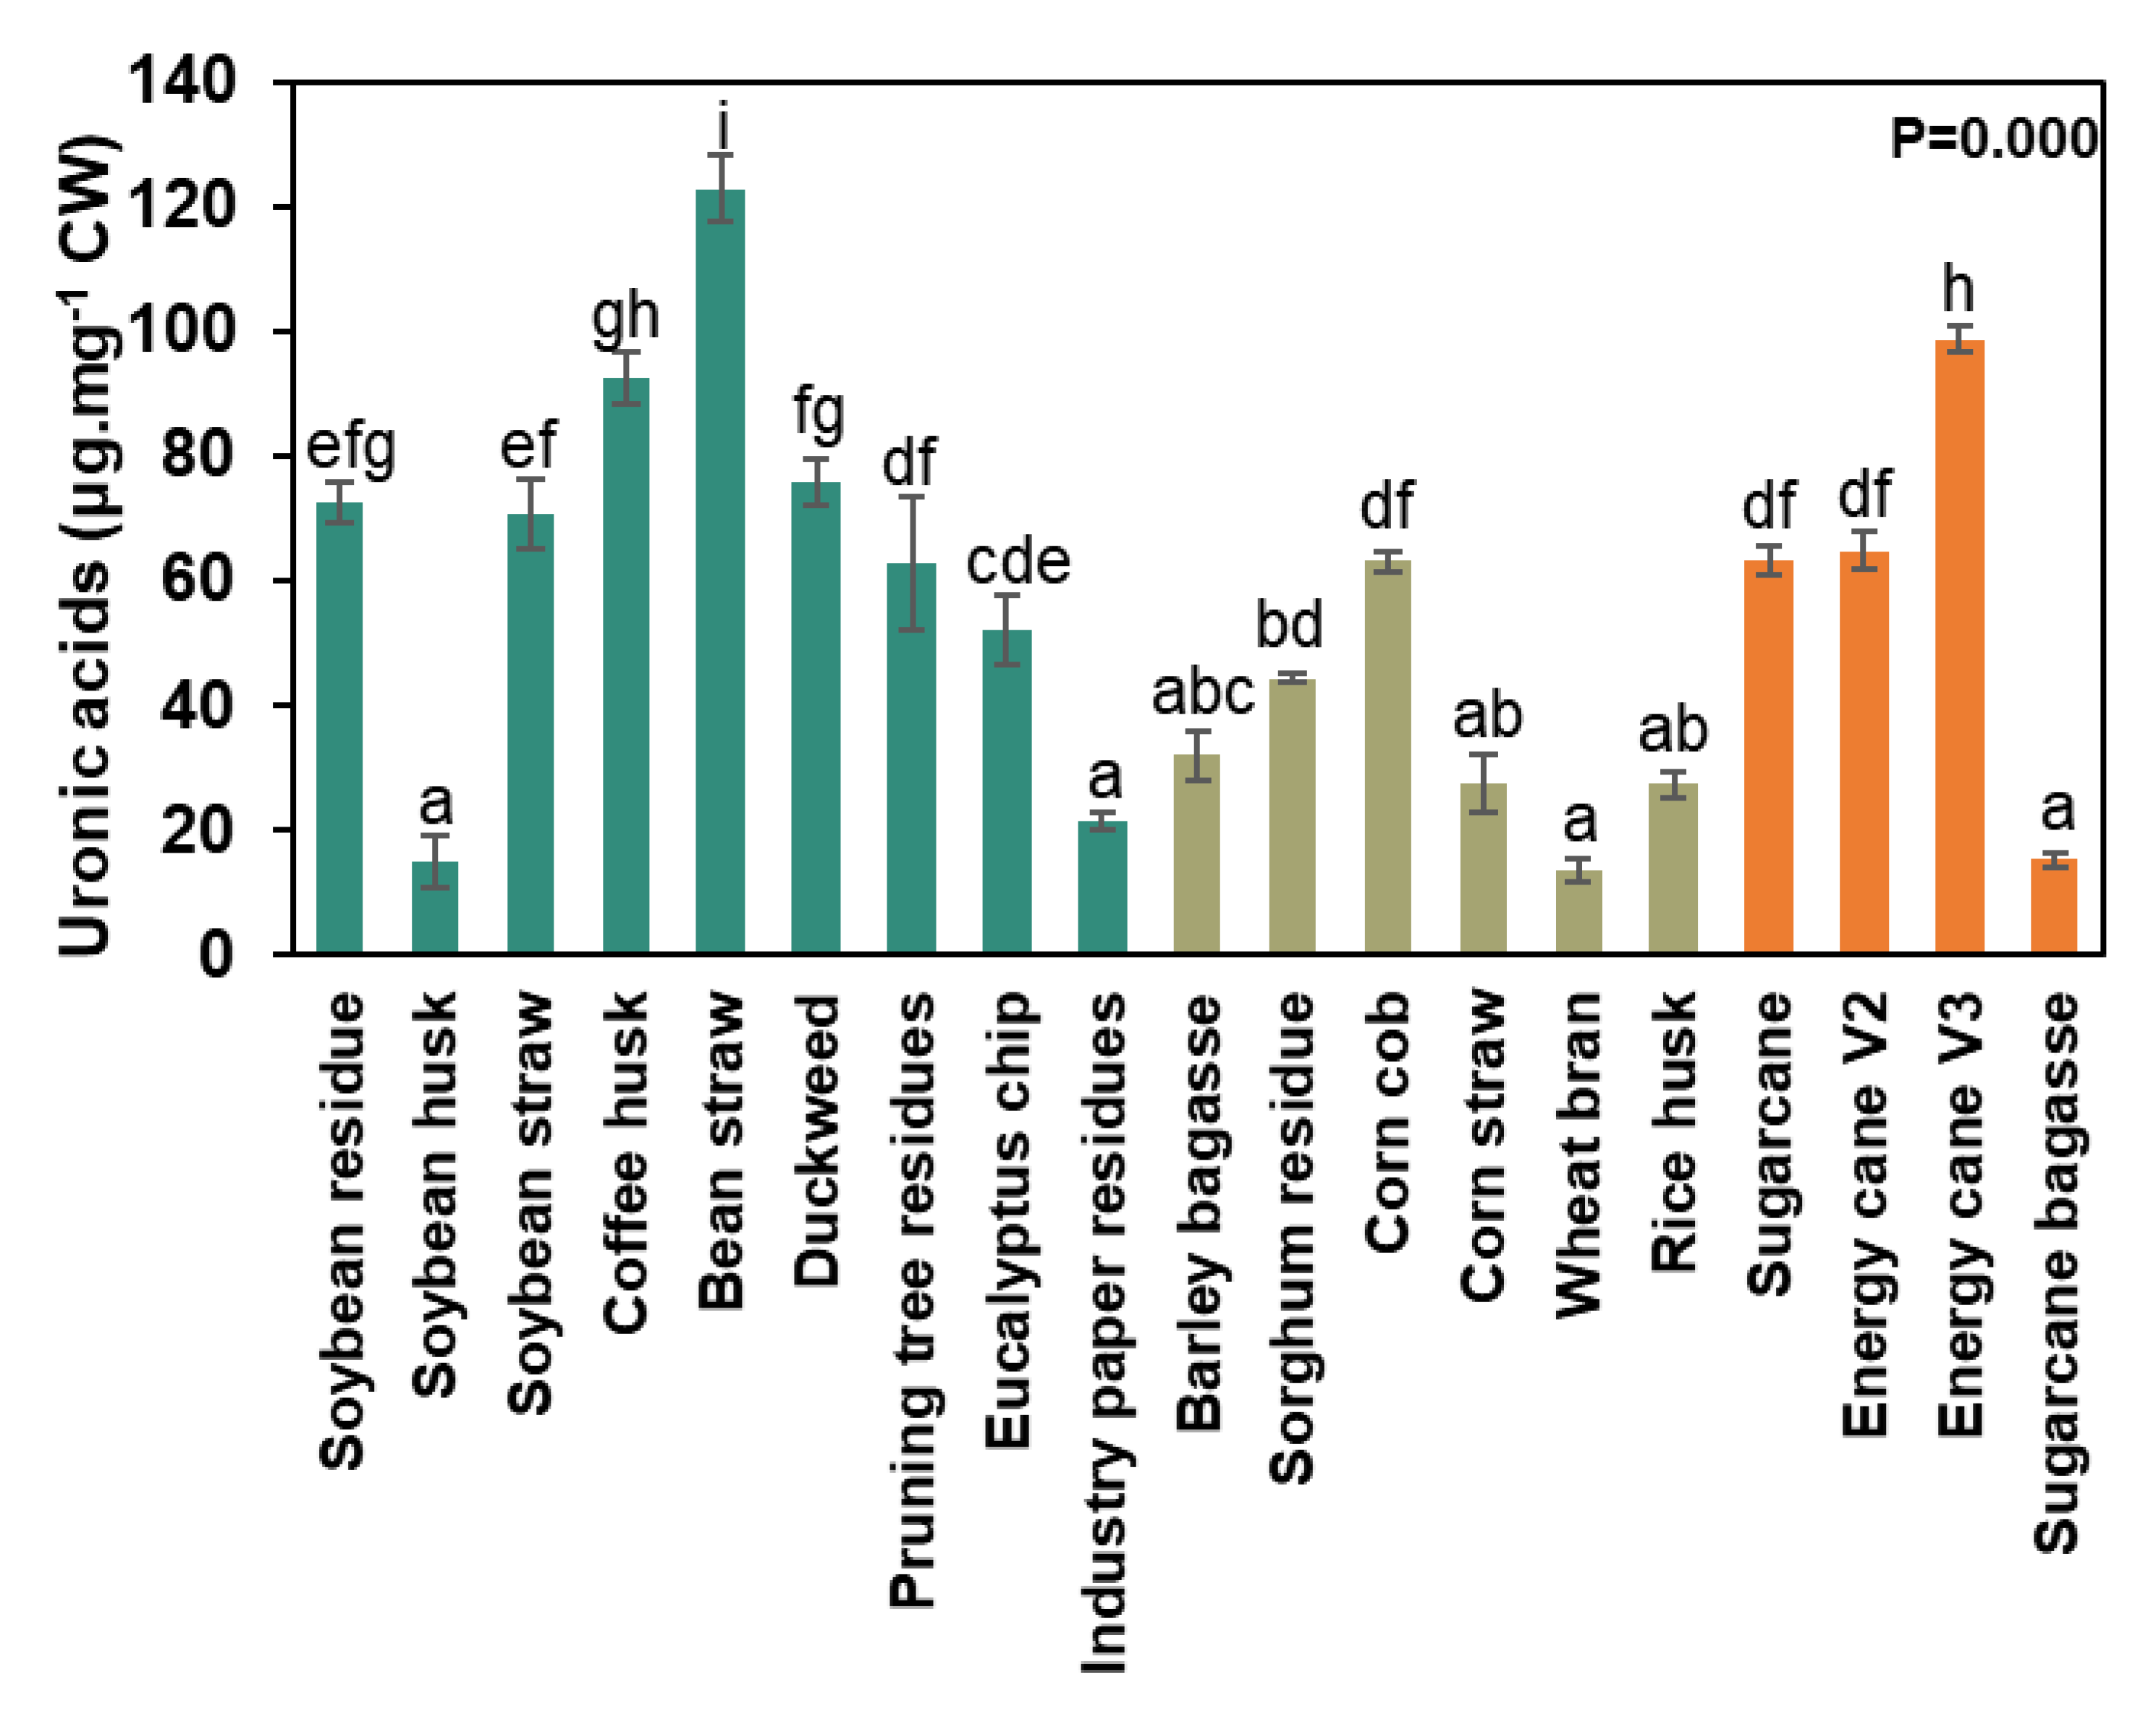
Figure 6.
Non-cellulosic monosaccharides composition from the intact cell wall. Data represented by percentage average ± std error (n=5). A table with the values (μg sugar. mg cell wall-1) and statistics are in Supplementary Table 1.
Figure 6.
Non-cellulosic monosaccharides composition from the intact cell wall. Data represented by percentage average ± std error (n=5). A table with the values (μg sugar. mg cell wall-1) and statistics are in Supplementary Table 1.
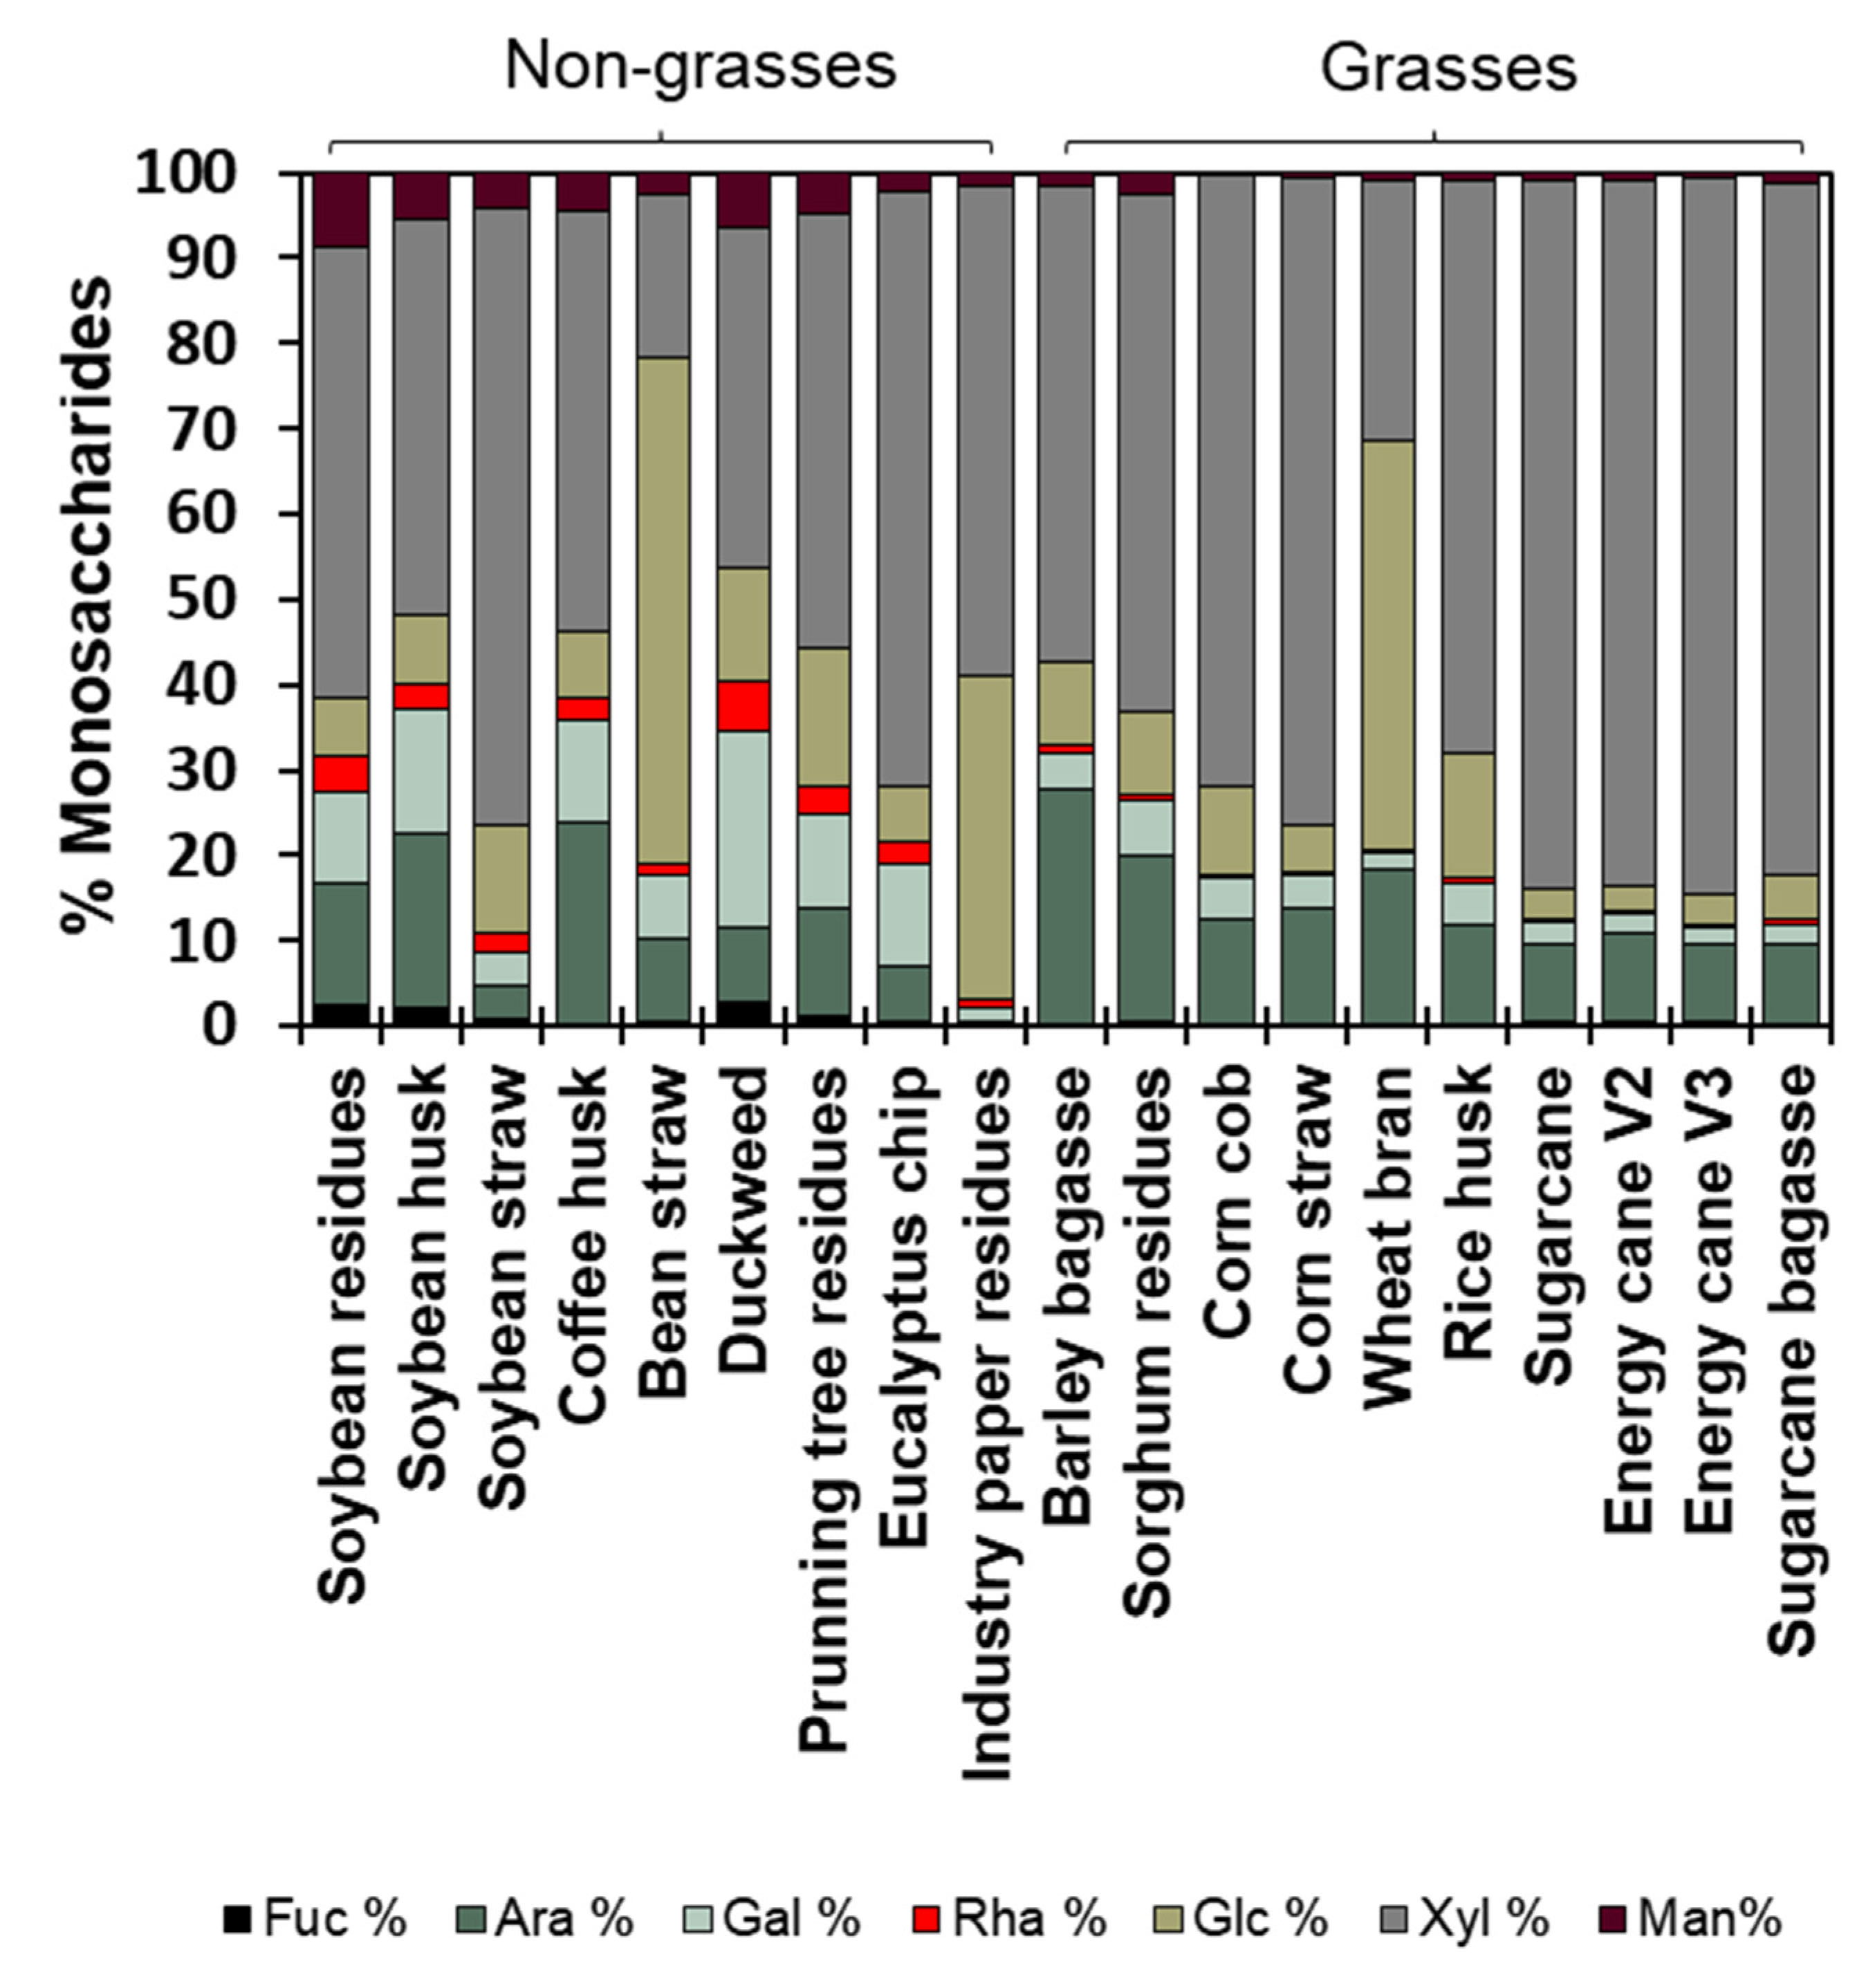
Figure 7.
Cell wall fractions monosaccharides. A. Monosaccharides composition from pectins (ammonium oxalate) fraction. B. Monosaccharides composition from pectins+soluble hemicelluloses (sodium chloride) fraction. C. Monosaccharides composition from hemicelluloses (sodium hydroxide) fraction. D. Monosaccharides composition strongly attached to cellulose (residue) fraction. Data represented by percentage average ± std error (n=5). A table with the absolute values (μg sugar.mg) and statistics are in Supplementary Table S2.
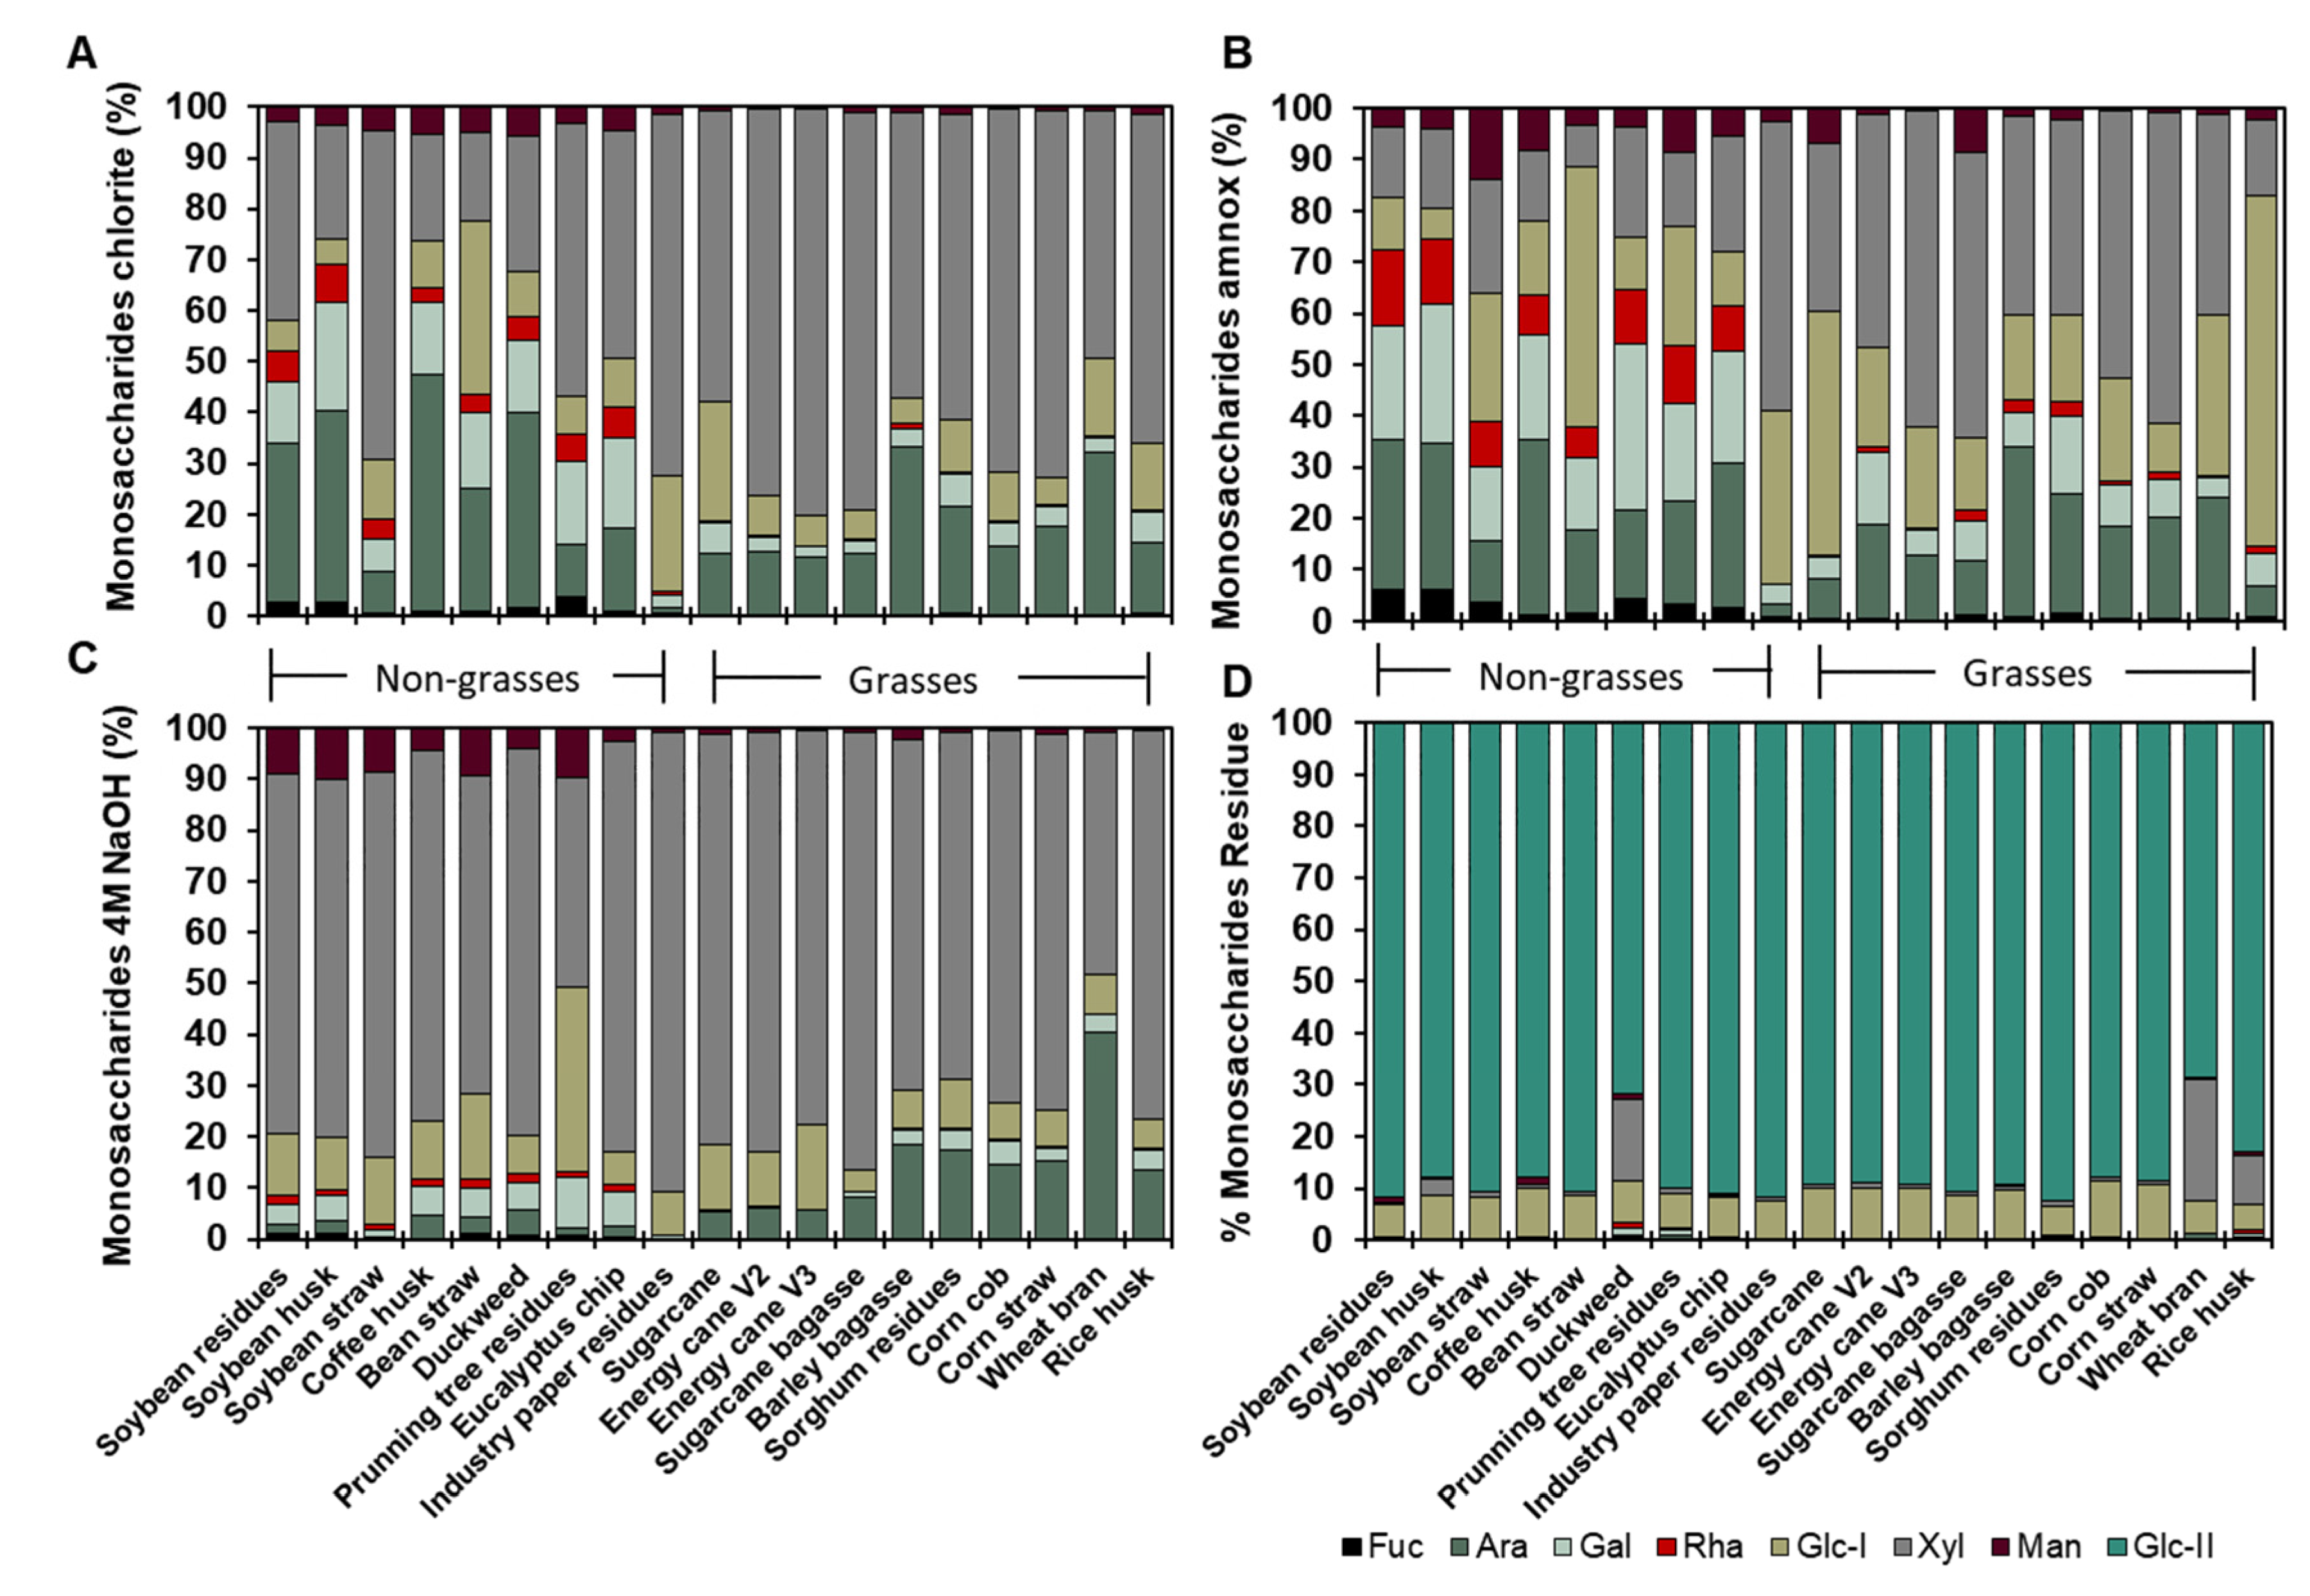
Figure 8.
Principal component analysis of different biomasses cell wall characterization. A. The centroid separation corresponds to the cell wall characterization of 19 biomasses in the plane by the first and second main components (PC1 and PC2). Percentage values in parenthesis show the proportion of the variance explained by each axis. B. Plot of PC1 and PC2 loading vectors, describing the relationship between the variables of the cell wall compounds. The variables analyzed were lignin, saccharification, percentage, and monosaccharide composition of the cell walls (fucose, arabinose, galactose, glucose, xylose, and mannose) fractions (ammonium oxalate- AmnOX, sodium chlorite – Chlo, 4M NaOH – 4M, and residue -R), and uronic acids.
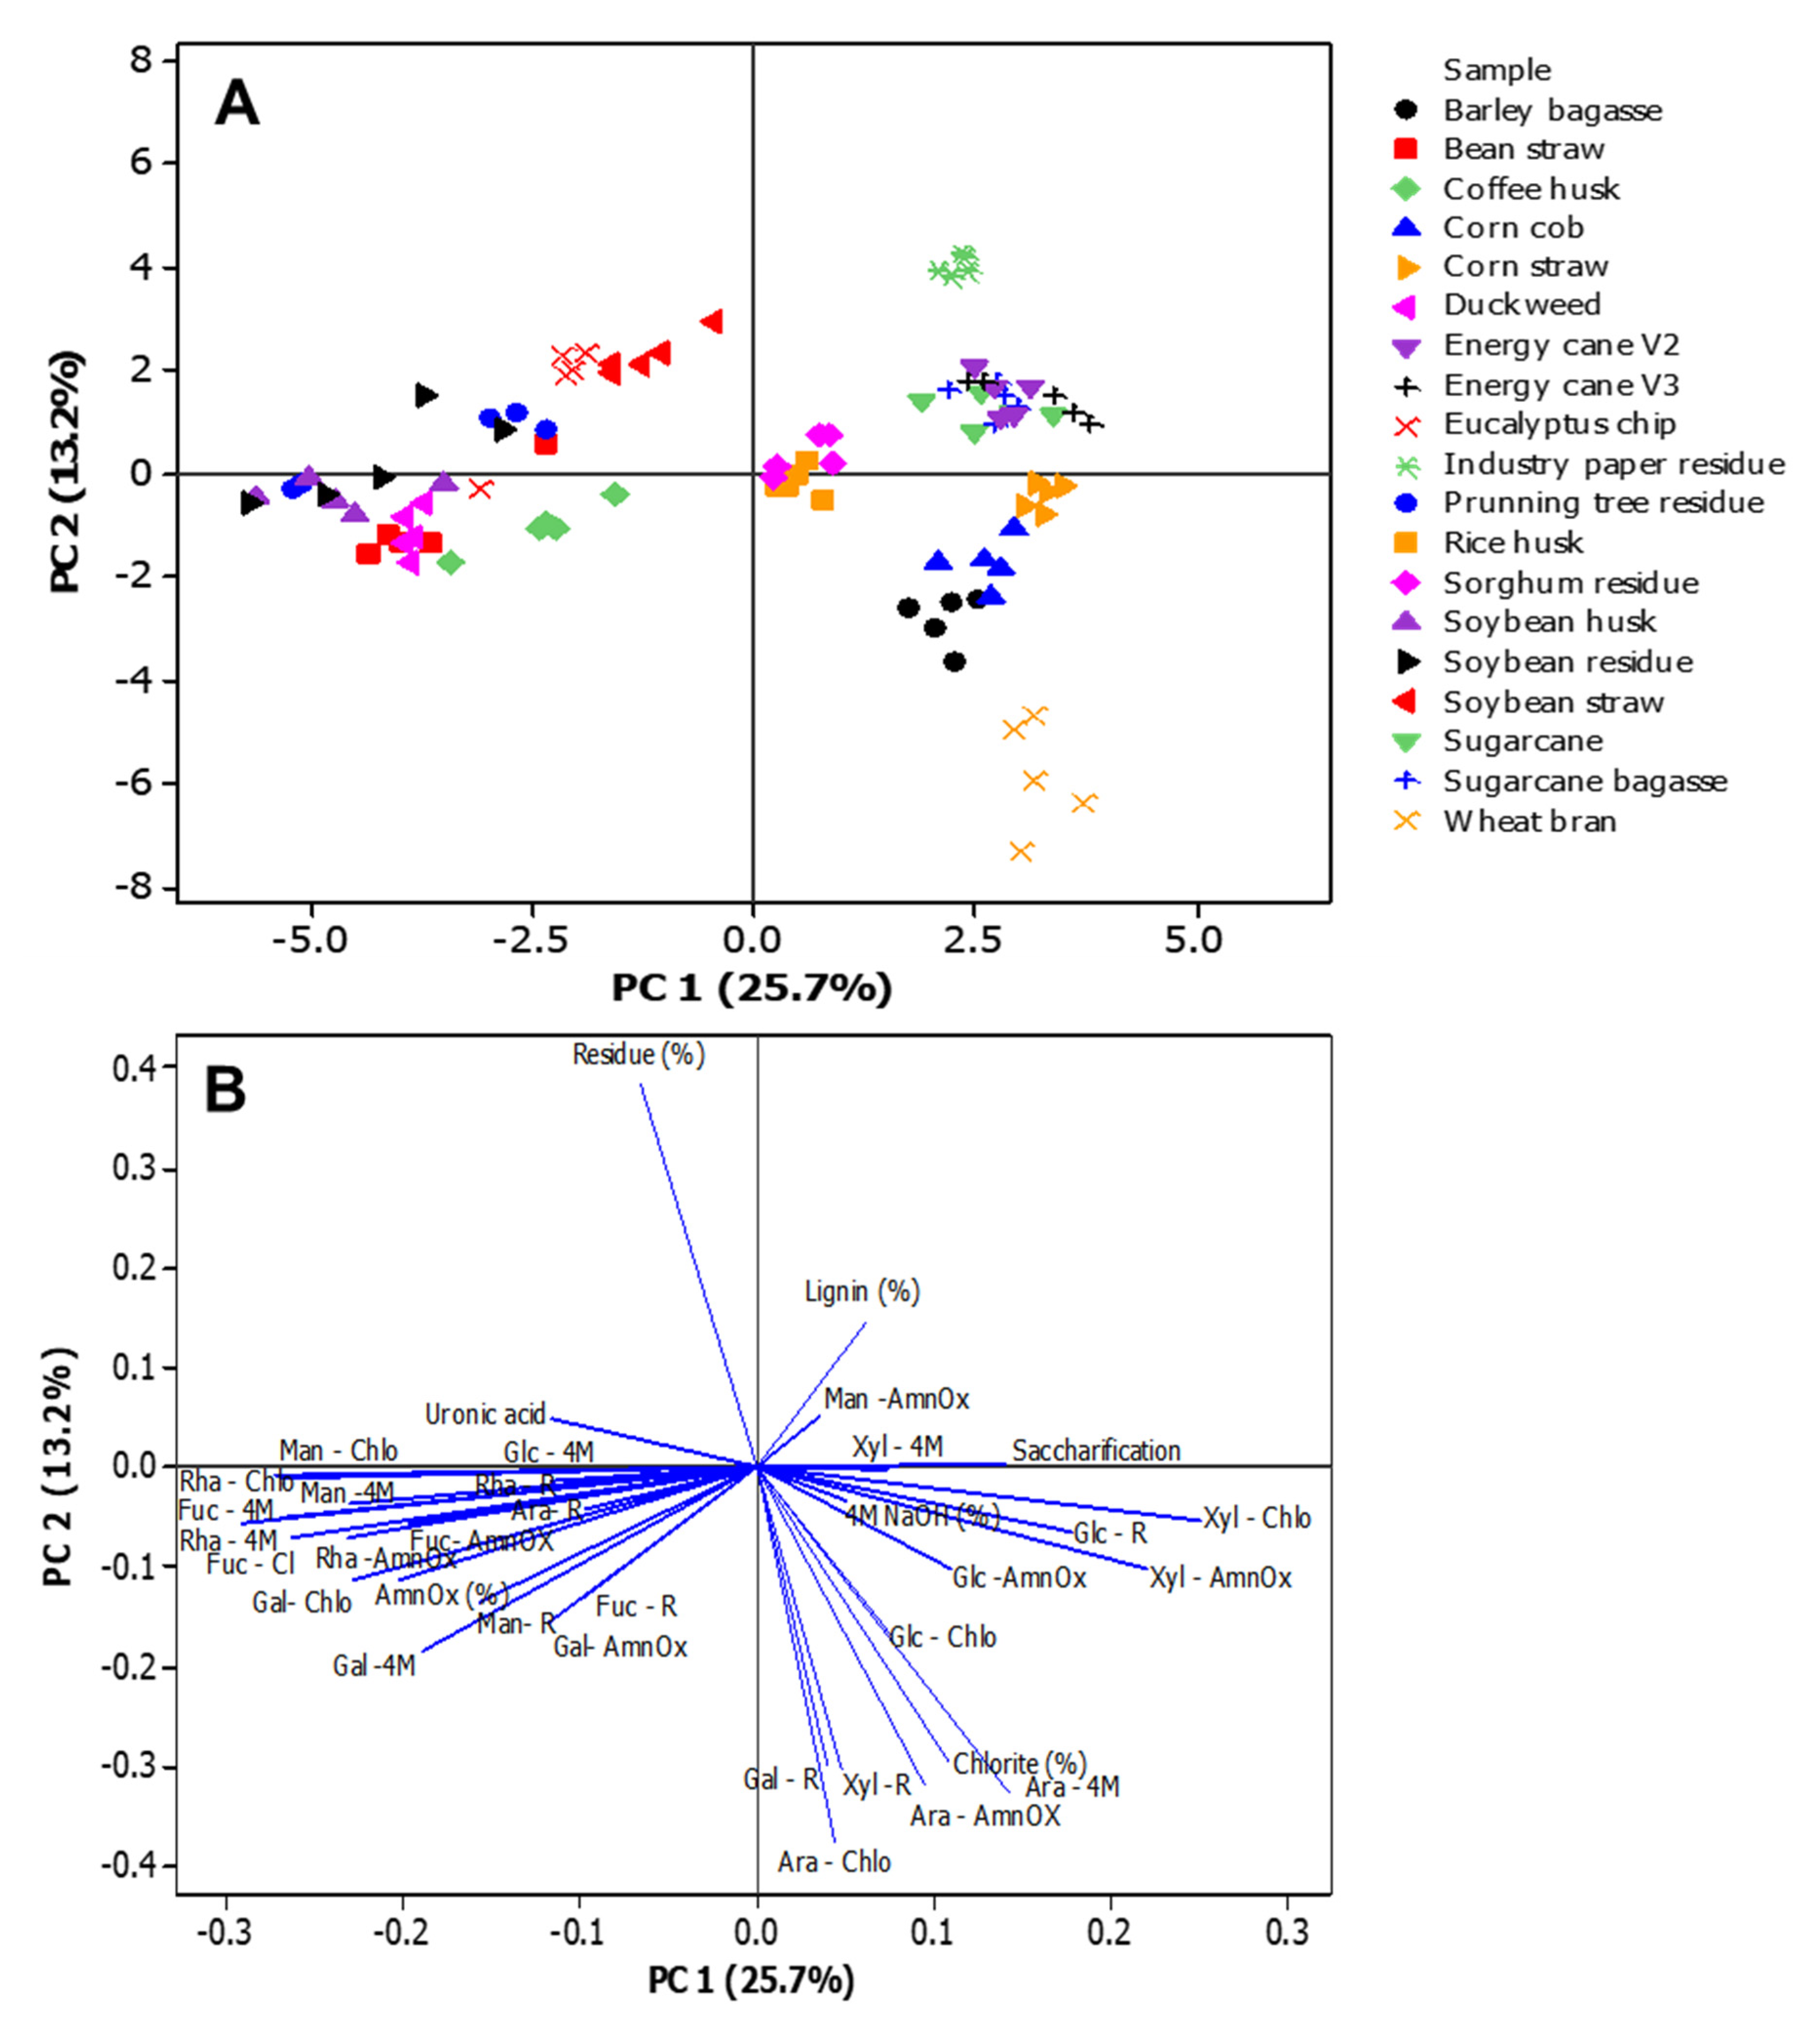

Table 1.
Selected agro-wastes that were characterized regarding their cell wall composition.
| Agro-waste | Species | Location |
|---|---|---|
| Soybean residues | Glycine max var IAC Foscarin 31 | Instituto Agrônomico de Campinas |
| Soybean husk | Glycine max | Ribeirão Preto-SP |
| Soybean straw | Glycine max | Maringá, PR |
| Coffee husk | Coffea sp. | Ribeirão Preto-SP |
| Bean straw | Phaseolus vulgaris | Ribeirão Preto-SP |
| Duckweed | Lemna minor 8627 | Rutgers Duckweed Stock Cooperative |
| Prunning tree residues | - | University of São Paulo |
| Eucalyptus chip | Eucalyptus sp. | Suzano papel e celulose |
| Industry paper residues | - | Suzano papel e celulose |
| Barley bagasse | Hordeum vulgare | Brewery Colorado, Ribeirão Preto -SP |
| Sorghum residues | Sorghum bicolor | Embrapa |
| Corn cob | Zea mays | Ribeirão Preto-SP |
| Corn straw | Zea mays | Ribeirão Preto-SP |
| Wheat bran | Triticum sp. | Ribeirão Preto-SP |
| Rice husk | Oryza sativa | Ribeirão Preto-SP |
| Sugarcane | Saccharum sp 80-3280 | Piracicaba- SP |
| Energy cane V2 | Saccharum ssp. | Piracicaba- SP |
| Energy cane V3 | Saccharum ssp. | Piracicaba- SP |
| Sugarcane bagasse | Saccharum spp. | Guarani - São Paulo-SP |
Table 2.
Elemental composition and high heating value (HHV) of different agro-industrial wastes. Data represented by average ± std error (n=3). Different letters are statistically significant among biomasses compared according to ANOVA-one way with Tukey’s post-hoc (p<0.05). Industry paper residue was not evaluated despite the composition of the residue being mainly cellulose.
 |
Disclaimer/Publisher’s Note: The statements, opinions and data contained in all publications are solely those of the individual author(s) and contributor(s) and not of MDPI and/or the editor(s). MDPI and/or the editor(s) disclaim responsibility for any injury to people or property resulting from any ideas, methods, instructions or products referred to in the content. |
© 2025 by the authors. Licensee MDPI, Basel, Switzerland. This article is an open access article distributed under the terms and conditions of the Creative Commons Attribution (CC BY) license (http://creativecommons.org/licenses/by/4.0/).
Copyright: This open access article is published under a Creative Commons CC BY 4.0 license, which permit the free download, distribution, and reuse, provided that the author and preprint are cited in any reuse.


