Submitted:
21 May 2025
Posted:
22 May 2025
You are already at the latest version
Abstract
A systematic understanding of spatiotemporal changes in fractional vegetation cover (FVC) of the Xinjiang grassland and its drivers serve as a scientific reference for regional ecological restoration and sustainable development. Based on the MODIS EVI data from 2000 to 2023, this study estimated Xinjiang grassland FVC by using the dimidiate pixel model, analyzed its spatiotemporal dynamics with the Theil-Sen trend analysis, Mann-Kendall test and Hurst index method, and explored the driving factors by ridge regression and residual analysis. The results showed that: (1) From 2000 to 2020, Xinjiang grassland FVC experienced an upward trend on the whole, yet a significant decrease after 2020. Spatially, it was distributed as high in the northwest and low in the southeast, and decreasing from mountains to basins. (2) Precipitation and soil moisture affected FVC positively, with contributions of 18.6% and 38.3%, respectively; while air temperature and solar radiation affected negatively, with contributions of 22.9% and 20.2%, respectively. (3) Climate change and human activities contributed 57.2% and 42.8% respectively to Xinjiang grassland FVC with 60.8% of grassland FVC dominated by climate change and 39.2% by human activities. (4) While most grassland types in Xinjiang have FVCs driven by joint actions of climate change and human activities, climatic conditions were dominant drivers of FVC in temperate typical grasslands and temperate desert grasslands, whereas human activities had more influence on FVC in temperate meadow grasslands. This study quantified the dual driving mechanisms of climate change and human activities together with their respective contributions by analyzing the spatiotemporal evolution characteristics of Xinjiang grassland FVC, thus providing scientific support and guidance for optimizing the ecological barrier functions and regulating the vegetation cover in arid zones.
Keywords:
climate change
; fractional vegetation cover
; ridge regression
; Xinjiang grassland
; human activities
1. Introduction
Grasslands are widely distributed, occupying an area of more than 40% of the Earth’s land mass, making them one of the most important terrestrial ecosystems [1]. Grassland ecosystems play an extremely vital role in the global carbon cycle by providing humans with services including net primary productivity, soil and water conservation, carbon sinks and biodiversity maintenance [2]. Vegetation is an important component of grassland ecosystems and changes in its cover are a direct cause of environmental change. Fractional vegetation coverage (FVC) is defined as the percentage of the vertical projection area of the above-ground portion of vegetation in a given unit area to the total statistical area. It has been widely utilized in ecological environment assessment, soil erosion risk evaluation and drought monitoring [3]. Accurate tracking of the dynamic evolution in grassland FVC in a timely manner offers an significant scientific and theoretical reference for environmental quality assessment and ecological security.
Of contemporary earth observation techniques, remote sensing-based techniques have gradually evolved into a vital tool for monitoring the grassland dynamics across extensive regions [4]. Remote sensing techniques are utilized for long-term grassland change detection, providing not only rapid access to real-time and large-scale research results, but also a decision-making basis for grassland conservation and ecological restoration[5]. Normalize difference vegetation index (NDVI), a widely used remote sensing vegetation index, is employed to monitor the vegetation growth status, coverage and health condition. NDVI has become the primary approach to investigate the large-scale vegetation cover over long periods of time[6]. Despite its ability to reflect the vegetation growth in most areas, NDVI is not effective in eliminating the effects of soil background and atmospheric noise [7]. In contrast, the enhanced vegetation index (EVI), by utilizing the difference in aerosol sensitivity between blue and red light bands, can further reduce the effects of aerosols and soil background in conjunction with the principles of ‘atmospherically resistant vegetation index (SAVI)’ and ‘soil adjusted vegetation index (SCVI)’[8]. While overcoming the limitations of NDVI in terms of atmospheric noise and soil background disturbance, EVI can also characterize FVC more accurately than NDVI during the vegetation growth period [9].
Xinjiang, being a typical arid and semi-arid region in northwest China, represents one of the most climate-sensitive zones globally, with abundant grassland resources [10]. Due to the recent trends of global warming and frequent occurrence of extreme events, coupled with anthropogenic factors of overloaded grazing and land reclamation Xinjiang grasslands have been experiencing serious ecological challenges like desertification, posing significant threats to both ecological security and economic development of Xinjiang. Studies of vegetation cover in Xinjiang have gained wide attention in recent years. Among them, Liu et al.[11] investigated the spatiotemporal characteristics and drivers of FVC in 11 sub-ecosystems in Xinjiang from 1982 to 2013 by using GIMMS-NDVI3g; Li et al.[12] analyzed the spatiotemporal variation and determinants of FVC in different eco-regions in Xinjiang from 2000 to 2020 based on MOD13Q1 vegetation data; Liang et al.[13] examined the vegetation-climate relationships in Xinjiang through LAI. Existing studies of overall FVC in Xinjiang on a large scale mainly rely on vegetation index. However, the spatial distribution of vegetation in Xinjiang is characterized by significant heterogeneity, with rich vegetation resources and high FVC in Tianshan Mountains, Altay Mountains and Tacheng regions[14] making the limitations of NDVI unable to target the grasslands in high-cover regions of Xinjiang. Therefore, this study examined the spatiotemporal dynamics of grassland FVC and its drivers in Xinjiang by employing EVI combined with pixel binary method. Furthermore, given the limitations of conventional methods for analyzing the drivers of FVC including multiple regression analysis and partial correlation analysis, etc. in dealing with multicollinearity and high-dimensional data, especially considering the strong correlation between climatic variables, this paper quantified the contribution of each driver to the change in FVC [15] using ridge regression.
In conclusion, this study integrated Theil-Sen trend analysis, Mann-Kendall test and Hurst index to analyze the spatiotemporal dynamics with EVI data; meanwhile, ridge regression and residual analysis were applied to quantitatively assess the contributions of meteorological factors and human activities to FVC. By analyzing the spatiotemporal dynamics of FVC in Xinjiang from 2000 to 2023, this study aimed to investigate the driving mechanism of climatic and anthropogenic factors and to analyze the development trend of the forecasting period, providing critical theoretical and practical insights for evaluating the environmental quality of ecosystems and regulating ecological processes.
2. Overview of the Study Area
Xinjiang is located in the northwestern border of China, at the intersection of Central and East Asia (73°40′-96°23′E, 34°22′-49°10′N). The region has a complex topography with significant elevation differences, and the natural conditions form two typical mountain-basin systems starting from the Kunlun Mountains in the south and extending to the Tianshan Mountains and Altay Mountains in the north[16] (Figure 1a). The average altitude of the region is 2040 m. The unique hydrothermal conditions have created a special climate pattern[17]. Xinjiang has typical temperate continental climate characteristics, which are manifested by large temperature variability, abundant sunshine, and scarce annual precipitation (about 150 mm). The region is rich in grassland resources and possesses a vast grassland area, which is one of the most important pasture bases in China[18]. Xinjiang is endowed with abundant natural grassland resources. The types of natural grasslands in the region include Alpine Kobresia and Forb Meadow (AKFM), Alpine Grass and Sedge Steppe (AGSS), Temperate Grass and Forb Meadow (TGFM), Temperate Grass and Forb Meadow Steppe (TGFS), Temperate Bunchgrass Typical Steppe (TBTS), Temperate Dwarf Bunchgrass and Dwarf Semi-Shrub Desert Steppe (TDDS), Temperate Grass and Forb Halophytic Meadow (TGFHM), and Temperate Grass, Sedge, and Forb Swampy Meadow (TGSSM) [19].
3. Data Sources and Pre-Processing
The Enhanced Vegetation Index (EVI) data were derived from the MOD13Q1 dataset provided by the National Aeronautics and Space Administration (NASA)[20]. This dataset provides global EVI data with a spatial resolution of 250 m and a temporal resolution of 16 days. Based on the Google Earth Engine (GEE) platform, the raw EVI data were preprocessed by mask extraction (only the Xinjiang region was preserved), format conversion (to GEE-compatible TIFF format) and reprojection (WGS84 coordinate system), and the maximum value synthesis (MVC) method was used to synthesise the annual maximum EVI (EVImax) dataset of month-by-month EVI data for the years 2000-2023. EVI (EVImax) dataset from 2000 to 2023 using the MVC method.
Meteorological data including month-by-month precipitation, maximum and minimum temperatures, solar radiation and soil moisture data from 2000-2023 were obtained from the TerraClimate dataset[21]. TerraClimate provides global monthly-scale climate data with a spatial resolution of 4 km since 1958. Based on the GEE platform, the meteorological data were processed as follows: (1) the annual cumulative precipitation was calculated by summing up the monthly precipitation; (2) the monthly mean temperature was obtained by averaging the monthly maximum and minimum temperatures; and (3) the annual mean values of the monthly mean temperature, the solar radiation, and the soil moisture were calculated separately. The processed meteorological data were consistent with the EVI data in terms of temporal resolution (years) and projection system (WGS84) for subsequent driver analyses.
Grassland distribution data were obtained from the China Land Use/Cover Dataset (CNLUCC)[22] and the 1:100000 China Vegetation Atlas[19]. The CNLUCC dataset is generated by manual visual interpretation of Landsat images and provides national-scale multi-period land use/cover information. The China Vegetation Atlas systematically documents the spatial patterns of 11 vegetation type groups, 54 vegetation types and 796 communities/subcommunities in China. Based on ArcGIS, the grassland type layer was extracted from the atlas and reprojected to the WGS84 coordinate system to match with the EVI data to construct a spatial database of grassland types in Xinjiang.
The elevation data are derived from the Shuttle Radar Topography Mission (SRTM). The programme is jointly implemented by NASA and the United States Geological Survey (USGS) to acquire a global digital elevation model[23]. The dataset has a spatial resolution of 30 m and a vertical error of less than 16 m, providing high-precision basic data for terrain analysis.

Table 1.
The dataset used in this study.
| Date | Product | Spatial Resolution |
Temporal Resolution |
Period | Source |
| EVI | MODIS EVI | 250 m | 16 days | 2000-2023 | https://doi.org/10.5067/MODIS/MOD13Q1.061 |
| Climatic factors | Precipitation Temperature Solar radiation Soil moisture |
4 km | Monthly | 2000-2023 | https://www.climatologylab.org/terraclimate.html |
| Grassland distribution | CNLUCC | 1 km | / | 2020 | http://www.resdc.cn/DOI |
| Grassland species | Vegetation Atlas of China | 10 km | / | / | https://www.plantplus.cn/cn |
| Dem | SRTM | 30 m | / | 2024 | https://srtm.csi.cgiar.org/ |
4. Research Methodology
4.1. Maximum Value Synthesis Method
Maximum value compositing (MVC) is a widely used method in remote sensing for processing time series vegetation indices such as EVI and NDVI. By selecting the maximum value of vegetation indices within a given time window, MVC effectively reduces the effects of atmospheric disturbances, cloud cover, and changes in observation angles, thus improving the quality of time-series data and reflecting the dynamics of vegetation growth[24,25]. Its formula is as follows:
In the formula: MVC(x,y) denotes the maximum EVI value of image element (x,y) during the synthesis period; EVIn(x,y) denotes the EVI value at the nth time point; n is the number of observations within the time series.
4.2. Pixel Binary Model
The pixel binary model is a method for estimating FVC based on spectral mixture analysis, assuming that each pixel is composed of pure vegetation and pure soil[26]. The formula is as follows:
In the formula: EVIsoil represents the EVI value of pure soil pixels (taking the 0.5% quantile of the cumulative distribution); EVIveg represents the EVI value of pure vegetation pixels (taking the 99.5% quantile of the cumulative distribution).
The FVC of grassland in Xinjiang was classified into five classes: very low (0 ≤ FVC ≤ 0.2, Ⅰ), low (0.2 < FVC ≤ 0.4, Ⅱ), medium (0.4 < FVC ≤ 0.6, Ⅲ), high (0.6 < FVC ≤ 0.8, Ⅳ), and very high (0.8 < FVC ≤ 1) [27].
4.3. Theil-Sen Median Trend Analysis with Mann-Kendall Test
Theil-Sen median trend analysis is a non-parametric statistical method to estimate the long-term trend of FVC by calculating the median slope (Q) of all two-by-two combinations in a time series. Compared with traditional least squares regression, this method is more robust to outliers and non-normal data distributions [28,29]. The formula is defined as:
In the formula: Q represents the median slope of the interannual change in FVC; xi andxj are time variables; yi and yj are the corresponding FVC observations at those time points. A positive Q>0 indicates an upward trend, while a negative Q<0 indicates a downward trend.
The Mann-Kendall test is a non-parametric statistical method for detecting the significance of trends in time series, which is robust to non-normality, non-linearity and seasonal variations, and is widely used in climatic, environmental and hydrological studies[30]。
Given the time series [x1,x2,…,xn], the calculation of the MK statistic S is as follows:
The sign function sgn(xj−xi) in the formula is defined as:
In the formula, xi and xj represent data points in the time series, and n is the length of the time series. The statistic S is used to determine the direction of the trend: if S>0 indicates the presence of an upward trend, and S<0 indicates the presence of a downward trend.
By standardizing S and performing a significance test, the statistic Z is calculated as follows:
Z follows a standard normal distribution and is used for significance testing.
In this study, the significance of FVC changes in Xinjiang grassland was classified into nine categories based on the Mann-Kendall test: highly significant increase, significant increase, marginally significant increase, non-significant increase, no change, highly significant decrease, significant decrease, marginally significant decrease, and non-significant decrease (Table 2).
4.4. Hurst Exponent
The Hurst exponent is widely used to predict future vegetation change trends [31]. The formula is as follows:
In the formula: FVC(n) represents the FVC values in the time series (n=1,2,…,N); FVC(p) represents the defined mean sequence, where p is any positive integer (p≥1).
The cumulative deviation series is calculated as follows:
In the formula: represents the cumulative deviation series, reflecting the mean deviation accumulated over time.
The calculation of the range sequence R(p) and the standard deviation sequence S(p) is as follows:
Finally, the Hurst index H was obtained by linear regression analysis.
In this study, the Hurst index was used to classify the persistence of FVC changes in Xinjiang grasslands into four categories: antisustained increase, sustained increase, antisustained decrease, and sustained decrease (Table 3).
4.5. Partial Correlation Analysis
Partial correlation analysis is a method used to investigate the linear relationship between two variables while controlling for the effects of other potentially confounding variables. By eliminating these confounding effects, partial correlation analysis can reveal more accurate and independent relationships between variables. This method has been widely used to study the response of vegetation to the factors that influence it [32].
Firstly, the Pearson correlation coefficient between each pair of variables was calculated using the following formula:
In the formula: x1, x2,...,xn represent n variables. For all i,j∈[1,2,...,n],rxiyj represents the Pearson correlation coefficient between variables xi and xj.
Then, all Pearson correlation coefficients are put into an n × n correlation matrix R with the following structure:
Then, the inverse matrix R−1 of the correlation matrix R is calculated, denoted as Q. The elements of matrix Q are represented as qij. The partial correlation coefficient between xi and xj after controlling for the effects of the other n-2 variables is calculated as follows:
In the formula: qij is the element in the i-th row and j-th column of the inverse matrix Q, qii and qjj are the diagonal elements of Q, corresponding to the i-th and j-th rows, respectively.
4.6. Ridge Regression Analysis
Ridge regression is a regression method specifically designed to solve the problem of multicollinearity, and is particularly suitable for situations where the independent variables are highly correlated [33]. With ridge regression, we can quantify the relative contribution of each independent variable to the dependent variable. The formula is as follows:
In the formula: βis the vector of ridge regression coefficients, indicating the impact of each independent variable on the dependent variable; X is the independent variable matrix of size n×p, where n is the sample size and p is the number of independent variables; y is the dependent variable vector of size n×1; λ is the regularization parameter (ridge parameter), used to control the complexity of the regression model; I is the identity matrix of size p×p.
To quantify the relationship between grassland FVC and various meteorological factors using ridge regression, each independent variable is standardized using the following formula:
In the formula: Xn represents the standardized independent variable, Xmax and Xmin represent the maximum and minimum values of each independent variable, respectively.
Then, the dependent variable grassland FVC is included in the ridge regression model, with the formula as follows:
In the formula: Yn represents the standardized grassland FVC, xin represents the standardized influencing factors, ai represents the regression coefficient of the influencing factors.
In addition, residual analysis was used to estimate the effect of human activities on grassland FVC using the following equation:
In the formula: Yn represents the predicted value obtained from the ridge regression model, YFVC is the actual FVC value, res represents the residual value, which is used to quantify the impact of human activities on grassland FVC.
The relative contribution represents the proportion of the total contribution of each independent variable. The formula is as follows:
In the formula: Xi_trend represents the trend of each influencing factor, ai represents the regression coefficients of the influencing factors, Yn_trend represents the trend of the predicted value of FVC, Yθ_trend represents the trend of the actual value of FVC, and ηrci represents the relative contribution of the i-th independent variable to the dependent variable.
In addition, residual analysis is used to assess the impact of anthropogenic activities on vegetation[42], and in this paper, residual analysis was introduced into the ridge regression model with the following formula:
In the formula: res represents the residual value, which indicates the impact of human activities on FVC.
Then, this paper calculates the relative and absolute contributions of climate and human activities, using the following formulas:
In the formula: res_trend represents the trend of the residual values, while ηrCC and ηrHA represent the relative contributions of climate and human activities, respectively.
In the formula: ηaCC and ηaHA represent the absolute contributions of climate and human activities, respectively.
5. Results
5.1. Temporal Dynamics of FVC of Different Grassland Types in Xinjiang
The temporal changes of annual mean grassland FVC in Xinjiang were shown in Figure 2a. The average value of grassland FVC in Xinjiang from 2000 to 2023 was 0.274, showing a fluctuating downward trend, with an average annual decrease rate of 0.0006/a. Grassland FVC values were highest in 2002 at 0.29 and lowest in 2023 at 0.256. Between 2002-2009 and 2019-2023 the grassland FVC continued to decline. The interannual fluctuation of grassland FVC in Xinjiang generally showed an increasing trend, but the change trend was not obvious (Figure 2b). The largest fluctuation was in 2001-2002 with a fluctuation rate of 4.89%. the smallest fluctuation was in 2014-2015 with a fluctuation rate of 0.02%. From 2000 to 2023, there were 15 years in which the grassland FVC was less than the average FVC and 7 years in which the grassland FVC was greater than the average FVC (Figure 2c). The difference between grass FVC and mean FVC continued to increase during 2020-2023, reaching a maximum negative difference of -0.02 in 2023.
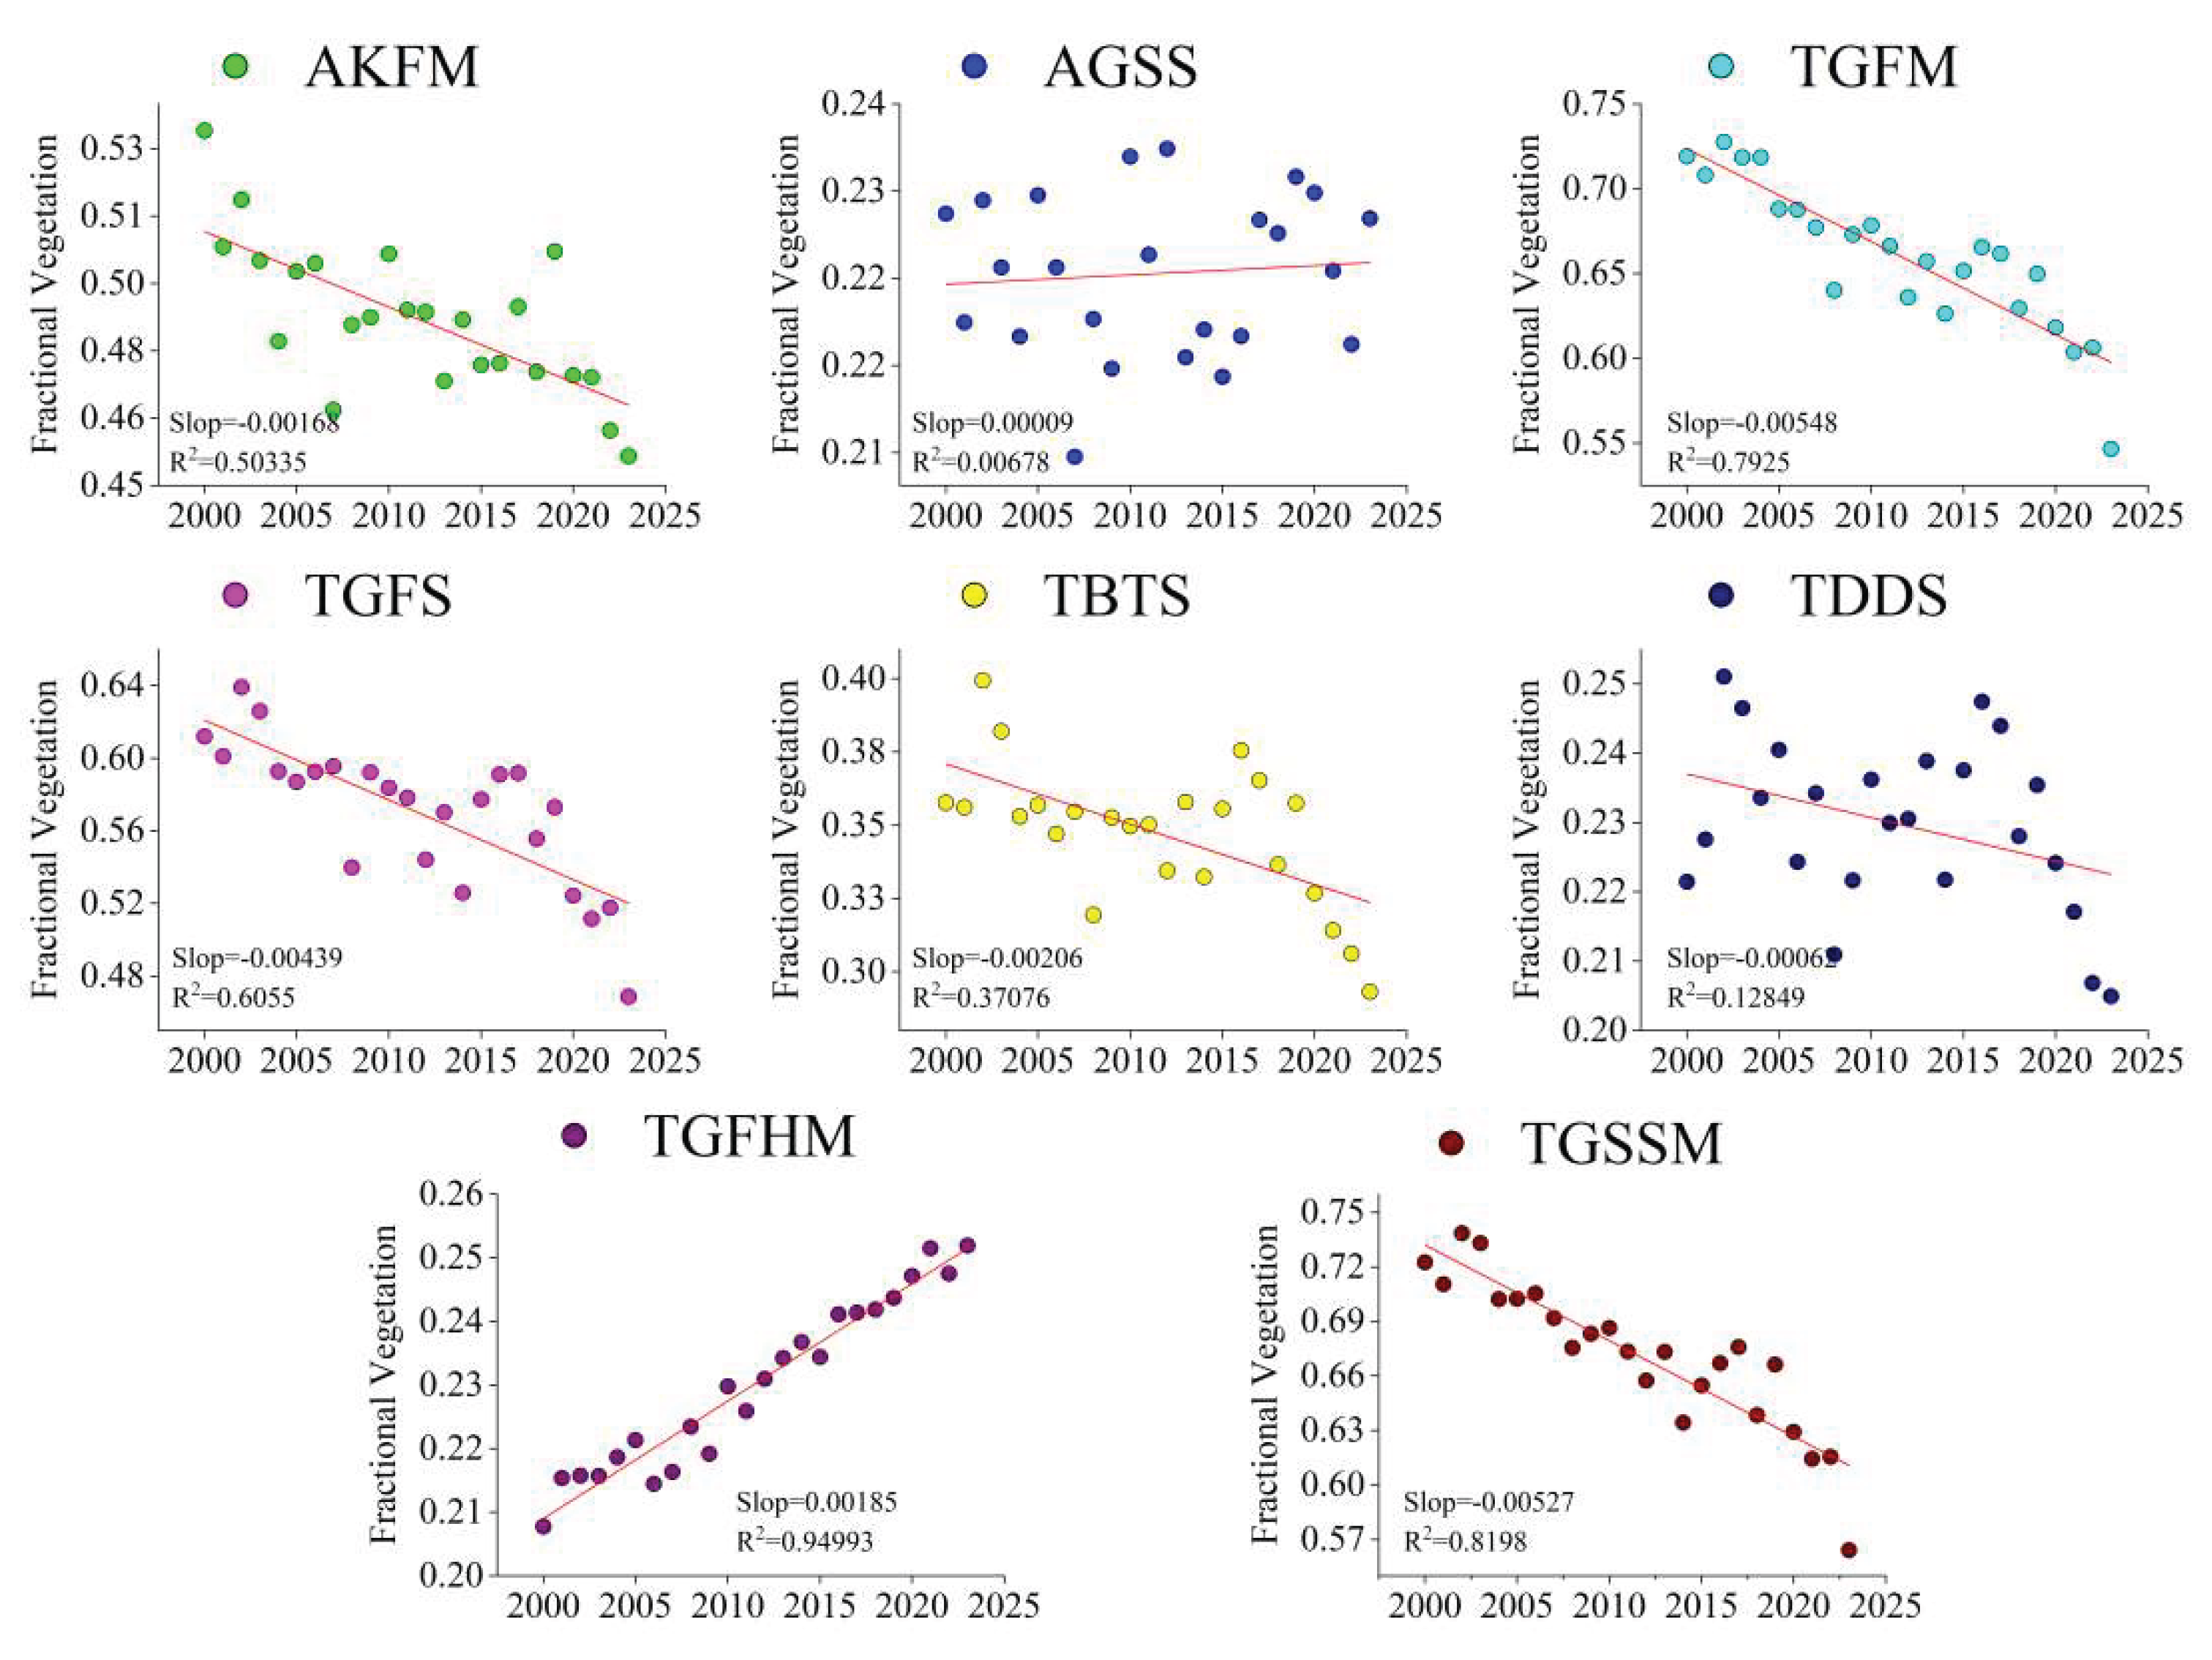
Figure 3 shows that the differences in FVC among the eight grassland types in Xinjiang are more obvious, and the multi-year average FVC of different grassland types, from high to low, are TGSSM (0.67), TGFM (0.66), TGFS (0.57), TBTS (0.35), AKFM (0.49), TDDS (0.23), TGFHM (0.23) and AGSS ( 0.22). During the period 2000-2023, AGSS and TGFHM FVC showed an increasing trend, while all other grassland types showed a decreasing trend in FVC. Among them, the FVC trends of TGFHM, TGFM and TGSSM were more pronounced, with TGFHM increasing at an average rate of 0.00185 per year and TGFM and TGSSM decreasing at average rates of 0.00168 and 0.00527 per year.
Figure 2.
(a) The interannual variation of grassland FVC in Xinjiang from 2000 to 2023. (b) The interannual fluctuation of grassland FVC in Xinjiang from 2000 to 2023. (c) The change of grassland FVC in Xinjiang compared to mean value.
Figure 2.
(a) The interannual variation of grassland FVC in Xinjiang from 2000 to 2023. (b) The interannual fluctuation of grassland FVC in Xinjiang from 2000 to 2023. (c) The change of grassland FVC in Xinjiang compared to mean value.
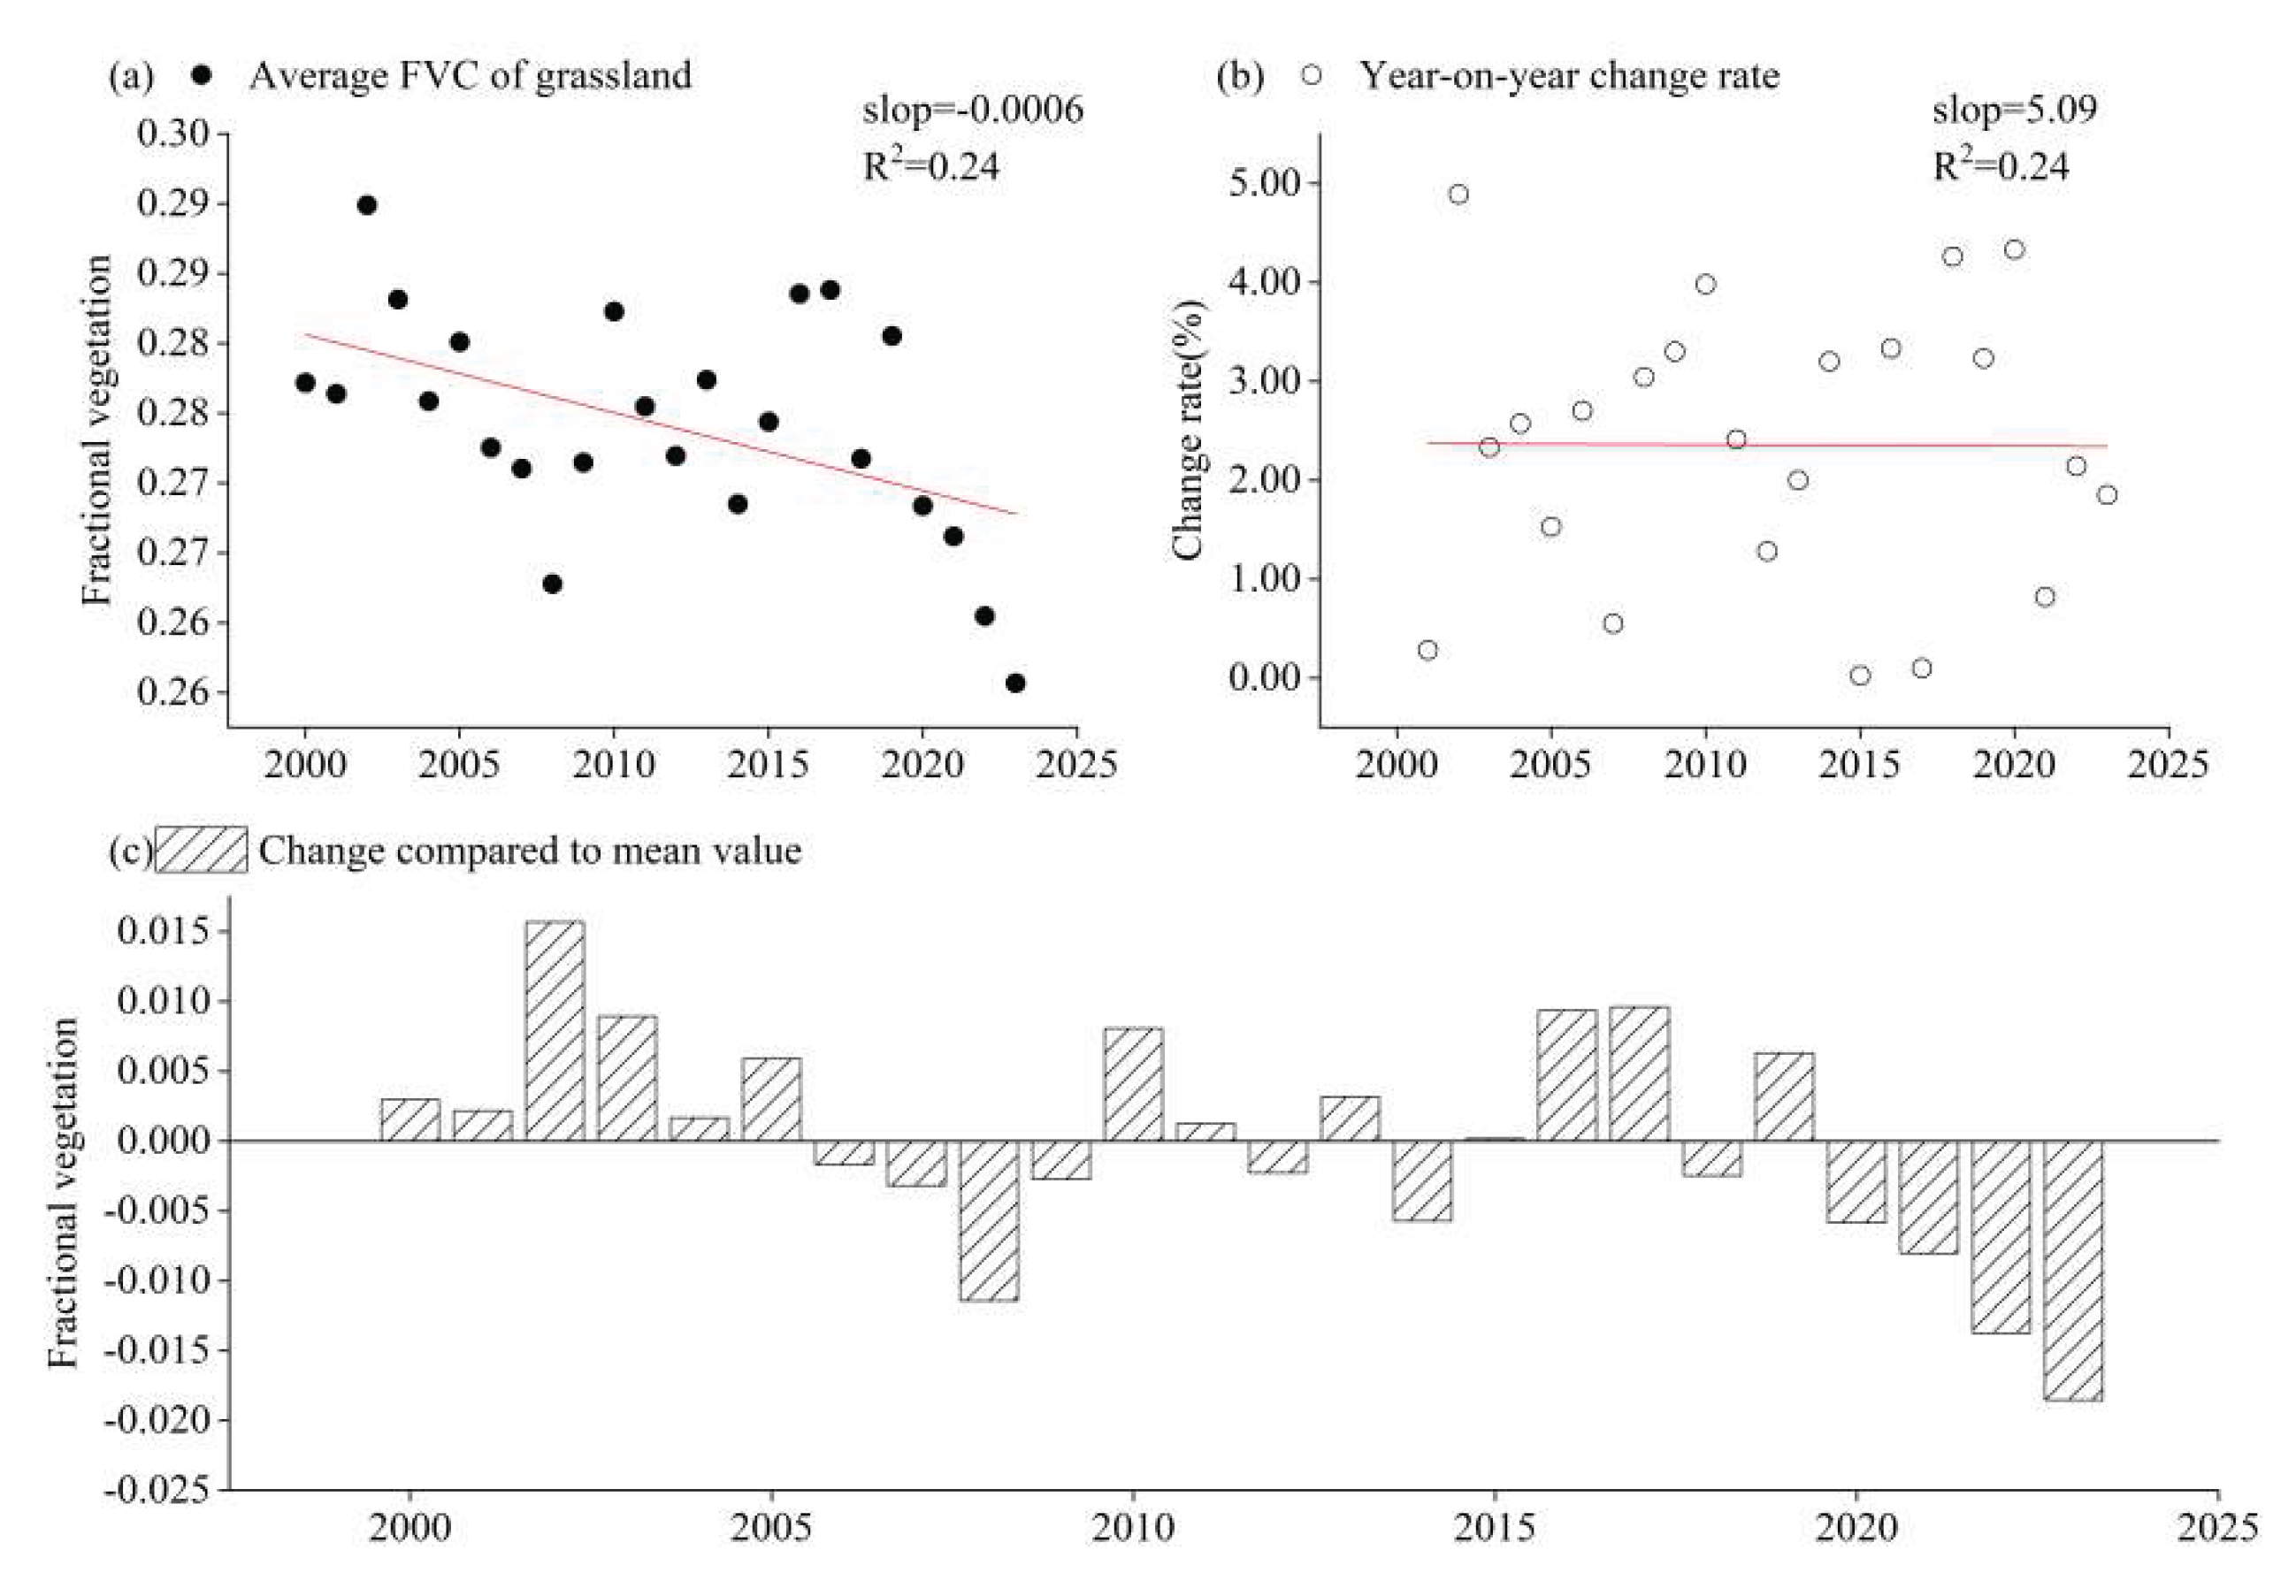
Figure 3.
The interannual variation of FVC in different grassland types from 2000 to 2023.
5.2. Spatial Pattern of Grassland FVC in Xinjiang
5.2.1. Spatial Distribution of Grassland FVC in Xinjiang
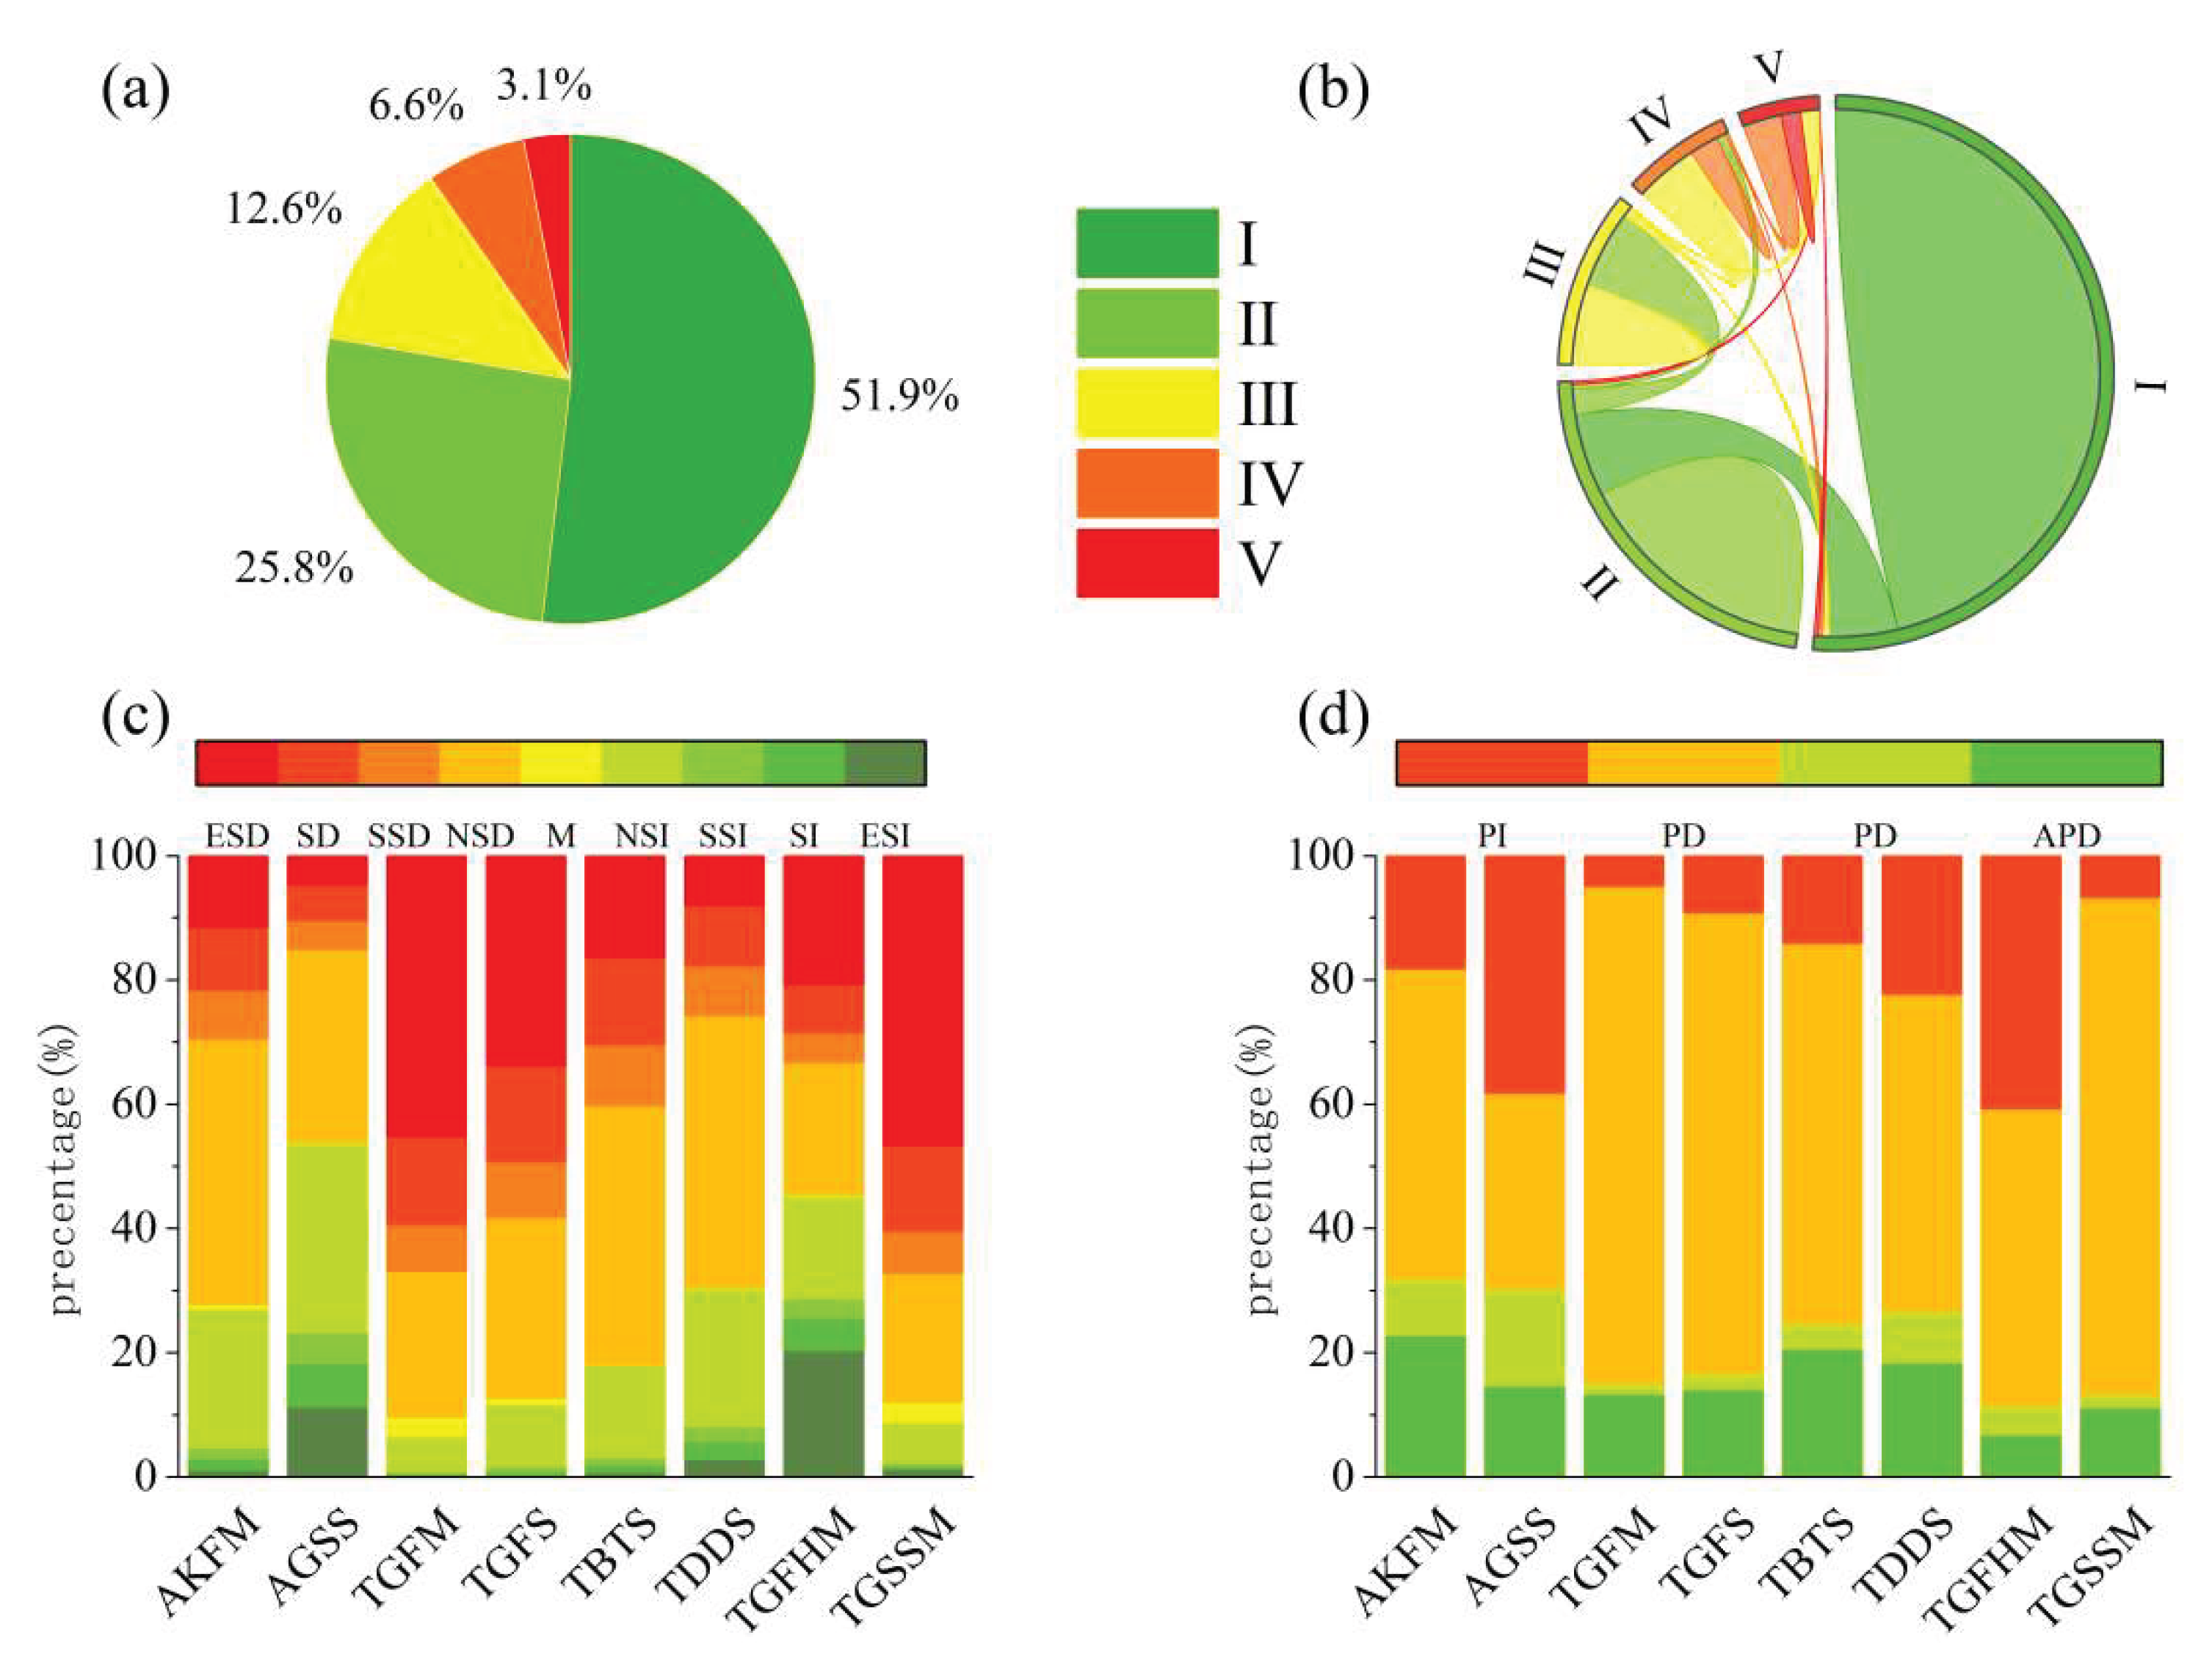
The spatial distribution of grassland FVC in Xinjiang from 2000 to 2023 showed significant heterogeneity (Figure 4a). The overall performance was a gradual decrease from the Yili River Valley, Tianshan Mountains, Altai Mountains and Kunlun Mountains to the Junggar Basin and Tarim Basin. The extremely low grassland FVC accounts for 51.9% of the total area, mainly distributed on the northern slope of the eastern Tianshan Mountains and the edges of the two major basins; the low and medium grassland FVCs accounted for 25.8% and 12.6% of the total area, and were concentrated in the Tarim River Basin and the transition zone; the high and extremely high grassland FVC accounted for the smallest proportion, 6.6% and 3.1%, respectively, and were mainly located in the Ili River Basin, Altai Mountains and Tianshan Mountains.
5.2.2. Spatial Changes of Grasslands FVC in Xinjiang
Grasslands with moderate and relatively high FVC generally show a trend of degradation, while grasslands with extremely low and low FVC are expanding (Figure 4b). The highest transition rates are observed from extremely high to high FVC grasslands (50.4%) and from high to moderate FVC grasslands (60%). Only 25.3% and 28.0% of the original states are retained, respectively. The most significant degradation occurs in the Ili River Valley and the Tianshan Mountains. The conversion rate from moderate FVC grasslands to low FVC grasslands is the highest, at 45.9%. In contrast, the outward conversion rate of low and extremely low FVC grasslands are relatively low, at 10% and 32.2%, respectively.
The trend of FVC changes in Xinjiang grassland during the study period showed significant spatial heterogeneity, with the decreasing trend area (66.7%) significantly higher than the increasing trend area (33.9%) (Figure 4c). The upward trend mainly appeared in low FVC areas such as the edge of the Tarim Basin and the Kunlun Mountains in the southern border, and the downward trend was concentrated in high FVC areas such as the Ili Valley, the Tianshan Mountains, the Tacheng area and the Altay Mountains in the northern border. Areas with no significant change accounted for the largest proportion, with no significant decline and no significant rise accounting for 34.6% and 20.9% of the grassland area in the whole of Xinjiang, respectively; areas with extremely significant changes are the next most common, with extremely significant increases accounting for 14.2% and extremely significant decreases for 6.7%. Areas with significant changes and slight changes are relatively smaller, representing 13.5% and 9.7%, respectively.
5.2.3. Future Changes of Grassland FVC in Xinjiang
In the future, 16.6% of the grassland FVC in the declining trend showed an inverse sustained decline, and 49.5% showed a sustained decline; in the increasing trend, 8.2% of the grassland FVC showed an inverse sustained increase, and 25.7% showed a sustained increase (Figure 4d). In the future, the FVC of grassland in Xinjiang will show a significant spatial heterogeneity with both increase and decrease, especially noteworthy is that the high FVC area in the northern border will continue to degrade, while the low FVC area in the southern border will show an upward trend.
Figure 4.
(a) The spatial distribution of grassland FVC in Xinjiang from 2000 to 2023. (b) Changes in grassland FVC types from 2000 to 2023. (c) The spatial variation trend of grassland FVC in Xinjiang from 2000 to 2023. (d) The spatial variation future trend of grassland FVC in Xinjiang from 2000 to 2023.
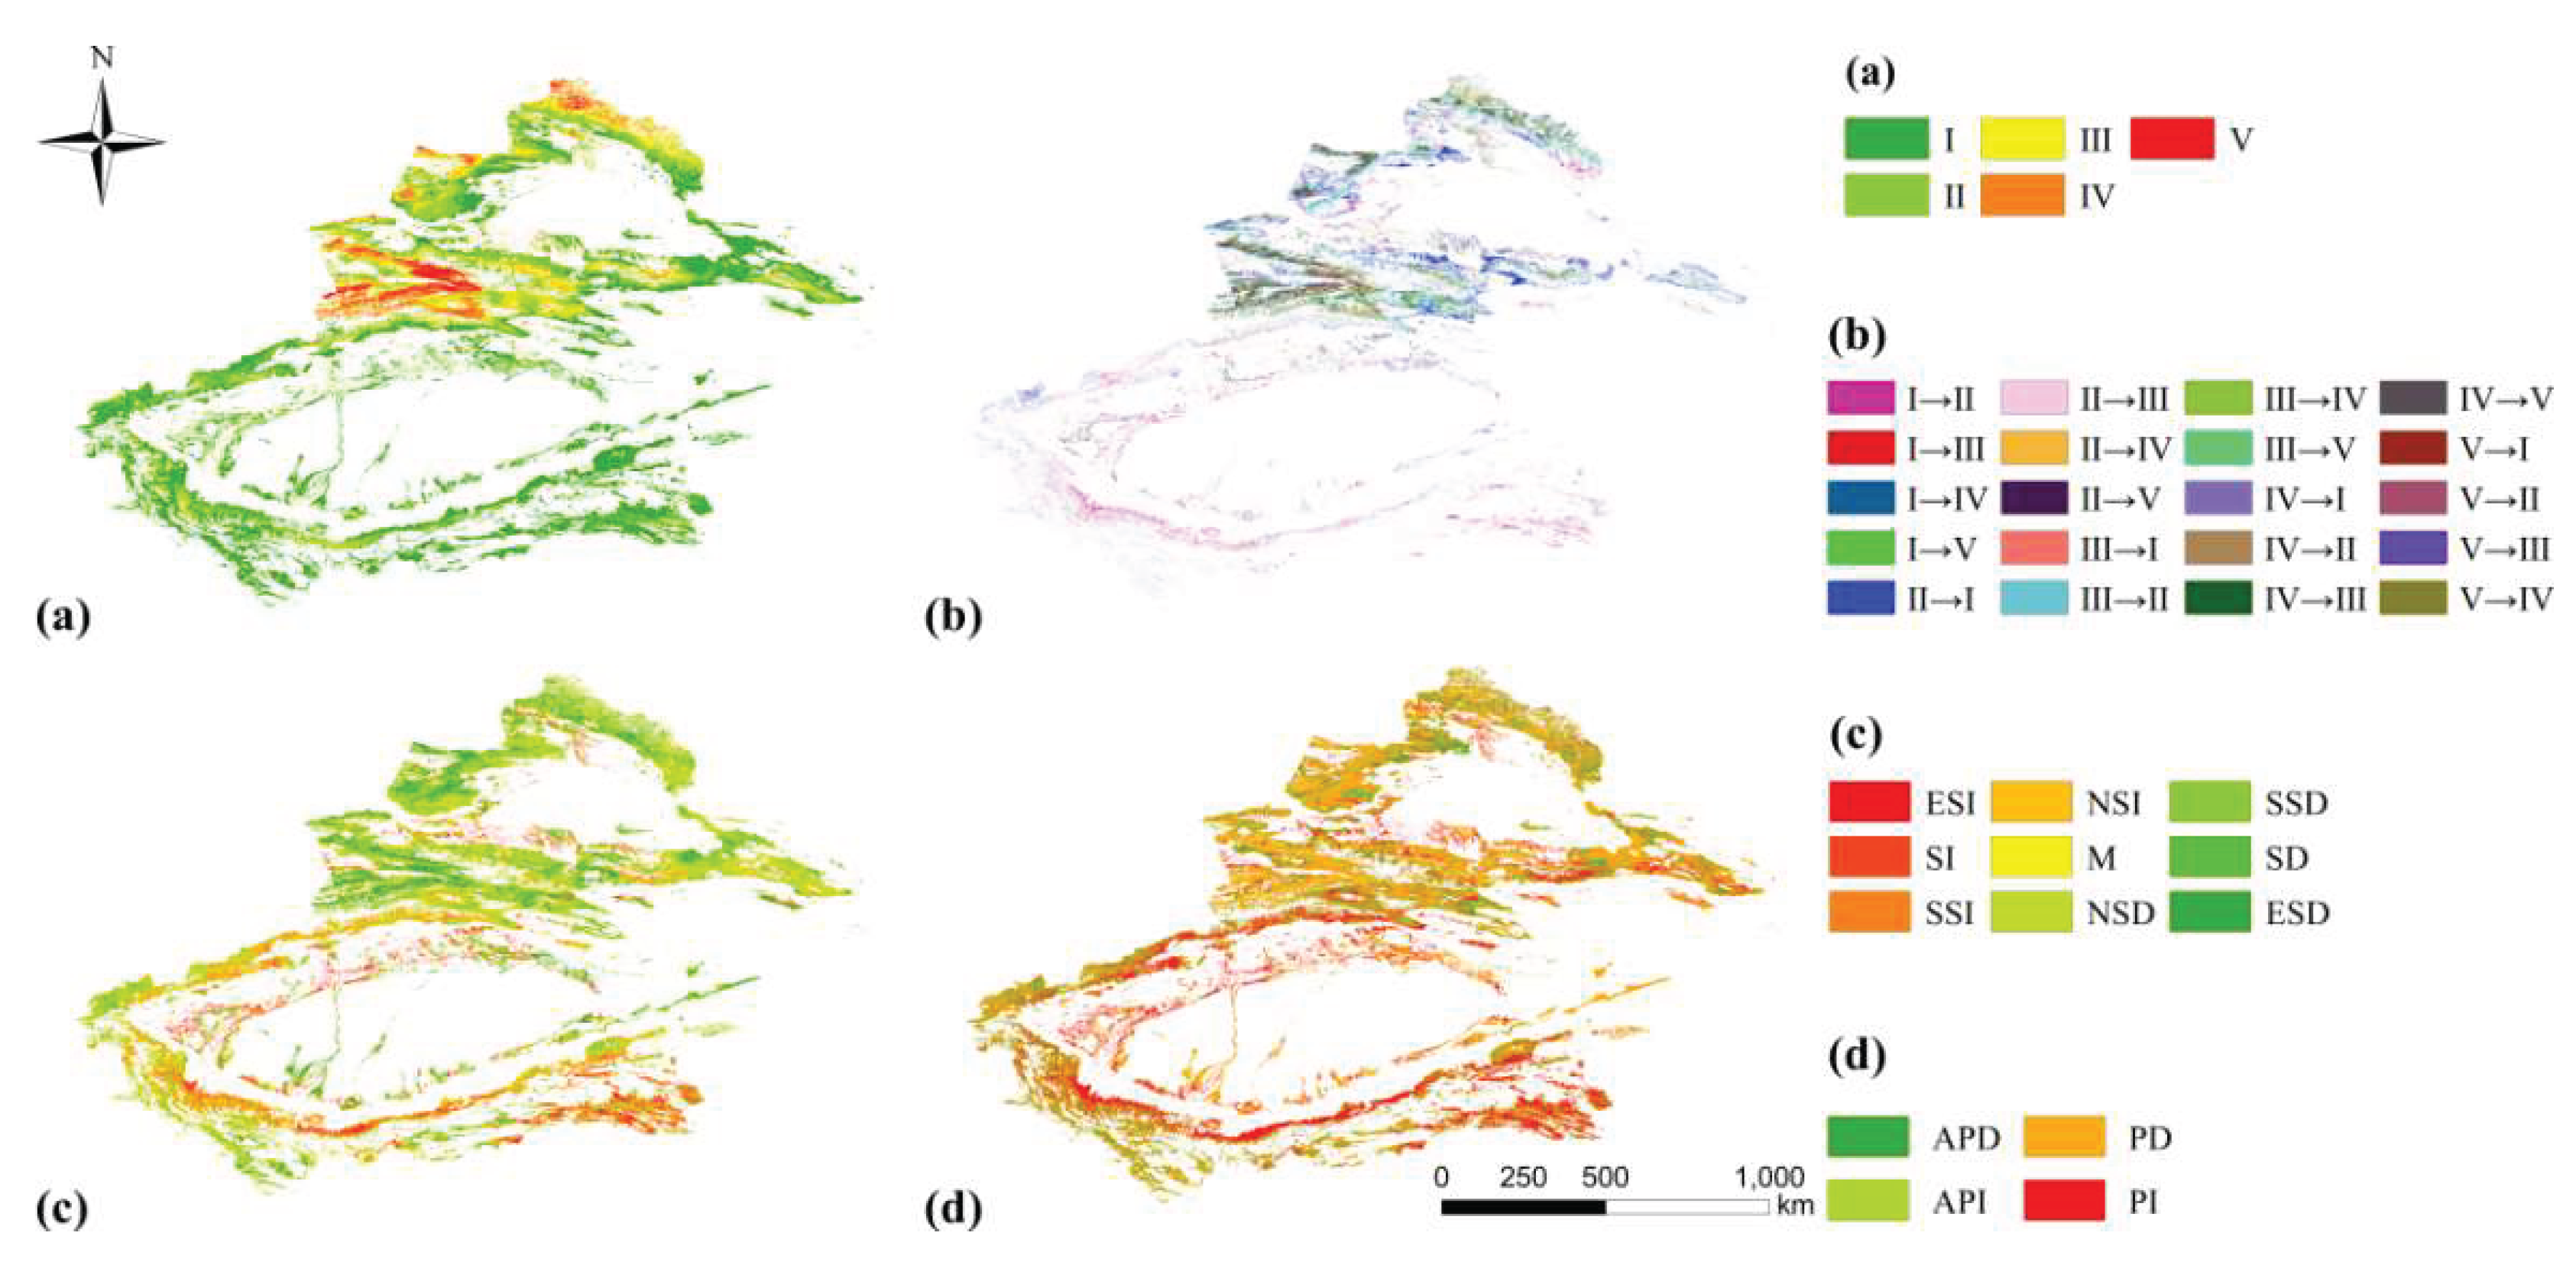
Figure 5.
( a ) The proportion of FVC area in different grades of grassland ; ( b ) The proportion of FVC transfer in different grades of grassland ; ( c ) Percentage of change trend types of different grassland types ; ( d ) Percentage of future change trend of different grassland types.
Figure 5.
( a ) The proportion of FVC area in different grades of grassland ; ( b ) The proportion of FVC transfer in different grades of grassland ; ( c ) Percentage of change trend types of different grassland types ; ( d ) Percentage of future change trend of different grassland types.
5.3. Analysis of the Drivers of Grassland FVC Change in Xinjiang
Precipitation, soil moisture and solar radiation all showed a decreasing trend in Xinjiang from 2000 to 2023, with average decreasing rates of 0.42 mm/a, 0.11 mm/a and 0.03 W/m²a, respectively (Figure 6). On the contrary, temperature showed a fluctuating upward trend, influenced to some extent by the warming of the Earth, with an average annual increase rate of 0.03 /a. The intensity of human activities maintained a relatively stable trend during the observation period as a whole, but showed an obvious upward trend in 2023.
5.3.1. Response of FVC of Grassland in Xinjiang to Different Climatic Factors
The partial correlations between grassland FVC and different climatic factors showed significant spatial heterogeneity (Figure 7a-d). The area of grassland FVC positively correlated with precipitation (61.3%) was larger than that of negatively correlated area (38.7%), and the areas where precipitation responded positively to grassland FVC were mainly concentrated around the Junggar Basin, the central Yili Valley, and the Kunlun Mountain Range (Figure 7a); the area of positively biased correlation of soil moisture to grass FVC was larger (61.3%) than that of negative correlation (38.5%), and the majority of grass FVC in Xinjiang had a positive response to soil moisture (Figure 7b); the area of grassland FVC positively correlated with solar radiation (34.7%) was smaller than that of negatively correlated areas (65.3%), and the areas where solar radiation positively contributed to grassland FVC were concentrated around the Junggar Basin, around the Tarim Basin, and in the mountains on the south side of the Kunlun Mountains (Figure 7c); the area of grassland FVC positively correlated with temperature (37.2%) was smaller than that of negatively correlated area (62.8%), and temperature acted negatively on most of grassland FVC in Xinjiang. However, the area of its positive effect was mainly concentrated in the eastern mountains of the Tianshan Mountains (Figure 7d).
Among the meteorological factors, soil moisture had the highest mean relative contribution to grassland FVC (38.3%), especially concentrated in the Tarim River Basin. The average contributions of precipitation, temperature and solar radiation were low at 18.6%, 22.9% and 20.2%, respectively (Figure 6a’-d’). The area of grassland FVC driven by soil moisture was the largest in Xinjiang from 2000 to 2023, with a share of 54.8%. In contrast, the area of grassland FVC driven by precipitation, solar radiation, and air temperature is less, with 13.1%, 14.6%, and 17.5%, respectively (Figure 8a). Soil moisture-driven grassland FVC was widely distributed in all regions of Xinjiang, precipitation-driven grassland FVC was mainly concentrated around the Junggar Basin, solar radiation-driven grassland FVC was concentrated in the western part of the Ili Valley and Kashgar, and the areas where the temperature factor drove grassland FVC were mainly concentrated in the Bayinbruk Plain and the southern Altay Mountains (Figure 8b).
5.3.2. Impact of Climate Change and Human Activities on Grassland FVC
From 2000 to 2023, the grassland FVC in Xinjiang was influenced by the combined effects of climate change and human activities. The relative contribution of climate change to grassland FVC was 57.2%, while the relative contribution of human activities was 42.8%. Climate change significantly affected the grassland FVC in the Kashgar region, the Tianshan Mountains, the Ili River Valley, and the western part of the Kunlun Mountains. In contrast, human activities had a more pronounced impact on the grassland FVC in (23.6%) was smaller than the area with a negative impact (38.4%). Similarly, the area where human activities had a positive impact on grassland FVC (28.0%) was smaller than the area with a negative impact (42.7%) (Figure 9a’-d’).
6. Discussion
6.1. Spatiotemporal Dynamics Characteristics of Xinjiang Grassland FVC
This study presented an analysis of the spatiotemporal dynamics of grassland FVC in Xinjiang from 2000 to 2023. The results revealed that the grassland FVC in Xinjiang was distributed as high in the northwest and low in the southeast, and decreasing from mountains to basins, which was consistent with the results of Ma et al.[34]. From 2000 to 2020, Xinjiang grassland FVC showed an upward in terms of temporal changes, which was consistent with the results of previous studies [12,34]. From 2000 to 2020, Xinjiang grassland FVC increased probably resulted from the combination of regional climate warming and humidification, together with the reduction of anthropogenic disturbance intensity. Specifically, the increased precipitation and elevated temperature during the study period optimized the hydrothermal conditions essential for vegetation growth. Concurrently, the implementation of ecological conservation projects effectively reduced the disturbance intensity of human activities on grassland ecosystems. The synergistic effect of these factors contributed to the recovery and growth of grassland vegetation. Notably, however, the grassland FVC decreased significantly from 2020 to 2023, with existing studies suggesting that drought conditions in the Tianshan region of Xinjiang increased significantly after 2020 [35], which may explain the remarkable decrease in grassland FVC from 2020 to 2023.
In northern Xinjiang, the spatial evolution of FVC showed a decreasing trend in the high FVC areas such as the Ili Valley, Tianshan Mountains and Altay Mountains, while an increasing trend was observed in the low FVC areas such as the surrounding areas of the Tarim Basin, the Kunlun Mountains and the surrounding areas of the Junggar Basin. Chen et al.’s [27] study on the spatial variation of Xinjiang grassland FVC showed a slight upward trend of NDVI in the grasslands of northern and southern Xinjiang, which differed from the results of this study. The discrepancy may arise from the fact that this study on the spatial changes of grassland FVC in Xinjiang concentrated on the time period before 2020, when the grassland FVC showed an upward trend. Yet, the significant downward trend of Xinjiang grassland FVC from 2020 to 2023 affected the spatial change of grassland FVC from 2000 and 2023. In addition, NDVI-based vegetation cover analysis may induce oversaturation of grassland cover in northern Xinjiang, possibly contributing to the inconsistency of the study results. Influenced by the unique geomorphology and uneven hydrothermal condition in Xinjiang, FVC variation patterns varied among different grassland types: While most grassland types showed a decreasing trend in FVC due to climatic drought, the rising trend of FVC in AGSS and TGFHM is noteworthy, which may be attributed to the melting of snow and ice on the high-elevation mountains due to the temperature rise in Xinjiang, thereby facilitating an increase of FVC in these two grassland types [36,37].
6.2. Impact of Climate Change on Grassland FVC
By analyzing the FVC-climate relationships in Xinjiang from 2000 to 2023, this study revealed the effects of climatic factors of annual precipitation, mean annual air temperature, mean annual solar radiation and relative humidity on grassland FVC. The positive feedback mechanism of vegetation enabled soil moisture to directly and stably supply water to vegetation, reduce water evaporation, improve soil structure, and maintain the long-term stability of soil moisture[38]. Findings indicated that the effect of soil moisture on grassland FVC was more significant than that of other meteorological factors. The study of Zhang et al. [39] also revealed that soil moisture was strongly positively correlated with grassland FVC with a significant contribution. Areas with negative effects of temperature on grassland FVC significantly exceeds those with a positive effect. In particular, temperature positively affects grassland FVC mainly in mountainous areas such as the Tianshan Mountains and the Kunlun Mountains, which is attributed to the increased moisture factor resulting from the temperature-enhanced melting of alpine glaciers and snow, thereby promoting the growth of grasses. In contrast, temperature negatively affects grassland FVC mainly located in areas around the Junggar Basin and around the Tarim Basin, which may be explained by water evaporation exacerbated by high temperatures leading to rapid water loss, and thus affecting the growth and survival of plants [40]. To a certain extent, elevated solar radiation is capable of increasing the photosynthetic efficiency of vegetation to promote plant growth and reproduction, but excessive light energy may exceed the photosynthetic capacity of plants, resulting in a decrease in photosynthetic efficiency and possibly even damaging the chlorophyll and photosystem of plants [41]. The impact of solar radiation on vegetation is relatively low due to its inability to act directly on vegetation growth and development, but indirectly by influencing other meteorological factors[42]. Precipitation also serves as a critical environmental factor for vegetation growth and development. The results of this study demonstrated that precipitation contributed the least to grassland FVC. The reason may lie in the strong drought tolerance of vegetation in arid and semi-arid regions, enabling them to survive and grow under limited moisture conditions, so changes in precipitation have less impact on grassland FVC [43]. Remarkably, precipitation in Xinjiang followed an increasing trend until 2020 [44], yet turned to a decreasing trend after 2020, which may adversely affect grassland FVC.
6.3. Impact of Climate Change and Human Activities on Grassland FVC
The findings demonstrated that climate change played a more dominant role than human activities in driving grassland FVC changes in Xinjiang, although both factors contributed collectively. Li et al. [12] suggested both climate change and anthropogenic activities contribute to the FVC change in Xinjiang, with climate change exerting a larger influence than anthropogenic activities, which was consistent with the results of this study. Xinjiang has experienced a significant increase in the frequency of extreme climatic phenomena over the past two decades. As a typical arid and semi-arid region, the vegetation in Xinjiang responds sensitively to climate change with a relatively fragile ecological environment [45]. In this context, extreme changes in climate can negatively affect the growth of grassland, resulting in a decreasing trend of grassland FVC. However, it is noteworthy that extreme droughts may exacerbate glacier melting and affect the hydrological cycle of the watershed [46], which may partially explain the increasing trend of grassland FVC in the Kunlun Mountains and Tarim River Basin.
During the study period, area with negative impacts of human activities on grassland FVC significantly exceeded those with positive effects. The negatively affected areas were mainly concentrated in the northern border regions such as Tianshan Mountains and Altay Mountains, which may be associated with the over-intensity of human activities, such as overgrazing, tourism development as well as insufficient anthropogenic management [47]. In regions such as the south side of Tianshan Mountain and the north side of Kunlun Mountain, the Chinese government has launched a series of ecological engineering to restore and improve grassland FVC [48]. Therefore, human activities conducted there positively contribute to grassland FVC. Based on these findings, it is imperative to strengthen the implementation of ecological projects such as conversion of grazing land to grassland and grazing exclusion. Concurrently, rational planning shall also be undertaken for land use planning, grazing and tourism development.
7. Conclusion
In this paper, the whole grassland and different grassland types in Xinjiang from 2000 to 2023 were mainly studied. Based on EVI data, Theil-Sen trend analysis, Mann-Kendall test, Hurst index, ridge regression and residual analysis were used to reveal the temporal and spatial evolution of grassland FVC in Xinjiang and its driving mechanism. The conclusions are as follows : (1) The spatial distribution of FVC in Xinjiang grassland is characterized by high in the northwest and low in the southeast, and decreasing from mountain to basin. From 2000 to 2023, the FVC of Xinjiang grassland showed a fluctuating downward trend, and the FVC of most grasslands will continue to decline in the future. (2)The change of grassland FVC in Xinjiang is affected by climate change and human activities, but the impact of climate change on grassland FVC is more significant. The contribution of climate factors to grassland FVC in Xinjiang is ranked as follows : soil moisture > temperature > solar radiation > precipitation. (3) The FVC of each grassland type in Xinjiang showed different change patterns. Except that the FVC of temperate typical steppe and temperate desert steppe was dominated by climate, and the FVC of temperate meadow steppe was dominated by human beings, the FVC of other grassland types was dominated by human activities and climate change.
In this paper, the temporal and spatial dynamics and attribution analysis of grassland FVC in Xinjiang are carried out on an annual scale. However, the impact of climate change on grassland FVC is usually more complex, and it is necessary to consider the impact of climate change on grassland FVC in the future. There is also a certain time lag and cumulative effect. At the same time, the residual analysis used in this paper only considers it as a whole, and does not refine the impact of specific factors of human activities on grassland FVC.Therefore, future research should refine the impact of various factors of human activities on grassland FVC.
Author Contributions
Yongchi Hua and Zhichao Hu collected and analyzed the experimental data. Chengchi Zhang and Yuexin Zhang designed the experiments and prepared the first draft under supervision of Xiuzhi Ma. They interpreted the experimental findings. All authors read, commented and revised this manuscript.
Funding
This study was supported by the Third Xinjiang Scientific Expedition Program (2022xjkk0403) and Natural Science Foundation of Inner Mongolia Autonomous Region and the “Structural and Functional Analyses of Xanthoceras sorbifolium rhizosphere Arbusular Mycorrhizal Fungi Community in Changing Environments and Research on Effect Mechanisms” (2023QN03049).
Conflict of Interest
The authors declare no conflicts of interest.
References
- Liu L, Zheng J, Guan J, Han W, Liu Y. ;Grassland cover dynamics and their relationship with climatic factors in China from 1982 to 2021. Science of The Total Environment 2023, 905, 167067. [CrossRef]
- Liu W, Mo X, Liu S, Lu C.; Impacts of climate change on grassland fractional vegetation cover variation on the Tibetan Plateau. Science of The Total Environment 2024, 939, 173320. [CrossRef]
- Gitelson AA, Kaufman YJ, Stark R, Rundquist D.; Novel algorithms for remote estimation of vegetation fraction. Remote sensing of Environment 2002, 80(1), 76-87. [CrossRef]
- Pettorelli N, Vik JO, Mysterud A, Gaillard JM, Tucker CJ, Stenseth NC.; Using the satellite-derived NDVI to assess ecological responses to environmental change. Trends in ecology & evolution 2005, 20(9), 503-510. [CrossRef]
- Shen X, Liu B, Li G, Yu P, Zhou D.; Impacts of grassland types and vegetation cover changes on surface air temperature in the regions of temperate grassland of China. Theoretical and Applied Climatology 2016, 126:141-50. [CrossRef]
- Fu B, Yang W, Yao H, He H, Lan G, Gao E, Qin J, Fan D, Chen Z. Evaluation of spatio-temporal variations of FVC and its relationship with climate change using GEE and Landsat images in Ganjiang River Basin. Geocarto International 2022, 37(26), 13658-13688. [CrossRef]
- Otto M, Höpfner C, Curio J, Maussion F, Scherer D.; Assessing vegetation response to precipitation in northwest Morocco during the last decade: an application of MODIS NDVI and high resolution reanalysis data. Theoretical and applied climatology 2016, 123, 23-41. [CrossRef]
- Matsushita B, Yang W, Chen J, Onda Y, Qiu G.; Sensitivity of the enhanced vegetation index (EVI) and normalized difference vegetation index (NDVI) to topographic effects: a case study in high-density cypress forest. Sensors 2007, 7(11), 2636-2651. [CrossRef]
- Son NT, Chen CF, Chen CR, Minh VQ, Trung NH.; A comparative analysis of multitemporal MODIS EVI and NDVI data for large-scale rice yield estimation. Agricultural and forest meteorology 2014, 197, 52-64. [CrossRef]
- Wang G, Mao J, Fan L, Ma X, Li Y.; Effects of climate and grazing on the soil organic carbon dynamics of the grasslands in Northern Xinjiang during the past twenty years. Global Ecology and Conservation 2022, 34, 20-39. [CrossRef]
- Liu Y, Li L, Chen X, Zhang R, Yang J.; Temporal-spatial variations and influencing factors of vegetation cover in Xinjiang from 1982 to 2013 based on GIMMS-NDVI3g. Global and Planetary Change 2018, 169, 145-155. [CrossRef]
- Li G, Liang J, Wang S, Zhou M, Sun Y, Wang J, Fan J.; Characteristics and Drivers of Vegetation Change in Xinjiang, 2000–2020. Forests 2024, 15(2), 231. [CrossRef]
- Liang S, Yi Q, Liu J.; Vegetation dynamics and responses to recent climate change in Xinjiang using leaf area index as an indicator. Ecological indicators 2015, 58, 64-76. [CrossRef]
- LOU AR, ZHOU GF.; Relationships Between Environment and Spatial Pattern of Vegetation Types in the Mid Tianshan Mountains. Chinese Journal of Plant Ecology 2001, 25(4): 385-391.
- Zhao Y, Chen Y, Wu C, Li G, Ma M, Fan L, Zheng H, Song L, Tang X.; Exploring the contribution of environmental factors to evapotranspiration dynamics in the Three-River-Source region, China. Journal of Hydrology 2023, 626, 130222. [CrossRef]
- Wang G, Mao J, Fan L, Ma X, Li Y.; Effects of climate and grazing on the soil organic carbon dynamics of the grasslands in Northern Xinjiang during the past twenty years. Global Ecology and Conservation 2022, 34, 2039. [CrossRef]
- Li Q, Chen Y, Shen Y, Li X, Xu J.; Spatial and temporal trends of climate change in Xinjiang, China. Journal of Geographical Sciences 2011, 21:1007-1018. [CrossRef]
- Yang H, Mu S, Li J.; Effects of ecological restoration projects on land use and land cover change and its influences on territorial NPP in Xinjiang, China. Catena 2014, 115, 85-95. [CrossRef]
- Zhang X S. Vegetation map of the People’s Republic of China (1:1 000 000). Geology Press, China, 2007.
- Didan, K.; MODIS/Terra Vegetation Indices 16-Day L3 Global 250m SIN Grid V061. 2021, distributed by NASA EOSDIS Land Processes Distributed Active Archive Center. Accessed 2025-01-13. [CrossRef]
- Abatzoglou, J.T., S.Z. Dobrowski, S.A. Parks, K.C. Hegewisch, 2018, Terraclimate, a high-resolution global dataset of monthly climate and climatic water balance from 1958-2015, Scientific Data.
- Xu Xinliang, Liu Jiyuan, Zhang Shuwen, Li Rendong, Yan Changzhen, Wu Shixin. China Multi-period Land Use Remote Sensing Monitoring Dataset (CNLUCC). Resource and Environmental Science Data Registration and Publishing System (http://www.resdc.cn/DOI), 2018. [CrossRef]
- Reuter HI, Nelson A, Jarvis A.; An evaluation of void-filling interpolation methods for SRTM data. International Journal of Geographical Information Science 2007, 21(9), 983-1008. [CrossRef]
- Holben BN.; Characteristics of maximum-value composite images from temporal AVHRR data. International journal of remote sensing 1986, 7(11), 1417-1434. [CrossRef]
- Karabulut M.; An examination of relationships between vegetation and rainfall using maximum value composite AVHRR-NDVI data. Turkish Journal of Botany 2003, 27(2), 93-101.
- Li F, Chen W, Zeng Y, Zhao Q, Wu B. Improving estimates of grassland fractional vegetation cover based on a pixel dichotomy model: A case study in Inner Mongolia, China. Remote Sensing 2014, 6(6), 4705-4722. [CrossRef]
- Chen CB, Li GY, Peng J.; Spatio-temporal variation characteristics of grassland NDVI and its response to climate change in Xinjiang from 1981 to 2018. Acta Ecologic Sinica 2023, 43(4), 1537-1552.
- Sen PK.; Estimates of the regression coefficient based on Kendall’s tau. Journal of the American statistical association 1968, 63(324), 1379-1389.
- Sur K, Chauhan P.; Dynamic trend of land degradation/restoration along Indira Gandhi Canal command area in Jaisalmer District, Rajasthan, India: a case study. Environmental Earth Sciences 2019, 78(15), 472.
- Mann HB.; Nonparametric tests against trend. Econometrica: Journal of the econometric society. 1945 Jul 1:245-259. [CrossRef]
- Hurst HE.; Long-term storage capacity of reservoirs. Transactions of the American society of civil engineers 1951, 116(1), 770-799. [CrossRef]
- Evans J, Geerken R.; Discrimination between climate and human-induced dryland degradation. Journal of arid environments 2004, 57(4), 535-554. [CrossRef]
- Hoerl AE, Kennard RW.; Ridge regression: Biased estimation for nonorthogonal problems. Technometrics 1970, 12(1), 55-67.
- MA Lisha, ZHANG Jianghua, PENG Jian, LI Guangyong, HAN Wanqiang, LIU Liang.; Remote sensing monitoring and influencing factors analysis of grassland degradation in Xinjiang from2001to2020. Bulletin of Surveying and Mapping 2024, (6), 1-7. [CrossRef]
- WU Xiulan, Cheng Heqian, TONG Xinyi, ZHANG Xu.;Response of vegetation changes to meteorological drought in Xinjiang Tianshan Mountain area. Arid Land Geography. http://kns.cnki.net/kcms/detail/65.1103.X.20250326.1557.005.html.
- Wang S, Liu Q, Huang C.; Vegetation change and its response to climate extremes in the arid region of Northwest China. Remote Sensing. 2021 13(7), 1230. [CrossRef]
- Wang H, Li Z, Niu Y, Li X, Cao L, Feng R, He Q, Pan Y.; Evolution and climate drivers of NDVI of natural vegetation during the growing season in the arid region of northwest China. Forests 2022, 13(7), 1082. [CrossRef]
- James SE, Pärtel M, Wilson SD, Peltzer DA.; Temporal heterogeneity of soil moisture in grassland and forest. Journal of Ecology 2003, 234-239. [CrossRef]
- Zhang X, Zhao W, Liu Y, Fang X, Feng Q.; The relationships between grasslands and soil moisture on the Loess Plateau of China: A review. Catena 2016, 145, 56-67. [CrossRef]
- Luo N, Mao D, Wen B, Liu X.; Climate change affected vegetation dynamics in the northern Xinjiang of China: Evaluation by SPEI and NDVI. Land 2020, 9(3), 90. [CrossRef]
- Qin G, Meng Z, Fu Y.; Drought and water-use efficiency are dominant environmental factors affecting greenness in the Yellow River Basin, China. Science of the Total Environment 2022, 834, 155479. [CrossRef]
- Fitter AH, Graves JD, Self GK, Brown TK, Bogie DS, Taylor K.; Root production, turnover and respiration under two grassland types along an altitudinal gradient: influence of temperature and solar radiation. Oecologia 1998, 114, 20-30. [CrossRef]
- Hardy CC, Burgan RE. Evaluation of NDVI for monitoring live moisture in three vegetation types of the western US. Photogrammetric Engineering and Remote Sensing 1999, 65, 603-610.
- Ma YJ, Shi FZ, Hu X, Li XY.; Climatic constraints to monthly vegetation dynamics in desert areas over the silk road economic belt. Remote Sensing 2021, 13(5), 995. [CrossRef]
- WU Xiaodan, LUO Min, MENG Fanhao.; Newcharacteristics of spatio-temporal evolution of extreme climate events in Xinjiang under the background of warm and humid climate. Arid Zone Research 2022, 39(6), 1695-1705.
- WU Xiulan, ZHANG Jingli, YU Xingjie, Mayila Maimaitiaili.; Comprehensive risk assessment and zoning of drought disasters in Tianshan Mountains, Xinjiang Uygur Autonomous Region. Journal of Meteorology and Environment 2022, 38(4), 161-167.
- Zhou Y, Li Y, Li W, Li F, Xin Q.; Ecological responses to climate change and human activities in the arid and semi-arid regions of Xinjiang in China. Remote Sensing 2022, 14(16), 3911. [CrossRef]
- Yang H, Yao L, Wang Y, Li J.; Relative contribution of climate change and human activities to vegetation degradation and restoration in North Xinjiang, China. The Rangeland Journal 2017, 39(3), 289-302. [CrossRef]
Figure 1.
The spatial pattern of Xinjiang, China, including :(a) Xinjiang elevation. (b) Xinjiang grassland species distribution.
Figure 1.
The spatial pattern of Xinjiang, China, including :(a) Xinjiang elevation. (b) Xinjiang grassland species distribution.
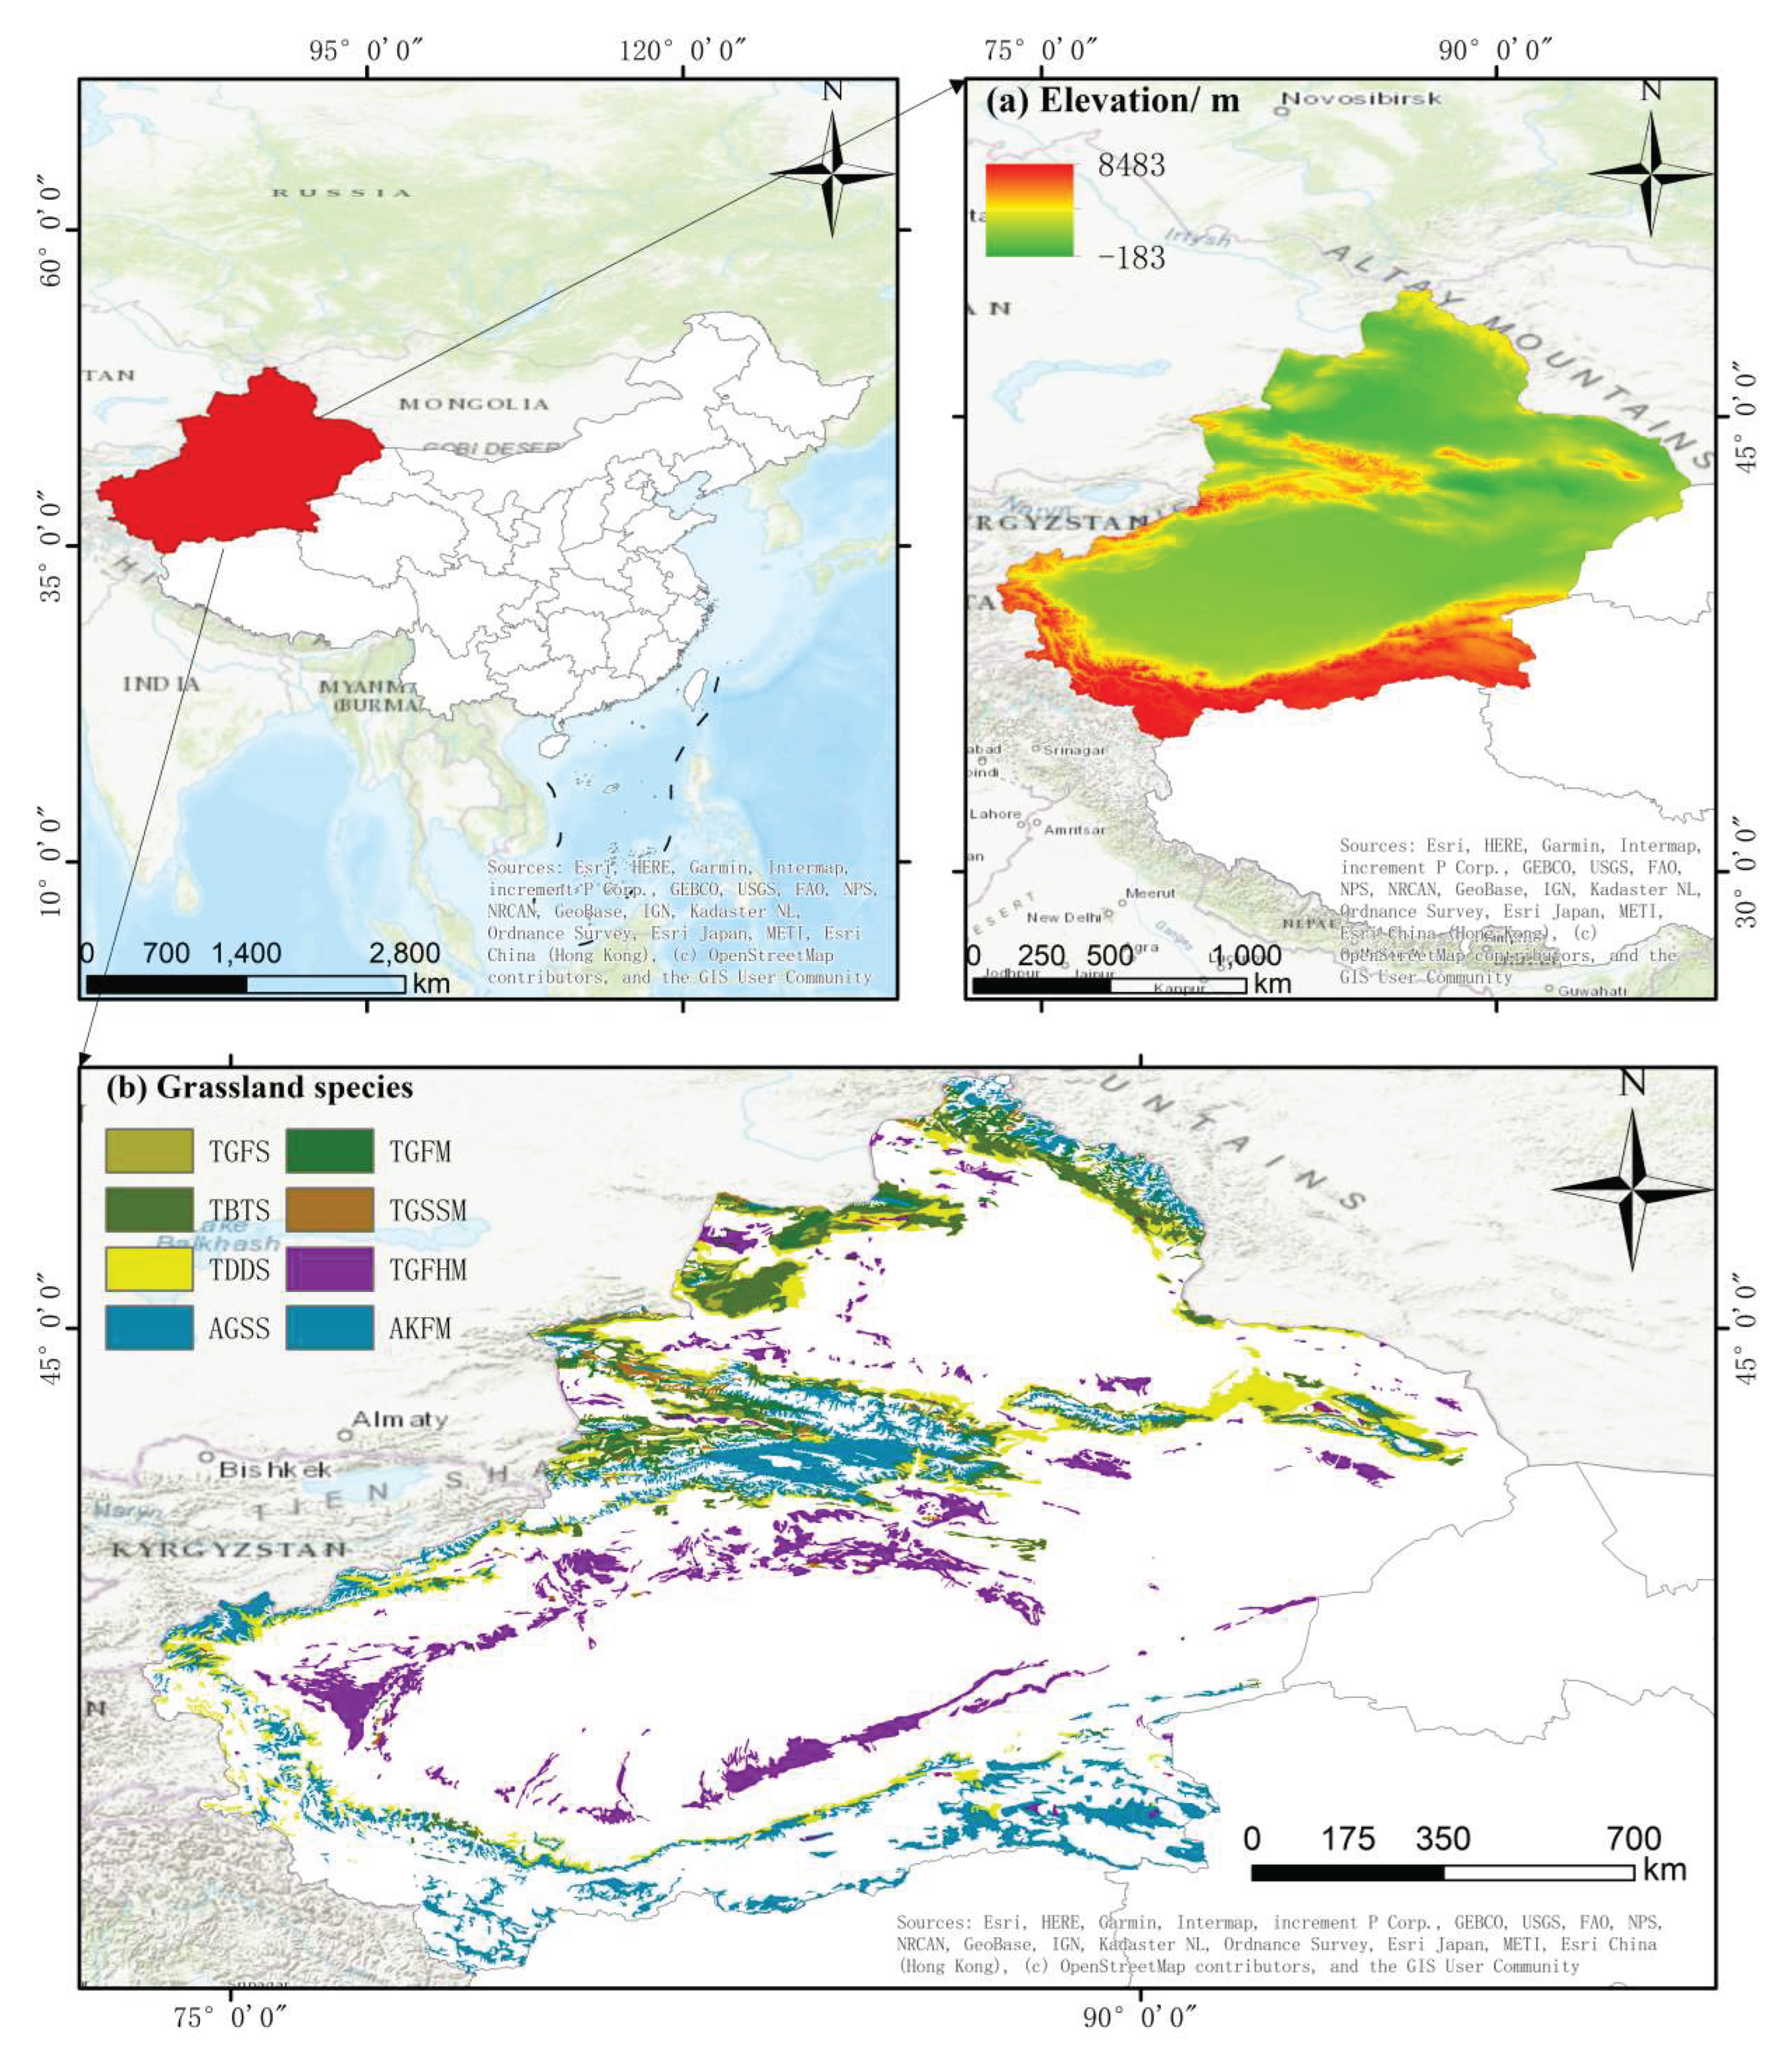
Figure 6.
The interannual variation trend of each driving factor.
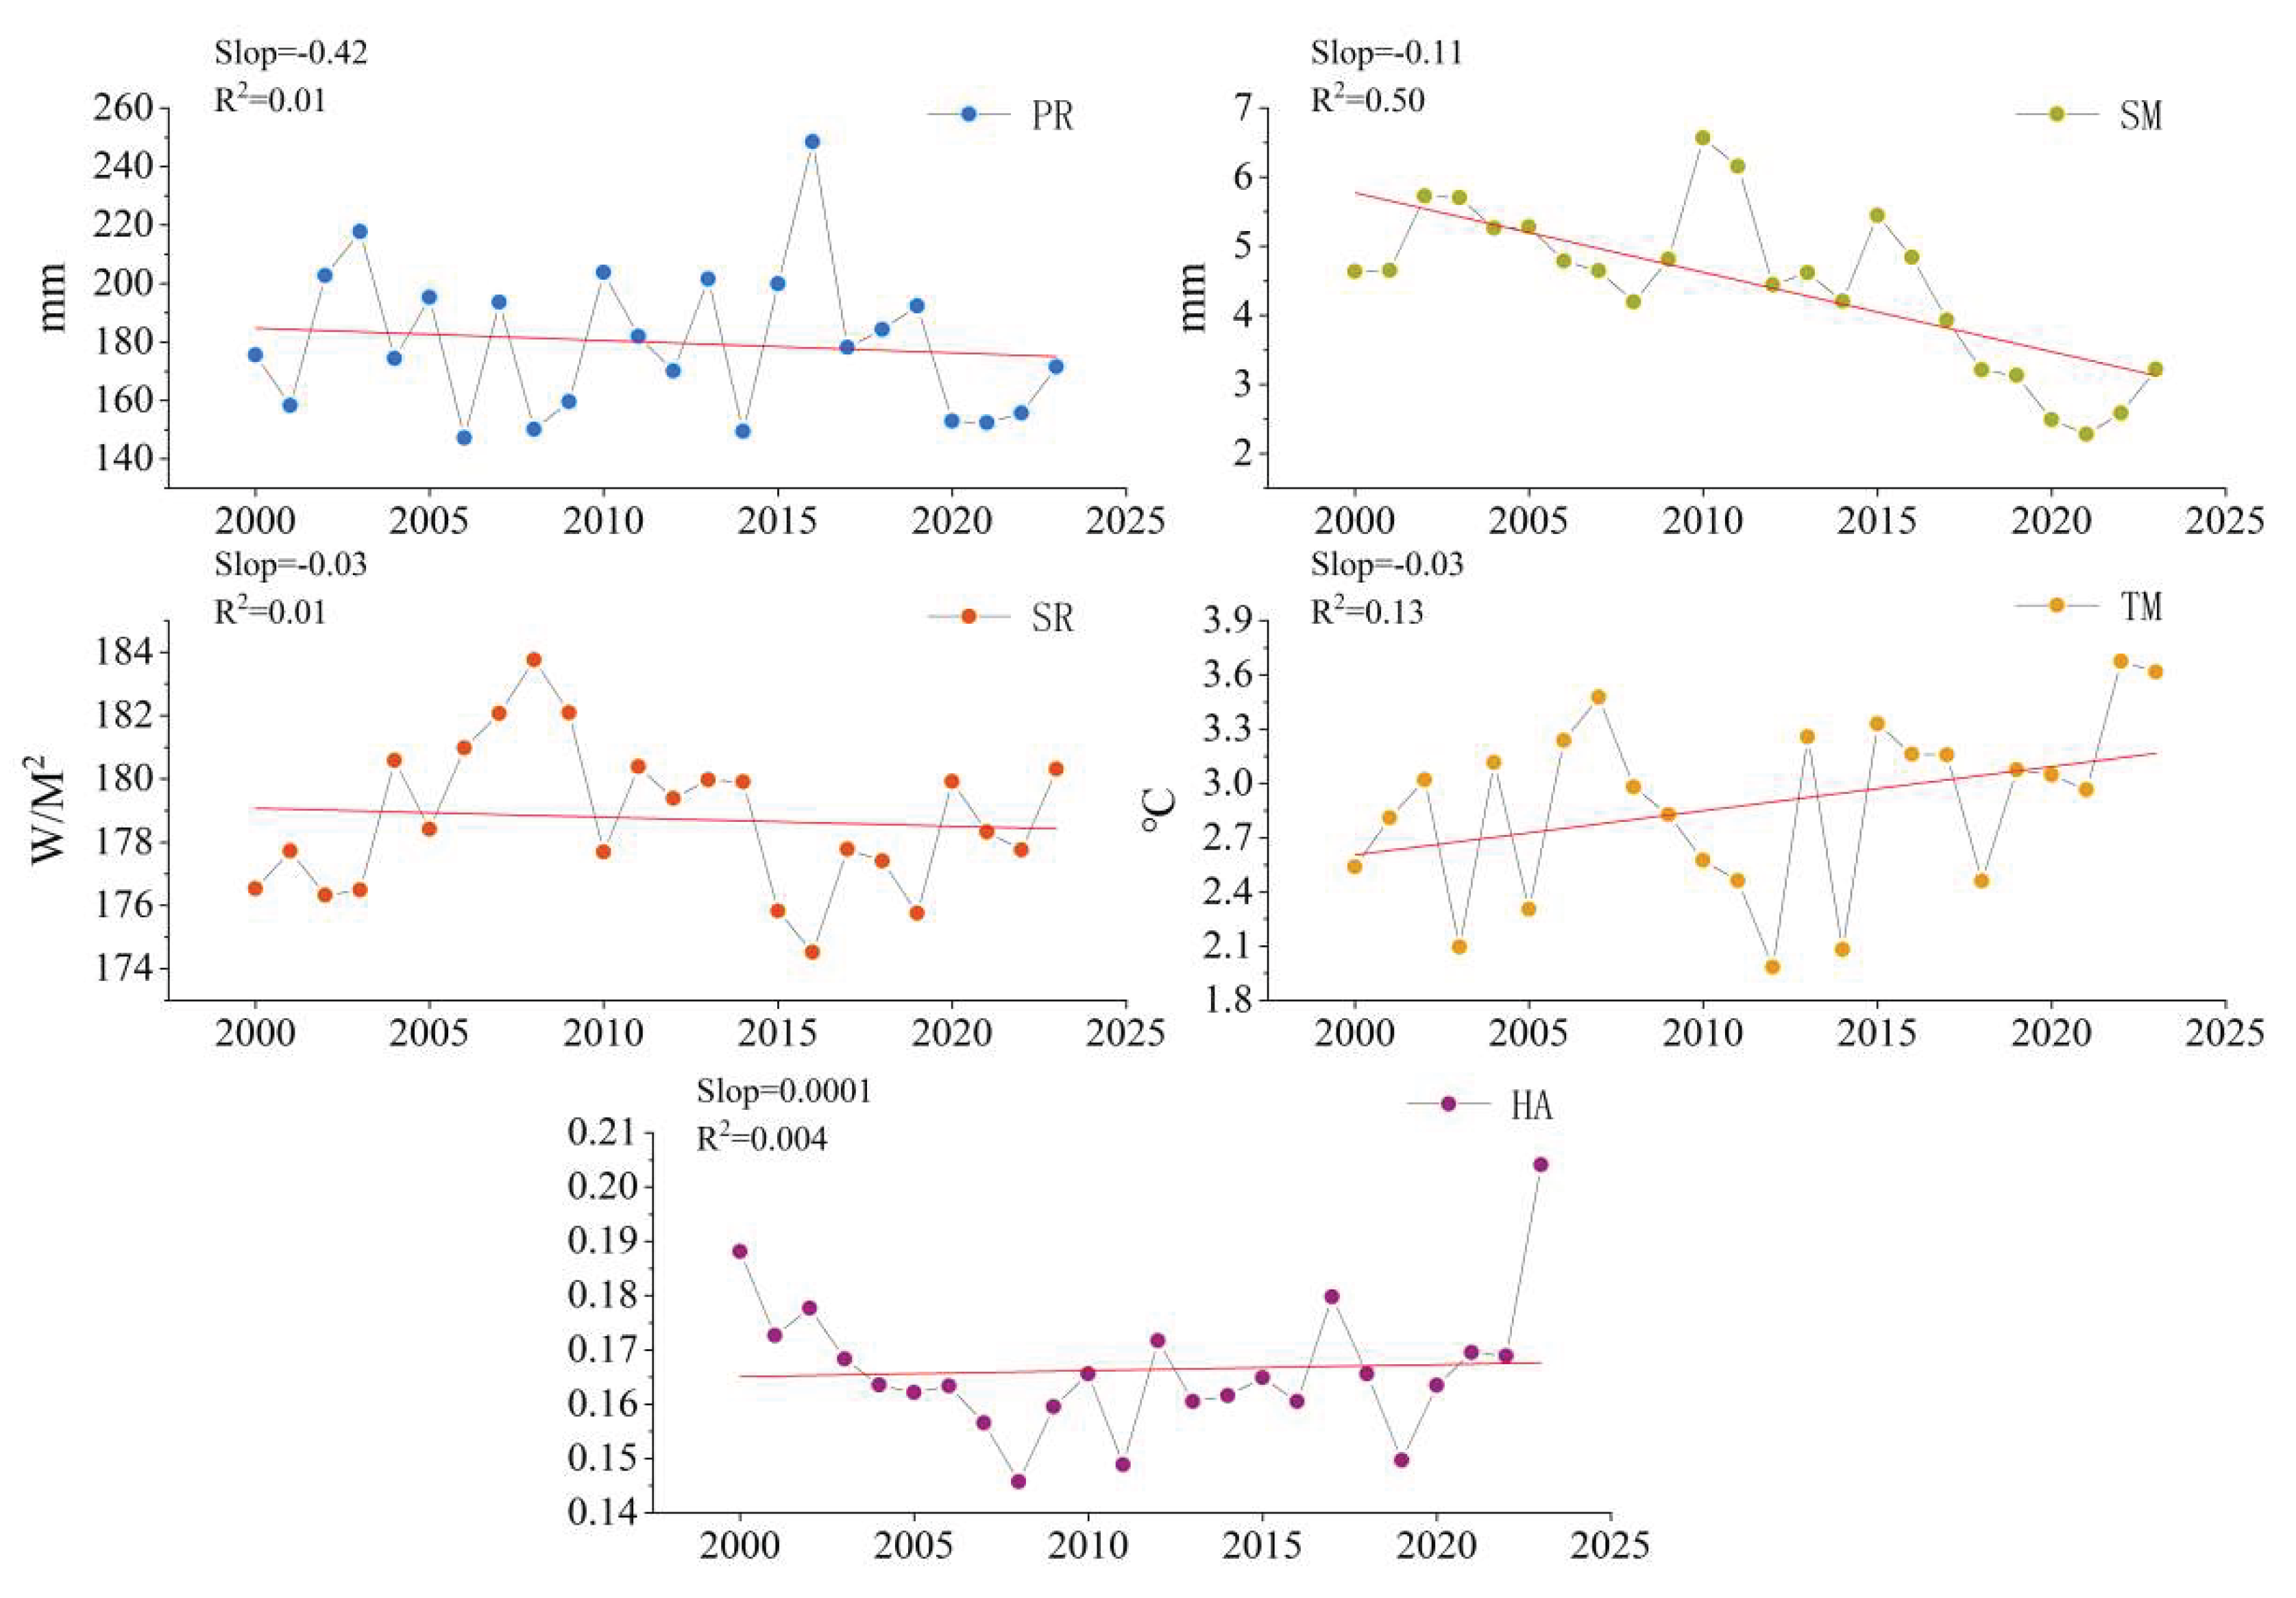
Figure 7.
(a-d) Partial correlation coefficients of precipitation, soil moisture, solar radiation and air temperature with grassland FVC. (a’-d’) Relative contributions of precipitation, soil moisture, solar radiation and air temperature to grassland FVC.
Figure 7.
(a-d) Partial correlation coefficients of precipitation, soil moisture, solar radiation and air temperature with grassland FVC. (a’-d’) Relative contributions of precipitation, soil moisture, solar radiation and air temperature to grassland FVC.
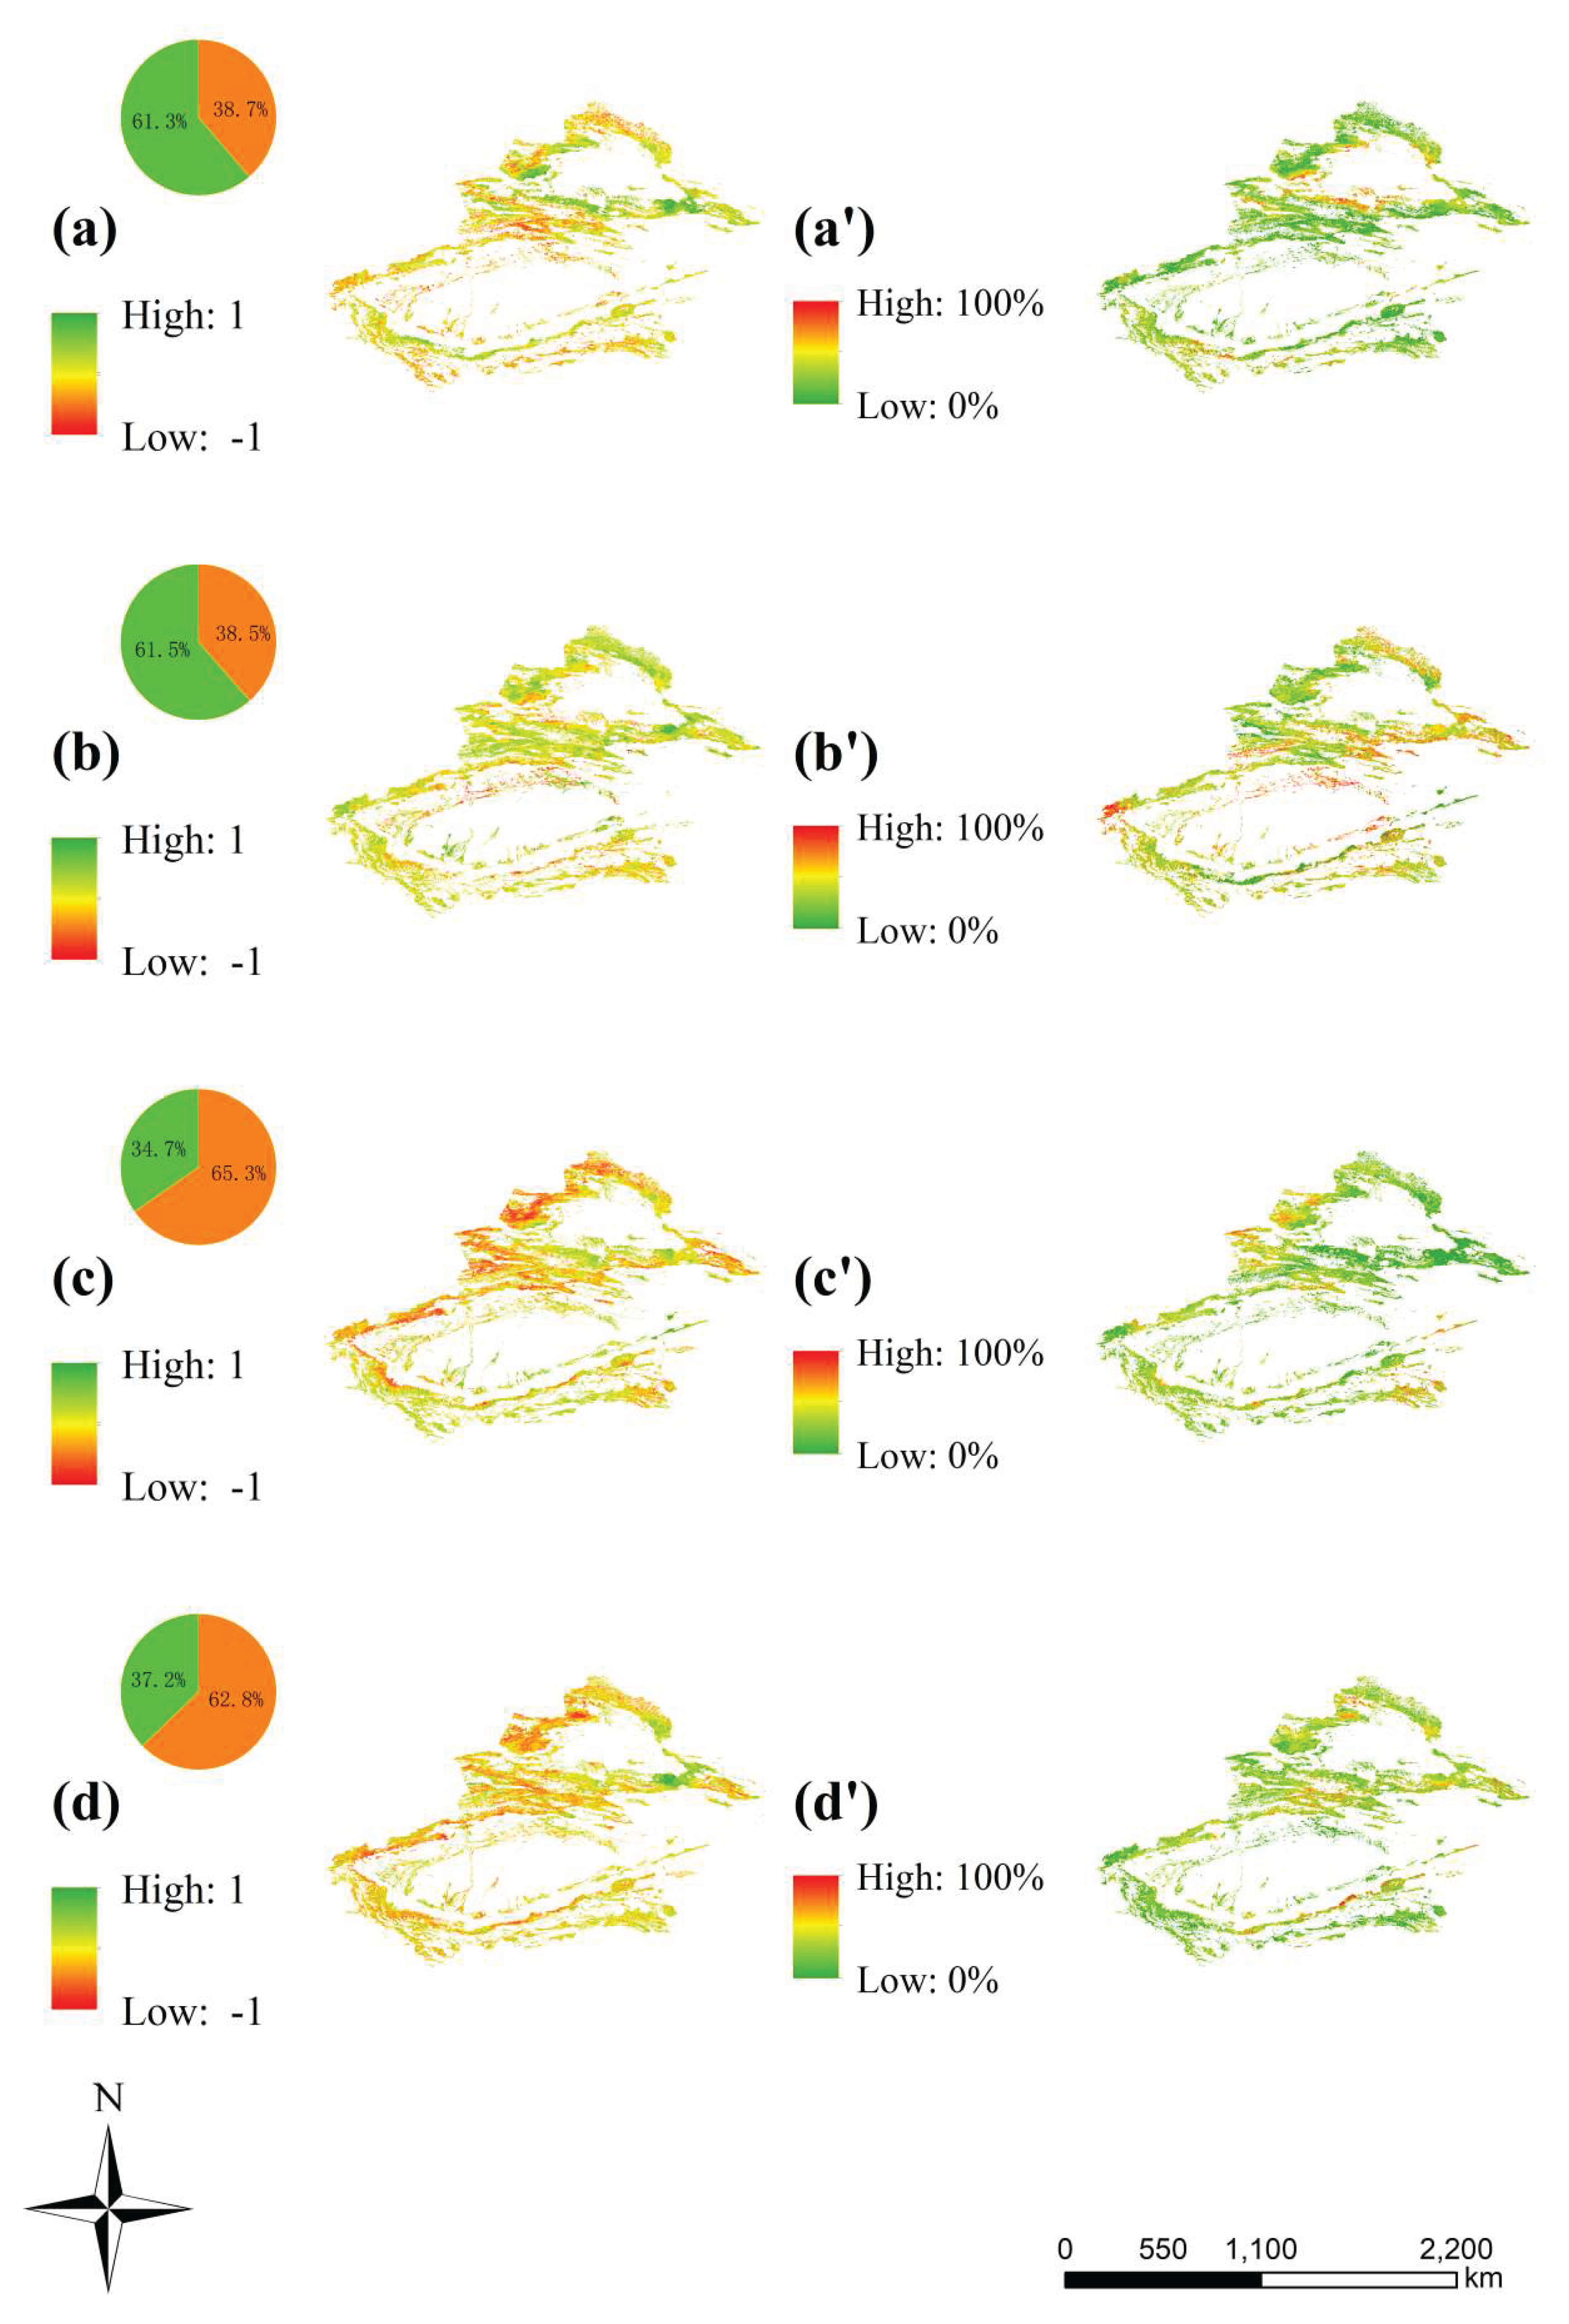
Figure 8.
(a) Distribution map of climate driving factors in Xinjiang; (b) Percentage of climate driving factors of different grassland types.
Figure 8.
(a) Distribution map of climate driving factors in Xinjiang; (b) Percentage of climate driving factors of different grassland types.
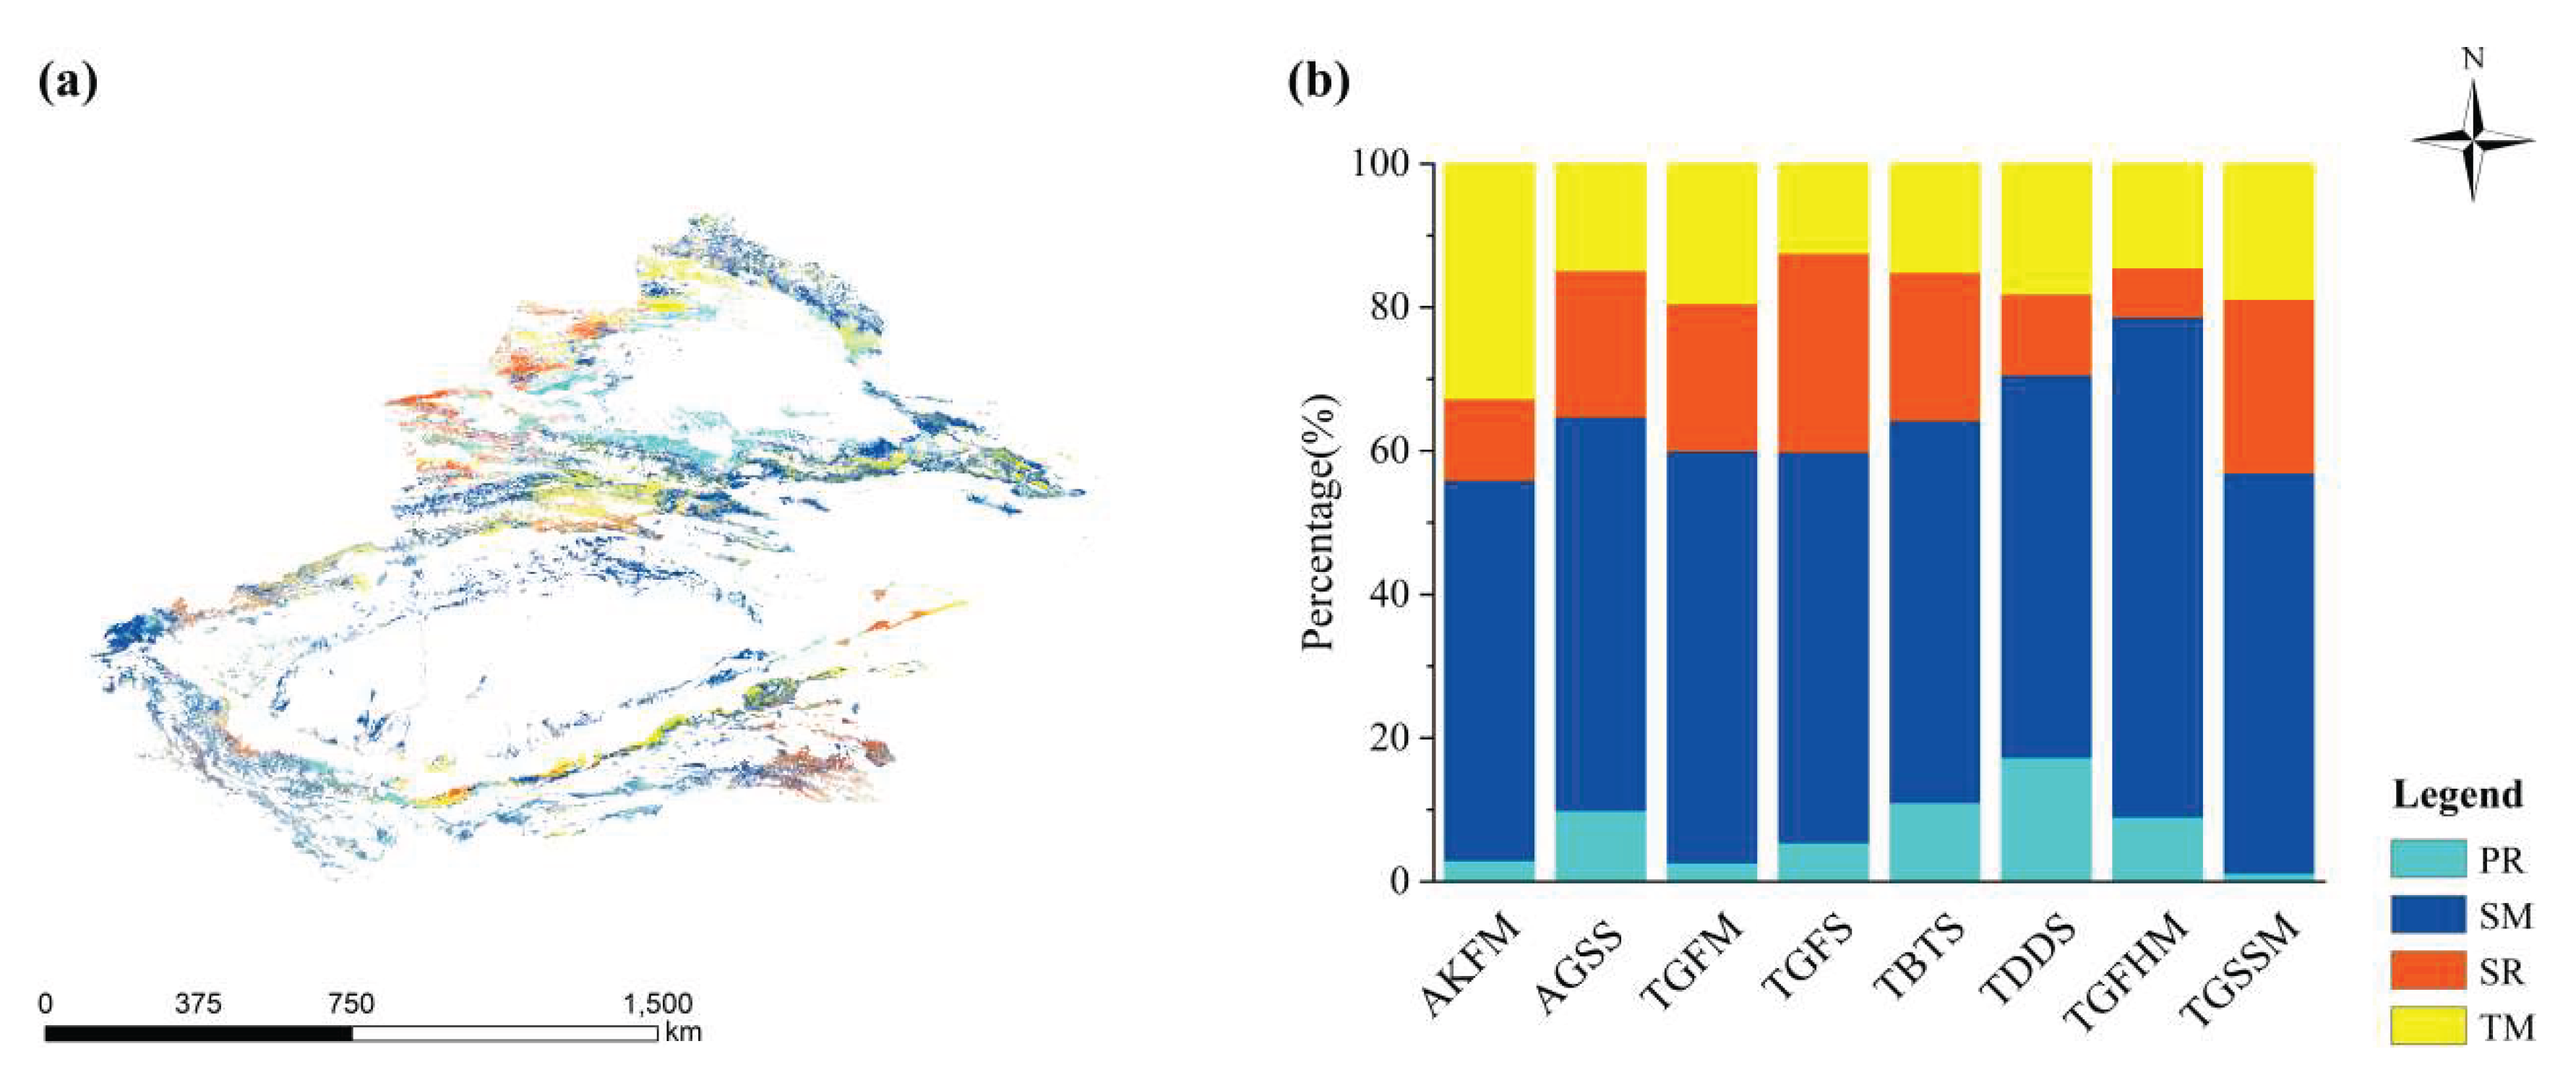
Figure 9.
(a) The relative contribution of climate to grassland FVC; (b) The relative contribution of human activities to grassland FVC; (a’) The absolute contribution of climate to grassland FVC; (a’) The absolute contribution of human activities to grassland FVC.
Figure 9.
(a) The relative contribution of climate to grassland FVC; (b) The relative contribution of human activities to grassland FVC; (a’) The absolute contribution of climate to grassland FVC; (a’) The absolute contribution of human activities to grassland FVC.
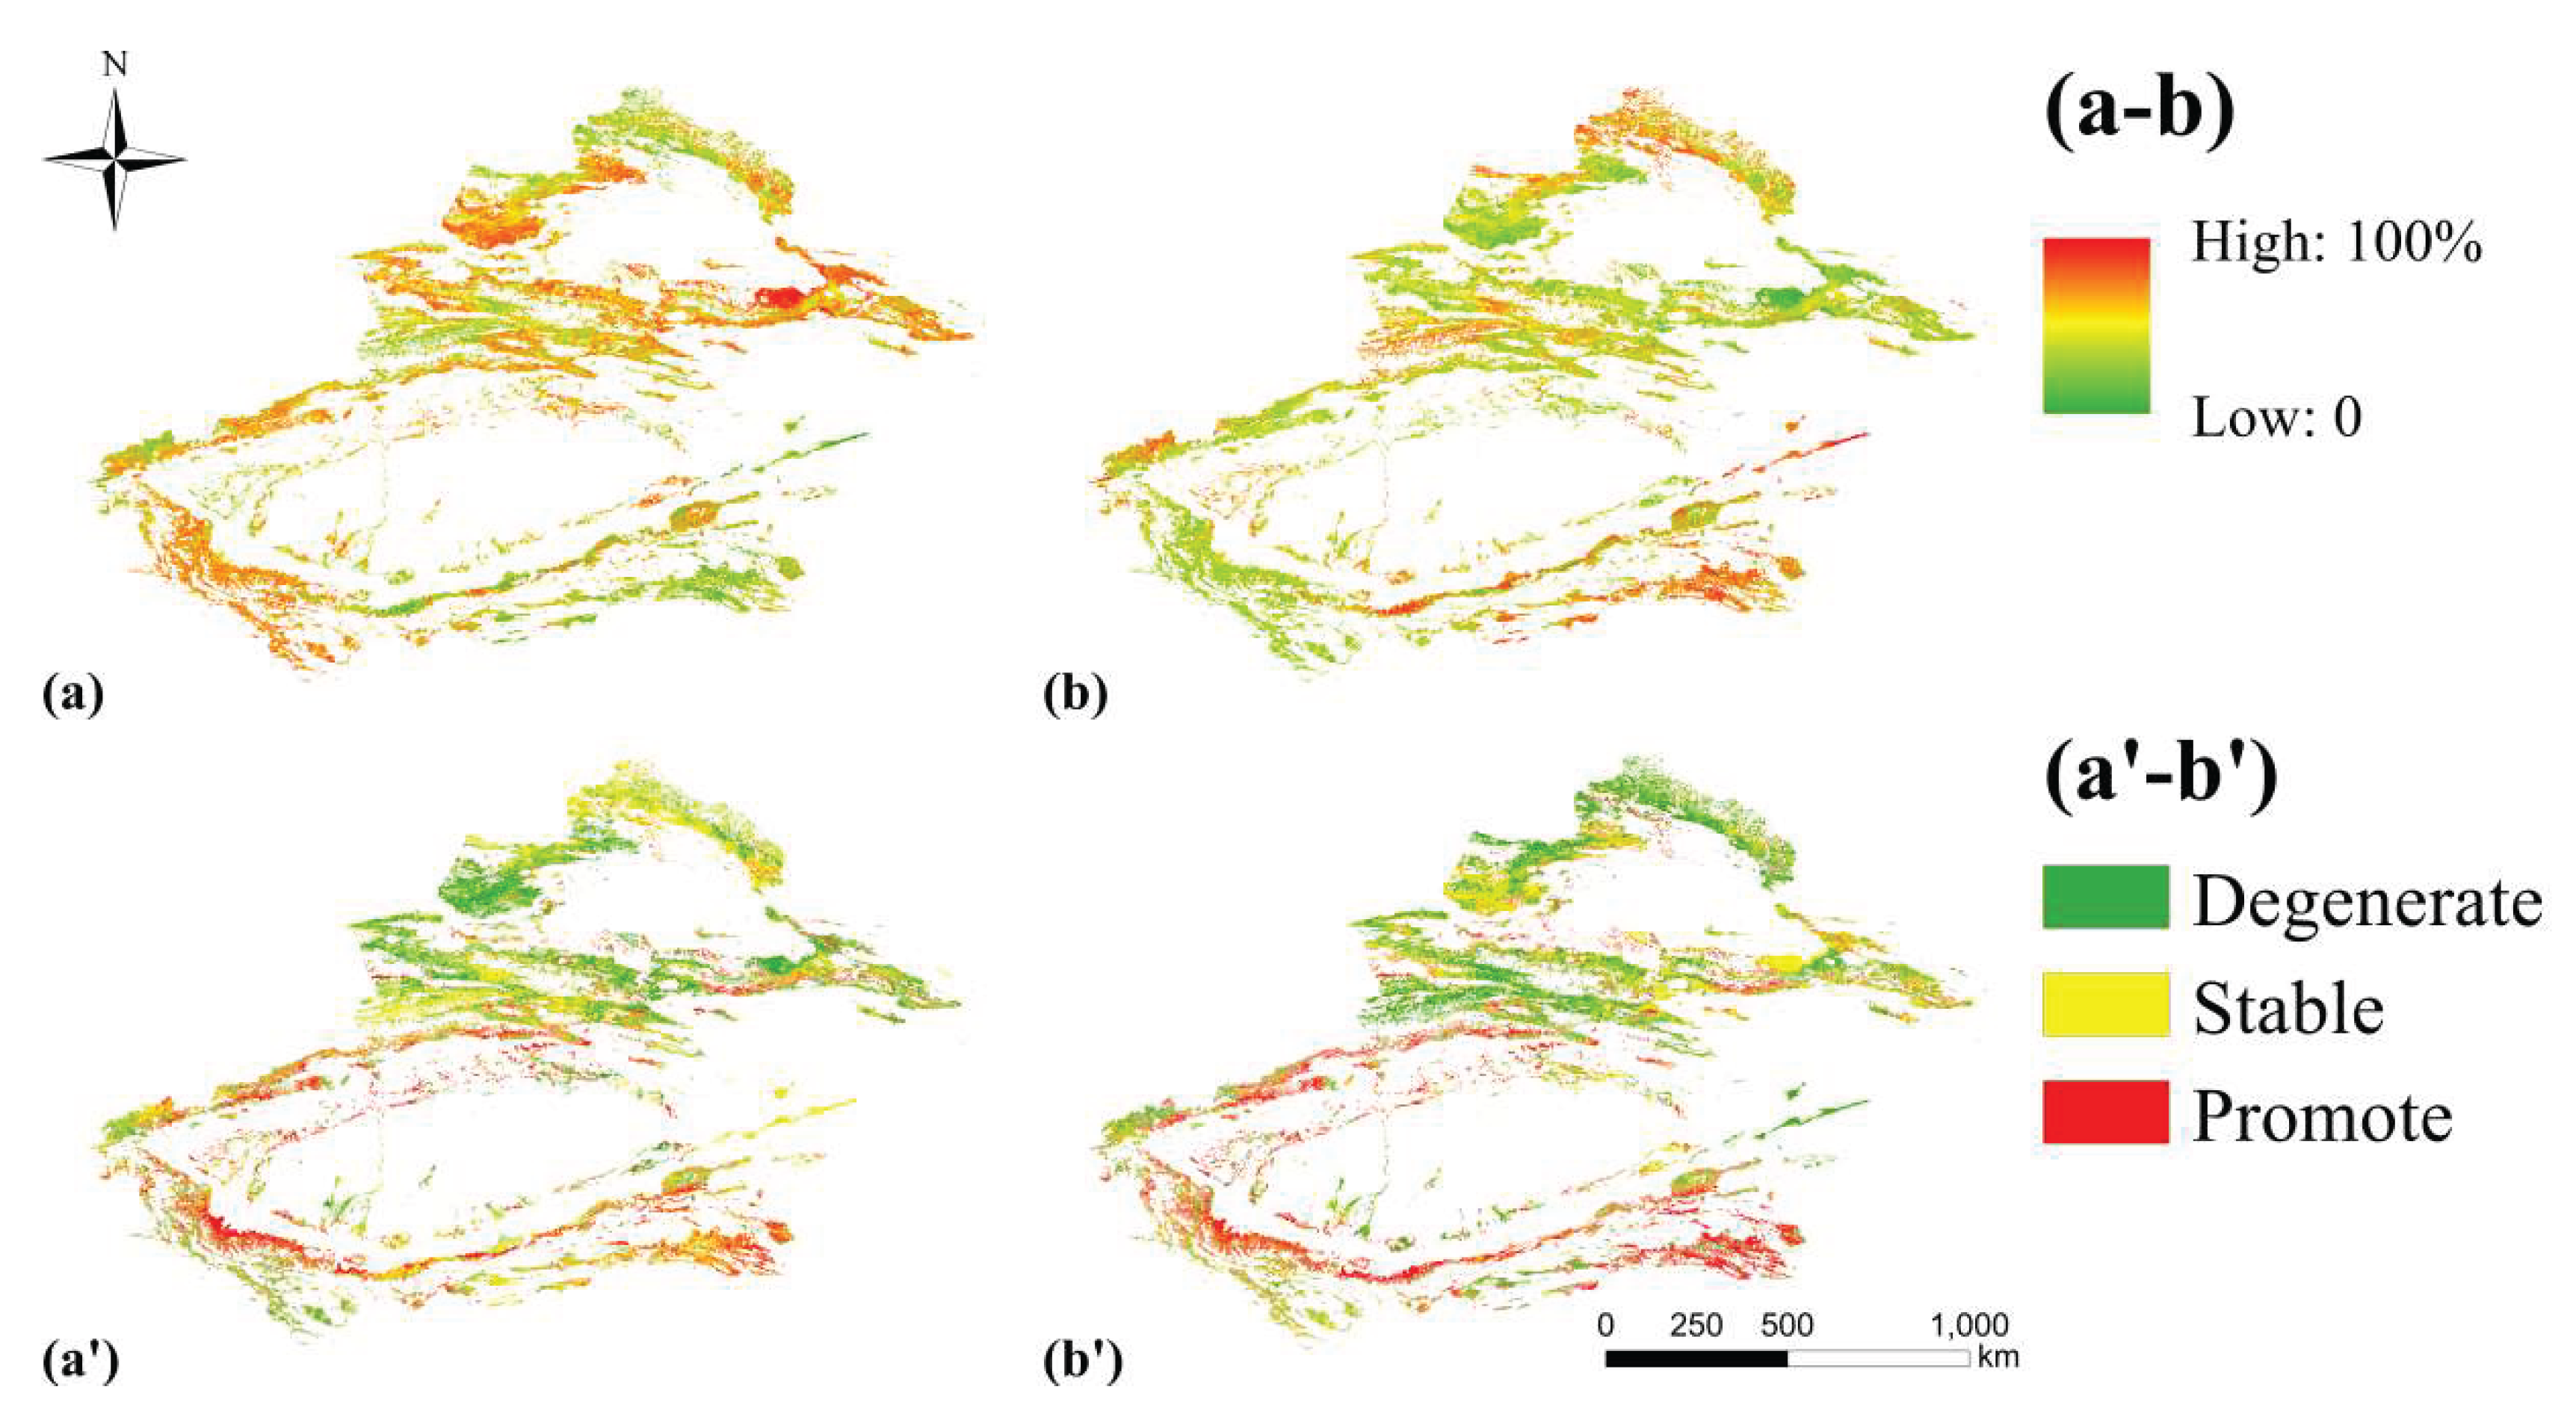
Figure 10.
(a) Grassland FVC climate and human activity-driven distribution in Xinjiang. (b) Percentage of grassland FVC climate and human activities driven by different vegetation types.
Figure 10.
(a) Grassland FVC climate and human activity-driven distribution in Xinjiang. (b) Percentage of grassland FVC climate and human activities driven by different vegetation types.
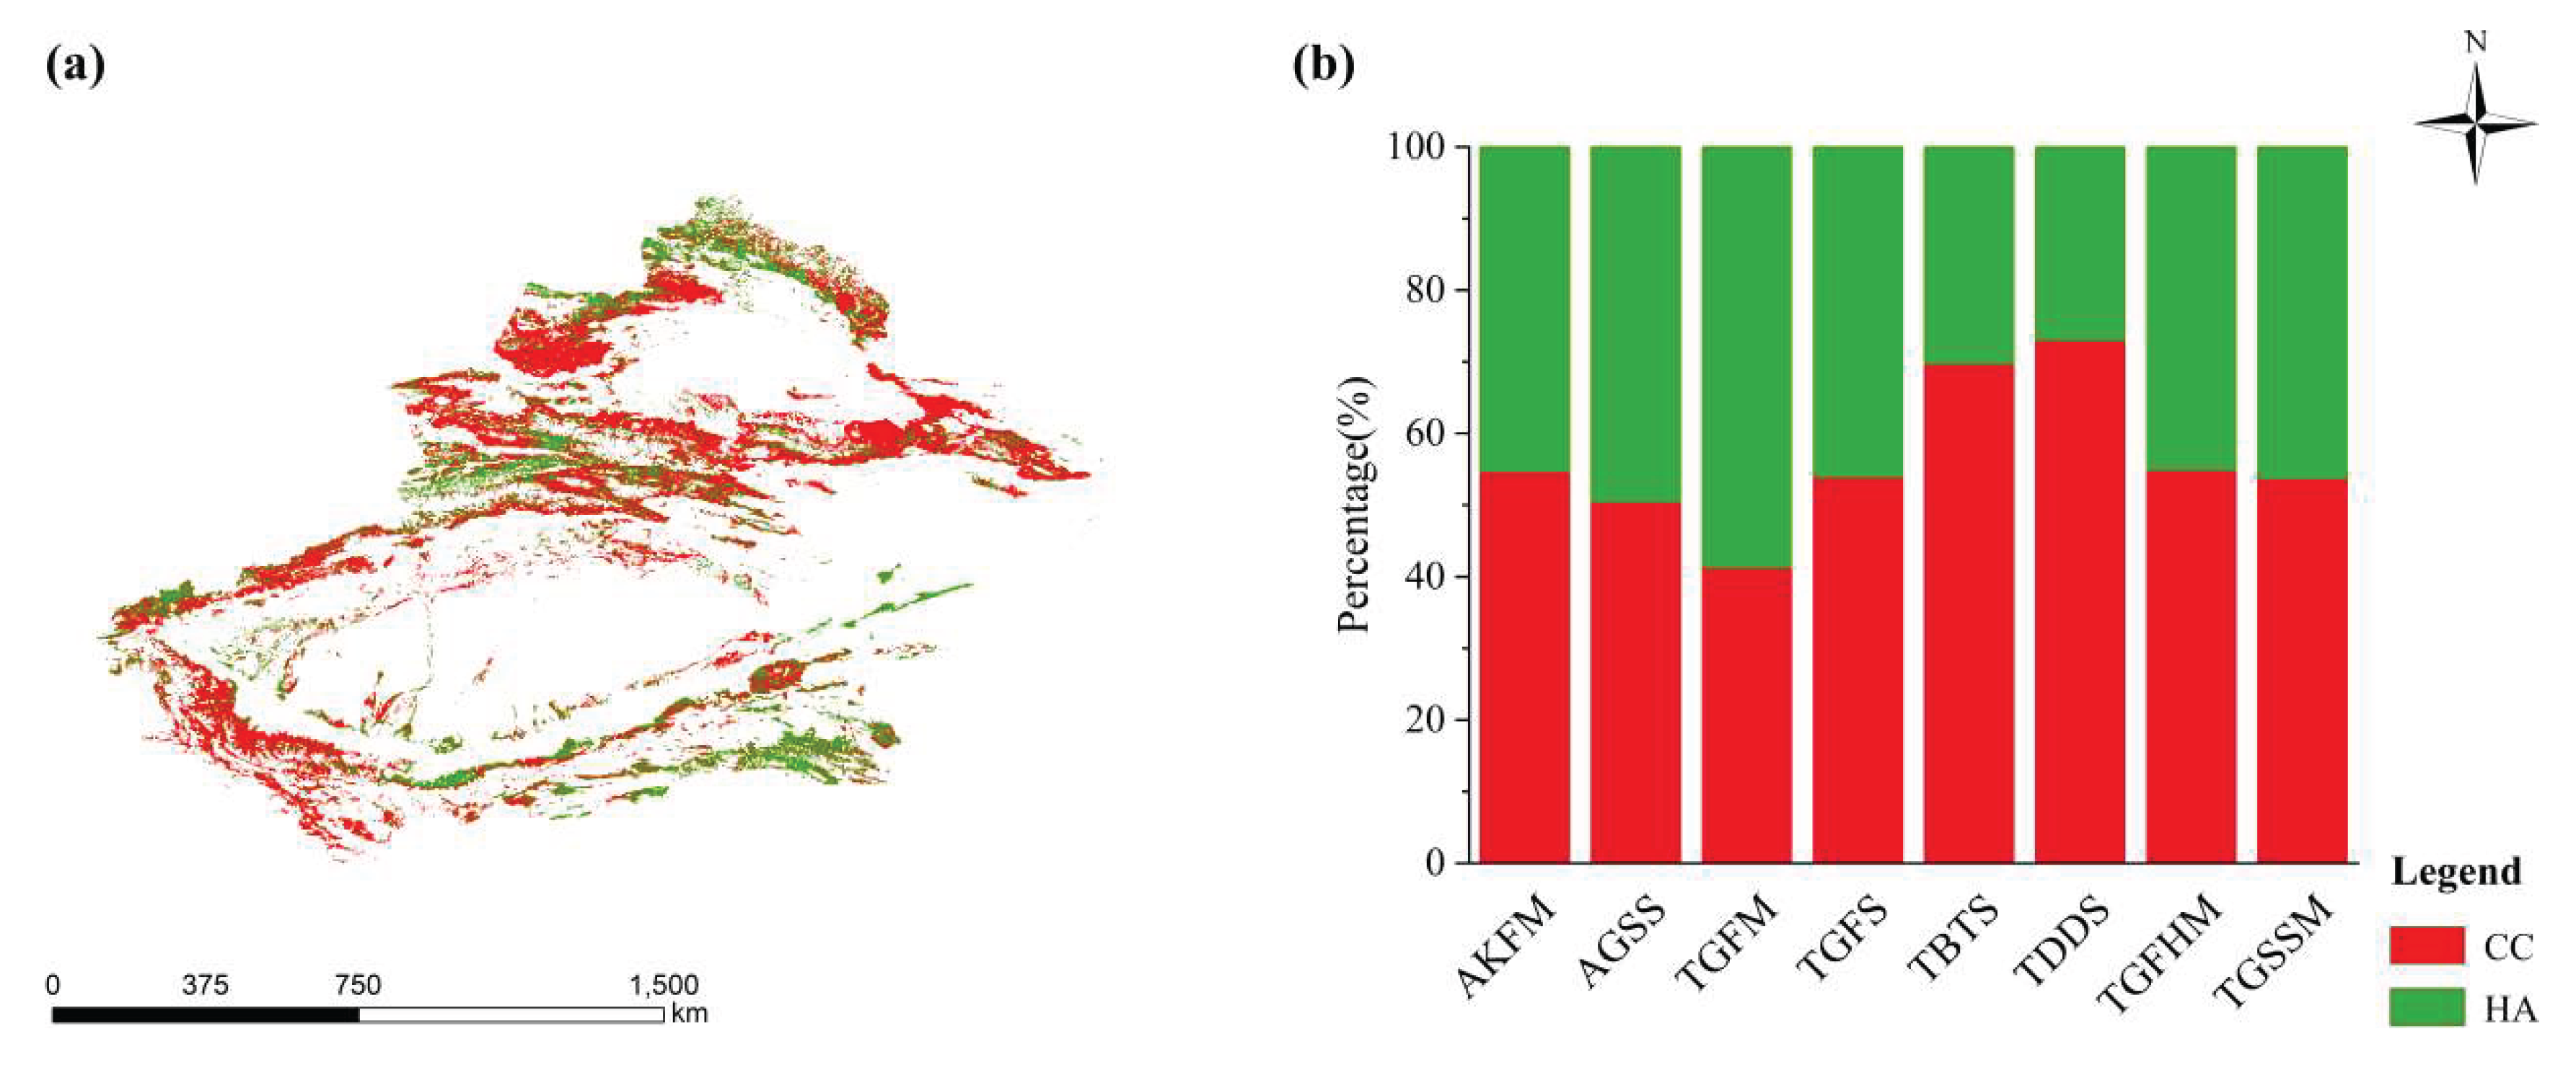
Table 2.
Classification of Mann-Kenddall test trend.
| β | Z | Trend Features |
| β>0 | Z<2.58 1.96<Z≤2.58 1.65<Z≤1.96 Z≤1.65 |
Extremely significant increase(ESI) Significant increase(SI) Slight significant increase(SSI) No significant increase(NSI) |
| β=0 | Z | Monotony(M) |
| β<0 | Z≤1.65 1.65<Z≤1.96 1.96<Z≤2.58 Z<2.58 |
No significant decrease(NSD) Slight significant decrease(SSD) Significant decrease(SD) Extremely significant decrease(ESD) |
Table 3.
Classification of Time Series Based on Hurst and Slope.
| β | Hurst | Trend Features |
| β>0 | 0<Hurst≤0.5 0.5<Hurst≤1 |
Anti persistence Increasing(APD) Persistence Increasing(PI) |
| β<0 | 0<Hurst≤0.5 0.5<Hurst≤1 |
Anti persistence Decreasing(APD) Persistence Decreasing(PD) |
Disclaimer/Publisher’s Note: The statements, opinions and data contained in all publications are solely those of the individual author(s) and contributor(s) and not of MDPI and/or the editor(s). MDPI and/or the editor(s) disclaim responsibility for any injury to people or property resulting from any ideas, methods, instructions or products referred to in the content. |
© 2025 by the authors. Licensee MDPI, Basel, Switzerland. This article is an open access article distributed under the terms and conditions of the Creative Commons Attribution (CC BY) license (http://creativecommons.org/licenses/by/4.0/).
Copyright: This open access article is published under a Creative Commons CC BY 4.0 license, which permit the free download, distribution, and reuse, provided that the author and preprint are cited in any reuse.


