
Submitted:
20 May 2025
Posted:
22 May 2025
You are already at the latest version
Abstract
Climate change has made weather more erratic and unpredictable. As a result, a growing need to develop more reliable short term Weather Prediction Models paved the way for a new era in satellite instrumentation technology, where Radar systems for meteorological applications became critically important. Recent advancements in Remote Sensing technology have come a long way since the early Weather and Climate Monitoring Systems of the 1960s. For instance, the APT TV Camera System, installed aboard the NIMBUS-1 satellite, was one of the pioneering meteorological technologies of its time. The next phase of satellite platforms is to leverage the advantages of Low Earth Orbit (LEO) based satellite constellation deployments for near-real time tracking of Atmospheric Hydrometers and Precipitation Profiles through innovative methods. These methods involve combining the collected Data into Big-Data lakes on Internet Cloud Platforms and constructing innovative AI-based Weather Prediction Models specifically tailored to Remote-Sensing. In the coming decade, the significance of recently implemented technology will form the basis for new applications in Aviation, Severe Weather Readiness, Energy, Agriculture, and more.
Keywords:
space-based remote sensing
; Radar
; multi sensor satellite constellations
; Neural Networks
; weather forecasting models
; cloud technology
; Radiometers
1. Introduction
In 2014, Neil deGrasse Tyson, a well renowned Astrophysicist, defined the Weather phenomena as what the atmosphere does in the short term, on an hourly or daily basis. this description draws support from the butterfly effect, a concept derived from Chaos Theory which states that a system’s sensitive dependence upon initial conditions can lead to small changes in one possible state, within a given state-space defining a deterministic non-linear system, creating large differences in a future state, conditioned by some probability of occurrence. That is why weather behavior is harder to predict due to its chaotic nature, especially in comparison to climate, which is defined as the long-term average of weather over a number of years, a long-term trend. Prior to the Satellite era, the invention of radio transmitters and the radiosonde, a small box equipped with weather instruments and a radio transmitter, enabled improved monitoring capabilities of land-based Weather observation stations worldwide by making them airborne, and launching them on balloons to high altitudes, a few miles above the ground. A method that mildly improved Weather forecasting observations.
At the start of 19th century, a growing inference started to form as Data pilled up from different environmental monitoring sources. This suggested that the Initial Assumption that we need to defend ourselves from the environment, which led to the formation of various environmental monitoring capabilities, was only half the story, as evidence showed that Humankind is capable of unintentionally altering the environment in unfavorable ways.
Driven by the broad assumption that humanity needs to protect itself from the environment, coupled with the emerging ability to launch Earth-Orbiting Satellites equiped with advanced instruments capable of monitoring the weather on a global scale - President Kennedy urged leaders during the 1960’s to support the establishment of the World Weather Watch (WWW). This initiative aimed to improve weather predictions, enhance event warning capabilities, and more. Only in the 1970’s did the realization that humankind is able to influence the environment transitioned into policy. Under the directive of President Nixon, measures were taken with the aim of reversing the negative environmental trends and protecting the environment from further harm caused by human activities.
One of the main triggers for the historical events outlined above was the launch of one of the first dedicated weather satellite TIROS-1, equipped with an Infra-Red observation system, on April 1st, 1960, by the United States, its objective was to test experimental television techniques designed to develop a global meteorological satellite information system. The reason scientists found value in satellite use for Meteorology is due to the fact that up until this point, collecting weather data from remote locations like the oceans and the arctics was impractical. as a result, there was a big Data-Gap which rendered constructing reliable weather forecasting Models impossible, that is until Satellite Technology came into fruition, providing men with near-real time data along with total global coverage of the atmosphere.
Satellites provide a complementary data collection tool that translates into added value which other data collection platforms such as pressure balloons, weather monitoring aircraft and ships, couldn’t provide. [1]
In this paper, we present a review of recent advancements in satellite instrumentation technology, remote sensing applications, and their role in developing near-real-time weather prediction models for a range of civilian and military sectors.
I. Orbit classification
Before discussing weather satellites can take place, one must understand where they are meant to be situated in space. For this purpose, we shall review the five kinds of planetary orbits.
a.) High Altitude Platforms (HAPs) - including the Stratospheric layer
b.) L.E.O – Low Earth Orbit
c.) M.E.O – Medium Earth Orbit
d.) G.E.O – Geostationary Earth Orbit
e.) H.E.O – Highly Elliptical Orbit
Placing weather monitoring instruments in the stratospheric layer, approximately 15 to 50km above ground, offers certain advantages. Since most weather-related phenomena occur in the lower Tropospheric layer (0-12Km height), this location facilitates easier monitoring of weather conditions in a surface area covered locally below a High-Altitude Platform (HAP), placed at a given geographic location. HAPs placed at altitudes of 17-24Km, where wind velocity is minimal, can maintain their location without drifting by using GPS technology and a low thrust mechanism installed on board. This exploites the Low-Pressure conditions of the stratosphere. In addition, HAPs offer near-zero time delay in radio transmission path between them and ground stations. [2,3].
Other weather monitoring instruments, such as satellites classified as operating at LEO maintain the lowest possible delay in a radio transmission path between a satellite and any ground station. These satellites function at altitudes ranging from 300km to 2,000km, placed below the first Van Allen radiation belt. MEO classified satellites operate at altitudes ranging from 4,000km to 8,000km and inherently introduce longer delay times compared to LEO satellites. GEO classified satellites have a zero inclanation angle, which means that their angular rate of change aligns with that of the planet they orbit. This synchronization causes the satellite to appear stationary from the ground - hence the term ‘Geostationary’. The orbit is referred to as the Equatorial Plane, or Clarke Satellite Orbit, but do not cover the regions of the earth poles. Its Perigee and Apogee locations vary depending on the planet in question. The advantage maintaining such an orbit is the larger area coverage due to the increased height, while the obvious shortcoming is the longer delay times. HEO classified satellites revolve around a plant located at one of the elliptical orbit’s focal points. [4]
Satellite constellations are common at the LEO or MEO level, as the area coverage provided by a single satellite is pretty small due to its low altitude. For this reason, a group of satellites is organized to maintain inter-connections along with connections with ground stations or user agents, to achieve larger area coverage. In contrast, a GEO use case is simpler by comparison, one satellite is enough to achieve large surface coverage of the Earth, up to 42% of the plant’s surface except the polar regions.
II. Satellite Sensor Instrument technologies
The above historical introduction thus opens the door for a discussion about a variety of Satellite Sensor
Instrument technologies which will continue to build up our understanding of what’s to come in the modern era – a topic covered in the following section.
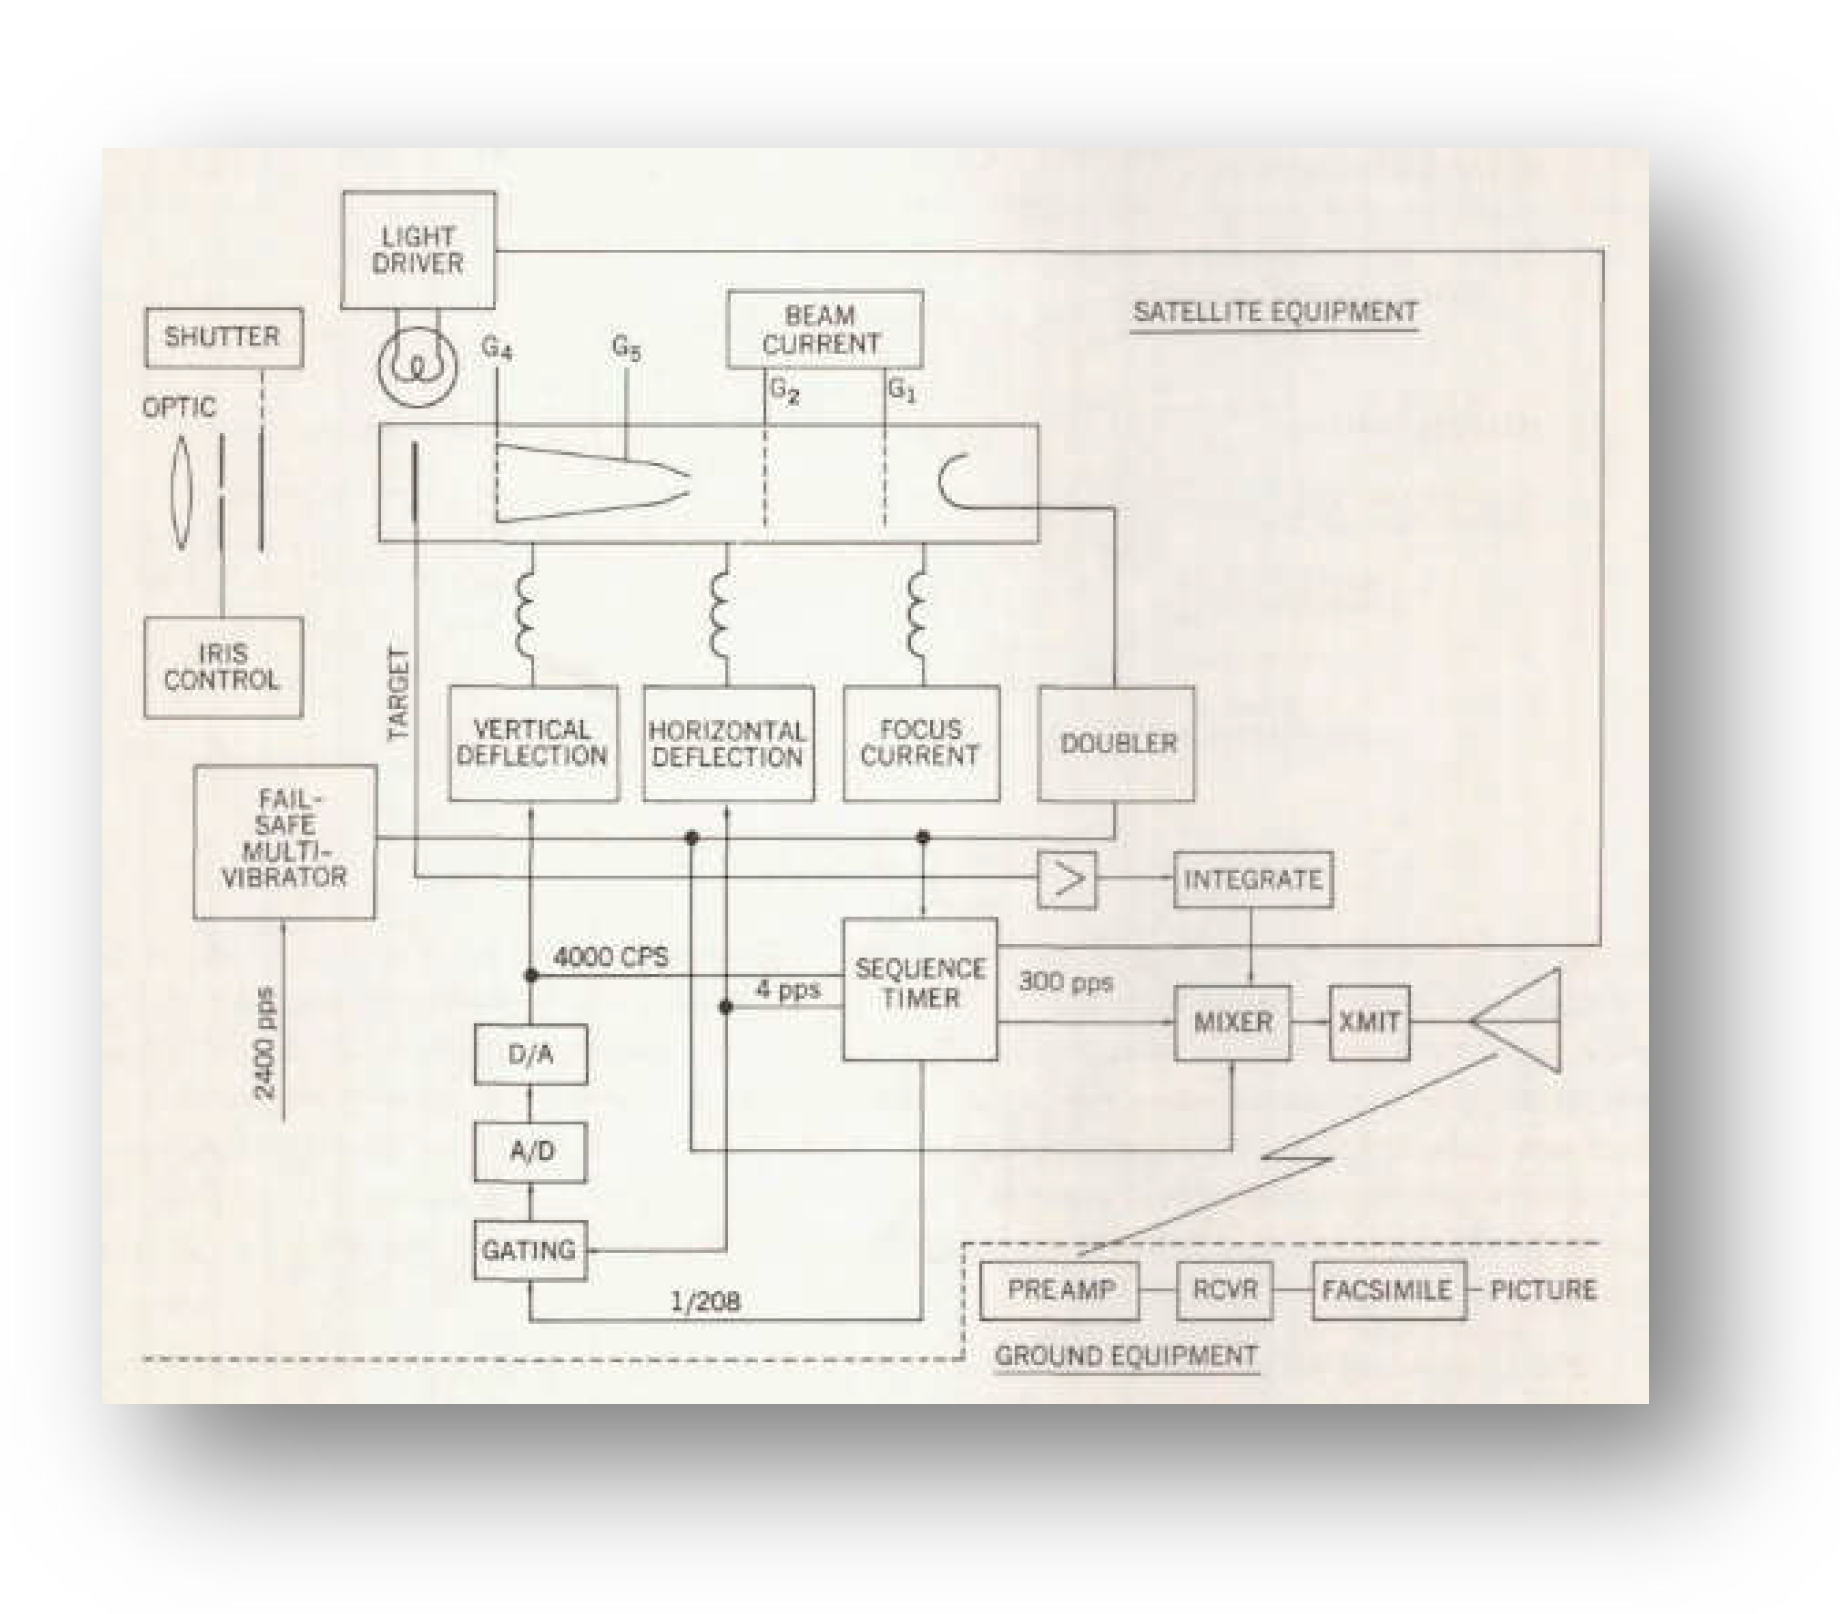
The Automatic Picture Transmission (APT) TV Camera System for Meteorological Satellites [5] was installed on NIMBUS-1, a Meteorological LEO Satellite launched on August 28th, 1964, it was specifically designed to provide global coverage of the earth’s cloud formations and contribute to various aspects of atmospheric research. The 3-Camera System is operated during daytime and an Infrared Scanner is operated during the night, storing data about cloud formations on a magnetic tape for continuous real-time picture transmission using the onboard communication system. The mechanism that allows the recording of cloud formations operates as follows. Optical instruments onboard the satellite were used to focus upon a specific cloud map below the satellite onto the face of a storage vidicon. This image was converted into an electrical signal by an electron beam readout. A subcarrier then modulated the signal, which in turn, modulated the VHF transmitter. The signal was transmitted through the antenna and receiver on the ground, where the image was recreated on a facsimile unit in real time. When positioned in a 900km altitude circular orbit, The lens in the APT camera were able to produce a picture width of 1720km on each side – higher orbits could produce a bigger sky coverage area in a single snap of the lens. [5]
Figure 1.
APT picture coverage - See Ref [5].
Figure 1.
APT picture coverage - See Ref [5].
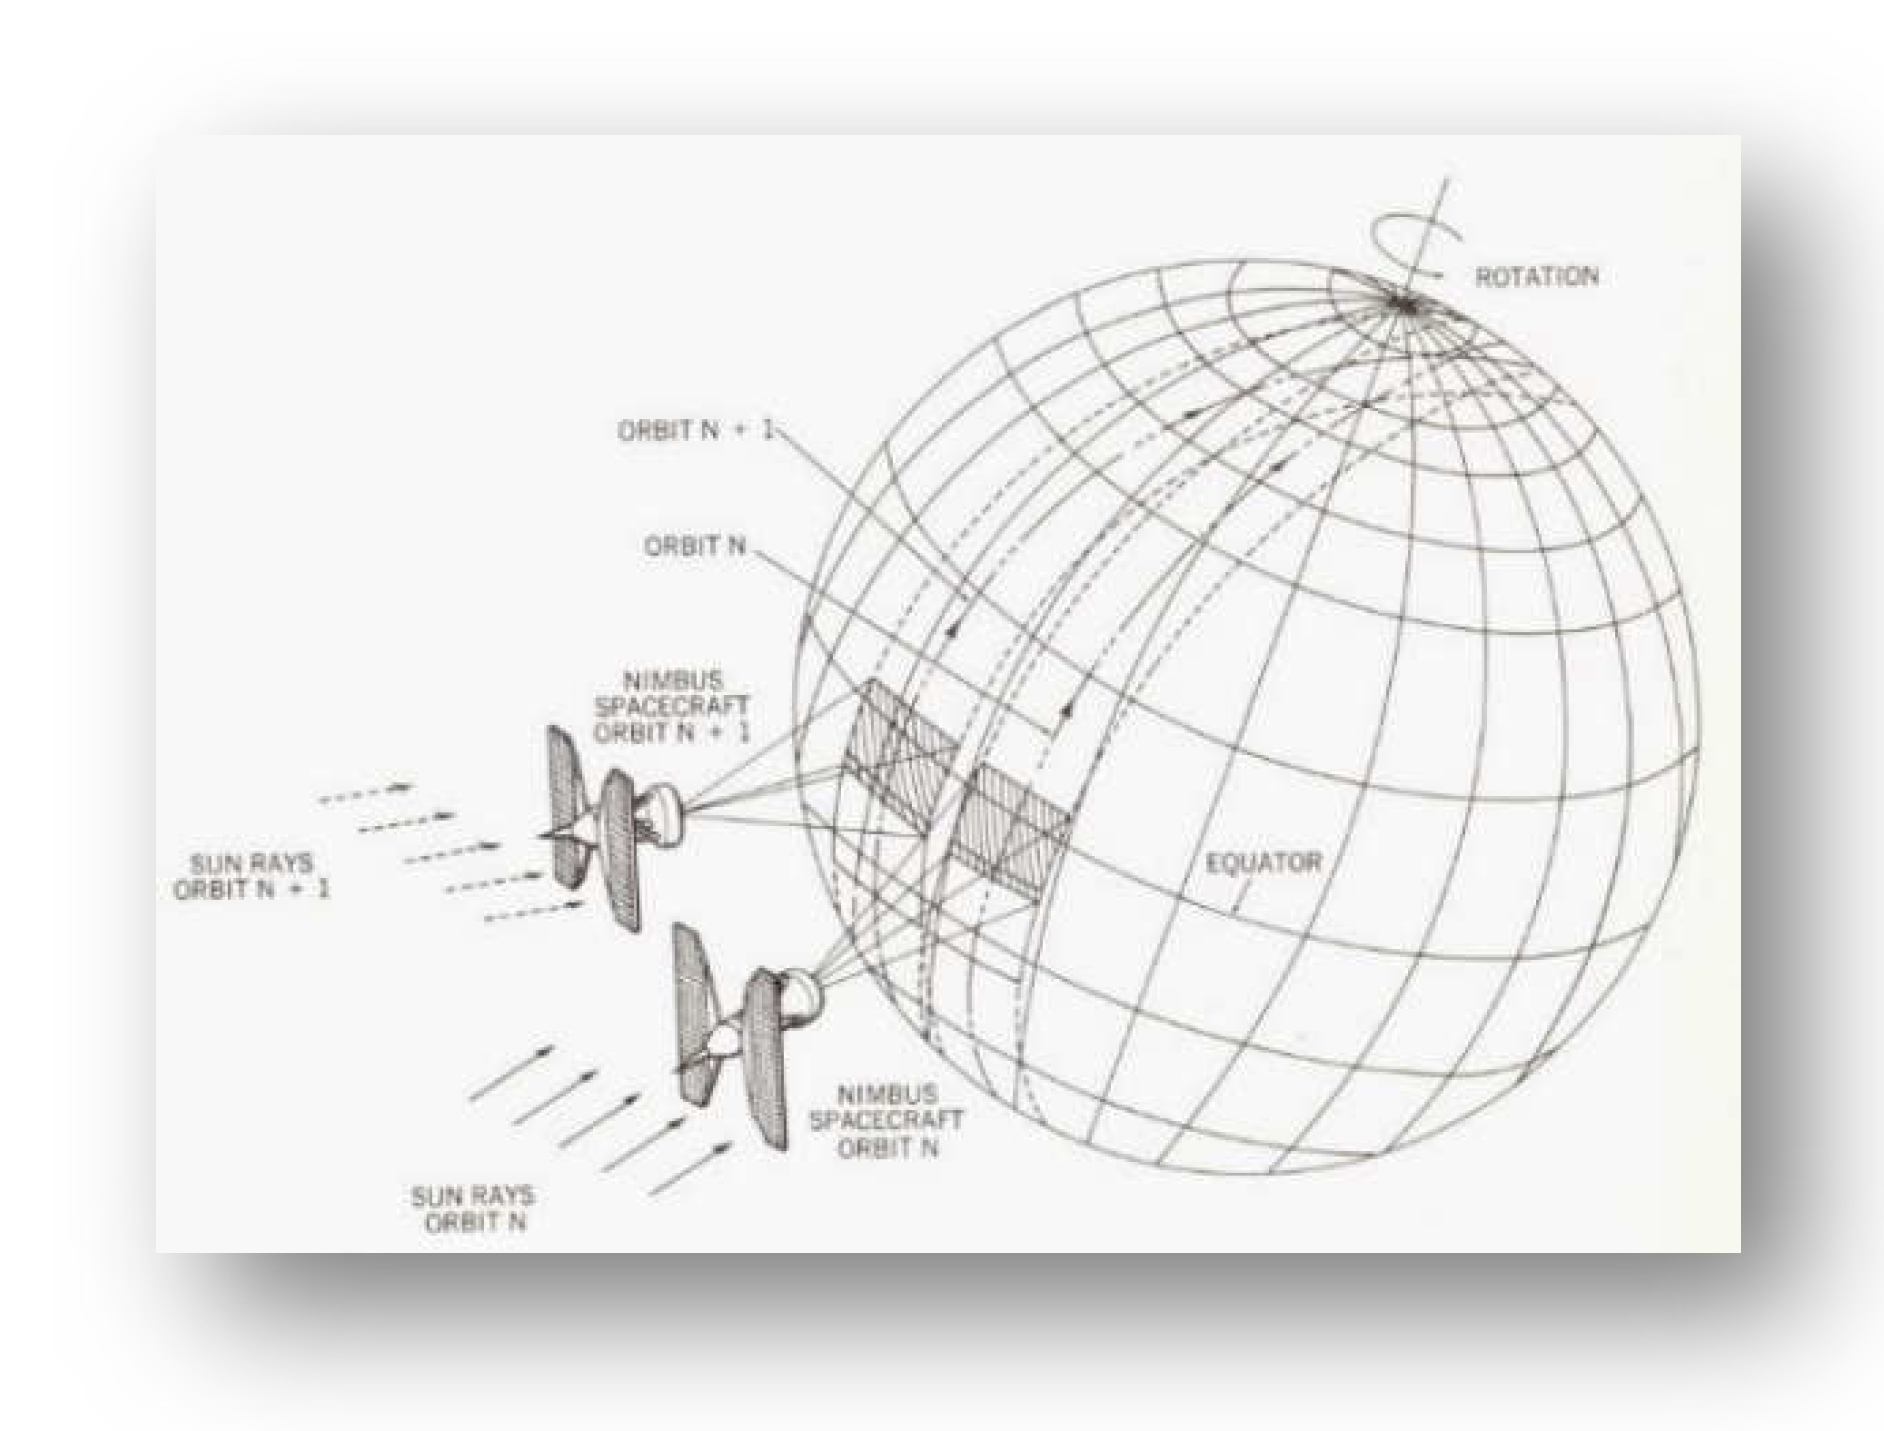
Figure 2.
Block diagram of the APT system - See Ref [5].
Figure 2.
Block diagram of the APT system - See Ref [5].
Microwave (MW) Remote Sensors
Due to a development trend that began as early as the 1960s with the launch of the NIMBUS-1 and continued through later missions like the LANDSAT Program in the 1970s, advancements in Image and Signal processing of Satellite Imagery, led to the emergence of a new class of Instruments. These instruments, categorized into Active and Passive sensors, possess far more advanced capabilities than the APT systems of the 1960s. Each operates differently and has its own applications. [6]
Radiometers are Passive Microwave sensors used to record thermal emission of MW signals propagated by the sun towards the earth. These emissions typically partially backscatter from the earth’s surface and are influenced by the physical temperature and electrical properties of the target surface or volume to be measured. The backscattered signals are modulated by the composition of the surface or volume they meet. This information is utilized upon reception, to create an emissions profile for the target. That is why those instruments are also referred as Daylight sensors due to their dependence upon the sun as a propagating MW source. They usually operate over a large Bandwidth and are based on real-aperture antennas which have a large physical area that is opaque to radiation at certain wave lengths.
Sounders, a derivative instrument of the Radiometers sub-class, are specialized instruments designed for extracting vertical profiles of atmospheric parameters.
Active MW Sensors, such as Radars, are not bound by daylight conditions since they actively transmit MW signals, eliminating reliance on the sun as a MW source.
A Meteorological Radar is a great instance typically making use of real-aperture antennas to transmit modulated pulses, by using Doppler and range processing, it constructs backscatter images, to detect rain, wind, snow, hail, cloud, ocean surface wave height, frequency and direction, temperature, wind speed, amount of water in the atmosphere, and Vertical Precipitation Profiles. This data is used to provide event warnings and short-range weather forecasts.
III. Understanding the Physical Principles of a Meteorological System [7]
The principles underlying the desing and operation of Meteorological Radar essential for addressing weather forecasting effectively. In this section we introduce some general concepts related to this subject.
It begins with defining the electromagnetic interaction of EM waves with individual molecules. The total internal energy of a molecule can be categorized into 3 types of energy states - electronic, rotational and vibrational energy.
These energy states define quantum states and as a consequence, dictates how an atom responds to EM waves with energy values corresponding to between energy states. This interaction leads to the creation of absorption and emission spectra due to transitions between energy states. Each atom has unique energy differences between states, therefore when an EM wave with energy at specific frequencies interacts with an atom, absorption and scattering spectral lines are created. From these graphs one can infer which types of atoms constitutes the molecules in question.
From a spectral graph one can derive an absorption coefficient. Since a spectral line have tails that extend over a certain bandwidth, it is necessary to sum the contributions of all frequency lines. Based on this principle, a MW Propagation Model was developed in the 1980’s. this model computes the gaseous absorption coefficient () as the sum of the oxygen absorption coefficient and the water vapor absorption coefficient, for a Clear-Sky Atmosphere. That is,
The summation is over 44 Oxygen spectral lines and 34 Water vapor spectral lines, calculated as a function of line strength and shape function – these are influenced by temperature (T), barometric pressure (P), and the partial pressure of water vapor () at different Heights in the atmosphere (Z).
In light of these principles, it becomes apparent that the choice of frequency is of critical importance, and depends on the parameters one seeks to remotely identify using spectral absorption or emission lines. While the discussion thus far has focused on examining a Clear-Sky Atmosphere, analyzing an atmosphere containing Extinction Hydrometeors such as rain, clouds, snow, or fog particles – introduces both absorption and scattering phenomena. In such cases, estimating the Volume Extinction Coefficient becomes essential. This coefficient depends on density, shape, size distribution, and dielectric properties of the particles inside the Volume interacting with the propagating EM waves.
For this, we assume the interaction occurs between EM waves and Spherical Particles inside the Volume. This allows us to discuss Power Density, , of an EM wave incident upon a particle with a cross-section A and a radius r.
Figure 3.
Self. Particles hit by EM waves.
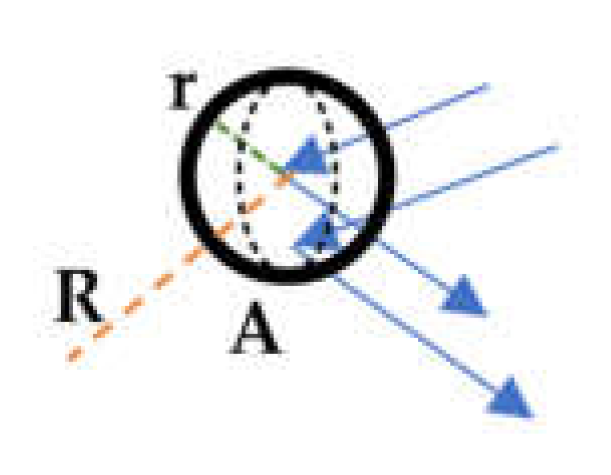
A portion of the energy is absorbed, while the reminder is scattered in all directions within a radius R from the center of the particle outwards. As a consequence, we can define an Absorption Cross Section
where is the absorbed power. The power scattered by the particle at a distance R, is calculated as the spherical integral over the surface of a sphere with radius R,
with being the power density of radiation scattered in directions at a distance R from the particle. The Scattering Cross Section is therefore defined as
The total power extracted from the EM wave is and the extinction cross section is defined as
Since we are interested in Meteorological applications, our focus is on the backscattering power towards the Radar - , acting as an Active MW Sensor. Therefore, the backscattering cross section can be defined as
At this point the discussion about a single particle can be broadened to a Volume occupied by many particles. Therefore, a Cross Section of a Volume is the algebraic sum of Cross Sections of all particles within that Volume. Hence:
(1) The Volume Scattering Coefficient is defined as:
(2) The Volume Extinction Coefficient for clouds is defined as:
(3) The Volume Backscattering Coefficient (also called Radar Reflectivity) is defined as:
for a Drop Size Distribution,
the partial concentration of particles per unit Volume and increment of radius r.
(4) The calculation of the Volume Extinction Coefficient () in the presence of Precipitation (Rain for instance) is a bit different. It requires considering another Drop-Size Distribution. This distribution, which represent the number of drops with radius r per unit volume, was developed by Marshall and Palmer in 1948. Their model, tailored for rainfall intensities ranging from 1 to 23 at the ground surface, provides a highly accurate result.
- General Note – the calculation of coefficients is more complicated than what has been discussed thus far due to additional factors not covered here such as wavelength () dependence stemming from Rayleigh\Mie approximations, the height (Z) of particles in the Atmosphere, penetration depth, etc.
The theory outlined in this section laid the foundation for a simplified depiction of the Radar Equation for Meteorology applications, which conveys a Theoretical description of the principle upon which the operation of a Short-Pulse Radar relies – reception of power absorbed by the Radar, which depends on the degree of Backscattering from a batch of particles dispersed in a finite volume in the Atmosphere, at some Distance (R) from a transmitting Short-Pulse Radar with a given Antenna Gain () and some transmitted Wavelength ().
being the total one-way path attenuation between the Radar and the Volume at a Distance (R):
Neglecting factors such as beamwidths at half power, Pulse length, etc. The amount of received power based on the frequencies transmitted towards a volume, serves as an indication as to the composition of the Volume. This, in turn, contributes to creating a Precipitation Profile (as in the outlined Rainfall instance) for a part of the Atmosphere at a given time, thus concluding the Theoretical description of the principles underlying the operation of Meteorological Radars.
IV. Weather Forecasting Models
We have detailed a variety of instruments and their products, such as Sounders and Radars, but leveraging them has been an enormous challenge due to one main factor that hasn’t yet been dealt with.
Recapping our initial discussion about the difference between Climate and Weather, it becomes clear that a Continuous flow of data is of great importance for formulating a shot-term forecasting Model for Weather applications. The term “Satellite Revisit Rate” best defines the degree of data flow as it essentially represents the time elapsed between two consecutive observations of the same point on the Earth’s surface by a Satellite. The higher the Revisit Rate, the higher the refresh rate of Data acquired by the Satellite, which enhances the accuracy and feasibility of Near-Real time Weather Forecasting Models, opening the door to new applications. Until today, Satellite Revisit Rates were pretty low:

Table 1.
Historical Satellite Revisit Rates.
| Satellite Systems | Revisit Rate | Date of operation |
|---|---|---|
| TRMM | 3 days | 1997-2015 |
| CloudSat | 16 days | 2006-present |
| GPM | 3 days | 2014-2028 |
| RainCube | Limited | 2018-2021 |
| EarthCare | 16 days | 2023 |
| INCUS | Limited | Start - 2027 |
Internalizing the importance of revisit rates to the scalability and accuracy of Forecasting Models, while Leveraging decades of knowledge and advancements in remote sensing, new missions were launched to enhance understanding of Earth’s global water cycle and investigate atmospheric convective systems, cyclic storms, and Precipitation processes using Radar and Radiometer technology.
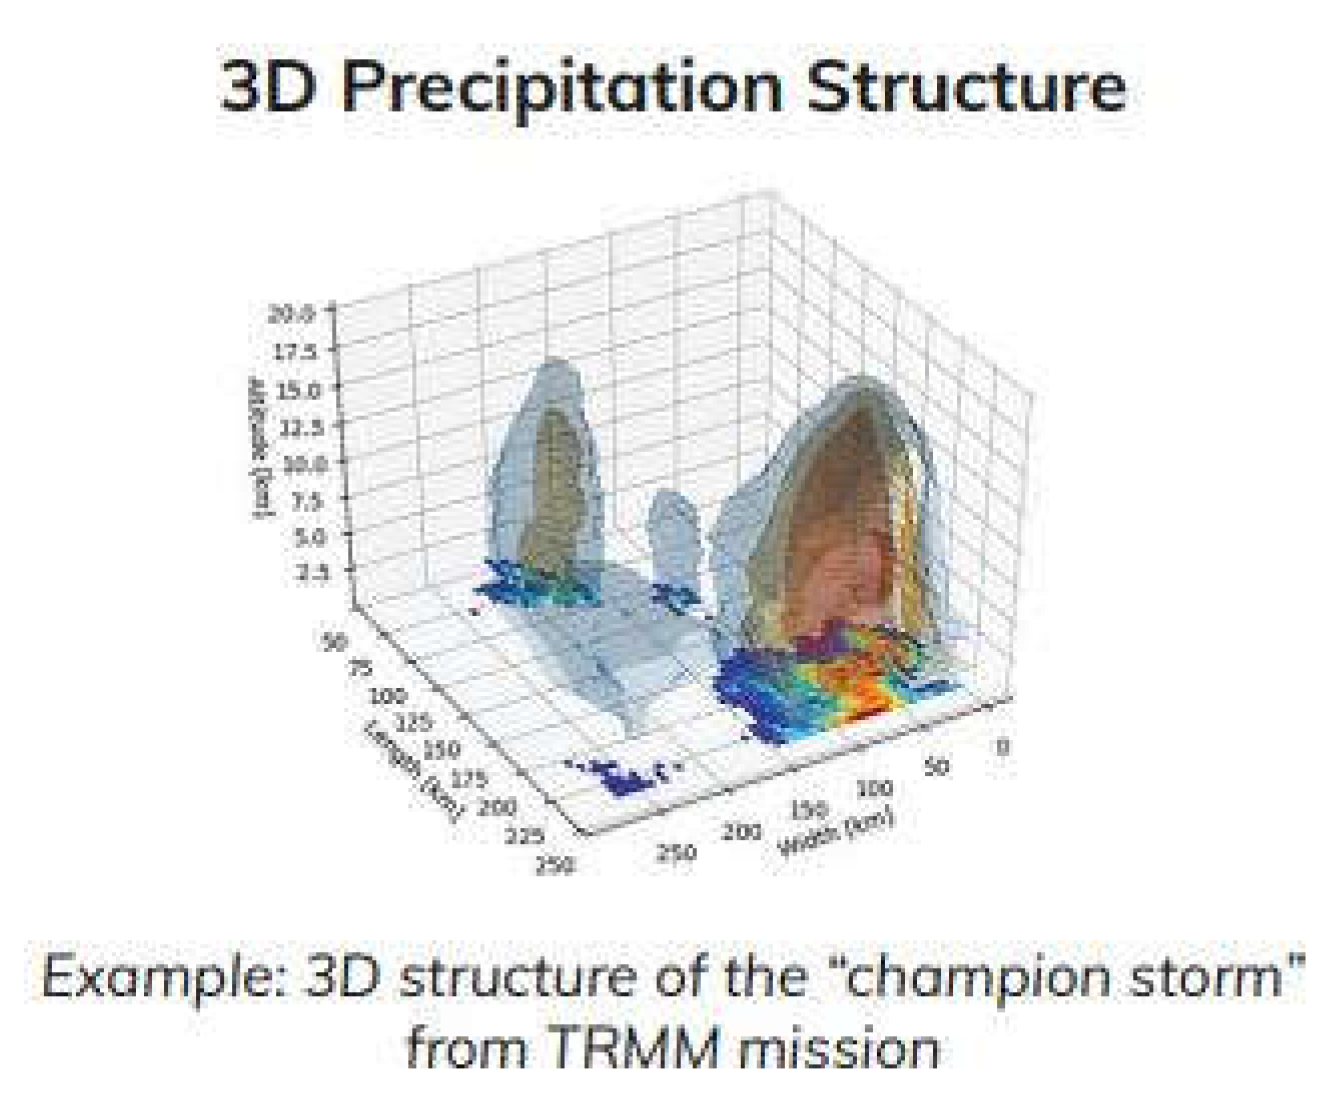
One instance would be the launch of the Tropical Rainfall Measuring Satellite Mission (TRMM) to LEO, an outcome of a joint venture between NASA and the Japanese Space Agency (JAXA) on November 27th, 1997. TRMM’s goal was to gain knowledge about global energy and water cycles by observing the time and space Distributions of tropical rainfall, along with a variety of associated Hydrometer structures and heating distributions over tropical and subtropical regions. This was achieved using onboard instruments such as a Precipitation Radar (PR), which provided a depiction of the 3D structure of rainfall and vertical distributions, as well as quantitative rainfall measurements over both land and ocean. The PR comprised a 128-element active phased-array system operating at 13.8GHz. The system Assembly was of a Transceiver composed of 128 solid state Power Amplifiers and LNAs (Low Noise Amplifiers) which were selected in each time step by a Circulator, periodically switching between transmission and reception states while sharing the same Antenna. This was followed by PIN-Diode Phase Shifter elements which also included an integrated Divider/Combiners, a 16-Branch Divider/Combiner, intermediate Driver Amplifier, and a Signal Processing Sub-system which included a Frequency Converter, an IF unit, and a System Control & Data Processing unit. [8]
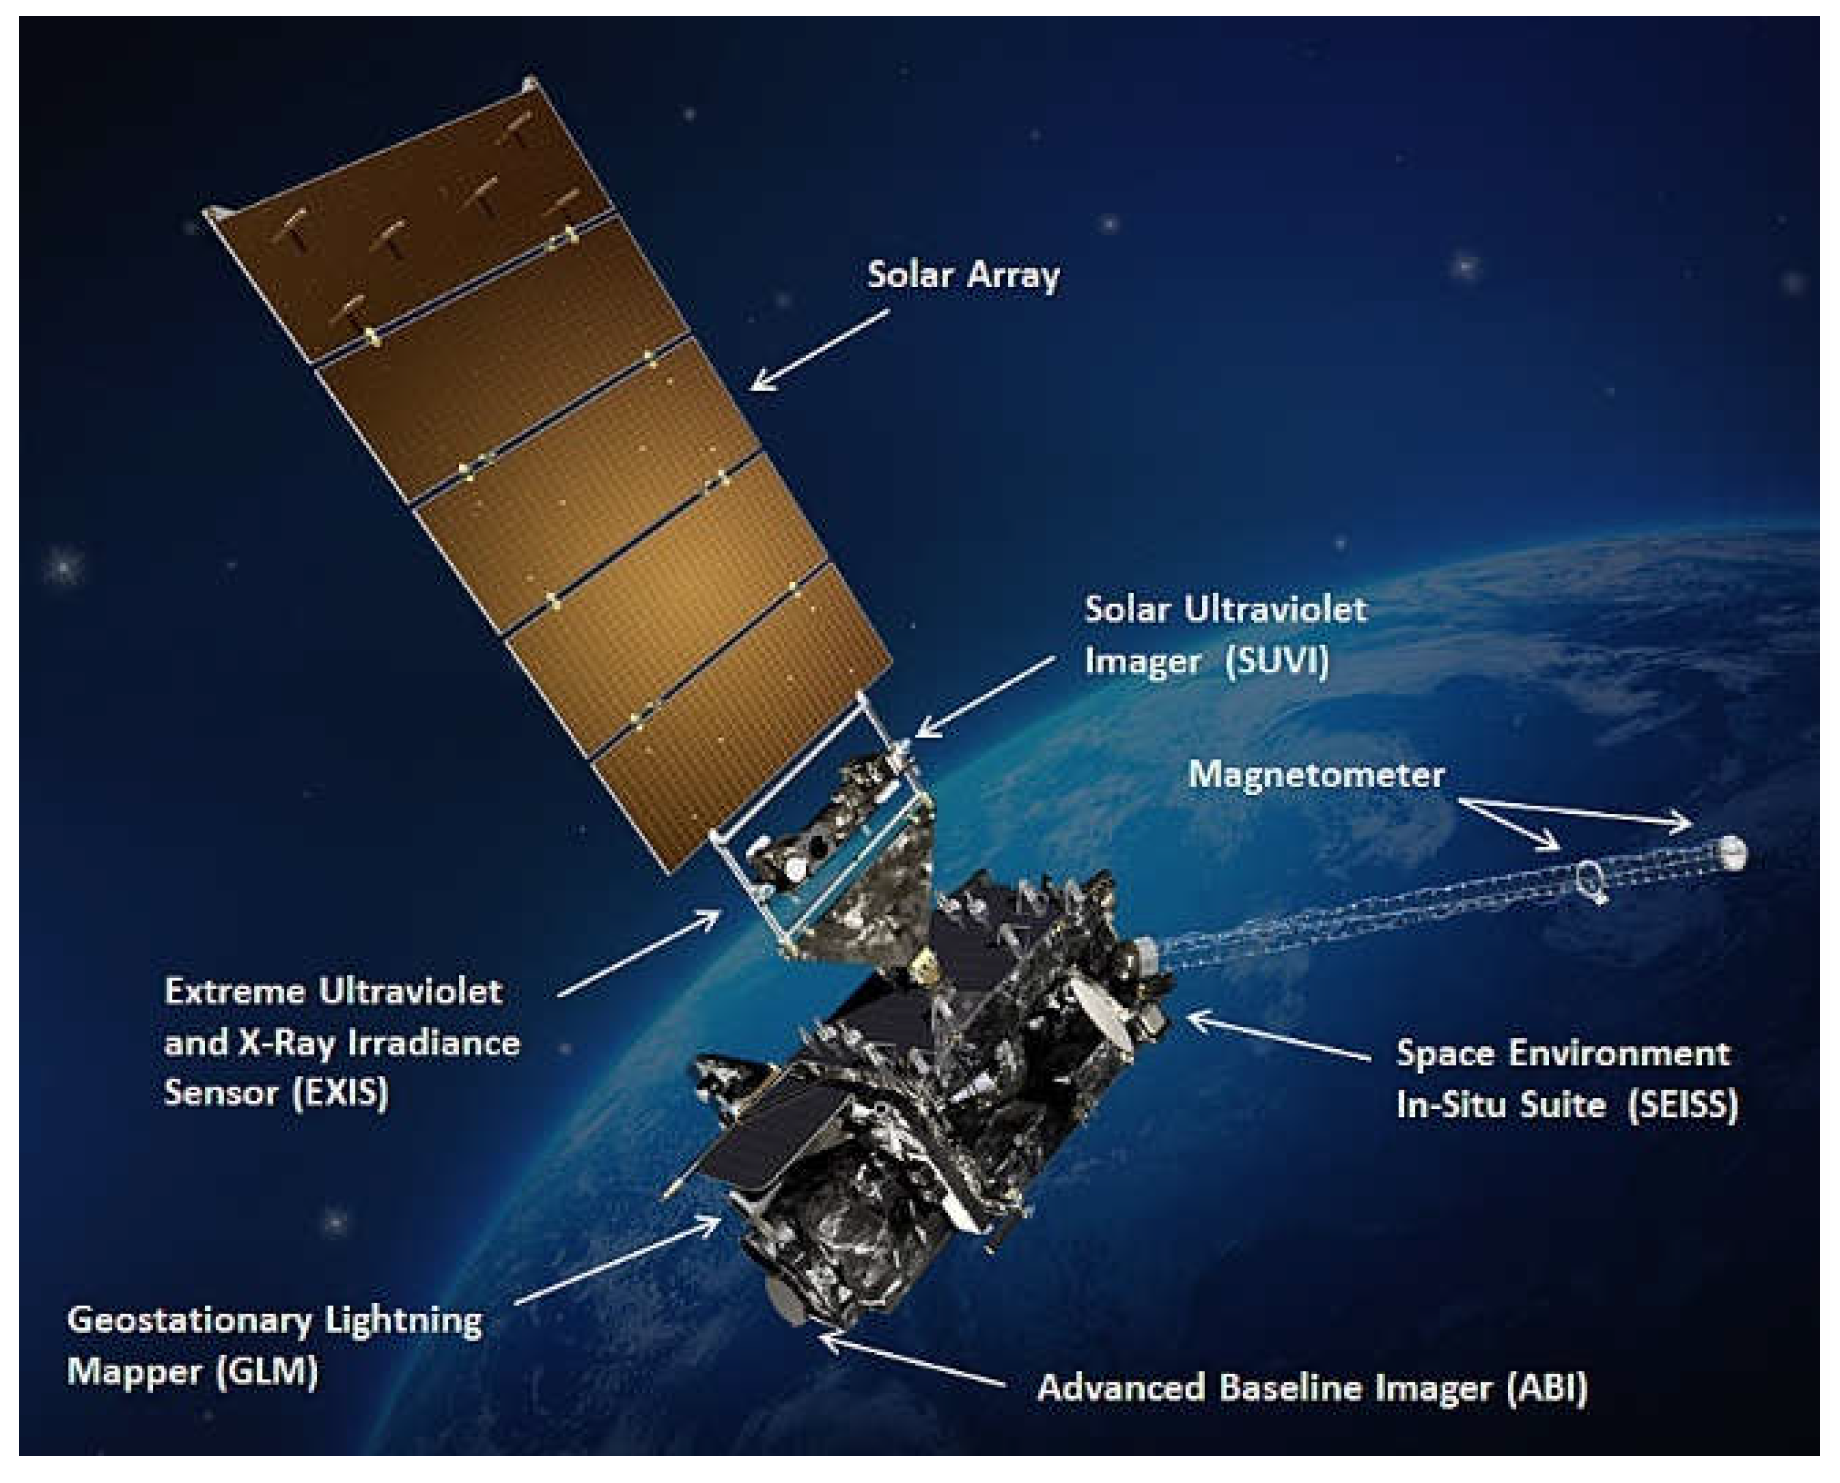
Figure 4.
U.S Weather Forecasting Satellite (Wikipedia) – GOES 16.
A second instrument, the Microwave Imager (TMI), is a 9-channel Radiometer operating at dual polarized frequencies ranging from 10.7GHz to 85.5GHz with a 11km X 8km field of view at 37GHz and a high Scanning functionality. It complemented the PR by collecting information about total Hydrometer content within Precipitation systems. This combination of Active-Passive instrumentation, coupled with the inclined orbit of the TRMM Satellite sampling the atmosphere along the entire orbit duration, produced high quality Precipitation information relative to operational capabilities at the time of TRMM’s mission execution. This led to various scientific advances due to additional parameter inputs to Hydrological and Land-Surface Models, which contributed to a deeper understanding of land-atmosphere interactions over time scales of days to years. [9]
Figure 5.
3D Precipitation Structure - Approved by Tomorrow.io.
Banking on recent technological advances and with the TRMM mission paving the way for future Meteorological Satellite missions, a next generation Satellite program launched on February 27th, 2014, as part of another NASA-JAXA partnership. The Global Precipitation Measurement (GPM) Core Observatory Satellite program aims to broaden the scope of Precipitation measured to even lower levels (in mm per hour) while increasing coverage beyond tropical and subtropical regions. By integrating a number of Satellites into a moving constellation in LEO, this program achieves broader land coverage and global Precipitation observations on a larger scale, doing so approximately every 3 hours. In comparison to the instruments aboard the TRMM, those on the GPM impart even greater Precipitation observation capabilities, providing an ability to diagnose characteristics of internal cloud volumes including Hydrometers and other features. This is accomplished by through the GPM’s Dual Frequency Precipitation Radar (DPR) and the GPM Microwave Imager (GMI).
The DPR’s Ku-band Radar was designed to measure Precipitation at 13.6GHz, similar to the PR onboard the TRMM. However, the DPR offers a second operating frequency at 35.5GHz in the Ka-Band, which allows the measurement of Frozen Precipitation and Light Rain. This capability, allows for the creation of even more detailed Drop Size Distributions, further improveing Rain and Snowfall Prediction Models.
The GMI – a 13-channel Scanning Microwave Imager, is designed to detect the Backscattering Power of EM waves (as described in former sections) and create a layer-like Model of a target volume. This enables to estimate the intensity of Light Rain and Snowfall by operating within a frequency range of 10-89GHz, which is also used to estimate heavy/moderate Rainfall, in a similar fashion to the operation of TRMM’s PR. The added value of the GMI is rooted in its use of 4 additional frequency channels, ranging from 166 to 183GHz, aimed at measuring moderate and light Precipitation, thus further improving the accuracy of Precipitation Forecasting Models. [10]
The Next Leap
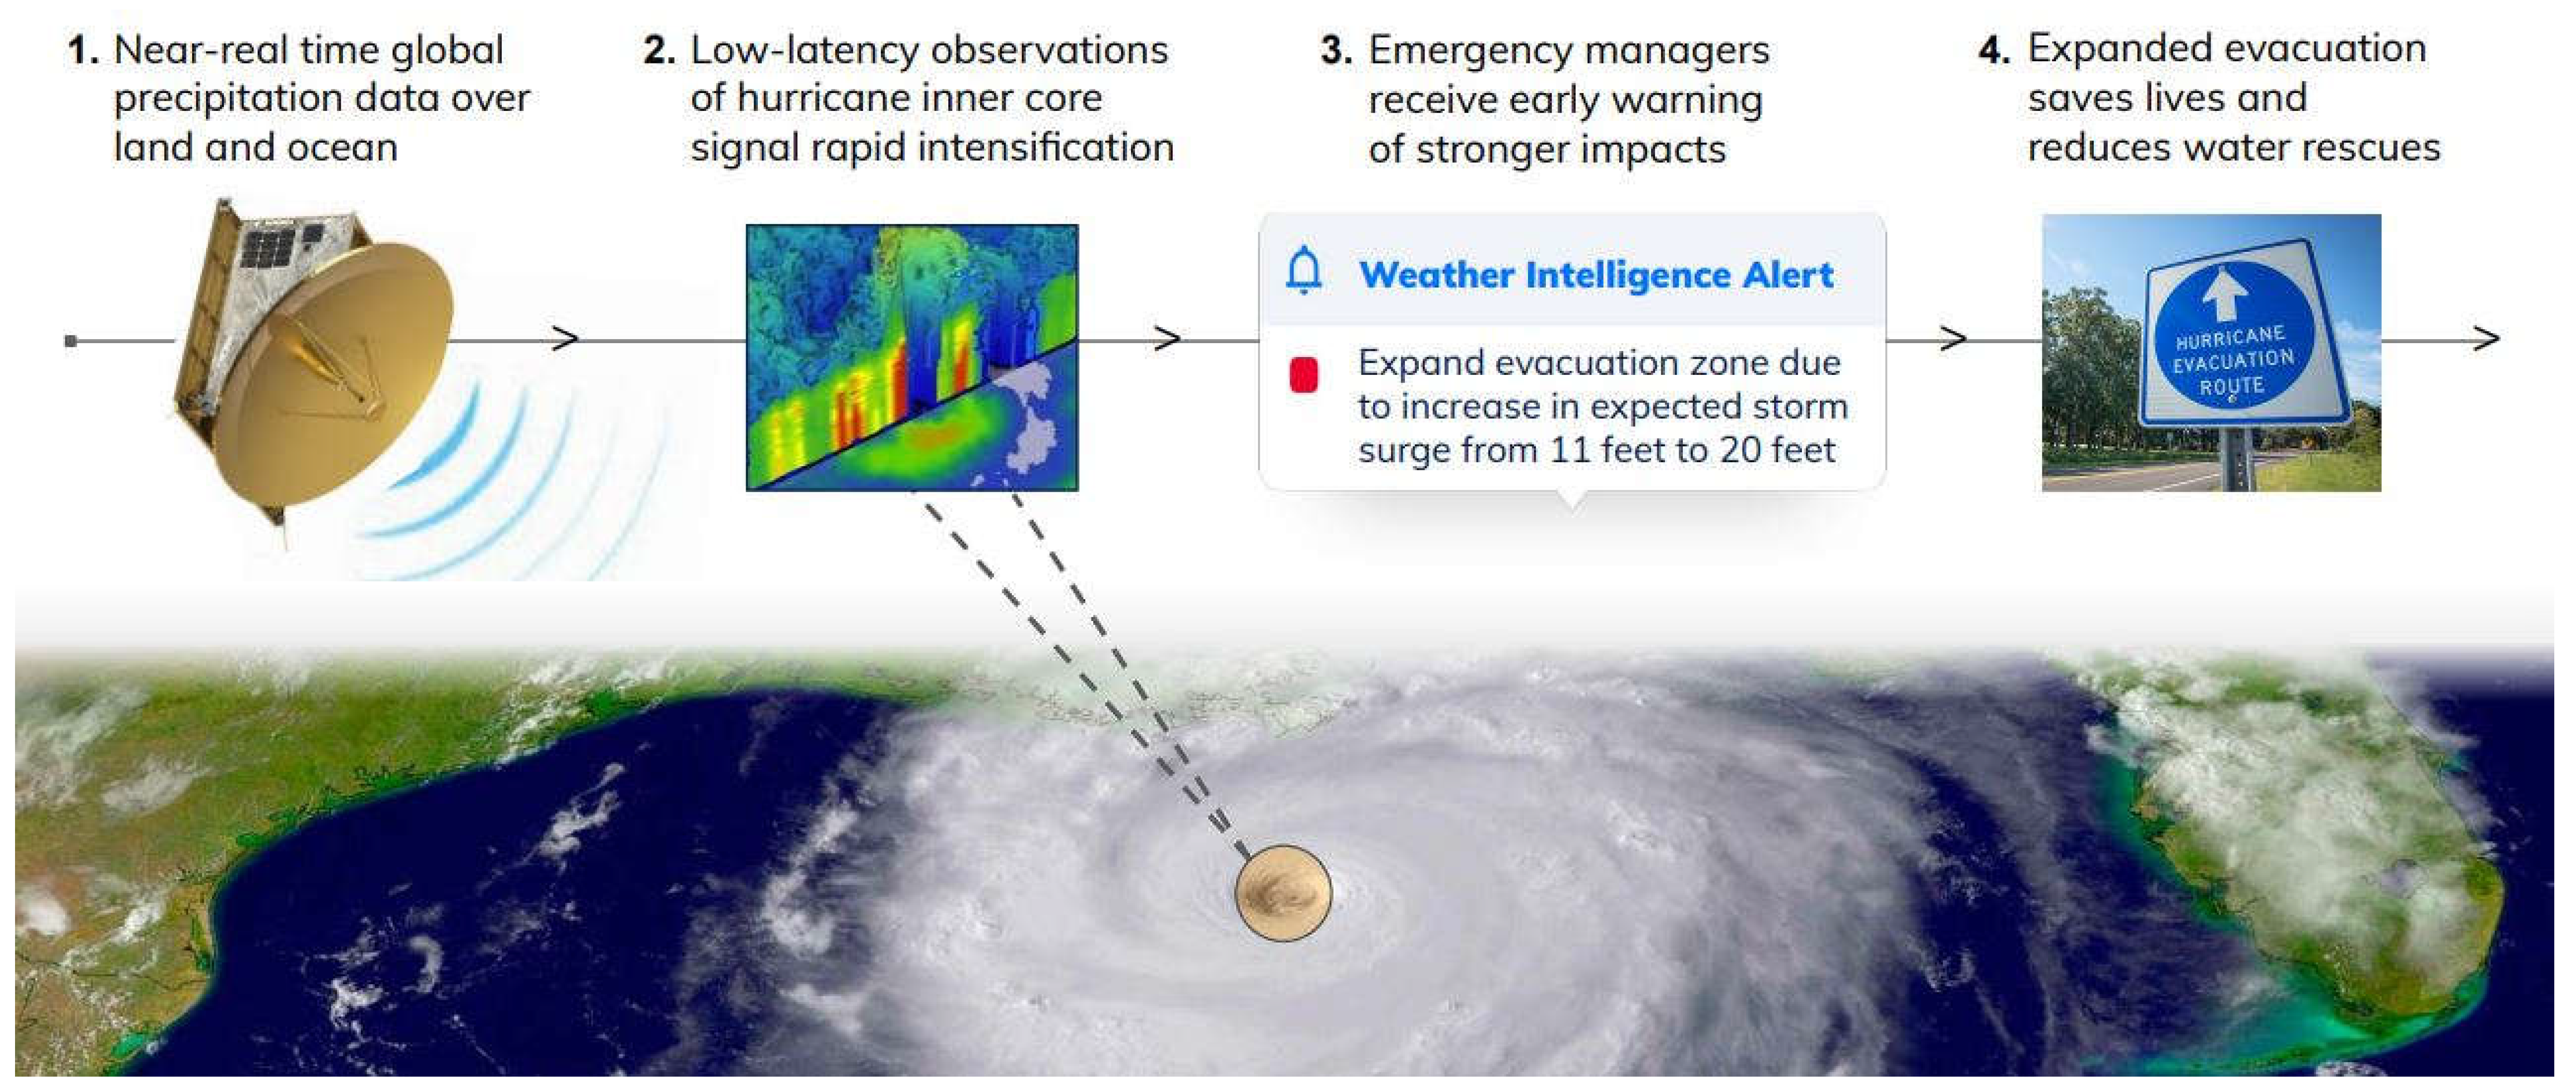
The World Meteorological Organization (WMO) is a dedicated agency of the United Nations (UN) with a mission to establish and maintain an integrated Earth system observation network. This network is composed mainly of state-level Weather and Climate monitoring capabilities owned by its 187 member-states, aimed at providing Weather and Climate Data to various consumers of all types. For the first time, a privately held entity will possess state-level weather monitoring resources and contribute added value to the WMO’s operations and activities.
Figure 6.
Weather Intelligence Alert Flowchart - Approved by Tomorrow.io.
Tomorrow.io, a U.S-Israeli Startup, speciallizing in advanced Weather Technology, is set to revolutionize our collective understanding of Climate and Weather by deploying a first of its kind constellation of 30 Weather Prediction Satellites. The goal is to launch at least 20 of these satellites to Low Earth Orbit by the end of 2025, which will include :
- a.)
- Radars placed at 550km in Sub-synchronous and mid-inclination orbit with an Horizontal Resolution of 5km x 5km and Vertical Resolution of 250m, operating in Ka-Band at 35.5-36GHz. This frequency offers clear advantages over other frequencies, such as Sensitivity to both Low and High Intensity Precipitations from orbital distances, higher Sensitivity to vertically integrated liquid water substances relative to that attainable at the Ku-Band, and the ability to estimate a wide range of surface Precipitation intensities. Additionally, it enables smaller antenna and RF components due to the shorter wavelength. Each Radar has a design lifespan of about 5 years.
- b.)
- Passive MW Radiometers placed at 550km and Mid-inclination orbit, with a Horizontal Resolution of 14 x 17km at 204GHz and 26 x 28km at 91GHz, operating in the 91-204GHz range. Each Radiometer has a design lifespan of 3 years.
All of this will turn the constellation into the world's first Global Sensing Network producing Near-Real time Precipitation Data and Atmosphere Profiles. These will be used in a variety of applications, such as sophisticated Severe Weather Alert and Emergency Management systems.
For instance, it is well-known that environmental Moisture has an intensification effect on Tropical Cyclones and Hurricanes (variations of tropical storms) by facilitating convection and Precipitation out-side the storm. The conclusion was that “Enhanced environmental Moisture ahead of the northwestward moving storm induces a dry air intrusion to the inner core and limits storm intensification. In contrast, increased Moisture in the rear quadrants favors intensification by providing more Moisture to the inner core and promoting storm symmetry, with primary contributions coming from Moisture increase in the boundary layer. The different impacts of environmental Moisture on storm intensification are governed by the relative locations of Moisture perturbations and their interactions with the storm Lagrangian Structure”. [11]
Therefore, it becomes evident that a Precipitation Model updated by Near-Real time Data and driven by high Revisit Rates will be able to more effectively predict Severe Weather events and issue timely warnings to Decision Makers – one of the many applications that, over time, will gain even greater usability and become a daily reality thanks to Tomorrow.io’s venture.
A Global Measurements Integration Model
Integration of all received measurements into one unified Model is made feasible by Tomorrow.io’s technology, by implementing a Cloud Centric Model. This approach ensures that any Weather forecasting Model usage and output accessible worldwide, promoting numerous new solutions and use cases in the process, outlined as follows:
- 1.
- At first, measurements are received worldwide by Tomorrow.io’s Multi-Sensor Satellite Constellation using various Remote-Sensing technologies aboard.
- 2.
- The data is then relayed to a Distributed Commercial Ground Stations Network such as the Kongsberg Satellite Services (KSAT),. KSAT is a Norwegian commercial company that operates numerous ground stations across the globe, facilitating reception of downlinks for Polar Orbiting Satellites and global Earth Observation Services. Its infrastructure consists of 25 physical sites, enabling full coverage for Polar Orbiting Satellites.
- 3.
- At the next stage, Data received from the Ground Stations Network is transferred into a Commericial Cloud Formation Topology over the Internet, such as Amazon Web Services (AWS). This makes the Raw-Data accessible to cloud-based Data-Analytics tools, and makes Weather Forecasting Models accessible worldwide to any company interested in utilizing them for its own services.
Figure 7.
From Space to Software – Flowchart – Approved by Tomorrow.io.
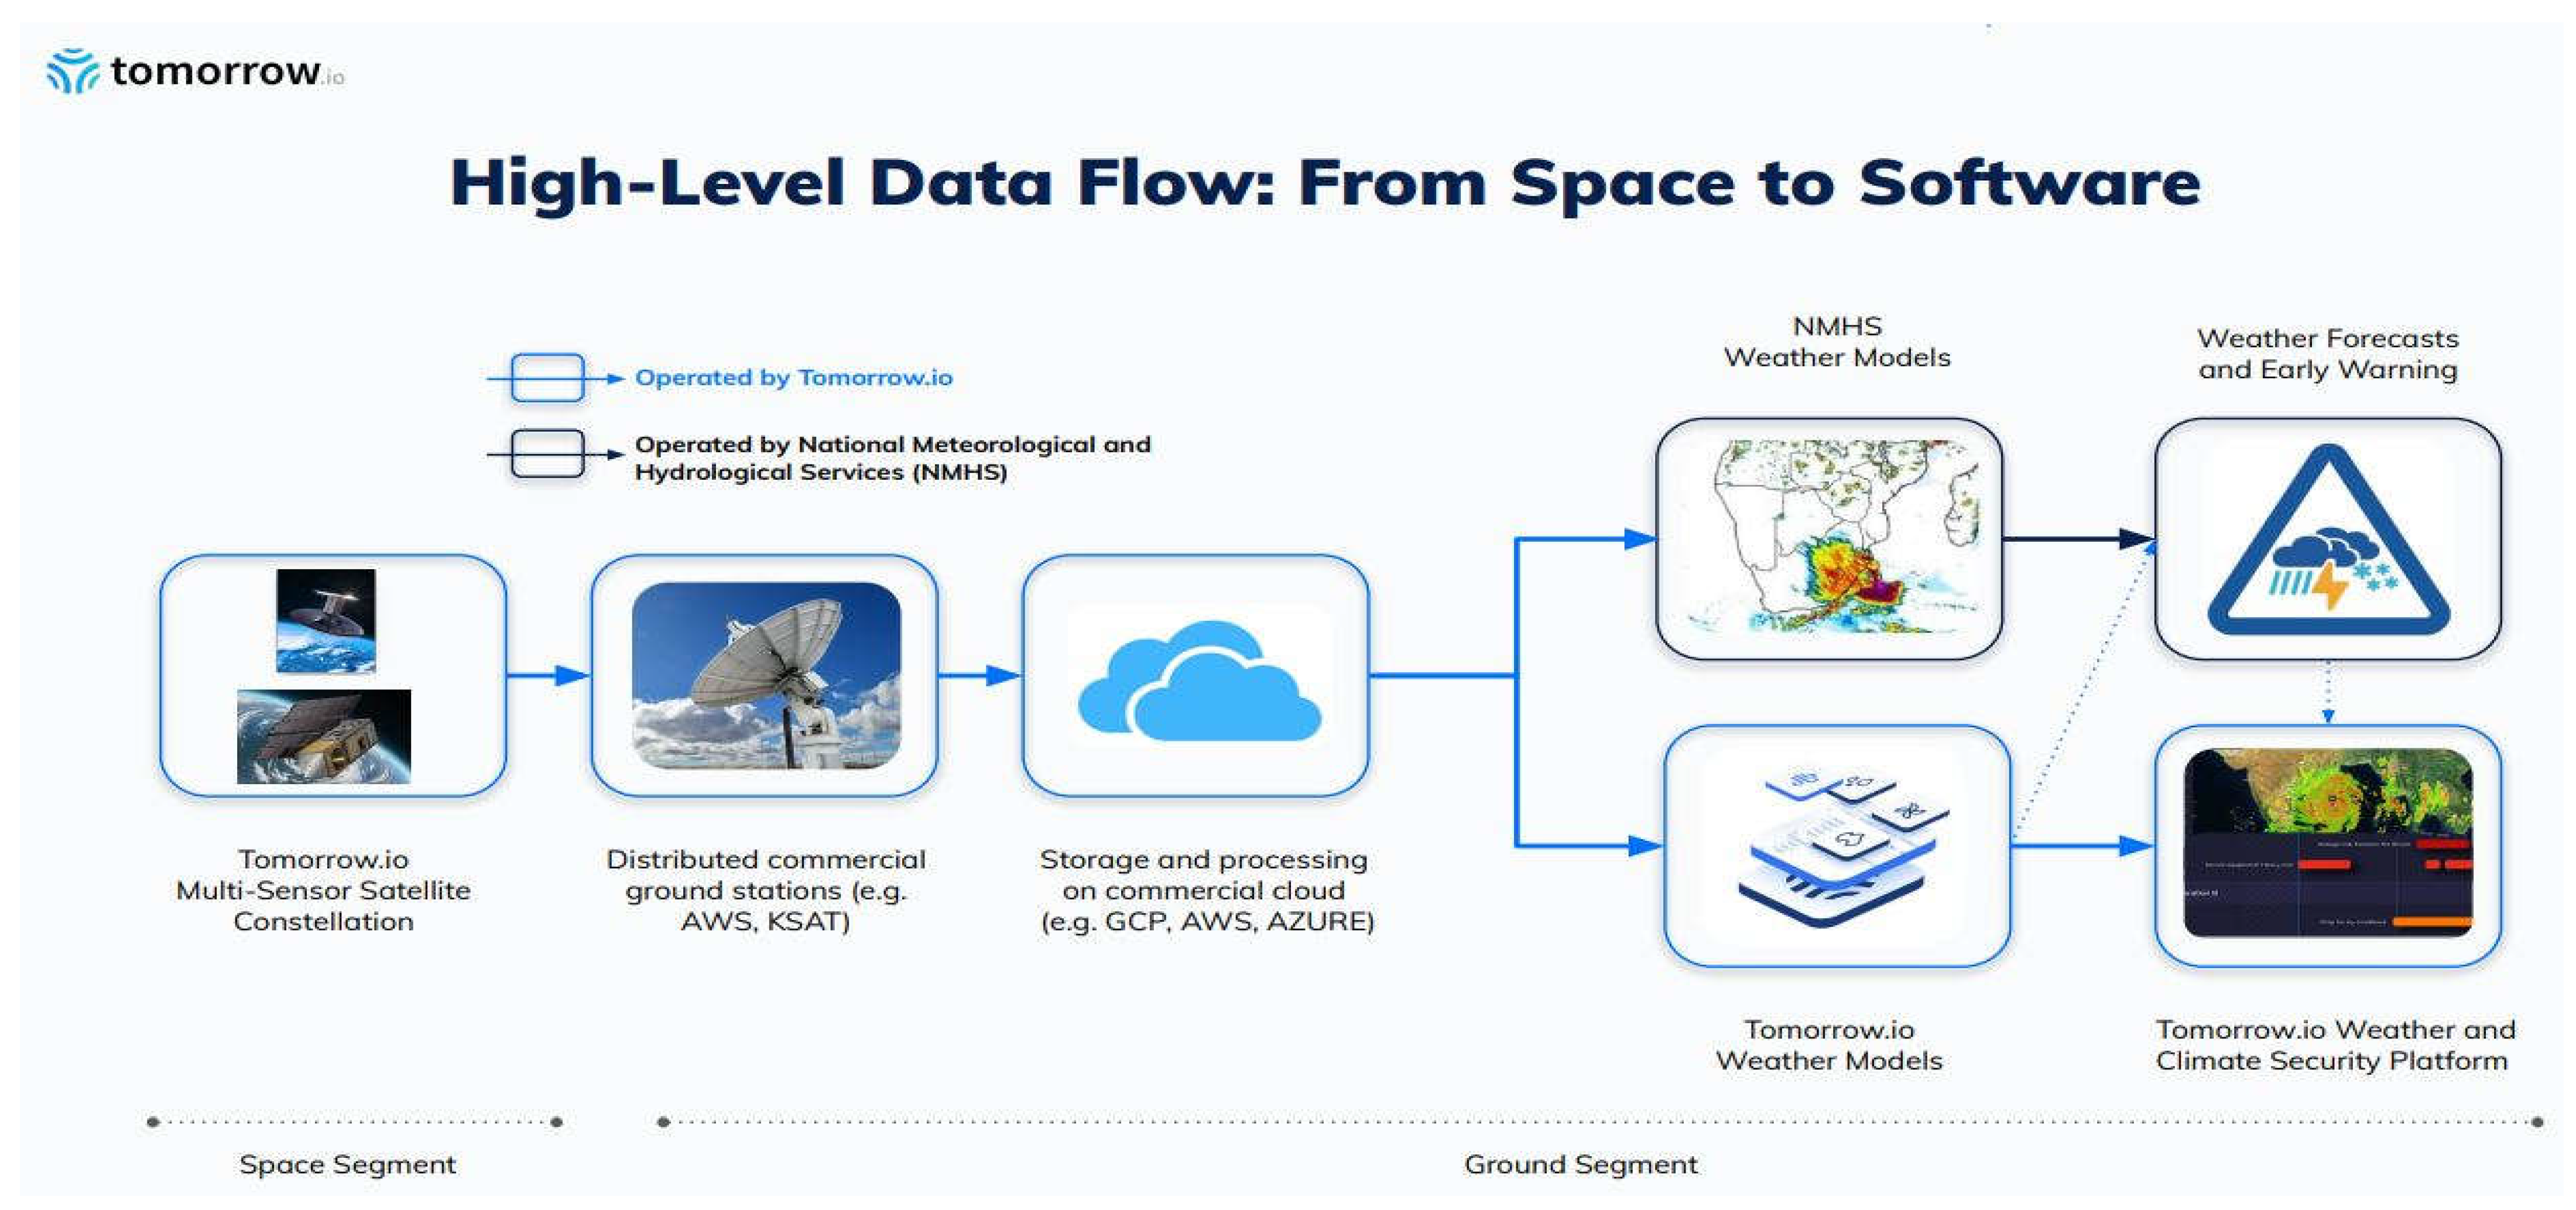
- 4.
- As a Pre-final stage, enormous amounts of Data are input into sophisticated Weather Forecasting Models that use Neural Networks (AI) specifically designed for Remote-Sensing applications. These models are uniquely required to operate in Near-Real time in order to produce Severe Weather Event Warnings, among other purposes. Approaches such as Statistical Regression (Parameterized Function Approximation), which employ a collection of input/output pairs to empirically derive statistical relationships between ensembles, are likely utilized. In cases of Linear Regression, Second Order Statistical Moments (Covariances) are used to compute a linear fit that minimizes the Sum-Squared Error between the fit and the Data. However, linear representation is seldom sufficient to fully characterize the complex statistical relationships inherent in Atmospheric Data, and nonlinear regression techniques must be used. Artificial Neural Networks, as a special class of Nonlinear Regression Operators – are thus well suited for Weather Forecasting Models based on Remote-Sensing technology. [12]
- 5.
- Finally, Model predictions are incorporated into Tomorrow.io’s Weather and Climate Security Platform for customer dispatching.
One might argue that such a Model is one step ahead of the advanced Weather Interactive Processing System (AWIPS2), which operates as an extension of the RSA Project under NOAA. Its goal is, to help visualize site-specific weather data for the benefit of decision makers and monitoring staff [13].
The influence of Near-Real time Weather forecasting technology coming into fruition will not stop at civilian sectors but will have a profound impact on the Military Defense sector as well.
For instance, operations involving Remotely Piloted Aircrafts (RPAs) came with significant losses in the last 30 years, costing to taxpayers more than $100 million. Due to the fact that these RPAs are unmanned, their environmental awareness of weather phenomena must be adequate. Use of inadequate technology which stemming from conventional weather forecasting processes is responsible for the majority of these yearly losses. Therefore, the implementation of Near-Real time weather forecasting capabilities in Military Operations may prove to be a great support tool for RPA operators, saving considrable sums of money. By providing high levels of Weather resolution and accuracy, this technology may also remove the need for weather-specific sensors at or near mission locations. [14]
V. Profound Impact Potential on Decision-Making Processes
Weather and environmental monitoring have always played a critical role in guiding strategic decision-making processes across both civilian and military sectors. As legacy systems like the Defense Meteorological Satellite Program (DMSP) approach the end of their operational lifespan, the need to modernize satellite constellations has become increasingly urgent. This part synthesizes key advancements across multiple programs, including the Geostationary Operational Environmental Satellite-R (GOES-R) series, and the Weather System Follow-on Microwave (WSF-M) satellite program.
- 1.
- Modernizing Military Weather Monitoring - The U.S. military relies on robust space-based meteorological systems to support Joint All-Domain Command and Control (JADC2) operations, which demands near-real-time meteorological insights to enable agile operational responses. Current challenges include the limitations in terrestrial sensors and the complexities of the Indo-Pacific theater, necessitating space-based solutions. [15]
Initiatives such as the WSF-M Program, address critical gaps left by the DMSP. Launched in April 2024 aboard a SpaceX Falcon 9 rocket, the WSF-M satellite enhances capabilities for measuring ocean surface winds, analyzing tropical cyclones, and detecting atmospheric charged particles. Additionally, it offers broad utility by collecting data on sea ice, soil moisture, and snow depth, which are pivotal for both military and environmental monitoring. Future plans include deploying a second WSF-M satellite in 2028, alongside additional launches with complementary capabilities developed under the Electro-Optical Weather System, scheduled for 2025 and 2027. [16] Complementary programs like the Electro-Optical/Infrared Weather System (EWS) are also being developed to ensure redundancy and resilience in weather monitoring systems. [17]
2. Enhancing National Resilience with the GOES-R Series The GOES-R satellite series, developed collaboratively by NOAA, NASA, and Lockheed Martin, represents a transformative leap in geostationary weather monitoring. Since its inception in 2016, the GOES-R series has significantly improved the precision and frequency of data collection, providing critical insights for disaster preparedness and long-term climate strategies. [18]
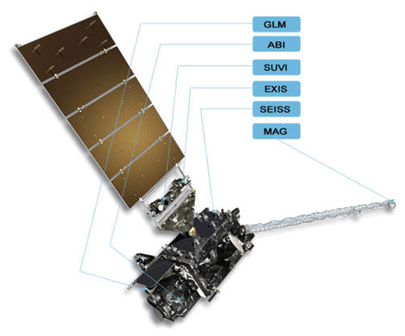
Key features include the Geostationary Lightning Mapper (GLM) for real-time lightning tracking, the Solar Ultraviolet Imager (SUVI) for monitoring solar activity, and the Compact Coronagraph (CCOR) for early detection of coronal mass ejections, safeguarding technological infrastructures from space weather impacts. With fourfold improvements over earlier satellites, GOES-R offers near-instantaneous updates, enabling timely responses to severe weather events. The final installment, GOES-U, launched in June 2024, further solidifies this series’ contributions to national resilience and global environmental intelligence. Deployed by SpaceX’s Falcon Heavy from NASA’s Kennedy Space Center, GOES-U introduces advanced weather and environmental monitoring capabilities for the Western Hemisphere, spanning from the west coast of Africa to New Zealand. [19]
Equipped with the Advanced Baseline Imager (ABI), the GOES-U satellite enhances real-time weather forecasting, improves detection of severe weather conditions, and supports disaster management. It also incorporates specialized instruments like the Geostationary Lightning Mapper (GLM) for early storm detection and devices for monitoring solar activity, such as the Solar Ultraviolet Imager (SUVI) and Compact Coronagraph-1 (CCOR-1). These tools strengthen NOAA’s ability to predict and mitigate space weather hazards safeguarding communication and navigation systems.
The Advanced Baseline Imager (ABI), significantly enhances meteorological imaging with its 16 spectral bands, compared to only five in earlier systems. ABI’s high spectral resolution, combined with its rapid data processing capabilities, allows for full Earth scans every five minutes and updates on severe weather conditions every 30 seconds. These features are critical for real-time disaster response, improved numerical weather predictions, and comprehensive environmental analysis.
3. Leveraging AI for Climate Research - IBM’s collaboration with NASA demonstrates the potential of artificial intelligence in climate research. This collaboration has significantly advanced climate and Earth science research through the application of cutting-edge AI and machine learning technologies. With a legacy in space exploration dating back to 1949, IBM has provided instrumental support to NASA’s missions, including the Apollo Program and modern Earth science initiatives.
In 2022, IBM and NASA formalized their partnership under the Space Act Agreement to address global climate challenges. A key outcome of this collaboration is the development of the HLS Geospatial Foundation Model (HLS Geospatial FM), trained on NASA’s extensive geospatial datasets, including the Harmonized Landsat and Sentinel-2 data. Leveraging IBM’s Vela supercomputer, this Model improves the efficiency of geospatial data analysis, enabling applications such as flood prediction, land-use monitoring, and disaster response. [20]
Key advancements include a 15% accuracy improvement over traditional Models and fourfold increase in geospatial analysis speed, achieved with less labeled data. This Model’s broad applicability extends to, agricultural impact analysis, deforestation monitoring, and wildfire tracking. Additionally, IBM’s commitment to open-source platforms fosters global collaboration and innovation, with the HLS Geospatial FM available on Hugging Face.
4. Advances in Solar Weather Forecasting - Solar weather phenomena pose significant risks to satellite operations and communication networks. Accurate solar weather predictions are crucial, as events such as solar flares can significantly impact satellite trajectories, particularly in very low Earth orbit (vLEO). Improved Models can help address challenges, including tracking adversarial satellites during solar storms.
Booz Allen Hamilton's researchers have developed innovative solutions using data from NASA’s Solar Dynamics Observatory (SDO), which provides extensive solar imagery. By leveraging autoencoder-based ML Algorithms, these Models efficiently analyze vast datasets and detect patterns indicative of solar activity. This approach has enabled more accurate predictions of solar events, such as sunspots and flares, by training on over 300,000 high-resolution images spanning a decade. Researchers emphasize open-source methodologies, enabling continuous refinement of Models by integrating diverse datasets. This extensibility supports applications such as predicting atmospheric drag on satellites, improving orbit determination, and creating unified frameworks for space domain awareness. [21]
- 5.
- In China, the Fengyun (FY) satellite series, complemented by the Tianmu-1 and Yunyao-1 constellations, has significantly advanced disaster monitoring and weather predictions. The FY-4 series reduced typhoon recognition time from 15 minutes to 5 minutes and improved track prediction accuracy. These satellites enhance global numerical weather prediction (NWP) capabilities and montior severe weather, environmental changes, and ecological hazards. Additionally, FY satellites support international collaboration by providing sata to ver 115 countries, solidifying China’s role as a leader in meteorological innovation and ecological sustainability [22].
2. Conclusions
Significant advancements have been made in the field of remote-sensing and its applications in weather and climate forecasting over the last 60 years, especially through the use of dedicated satellite technologies. Despite these achievements, the future holds immense potential, limited by only our imagination in making even greater leaps with unimaginable impacts. The implementation of near-real time weather forecasting models may affect many sectors, including the Military Defense sector, where weather plays a critical role in National Security and is vital [22] to mission success across the Air-Force and, other units. Civilian sectors [23] such as emergency response, also stand to benefit significantly from highly accurate weather information, especially during the process of issuing weather alerts to disaster-stricken areas prior to eviction operations. The main purpose of all innovation achieved in recent years, particularly through the efforts of institutions and companies such as the World Meteorological Organization (WMO), National Meteorological Administrations, NOAA [24], the US-Israeli company Tomorrow.io, the Aerospace cooperation [25], IBM, Booz Allen Hamilton, and a few Chinese and European companies is to save lives. Their important contributions are highlighted throughout this paper.
| Table of Figures | ||
| Figure 1 - APT picture coverage - See Ref [5] | 3 | |
| Figure 2 - Block diagram of the APT system - See Ref [5] | 4 | |
| Figure 3 – Self. Particles hit by EM waves | 5 | |
| Figure 4 - U.S Weather Forecasting Satellite (Wikipedia) – GOES 16 | 8 | |
| Figure 5 - 3D Precipitation Structure - Approved by Tomorrow.io | 8 | |
| Figure 6 - Weather Intelligence Alert Flowchart - Approved by Tomorrow.io | 9 | |
| Figure 7 – From Space to Software – Flowchart – Approved by Tomorrow.io | 11 | |
| Tables | ||
| Table 1 - Historical Satellite Revisit Rates | 7 | |
Possible alternative to Figure 4:
Scalable to whichever size is necessary. Just add text boxes to point to instrumentation with arrows, similar to how Wikipedia’s page editor has done. Image Source: GOES16 Website
References
- R. E. Hallgren, "Global Monitoring - Something Old and New," The Bulletin of the American Meteorological Society (BAMS), vol. 52, no. 7, pp. 539-543, July 1971.
- D. Grace, J. Gavan and S. Tapuchi, "Concepts and Main Applications of High-Altitude-Platform Radio Relays," The Radio Science Bulletin, no. 330, pp. 20-31, Sept 2009.
- J. Gavan and S. Tapuchi, "Microwave Wireless Power Transmission to High-Altitude Platform Systems," The Radio Science Bulletin, no. 334, pp. 25-42, September 2010.
- J. T. Penttinen, THE TELECOMMUNICATIONS HANDBOOK, chapter 16 - Satellite Systems: Communications., WILEY, 2015, p. 605.
- W. G. Stroud and R. A. Stampfl, "THE AUTOMATIC PICTURE TRANSMISSION (APT) TV CAMERA SYSTEM FOR METEOROLOGICAL SATELLITES," NATIONAL AERONAUTICS AND SPACE ADMINISTRATION (NASA), no. NASA TECHNICAL NOTE - NASA TN D- 1915, pp. 1-6, Nov 1963. [CrossRef]
- F. T. Ulaby and D. G. Long, Microwave Radar and Radiometric Remote Sensing - Chapter 1 - Introduction, University of Michigan Press, 2014, pp. 3-12.
- F. T. Ulaby and D. G. Long, Microwave Radar and Radiometric Remote Sensing, Chapter 8 - Microwave Interactions with Atmospheric Constituents, the university of michigan press, 2014, pp. 325-360.
- C. Kummerow, W. Barnes and T. Kozu, "The Tropical Rainfall Measuring Mission (TRMM) Sensor Package," Journal of Atmospheric and Oceanic Technology, pp. 6-7, June 1998.
- S. A. Braun, "TRMM Senior Review Proposal 2011," NASA, 2011.
- E. Gray and H. Hanson, "GPM Mission Brochure," NASA, 2014.
- L. Wu, H. Su, R. G. Fovell, T. J. Dunkerton, Z. Wang and B. H. Kahn, "Impact of environmental moisture on tropical cyclone intensification," Atmospheric Chemistry and Physics, 21th December 2015. [CrossRef]
- W. J. Blackwell and F. W. Chen, Neural Networks In Atmospheric Remote Sensing, Boston: Artech House, 2009, pp. 2-3.
- Raytheon, AWIPS System Manager's Manual: AWIPS || Operational Build, Raytheon, 2015.
- J. Mun, D. N. Ford, T. Housel and S. H., "The Importance of Weather in Military Applications: WeatherNow ROI Analysis," in Naval Acquisitions Research, pp 6-15, 2016.
- C. Oxford, "Next-Gen Weather Satellite Set to Enhance Global Military Operations," 8th Feb 2024. [Online]. Available: https://www.spacedaily.com/reports/Next_Gen_Weather_Satellite_Set_to_Enhance_Global_Military_Operations_999.html.
- C. Albon, "Space Force launches weather satellite to replace 1960s-era spacecraft," 11th Apr 2024. [Online]. Available: https://www.c4isrnet.com/battlefield-tech/space/2024/04/11/space-force-launches-weather-sat-to-replace-1960s-era-spacecraft/#:~:text=%E2%80%94%20The%20Space%20Force%20on%20Thursday,a%20SpaceX%20Falcon%209%20rocket.
- T. Ryan, "Rain or shine: Why upgraded space-based weather-monitoring is crucial for the military," 17th Nov 2023. [Online]. Available: https://breakingdefense.com/2023/11/rain-or-shine-why-upgraded-space-based-weather-monitoring-is-crucial-for-the-military/#:~:text=The%20ability%20to%20employ%20forces,the%20most%20robust%20enemy%20defenses.
- M. LOCKHEED, "Increasing National Resilience with Cutting-Edge Weather Satellite Technology," 6th June 2024. [Online]. Available: https://spaceproject.govexec.com/sponsors/sponsor-content/2024/06/increasing-national-resilience-cutting-edge-weather-satellite-technology/397027/.
- SatNews, "SpaceX launches NOAA’s monumental GOES-U mission claiming: the nation’s most advanced weather observing and environmental monitoring satellite system," 25th Jun 2024. [Online]. Available: https://news.satnews.com/2024/06/25/spacex-launches-noaas-monumental-goes-u-mission-claiming-the-nations-most-advanced-weather-observing-and-environmental-monitoring-satellite-system/.
- J. Blumenfeld and N. , "NASA and IBM Research Apply AI to Weather and Climate," 22 May 2024. [Online]. Available: https://www.earthdata.nasa.gov/news/blog/nasa-ibm-research-apply-ai-weather-climate.
- Daily, "Modeling Solar Weather Better and Faster for Decision Advantage," 30th Sept 2024. [Online]. Available: https://www.airandspaceforces.com/modeling-solar-weather-better-and-faster-for-decision-advantage/.
- H. Moti. [Online]. Available: https://www.cma.gov.cn/en/. [Accessed 2025].
- M. Christino, "Maintaining a Functional Meteorological Satellite Program for National Defense," 30th Jun 2023. [Online]. Available: https://www.americansecurityproject.org/maintaining-a-functional-meteorological-satellite-program-for-national-defense/.
- T. Ryan, "Rain or shine: Why upgraded space-based weather-monitoring is crucial for the military," 17th Nov 2023. [Online]. Available: https://breakingdefense.com/2023/11/rain-or-shine-why-upgraded-space-based-weather-monitoring-is-crucial-for-the-military/.
- J. Keller, "NOAA eyes replacing ageing network of WSR-88D NEXRAD weather radar to warn of tornadoes and thunderstorms," 12th Sep 2024. [Online]. Available: https://www.militaryaerospace.com/sensors/article/55139014/weather-radar-enabling-technologies-tornadoes-and-thunderstorms.
- Aerospace, "GOES-R: Understanding the Critical Role of Weather Satellites," 7th Nov 2024. [Online]. Available: https://aerospace.org/article/goes-r-understanding-critical-role-weather-satellites.
Disclaimer/Publisher’s Note: The statements, opinions and data contained in all publications are solely those of the individual author(s) and contributor(s) and not of MDPI and/or the editor(s). MDPI and/or the editor(s) disclaim responsibility for any injury to people or property resulting from any ideas, methods, instructions or products referred to in the content. |
© 2025 by the authors. Licensee MDPI, Basel, Switzerland. This article is an open access article distributed under the terms and conditions of the Creative Commons Attribution (CC BY) license (http://creativecommons.org/licenses/by/4.0/).
Copyright: This open access article is published under a Creative Commons CC BY 4.0 license, which permit the free download, distribution, and reuse, provided that the author and preprint are cited in any reuse.


