
Submitted:
20 May 2025
Posted:
21 May 2025
You are already at the latest version
Abstract
To address the issues of high excitation loss and low power density in purely electrically excited generators, as well as the difficulty in adjusting the magnetic field in purely permanent magnet generators, a new topology for a built-in permanent magnet and salient-pole electromagnetic hybrid excitation generator is proposed. Firstly, an equivalent magnetic circuit model of the generator is established. Secondly, expressions are derived to describe the relationships between the dimensions of the salient-pole rotor and the permanent magnets and the generator's no-load induced electromotive force, cogging torque, and air-gap magnetic flux density. These expressions are then used to analyze the structural parameters that influence the generator's performance. Thirdly, optimization targets are selected through sensitivity analysis, with the no-load induced electromotive force, cogging torque, and air-gap magnetic flux density serving as the optimization objectives. A multi-objective genetic algorithm is employed to optimize these parameters and determine the optimal structural matching parameters for the generator. Finally, a prototype is fabricated and experimentally tested, validating the accuracy of the simulation analysis, the feasibility of the optimization method, and the rationality of the generator design. Therefore, the proposed topology and optimization method can effectively enhance the output performance of the generator, providing a valuable theoretical reference for the design of hybrid excitation generators for vehicles.
Keywords:
hybrid excitation generators
; response surface model
; sensitivity analysis
; pareto frontier
; multi-objective optimization
1. Introduction
In recent years, the rapid development of the automotive industry has imposed higher standards and requirements on vehicle generators. Traditional silicon rectifier generators can no longer meet the demands of modern vehicle power systems. Although permanent magnet synchronous generator (PMSG) offers high efficiency and power density, they are limited in operating range and magnetic field regulation [1]. Hybrid excitation generator (HEG), while retaining the low excitation loss and high-power density of PMSG [2], incorporates an electro-excitation winding. This addresses the magnetic field regulation challenges of traditional PMSG and provides easy air gap magnetic field control, high power density, and a wide magnetic regulation range [3].
Based on the magnetic circuit relationships between the two excitation sources in existing HEG, these generators can be categorized into three types of magnetic circuit structures: series-connected, parallel-connected, and hybrid-connected [4]. Among them, the parallel-type HEG exhibits strong magnetic field regulation capabilities. However, its topology and magnetic circuit design are more complex, which can lead to magnetic coupling issues between the two excitation sources [5]. Additionally, the introduction of additional air gaps can reduce the magnetic density in the generator's air gaps and cause significant magnetic leakage [6,7]. In the parallel HEG, the permanent magnet field (PMF) and the electro excitation magnetic field (EEMF) are independent but interact in the air gap to form the main magnetic field. This structure requires separate designs for the permanent magnet and electro-excitation devices, which not only increases the size and weight of the generator but also complicates the manufacturing process [8]. In contrast, series-connected HEG, which typically use permanent magnets as the primary magnetic potential source and the electric excitation winding as the auxiliary source, achieve flexible adjustment of the air gap magnetic field by connecting these two sources in series to form a magnetic circuit [9]. The series-connected HEG retains the high-power density of PMSG, allowing it to output higher power for the same volume and weight. Moreover, it features a simple structure, high space utilization, and operational efficiency, making it well-suited for applications in aerospace, electric vehicles, and ships [10,11].
In the literature [12,13], an axial shunt hybrid excitation generator integrates a permanent magnet motor part (PMMP), a magnetic field modulated motor part (FMMP), and a diode rectifier. The PMMP and FMMP rotors are mounted on the same shaft, and their armature windings are connected in series. Although the axial shunt hybrid excitation generator can output higher power in a specific voltage boost region, the magnetic fields of the PMMP and FMMP are independent. Additionally, the large spacing between the two rotors increases the axial length and structural complexity of the generator, while also reducing the utilization of the stator silicon steel wafers.
Literature [14] investigates a parallel rotor hybrid excitation synchronous generator. This HEG structure comprises an AC exciter rotor, a Halbach permanent magnet rotor, a hidden-pole electro-excitation rotor, and a rotating rectifier bridge. In this configuration, the direct axes of the permanent magnet rotor and the electro-excitation rotor coincide and share a common stator winding.
Literature [15,16] examines a new dual rotor hybrid excitation generator structure. This structure compactly arranges the permanent magnet rotor and the electro-excitation rotor on the same axis. The two excitation sources are connected in parallel to synthesize the magnetic field in the air gap. By sharing a common set of stator core and armature windings, the two rotors reduce the axial length requirement of the generator.
Literature [17] proposes a new parallel magnetic circuit hybrid excitation generator. This structure consists of two stator cores and two rotors. The magnetic potential under each pole of the permanent magnet rotor is supplied by a radial permanent magnet (RPM) and two adjacent tangential permanent magnets (TPM). A claw-pole electro excitation rotor is mounted coaxially with the permanent magnet rotor. The RPM and TPM provide the main air gap magnetic field, while the electro excitation rotor regulates the air gap magnetic field.
Literature [18] proposes a new type of hybrid excitation double salient pole motor. This motor features salient pole structures for both the stator and rotor, a simple rotor design, and the arrangement of excitation and armature windings on the stator, with permanent magnets (PM) embedded in the magnetic bridge. Although this design theoretically achieves higher power density, the overall size and weight of the machine are still large, and it lacks experimental validation.
Literature [19] introduces a parallel claw-pole hybrid excitation motor structure. In this design, the PM are placed on the claw-pole rotor shaft, and an excitation support frame is added to the shaft to accommodate the excitation coils. While the excitation support frame fully utilizes the internal space of the claw-pole and improves the motor's power density, it still suffers from uneven magnetic field distribution and low air gap magnetic density. Despite parameter optimization, there is a lack of experimental evidence.
The existing salient pole HEG primarily relies on the EEMF, with the PMF as a supplementary source. This configuration results in high excitation losses and reduced generation efficiency, thereby diminishing the generator's reliability [20,22]. Therefore, this paper proposes a new topology for an in-built permanent magnet and salient pole electromagnetic HEG. In this design, PMF serves as the primary magnetic field, while EEMF acts as an auxiliary source. The electric excitation winding and PM are integrated on the same rotor, which improves the spatial utilization of the HEG, reduces excitation losses, and lowers the risk of irreversible demagnetization under load conditions. By combining segmented PM with internal rotor slots [23] and deflecting the PM at both ends by a certain angle β, a U-shaped PM structure with strong magnetic concentration capabilities is formed. Based on this design, the structural parameters of the rotor and PM are optimized for multiple objectives to enhance the generator's output characteristics. The rationality of the generator's optimization design is verified through finite element simulations and prototype testing.
2. Structure and Working Principal Analysis of HEG
2.1. Structure and Main Parameters of HEG
To address the challenge of magnetic field adjustment in the salient pole built-in permanent magnet generator, excitation windings are installed on each salient pole. This design enhances space utilization within the generator. With the PMF as the primary source and the EEMF as the auxiliary source, it retains the high-power density of the salient pole built-in permanent magnet generator while enabling flexible adjustment of the air gap magnetic field. In this paper, a three-phase, 8-pole, 36-slot double-layer fractional slot winding generator is designed. The structure is shown in Figure 1, and the main parameters are listed in Table 1.
2.2. Magnetic Circuit Analysis of HEG
A two-dimensional finite element model of the HEG is established. The magnetic field simulation and analysis of the salient pole electrically excited generator (SPEEG) and the HEG are conducted using the finite element method, as shown in Figure 2. In the figure, region I depicts the magnetic flux density distribution of the SPEEG when a 2 A excitation current is applied. Regions II, III, and IV illustrate the magnetic flux density distributions of the HEG when 0 A, 2 A, and -2 A excitation currents are applied respectively. The results indicate that the magnetic field strength of the generator increases progressively with the addition of PM and the application of positive excitation current. Conversely, the magnetic field strength decreases when a negative excitation current is applied.
The equivalent magnetic circuit (EMC) method is employed to develop the mathematical model of the HEG. This model comprises two primary parallel magnetic circuits, as illustrated in Figure 3. Specifically, magnetic circuit I forms a closed loop from the S pole of RPM1 to the salient pole body, then to the N pole of RPM1, through the salient pole shoes, across the air gap, through the stator core, back across the air gap, through the salient pole shoes, and finally returning to the S pole of RPM1. Similarly, magnetic circuit II forms a closed loop from the S pole of RPM2 to the salient pole body, then to the N pole of RPM2, through the salient pole shoes, across the air gap, through the stator core, back across the air gap, through the salient pole shoes, and finally returning to the S pole of RPM2.
2.3. Analysis of HEG Structural Parameters Based on the EMC Method
The EMC model integrates both series and parallel magnetic circuits, as depicted in Figure 4.
In Figure 4, Fad, Fm1, Fm2, and Fe represent the magnetomotive force (MMF) of the armature windings, RPM1, RPM2, and the electro-excitation windings respectively. Φδ1 and Φδ2 denote the effective fluxes across the air gap provided by each pair of poles, RPM1 and RPM2 respectively. Φm1 and Φm2 are the fluxes provided by each pair of poles, RPM1 and RPM2 respectively. Φe represents the flux provided by the electro-excitation windings. Φtbl and Φtpl are the leakage fluxes between the pole bodies and the pole boots of each pair of poles respectively. Φ1 is the end leakage flux of RPM2. Gm1 and Gm2 are the equivalent permeabilities of RPM1 and RPM2 respectively. Gtp and Gtb are the equivalent permeabilities of the pole shoe and pole body of the salient poles respectively. Gtpl and Gtbl are the leakage permeabilities of the pole shoe and pole body respectively. Gδ is the equivalent permeability of the air gap. Gst is the equivalent permeability of the stator. G1 is the end leakage permeability of RPM2.
Based on Kirchhoff's and Ohm's laws, the following system of flux equations is established:
The MMFs of RPM1 and RPM2 can be expressed as:
where Bm is the residual magnetic induction of the PM, h1 and h2 are the thicknesses of RPM1 and RPM2 respectively, μ0 is the vacuum permeability, and μm is the permeability of the PM.
The magnetic permeability of the RPM1, RPM2, salient pole boots, and pole bodies can be expressed as:
where b1 and b2 are the widths of RPM1 and RPM2 respectively, lef is the axial length of the rotor, ws is the width of the salient pole boot, hs is the height of the salient pole boot, wb is the width of the salient pole body, and hb is the height of the salient pole body.
The leakage permeability between the pole body and pole shoe of RPM2 and the two adjacent bumps can be expressed as:
where rm is the radius of the leakage path of RPM2, ls is the length of the leakage path of the salient pole boot, and lb is the length of the leakage path of the salient pole body.
The effective total magnetic flux through the air gap can be expressed as:
The no-load induced electromotive force of the generator can be expressed as:
where f is the frequency, Ns is the number of armature winding turns, Kdp is the winding factor, and KΦ is the waveform factor of the air gap flux.
Substituting formula (6) into formula (7) gives:
The magnetic flux density in generator air gap can be expressed as:
where αp is the pole arc coefficient, taken as 0.87 in this paper; τ is the pole pitch, taken as 31.8 mm.
Substituting formula (6) into formula (9) gives:
Assuming that the magnetic permeability of the generator armature core is infinite and neglecting core magnetic saturation and leakage, the magnetic field energy storage can be approximated as the energy stored in the air gap. The cogging torque of the generator under no-load conditions can be expressed as:
where W is the internal energy stored in the magnetic field, and α is the relative position angle between the generator stator and rotor.
Substituting formula (10) into formula (11) gives:
3. Optimization of Parameter Sensitivity Analysis
In summary, the main factors affecting the no-load induced electromotive force, cogging torque and air gap flux density are the thickness h1 and width b1 of RPM1, the thickness h2, width b2, and deflection angle β of RPM2, the width ws and height hs of the salient pole shoe, the width wb and height hb of the salient pole body, and the embedding depth h3 of the PM. For HEG with embedded combination poles, the embedding depth h3 is also a key factor influencing the generator's performance [24]. The design variable structure is depicted in Figure 5. Based on the spatial geometric constraints of the generator, the feasible value ranges for each variable are provided in Table 2.
If an agent model is used directly to establish the relationship between variables and optimization objectives, there will be issues with insufficient fitting accuracy and the potential to overlook variables with low sensitivity [25]. The number of initial optimization parameters in this paper is as high as 10, which significantly increases the number of samples required for multi-objective optimization. To reduce the computational time and cost while ensuring the accuracy of the calculations, a sensitivity analysis of the 10 design parameters is conducted before multi-objective optimization. The Pearson coefficients of each design parameter and optimization objective are shown in Figure 6.
To simplify the design space, this paper employs the Latin Hypercube Sampling method in conjunction with the Finite Element Method to analyze and generate the dataset of design variables and optimization objectives. The Pearson correlation coefficient is introduced to assess the correlation between variables, thereby optimizing the design process. The mathematical expression for the Pearson correlation coefficient is as follows:
where xi is the design parameter, yi is the optimization objective, and n is the number of samples. Since different design parameters have varying degrees of influence on each optimization objective, the sensitivity of each design parameter must be calculated to comprehensively consider each optimization objective. The formula is:
where SEMF(xi), STcog(xi), and SBr(xi) are the Pearson correlation coefficients of the no-load induced electromotive force, cogging torque and air gap flux density respectively. wEMF, wTcog, and wBr are the weighting coefficients corresponding to the three optimization objectives respectively.
In the HEG, the air gap flux density has the most significant effect on the generator's performance. Therefore, the weighting coefficients wEMF, wTcog, and wBr are set to 0.25, 0.25, and 0.5 respectively. The integrated sensitivity index is calculated based on formula (14) and (15), using the Pearson correlation coefficients of the design parameters listed in Table 3. The results are presented in Table 3.
Based on the analysis of the integrated sensitivity index presented in Table 3, the design parameters are categorized into two layers according to their sensitivity levels, using a threshold value of 0.5 as the criterion. Parameters with an integrated sensitivity index exceeding 0.5 are classified as highly sensitive, while those with an index below 0.5 are considered less sensitive. Consequently, the design parameters with a combined sensitivity greater than 0.5, specifically the width b1 of RPM1, the width b2 of RPM2, and the deflection angle β of RPM2, are selected for further analysis. The remaining parameters, which have a combined sensitivity less than 0.5, will be evaluated using finite element simulation to determine their optimal values.
4. Establishment and Analysis of Response Surface Model
Based on the results of the sensitivity analysis, three optimized structural parameters and three optimization objectives with significant impacts—A-phase no-load induced electromotive force EA, cogging torque Tcog and air gap flux density Br—are selected for further optimization. The mathematical relationships between the optimization parameters and the optimization objectives are complex and intricate, making traditional functional relationship solving methods impractical. Evaluating the effects of different structural parameters on generator performance using finite element simulation in the subsequent optimization process would be time-consuming. To simplify the problem model, reduce computational effort, and enhance optimization efficiency, a proxy model is constructed to approximate the relationship between the optimization variables and the optimization objectives.
The response surface model is a statistically based model constructed through regression analysis of experimental data. It employs polynomial functions to map the relationship between optimization variables and the optimization objective. This model is particularly suitable for addressing nonlinear problems and is highly effective in solving generator optimization problems. By leveraging the response surface model, parameter optimization can be conducted more efficiently, thereby enhancing the performance of the generator. The specific mathematical form of the response surface model is:
where γ is the regression model coefficient, Xi is the design variable, and ε is the error term.
Using Latin Hypercube Sampling and Central Composite Design (CCD) sampling, 15 sets of important parameter combinations for the optimized design variables are extracted. The corresponding generator performance data are obtained using a finite element simulation. The results are presented in Table 4.
Due to the deviation between parametric modeling and actual generator operation, it is essential to validate the accuracy of the response surface model. This validation process is crucial for ensuring the model's credibility and accuracy. The coefficient of determination, R2 is a statistical measure that evaluates the fit between the experimental model and the actual generator. An R2 value closer to 1 indicates a better fit, thereby more accurately reflecting the generator's actual performance. The expression for calculating R2 is as follows:
where Pi is the actual response value, is the predicted response value, is the mean value, and N is the total number of experiments. The predicted and actual values are normalized as shown in Figure 7.
The coefficients of determination (R2) for the response surface model with respect to EA, Tcog and Br are calculated using the formula (17) and are found to be =0.9856, =0.9767 and =0.9967 respectively. In summary, the experimentally designed response surface model exhibits high prediction accuracy.
From Figure 8, Figure 9 and Figure 10, it is evident that increasing the width of RPM1 (b1), the width of RPM2 (b2), and the deflection angle (β) enhances EA and Br to their maximum values. However, this also leads to an increase in Tcog. When the optimization parameters exceed a certain range, EA and Br exhibit a decreasing trend, while Tcog decreases again. Different parameter combinations have varying impacts on EA, Tcog, and Br. Therefore, in the design and optimization process, the effects of these parameters must be considered comprehensively to achieve optimal results.
5. Multi-Objective Optimization and Simulation Verification
5.1. Multi-Objective Optimization
Since the fitted plots of the design variables and response values can only reflect the influence of two parameters on the response values and cannot intuitively derive the PM structural parameters under the optimal solutions for EA, Tcog and Br, further optimization is conducted on the results of the best predictive meta-model adaptive sampling algorithm. This process aims to elucidate the impact of the design variables on the characteristics of the response values. Adaptive genetic algorithms are employed to determine the PM structural parameters under the relatively optimal solutions for EA, Tcog and Br.
From the derivation of the above formula, it is evident that each structural parameter of the generator is not independent. The interconnection between each parameter has a complex and variable impact on the generator's performance. Finite element simulation is utilized to investigate the effects of various PM structural parameters on generator performance, with the goal of maximizing the EA and Br, while minimizing the Tcog. The mathematical models for these three optimization objectives are presented as follows:
An adaptive genetic algorithm is designed to adjust the variance and crossover factors. The crossover probability and variance probability are adaptively tuned to generate the 3D distribution of the Pareto front, which contains the effective solutions of the optimization model, as shown in Figure 11. In the figure, the x, y, and z-axes represent Br, Tcog and EA respectively. The red dots indicate input variables that meet the constraints, while the black dots represent input variables that do not meet the constraints. The gray triangles delineate the irregular surface domain of the Pareto front. The input variables of the relatively optimal solutions lie on the Pareto front surface. Some of the optimal solutions from the Pareto front distribution map are presented in Table 5.
Based on the above analysis, to determine the optimal solution from the Pareto front distribution graph, the value of the parameter matching coefficient k must be defined. A larger value of k indicates better generator performance. Therefore, the three optimization objectives are assigned to the following expression:
where Q1, Q2, and Q3 denote the weighted scale factors. Specifically, Q1 is assigned 0.4, Q2 is assigned 0.3, and Q3 is assigned 0.6. EA0 is 18.96V, representing the no-load induced electromotive force in phase A before optimization. Tcog0 is 177.08mN·m, indicating the generator cogging torque before optimization. Br0 is 0.789T, representing the generator air gap flux density before optimization.
Based on the evaluation function derived from the above weighted assignment method and considering the optimization magnitude of EA, Tcog and Br, the optimal solution is selected from the Pareto front. The results are verified by simulation, and the value of k is obtained according to the parameter matching coefficient formula, as shown in Figure 12. According to the optimization objective conditions, sample point 263 is identified as the relatively optimal solution for model optimization. The comparison of generator structural parameters before and after optimization is presented in Table 6.
5.2. Simulation Verification
To verify the correctness of the optimized design, the no-load induced electromotive force, cogging torque and air gap flux density are compared and verified using finite element simulation based on the rotor structural parameters of the generator before and after optimization. As shown in Figure 13, the no-load induced electromotive force of the generator increases by 1.18V to 20.14V after optimization, and the optimized waveform of the no-load induced electromotive force is smoother. According to Figure 14, the fundamental amplitude of the no-load induced electromotive force waveform increases by 1.58V, the 3rd, 5th, and 7th harmonics are virtually eliminated, and the 9th and 13th harmonics are significantly reduced after optimization.
As shown in Figure 15, the optimized cogging torque has been significantly reduced from 177.08mN·m to 90.52mN·m, representing a decrease of 48.88%.
The total harmonic distortion (THD) of the air gap flux density waveform is a key indicator of the performance of the HEG. It is typically calculated based on the harmonic amplitude. A lower THD indicates less harmonic content and a waveform that more closely approximates a sinusoidal shape. The THD is calculated using the following formula:
As shown in Equation (17) and Figure 16, the optimized air gap flux density has increased by 5.07%, from 0.789T to 0.829T. The waveform aberration rate has decreased to 2.38%, which is a 39.3% reduction compared to the pre-optimization value. This indicates a significant improvement in the sinusoidal nature of the air gap flux density waveform. The Fourier function decomposition of the air gap flux density waveform is performed, and the comparison of the harmonic amplitudes before and after optimization is shown in Figure 17. The fundamental amplitude increased by 0.054T, while the amplitudes of the 3rd, 5th, 7th, 9th, and 13th harmonics decreased.
6. Experimental Verification
A three-phase, 8-pole, 36-slot built-in U-shape permanent magnet with salient pole electromagnetic HEG is prototyped based on the optimization results presented in the previous section. The generator stator and rotor are shown in Figure 18. The prototype's performance is evaluated using a generator test platform. Showing in Figure 19, this platform features a comprehensive performance test system that is suitable for various models of automotive generators. It allows for manual control of the generator, including setting the generator speed, regulating the electronic load, and increasing the load current. The system is user-friendly and offers comprehensive test capabilities.
Under no-load conditions, the experimental results for the generator's induced electromotive force are presented in Figure 20. As the excitation current varies from -3 A to 3 A, the output voltage curve of the compound-excited generator is depicted in Figure 21 and Figure 22, with increasing speed.
When the generator operates at its rated speed, it can maintain the rated output voltage under various load power conditions by adjusting the excitation current. The performance curve obtained in this process is the regulation characteristic curve, as shown in Figure 23. As the load current increases, the load power rises, and the excitation current required to maintain a stable output voltage grows approximately linearly. When the load current exceeds 65.8A and the load power exceeds 800W, the excitation current must be greater than 0A to ensure the rated voltage output. At this point, the slope of the regulation characteristic curve increases, indicating that a greater increase in excitation current is needed to maintain voltage stability for the same increment in load current.
Conversely, when the load current is below 64.3A and the load power is below 750W, the excitation current must be less than 0A to maintain a stable output voltage. In this case, the slope of the regulation characteristic curve is small, indicating that a small change in excitation current can significantly affect the output voltage.
Under rated load conditions, with a load power of 1000W and a load current of 73.5A, the excitation current is only 1.5A. At this point, the generator is primarily dominated by the PMF, with the EEMF providing auxiliary support, thereby reducing excitation losses.
When the generator operates at half-load, with a load power of 500W and a load current of 53.7A, the excitation current is -1.9A. Here, the EEMF weakens the PMF to achieve a stable output voltage. When the load power reaches 1200 W, the generator enters an overload condition, and the excitation current is 2.6A. At this point, the EEMF enhances the synthetic magnetic field to meet the higher power demand.
Overall, comprehensive analyses demonstrate that the designed HEG exhibits excellent voltage regulation performance.
7. Conclusions
This paper presents a novel design structure for a generator. By establishing an EMC model, expressions for no-load induced electromotive force, cogging torque and air gap flux density are derived. Optimization parameters are selected based on a sensitivity analysis. The no-load induced electromotive force, cogging torque and air gap flux density amplitude are chosen as optimization objectives, and the structural dimensions of the rotor and PM are optimized using a multi-objective genetic algorithm. As a result, the optimized no-load induced electromotive force increased from 18.96V to 20.14V, representing a 6.22% improvement; the cogging torque decreased from 177.08mN·m to 90.52mN·m, a 48.88% reduction; the air gap flux density increased from 0.789T to 0.829T, a 5.07% improvement; and the air gap flux density waveform distortion rate decreased from 6.22% to 2.38%, a 39.3% reduction.
A prototype is fabricated based on the optimized generator parameters and experimentally verified. The experimental results demonstrate that the generator can maintain a stable output voltage by adjusting the excitation current. Under rated load conditions, when the excitation current is 1.5A, the HEG is primarily dominated by the PMF and supplemented by the EEMF, thereby reducing excitation losses. Under overload conditions, the EEMF enhances the synthetic magnetic field to meet the higher power demand.
The optimized design is validated through prototype fabrication and experimental testing. The experimental results are in good agreement with the finite element simulation results, confirming the validity and feasibility of the optimized design. The optimized generator achieves the expected performance goals, exhibiting excellent voltage regulation and electromagnetic performance, which meet the application requirements.
Author Contributions
Conceptualization, S.M. and K.C.; methodology, S.M; software, K.C. and J.M; validation, S.M., Y.W. and C.L.; formal analysis, S.M. K.C and J.M; writing—original draft preparation, K.C.; writing—review and editing,S.M., C.L. and Y.W.; supervision, S.M.; project administration, S.M.; funding acquisition, S.M. All authors have read and agreed to the published version of the manuscript.
Funding
This research was funded by the National Natural Science Foundation of China (grant number: 52305276), the Tianjin Education Commission Research Program Project (grant number: ), and the Tianjin University of Technology and Education Scientific Research Project (grant number: KYQD202339). We have carefully checked and found that the information about the funds is accurate.
Data Availability Statement
The data presented in this study are included in the article.
Conflicts of Interest
The authors declare no conflict of interest.
References
- Zhang, X.; Du, Q.; Xu, J.; et al. Development and Analysis of the Magnetic Circuit on Double-Radial Permanent Magnet and Salient-Pole Electromagnetic Hybrid Excitation Generator for Vehicles. Chinese Journal of Mechanical Engineering 2019, 32, 33. [CrossRef]
- Zhao, C.; Qin, H.; Zhang, Z.; et al. Structural and Principle Analysis of Radial Structure Hybrid Excitation Synchronous Generator with Magnetic Shunt. Proceedings of the CSEE 2008, 28, 145–150.
- Wenjing, H.; Xueyi, Z.; Huihui, G.; et al. Electromagnetic Design and Flux Regulation Analysis of New Hybrid Excitation Generator for Electric Vehicle Range Extender. Journal of Electrical and Computer Engineering 2021, 2021. [CrossRef]
- Zhu, C.; Wang, X.; Yang, Y.; et al. Structural and Voltage Regulation Analysis of Parallel Hybrid Excitation Synchronous Generator under Double-Pole Induction. Proceedings of the CSEE 2020, 40, 7890–7898+8226. [CrossRef]
- Hui, Y.; Hao, Z.; Q., Z.Z.; et al. Comparative Study of Partitioned Stator Memory Machines with Series and Parallel Hybrid PM Configurations. IEEE Transactions on Magnetics 2019, 55, 1–8. [CrossRef]
- Wang, X.; Qiao, D.; Zhu, C. Finite Element Analysis of Magnetic Field Regulation Characteristics of New Type of Hybrid Excitation Brushless Claw-Pole Generator. Journal of Electrical Control Engineering 2013, 17, 99–104. [CrossRef]
- Qiao, D.; Wang, X.; Zhu, C. Analysis and Experimental Study of Magnetic Field Regulation Characteristics of New Type of Hybrid Excitation Brushless Claw-Pole Generator. Proceedings of the CSEE 2013, 33, 115–121. [CrossRef]
- Geng, W.; Zhang, Z.; Yu, L.; et al. Structure Principle and Magnetic Field Regulation Characteristics of New Type of Parallel Hybrid Excitation Brushless DC Motor. Transactions of China Electrotechnical Society 2013, 28, 131–137+154. [CrossRef]
- Zhao, C. Structure Design and Characteristics of Series Magnetic Circuit Hybrid Excitation Claw-Pole Generator. Transactions of China Electrotechnical Society 2009, 24, 1–6+12. [CrossRef]
- Zhang, Z.; Wang, D.; Hua, W. Review and Prospect of Structure Principle, Design and Operation Control Technology of Hybrid Excitation Motor. Proceedings of the CSEE 2020, 40, 7834–7850+8221. [CrossRef]
- Zhu, X.; Cheng, M.; Zhao, W.; et al. Review and Prospect of Hybrid Excitation Motor Technology. Transactions of China Electrotechnical Society 2008, 23, 30–39. [CrossRef]
- Gu, X.; Zhang, Z.; Sun, L.; et al. Magnetic Field Enhancement Characteristic of an Axially-Parallel Hybrid Excitation DC Generator. IEEE Transactions on Magnetics 2020, PP, 1–1. [CrossRef]
- Xiangpei, G.; Zhuoran, Z.; Linnan, S.; et al. Phase Displacement Characteristics of a Parallel Hybrid Excitation Brushless DC Generator. IEEE Transactions on Energy Conversion 2020, 35, 1–1. [CrossRef]
- Gong, H.; Zhang, Y.; Wang, L.; et al. Rotor Pole Matching of Parallel Rotor Hybrid Excitation Synchronous Generator. Journal of Electrical Control Engineering 2020, 24, 128–137. [CrossRef]
- Shilong, Y.; Xueyi, Z.; Jun, Z.; et al. Magnetic Field Analysis and Performance Optimization of Dual-Rotor Hybrid Excitation Generator for Automobile. Machines 2022, 10, 816. [CrossRef]
- Geng, H.; Zhang, X.; Yan, S.; et al. Magnetic Field Analysis and Performance Optimization of Hybrid Excitation Generators for Vehicles. Sustainable Energy Technologies and Assessments 2022, 52, e102222. [CrossRef]
- Wenjing, H.; Xueyi, Z.; Huihui, G.; et al. Electromagnetic Design and Flux Regulation Analysis of New Hybrid Excitation Generator for Electric Vehicle Range Extender. Journal of Electrical and Computer Engineering 2021, 2021. [CrossRef]
- Mengyao, W.; Baoquan, K.; Lu, Z.; et al. A Novel Hybrid Excitation Doubly Salient Generator with Separated Windings by PM Inserted in Stator Slot for HEVs. Energies 2022, 15, 7968. [CrossRef]
- Wei, C.; Wu, Q.; Bao, J.; et al. Structural Design and Parameter Optimization of Parallel Claw-Pole Hybrid Excitation Motor for New Energy Vehicles. Science Technology and Engineering 2025, 25, 1496–1502. [CrossRef]
- Yujing, G.; Ping, J.; Heyun, L.; et al. Design and Analysis of a Flux Intensifying Permanent Magnet Embedded Salient Pole Wind Generator. AIP Advances 2018, 8, 056627. [CrossRef]
- Huihui, G.; Yi, X.Z.; Yanhong, G.; et al. Performance Analysis and Optimization of Built-In Permanent Magnet and Salient-Pole Electromagnetic Hybrid Excitation Generators for Vehicles. Journal of Engineering 2022, 2022. [CrossRef]
- Huihui, G.; Xueyi, Z.; Yufeng, Z.; et al. Development of Brushless Claw Pole Electrical Excitation and Combined Permanent Magnet Hybrid Excitation Generator for Vehicles. Energies 2020, 13, 4723. [CrossRef]
- Yan, S.; Zhang, X.; Gao, Y. Influence of Rotor Internal Slotting on Cogging Torque of Segmented Permanent Magnet Synchronous Motor. Journal of Xi’an University of Technology 2022, 38, 433–441. [CrossRef]
- Ma, S.; Chen, K.; Zhang, Q. Analysis of Multi-Objective Optimization Design of Interior Double Radial and Tangential Combined Magnetic Pole Permanent Magnet Drive Motor for Electric Vehicles. World Electric Vehicle Journal 2024, 15, 4. [CrossRef]
- Huang, C.; Li, S.; Liu, X.; et al. Multi-Objective Optimization Method of Permanent Magnet Assisted Synchronous Reluctance Motor Based on KELM-NSGA-II. Science Technology and Engineering 2025, 25, 1065–1074.
Figure 1.
Schematic diagram of the HEG structure.
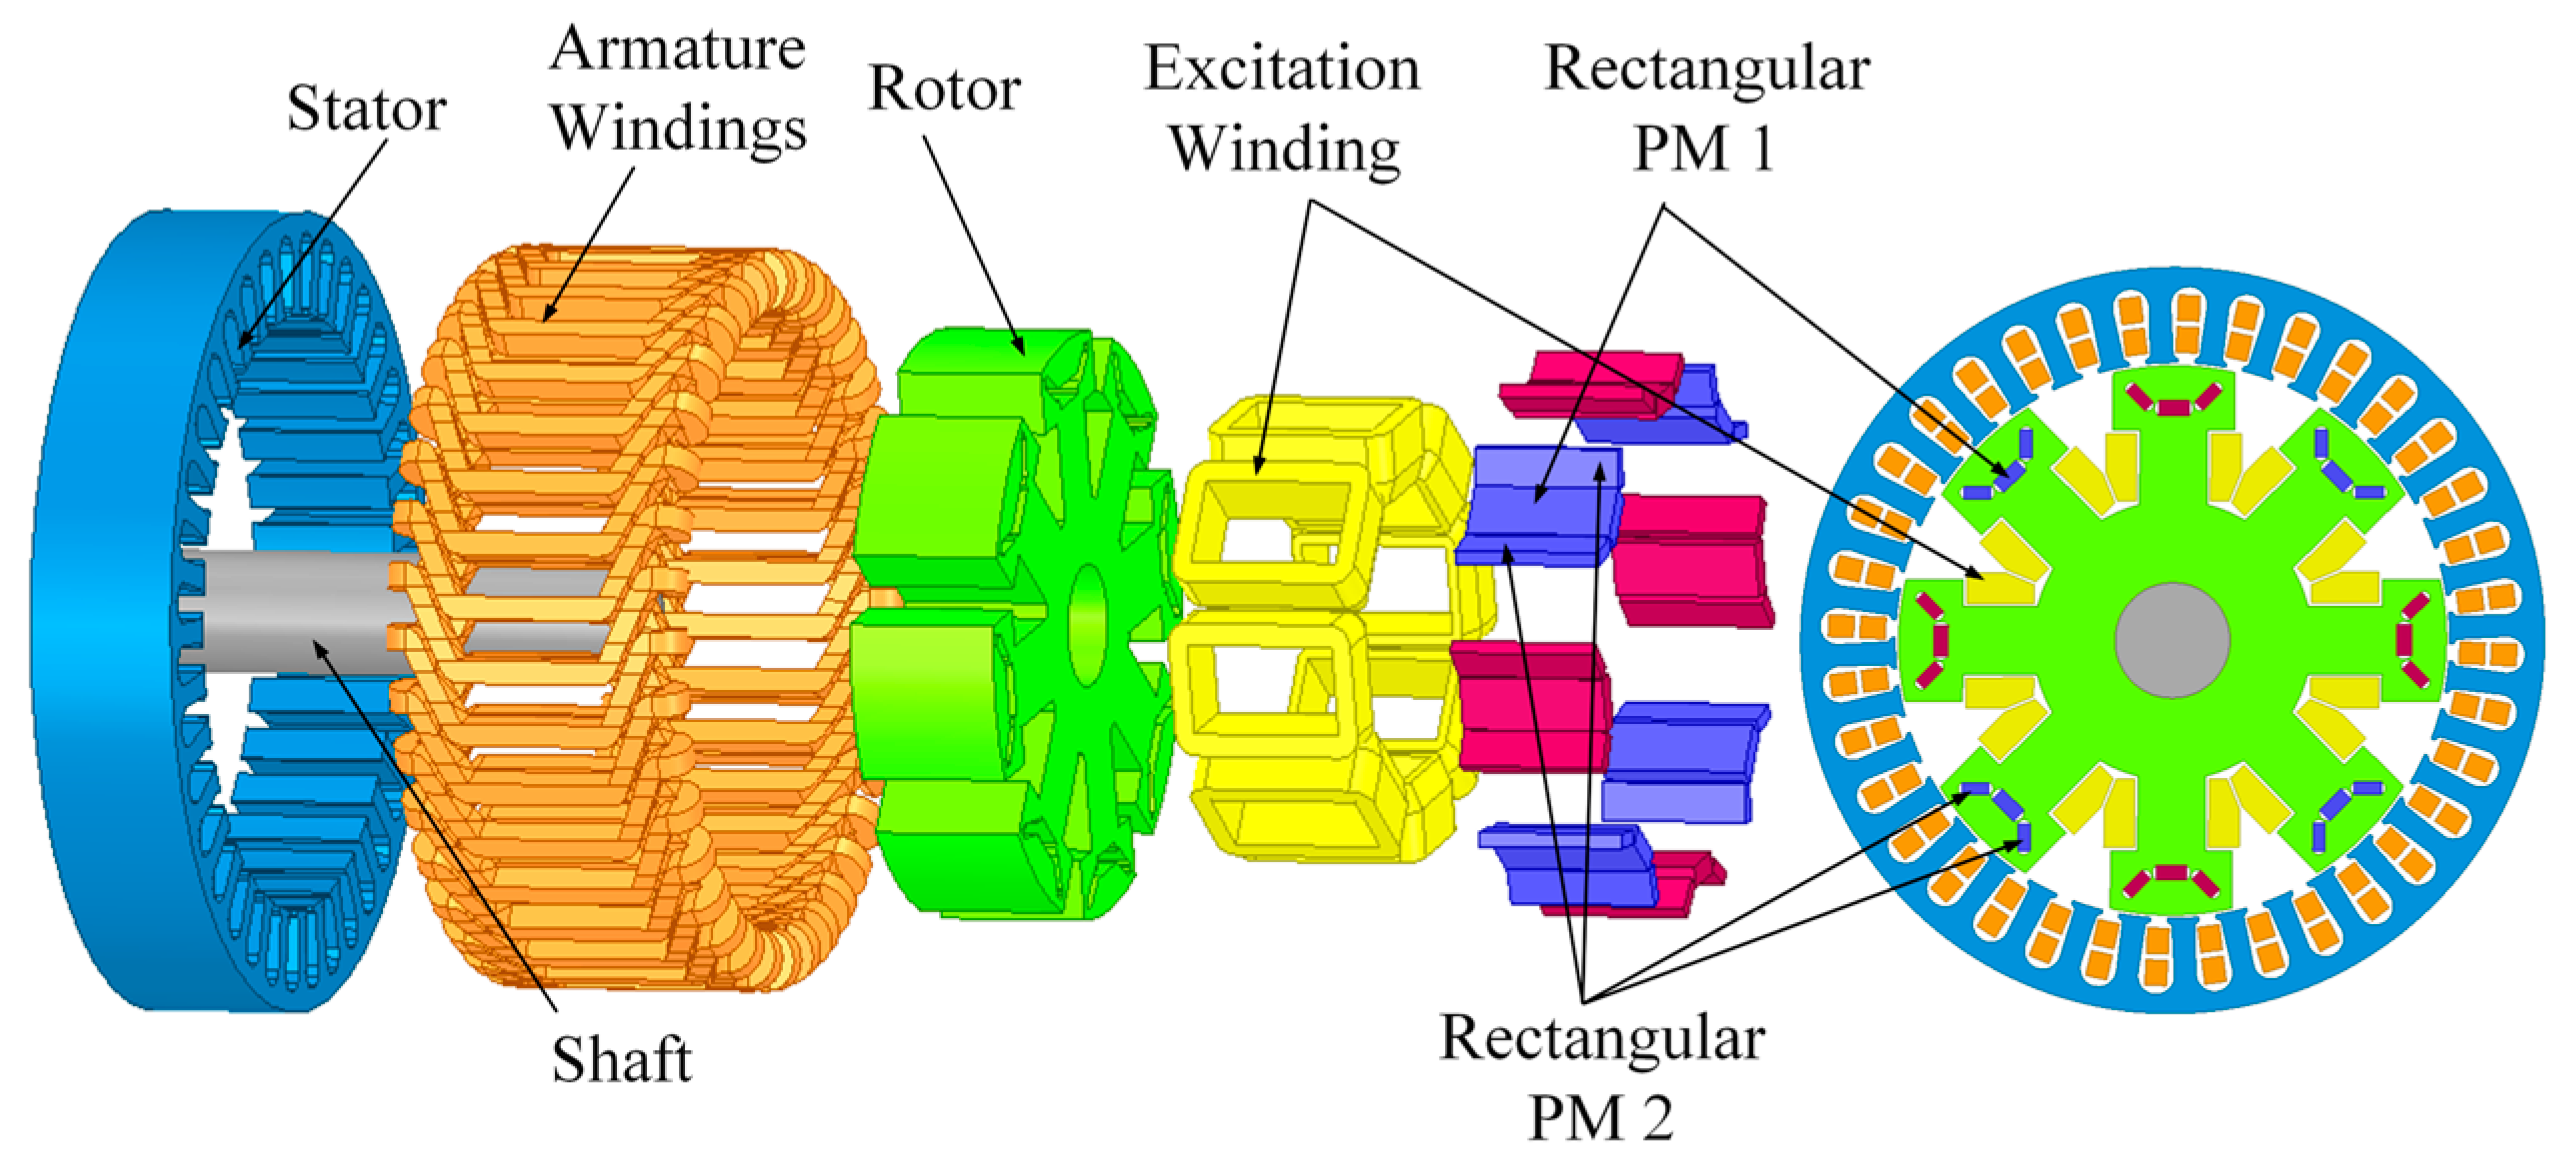
Figure 2.
Magnetic flux density distribution between EEG and HEG.
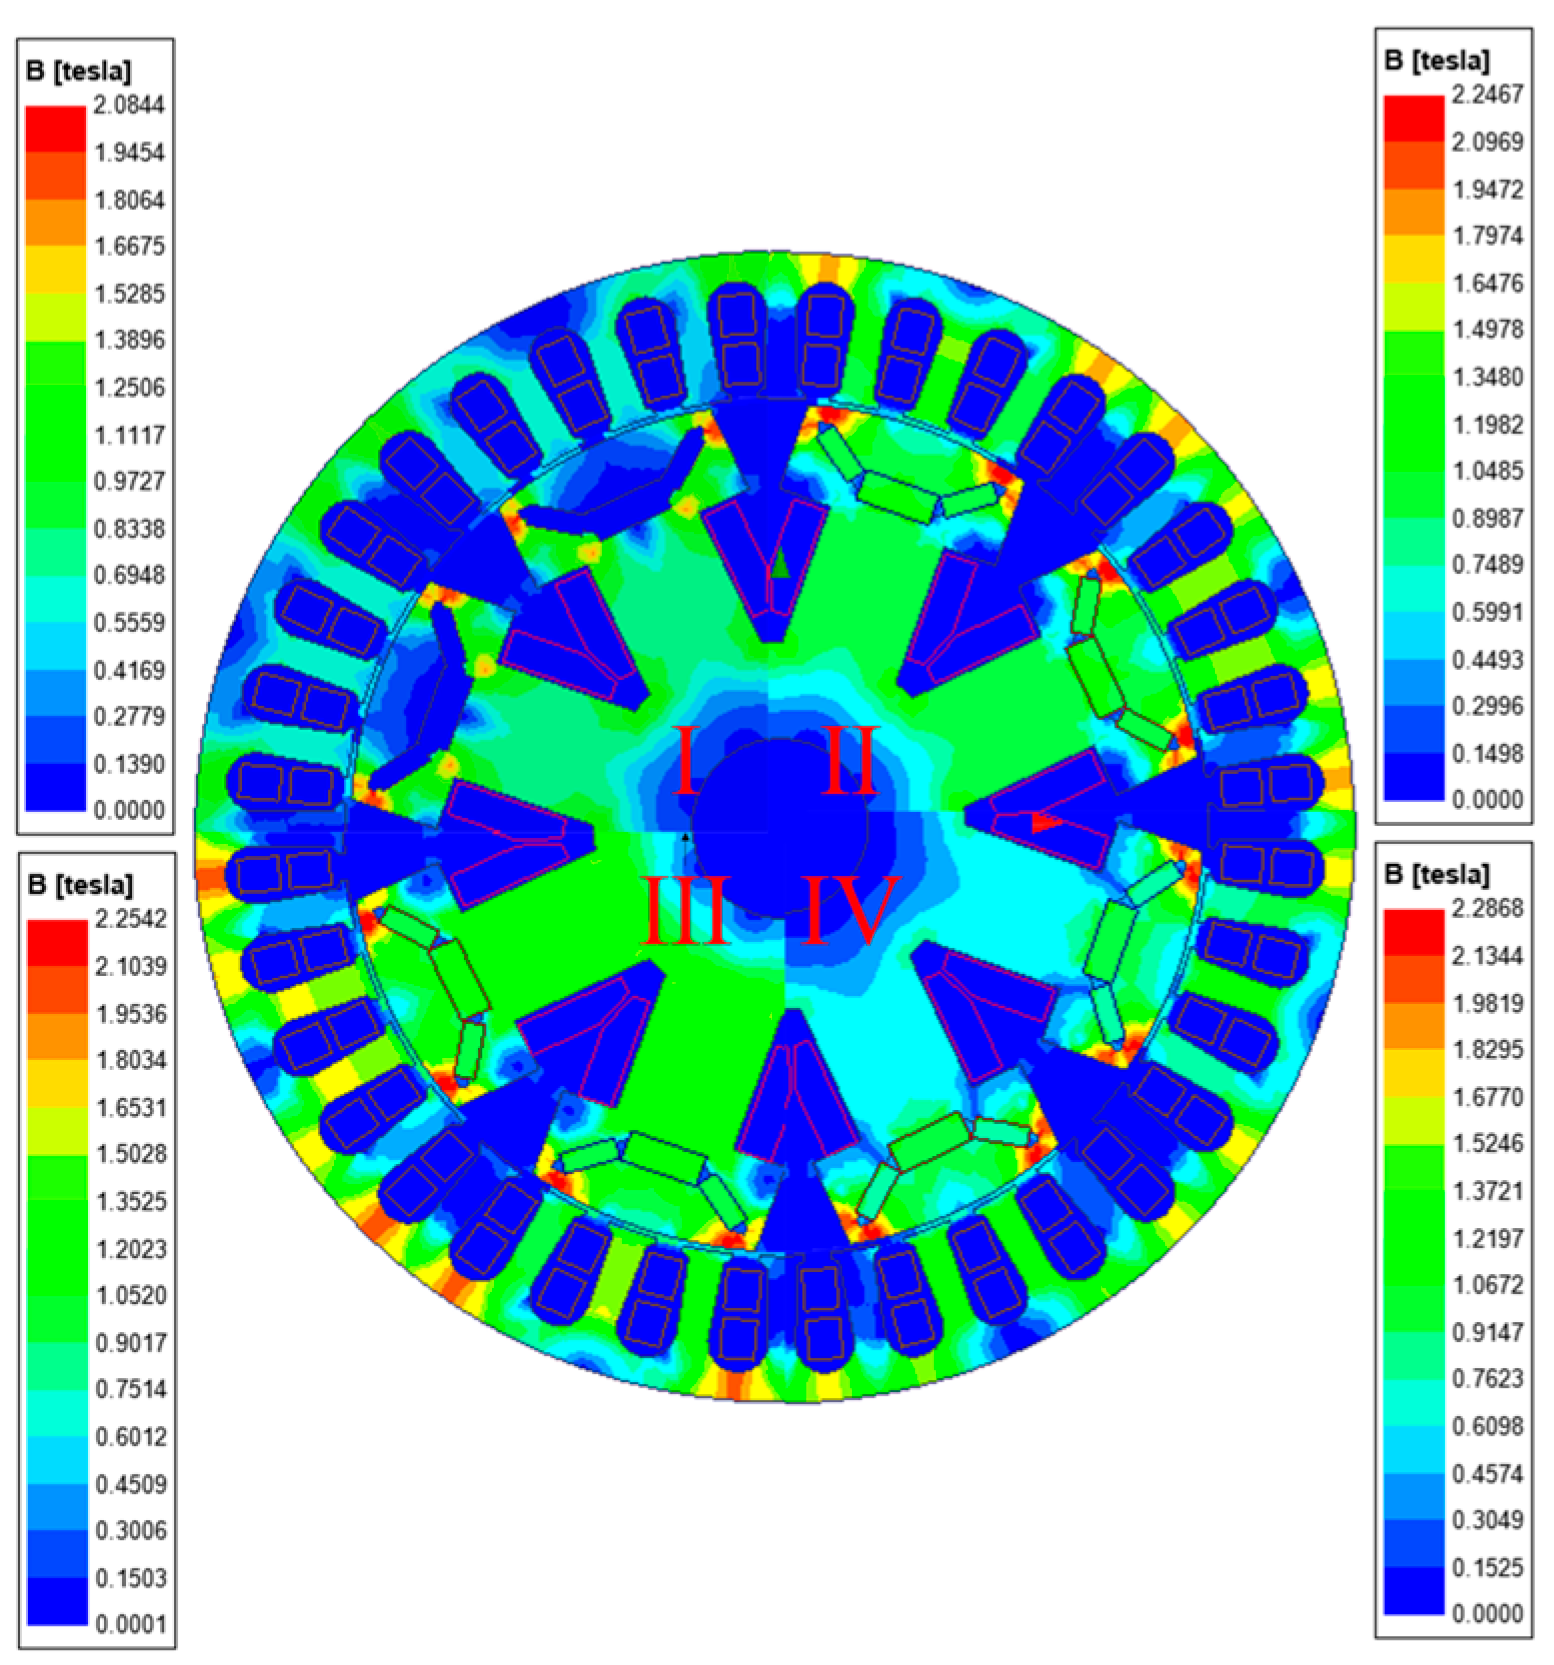
Figure 3.
Magnetic circuit distribution of the HEG.
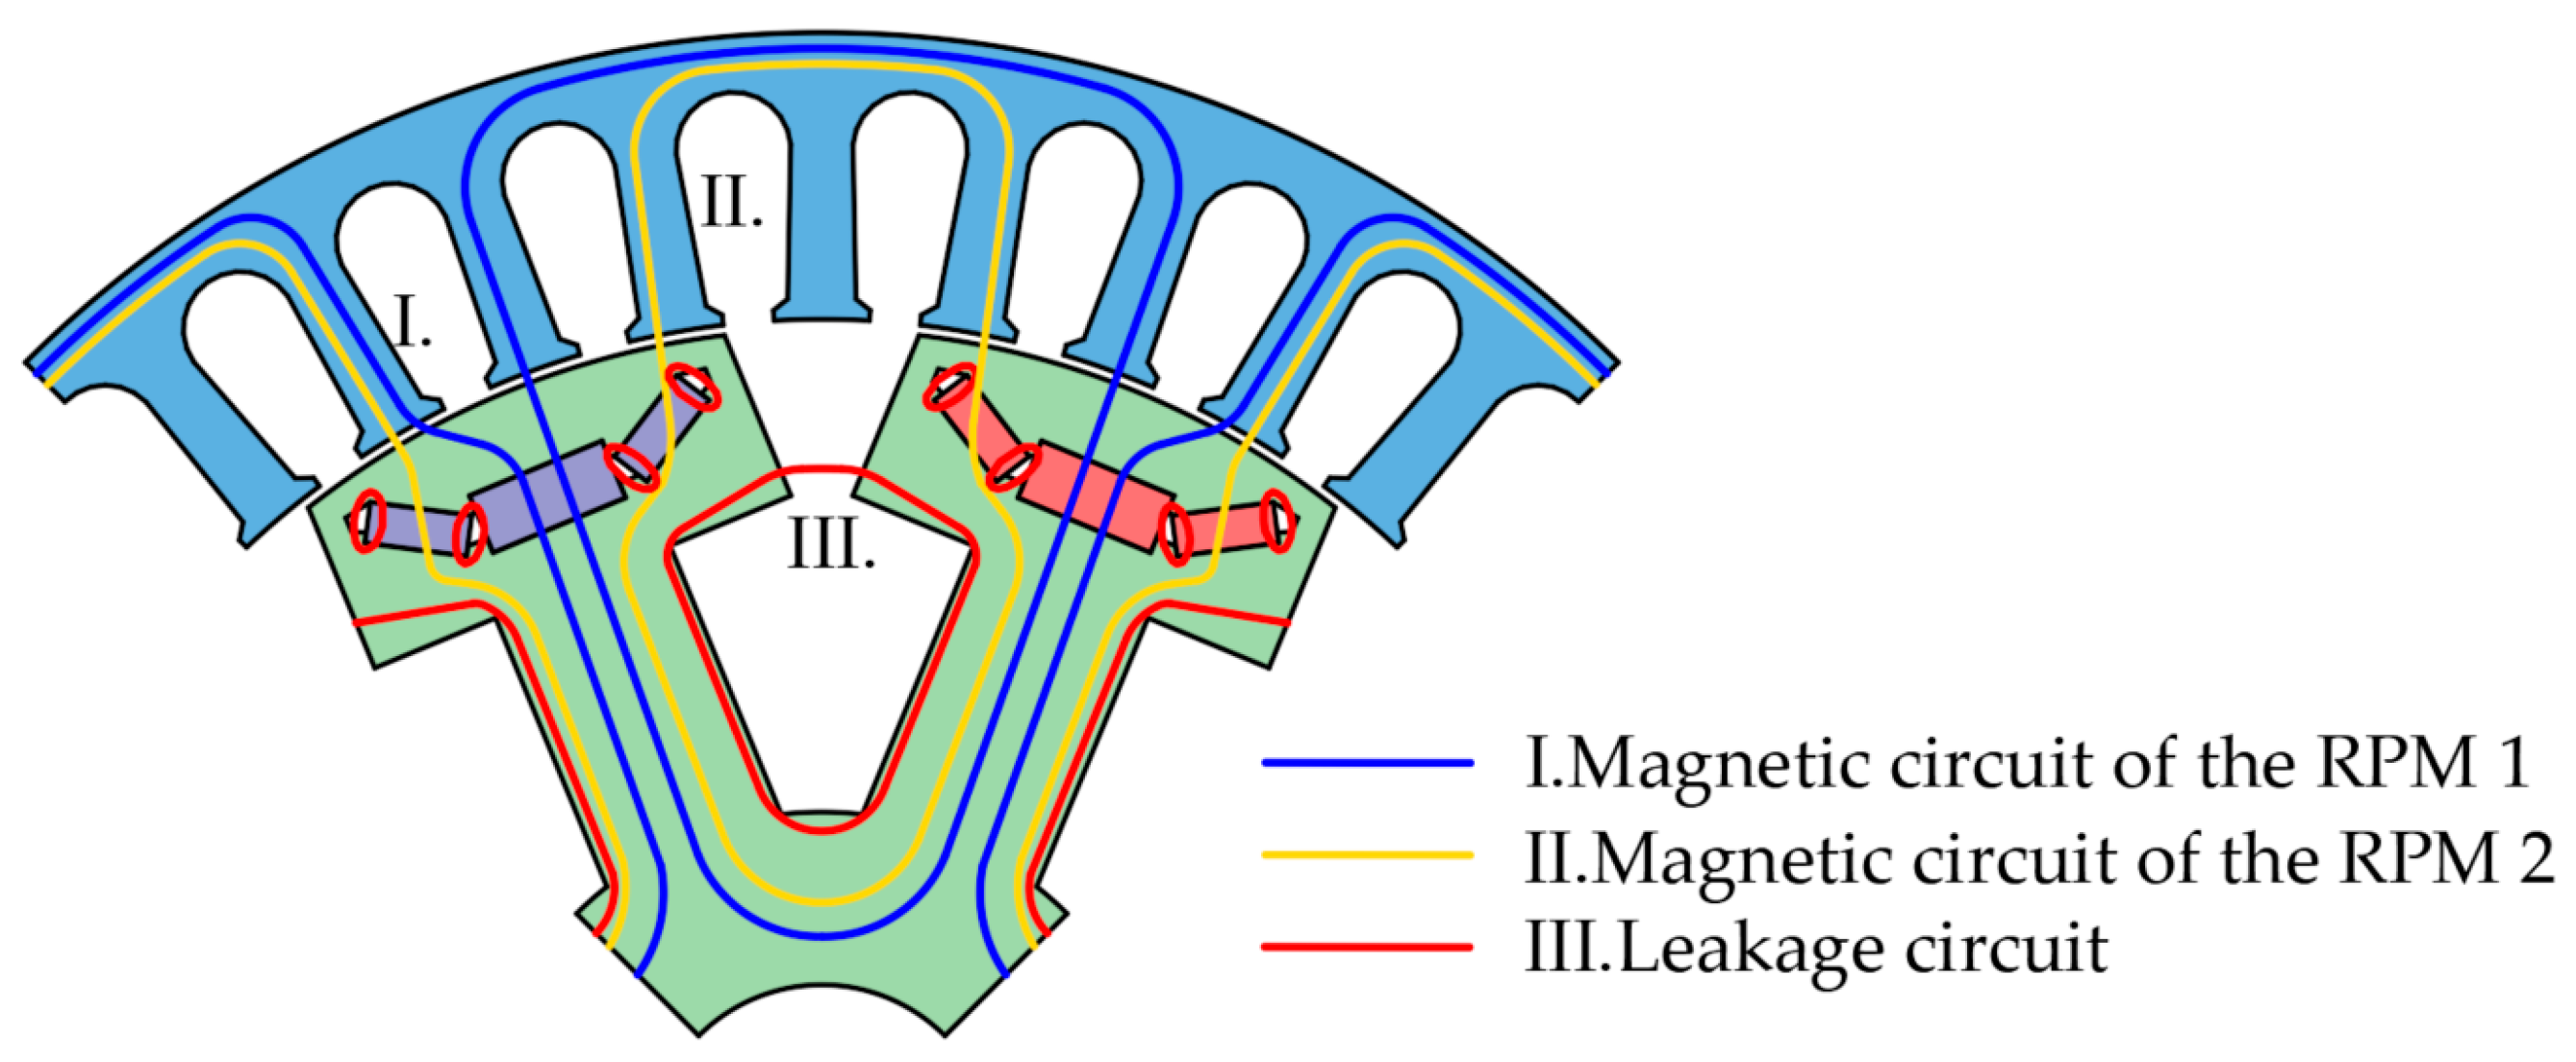
Figure 4.
EMC diagram of the HEG: (a) Magnetic circuit of RPM1; (b) Magnetic circuit of RPM2.
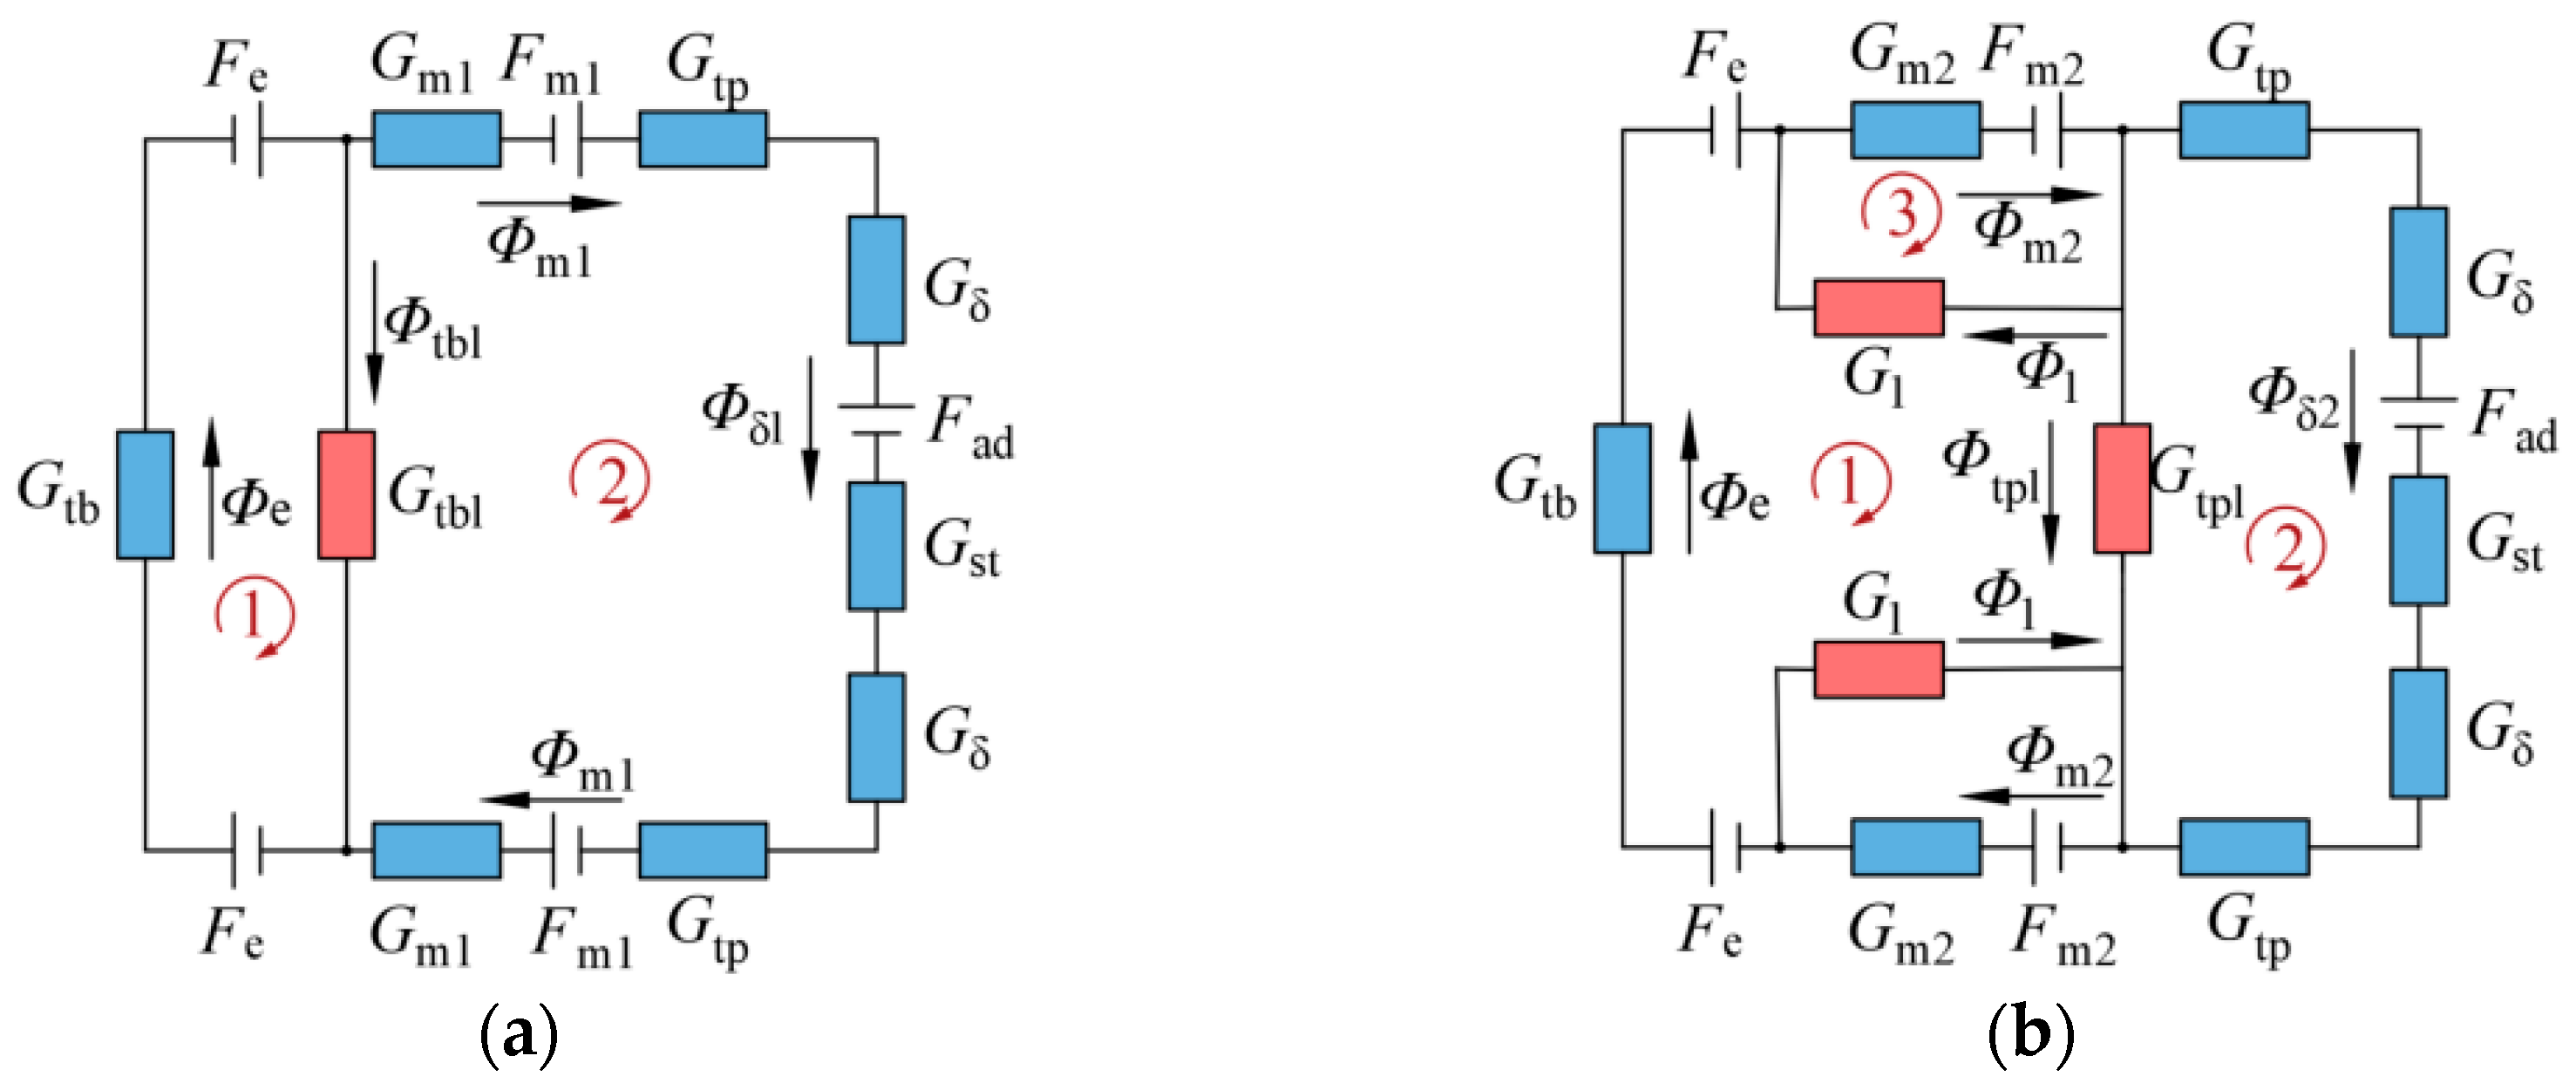
Figure 5.
Design parameters of a single salient pole structure.
Figure 6.
Pearson coefficient diagram of each design parameter and optimization target.
Figure 7.
Normalization of predicted and actual values.
Figure 8.
Response surfaces of b1, b2, and β with EA: (a) Effect of b1 and b2 on EA; (b) Effect of b1 and β on EA; (c) Effect of b2 and β on EA.
Figure 8.
Response surfaces of b1, b2, and β with EA: (a) Effect of b1 and b2 on EA; (b) Effect of b1 and β on EA; (c) Effect of b2 and β on EA.
Figure 9.
Response surfaces of b1, b2, and β with Tcog: (a) Effect of b1 and b2 on Tcog; (b) Effect of b1 and β on Tcog; (c) Effect of b2 and β on Tcog.
Figure 9.
Response surfaces of b1, b2, and β with Tcog: (a) Effect of b1 and b2 on Tcog; (b) Effect of b1 and β on Tcog; (c) Effect of b2 and β on Tcog.
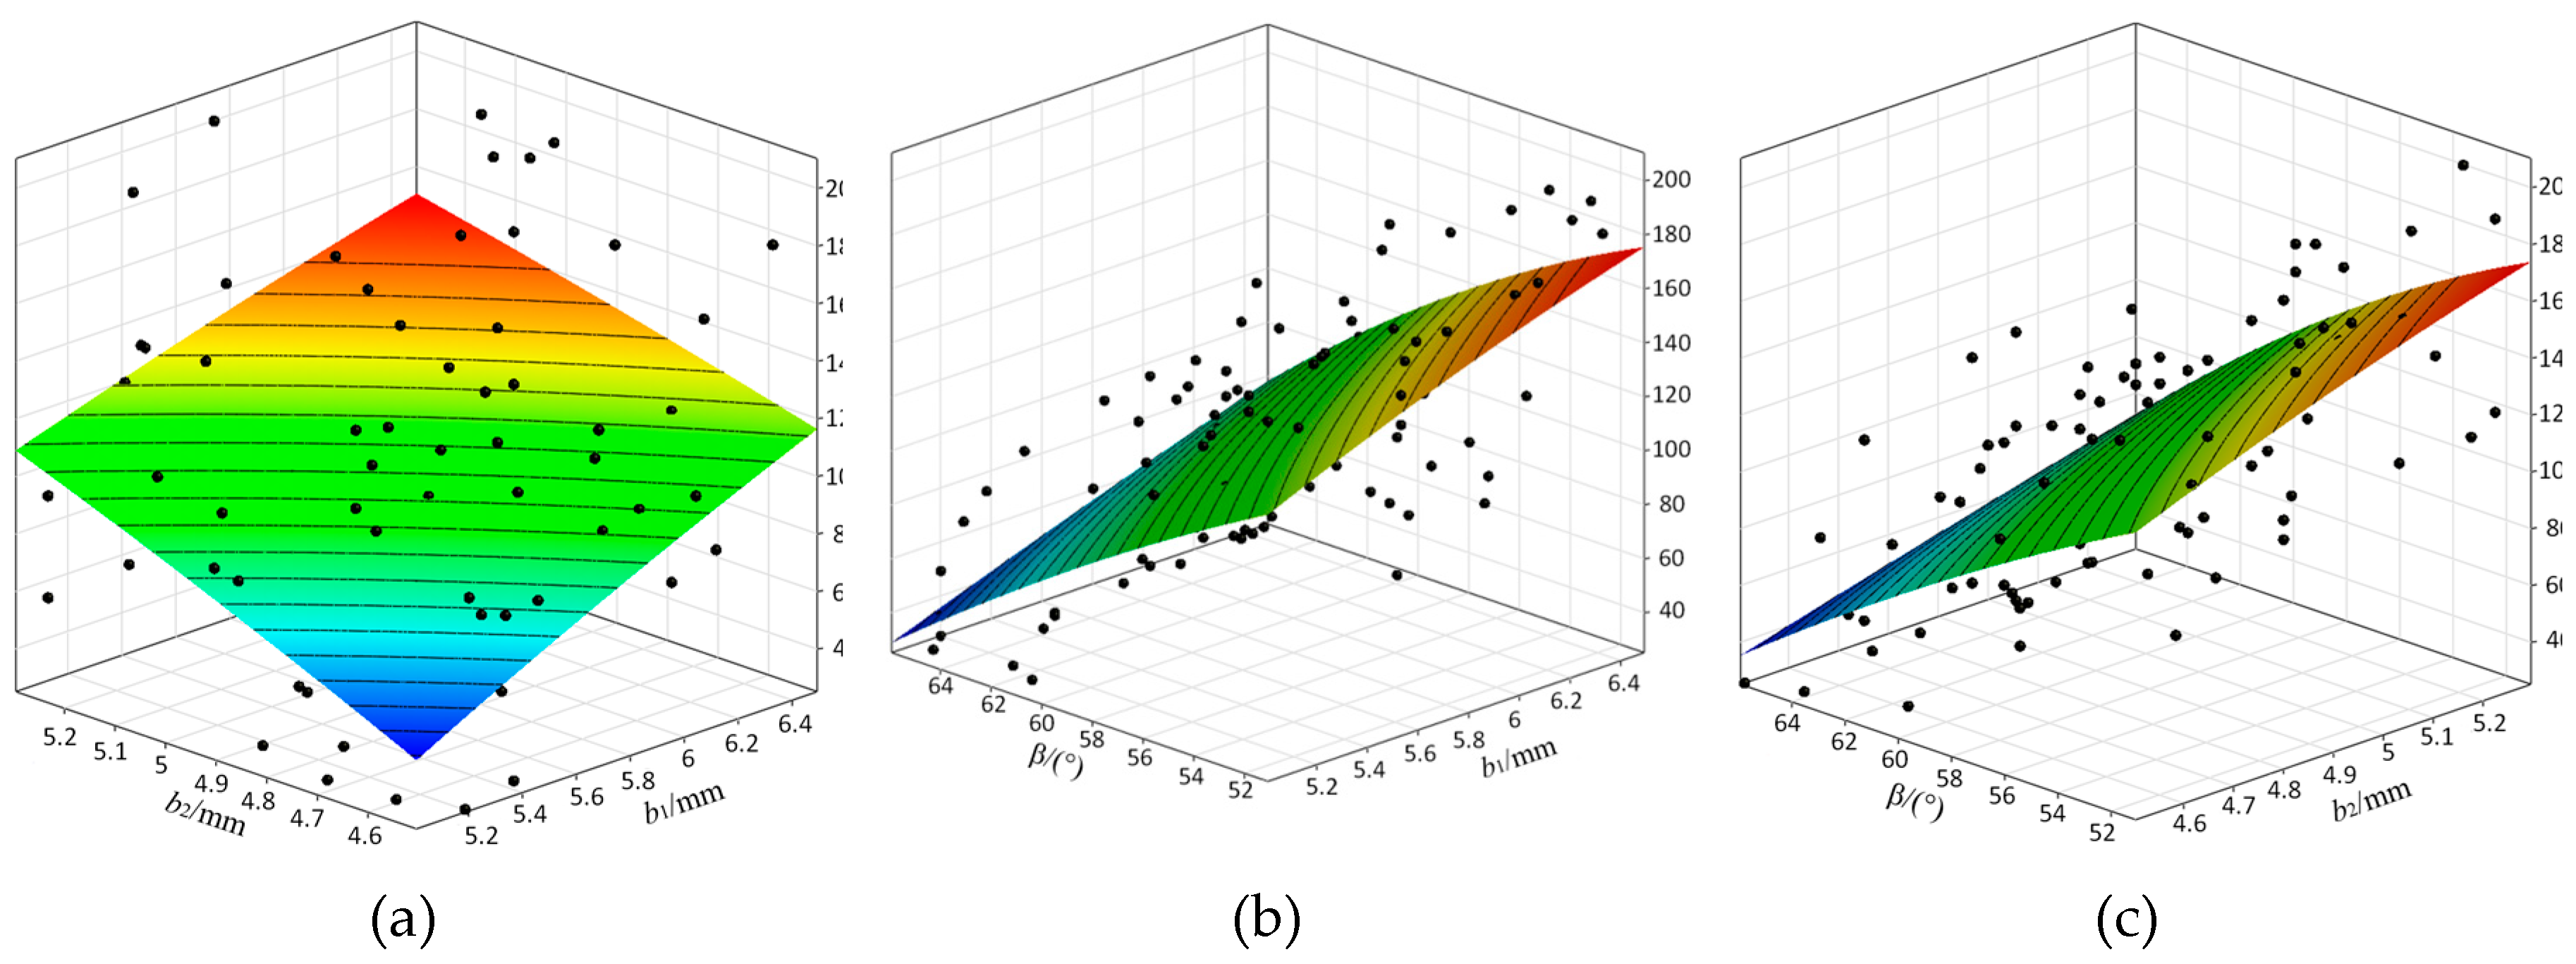
Figure 10.
Response surfaces of b1, b2, and β with Br: (a) Effect of b1 and b2 on Br; (b) Effect of b1 and β on Br; (c) Effect of b2 and β on Br.
Figure 10.
Response surfaces of b1, b2, and β with Br: (a) Effect of b1 and b2 on Br; (b) Effect of b1 and β on Br; (c) Effect of b2 and β on Br.
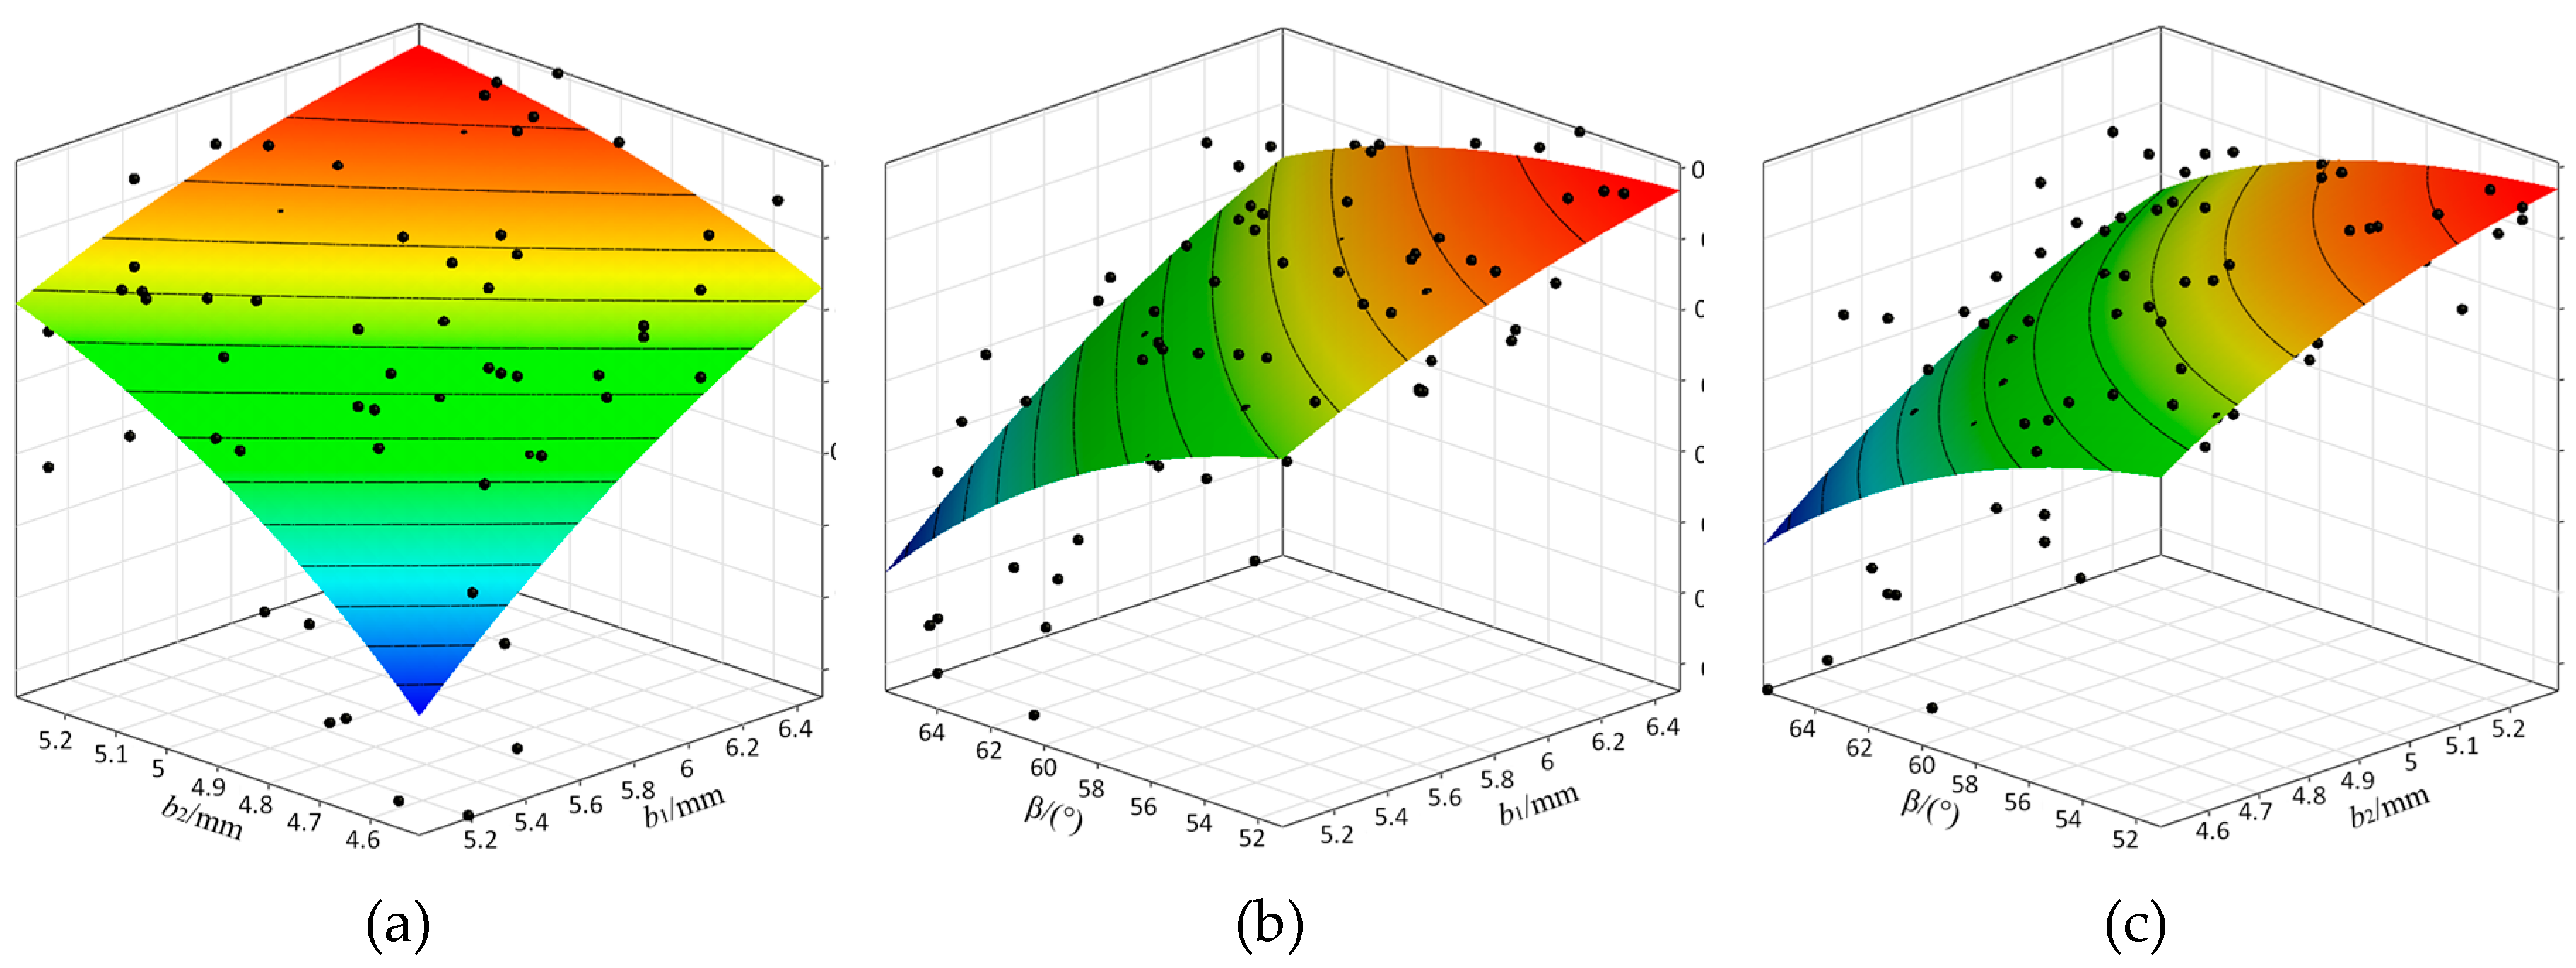
Figure 11.
3D Distribution of the pareto front.
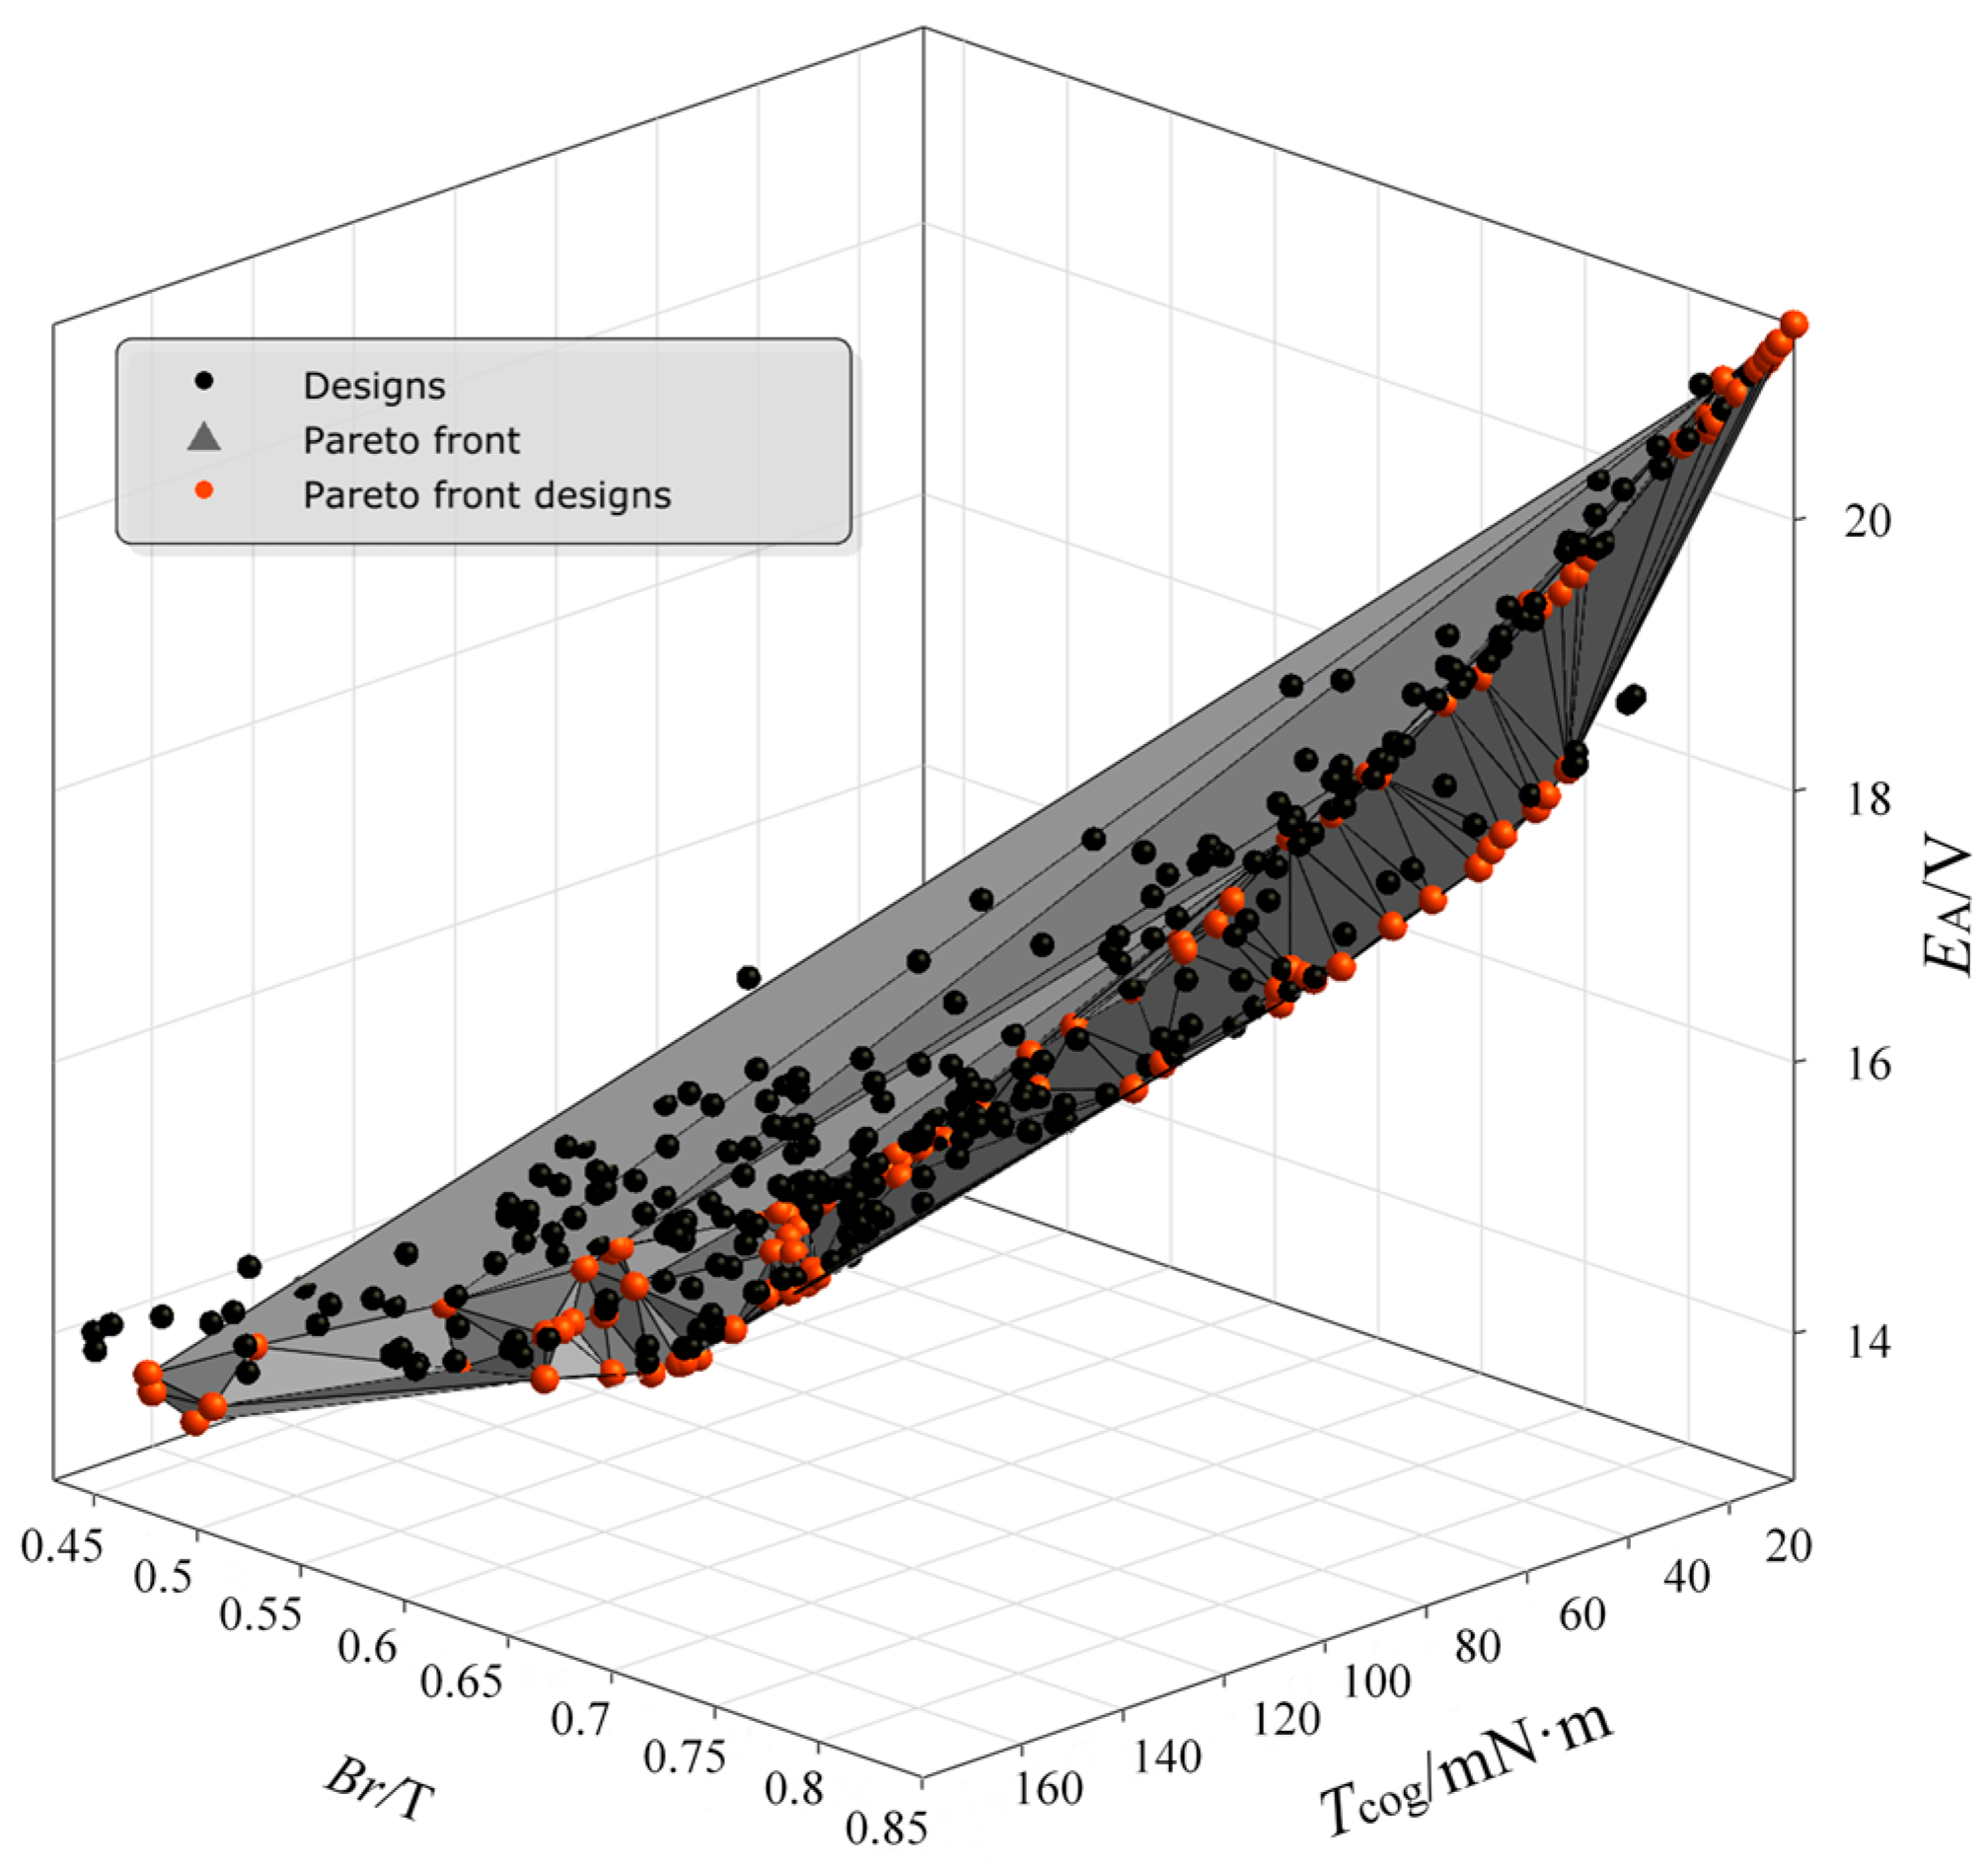
Figure 12.
Statistical chart of the k-value of the parameter matching coefficient.
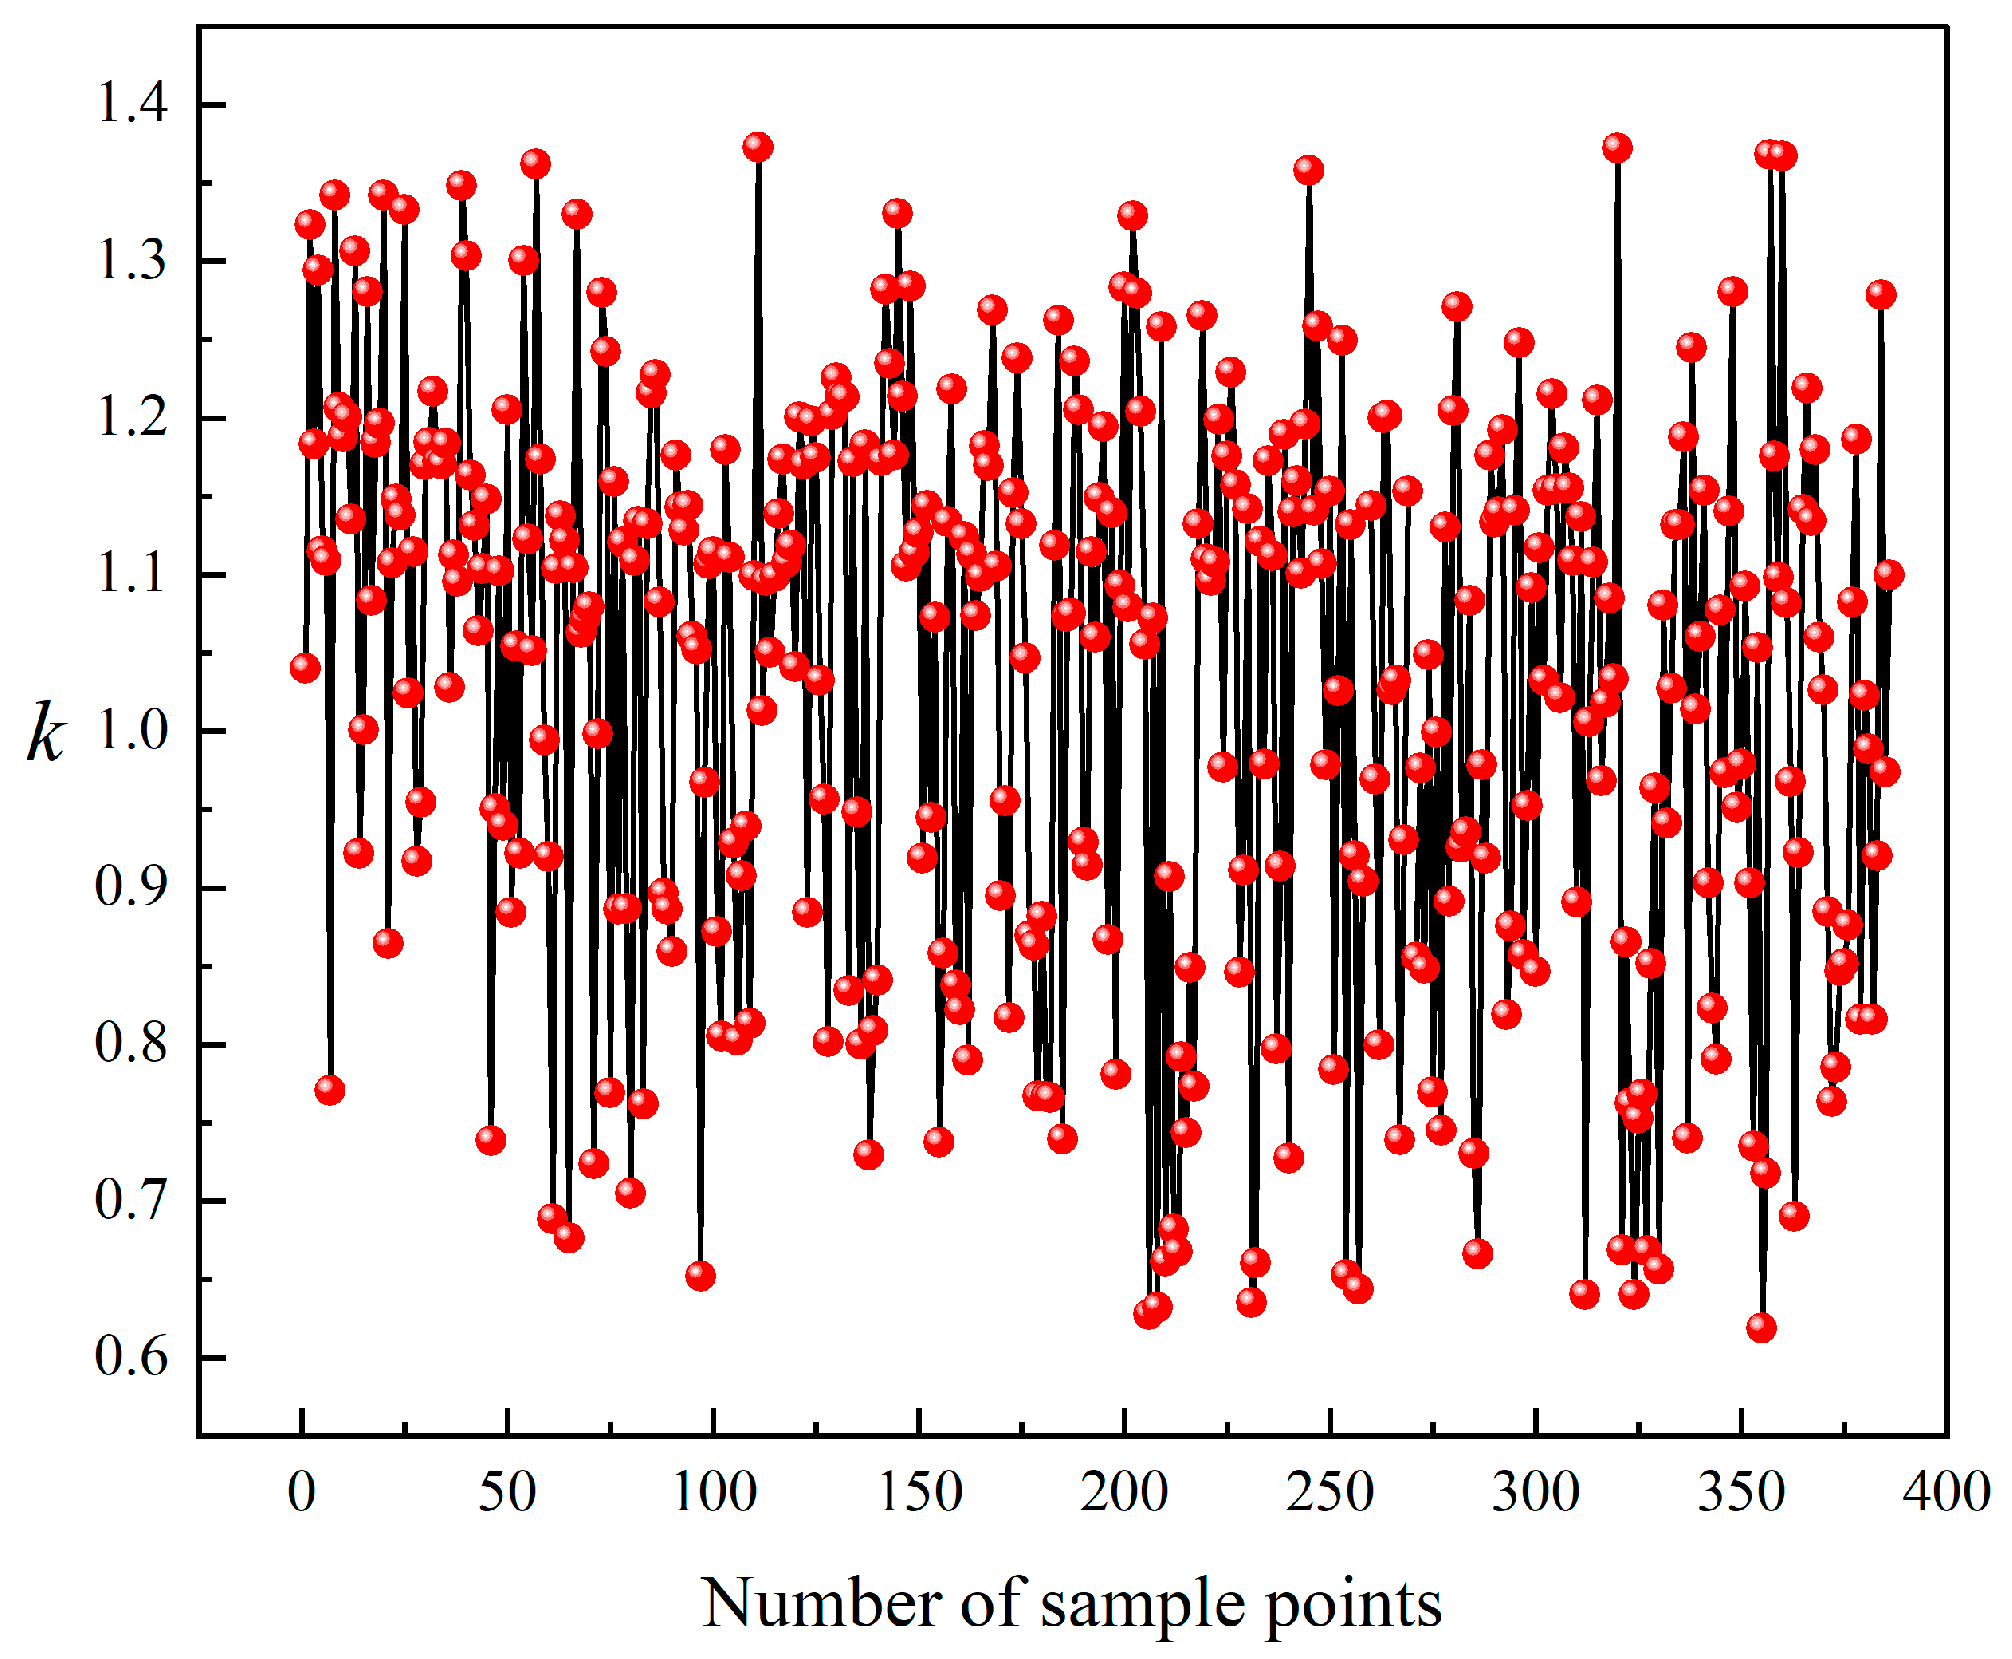
Figure 13.
Comparison chart of no-load induced electromotive force before and after optimization.
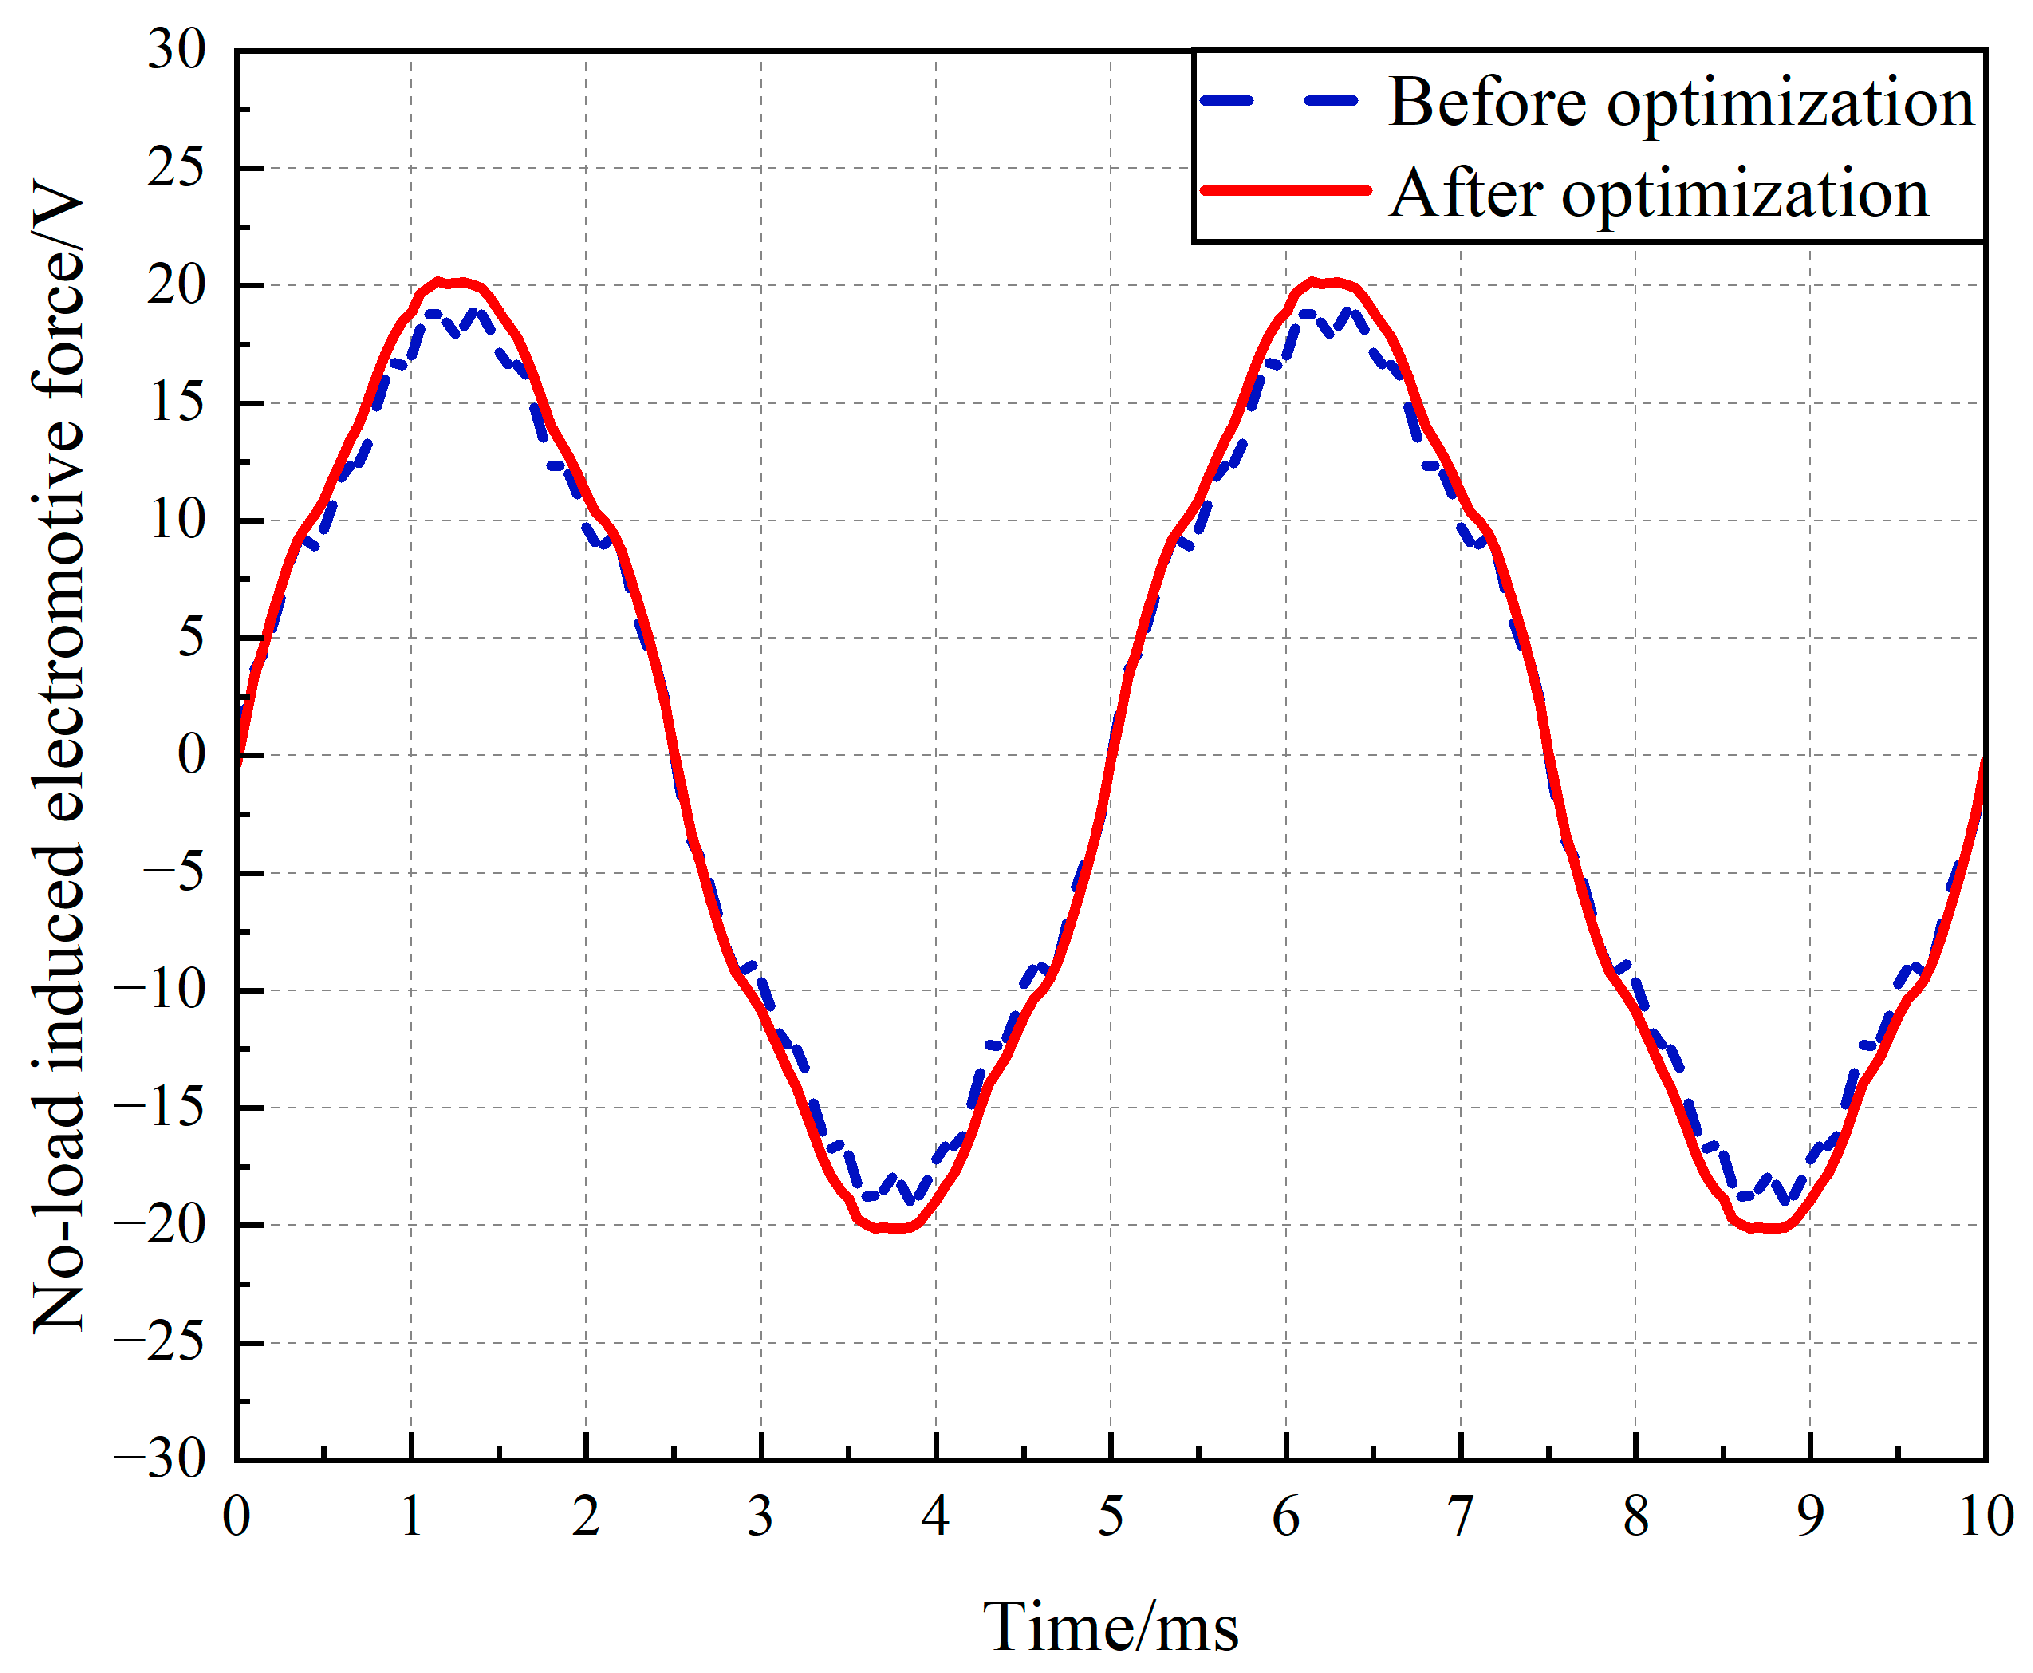
Figure 14.
Histogram of no-load induced electromotive force harmonic amplitude.
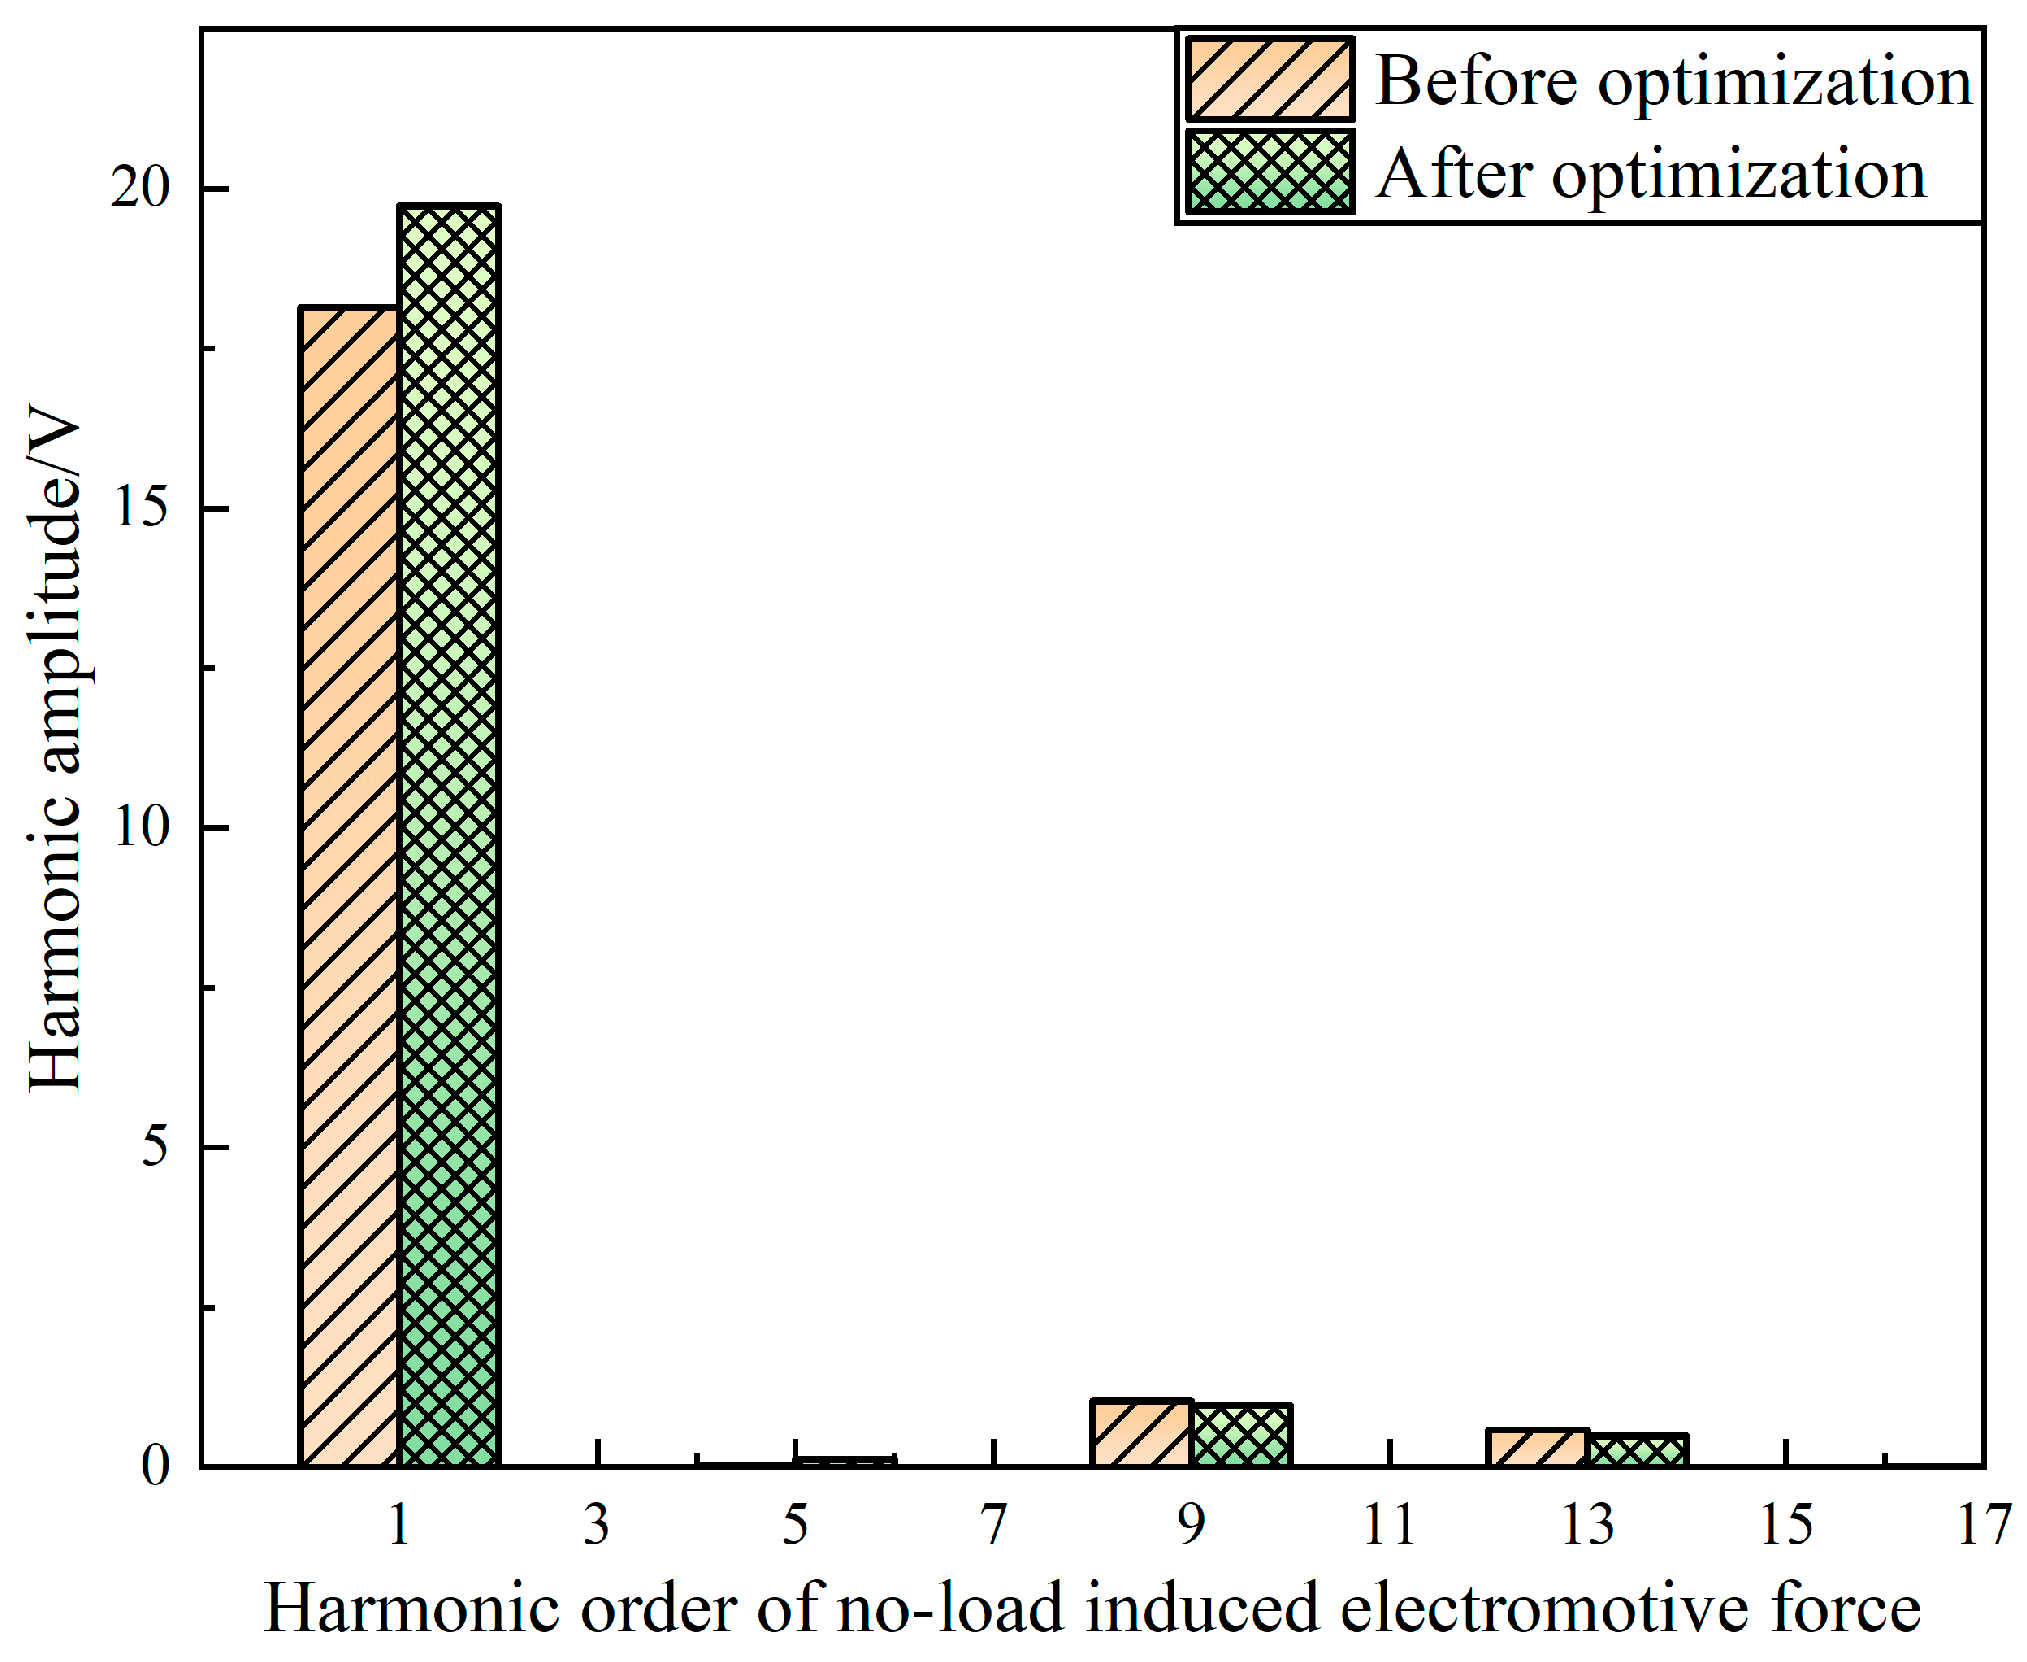
Figure 15.
Comparison of cogging torque before and after optimization.
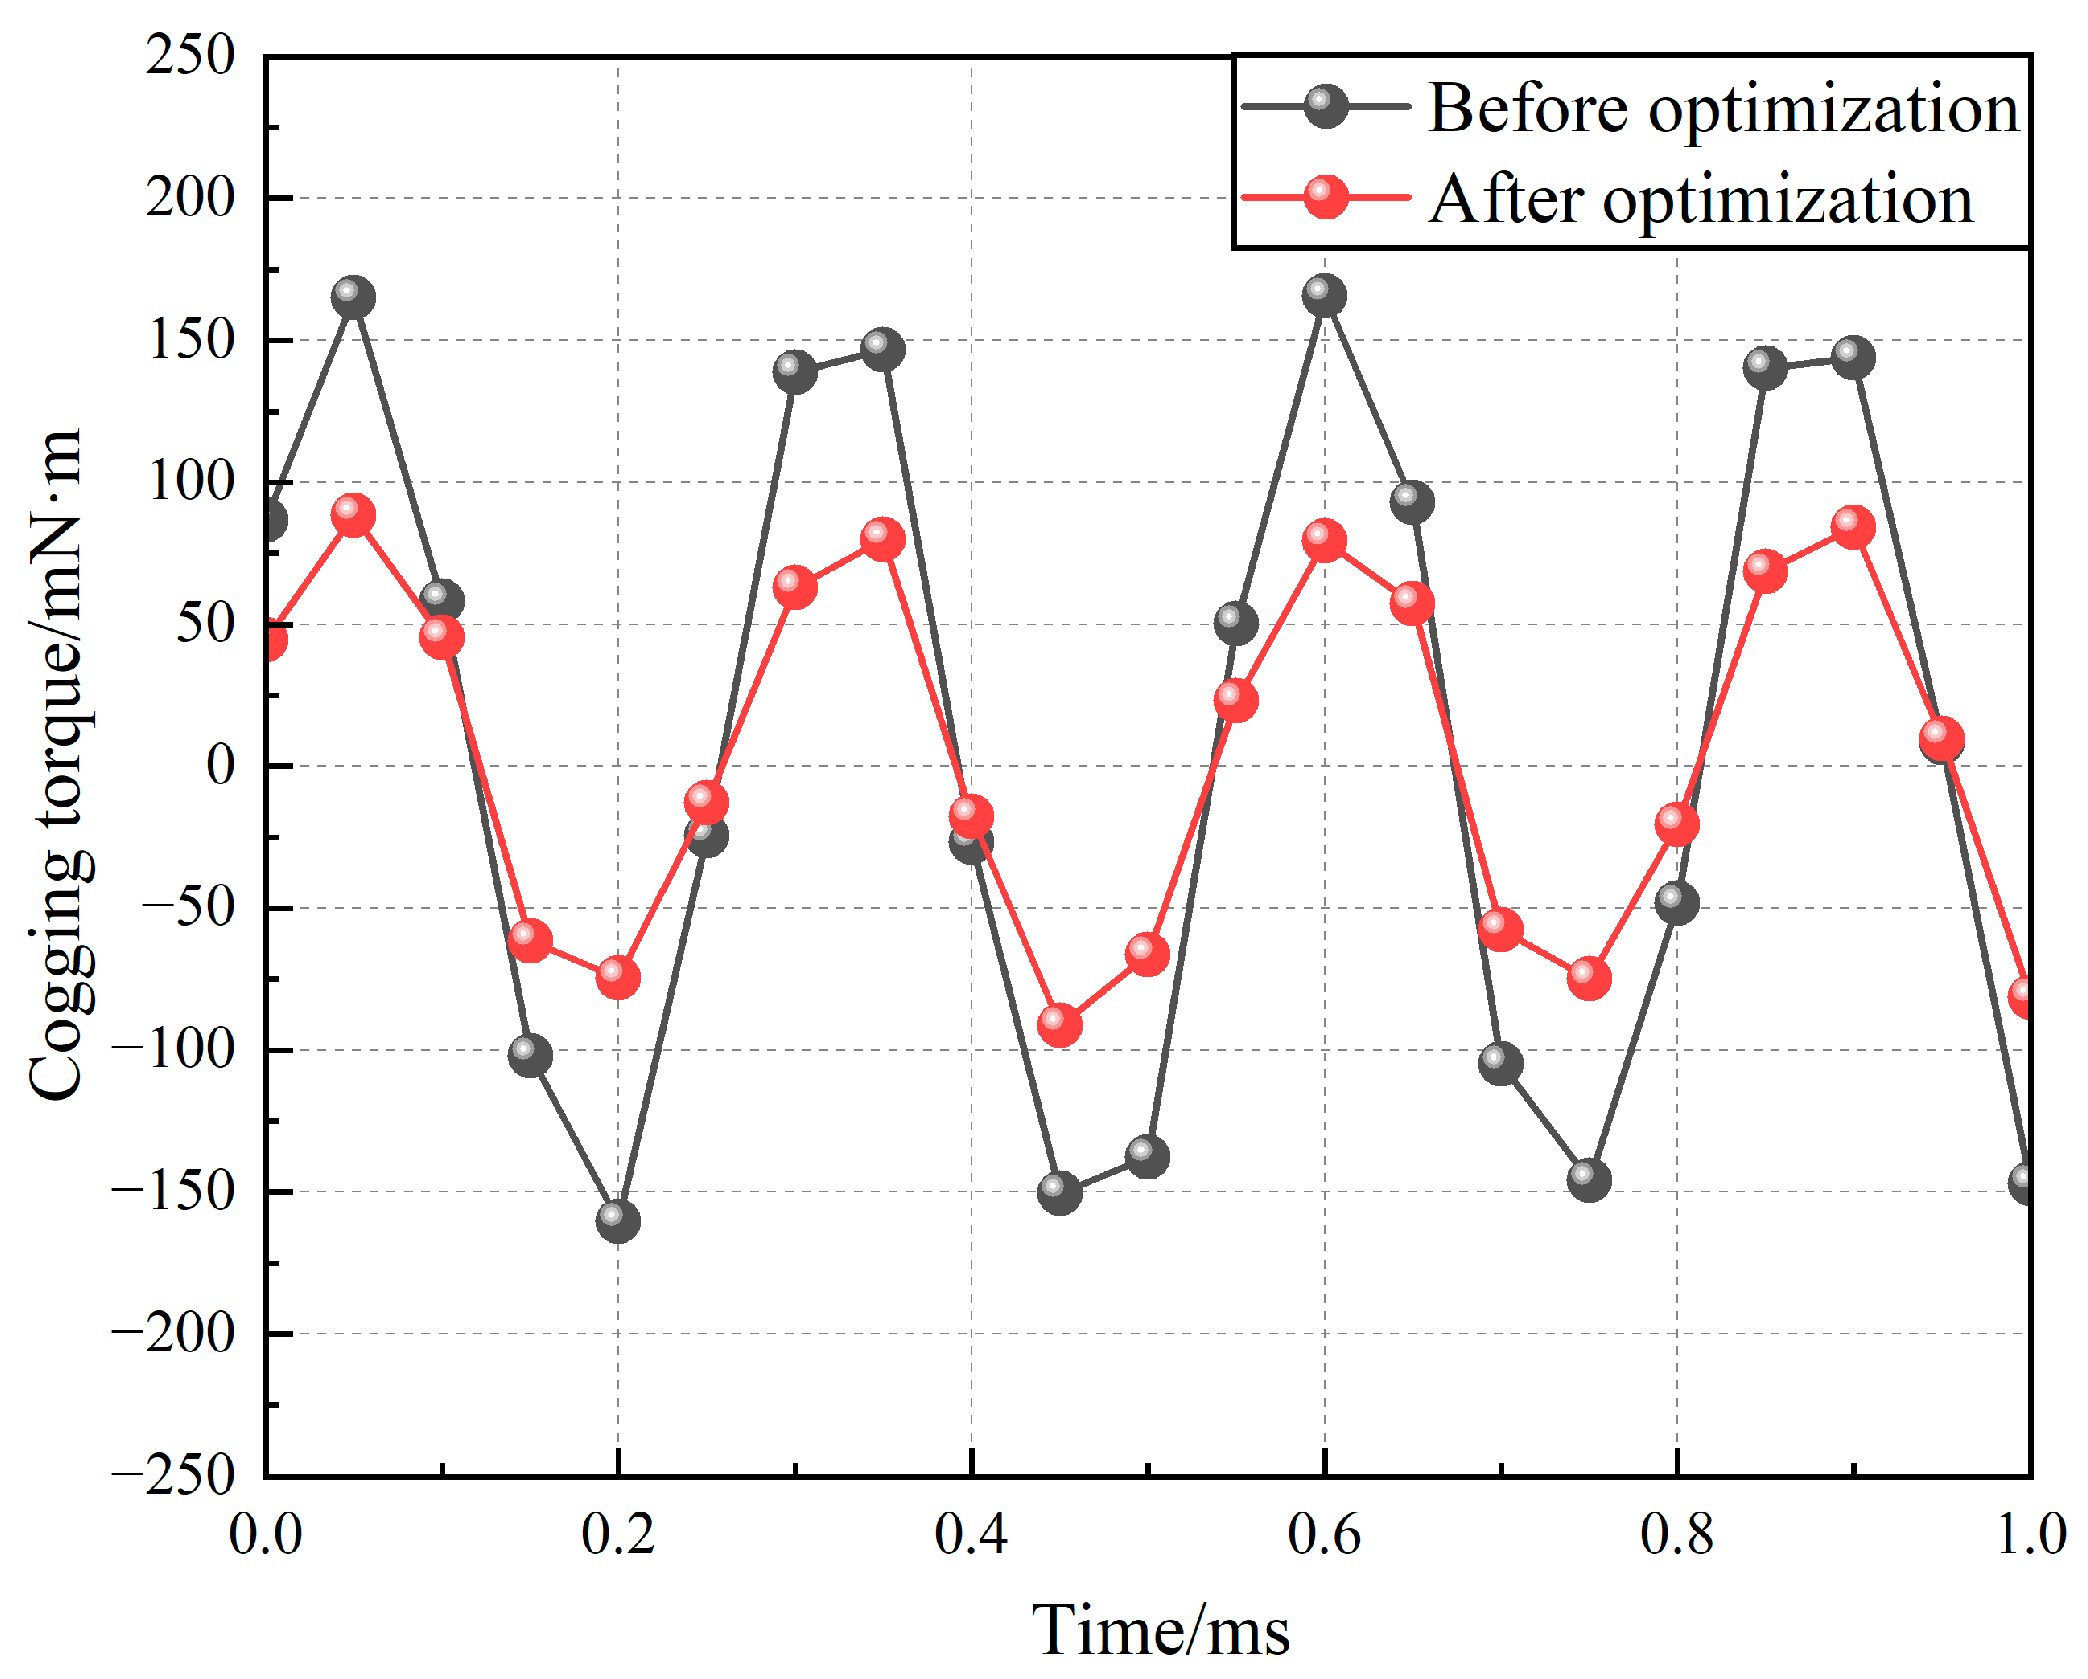
Figure 16.
Comparison of air gap flux density before and after optimization.
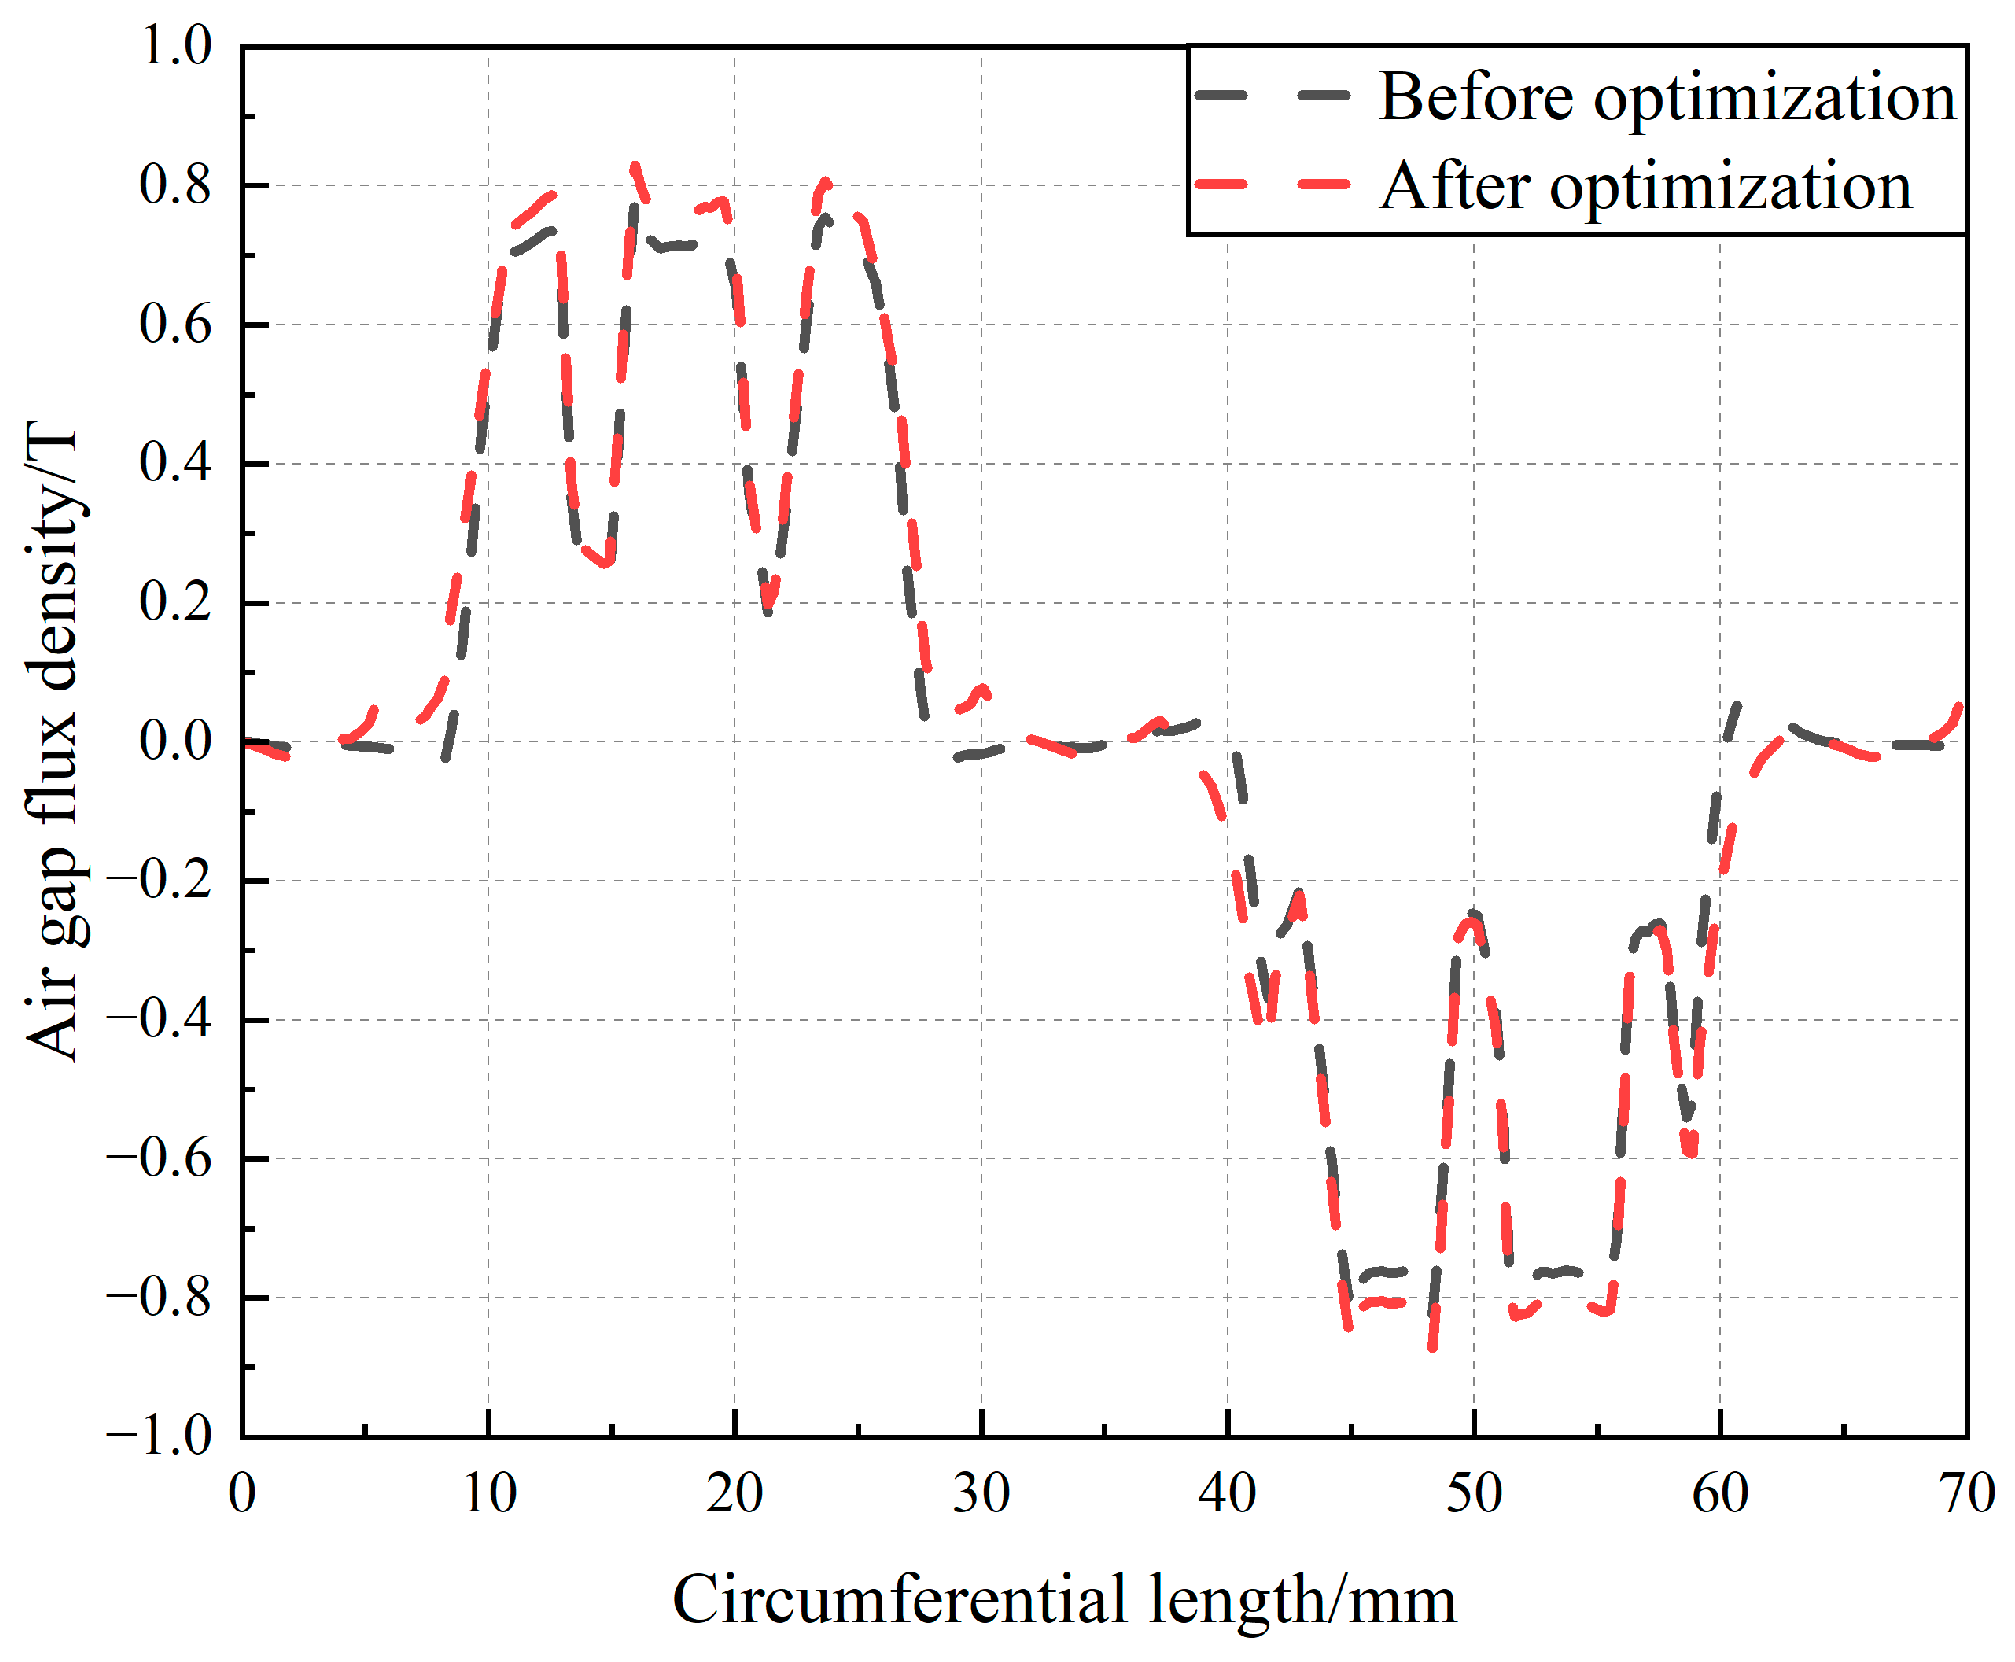
Figure 17.
Histogram of air gap flux density harmonic amplitudes.
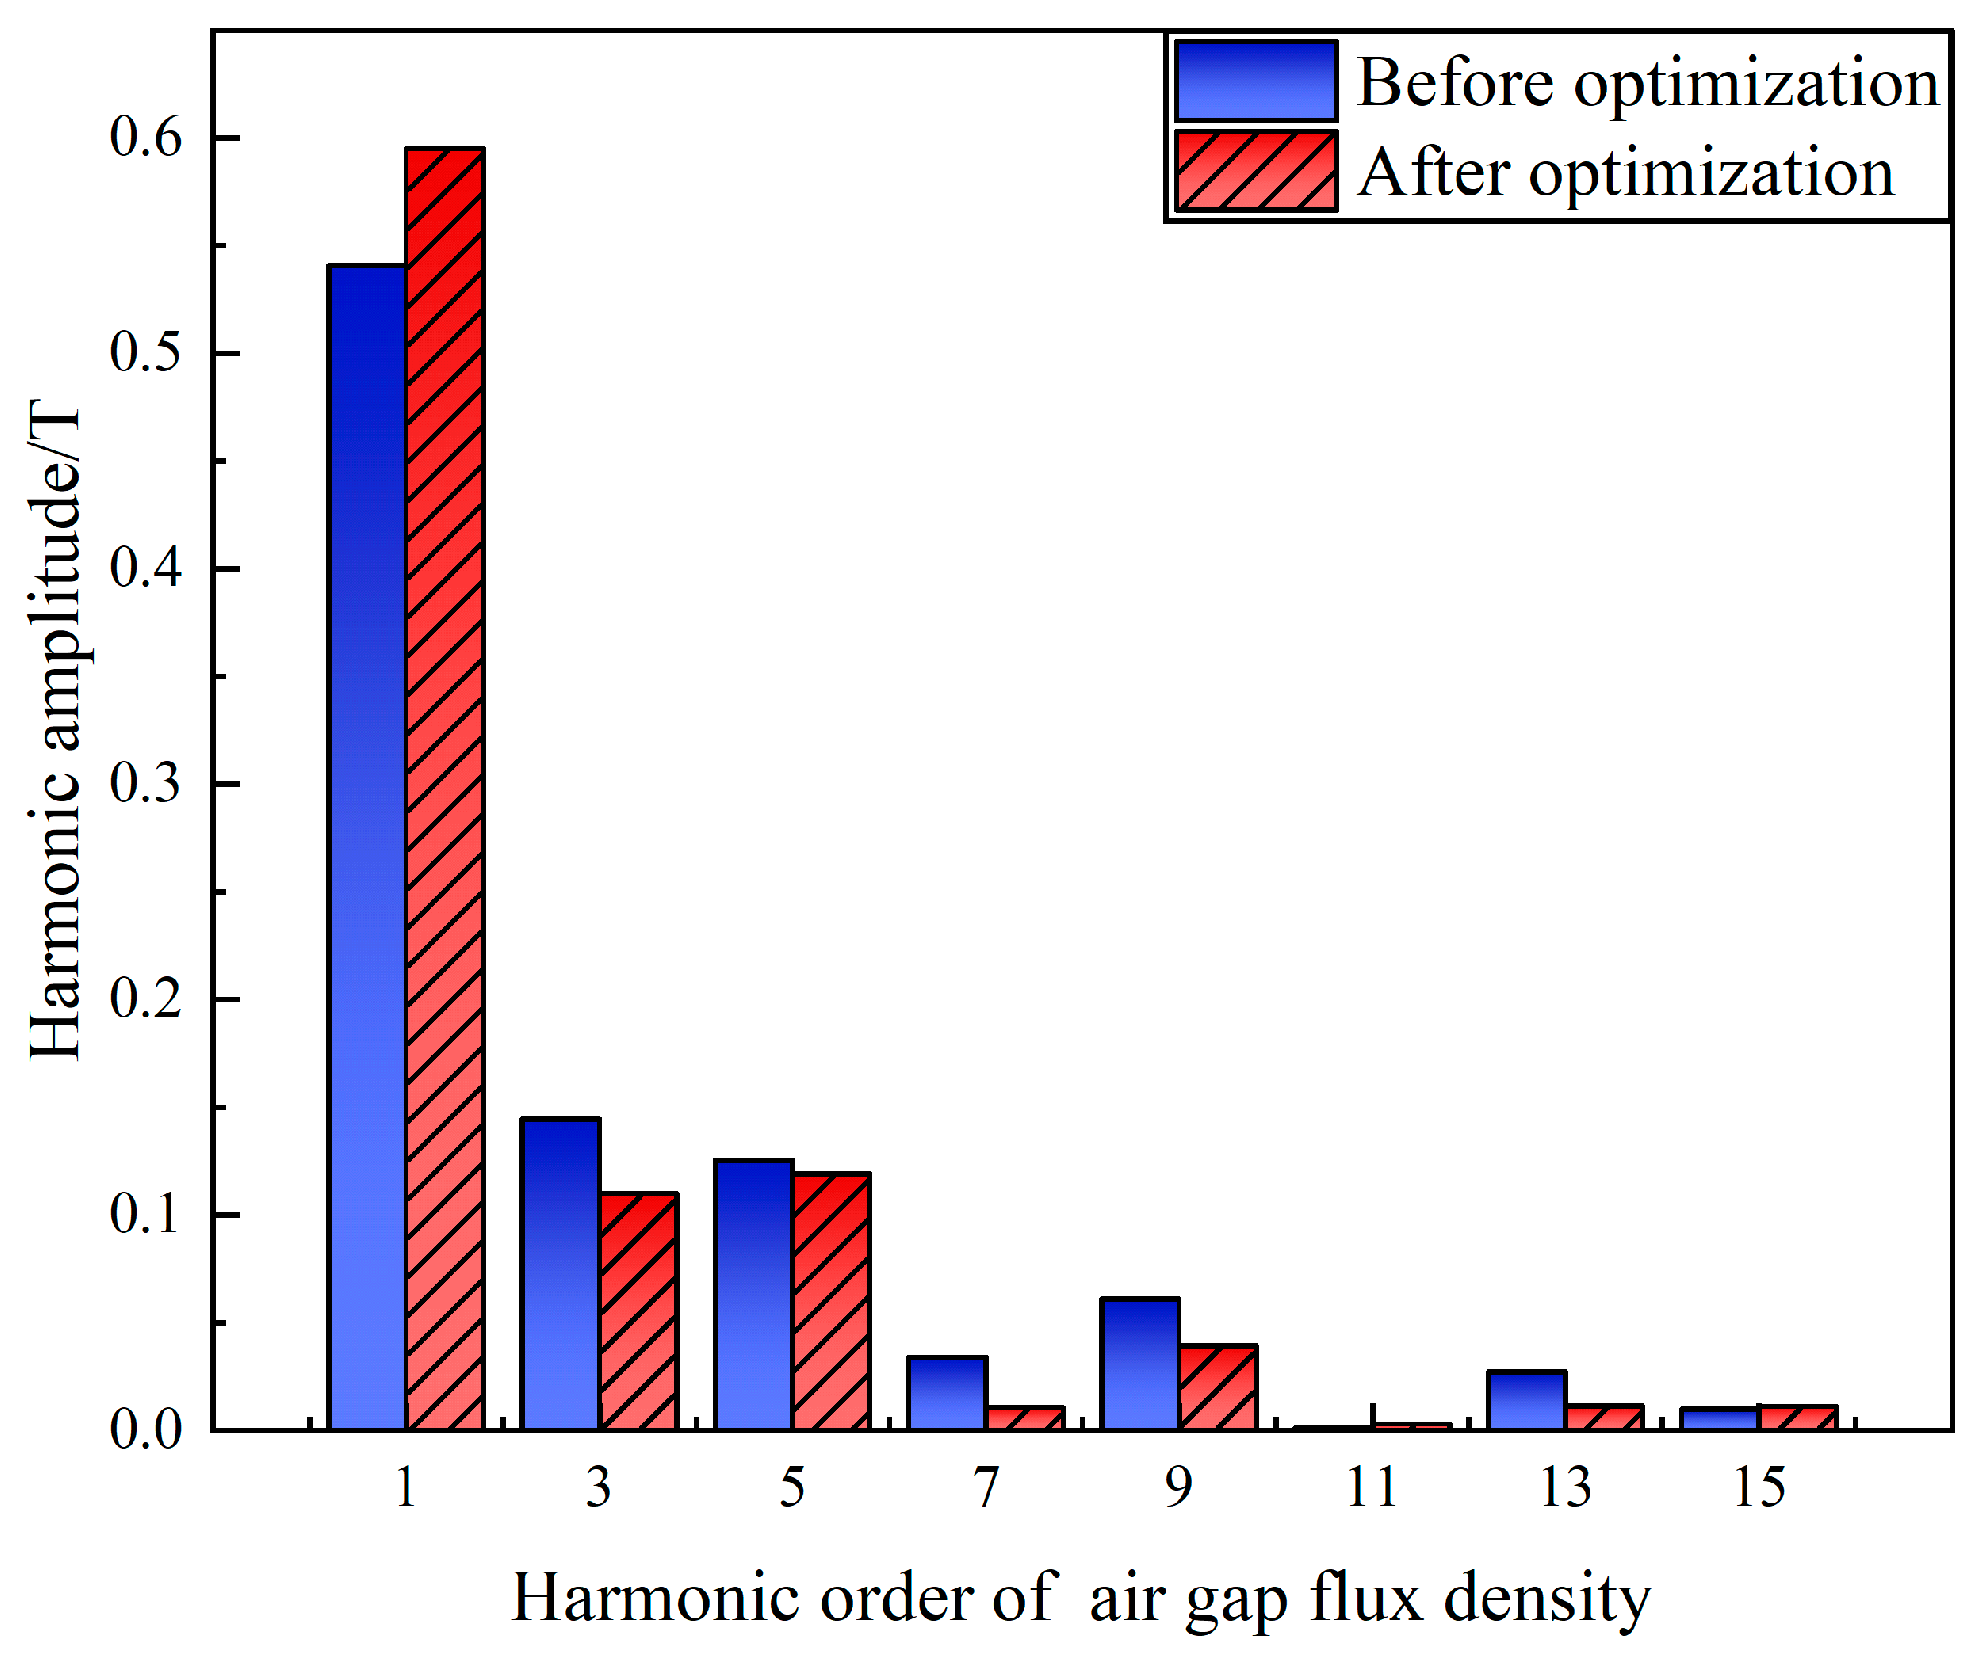
Figure 18.
The diagram of prototype: (a) Stator; (b) Rotor.
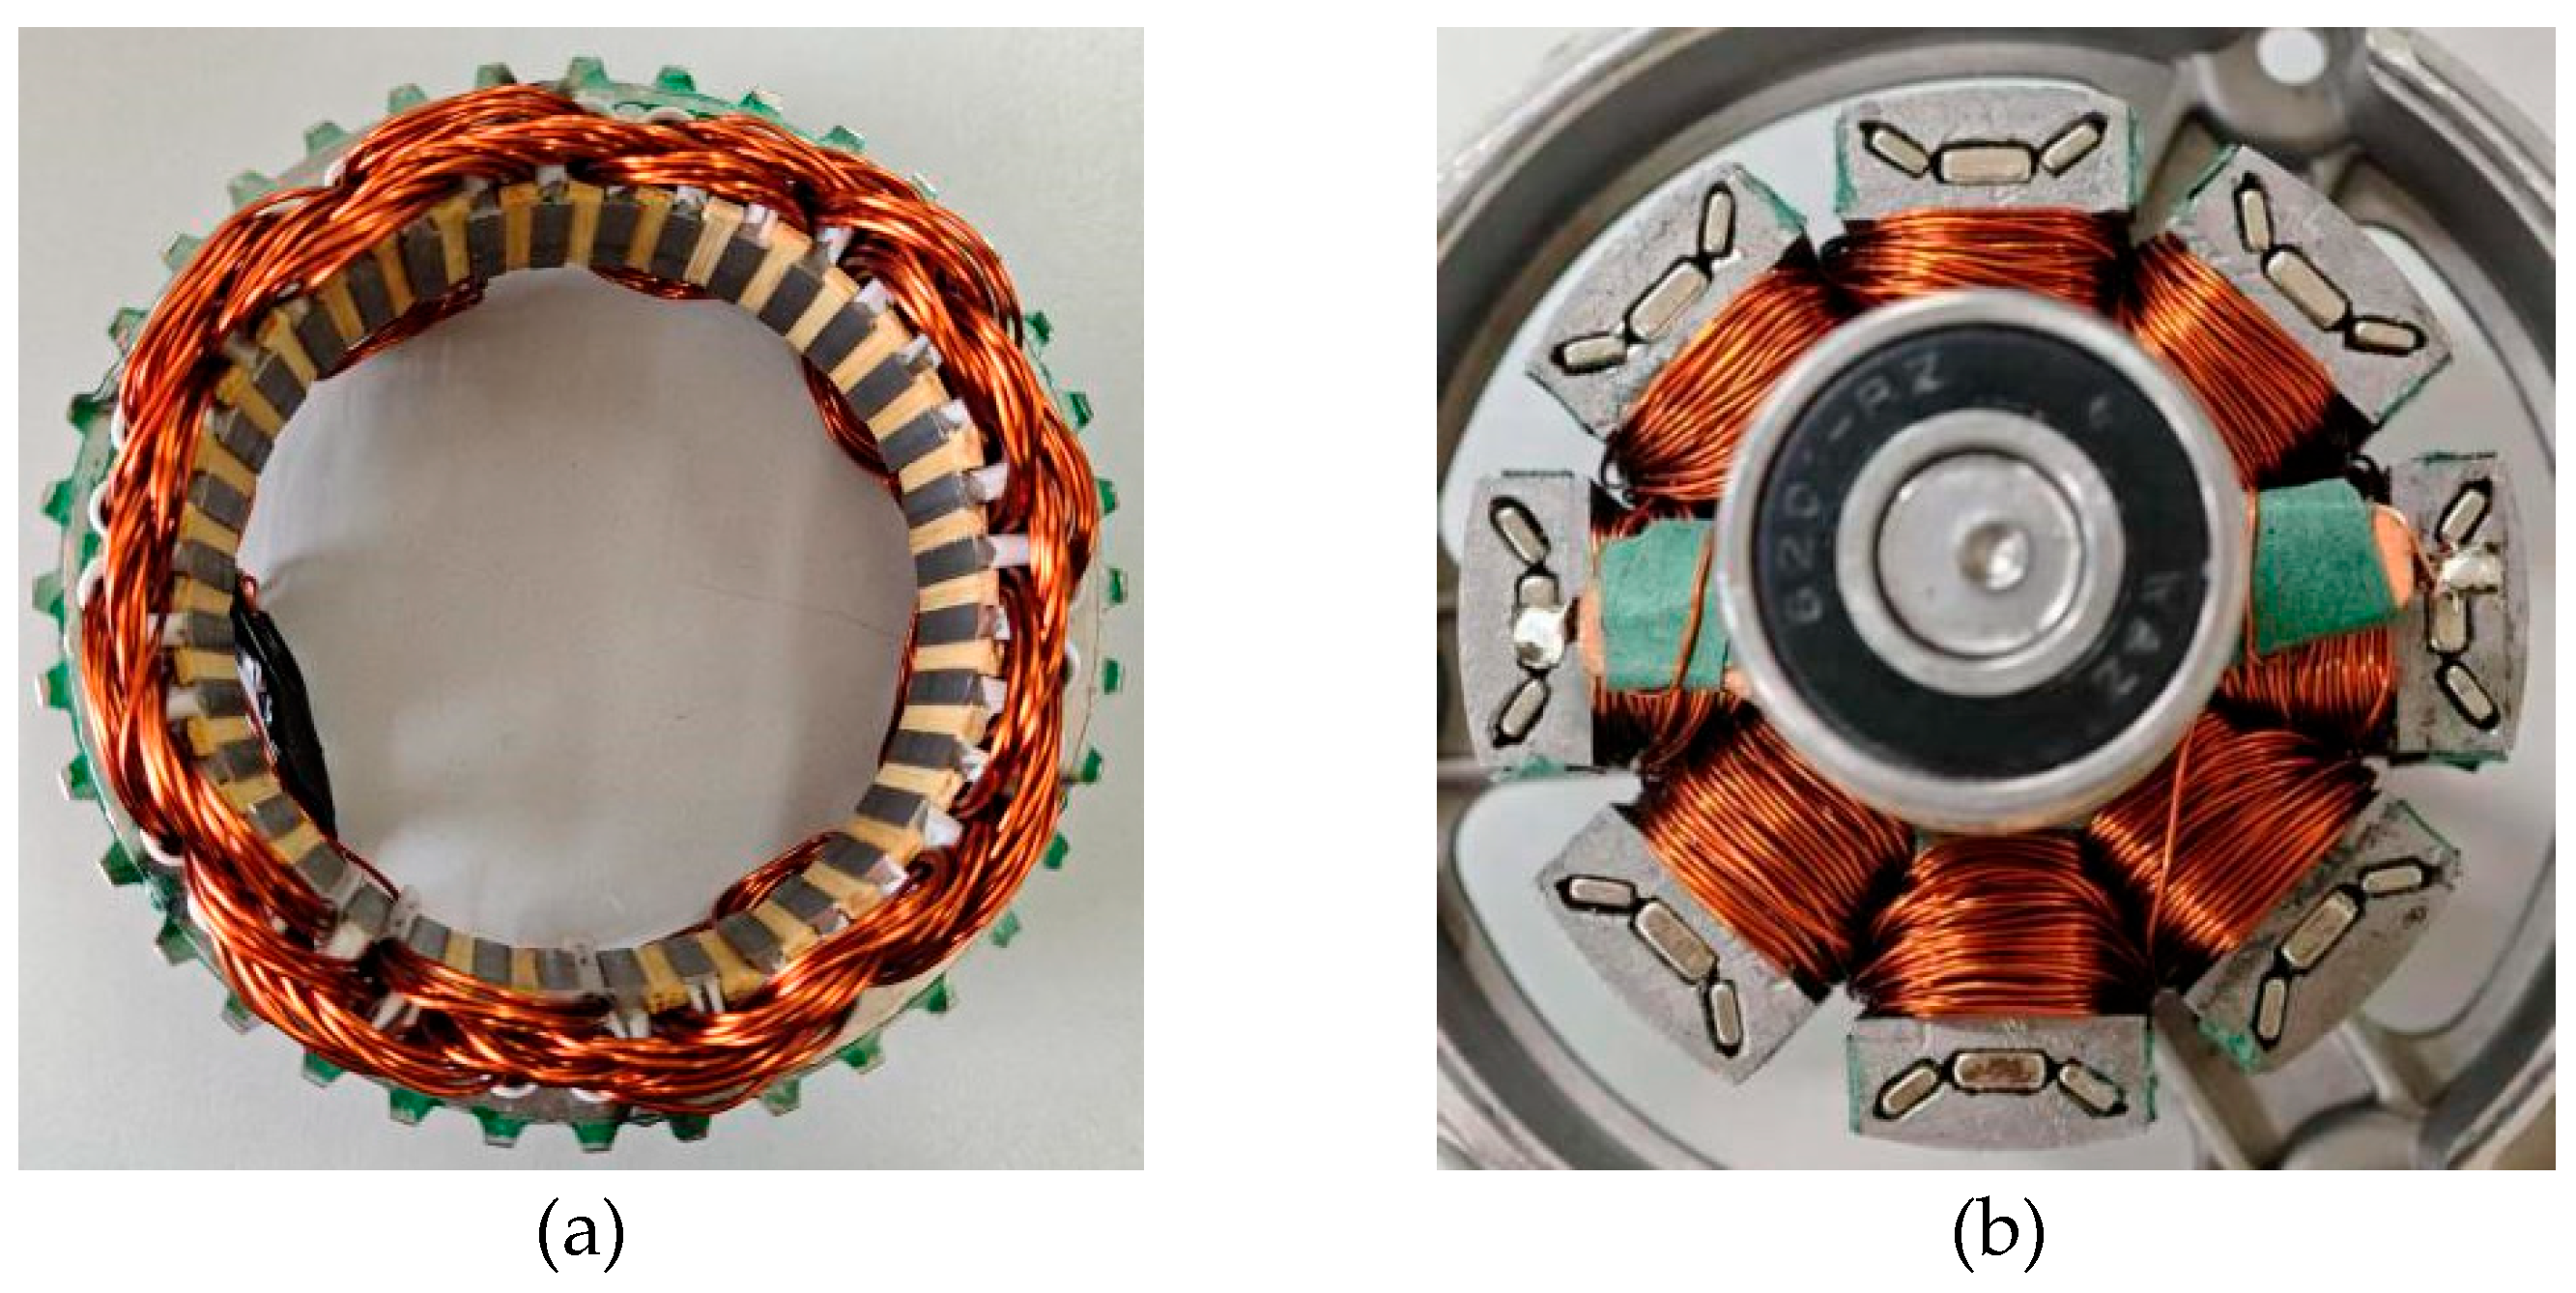
Figure 19.
The diagram of generator test platform.
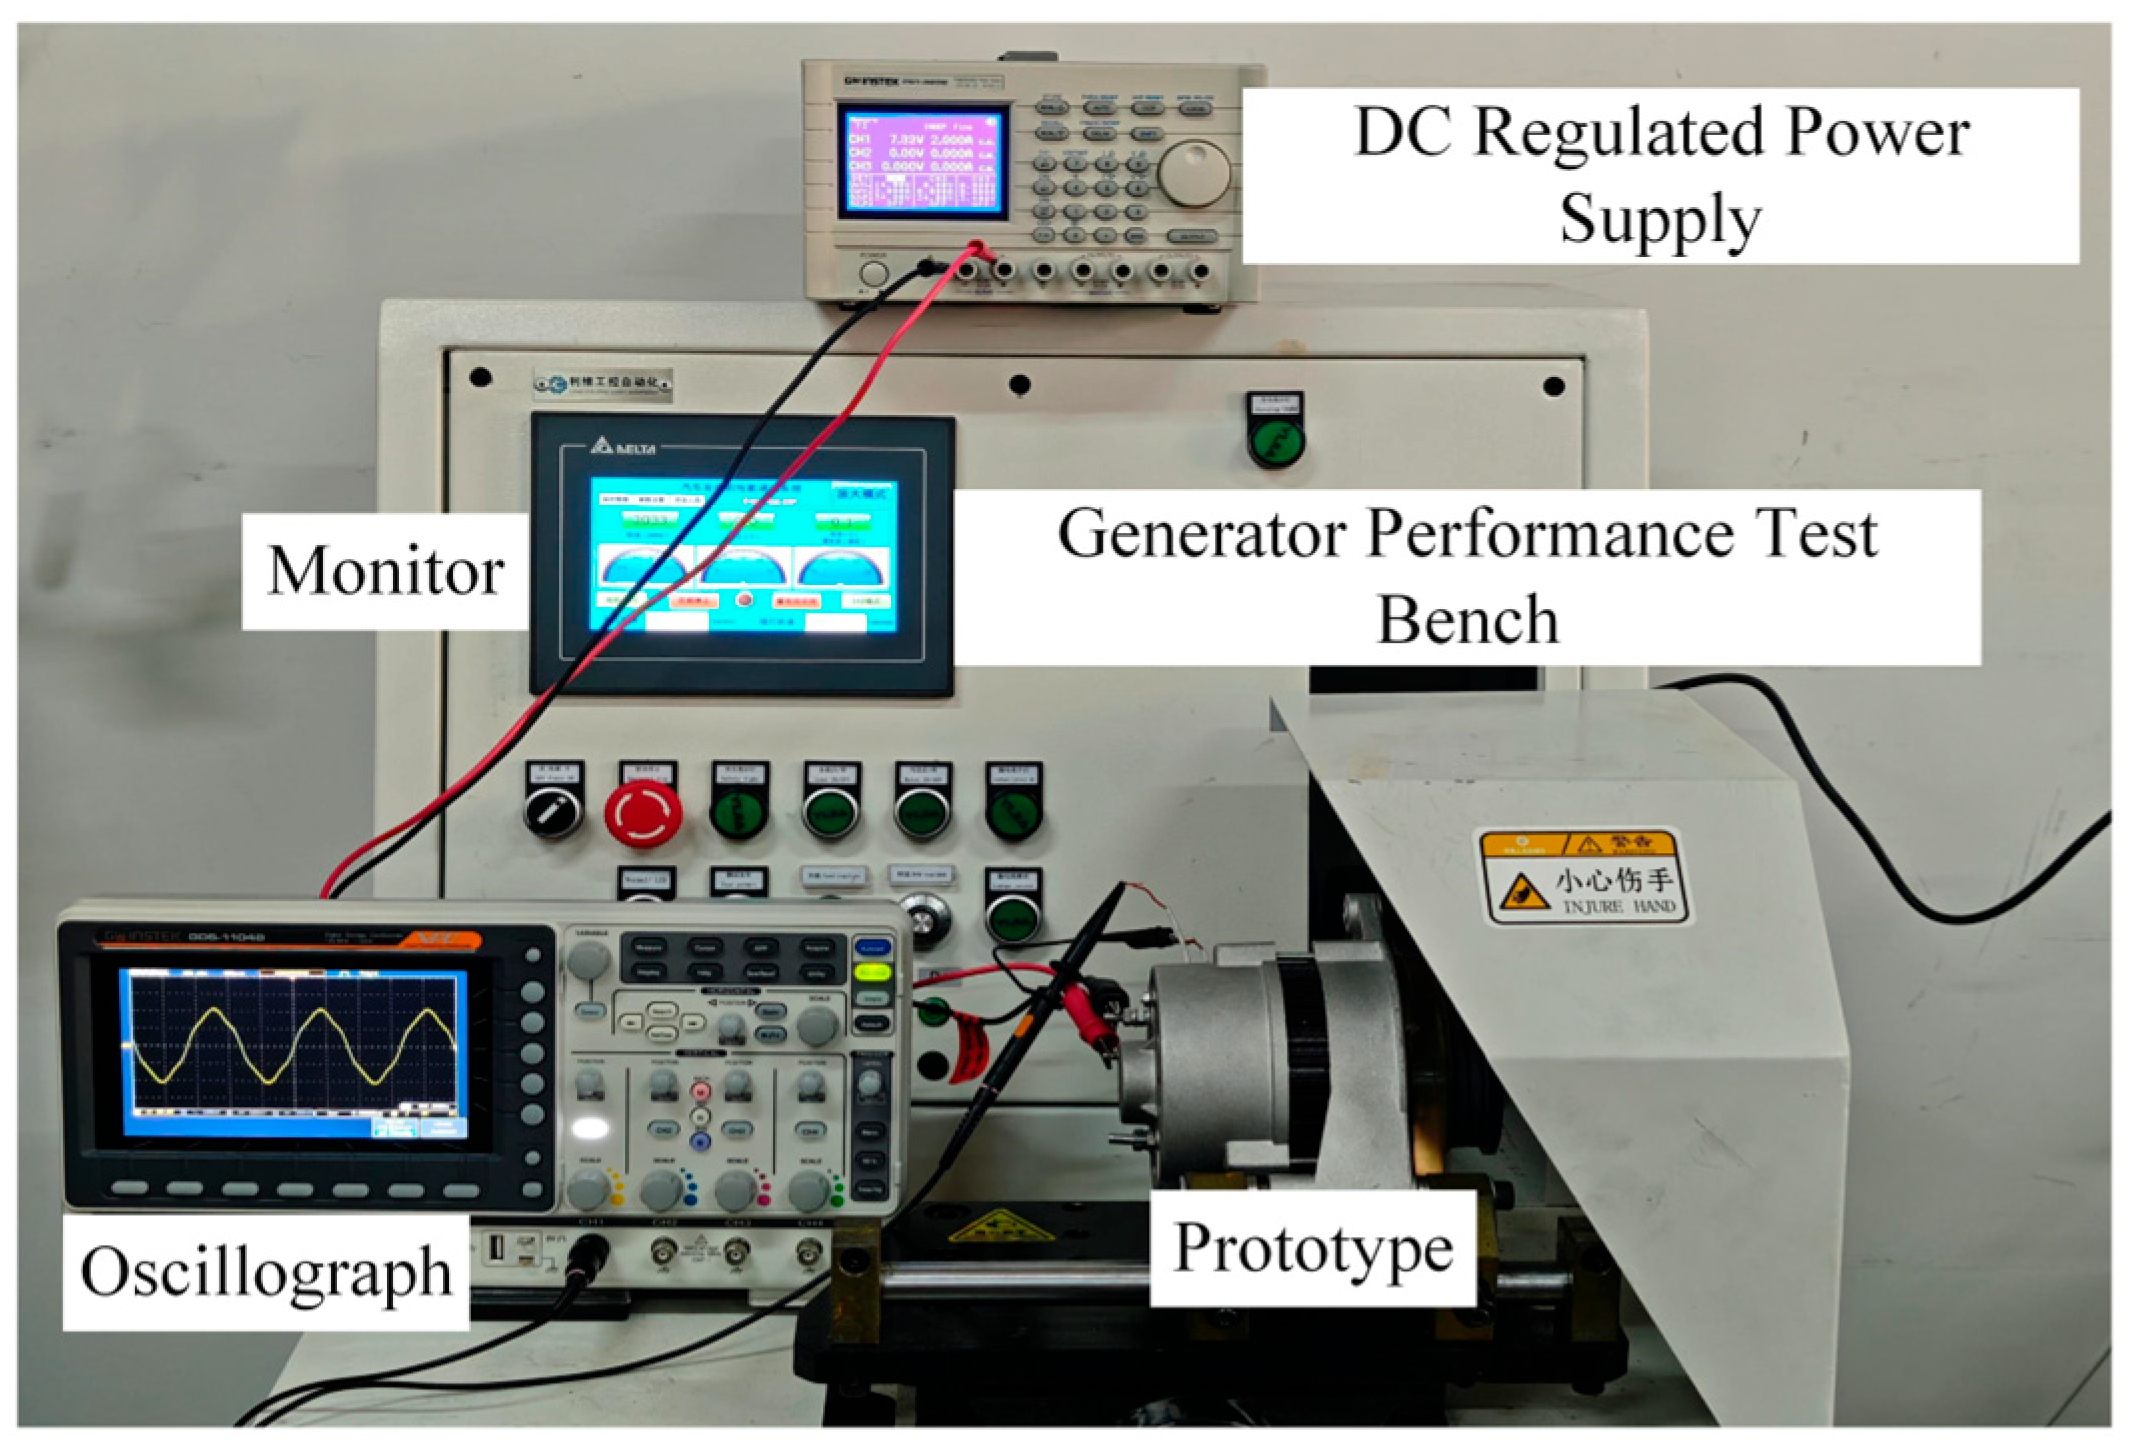
Figure 20.
Experimental results of no-load induced electromotive force.
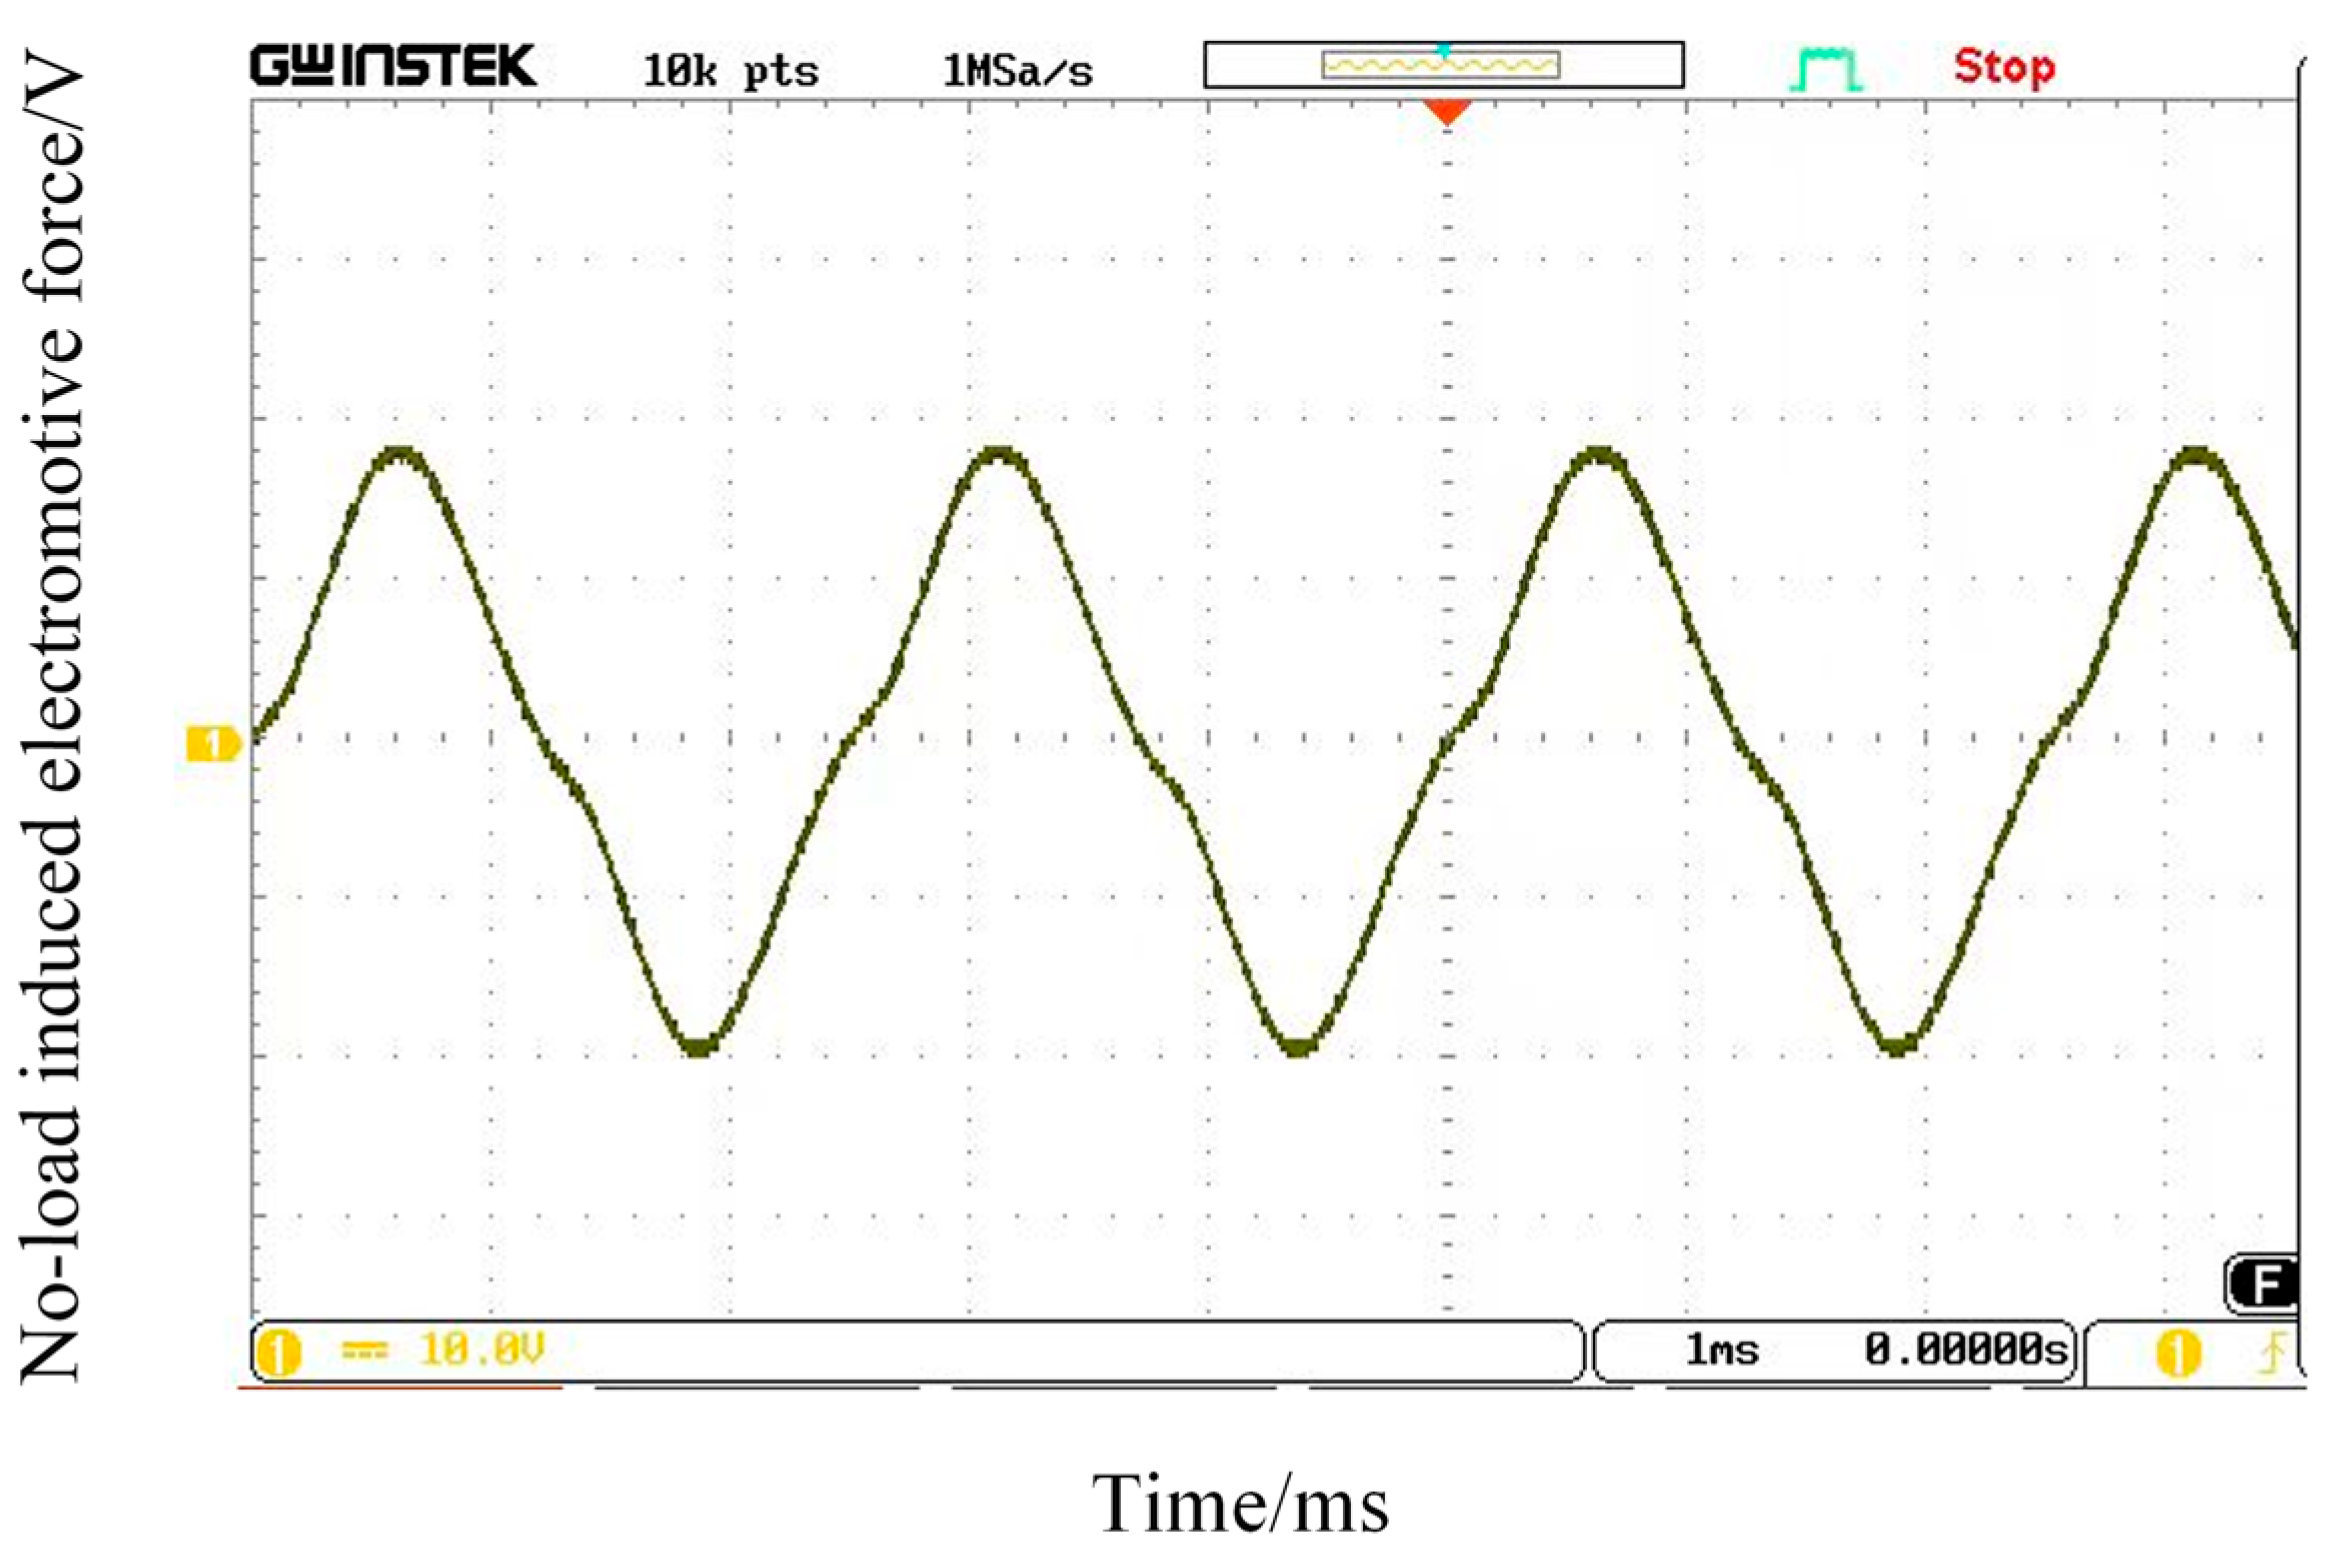
Figure 21.
No-load characteristic curve of HEG.
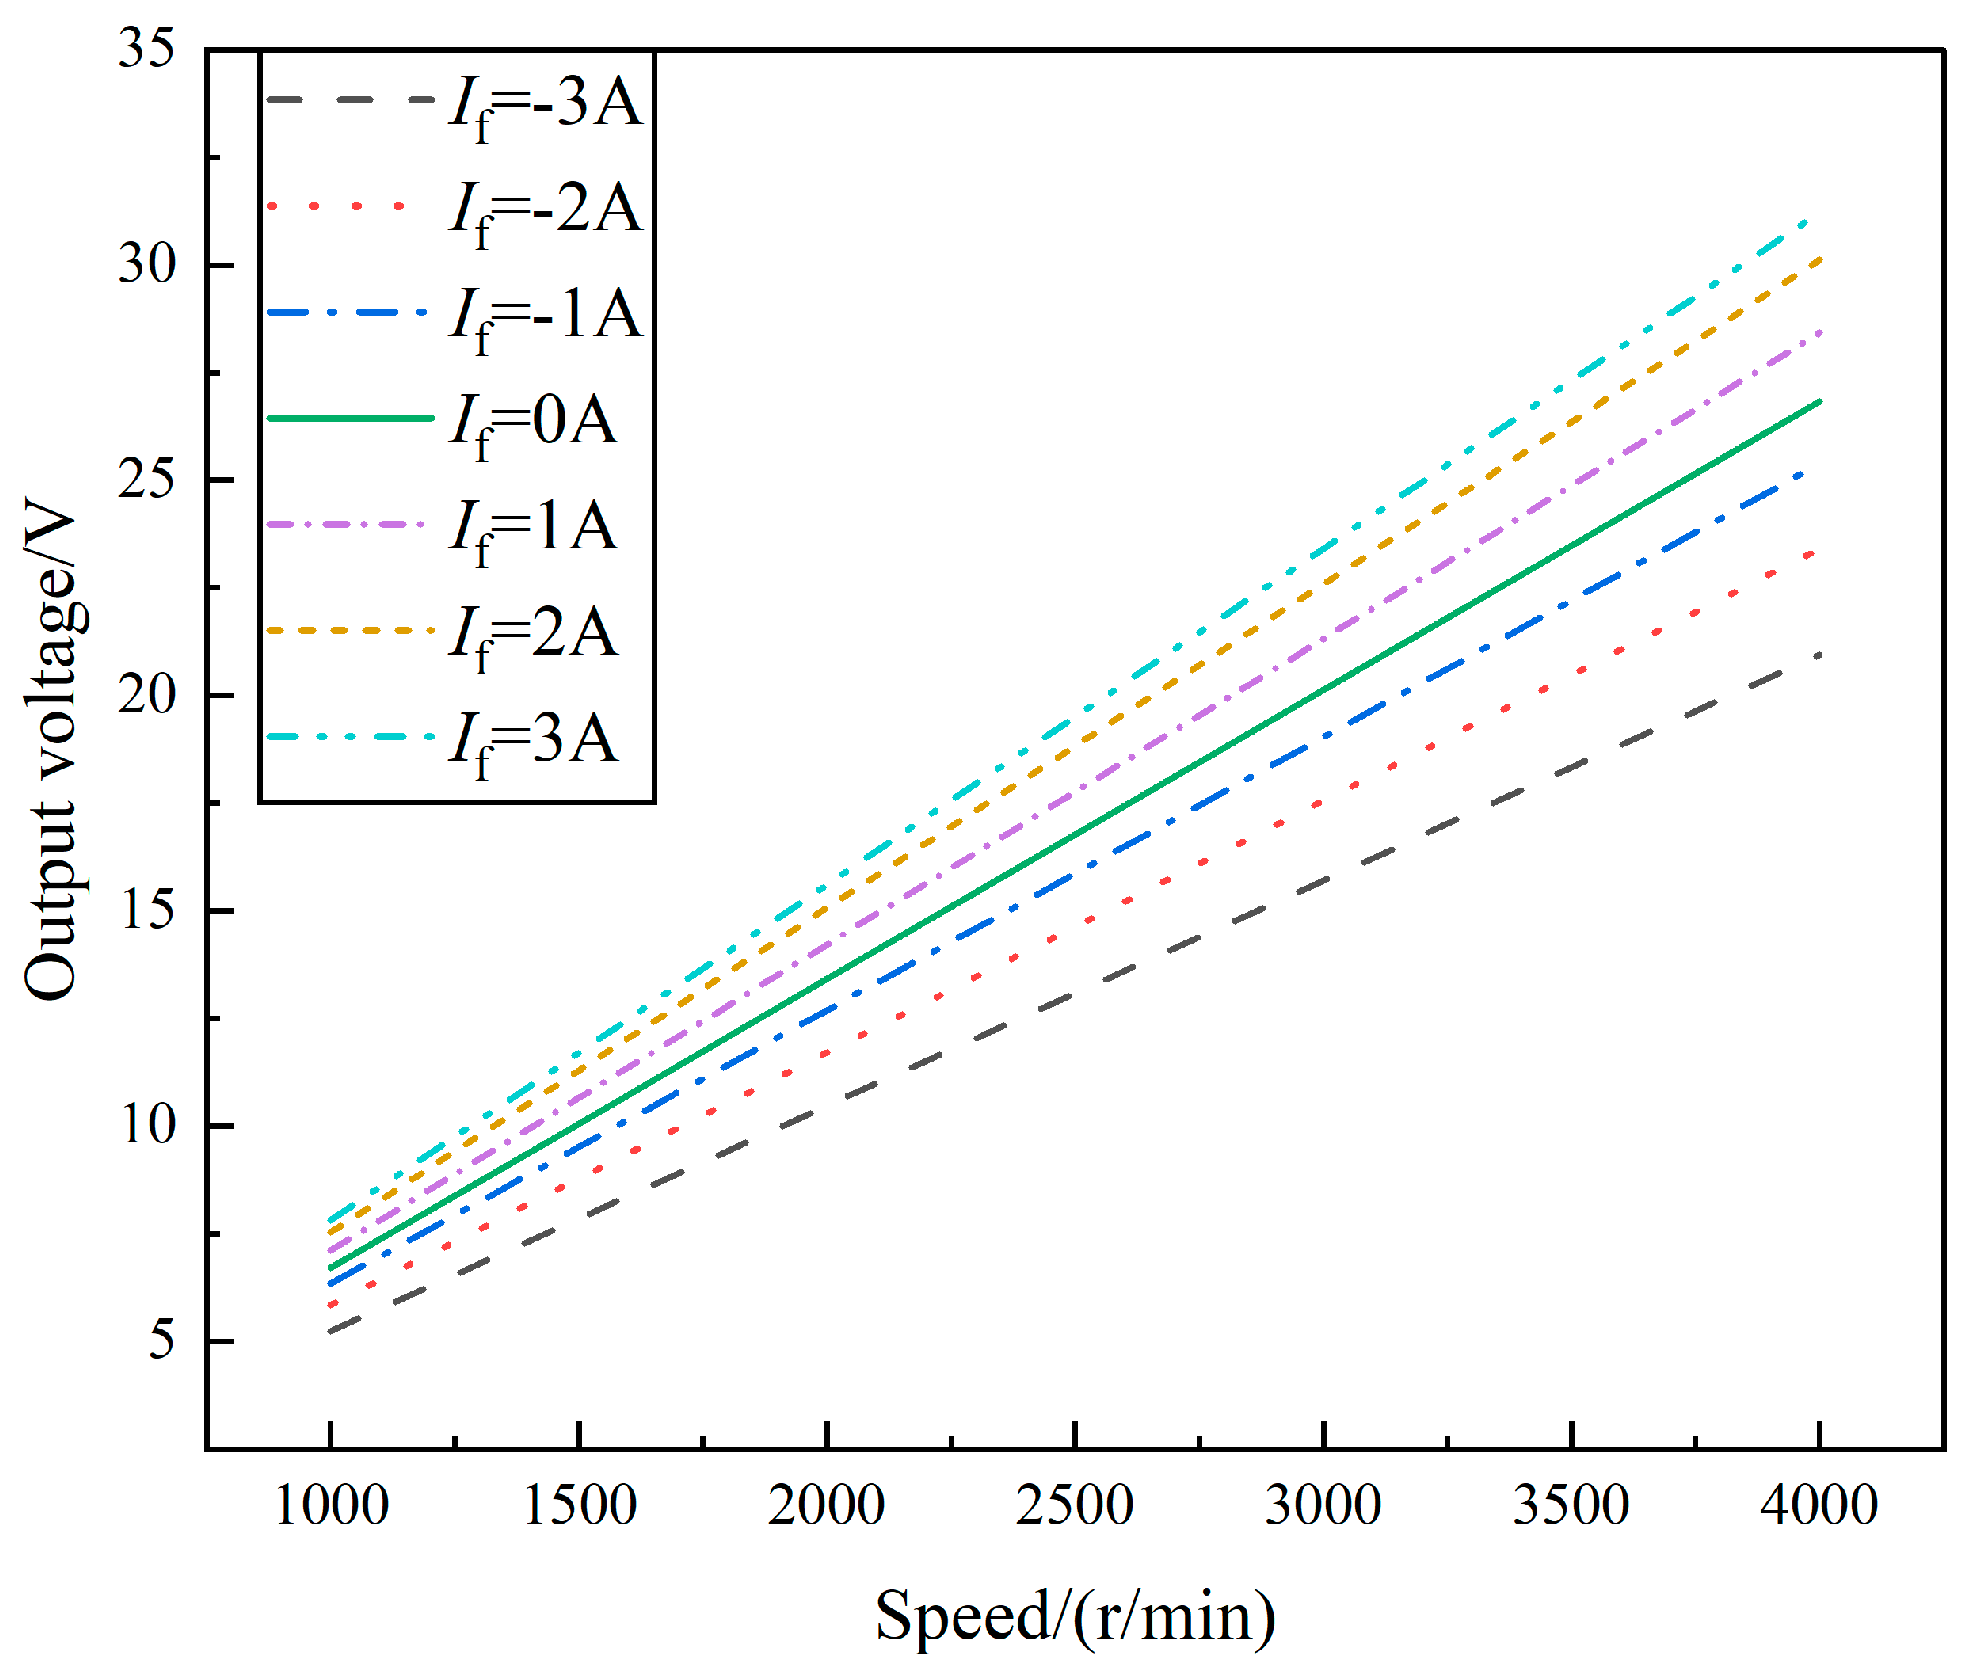
Figure 22.
Variation curves of output voltage and excitation current of HEG at different Speeds.
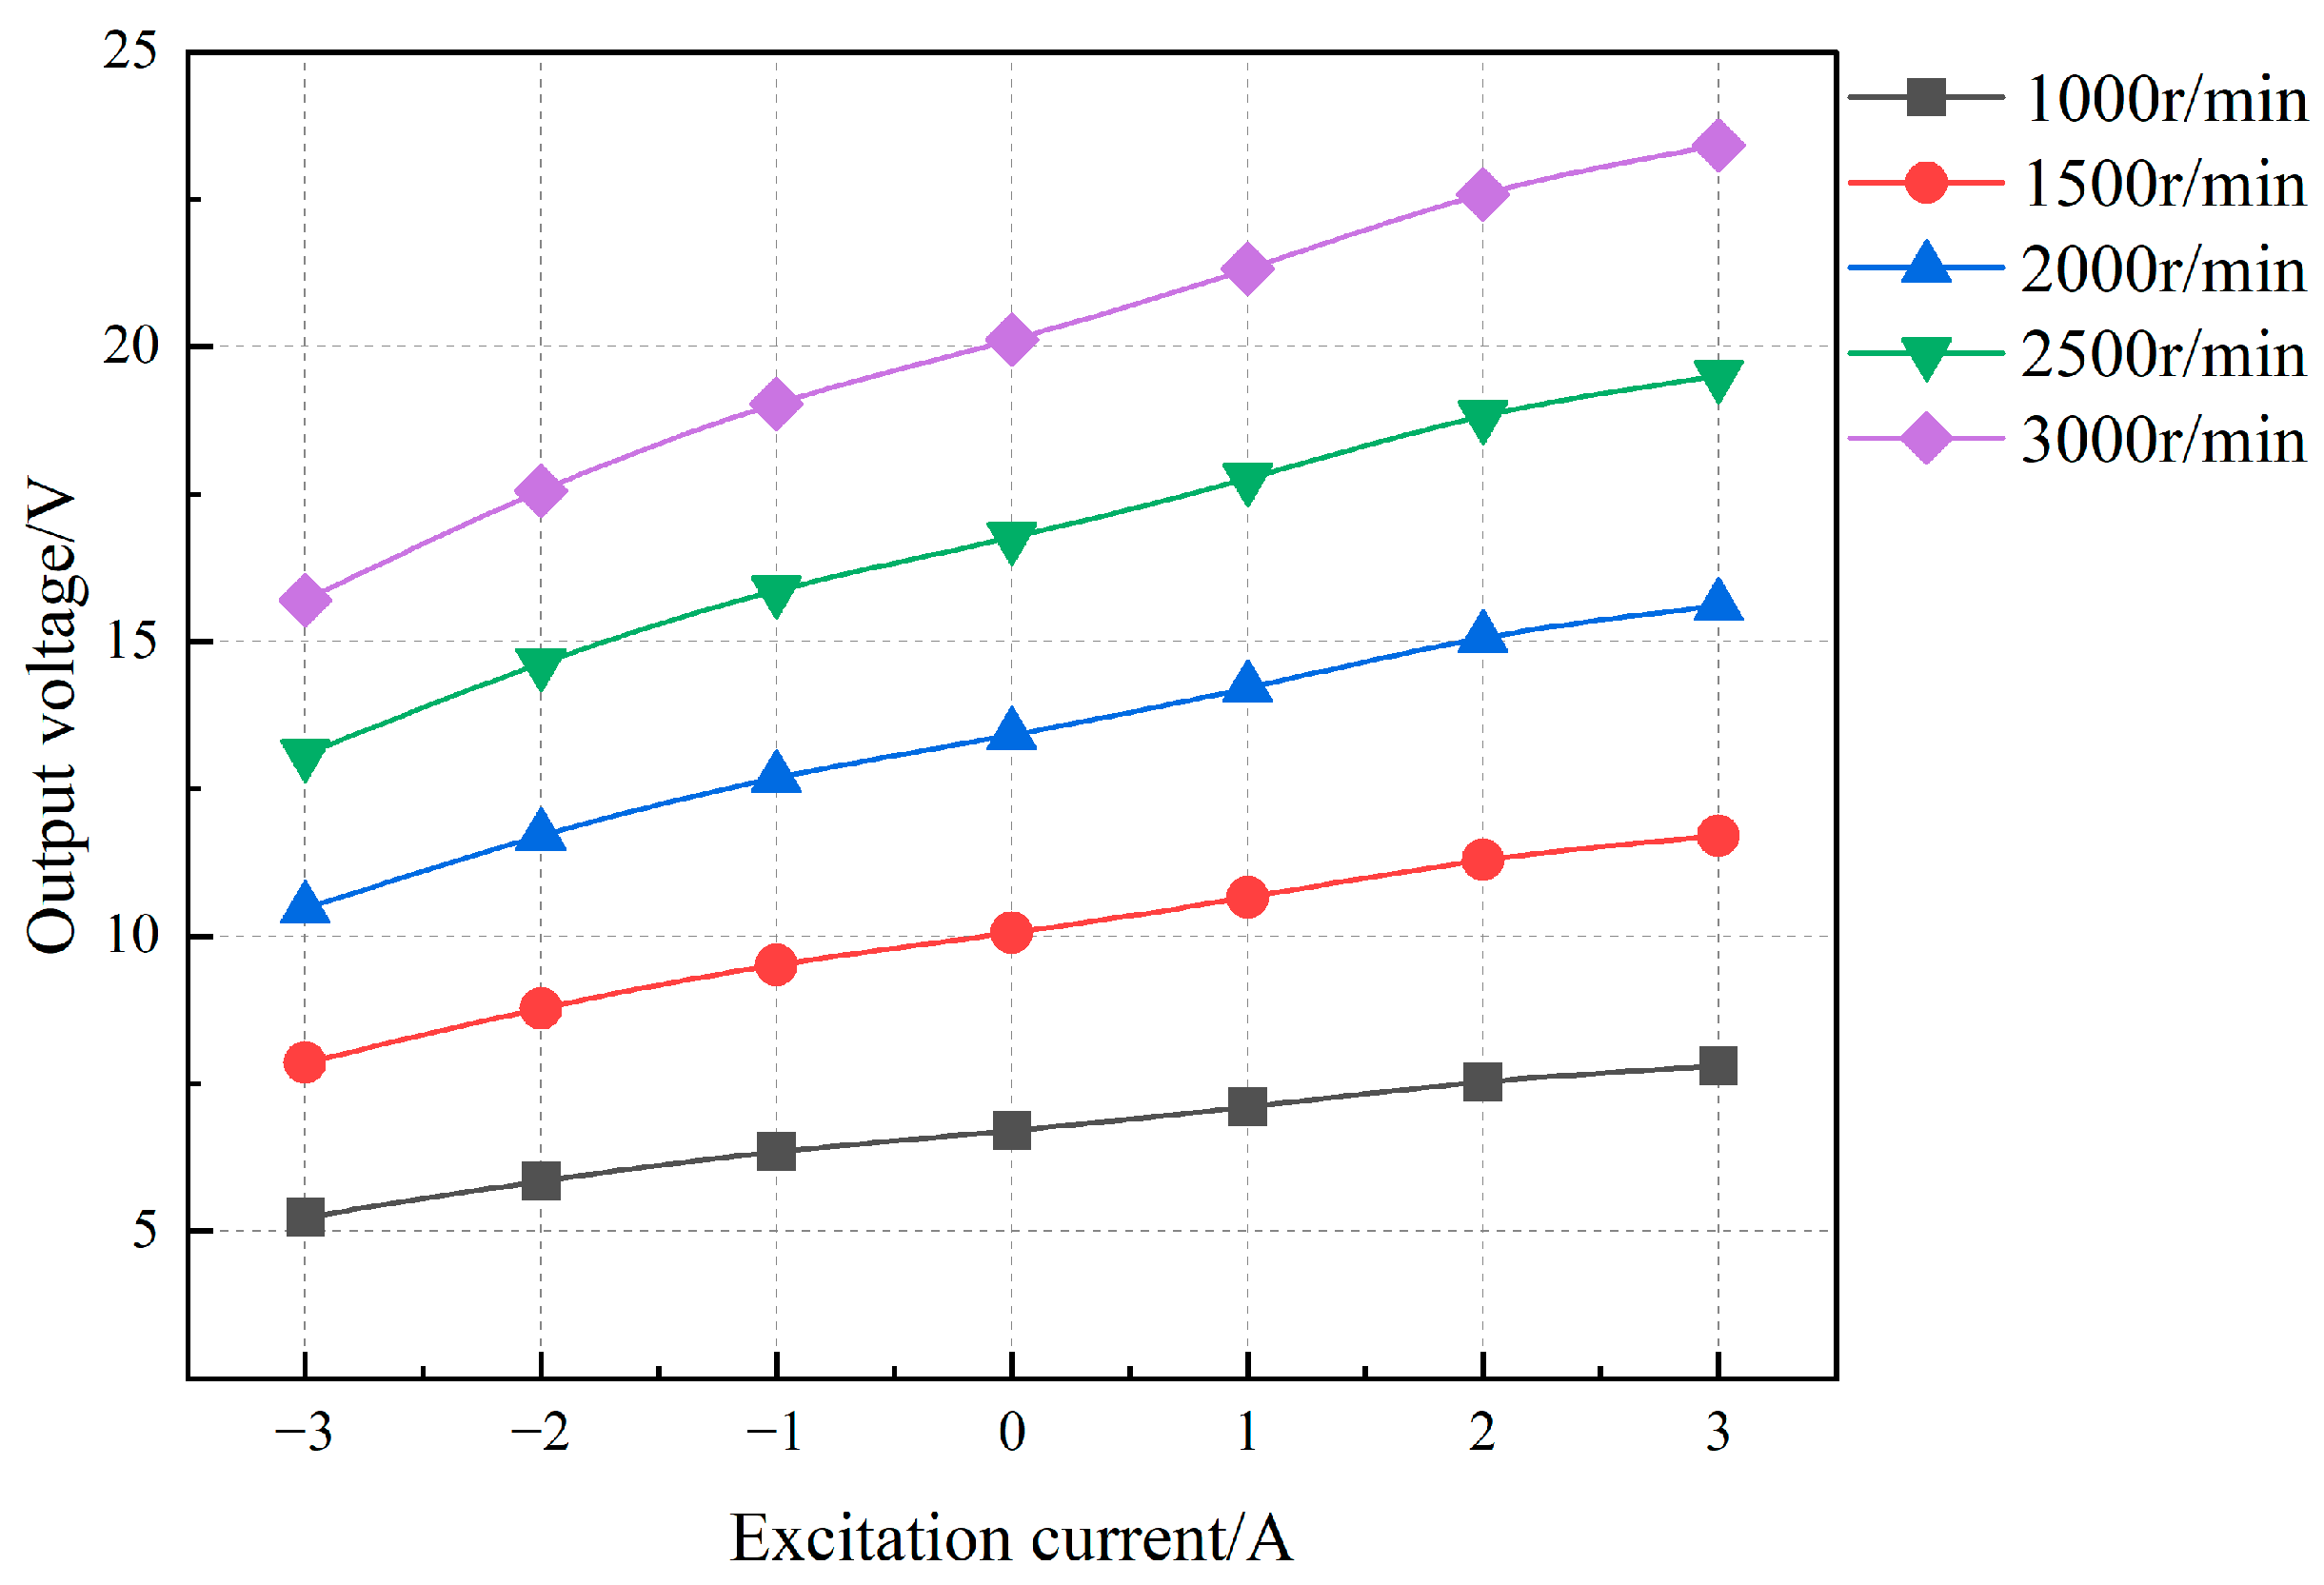
Figure 23.
Adjustment characteristic curve of HEG.
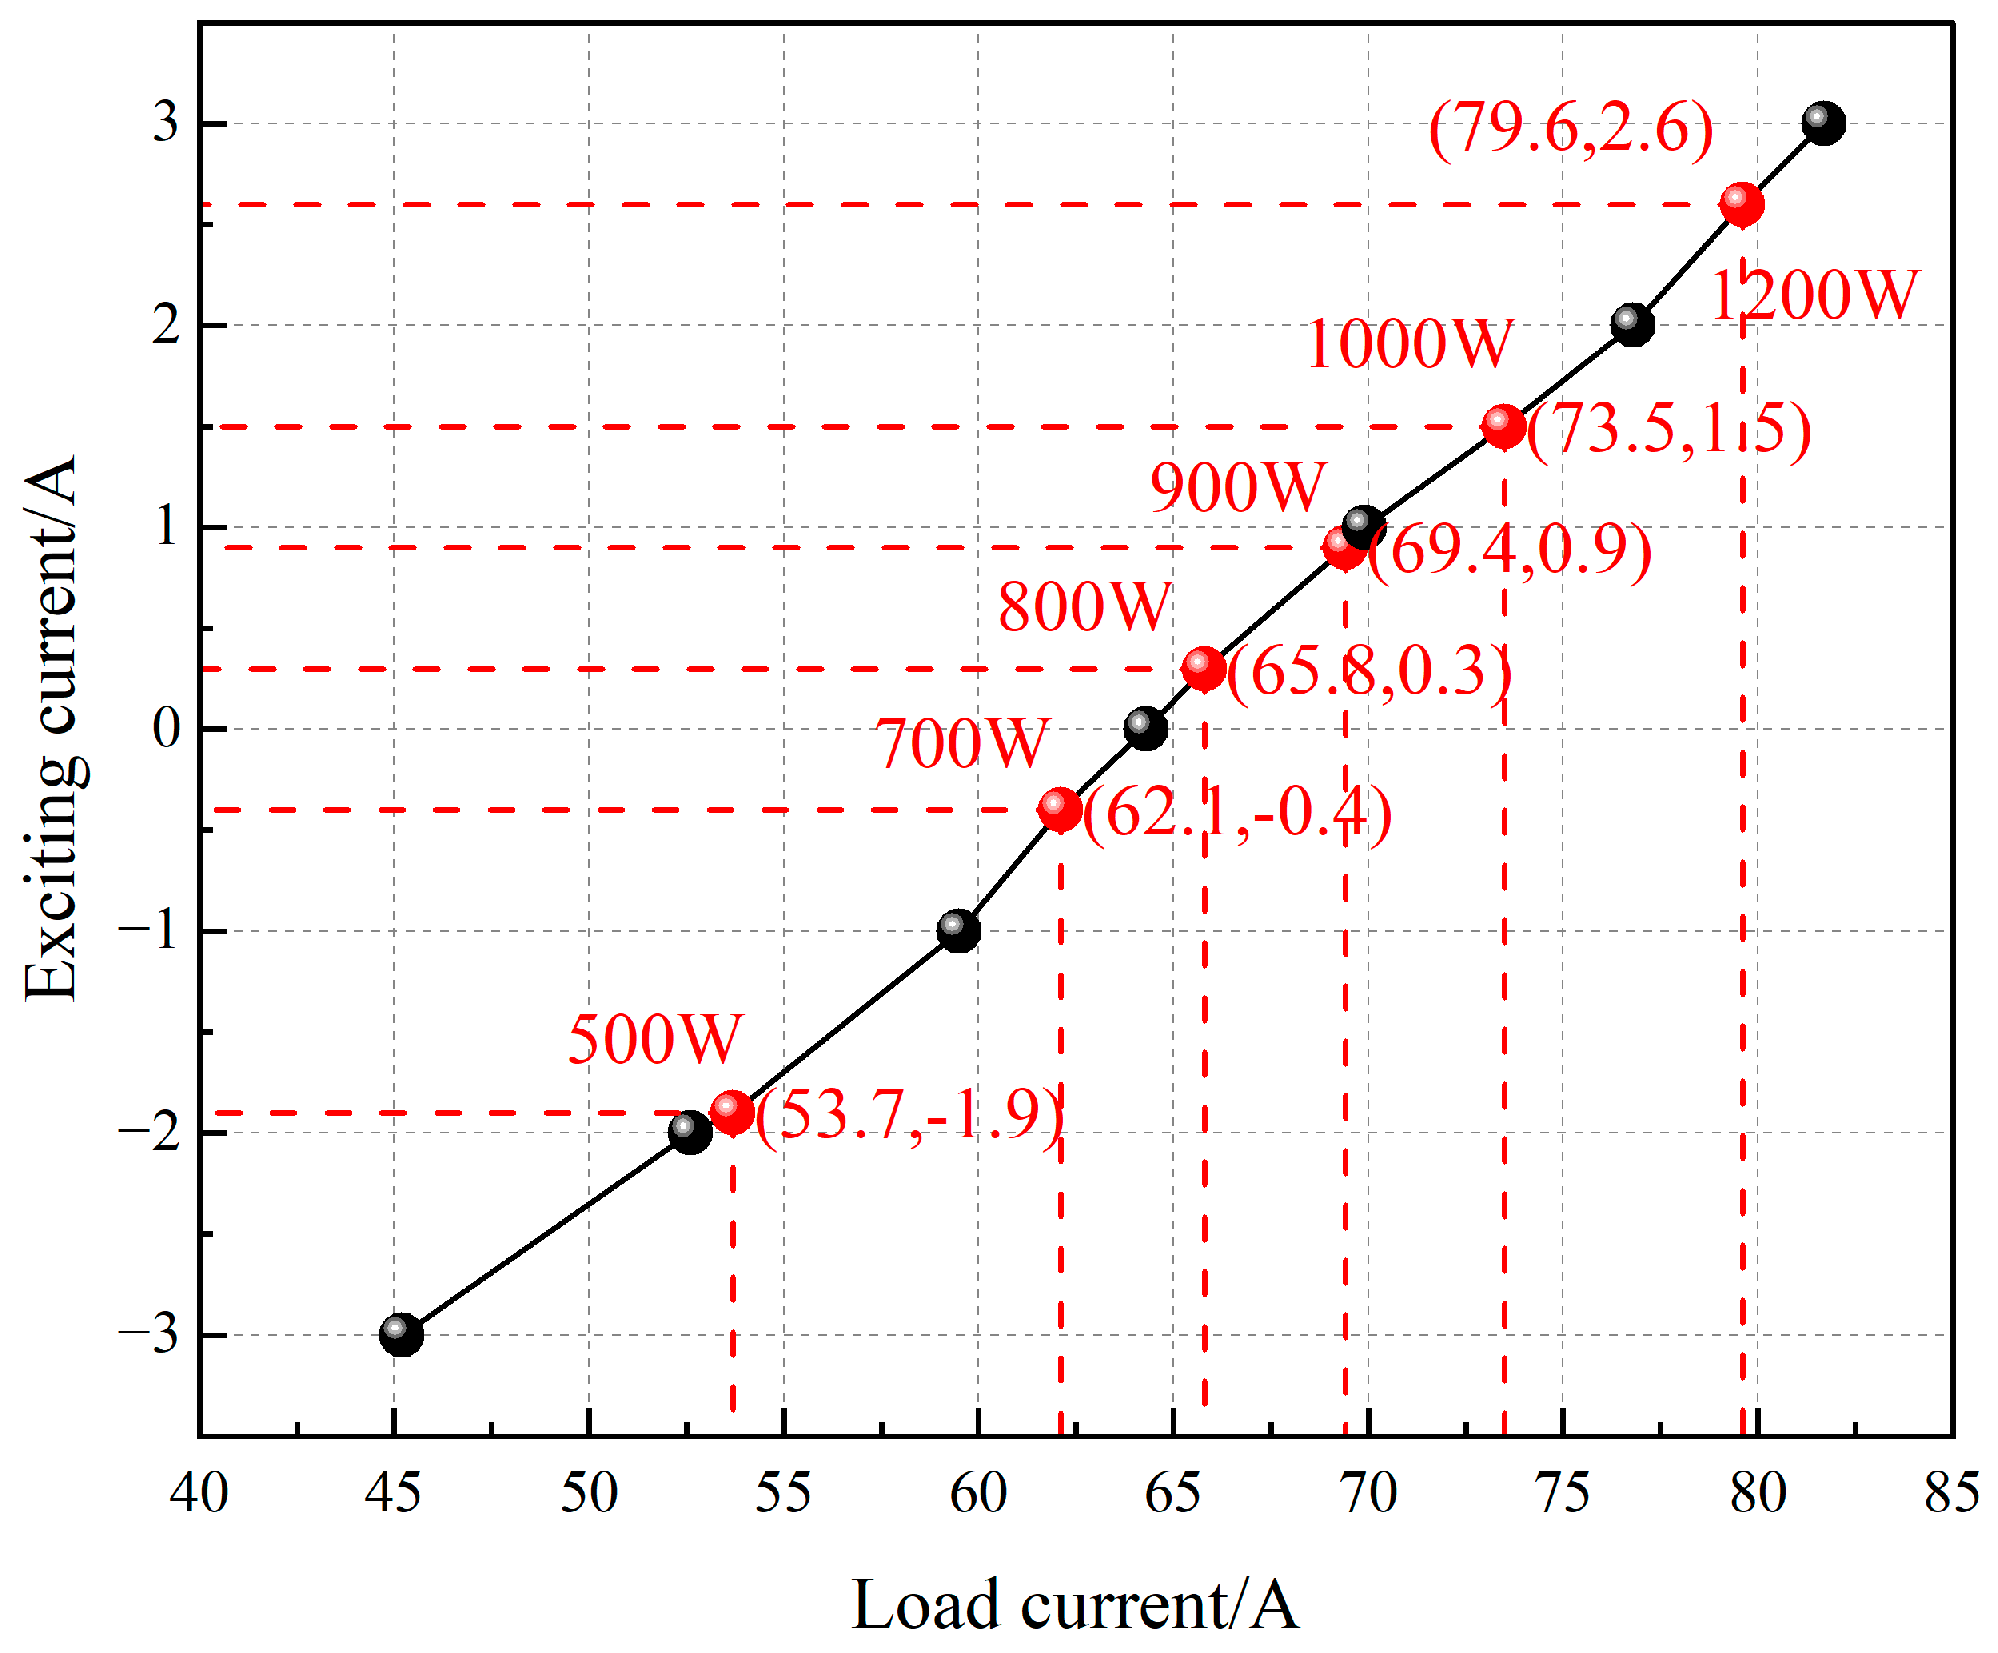

Table 1.
Main parameters of the HEG.
| Parameters | Numerical value | Parameters | Numerical value |
| Rated power/W | 1000 | Stator-rotor axial length/mm | 24 |
| Rated speed/(r/min) | 3000 | Stator outer diameter/mm | 110 |
| Number of poles/slots | 8/36 | Stator inner diameter/mm | 82 |
| Rated voltage/V | 14 | Rotor outer diameter/mm | 81 |
Table 2.
Variation ranges of design parameters.
| Parameters | Range ofvalues | Parameters | Range ofvalues |
| ws/mm | 21~23.5 | h1/mm | 2~3 |
| hs/mm | 9~11 | b2/mm | 4.5~5.5 |
| wb/mm | 10~13 | h2/mm | 2~2.5 |
| hb/mm | 10~13.5 | h3/mm | 4~6 |
| b1/mm | 5~7.7 | β/(°) | 50~65 |
Table 3.
Pearson correlation coefficient composite sensitivity index.
| Design Parameters | Pearson Correlation Coefficient Weights | Integrated Sensitivity/% | ||
| |SEMF(0.25)| | |STcog(0.25)| | |SBr(0.5)| | ||
| ws | 0.430 | 0.523 | 0.079 | 0.063 |
| hs | 0.023 | 0.026 | 0.023 | 0.012 |
| wb | 0.087 | 0.070 | 0.047 | 0.063 |
| hb | 0.036 | 0.035 | 0.042 | 0.039 |
| b1 | 0.730 | 0.424 | 0.729 | 0.653 |
| h1 | 0.218 | 0.098 | 0.217 | 0.187 |
| b2 | 1.000 | 0.541 | 1.000 | 0.885 |
| h2 | 0.162 | 0.610 | 0.401 | 0.394 |
| h3 | 0.166 | 0.094 | 0.137 | 0.086 |
| β | 0.456 | 1.000 | 0.661 | 0.694 |
Table 4.
Experimental design data and results.
| Experiment No. | Optimize parameters | Optimizegoals | ||||
| b1/mm | b2/mm | β/(°) | EA/(V) | Tcog/(mN∙m) | Br/(T) | |
| 1 | 6.17 | 4.73 | 58.50 | 18.2714 | 59.303 | 0.7015 |
| 2 | 5.63 | 5.00 | 59.50 | 18.4952 | 69.126 | 0.7139 |
| 3 | 7.61 | 4.93 | 52.50 | 20.2502 | 67.622 | 0.7944 |
| 4 | 5.81 | 5.47 | 63.50 | 19.7596 | 106.77 | 0.7932 |
| 5 | 7.43 | 5.33 | 53.50 | 20.6093 | 79.282 | 0.8247 |
| 6 | 5.09 | 5.40 | 51.50 | 18.5077 | 40.793 | 0.6954 |
| 7 | 5.99 | 4.60 | 62.50 | 16.4341 | 51.213 | 0.6295 |
| 8 | 5.27 | 4.80 | 61.50 | 15.7405 | 42.145 | 0.5993 |
| 9 | 6.89 | 5.27 | 57.50 | 20.1824 | 87.989 | 0.8079 |
| 10 | 7.07 | 4.87 | 64.50 | 19.6449 | 112.00 | 0.7892 |
| 11 | 6.53 | 5.13 | 55.50 | 19.7269 | 69.687 | 0.7725 |
| 12 | 7.25 | 4.67 | 54.50 | 19.4750 | 61.784 | 0.7558 |
| 13 | 6.35 | 5.07 | 56.50 | 19.4214 | 69.175 | 0.7593 |
| 14 | 5.45 | 4.53 | 50.50 | 13.3469 | 8.9281 | 0.4796 |
| 15 | 6.71 | 5.20 | 60.50 | 19.9521 | 96.960 | 0.8011 |
Table 5.
Optimal solutions of the model on the pareto front.
| Serialnumber | b1/mm | b2/mm | β/(°) | EA/(V) | Tcog/(mN∙m) | Br/(T) |
| 1 | 5.43 | 4.50 | 50.05 | 13.481 | 56.64 | 0.481 |
| 15 | 5.44 | 4.51 | 50.09 | 13.654 | 61.62 | 0.486 |
| 52 | 5.51 | 4.50 | 51.07 | 15.416 | 77.33 | 0.532 |
| …… | …… | …… | …… | …… | …… | …… |
| 171 | 7.47 | 5.04 | 58.03 | 20.335 | 143.27 | 0.798 |
| 218 | 7.45 | 5.04 | 56.03 | 20.324 | 114.45 | 0.797 |
| 386 | 7.30 | 5.10 | 53.04 | 19.78 | 87.44 | 0.768 |
Table 6.
Comparison of generator structural parameters before and after optimization.
| Structureparameter | ws/mm | hs/mm | wb/mm | hb/mm | h3/mm | b1/mm | h1/mm | b2/mm | β/(°) | h2/mm |
| Before Optimization | 22.87 | 10.7 | 12.3 | 10.2 | 5.7 | 5.3 | 2.6 | 5.1 | 64.8 | 2.3 |
| After Optimization | 22 | 10 | 11.6 | 13.8 | 6 | 7.4 | 3 | 5.3 | 53.5 | 2 |
Disclaimer/Publisher’s Note: The statements, opinions and data contained in all publications are solely those of the individual author(s) and contributor(s) and not of MDPI and/or the editor(s). MDPI and/or the editor(s) disclaim responsibility for any injury to people or property resulting from any ideas, methods, instructions or products referred to in the content. |
© 2025 by the authors. Licensee MDPI, Basel, Switzerland. This article is an open access article distributed under the terms and conditions of the Creative Commons Attribution (CC BY) license (http://creativecommons.org/licenses/by/4.0/).
Copyright: This open access article is published under a Creative Commons CC BY 4.0 license, which permit the free download, distribution, and reuse, provided that the author and preprint are cited in any reuse.


