
Submitted:
20 May 2025
Posted:
21 May 2025
You are already at the latest version
Abstract
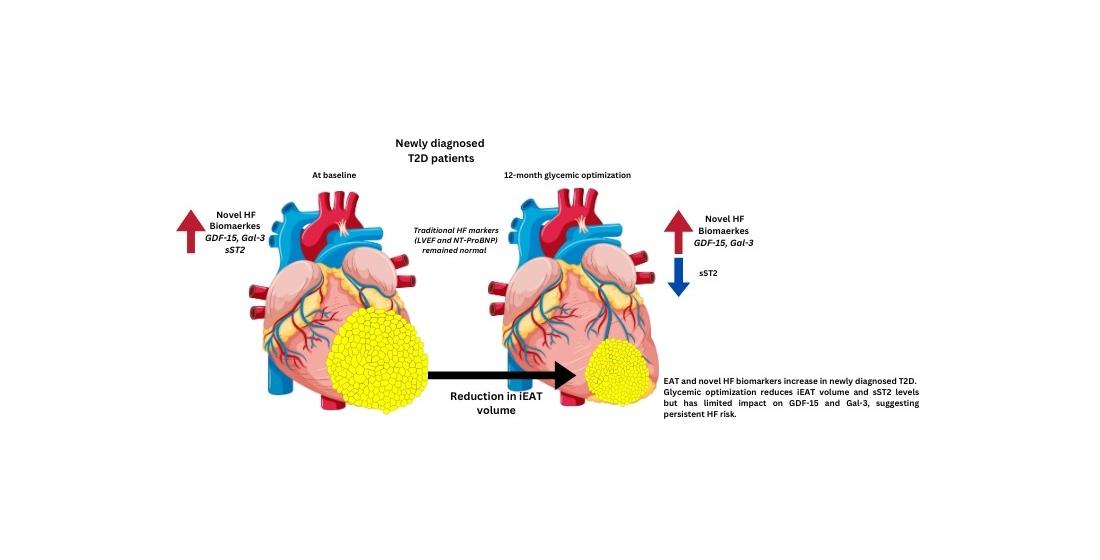
Background: Type 2 diabetes (T2D patients) have a 74% increased risk of heart failure (HF) but traditional HF biomarkers lack sensitivity in early disease detection. Increased epicardial adipose tissue volume (EATv) is associated with cardiovascular risk in T2D, and novel biomarkers such as, Growth differentiation factor 15 (GDF15), Galectin-3, and soluble suppression of tumorigenicity 2 (sST2) are inflammatory bi-omarkers linked to HF. Methods: we investigated associations between EATv, and inflammation biomarkers, and the effect of metabolic control in 14 healthy controls (HC) and 36 newly diagnosed T2D patients before (PGC) and after 12-months of metabolic optimization (GGC). EATv indexed to body surface area (iEATv) was quantified by multidetector computed tomography, and biomarker levels measured by immuno-assays. Results: PGC patients had higher iEATv (59.53±21.67 vs. 36.84±16.57 cm³/m², p=0.0017) and elevated GDF15, Galectin-3, and sST2 (all p< 0.05) than HC. The met-abolic optimization reduced iEATv (p=0.0232) and sST2 (p=0.048), while GDF15 and Galectin-3 remained unchanged. Multivariable analysis confirmed independent as-sociations between iEATv, GDF15 (β = 0.27, p = 0.027) and sST2 (β = 0.29, p = 0.02). Conclusions: these results support the link between systemic inflammation, EAT ex-pansion, and cardiac dysfunction, and the role of adiposity in the early HF risk of T2D patients.
Keywords:
Epicardial Adipose Tissue (EAT)
; Type 2 Diabetes (T2D)
; Cardiovascular Risk
; Heart Failure (HF)
; Inflammatory Biomarkers
; GDF15
; Galectin-3
; sST2 and Metabolic Control (MC)
1. Introduction
Patients with T2D exhibit a twofold increased risk of developing heart failure (HF), regardless of traditional cardiovascular risk factors [1,2,3]. This heightened risk is attributed to a combination of insulin resistance (IR), oxidative stress, and low-grade chronic inflammation, which contribute to vascular dysfunction, myocardial remodeling and fibrosis [4,5,6].
Among the metabolic alterations observed in T2D, visceral adipose tissue (VAT), particularly epicardial adipose tissue (EAT), has gained attention as a key modulator of cardiovascular risk [7,8,9]. EAT, located between the myocardium and pericardium, functions as an active endocrine organ, releasing inflammatory cytokines, adipokines, and profibrotic mediators that may contribute to myocardial fibrosis, diastolic dysfunction, and HF progression [10,11,12]. Notably, increased EAT volume (EATv) has been associated with HF with preserved ejection fraction (HFpEF), the most prevalent form of HF in T2D [13,14,15].
While natriuretic peptides (NPs) remain the gold standard for HF diagnosis, their predictive accuracy in HFpEF is limited [16,17]. Thus, there is an urgent need for alternative biomarkers to aid in the early identification of cardiovascular high-risk T2D patients. Growth differentiation factor 15 (GDF15), Galectin-3, and soluble suppression of tumorigenicity 2 (sST2) have emerged as potential novel HF-related biomarkers, given their roles in fibrosis, myocardial stress, and systemic inflammation [18,19,20].
Given the interplay between EAT, metabolic dysregulation, and inflammatory biomarkers, this study aims to investigate the association between EATv, and novel biomarkers related with inflammation and HF (GDF15, Galectin-3, and sST2) in newly diagnosed T2D patients, as well as determine the effect of metabolic optimization on this association.
2. Materials and Methods
2.1. Study Population
A longitudinal prospective single-center observational cohort study was conducted with 36 newly diagnosed type 2 diabetes (T2D) and 14 age- and sex- matched healthy control participants (HC). . Patients were recruited between 2017 and 2020 and controlled at the Endocrinology and Nutrition Department of Hospital de la Santa Creu i Sant Pau, Barcelona (Spain). . The inclusion criteria included: patients older than 18 years, without previous hypoglycemic, lipid-lowering, anti-inflammatory pharmacology treatment, estimated glomerular filtration rate (eGFR) > 60mL/min/1.73m2) and heart function. The HC group were normolipidemic and normoglycemic individuals, without major risk factors of CVD, and no family history of premature coronary or inflammatory disease. The patients with T2D were studied at diagnosis (poor glycemic control group-PGC-) and after 12 months of metabolic optimization (good glycemic control-GGC-). All patients received a structured program of lifestyle changing, physical activity and pharmacology therapy based on clinical guidelines recommendations The initial pharmacological therapy included metformin, dipeptidyl peptidase inhibitors (DPP4i) and basal insulin in 90% of patients. Basal insulin was suspended after 2 weeks, and non-insulin pharmaceutical treatment was modified based on individualized characteristics of the patients. Neither of the patients was under heart failure-specific therapy. Anthropometric and clinical characteristics, hypoglycemic treatment and biochemical profile of all subjects at baseline and 12 months after follow-up are shown in Supplementary Table S1. At study completion, 30 T2D patients were treated with metformin and 33 with empagliflozin. Additionally, 4 patients were on DPP-4i and 2 received GLP-1 receptor agonists (GLP1-RA), in accordance with current diabetes management guidelines. Notably, no participants received statins or antiplatelet therapy during the study period. These clinical and biochemical data for this cohort were published at Rives et al. 21. The study was approved by the Ethics Committee of the Hospital de Sant Pau (IIBSP-REL-2017-27). Written informed consent was obtained from all participants. This study was performed in full compliance with the Declaration of Helsinki.
2.2. Laboratory Analysis
Blood samples were collected using Vacutainer™ tubes (Becton Dickinson, NJ, USA) with serum and plasma processed in additive-free or EDTA-containing tubes. Serum and plasma were obtained by centrifugation for 15 min at 1500 g at room temperature. A complete profile, included glucose, glycated hemoglobin A1c (HbA1c), C-peptide, total bilirubin, liver function (gamma glutamyl transferase [GGT], aspartate aminotransferase [AST], alanine transaminase [ALT], and alkaline phosphatase [ALP]), high sensitivity C-reactive protein (hsCRP), and lipid profile (cholesterol, triglycerides, VLDLc, LDLc, HDLc, and Lp(a)), was performed on all individuals, as previously described [21]. As specific markers related with the presence of HF, high-sensitive troponin T (hsTnT), N-terminal pro B-type natriuretic (NT-proBNP), GDF15, Gal-3 and sST2 levels were determined. hsTnT, NT-proBNP and GDF15 were quantified by electrochemiluminescence immunoassays in a Cobas e601 autoanalyzer (Roche Diagnostics, Basel, Switzerland). Galectin-3 was determined by chemiluminescence immunoassay in an Alinity Ci autoanalyzer (Abbott, Chicago, IL, USA). sST2 was measured by immunoturbidimetry (Critical Diagnostics, San Diego, CA, USA) in a Cobas e601 autoanalyzer (Roche Diagnostics). Inflammatory biomarkers, which included IL6, TNFα, IL1β, leptin, adiponectin and resistin, were measured using a Luminex system with xMAP® technology (MILLIPLEX® MAP multiplexed assay kit, Millipore).
2.3. Image Analysis
EAT volume was measured by unenhanced scan acquired with a 256-slice multidetector computed tomography (MDCT) scanner (Brilliance iCT 256-slice, Philips Healthcare). This scan was triggered at 75% of the RR interval using from 100 to 120 kV (120 kV in patients with a body mass index > 30 kg/m2). After that, MDCT studies were analyzed in an off-line workstation. The methodology to calculate EAT was done with dedicated software (OsiriX MD, v 6.5, FDA cleared, Pixmeo) as follows: first, the upper and lower slice limits of pericardium were manually defined using axial views. Then, EAT was marked in each slice by drawing regions of interest with voxel density between −150 to −30 Hounsfield units (corresponding to adipose tissue). After that, a contiguous 3-dimensional volume render (showing EAT volume) was performed and quantified in cubic centimeters (cm3) as well as indexed to body surface area (iEAT, cm3/m2). To ensure measurement accuracy, inter-rater variability, and measurements were independently analyzed by experienced cardiologist. Cardiac MRI, used to assess LVEF, was performed as described [16,21].
2.4. Statistical analysis
The descriptive statistics were used to represent the study populations, and data were expressed as the mean ± SD or median ± IQR for continuous variables and as frequencies (percentages) for categorical variables. The normality of numerical data distribution was verified using the Shapiro-Wilk test. A bivariate analysis was used for paired data, the analysis was validated using a non-parametric approach. Relationships between HF and inflammatory biomarkers, and iEATv were assessed using Spearman correlation analysis. Significant variables associated with iEAT in the correlation analysis were included in the forward stepwise multivariable linear regression analysis. Regression models were adjusted for potential confounders, including age, BMI, renal function, and glycemic control. Collinearity among independent variables was assessed using the variance inflation factor (VIF) < 5 (Table 2). A two-sided p-value < 0.05 was considered statistically significant. Statistical analyses were performed using the statistical software packages IBM-SPSS 27.0, and GraphPad Prism Software 9.
3. Results
3.1. Clinical Characteristics
This is the same cohort studied in Ribes et al, [21] and clinical characteristics and biochemical profile can be found in that study. However, to facilitate the reading of this study, we have included this same data as a Supplementary Table 1. Briefly, compared with HC, T2D diabetic patients at diagnosis (poor glycemic control group-PGC-) had greater BMI, higher levels of the parameters of hepatic function and systemic inflammation (hsCRP), and marked alterations in the lipid profile. After a 12-month follow-up, HbA1c decreased from 11.7 ± 2.1 to 6.1 (0.77) % (p= <0.05) and BMI from 33.53 ± 7.27 to 31.87 ± 5.59 kg/m2 (p=<0.05) in T2D patients with good glycemic control group (GGC). This improvement in metabolic optimization, although improved, did not normalize most parameters compared with HC.
3.2. iEAT Volume and Left Ventricular Function
A significant difference in iEATv was observed between the groups. iEATv in the PGC group was higher than in HC (59.53 ± 21.67 vs 36.84 ± 16.57 cm/m2; p = 0.0017). In TD2 group, iEATv decreased after metabolic optimization (59.53 ± 21.67 vs 54.59 ± 18.76 cm/m2; p = 0.0232), but remains higher than in the HC group (54.59 ±18.76 vs 36.84 ± 16.57 cm/m2; p = 0.007). Although LVEF was within the normal range in T2D patients in PGC (58.80 ± 4.45%) and did not differ from that of HCs (61.39 ± 5.53%), there was a slight improvement in LEVF in T2D after metabolic optimization (65.61 ± 6.18%; p = 0.0257). As we mentioned before, these results have been previously published 21. Furthermore, PGC group had significantly higher end-systolic volume (ESV) compared to those with GGC (36.16 ± 19.27 mL/m² vs. 29.80 ± 16.83 mL/m², p= 0.024), while end-diastolic volume (EDV) did not differ significantly (81.21 ± 22.80 vs. 74.87 ± 20.46 mL/m², p= ns).
3.3. Biomarkers of Inflammation
Plasma levels of inflammation-related biomarkers, including IL6, TNFα adiponectin and resistin, are altered in the PGC group compared with HC group. The improvement of metabolic control significantly decreased IL1β, IL6 and resistin levels, but remained higher than in controls (Figure 1).
The most relevant correlations of inflammatory biomarkers are shown in Table 1. As a summary, inflammation markers correlated with weight-related, glycemia-related, HDLc and liver function parameters, but only TNFα showed correlations with iEATv and cardiac function (LVEF).
3.4. Multivariate Analysis of EAT and Inflammatory Biomarkers
Given these significant correlations, we conducted a multivariate analysis to determine whether EAT were independently associated to inflammatory biomarker levels. However, after adjusting for metabolic and cardiovascular variables, no independent associations were found (data not shown).
3.5. Novel HF-Related Biomarkers
Traditional markers for the diagnosis of HF such as LVEF, NT-proBNP and hsTnT were not significantly different between groups. These data have been previously published 21 and indicate that there was no evidence of overt HF in these patients.
Regarding novel inflammation and HF-related biomarkers, increased plasma levels were observed in T2D patients, compared to HC, in both PGC and GCG groups (Figure 2). Metabolic optimization significantly reduced plasma sST2 levels.
Spearman’s rank correlation analysis revealed that GDF15, Galectin-3, and sST2 were positively correlated with age, HbA1c, AW, and BMI. In addition, iEATv showed positive correlations with GDF15, sST2, and TNFα. GDF15 and Galectin-3 were also positively correlated with IL6 and hsCRP. All three novel biomarkers correlated positively with liver function tests. Conversely, GDF15 demonstrated negative correlations with HDL-c, LDL-c, and TC, while sST2 was negatively correlated with LVEF. The correlations between all parameters are shown in the Table 2.

Table 2.
Statistically significant correlations of GDF15, Galectin-3 and sST2 with clinical and laboratory parameters using the Spearman’s rank correlation coefficient.
Table 2.
Statistically significant correlations of GDF15, Galectin-3 and sST2 with clinical and laboratory parameters using the Spearman’s rank correlation coefficient.
| Spearman’s rank correlation coefficient test | |||||||
| GDF15 | Galectin-3 | sST2 | |||||
| Clinical | r | p | r | p | r | p | |
| Age | 0.56 | <0.0001 | 0.26 | 0.022 | 1 | 1 | |
| BMI | 0.23 | 0.04 | 0.27 | 0.02 | 0.28 | 0.015 | |
| Weight | 0.18 | 0.10 | 0.09 | 0.41 | 0.35 | 0.002 | |
| AW | 0.27 | 0.028 | 0.25 | 0.034 | 0.31 | 0.009 | |
| Biochemical | HbA1c | 0.35 | 0.002 | 0.27 | 0.026 | 0.26 | 0.029 |
| Glucose | 0.31 | 0.006 | 0.23 | 0.053 | 0.37 | 0.001 | |
| ALP | 0.29 | 0.010 | 0.25 | 0.033 | 0.14 | 0.22 | |
| GGT | 0.27 | 0.020 | -0.92 | 0.44 | 0.24 | 0.04 | |
| HDL-c | -0.46 | <0.001 | -0.19 | 0.11 | -0.19 | 0.10 | |
| LDL-c | -0.28 | 0.016 | -0.24 | 0.84 | -0.50 | 0.67 | |
| Inflammation | hsCRP | 0.31 | 0.008 | 0.27 | 0.02 | 0.09 | 0.42 |
| TNFα | 0.37 | <0.001 | 0.052 | 0.66 | 0.097 | 0.40 | |
| IL6 | 0.25 | 0.02 | 0.27 | 0.02 | -0.058 | 0.61 | |
| Cardiac Parameters | iEAT | 0.52 | <0.001 | 0.19 | 0.11 | 0.37 | <0.001 |
| LVEF | 0.055 | 0.68 | 0.19 | 0.16 | -0.30 | 0.025 | |
3.6. EAT and Novel HF-Related Biomarkers
Beyond traditional inflammatory markers, we explored the relationship between EAT and novel HF-related biomarkers. To determine the parameters independently associated with GDF15, Galectin-3, and sST2, we performed a stepwise multivariable analysis, adjusting for hypoglycemic therapy. Classical variables included in the model were age, BMI, AW, sex, HbA1c, and NT-ProBNP. Additionally, iEAT and inflammation-related parameters that showed significant correlations with each biomarker were sequentially added. This analysis showed that iEATv is independently associated with GDF15 and sST2 levels. In addition, age was associated with the GDF15. On the other hand, hsCRP was the only variable associated with the values of Galectin-3. To summarize, this analysis showed that GDF15 and sST2 are closely related with iEAT, that is with visceral adiposity, whereas Galectin-3 depends mainly on hsCRP, that is with systemic inflammation (Table 3).
4. Discussion
In the present study, we found that newly diagnosed T2D patients had significantly higher EATv compared to controls, and that the improvement of glycemic control and weight loss allowed a significant reduction of iEATv. On the other hand, GDF15, Galectin-3, and sST2 were elevated in T2D, even in the absence of significant differences in LVEF, NT-proBNP, and hsTnT levels, which are classical markers of overt HF, and in a multivariate regression analysis iEATv was independently associated with GDF15 and sST2. These results support the potential role of adiposity in the early HF risk of T2D patients T2D patients have a 74% increased risk of HF, with HFpEF being the most underdiagnosed form [1,8]. In Spain, the DIABET-IC study reported a 39.2% prevalence of HF in T2D patients, with 30.6% attributed to HFpEF [15]. Therefore, identify a risk marker that could be used in both clinical and nonclinical settings to early risk identification of cardiovascular and HF risk of T2D patients is critical. In our study, in absence of significant alterations in LVEF, EDV, and classical markers of HF, improvement of glycemic control and weight loss increased LVEF and reduced ESV but did not significantly reduce EDV. These findings suggest that systolic function, as reflected by ESV and LVEF, may be more responsive to metabolic optimization than diastolic function, which are often more resistant to short-term interventions [22,23]. Identifying biomarkers and early metabolic disturbances associated with the development of HF may be critical for preventing and treating HF early in the type 2 diabetes population.
Currently, NT-ProBNP and BNP are the recommended biomarkers for HF diagnosis, but they have limitations in detecting early HF, particularly in obese patients [16,17]. As a result, novel biomarkers have been proposed for HF risk stratification [17]. GDF15, Galectin-3, and sST2 play distinct roles in HF pathophysiology. Galectin-3 promotes fibrosis and myocardial remodeling, correlating with HFpEF severity and cardiovascular mortality [19,24]. sST2, a soluble receptor for interleukin-33 (IL-33), is secreted in response to myocardial stress, promoting remodeling and apoptosis [17,25,26]. GDF15, secreted in response to ischemic and inflammatory stress, has been linked to poor prognosis in acute and chronic HF [27] . In our study, these biomarkers remained elevated despite metabolic optimization, suggesting ongoing inflammatory and fibrotic activity in T2D, which could predispose to an early development of CVD, including HF. sST2 was the only biomarker significantly reduced with metabolic optimization, supporting its role as a potential marker of metabolic intervention efficacy [25,26]. Galectin-3 levels negatively correlated with both EDV and ESV in patients with diabetes and emphasizes the potential utility of Galectin-3 as an early biomarker to identify diabetic patients at higher cardiovascular risk despite apparently normal volumetric parameters.
EAT plays a key role in early atherosclerosis and HF progression [28]. While EAT typically accounts for ~20% of the total heart weight (~100g) [13,29], it can exceed 400g in obesity and T2D 30. Due to its proximity to the myocardium and coronary arteries, excessive EAT may promote ventricular stiffness and diastolic dysfunction [13,30,31]. Additionally, EAT acts as an endocrine and paracrine organ, altering cardiomyocyte metabolism, shifting energy utilization toward free fatty acid uptake, and activating inflammation and oxidative stress pathways [12,32,33]. These mechanisms contribute to remodeling, fibrosis, and ultimately HF [12,31,34,35]. The observed relationship between EAT expansion and increased GDF15 and sST2 levels, as well as the reduction of iEATv after glycemic optimization and weight loss, supports the effect of EAT to the inflammatory and fibrotic processes leading to CVD and HF in this population, and reinforce the potential impact of these interventions in modulating cardiometabolic risk.
We also observed elevated inflammatory markers (hsCRP, IL1β, IL6, and TNFα) in T2D patients, suggesting a systemic inflammatory state rather than an isolated effect of adipose tissue, because adipose tissue-specific adipokines such as, adiponectin or leptin, were not increased in T2D. IL1β correlated with LVEF, and TNFα correlated with HbA1c, hsCRP, and iEATv, implying a potential link between systemic inflammation, EAT expansion, and cardiac dysfunction. However, after multivariable analysis, no direct association between inflammatory markers and iEATv or LVEF remained, indicating that these mediators may contribute indirectly to HF progression.
Limitations
A key limitation of our study is the small sample size, which was constrained by recruitment challenges during the COVID-19 pandemic. Also, the lack of longitudinal outcome data restricts the ability to assess the long-term prognostic value of these biomarkers. Although statistical associations between iEATv and biomarkers such as GDF15 and sST2 were observed, the cross-sectional nature of the baseline/follow-up design limits causal inference Nonetheless, our findings provide valuable preliminary insights into the interplay between EAT, metabolic control, and cardiovascular biomarkers in early T2D. Future studies with larger, more diverse cohorts are needed to validate these findings, explore long-term outcomes, and assess the impact of EAT-targeted interventions. Additionally, sex-based differences in HFpEF prevalence and biomarker expression were not explicitly examined, due to the sample size.
5. Conclusions
In newly diagnosed T2D patients, we observed increased iEATv and elevated levels of GDF15, Galectin-3, and sST2, all of which have been implicated in inflammation and HF risk. While weight loss and glycemic optimization led to reductions in iEATv and sST2, GDF15 and Galectin-3 remained persistently elevated, indicating possible ongoing inflammatory activity. Multivariable analysis confirmed independent associations between iEATv and both GDF15 and sST2, supporting the role of visceral adiposity in modulating inflammatory and metabolic pathways that may contribute to cardiovascular complications. Future studies are needed to confirm these findings and define the usefulness of new biomarkers.
Supplementary Materials
The following supporting information can be downloaded at the website of this paper posted on Preprints.org, supplementary Table S1.
Author Contributions
Conceptualization: AP, JLS-Q. Formal analysis, Investigation, and Methodology: Laboratory analysis: PG-M, JR, AG-O, MG-A, NP, SB. Patients recruitment and follow-up: PG-M, IG, IM, AP. Image analysis: DV. Statistical analysis: IG and PG-M. Analysis and interpretation of data: PG-M, JR, DV, IG, IM, AP, JLS-Q, Writing – original draft: P.G-M. Writing – review and editing: PG.-M, JR, DV, IG, JJ, AP, JLS-Q, S.B; Funding acquisition: AP, JLS-Q.
Funding
This research was funded by grants FIS PI16/00471, PI17/00232 and PI20/00334 from the Instituto de Salud Carlos III (co-financed by the European Regional Development Fund). NP is funded by the Instituto de Salud Carlos III predoctoral contract FI20/00252. SB, JJ, AP, and JLS-Q are members of CIBER of Diabetes and Metabolic Diseases (CIBERDEM, Instituto de Salud Carlos III Project). SB, JLS-Q, and NP are members of the Quality. Research Group 2017-SGR-1149 from Generalitat de Catalunya, and of the Spanish. Atherosclerosis Society Vascular Biology Group. Institut de Recerca Sant Pau (IR Sant Pau) is accredited by CERCA Programme/Generalitat de Catalunya. JJ has received financial support from Agencia Estatal de Investigación (MCIN/AEI/10.13039/501100011033 and European Union “NextGeneration EU”/PRTR) within the action "Consolidación Investigadora 2022" (CNS2022-135559). Additionally, this study was supported by the XII SED Grant for Clinical Research Projects in Diabetes led by Young Investigators, awarded in 2021 by the Spanish Diabetes Society (Sociedad Española de Diabetes, SED), for the project titled “Relación del volumen de tejido adiposo epicárdico en diabetes con nuevos biomarcadores de insuficiencia cardíaca y perfil de microRNAs” (“Relationship of epicardial adipose tissue volume in diabetes with novel biomarkers of heart failure and microRNA profiles”).
Institutional Review Board Statement
The study was approved by the Ethics Committee of the Hospital de Sant Pau (IIBSP-REL-2017-27). Written informed consent was obtained from all participants. This study was performed in full compliance with the Declaration of Helsinki.
Informed Consent Statement
All subjects gave written informed consent before participating in the study. Written informed consent to participate in the study and publish results in medical journals was obtained from patients.
Data Availability Statement
All the information of this study is available upon reasonable request by contacting with the corresponding author.
Conflicts of Interest
These authors declare that no conflict of interest exists.
Abbreviations
- AGEs – Advanced Glycation End Products
- ALP – Alkaline Phosphatase
- ALT – Alanine Transaminase
- AST – Aspartate Aminotransferase
- AW – Abdominal Waist
- BMI – Body Mass Index
- BNP – B-type Natriuretic Peptide
- CVD – Cardiovascular Disease
- DPP4i – Dipeptidyl Peptidase-4 Inhibitors
- EAT – Epicardial Adipose Tissue
- EATv – Epicardial Adipose Tissue Volume
- EDV- end-diastolic volume left ventricular
- eGFR – Estimated Glomerular Filtration Rate
- ESV- end-systolic volume left ventricular
- FFAs – Free Fatty Acids
- GDF15 – Growth Differentiation Factor 15
- GGC – Good Glycemic Control
- GGT – Gamma-Glutamyl Transferase
- GLP1-ar – Glucagon-Like Peptide 1 Agonist Receptor
- HC – Healthy Controls
- HDLc – High-Density Lipoprotein Cholesterol
- HF – Heart Failure
- HFpEF – Heart Failure with Preserved Ejection Fraction
- HFrEF – Heart Failure with Reduced Ejection Fraction
- hsCRP – High-Sensitivity C-Reactive Protein
- hsTnT – High-Sensitivity Troponin T
- iEAT – Indexed Epicardial Adipose Tissue
- IL – Interleukin
- IR – Insulin Resistance
- LDLc – Low-Density Lipoprotein Cholesterol
- LVEF – Left Ventricular Ejection Fraction
- MDCT – Multidetector Computed Tomography
- MRI – Magnetic Resonance Imaging
- NPs – Natriuretic Peptides
- NT-proBNP – N-terminal pro-B-type Natriuretic Peptide
- PGC – Poor Glycemic Control
- ROS – Reactive Oxygen Species
- sHF – Subclinical Heart Failure
- sST2 – Soluble Suppression of Tumorigenicity 2
- T1D – Type 1 Diabetes
- T2D – Type 2 Diabetes
- TC – Total Cholesterol
- Tg – Triglycerides
- TNFα – Tumor Necrosis Factor Alpha
- VAT – Visceral Adipose Tissue
- VIF – Variance Inflation Factor
- VLDLc – Very Low-Density Lipoprotein Cholesterol
following abbreviations are used in this manuscript:
References
- Gulsin GS, Athithan L, McCann GP. Diabetic cardiomyopathy: prevalence, determinants and potential treatments. Ther Adv Endocrinol Metab. 2019;10:2042018819834869. [CrossRef]
- Nichols GA, Gullion CM, Koro CE, Ephross SA, Brown JB. The incidence of congestive heart failure in type 2 diabetes: An update. Diabetes Care. 2004;27(8):1879-1884. [CrossRef]
- Savji N, Meijers WC, Bartz TM, et al. The Association of Obesity and Cardiometabolic Traits with Incident HFpEF and HFrEF HHS Public Access. JACC Heart Fail. 2018;6(8):701-709. [CrossRef]
- Luc K, Schramm-Luc A, Guzik TJ, Mikolajczyk TP. Oxidative stress and inflammatory markers in prediabetes and diabetes. Journal of Physiology and Pharmacology. 2019;70(6):809-824. [CrossRef]
- Evangelista I, Nuti R, Picchioni T, Dotta F, Palazzuoli A. Molecular Sciences Molecular Dysfunction and Phenotypic Derangement in Diabetic Cardiomyopathy. Published online 2019. [CrossRef]
- Okdahl T, Wegeberg AM, Pociot F, Brock B, Størling J, Brock C. Low-grade inflammation in type 2 diabetes: A cross-sectional study from a Danish diabetes outpatient clinic. BMJ Open. 2022;12(12). [CrossRef]
- Sardu C, D’Onofrio N, Torella M, et al. Pericoronary fat inflammation and Major Adverse Cardiac Events (MACE) in prediabetic patients with acute myocardial infarction: Effects of metformin. Cardiovasc Diabetol. 2019;18(1):1-11. [CrossRef]
- Lorenzo-Almorós A, Tuñón J, Orejas M, Cortés M, Egido J, Lorenzo Ó. Diagnostic approaches for diabetic cardiomyopathy. Cardiovasc Diabetol. 2017;16:28. [CrossRef]
- Gruzdeva O, Borodkina D, Uchasova E, Dyleva Y, Barbarash O. Localization of fat depots and cardiovascular risk. [CrossRef]
- Park JJ. Epidemiology, pathophysiology, diagnosis and treatment of heart failure in diabetes. Diabetes Metab J. 2021;45(2):146-157. [CrossRef]
- Packer M. Epicardial Adipose Tissue May Mediate Deleterious Effects of Obesity and Inflammation on the Myocardium. J Am Coll Cardiol. 2018;71(20):2360-2372. [CrossRef]
- Iacobellis G. Local and systemic effects of the multifaceted epicardial adipose tissue depot. Nat Rev Endocrinol. 2015;11(6):363-371. [CrossRef]
- Patel VB, Shah S, Verma S, Oudit GY. Epicardial adipose tissue as a metabolic transducer: role in heart failure and coronary artery disease. Heart Fail Rev. 2017;22(6):889-902. [CrossRef]
- Liu J, Yu Q, Li Z, et al. Epicardial adipose tissue density is a better predictor of cardiometabolic risk in HFpEF patients: a prospective cohort study. Cardiovasc Diabetol. 2023;22(1). [CrossRef]
- Gonzalez-Manzanares R, Anguita-Gámez M, Muñiz J, et al. Prevalence and incidence of heart failure in type 2 diabetes patients: results from a nationwide prospective cohort—the DIABET-IC study. Cardiovasc Diabetol. 2024;23(1). [CrossRef]
- McDonagh TA, Metra M, Adamo M, et al. 2021 ESC Guidelines for the diagnosis and treatment of acute and chronic heart failure. Eur Heart J. 2021;42(36):3599-3726. [CrossRef]
- Meijers WC, Bayes-Genis A, Mebazaa A, et al. Circulating heart failure biomarkers beyond natriuretic peptides: review from the Biomarker Study Group of the Heart Failure Association (HFA), European Society of Cardiology (ESC). Eur J Heart Fail. 2021;23(10):1610-1632. [CrossRef]
- Pieske B, Tschöpe C, De Boer RA, et al. How to diagnose heart failure with preserved ejection fraction: The HFA-PEFF diagnostic algorithm: A consensus recommendation from the Heart Failure Association (HFA) of the European Society of Cardiology (ESC). Eur Heart J. 2019;40(40):3297-3317. [CrossRef]
- Michalska-Kasiczak M, Bielecka-Dabrowa A, Von Haehling S, Anker SD, Rysz J, Banach M. Biomarkers, myocardial fibrosis and co-morbidities in heart failure with preserved ejection fraction: An overview. Archives of Medical Science. 2018;14(4):890-909. [CrossRef]
- Rabkin SW. The utility of growth differentiation factor-15 , galectin-3 , and sST2 as biomarkers for the diagnosis of heart failure with preserved ejection fraction and compared to heart failure with reduced ejection fraction : a systematic review. Heart Fail Rev. Published online 2020.
- Rives J, Gil-millan P, Viladés D, et al. Low-Density Lipoprotein Subfraction Phenotype Is Associated with Epicardial Adipose Tissue Volume in Type 2 Diabetes. 2025;i.
- Pieske B, Tschöpe C, De Boer RA, et al. How to diagnose heart failure with preserved ejection fraction: The HFA-PEFF diagnostic algorithm: A consensus recommendation from the Heart Failure Association (HFA) of the European Society of Cardiology (ESC). Eur Heart J. 2019;40(40):3297-3317. [CrossRef]
- Hatle L. How to diagnose diastolic heart failure - A consensus statement. In: European Heart Journal. Vol 28. ; 2007:2421-2423. [CrossRef]
- Merino-Merino A, Gonzlez-Bernal J, Fernandez-Zoppino D, Saez-Maleta R, Perez-Rivera JA. The role of galectin-3 and st2 in cardiology: A short review. Biomolecules. 2021;11(8):1-9. [CrossRef]
- Singh H, Khadanga S, Goel SK, et al. Evaluation of interleukin-33 & sST2 levels in type-2 diabetic mellitus patients with or without metabolic syndrome. Indian Journal of Medical Research. 2023;157(5):470-476. [CrossRef]
- Castiglione V, Chiriaco’ M, Aimo A, et al. Prognostic Value of SST2 in Heart Failure Patients with Diabetes. Available online: https://academic.oup.com/eurheartj/article/42/Supplement_1/ehab724.0869/6394967.
- Chaikijurajai T, Tang WHW. Reappraisal of Inflammatory Biomarkers in Heart Failure. Curr Heart Fail Rep. 2020;17(1):9-19. [CrossRef]
- Rossi VA, Gruebler M, Monzo L, Galluzzo A, Beltrami M. The Different Pathways of Epicardial Adipose Tissue across the Heart Failure Phenotypes: From Pathophysiology to Therapeutic Target. Int J Mol Sci. 2023;24(7). [CrossRef]
- Jia G, Whaley-Connell A, Sowers JR. Diabetic cardiomyopathy: a hyperglycaemia-and insulin-resistance-induced heart disease HHS Public Access. Diabetologia. 2018;61(1):21-28. [CrossRef]
- Le Jemtel TH, Samson R, Ayinapudi K, Singh T, Oparil S. Epicardial Adipose Tissue and Cardiovascular Disease. Curr Hypertens Rep. 2019;21(5). [CrossRef]
- Marisa Costa V, Carvalho F, Kulkarni P, et al. Dysregulated Epicardial Adipose Tissue as a Risk Factor and Potential Therapeutic Target of Heart Failure with Preserved Ejection Fraction in Diabetes. Published online 2022. [CrossRef]
- Greulich S, Maxhera B, Vandenplas G, et al. Secretory Products From Epicardial Adipose Tissue of Patients With Type 2 Diabetes Mellitus Induce Cardiomyocyte Dysfunction. Published online 2012. [CrossRef]
- Puig N, Rives J, Gil-Millan P, et al. Apolipoprotein J protects cardiomyocytes from lipid-mediated inflammation and cytotoxicity induced by the epicardial adipose tissue of diabetic patients. Biomedicine and Pharmacotherapy. 2024;175. [CrossRef]
- van Woerden G, Gorter TM, Westenbrink BD, Willems TP, van Veldhuisen DJ, Rienstra M. Epicardial fat in heart failure patients with mid-range and preserved ejection fraction. Eur J Heart Fail. 2018;20(11):1559-1566. [CrossRef]
- van Woerden G, van Veldhuisen DJ, Westenbrink BD, de Boer RA, Rienstra M, Gorter TM. Connecting epicardial adipose tissue and heart failure with preserved ejection fraction: mechanisms, management and modern perspectives. Eur J Heart Fail. 2022;24(12):2238-2250. [CrossRef]
Figure 1.
Scatter plots of inflammatory markers. Inflammatory parameters were determined using a Luminex system with xMAP® technology, as described in the Methods section. HC: healthy controls; PGC: T2D patients with poor glycemic control; GGC: T2D patients with good glycemic control. The horizontal bar indicates statistically significant differences. Data are expressed as mean ± SD.
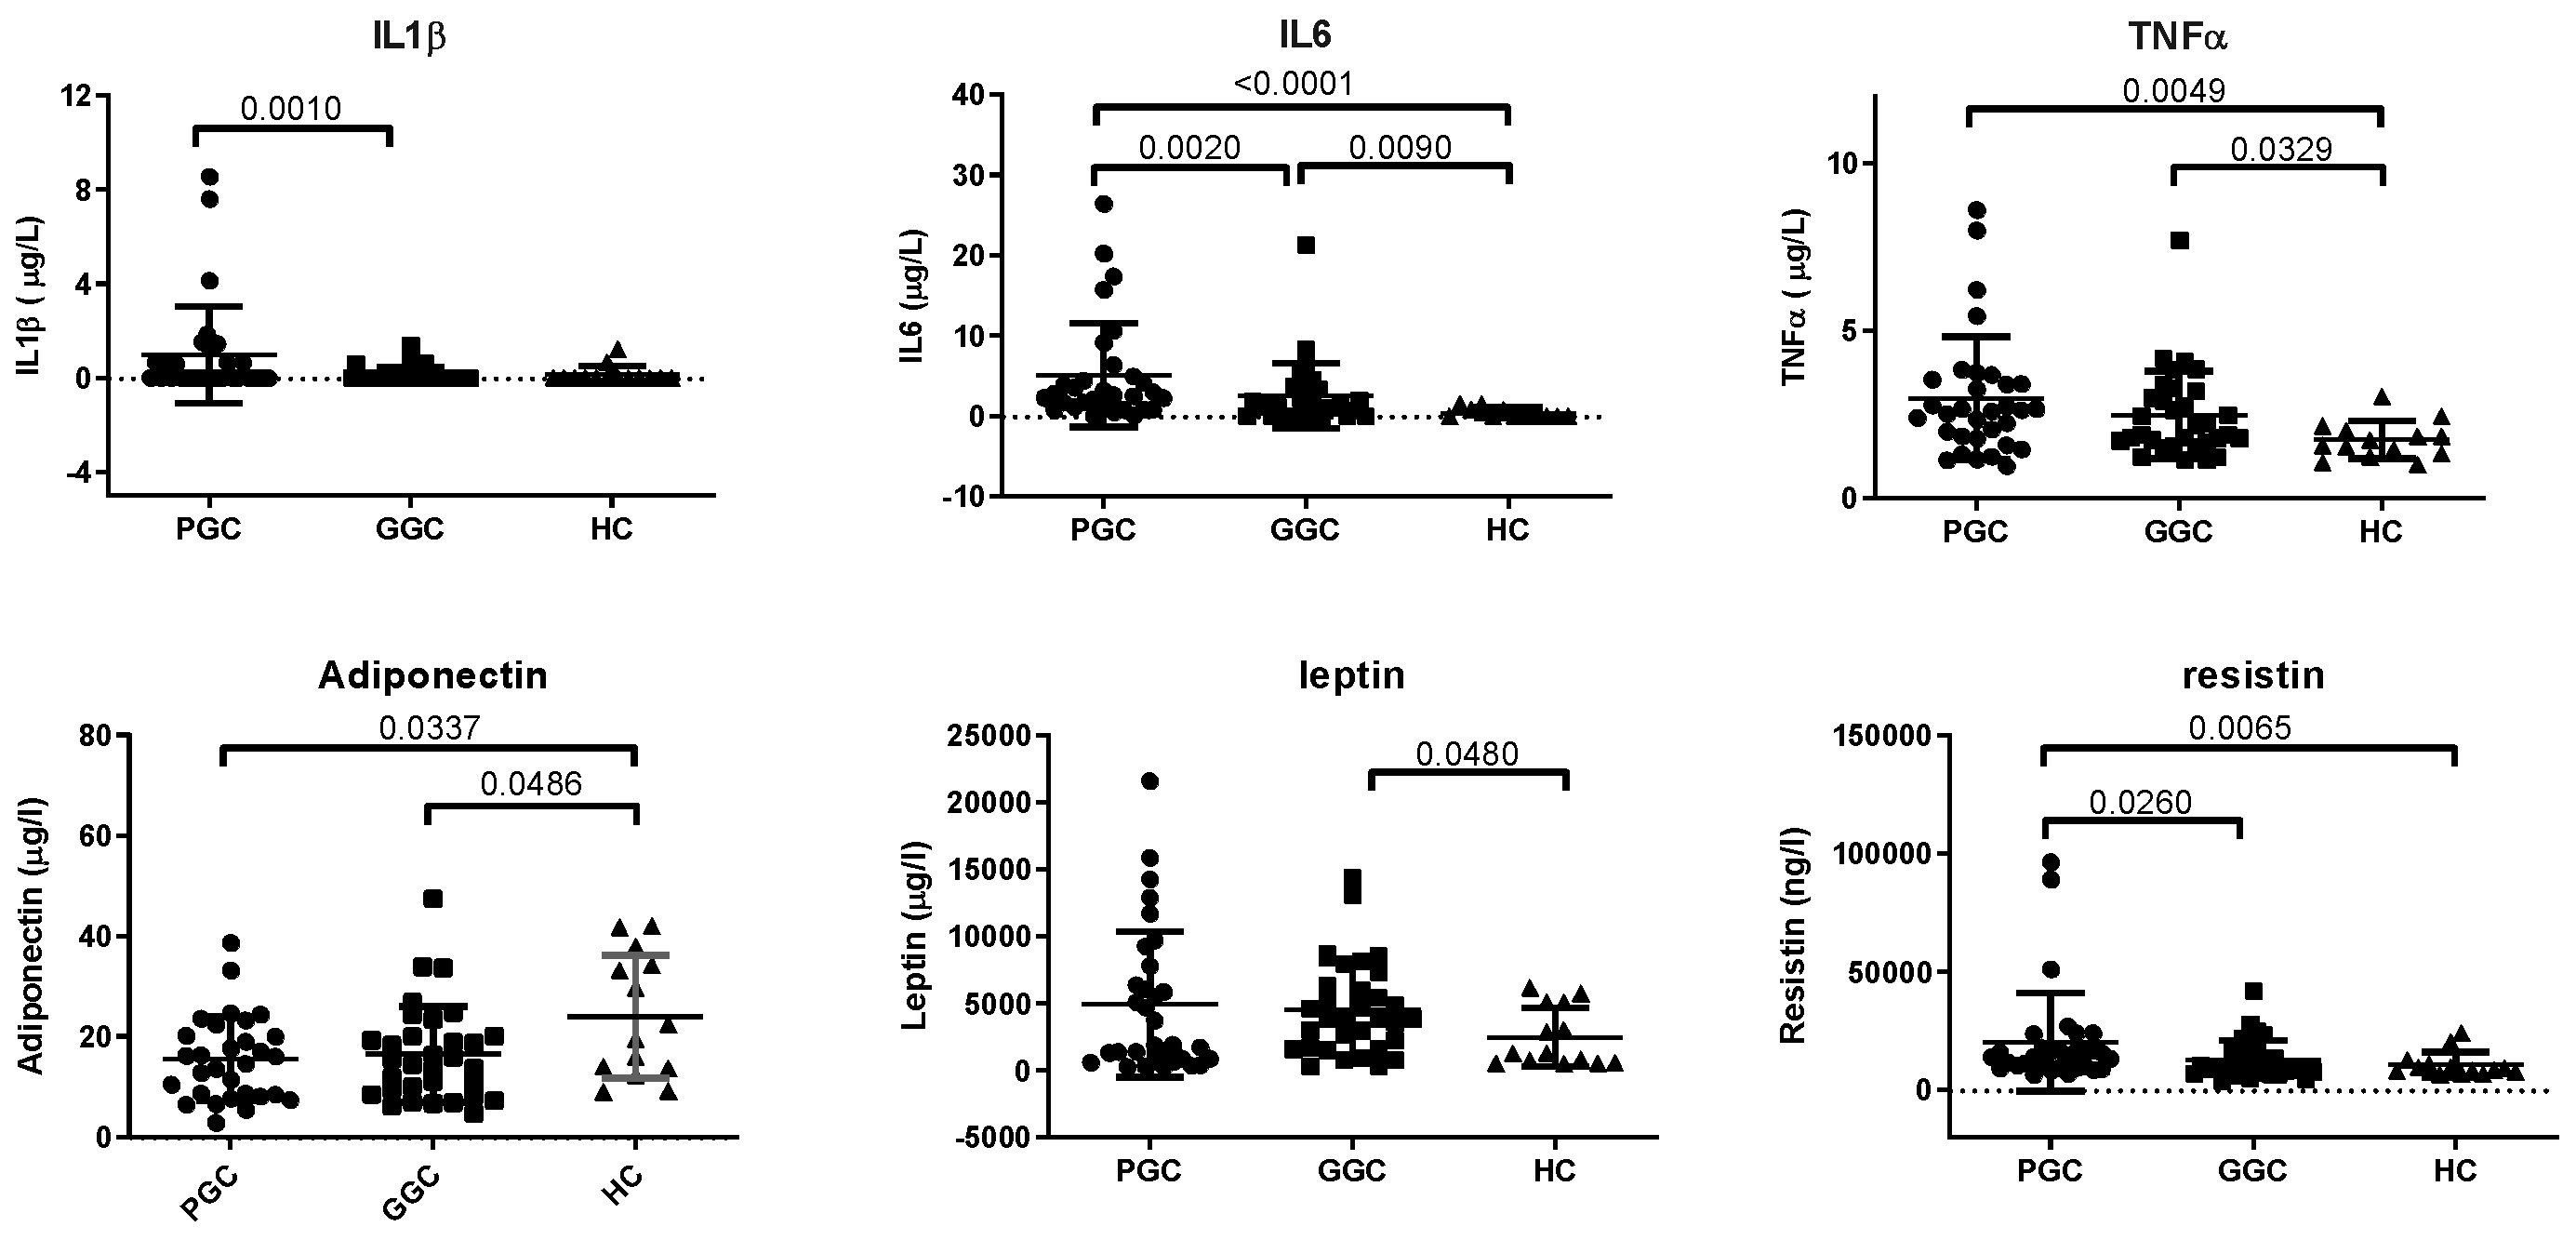
Figure 2.
Scatter plots of HF-related markers. a) GDF15, b) Galectin-3, and c) sST2. Markers were determined by commercial methods in autoanalyzer, as described in the Methods section. HC: healthy controls; PGC: T2D patients with poor glycemic control; GGC: T2D patients with good glycemic control. The horizontal bar indicates statistically significant differences. Data are expressed as mean ± SD.
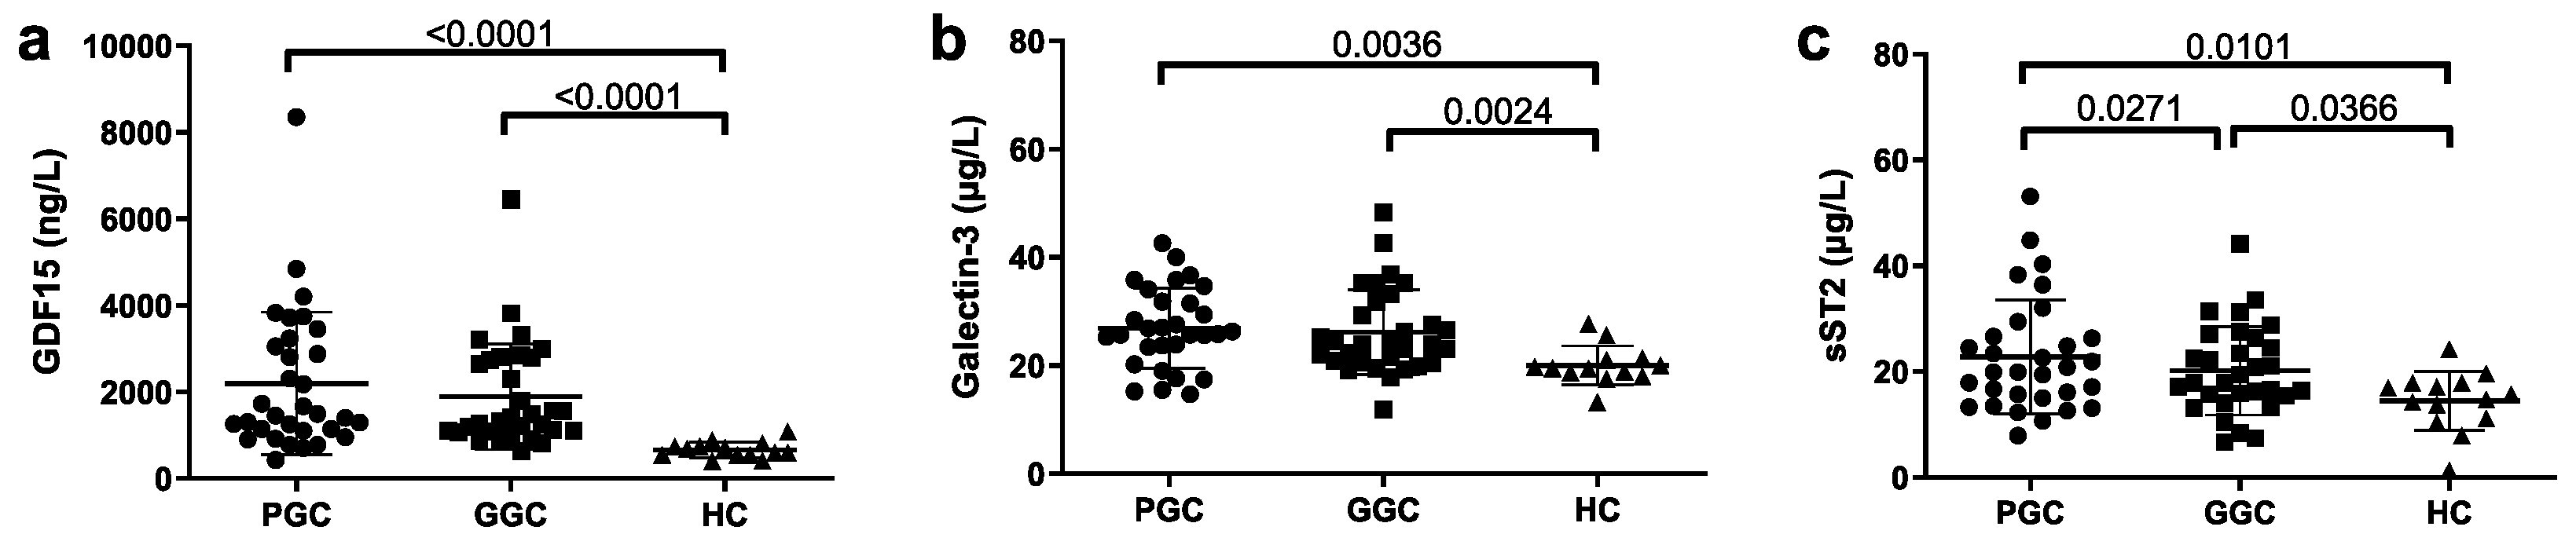
Table 1.
Statistically significant correlations of inflammation markers with clinical and laboratory parameters using the Spearman’s rank correlation coefficient.
Table 1.
Statistically significant correlations of inflammation markers with clinical and laboratory parameters using the Spearman’s rank correlation coefficient.
| Spearman’s rank correlation coefficient test | |||
| r | p | ||
| IL1β | HbA1c | 0.295 | 0.006 |
| hsCRP | 0.259 | 0.013 | |
| AST | 0.272 | 0.010 | |
| LVEF | -0.293 | 0.029 | |
| Tg | -0.250 | 0.016 | |
| IL6 | BMI | 0.247 | 0.015 |
| AW | 0.252 | 0.016 | |
| HbA1c | 0.339 | 0.002 | |
| hsCRP | 0.563 | < 0.001 | |
| AST | 0.304 | 0.004 | |
| HDL-c | - 0.235 | 0.022 | |
| TNFα | AW | 0.208 | 0.038 |
| HbA1c | 0.268 | 0.012 | |
| hsCRP | 0.342 | 0.002 | |
| AST | 0.261 | 0.013 | |
| ALT | 0.232 | 0.023 | |
| ALP | 0.258 | 0.013 | |
| iEATv | 0.242 | 0.021 | |
| LVEF | -0.263 | 0.025 | |
| HDL-c | -0.373 | <0.001 | |
| Adiponectin | Age | 0.192 | 0.046 |
| ALT | -0.439 | <0.001 | |
| GGT | -0.333 | 0.002 | |
| Tg | -0.259 | 0.013 | |
| HDL-c | 0.328 | 0.002 | |
| VLDL-c | -0.241 | 0.020 | |
| Leptin | Weight | 0.468 | <0.001 |
| BMI | 0.653 | < 0.001 | |
| AW | 0.553 | < 0.001 | |
| ALT | 0.243 | 0.018 | |
| hsCRP | 0.310 | 0.004 | |
| Resistin | BMI | 0.258 | 0.012 |
| AW | 0.251 | 0.016 | |
| HbA1c | 0.268 | 0.012 | |
| hsCRP | 0.298 | 0.005 | |
Table 3.
Multivariable lineal regression analysis (stepwise) for GDF15, Galectin-3 and sST2 with clinical and laboratory parameters.
Table 3.
Multivariable lineal regression analysis (stepwise) for GDF15, Galectin-3 and sST2 with clinical and laboratory parameters.
| Multivariable lineal regression analysis (stepwise) | ||||||||||
| Model | Unstandardized Coefficients | Standardized Coefficients | t | p | 95.0% Confidence Interval for B | Collinearity Statistics | ||||
| B | Std. Error | Beta | Lower Bound | Upper Bound | Tolerance | VIF | ||||
| GDF15 | ||||||||||
| 1 | (Constant) | -2623.37 | 1039.69 | -2.52 | 0.014 | -4701.70 | -545.05 | |||
| Age | 80.60 | 18.40 | 0.48 | 4.38 | 0.001 | 43.82 | 117.38 | 1.00 | 1.00 | |
| 2 | (Constant) | -2520.87 | 1007.47 | -2.50 | 0,015 | -4535.44 | -506.31 | 0.79 | 1.25 | |
| Age | 60.03 | 19.98 | 0.36 | 3 | 0,004 | 20.08 | 99.98 | 0.79 | 1.25 | |
| iEAT | 19.41 | 8.54 | 0.27 | 2.27 | 0,027 | 2.32 | 36.51 | |||
| Galectin-3 | ||||||||||
| 1 | (Constant) | 20.57 | 2.36 | 8.70 | 0,001 | 15.85 | 25.30 | |||
| HbA1c | 0.64 | 0.26 | 0.297 | 2.42 | 0.01 | 0.11 | 1.17 | 1.00 | 1.00 | |
| 2 | (Constant) | 20.90 | 2.25 | 9,.7 | 0.001 | 16.40 | 25.41 | |||
| HbA1c | 0.32 | 0.28 | 0.14 | 1,.5 | 0.25 | -0.23 | 0.88 | 0.81 | 1.22 | |
| hsCRP | 0.44 | 0.16 | 0.34 | 2.69 | 0.009 | 0.11 | 0.77 | 0.81 | 1.22 | |
| sST2 | ||||||||||
| 1 | (Constant) | 12.91 | 3.61 | 3.57 | <0.01 | 5.67 | 20.14 | |||
| HbA1c | 0.90 | 0.40 | 0.28 | 2.21 | 0.031 | 0.08 | 1.72 | 1.00 | 1.00 | |
| 2 | (Constant) | -7.06 | 9.27 | -0.76 | 0.44 | -25.64 | 11.50 | |||
| HbA1c | 0.74 | 0.40 | 0.23 | 1.84 | 0.07 | -0.063 | 1.54 | 0.96 | 1.03 | |
| AW | 0.19 | 0.08 | 0.28 | 2.32 | 0.024 | 0.027 | 0.37 | 0.96 | 1.03 | |
| 3 | (Constant) | -5.27 | 8.99 | -0.58 | 0.56 | -23.29 | 12.74 | |||
| HbA1c | 0.56 | 0.39 | 0.17 | 1.42 | 0.16 | -0.22 | 1.35 | 0.92 | 1.07 | |
| AW | 0.12 | 0.08 | 0.18 | 1.43 | 0.15 | -0.05 | 0.30 | 0.84 | 1.18 | |
| iEAT | 0.14 | 0.06 | 0.29 | 2.24 | 0.02 | 0.01 | 0.26 | 0.81 | 1.22 | |
| Non-significant variables from the model were: age, sex, AW, BMI, Hba1c and NT-ProBNP | ||||||||||
Disclaimer/Publisher’s Note: The statements, opinions and data contained in all publications are solely those of the individual author(s) and contributor(s) and not of MDPI and/or the editor(s). MDPI and/or the editor(s) disclaim responsibility for any injury to people or property resulting from any ideas, methods, instructions or products referred to in the content. |
© 2025 by the authors. Licensee MDPI, Basel, Switzerland. This article is an open access article distributed under the terms and conditions of the Creative Commons Attribution (CC BY) license (http://creativecommons.org/licenses/by/4.0/).
Copyright: This open access article is published under a Creative Commons CC BY 4.0 license, which permit the free download, distribution, and reuse, provided that the author and preprint are cited in any reuse.


