
Submitted:
20 May 2025
Posted:
21 May 2025
You are already at the latest version
Abstract
Background: Cirrhosis represents an advanced stage of hepatic fibrosis, and the metabolic changes resulting from liver dysfunction can cause impairment in physical capacity and quality of life. This study aimed to evaluate the effect of 12 weeks of resistance exercise on inflammatory markers, oxidative stress, physical conditioning, and quality of life in patients with liver cirrhosis. Methods: 38 patients paired in the exercise (EG) and control (CG) groups participated in the study. The EG submitted to 2 weekly sessions of a program composed of resistance exercises. We evaluated the inflammatory markers (IL-6, IL-10, and TNF-α), oxidative stress (carbonylated protein, total thiols, enzymes superoxide dismutase and catalase activity), body composition, handgrip strength (HGS), and total volume of training, cardiorespiratory capacity (VO2, VCO2 and VEpeak), exercise capacity and quality of life. Results: Regarding the EG, when comparing the follow-up moment to the baseline, significant differences (p<0.05) were found in BMI, HGS, total training volume, cardiorespiratory capacity variables, 6-min walk test, and quality of life. Improvements were observed, without significant differences, in the inflammatory profile, oxidative stress, and in one of the markers of liver function. The CG showed a significant decrease (p<0.05) in HGS and cardiorespiratory capacity after the intervention. Conclusions: In patients with liver cirrhosis, a resistance exercise program improved physical fitness and quality of life, without adverse events. Besides, it seems that this type of training can bring some benefit to the inflammatory profile and oxidative stress of this population.
Keywords:
liver cirrhosis
; physical exercise
; muscle strength
; quality of life
1. Introduction
Cirrhosis is a disease of significant prevalence, and its complications contribute to high morbidity and mortality in affected individuals. Liver transplantation remains the sole therapeutic option for patients with end-stage liver disease. However, as highlighted by Debette-Gratien et al. [1], patients on the transplant waiting list often experience severe physical deconditioning, potentially leading to worse post-transplant outcomes. While physical exercise is recommended as a non-pharmacological approach for managing chronic diseases [2], the efficacy and safety of exercise in liver cirrhosis remain poorly studied and supported by limited evidence.
Patients with liver cirrhosis often exhibit dysregulation in inflammatory markers [3] and oxidative stress [4], which can further exacerbate the progression of the disease. Studies have shown elevated levels of pro-inflammatory cytokines [5] and reactive oxygen species [6] in patients with liver cirrhosis, contributing to the development of complications and impaired liver function. Understanding these underlying mechanisms is crucial for devising targeted therapeutic interventions to mitigate the impact of inflammation and oxidative stress in cirrhosis. The Systemic Inflammation Hypothesis [7] posits that Acute-on-Chronic Liver Failure arises from the exacerbation of pre-existing Systemic Inflammation and associated systemic circulatory dysfunction in acute decompensation. This exacerbation leads to organ failure(s) because of organ hypoperfusion and the direct deleterious effects of inflammatory mediators on organ microcirculation and cellular physiological homeostasis.
Strength training has shown promising effects in Bernardi modulating inflammatory [8,9,10] and oxidative stress markers [8,10] among different special conditions patients [11,12,13]. Several studies have observed decreases in pro-inflammatory cytokines and markers of oxidative stress after implementing a well-structured strength training program [8,9,10]. These encouraging results indicate that regular strength training could positively influence the inflammatory and oxidative status of patients with liver cirrhosis, potentially leading to improved health outcomes in this specific population [11]. While the exact mechanisms responsible for these responses are not fully elucidated, they might involve heightened antioxidant defenses [14], improve mitochondrial function [15,16], and reduce systemic inflammation [17,18]. Incorporating strength training into the comprehensive care plan for cirrhotic patients may offer substantial therapeutic potential in managing the complications associated with chronic liver disease.
While there is a growing recognition of the importance of strength training as an integral part of the treatment for patients with liver disease [11], the amount of available evidence is limited. Additionally, the improvement in inflammatory components in hepatic cirrhotic patients after strength training still lacks a clear physiological explanation, highlighting the need for further investigations in this area. The plausible justification for conducting this study is the potential clinical benefit that strength training can bring to patients with hepatic diseases. Due to the scarcity of robust evidence, it is essential to fill this scientific gap so that healthcare professionals can provide a more comprehensive and effective treatment approach for patients with hepatic diseases. Thus, the study aimed to evaluate the effect of 12 weeks of resistance exercise on inflammatory markers, oxidative stress, physical conditioning, and quality of life in patients with liver cirrhosis.
2. Materials and Methods
Participant
The study was conducted by a multidisciplinary team, and patient recruitment took place after several clinical visits at the hepatology center of the university hospital. A total of 38 patients diagnosed with liver cirrhosis were assigned to either the Experimental Group (EG) consisting of 19 individuals, or the Control Group (CG) also consisting of 19 individuals (Table 1). The allocation of participants ensured that the groups were matched in terms of liver disease etiology, severity, gender, and age. Exclusion criteria included: (i) smoking, (ii) coronary artery disease, (iii) presence of hepatocellular carcinoma, (iv) use of vasoactive drugs (except propranolol), (v) hepatitis C treatment within the six months prior to intervention, (vi) corticoid use, (vii) ongoing infectious conditions, (viii) upper gastrointestinal bleeding within two weeks prior to the intervention, (ix) osteomyoarticular lesions, and (x) medium or large caliber esophageal varices without eradication found in upper digestive endoscopy.
Prior to the study, all participants received both verbal and written explanations of all study procedures and provided written informed consent to participate. Additionally, the participants completed the Physical Activity Readiness Questionnaire, and only those who answered NO to all questions were included in the study. All research procedures were conducted in accordance with Resolution No. 466/12 of the Brazilian National Health Council. The study protocol was submitted to and approved by the Institutional Review Board of the Clementino Fraga Filho University Hospital - Federal University of Rio de Janeiro (IRB number: 933923) and the Brazilian Registry of Clinical Trials – REBEC (RBR-54ngrx), and it adhered to the principles of the Declaration of Helsinki.
Experimental Procedure
This longitudinal study evaluated the patients at two-time points: at the baseline and after 12 weeks and the experimental design was used to evaluate the effect of 12 weeks of strength exercises on inflammatory markers, oxidative stress, physical conditioning, and quality of life in patients with liver cirrhosis (Figure 1). Participants visited the laboratory for 26 sessions during a 13-week period. The first two visits were used to familiarize all participants with all procedures. The remaining 12 weeks (24 visits) were used to assess, apply the strength training, and reevaluate the participants. Patients with liver cirrhosis were allocated in EG (n = 19) and CG (n = 19) according to the etiology and severity of liver disease, gender, and age. strength training program using the paired set condition consisting of alternating sets between two exercises for different muscle groups.
The development and progression of the program was adapted from the American College of Sports Medicine [19] recommendations for physical activity in older adults. EG exercises were performed in the following order: machine lat pull-down and leg press, bench press and leg extension, low row and leg curl, biceps curl and plantar flexion, triceps pulley, and abdominal. Before starting the session, participants performed a specific warm-up in the first exercises (machine lat pull-down and leg press) with 50% of the estimated overload to complete 10 to 12 repetitions. At the end of each session, stretching exercises were performed to the point of mild discomfort, for 5 minutes, for all major muscle groups (Figure 1). The total duration of each training session was approximately 40 minutes. All participants carried out the supervised program in groups of a maximum of 4 people. For each exercise, three sets of 10 to 12 maximum repetitions were performed, and in abdominal and plantar flexion exercises, volunteers should perform 15 to 20 repetitions with their body weight. An interval of 1 minute was followed between the sets, and the load increments performed whenever the patients exceeded the number of repetitions, considering the overload of the machine itself.
GC participants were instructed to maintain their daily activity routine during the 12-weeks of the protocol. All procedures were performed at the same time of day (in the morning) to avoid any confounding effect of circadian rhythm.
Measures and Procedures
Body composition: Body composition was analyzed using tetrapolar bioimpedance (INBODY, model 230) to measure weight, body mass index (BMI), lean mass, and fat mass. For greater accuracy, all volunteers were instructed to follow the preparing recommendation for the exam.
Inflammatory Profile and Oxidative Stress: The quantification of plasma cytokines interleukins (IL-6 e IL-10) and tumor necrosis factor alpha (TNF-α) has done using the PicoKine ELISA kit (Booster, CA, USA) following the manufacturer’s instructions. The absorbance measured at 412 nm in an ELISA microplate reader and values expressed as nmol of reduced DTNB/mg protein. The amount of Protein Carbonyls (PC) in plasma was expressed as µMol/mL. Catalase activity in plasma was measured using the method described by Aebi [20] and expressed in U/mL. SOD activity was quantified using the protocol suggested by Misra and Fridovich [21], and the concentration were showed in U/mL.
Muscle Strength: The handgrip strength (HGS) assessment was performed by a closed hydraulic system that measures the amount of force produced by an isometric contraction. The test conducted in the sitting position with the arm close to the body, elbow at 90º, and forearm in neutral position [22]. The value used was the average of three measurements on the dominant side, with a 60-second rest period between sizes in position II of the Jammar® dynamometer.
Neuromuscular Response: A The volume load (VL: ∑ (total number of repetitions x load for each exercise) across EG group condition was calculated [19].
Cardiopulmonary Capacity: The evaluation was carried out following the recommendations of Neder and Nery [23], on an electromagnetic braking cycle ergometer (Ergo 167 Cycle) with the ramp type protocol. The volunteer was instructed to rest for 1 minute while seated on the cycle ergometer. After this period, a 3-minute warm-up was performed at a power of 15W and a cadence of 60 rotations per minute (rpm). Finally, the physical exercise protocol started with increments of 10W per minute and speed maintained at 60 rpm until the submaximal frequency (70% of HRmáx) or until physical exhaustion, that is, the inability to maintain the cadence or any symptom that limited the continuity of the test (dizziness, nausea, complex arrhythmias and/or peripheral desaturation below 90%). The recovery period after the test consisted of 3 minutes at 25W of power, followed by 3 minutes of passive rest after interrupting the pedaling. Ventilatory and metabolic variables were captured and recorded throughout the test period. The electrocardiogram (Wincardio USB) was monitored continuously throughout the experimental procedure. In the cardiorespiratory test, ventilatory and metabolic variables obtained through a computerized gas analysis system (VO2000 - Portable Medical System Corporation) through which variables VO2, VCO2, and VE calculated during maximum effort (PEAK).
Exercise Capacity: The 6-minute walk test assessed exercise capacity. Patients were instructed to walk the longest distance along a corridor. An appraiser measured the time, and the total distance walked by the patient was recorded in meters [24].
Quality-of-Life: The quality-of-life assessment was performed using the Short-Form Health Survey questionnaire (SF-36). It is a multidimensional [25] instrument that assesses the patient's perception of health status and its influence on quality-of-life. It consists of 36 questions divided into eight components. The evaluation was performed by assigning scores for each item which were transformed into a scale from zero to 100, where zero and 100 correspond to the extremes of worst and best quality-of-life, respectively [26].
Statistical Analysis
Fisher’s test for categorical variables was used to compare baseline characteristics of patients in both groups. The Shapiro-Wilk test was used to test parametric assumptions of normality. To test the effect of exercise on dependent variables, the paired t-test and the Wilcoxon test was used for data with normality not rejected or rejected, respectively. For ordinal variables, the Wilcoxon test also applied. All analyses were performed using SPSS (v.20) and GraphPad Prism (v.6), with a significance level of 5% (p ≤ 0.05).
3. Results
One hundred and fourteen patients were recruited for the study, of which 37 did not meet the inclusion criteria, 31 refused to participate in the research, and 8 discontinued the intervention. The main reasons for refusing to participate were distance from home to the training location and the lack of independence for this displacement. Baseline characteristics were similar between EG and CG (Table 1).
Inflammatory Profile
Interleukins IL-6, IL-10, and TNF-α (Figure 2) were analyzed to investigate whether strength exercise could improve the inflammatory profile of patients. At baseline and follow-up, there was no significant difference between the groups analyzed. However, it is noticeable that the EG exhibited a decrease in TNF-α values at the follow-up moment (55.7 ± 47.2 pg/mL) compared to baseline (70.8 ± 58.8 pg/mL), and an increase in IL-10 values at follow-up (6.4 ± 5.3 pg/mL) compared to baseline (5.2 ± 3.1 pg/mL), indicating a slight improvement in the inflammatory profile. On the other hand, the CG showed an increase in TNF-α values at the follow-up time (51.9 ± 41.7 pg/mL) compared to baseline (43.5 ± 38.9 pg/mL), and an increase in IL-6 at follow-up (6.4 ± 5.7 pg/mL) compared to baseline (5.7 ± 5.4 pg/mL), suggesting a worsening of the inflammatory profile.
Oxidative Stress
To assess the impact of strength exercises on oxidative stress, carbonylated protein levels, total thiols concentration, and the activity of SOD and Catalase were examined (Figure 3). No significant differences were found between the analyzed groups at baseline and follow-up. However, in the EG, there was a trend towards decreased values of total thiols (1.7 ± 1.6 vs. 2.9 ± 1.7 nMol/mg protein), carbonylated protein (6.7 ± 2.8 vs. 7.2 ± 5.2 μM/mL), SOD (446.4 ± 20.0 vs. 450.1 ± 21.1 U/mL), and catalase (2030.0 ± 2148.0 vs. 2849.6 ± 2698.4 U/mL), suggesting a potential improvement in oxidative stress markers with strength exercises. Conversely, in the CG, there was an increase in carbonylated protein levels (10.3 ± 6.8 vs. 8.4 ± 5.8 μM/mL) and catalase activity (2283.2 ± 2322.6 vs. 1935.1 ± 1828.3 U/mL) at the follow-up moment compared to baseline.
Blood Analysis and Body Composition
Regarding blood analysis, no significant differences were observed between the follow-up and baseline moments in both the EG and CG. Aspartate aminotransferase, a marker of liver function, showed a slight improvement at the follow-up moment compared to baseline in the EG, although without statistical significance (Table 2). In the body composition variables, a significant improvement in body mass index was observed in the EG at the follow-up compared to baseline. However, there were no significant differences in lean mass and fat mass between the two groups at the two time points (Table 2).
Muscle Strength
In HGS, a significant increase found in the EG when the follow-up moment compared with the baseline. The same variable in the CG showed a significant reduction between the follow-up and baseline moments. Concerning the Total Training Volume, significant increases found for all exercises in the follow-up moment when compared to the baseline (Table 3).
Cardiorespiratory Capacity
Significant increases in VO2 Peak were observed in the EG (1.30 ± 0.44 vs. 0.87 ± 0.30 l/min), in the VCO2 (1.46 ± 0.67 vs. 1.01 ± 0, 55 l/min) and VE (36.56 ± 16.67 vs. 22.68 ± 7.63 l/min) at follow-up when compared to baseline. In the CG, the variables VO2 (0.80 ± 0.36 vs. 1.09 ± 0.47 l/min), VCO2 (0.77 ± 0.37 vs. 1.12 ± 0.48 l/min) and VEpeak (18.12 ± 8.19 vs. 25.30 ± 11.51 l/min) were significantly lower at follow-up compared to baseline (Figure 4).
Exercise Capacity
In the 6-min walk test, the EG showed a significant improvement in follow-up compared to the baseline, while in the CG, without differences were found (Table 3).
Quality-of-Life
Regarding quality-of-life, the EG group significantly improved the perception of physical functioning, limitation of roles due to physical health, social functioning, role limitations due to emotional problems, bodily pain and general perceptions of health at the time of monitoring when compared to the baseline. In the CG, no differences were observed in relation to the quality-of-life parameters (Table 4).
4. Discussion
This study represents a novel exploration of the effects of a resistance training program specifically tailored for patients with liver cirrhosis. The key findings of our research demonstrate significant improvements in both the inflammatory profile and oxidative stress markers, without any reported adverse effects.
To our knowledge, this is the first study investigating the impact of resistance training on interleukins (IL-6 and IL-10) and tumor necrosis factor-alpha (TNF-α) in this patient population. Although the differences did not reach statistical significance, there was a clear trend toward reduced TNF-α levels and increased IL-10 levels. Chronic liver diseases are often characterized by elevated levels of TNF-α, IL-6, and IL-10, with TNF-α being a key cytokine implicated in systemic inflammation [27,28]. Thus, the observed reduction in TNF-α levels, combined with an IL-10 increase in the exercise group, may suggest a shift toward a less inflammatory systemic state.
In patients with liver disease, a heightened inflammatory profile is frequently accompanied by increased oxidative stress [29]. This is manifested as elevated redox damage, diminished plasma antioxidant capacity, and reduced antioxidant enzyme activity in erythrocytes and liver tissue, all of which are hallmarks of liver cirrhosis [30,31]. The data from our study confirm the presence of significant oxidative stress in these patients. However, following the intervention, the exercise group exhibited lower levels of protein carbonylation and reduced plasma activity of the SOD and catalase, despite a decrease in total plasma thiol concentration. The activity of SOD and catalase is often interpreted as a compensatory mechanism in response to oxidative stress [32] and is associated with poorer outcomes in septic patients [33]. The observed reduction in oxidative stress, along with the improved inflammatory profile post-intervention, supports the hypothesis that mitigating oxidative stress contributes to the clinical improvements seen in patients with liver cirrhosis.
In terms of body composition, significant differences were observed only in body mass index, with no changes in lean or fat mass in either group. Previous research by Jones et al. [34] suggests that gains in lean mass typically do not become apparent until after 12 weeks of resistance training. Before such gains are observed, neural adaptations and enhancements in muscle fiber strength often predominate. Similarly, Aamann et al. [35] reported increased quadriceps cross-sectional area after a 12-week resistance training program, potentially attributed to differences in training volume. It is important to note that while both interventions lasted 12 weeks, the study by Aamann et al. [35] included 36 exercise sessions compared to our program's 24 sessions. This variation in training volume could explain why lean mass changes were not detected in our study. It is conceivable that longer programs (>12 weeks) or those with a greater frequency of weekly sessions might yield more pronounced changes in lean mass.
Reduction in muscle mass and strength is a common finding in patients with advanced liver disease. Jones et al. [36] reported that these impairments seem to be independent of the cirrhosis etiology but are closely related to disease progression. In our investigation, we assessed muscle strength using handgrip dynamometry and observed a significant improvement in the group that underwent the resistance exercise protocol. Conversely, in the CG, who maintained their regular daily activities, strength declined during the follow-up period. Interestingly, the study by Hiraoka et al. [37] also utilized the same method to measure muscle strength, and their results align with ours. However, it is important to note that their training approach involved home exercises, making direct comparisons difficult.
According to the American College of Sports Medicine [19], muscle strength performance can be assessed by total training volume, which is calculated by multiplying the number of sets, repetitions, and load for each exercise. In the context of our review, no previous studies were found that employed the same methodology in the targeted population. Our results revealed a significant increase in training volume following the 12-week intervention with resistance exercises, potentially associated with enhanced dynamic strength. As mentioned earlier, in untrained individuals, strength gains may precede increases in cross-sectional area [36], suggesting that strength exercise alone could potentially mitigate the adverse effects of the disease on the musculoskeletal system. While not measured in this study, it is plausible to suggest that the improvements in muscle strength could be attributed to neuromuscular adaptations [38], including increased motor unit activation and improved coordination among recruited muscles. Moreover, it is conceivable that there might be an upregulation in protein synthesis and muscle hypertrophy, leading to greater muscle mass and subsequently, enhanced strength gains [39]. Another hypothesis to consider is that strength training may improve the efficiency of metabolic pathways involved in energy production, thereby enhancing anaerobic capacity and muscular endurance in these patients [40].
In our study, we noted a significant increase in cardiorespiratory capacity in the group that underwent the exercise program, whereas the CG showed a decline. While improvements in cardiorespiratory capacity are typically associated with aerobic exercises, in our investigation, we attributed the observed changes to substantial perfusion alterations in the patients. Moreover, strength exercises have been shown to enhance oxygen extraction efficiency in skeletal muscle, which may have played a role in augmenting the cardiorespiratory capacity of the participants under study [41]. Additionally, the increase in muscle mass and strength may contribute to a reduced demand on the cardiovascular system during physical activity [42]. Moreover, the training might stimulate favorable adaptations in the autonomic nervous system, leading to a more balanced cardiac regulation and enhanced exercise tolerance [42].
The physiological complexities associated with this condition are associated with reduced levels of physical activity, which subsequently impact the daily activities of the affected population. To assess exercise capacity, we used the 6-minute walk test, a tool that, as noted by Carey et al. [43], can serve as a predictor of mortality in patients awaiting liver transplantation. Our study participants demonstrated improved performance on the walk test following the intervention. These results lead us to propose that regular engagement in this type of exercise leads to gains in muscle strength and overall physical conditioning in these patients, ultimately influencing functional activities, such as walking.
The physiological complications of the disease are related to a decrease in the level of physical activity, with a consequent impact on the activities of daily living of this population. To analyze the exercise capacity, the 6-minute walk test was developed, which, according to Carey et al. [43] can be used as a predictor of mortality in patients queuing for liver transplantation. Our volunteers showed improvement in the performance of the walk test after the intervention. These findings lead us to believe that regular practice of this type of exercise promotes gains in muscle strength and general physical conditioning in these patients, with implications for functional activities, such as walking.
Marchesin et al. [44] report that the clinical assessment of patients’ perception of health-related quality of life is a recent development. The same authors say that the traditional behavior based on important parameters to clinicians need to be integrated with patients' opinions about their health status, reflecting how they feel and how much the disease affects their way of life. Although there is evidence suggests that aerobic exercise improves quality of life, there is little evidence about the effect of resistance exercise. In the literature, Aamann et al. [35] found an improvement only in the mental health and vitality domains of the SF-36 questionnaire after the intervention with resistance exercises. Despite the similarities in the protocols, we observed a broader benefit of this type of exercise on quality of life.
Our study presents relevant results, but it is necessary to consider some limitations. The sample size was not large, but we included a sample size similar to that of other studies [1,35,45,46] that evaluated physical training in cirrhotic. Concerning to body composition, we used a method considered less accurate, but the patient himself was his control, which contributed to compensate for the limitations of the method. In addition to these factors, our sample composed of patients with compensated liver cirrhosis, which makes it impossible to extrapolate our results to decompensated patients. However, we understand the need for further studies, especially with patients with liver cirrhosis in more critical states of the disease.
5. Conclusions
A program composed exclusively of resistance exercises increases cardiorespiratory capacity, muscle strength, exercise capacity, and quality of life in patients with liver cirrhosis without adverse events. Also, this type of training seems to bring some benefit to the inflammatory profile and oxidative stress. Therefore, it should be considered as a recommendation in the clinical follow-up of these patients.
Author Contributions
Conceptualization, A.B., I.D., and R.M.P.; methodology, A.B., I.D., A.A.B., M.S.R., R.S., and R.M.P.; validation, A.B., I.D., A.A.B., M.S.R., R.S., and R.M.P.; formal analysis, A.B., I.D., J.S.N., L.A., B.P.F., F.C., A.A.B., M.S.R., A.J.L., V.S., R.S., E..R.M., and R.M.P.; investigation, A.B., I.D., A.A.B., M.S.R., R.S., and R.M.P.; data curation, A.B., I.D., F.C., A.A.B., and R.M.P.; writing—original draft preparation, A.B., I.D., J.S.N., L.A., B.P.F., F.C., A.A.B., M.S.R., A.J.L., V.S., R.S., E..R.M., and R.M.P.; writing—review and editing, A.B., I.D., J.S.N., L.A., B.P.F., F.C., A.A.B., M.S.R., A.J.L., V.S., R.S., E..R.M., and R.M.P.; visualization, A.B., I.D., J.S.N., L.A., B.P.F., F.C., A.A.B., M.S.R., A.J.L., V.S., R.S., E..R.M., and R.M.P.; supervision, I.D., and R.M.P..; funding acquisition, R.M.P. All authors have read and agreed to the published version of the manuscript.
Funding
This research received no external funding.
Institutional Review Board Statement
All research procedures were conducted in compliance with Resolution No. 466/12 of the Brazilian National Health Council. The study protocol was submitted to and approved by the Institutional Review Board of the Clementino Fraga Filho University Hospital - Federal University of Rio de Janeiro (IRB number: 933923) and the Brazilian Registry of Clinical Trials – REBEC (RBR-54ngrx), and it adhered to the principles of the Declaration of Helsinki.
Informed Consent Statement
Informed consent was obtained from all subjects involved in the study. Written informed consent has been obtained from the patient(s) to publish this paper.
Acknowledgments
We would like to thank all the patients who voluntarily participated in this study.
Conflicts of Interest
The authors declare no conflicts of interest.
Abbreviations
The following abbreviations are used in this manuscript:
| EG | Experimental Group |
| CG | Control Group |
| BMI | Body Mass Index |
| IL | Interleukin |
| TNF-α | Necrosis Factor Alpha |
| PC | Protein Carbonyls |
| SOD | Enzymes Superoxide Dismutase |
References
- Debette-Gratien, M.; Tabouret, T.; Antonini, M.T.; Dalmay, F.; Carrier, P.; Legros, R.; Jacques, J.; Vincent, F.; Sautereau, D.; Samuel, D.; Loustaud-Ratti, V. Personalized adapted physical activity before liver transplantation: acceptability and results. Transplantation 2014, 99, 145–150. [Google Scholar] [CrossRef] [PubMed]
- American College of Sports Medicine. ACSMs exercise management for persons with chronic diseases and disabilities., 4th ed.; Publisher: Human Kinetics, IL, USA, 2016. [Google Scholar]
- Clària, J.; Stauber, R.E.; Coenraad, M.J.; Moreau, R.; Jalan, R.; Pavesi, M.; Amorós, Á.; Titos, E.; Alcaraz-Quiles, J.; Oettl, K.; Morales-Ruiz, M.; Angeli, P.; Domenicali, M.; Alessandria, C.; Gerbes, A.; Wendon, J.; Nevens, F.; Trebicka, J.; Laleman, W.; Saliba, F.; Welzel, T.M.; Albillos, A.; Gustot, T.; Benten, D.; Durand, F.; Ginès, P.; Bernardi, M.; Arroyo, V. Systemic inflammation in decompensated cirrhosis: Characterization and role in acute-on-chronic liver failure. Hepatology 2016, 64, 1249–1264. [Google Scholar] [CrossRef]
- Sak, J.J.; Prystupa, A.; Bis-Wencel, H.; Kiciński, P.; Luchowska-Kocot, D.; Krukowski, H. , Nowicki, G.J.; Panasiuk, L. Oxidative stress-induced growth inhibitor 1 in alcohol-induced liver cirrhosis. Ann Agric Environ Med 2021, 28, 676–680. [Google Scholar] [CrossRef] [PubMed]
- Bala, S.; Csak, T.; Saha, B.; Zatsiorsky, J.; Kodys, K.; Catalano, D.; Satishchandran, A.; Szabo, G. The pro-inflammatory effects of miR-155 promote liver fibrosis and alcohol-induced steatohepatitis. J Hepatol 2016, 64, 1378–1387. [Google Scholar] [CrossRef] [PubMed]
- Hao, Y.; Song, K.; Tan, X.; Ren, L.; Guo, X.; Zhou, C. Reactive Oxygen Species-Responsive Polypeptide Drug Delivery System Targeted Activated Hepatic Stellate Cells to Ameliorate Liver Fibrosis. ACS Nano 2022, 16, 20739–20757. [Google Scholar] [CrossRef]
- Solanki, N.; Salvi, A.; Patki, G.; Salim, S. Modulating Oxidative Stress Relieves Stress-Induced Behavioral and Cognitive Impairments in Rats. Int J Neuropsychopharmacol 2017, 20, 550–561. [Google Scholar] [CrossRef]
- Azizbeigi, K.; Azarbayjani, M.A.; Atashak, S.; Stannard, S.R. Effect of moderate and high resistance training intensity on indices of inflammatory and oxidative stress. Res Sports Med 2015, 23, 73–87. [Google Scholar] [CrossRef]
- Arazi, H.; Taati, B.; Suzuki, K. A Review of the Effects of Leucine Metabolite (β-Hydroxy-β-methylbutyrate) Supplementation and Resistance Training on Inflammatory Markers: A New Approach to Oxidative Stress and Cardiovascular Risk Factors. Antioxidants (Basel) 2018, 7, 148. [Google Scholar] [CrossRef]
- Ryrsø, C.K.; Thaning, P.; Siebenmann, C.; Lundby, C.; Lange, P.; Pedersen, B.K.; Hellsten, Y.; Iepsen, U.W. Effect of endurance versus resistance training on local muscle and systemic inflammation and oxidative stress in COPD. Scand J Med Sci Sports 2018, 28, 2339–2348. [Google Scholar] [CrossRef]
- Oh, S.; Tanaka, K.; Warabi, E.; Shoda, J. Exercise reduces inflammation and oxidative stress in obesity-related liver diseases. Med Sci Sports Exerc 2013, 45, 2214–2222. [Google Scholar] [CrossRef]
- Farinha, J.B.; Ramis, T.R.; Vieira, A.F.; Macedo, R.C.O.; Rodrigues-Krause, J.; Boeno, F.P.; Schroeder, H.T.; Muller, C.H.; Boff, W.; Krause, M.; De Bittencourt, P.I.H., Jr.; Reischak-Oliveira, A. Glycemic, inflammatory and oxidative stress responses to different high-intensity training protocols in type 1 diabetes: A randomized clinical trial. J Diabetes Complications 2018, 32, 1124–1132. [Google Scholar] [CrossRef] [PubMed]
- Corrêa, H.L.; Moura, S.R.G.; Neves, R.V.P.; Tzanno-Martins, C.; Souza, M.K.; Haro, A.S.; Costa, F.; Silva, J.A.B.; Stone, W.; Honorato, F.S. , Deus, L.A.; Prestes, J.; Simões, H.G.; Vieira, E.C.; De Melo, G.F.; Moraes, M.R.; Rosa, T.S. Resistance training improves sleep quality, redox balance and inflammatory profile in maintenance hemodialysis patients: a randomized controlled trial. Sci Rep 2020, 10, 11708. [Google Scholar] [CrossRef] [PubMed]
- Mesquita, C.S.; Oliveira, R.; Bento, F.; Geraldo, D.; Rodrigues, J.V.; Marcos, J.C. Simplified 2,4-dinitrophenylhydrazine spectrophotometric assay for quantification of carbonyls in oxidized proteins. Anal Biochem 2014, 458, 69–71. [Google Scholar] [CrossRef] [PubMed]
- Porter, C.; Reidy, P.T.; Bhattarai, N.; Sidossis, L.S.; Rasmussen, B.B. Resistance Exercise Training Alters Mitochondrial Function in Human Skeletal Muscle. Med Sci Sports Exerc 2015, 47, 1922–1931. [Google Scholar] [CrossRef]
- Groennebaek, T.; Vissing, K. Impact of Resistance Training on Skeletal Muscle Mitochondrial Biogenesis, Content, and Function. Front Physiol 2017, 8, 713. [Google Scholar] [CrossRef]
- Calle, M.C.; Fernandez, M.L. Effects of resistance training on the inflammatory response. Nutr Res Pract 2010, 4, 259–269. [Google Scholar] [CrossRef]
- Kim, S.D. , Yeun, Y.R. 2022. Effects of Resistance Training on C-Reactive Protein and Inflammatory Cytokines in Elderly Adults: A Systematic Review and Meta-Analysis of Randomized Controlled Trials. Int J Environ Res Public Health 2022, 19, 3434. [Google Scholar] [CrossRef]
- ACSM Position Stand: Progression Models in Resistance Training for Healthy Adults. Med Sci Sports Exerc 2009, 41, 687–708. [CrossRef]
- Aebi, H. Catalase in vitro. Methods Enzymol 1984, 105, 121–126. [Google Scholar]
- Misra, H.P.; Fridovich, I. The role of superoxide anion in the autoxidation of epinephrine and a simple assay for superoxide dismutase. J Biol Chem 1972, 247, 3170–3175. [Google Scholar] [CrossRef]
- Figueiredo, I.M.; Sampaio, R.F.; Mancini, M.C.; Silva, F.C.M.; Souza, M.A.P. Teste de força de preensão utilizando o dinamômetro Jammar. Acta Fisiatr 2007, 14, 104–110. [Google Scholar] [CrossRef]
- Neder, J.A.; Nery, L.E. Fisiologia Clínica do Exercício: Teoria e Prática, 1st ed.; Artes Médicas: São Paulo, Brazil, 2002. [Google Scholar]
- ATS - American Thoracic Society. Guidelines for the 6-minute walk test. Am J Crit Care 2002, 166, 111–117. [Google Scholar] [CrossRef] [PubMed]
- Ware Jr, J.E.; Sherbourne, D. The MOS 36-item short-form health survey (SF-36). I. Conceptual framework and item selection. Med Care 1992, 30, 473–483. [Google Scholar] [CrossRef]
- Adorno, M.L.G.R.; Brasil-Neto, J.P. Avaliação da qualidade de vida com o instrumento SF-36 em lombalgia crônica. Acta Ortop Bras 2013, 21, 202–207. [Google Scholar] [CrossRef]
- Zhang, L.J.; Wang, X.Z. Interleukin-10 and chronic liver disease. World J Gastroenterol 2006, 12, 1681–1685. [Google Scholar] [CrossRef]
- Hammerich, L.; Tacke, F. Interleukins in chronic liver disease: lessons learned from experimental mouse models. Clin Exp Gastroenterol 2014, 7, 297–306. [Google Scholar]
- Cichoz-Lach, H.; Michalak, A. Oxidative stress as a crucial factor in liver diseases. World J Gastroenterol 2014, 20, 8082–8091. [Google Scholar] [CrossRef] [PubMed]
- Hadi Yasa, M.; Kacmaz, M.; Serda Ozturk, H.; Durak, I. Antioxidant status of erythrocytes from patients with cirrhosis. Hepatogastroenterology 1999, 46, 2460–2463. [Google Scholar]
- Singh, R.; Singh, R.K.; Tripathi, A.K.; Cornelissen, G.; Schwartzkopff, O.; Otsuka, K.; Halberg, F. Chronomics of circulating plasma lipid peroxides and antioxidant enzymes and other related molecules in cirrhosis of liver. In the memory of late Shri Chetan Singh. Biomed Pharmacother 2005, 59, 229–235. [Google Scholar] [CrossRef]
- Pandey, K.B.; Rizvi, S.I. Markers of oxidative stress in erythrocytes and plasma during aging in humans. Oxid Med Cell Longev 2010, 3, 2–12. [Google Scholar] [CrossRef]
- Warner, A.; Bencosme, A.; Healy, D.; Verme, C. Prognostic role of antioxidant enzymes in sepsis: preliminary assessment. Clin Chem 1995, 41, 867–871. [Google Scholar] [CrossRef] [PubMed]
- Jones, D.A.; Rutherford, O.M.; Parker, D.F. Physiological changes in skeletal muscle as a result of strength training. Q J Exp Physiol 1989, 74, 365–371. [Google Scholar] [CrossRef] [PubMed]
- Aamann, L.; Dam, G.; Borre, M.; Drljevic-Nielsen, A.; Overgaard, K.; Andersen, H.; Vilstrup, H.; Aagaard, N. Resistance Training Increases Muscle Strength and Muscle Size in Patients with Liver Cirrhosis. Clin Gastroenterol Hepatol 2019, 18, 1179–1187. [Google Scholar] [CrossRef] [PubMed]
- Jones, J.C.; Coombes, J.S.; Macdonald, G.A. Exercise capacity and muscle strength in patients with cirrhosis. Liver Transpl 2012, 18, 146–151. [Google Scholar] [CrossRef]
- Hiraoka, A.; Michitakaa, K.; Kiguchib, D.; Izumotoa, H.; Uekia, H.; Kanetoa, M.; Kitahataa, S.; Aibikia, T.; Okudairaa, T.; Tomidaa, H.; Miyamotoa, Y.; Yamagoa, H.; Sugaa, Y.; Iwasakia, R.; Moria, K.; Miyataa, H.; Tsubouchia, E.; Kishidaa, M.; Ninomiyaa, T.; Kohgamib, S.; Hirookac, M.; Tokumotoc, Y.; Abec, M.; Matsuurac, B.; Hiasab, Y. Efficacy of branched-chain amino acid supplementation and walking exercise for preventing sarcopenia in patients with liver cirrhosis. Eur J Gastroenterol Hepatol 2017, 29, 1416–1423. [Google Scholar] [CrossRef]
- Kumar, N.T.A.; Oliver, J.L.; Lloyd, R.; Pedley, J.S.; Radnor, J.M. The Influence of Growth, Maturation and Resistance Training on Muscle-Tendon and Neuromuscular Adaptations: A Narrative Review. Sports (Basel) 2021, 9, 59. [Google Scholar] [CrossRef]
- Matos, F.; Amaral, J.; Martinez, E.; Canário-Lemos, R.; Moreira, T.; Cavalcante, J.; Peixoto, R.; Pinheiro, B.N.; Scipião Junior, L.; Uchoa, P.; Garrido, N.; Reis, V.M.; Monteiro, G.M.; Vilaça-Alves, J. Changes in Muscle Thickness after 8 Weeks of Strength Training, Electromyostimulation, and Both Combined in Healthy Young Adults. Int J Environ Res Public Health 2022, 19, 3184. [Google Scholar] [CrossRef]
- Lacio, M.; Vieira, J.G.; Trybulski, R.; Campos, Y.; Santana, D.; Elias Filho, J.; Novaes, J.; Vianna, J.M.; Wilk, M. Effects of Resistance Training Performed with Different Loads in Untrained and Trained Male Adult Individuals on Maximal Strength and Muscle Hypertrophy: A Systematic Review. Int J Environ Res Public Health 2021, 18, 11237. [Google Scholar] [CrossRef]
- Deliceoğlu, G.; Kabak, B.; Çakır, V.O.; Ceylan, H.I.; Raul-Ioan, M.; Alexe, D.I.; Stefanica, V. Respiratory Muscle Strength as a Predictor of VO2max and Aerobic Endurance in Competitive Athletes. Appl Sci 2024, 14, 8976. [Google Scholar] [CrossRef]
- Artero, E.G.; Lee, D.-C.; Lavie, C.J.; España-Romero, V.; Sui, X.; Church, T.C.; Blair, S.N. Effects of muscular strength on cardiovascular risk factors and prognosis. J Cardiopulm Rehabil Prev 2012, 32, 351–358. [Google Scholar] [CrossRef]
- Carey, E.J.; Steidley, D.E.; Aqel, B.A.; Byrne, T.J.; Mekeel, K.L.; Rakela, J.; Vargas, H.E.; Douglas, D. Six-Minute Walk Distance Predicts Mortality in Liver Transplant Candidates. Liver Transpl 2010, 16, 1373–1378. [Google Scholar] [CrossRef] [PubMed]
- Marchesini, G.; Bianchi, G.; Amodio, P.; Salerno, F.; Merli, M.; Panella, M.; Loguercio, C.; Apolone, G.; Niero, M.; Abbiati, R. Factors Associated with Poor Health-Related Quality of Life of Patients with Cirrhosis. Gastroenterology 2001, 120, 170–178. [Google Scholar] [CrossRef] [PubMed]
- Román, E.; Torrades, M.T.; Nadal, M.J.; Cárdenas, G.; Nieto, J.C.; Vidal, S.; Bascunãna, H.; Juárez, C.; Guamer, C.; Córdoba, J.; Soriano, G. Randomized pilot study: effects of an exercise programme and leucine supplementation in patients with cirrhosis. Dig Dis Sci 2014, 59, 1966–1975. [Google Scholar] [CrossRef] [PubMed]
- Zenith, L.; Meena, N.; Ramadi, A.; Yavari, M.; Harvey, A.; Carbonneau, M.; Ma, M.; Abraldes, J.G.; Paterson, I.; Haykowsky, M.J.; Tandon, P. Eight weeks of exercise training increases aerobic capacity and muscle mass and reduces fatigue in patients with cirrhosis. Clin Gastroenterol Hepatol 2014, 12, 1920–1926. [Google Scholar] [CrossRef]
Figure 1.
Study design.
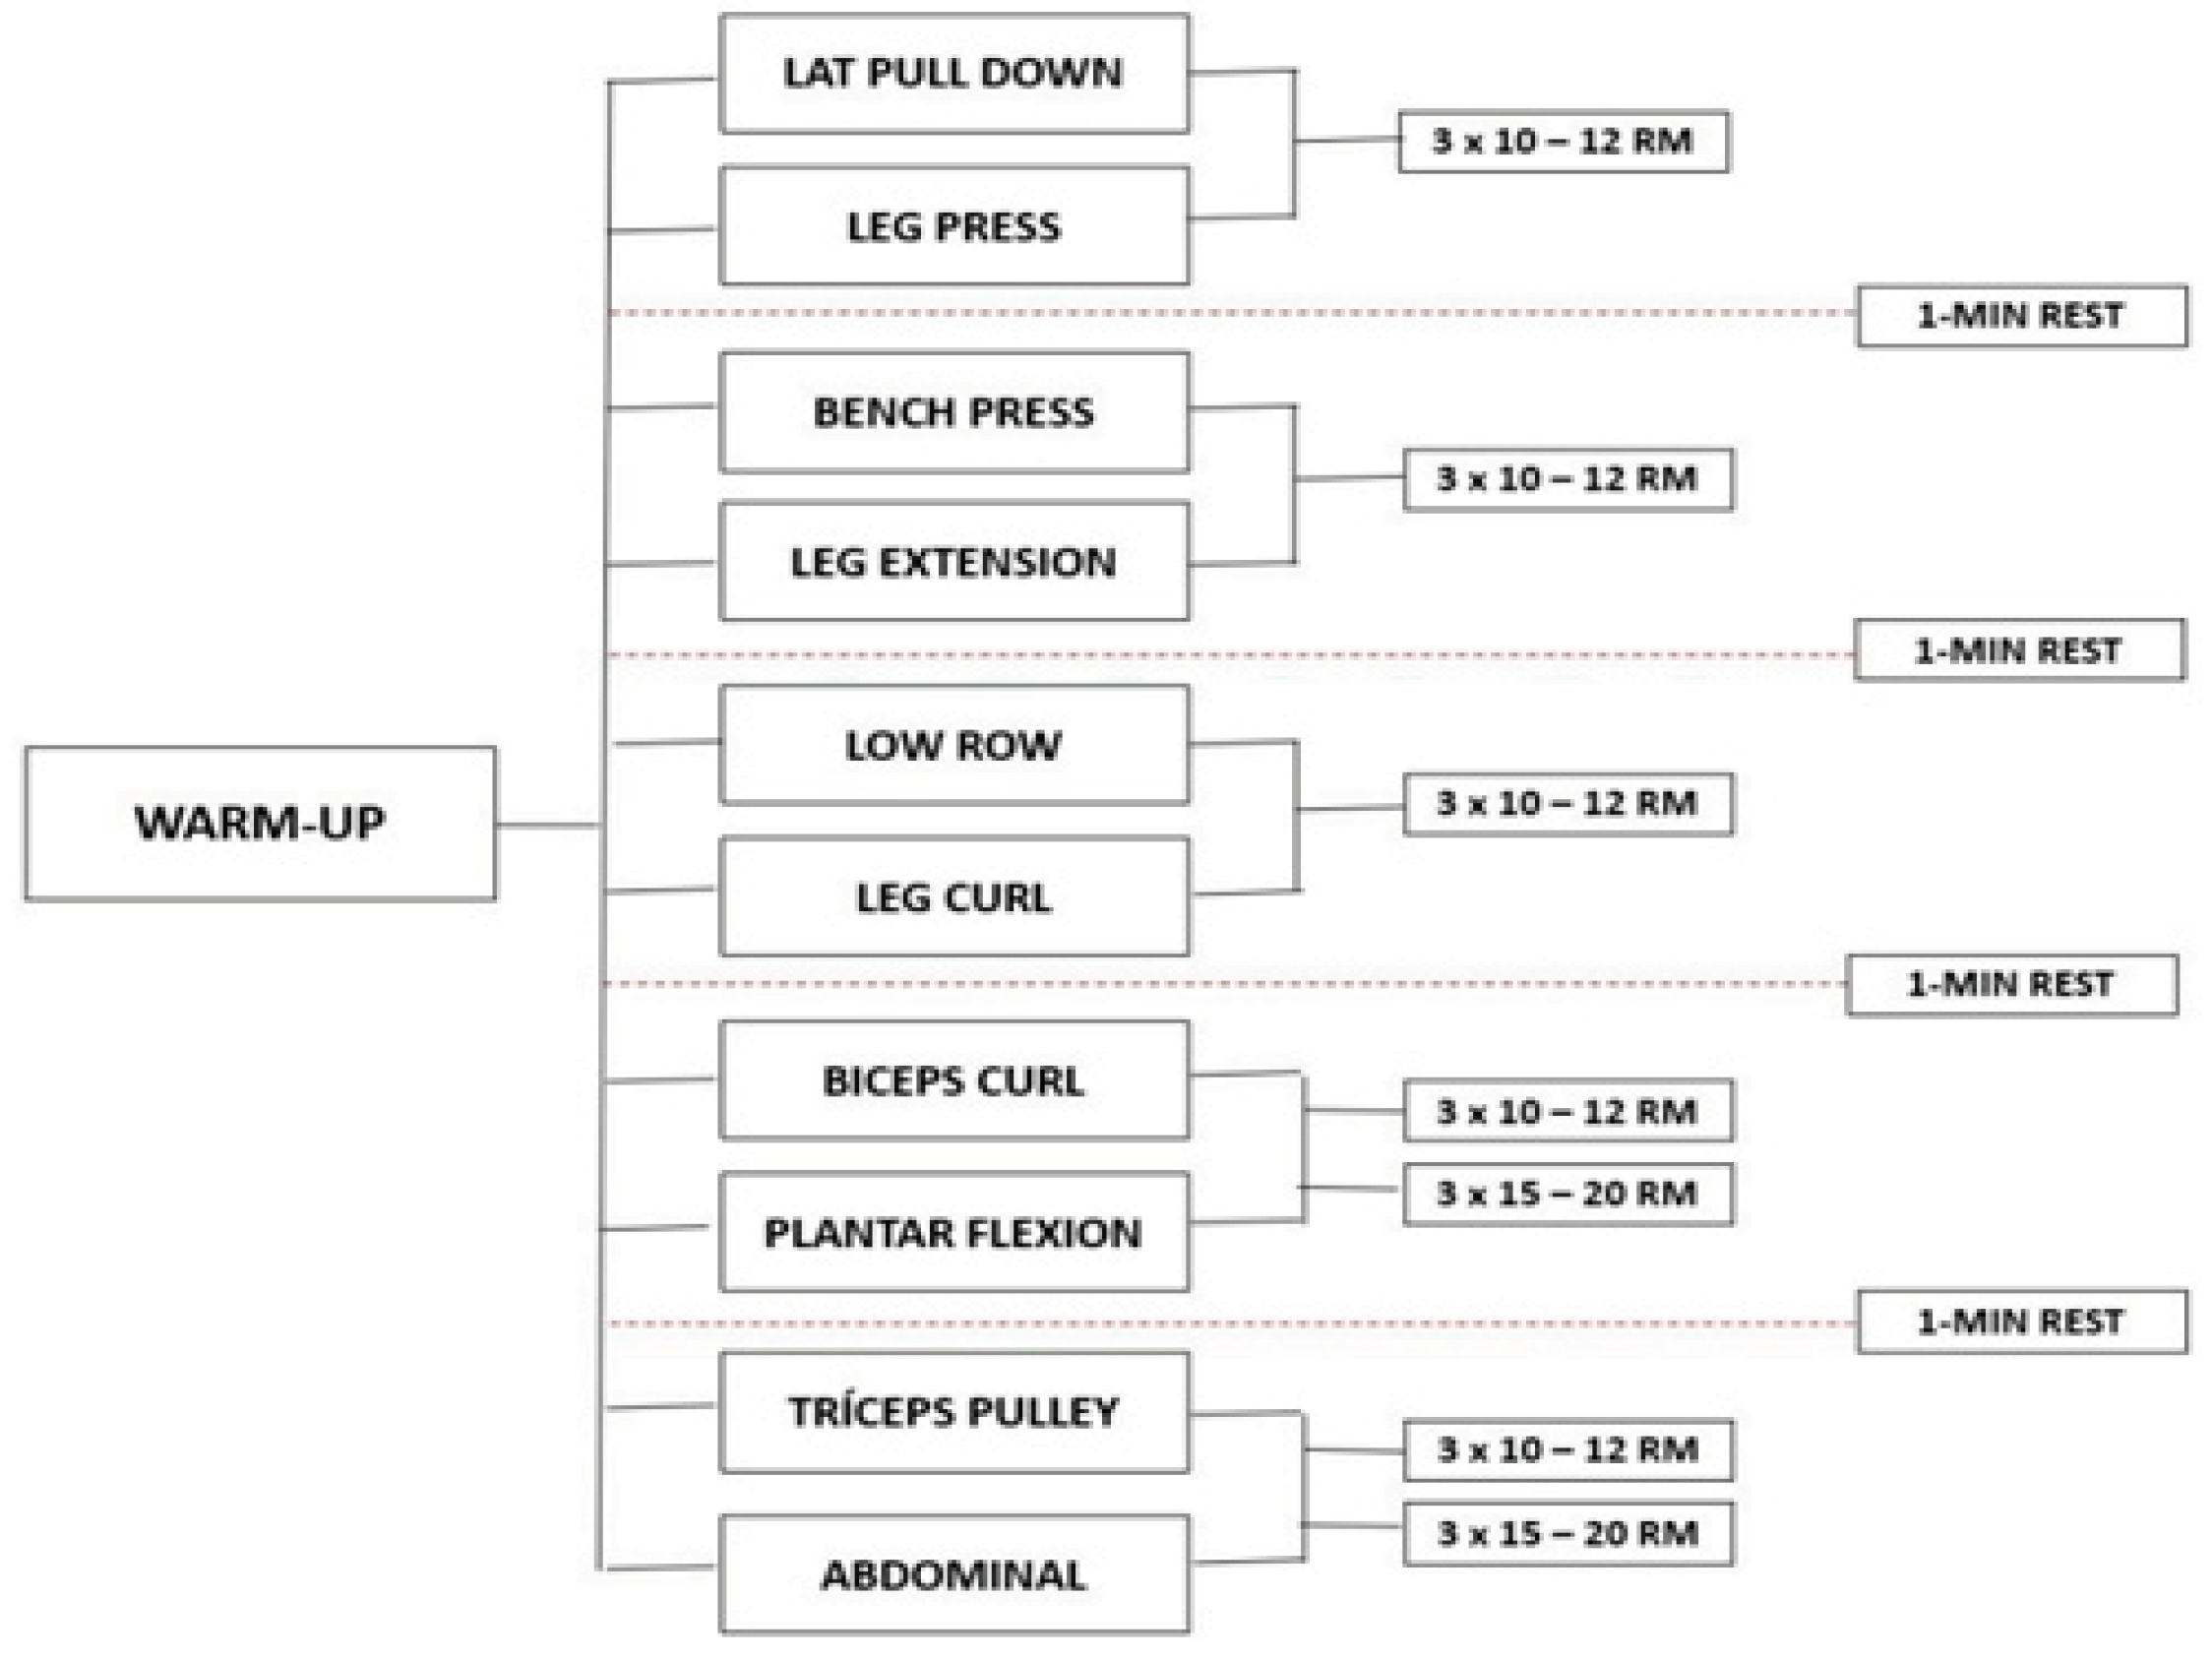
Figure 2.
Inflammatory profile.
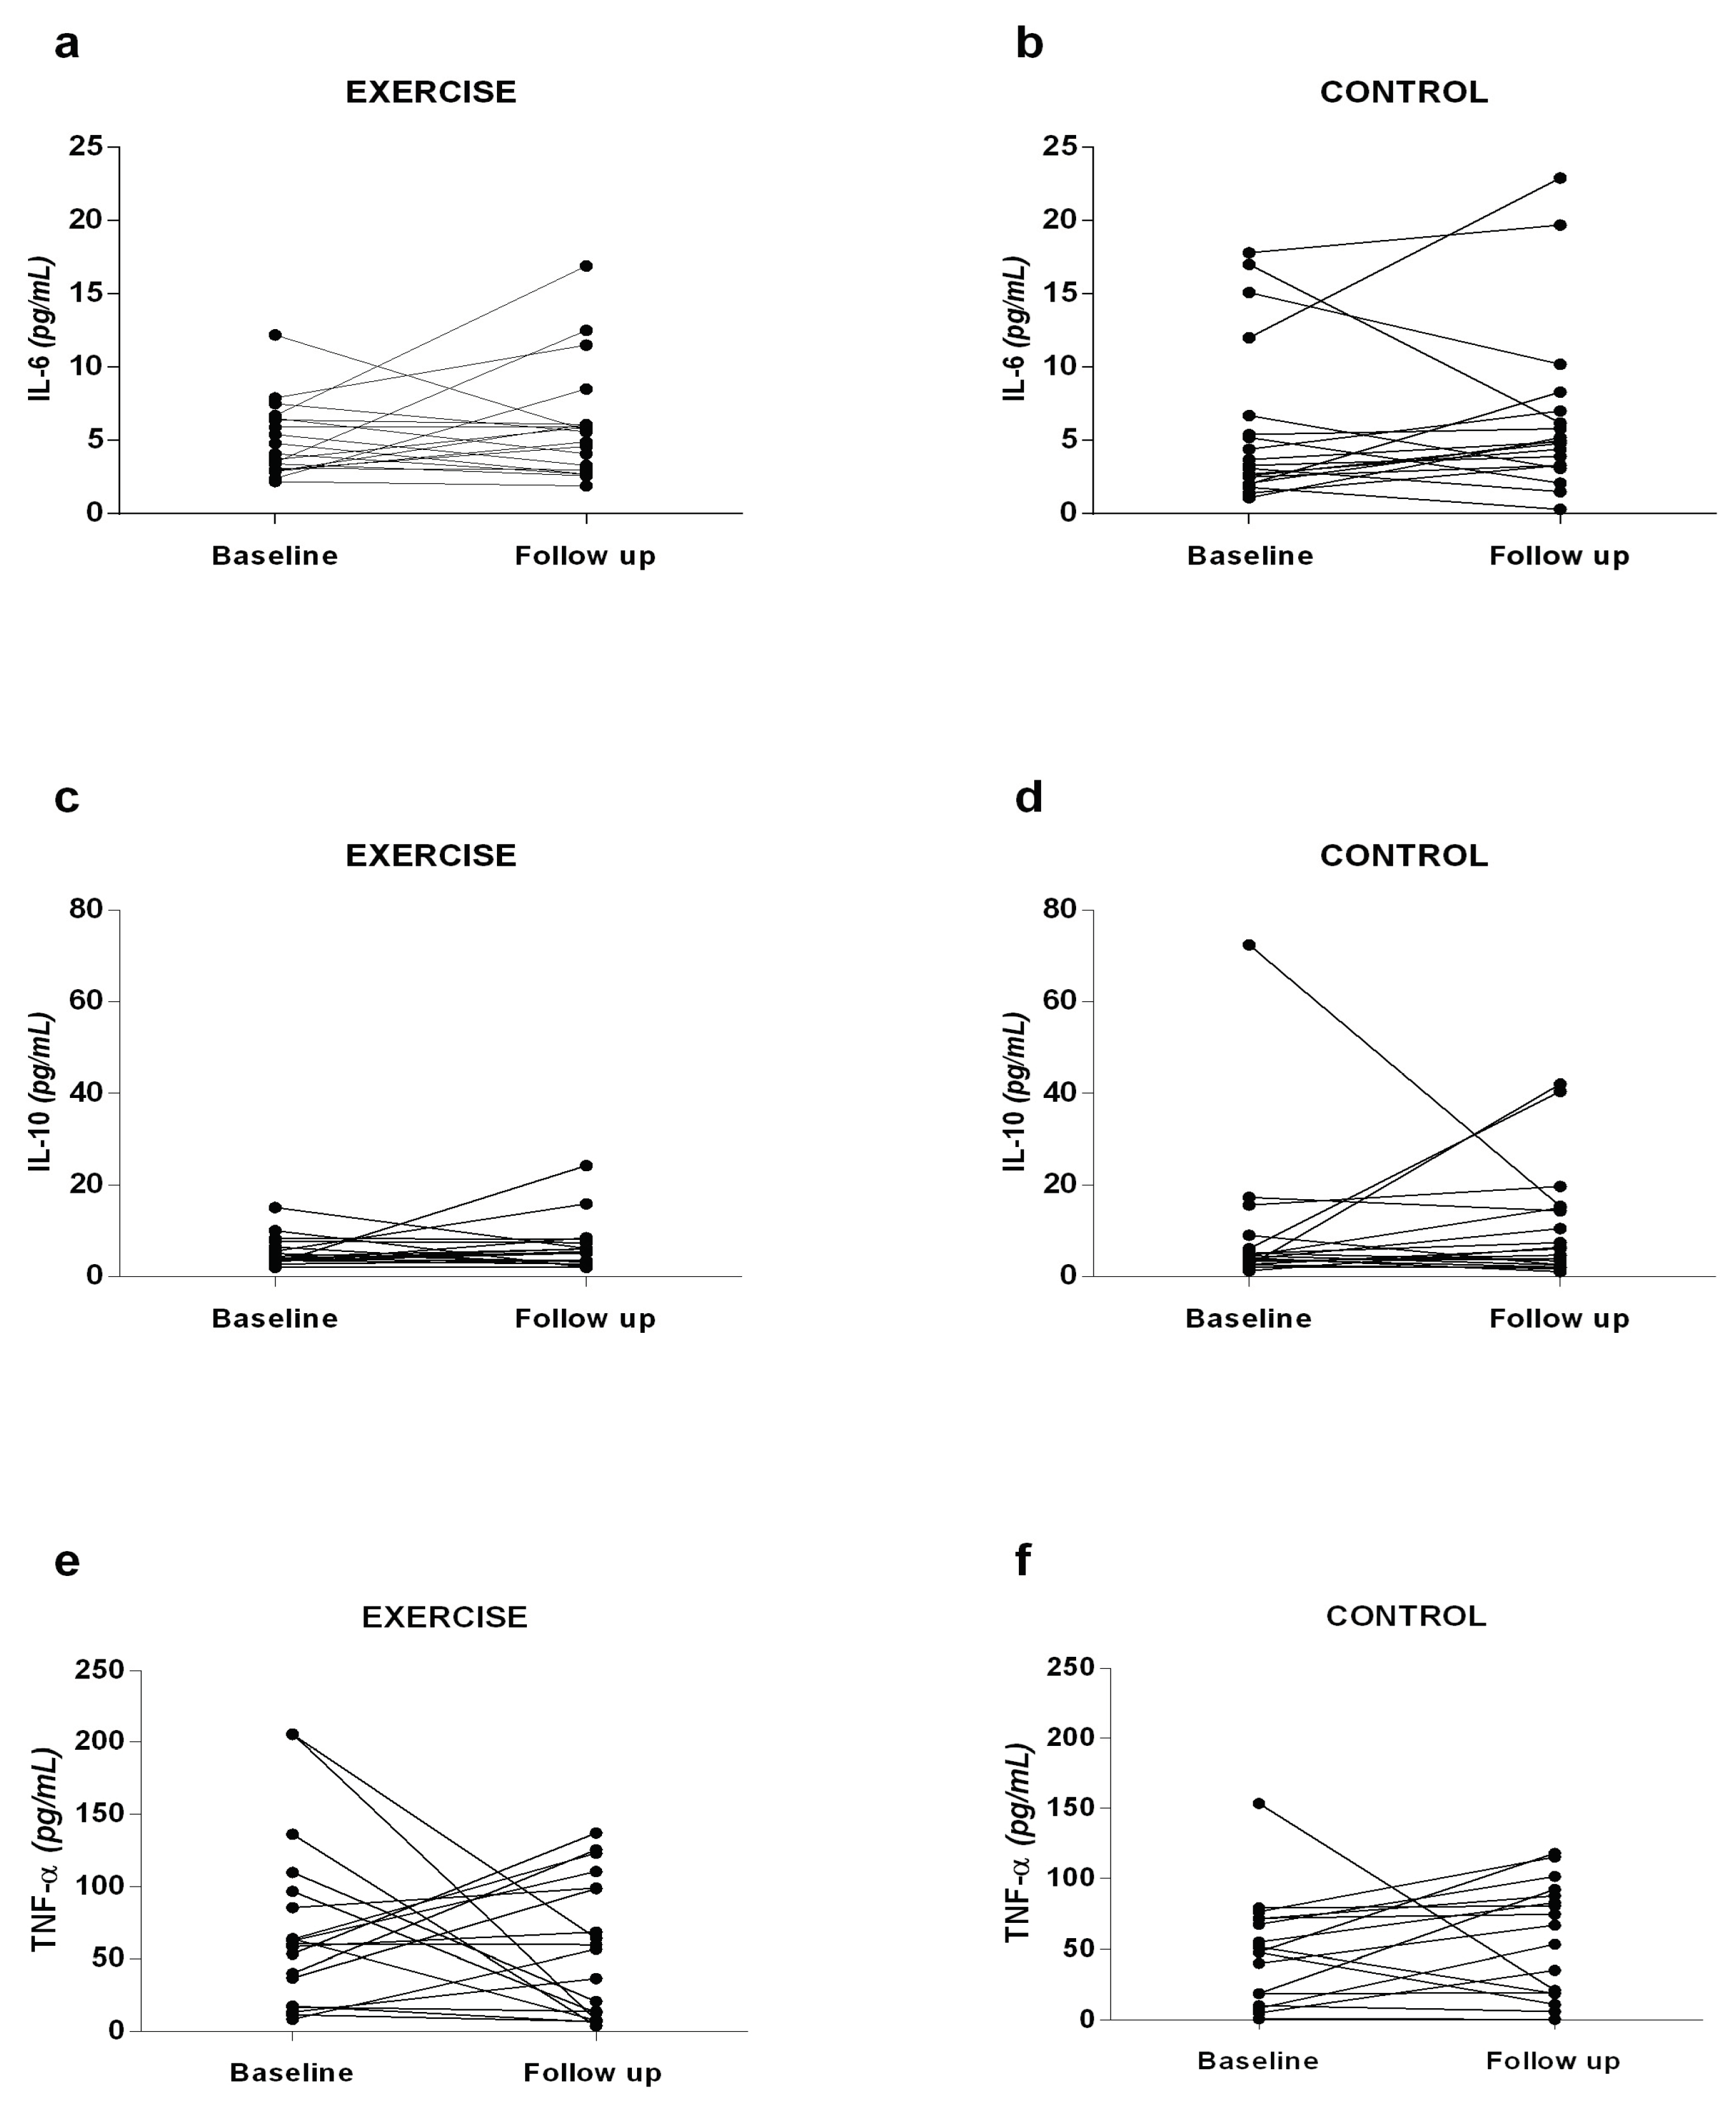
Figure 3.
Oxidative stress.
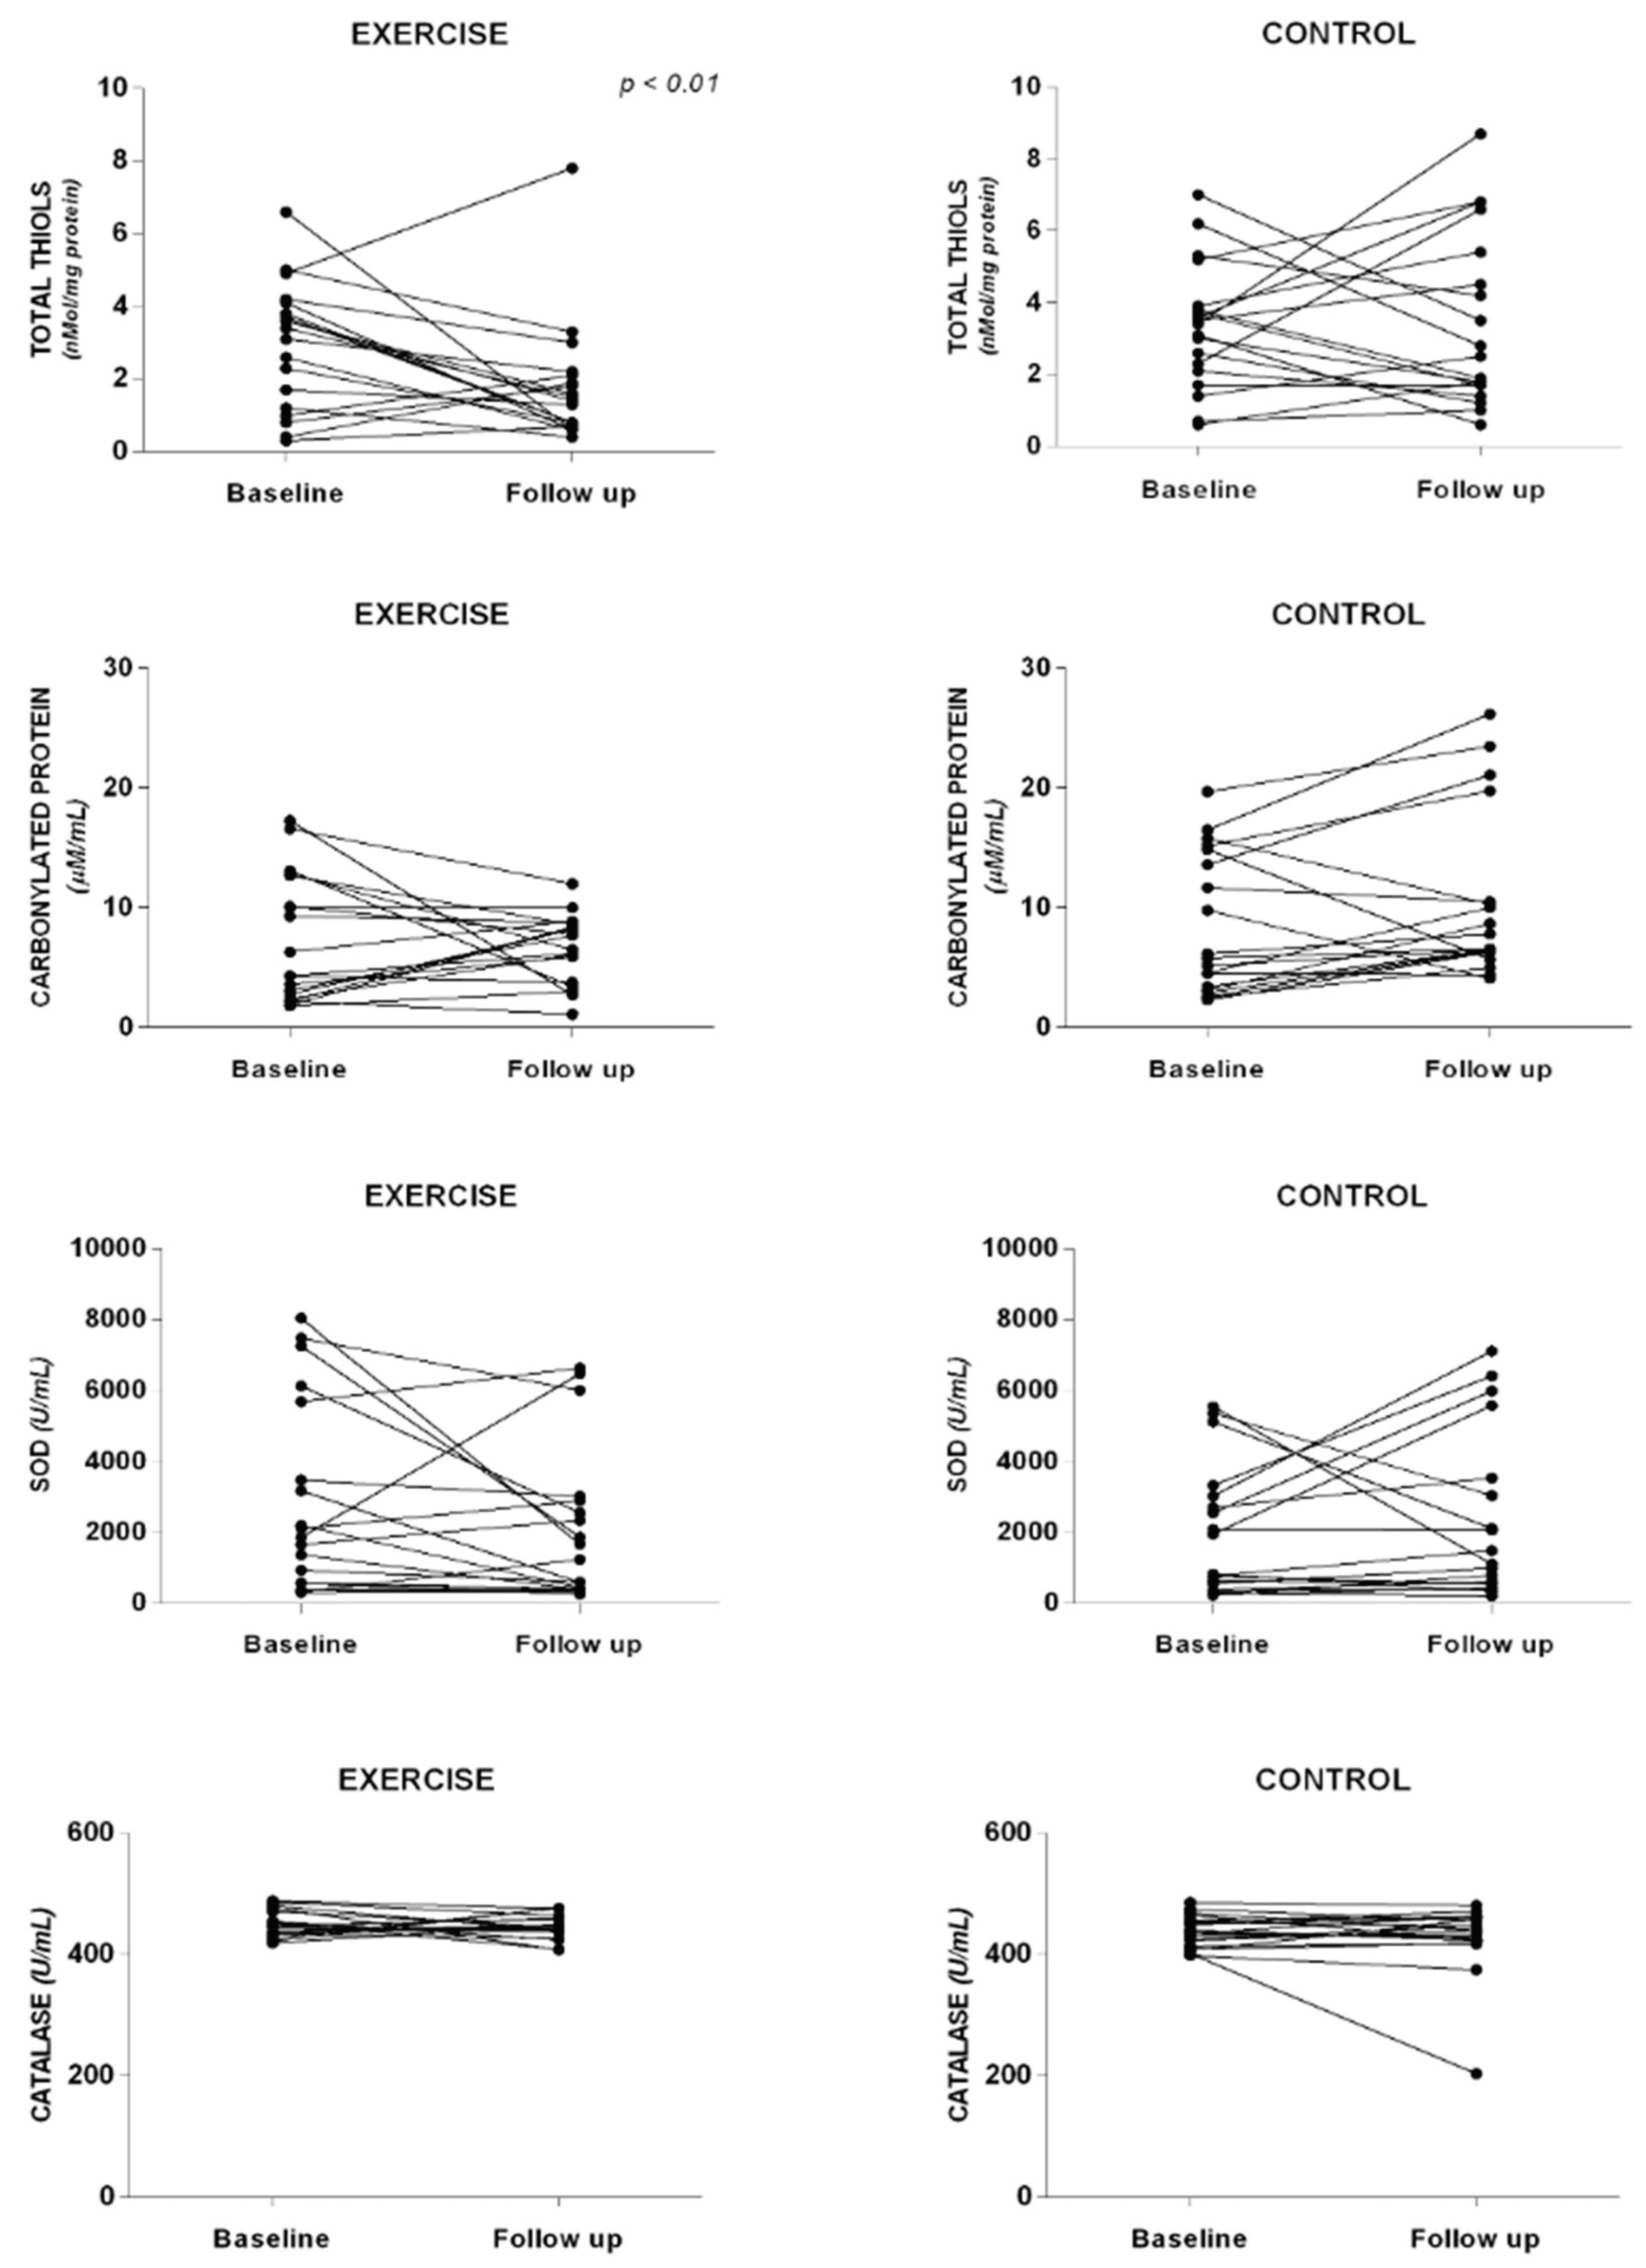
Figure 4.
Cardiorespiratory capacity.
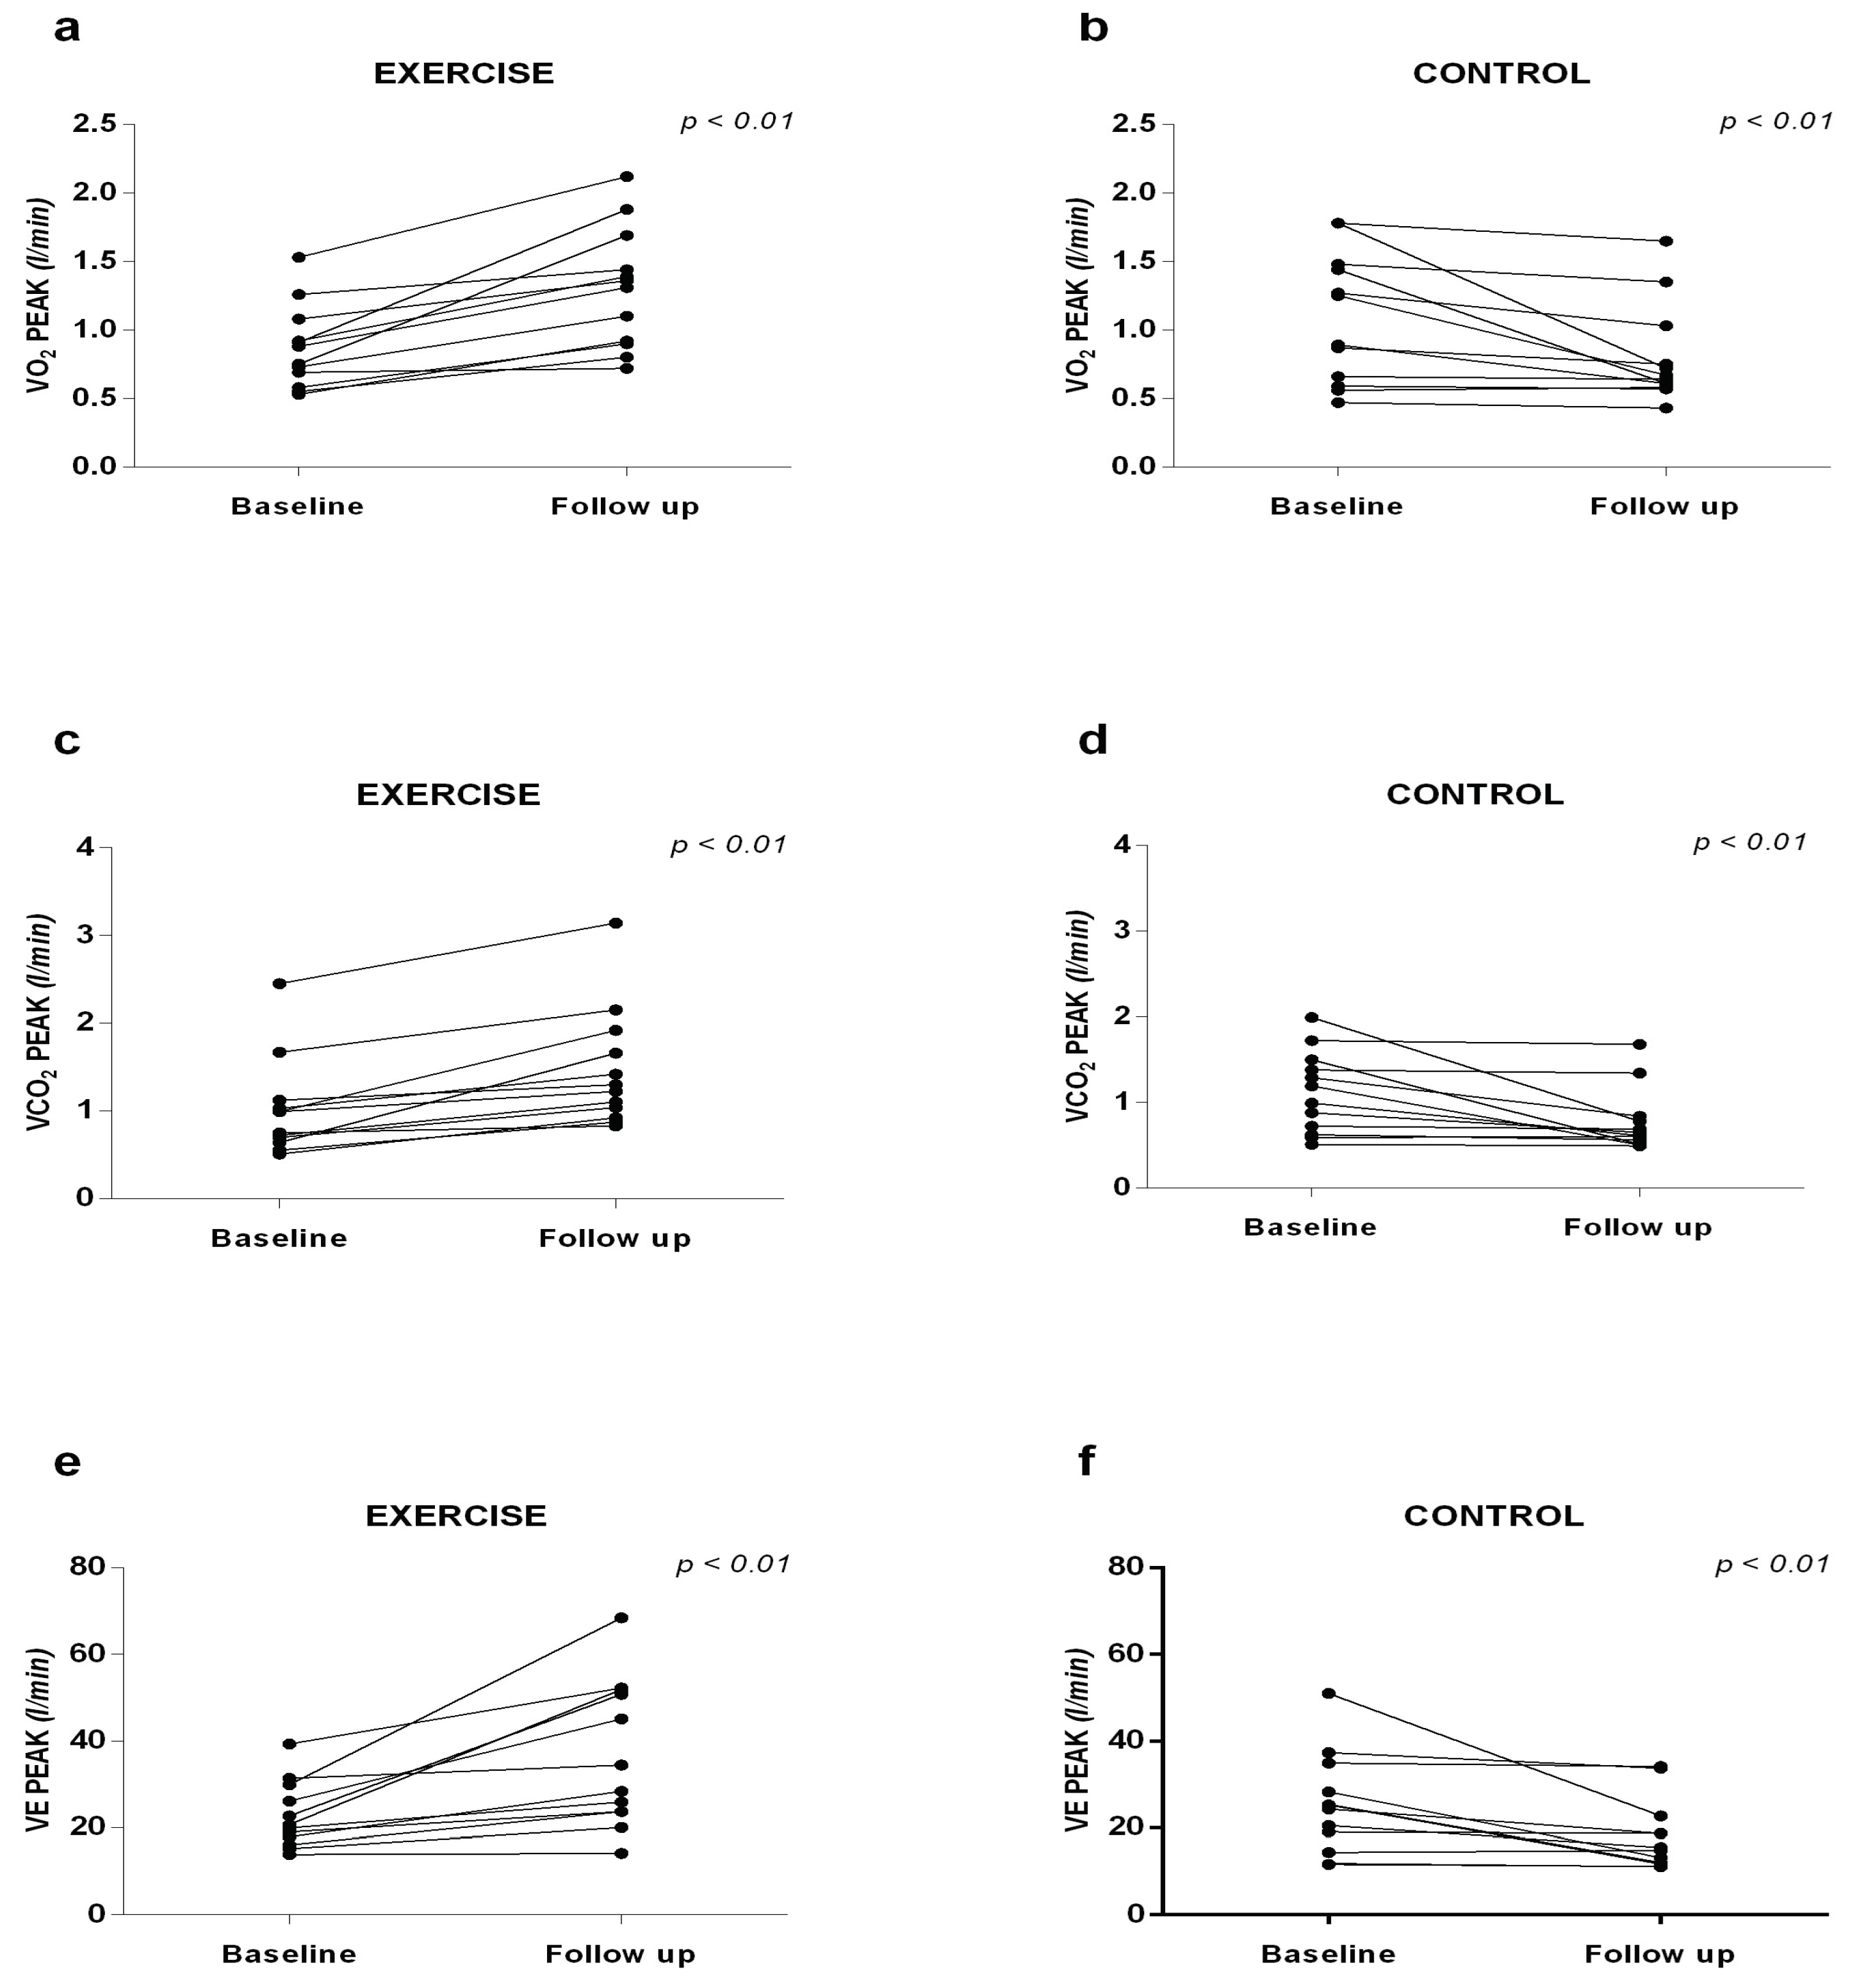

Table 1.
Baseline sample characteristics.
| Exercise Group | Control Group | p value | |
|---|---|---|---|
| Gender, n (female, male) | 12/7 | 12/7 | 1.00 |
| Age, years | 58.9 ± 10.1 | 59.6 ± 8.8 | 0.35 |
| Weight, Kg | 75.8 ± 17.3 | 76.4 ± 14.8 | 0.37 |
| Height, cm | 158 ± 12 | 162 ± 8 | 0.51 |
| BMI, Kg/m2 | 29.9 ± 5.3 | 27.9 ± 4.5 | 0.11 |
| Etiology of Cirrhosis, n | |||
| Hepatitis C virus | 10 | 10 | 1.00 |
| Non-alcoholic steatohepatitis | 8 | 8 | 1.00 |
| Alcohol | 1 | 1 | 1.00 |
| Child-Pugh class, n | |||
| Child-Pugh A | 19 | 18 | 1.00 |
| Child-Pugh B | 0 | 1 | 1.00 |
| Use of Propranolol (yes/no) | 4/15 | 9/10 | 0.91 |
| Previous Ascites (yes/no) | 1/18 | 2/17 | 0.60 |
| Previous of Edema (yes/no) | 0/19 | 0/19 | 1.00 |
| Variceal Bleeding (yes/no) | 4/13 | 4/15 | 1.00 |
| Portal Vein Thrombosis (yes/no) | 2/17 | 1/18 | 1.00 |
| Esophageal Varices (yes/no) | 7/12 | 11/9 | 0.19 |
| Encephalopathy (yes/no) | 0/19 | 1/18 | 0.48 |
| Glucose, mg/dl | 111 ± 26 | 112 ± 46 | 0.70 |
| Albumin Serum, g/dl | 4.2 ± 0.4 | 3.9 ± 0.8 | 0.13 |
| Prothrombin Time, % | 81 ± 14 | 79 ± 20 | 0.80 |
| INR | 1.14 ± 0.13 | 1.19 ± 0.15 | 0.37 |
| Serum Bilirubin, mg/dl | 1.03 ± 1.05 | 1.12 ± 1.09 | 0.81 |
| AST, U/L | 52 ± 35 | 41 ± 19 | 0.18 |
| ALT, U/L | 56 ± 36 | 45 ± 17 | 0.60 |
Legend: BMI, Body Mass Index; INR, International Normalized Ratio; AST, aspartate aminotransferase; ALT, alanine aminotransferase.
Table 2.
Blood analysis and body composition.
| Exercise Group | Control Group | |||||
|---|---|---|---|---|---|---|
| Baseline | Follow-up | p value | Baseline | Follow-up | p value | |
| Body Composition | ||||||
| BMI, Kg/m2 | 30.0 ± 5.3 | 29.5 ± 5.0* | < 0.01* | 28.0 ± 4.5 | 28.1 ± 5.1 | 0.40 |
| Lean Mass, kg | 27.7 ± 7.6 | 27.0 ± 7.0 | 0.66 | 27.1 ± 7.1 | 27.1 ± 6.1 | 0.90 |
| Fat Mass, Kg | 28.2 ± 10.6 | 27.4 ± 10.7 | 0.33 | 25.5 ± 9.0 | 25.4 ± 9.5 | 0.91 |
Legend: BMI, Body Mass Index. *Statistical difference form baseline.
Table 3.
Muscle strength, total training volume, and exercise capacity.
| Exercise Group | Control Group | |||||
|---|---|---|---|---|---|---|
| Baseline | Follow-up | p value | Baseline | Follow-up | p value | |
| Muscle Strength | ||||||
| Handgrip, Kgf | 27.4 ± 13.9 | 30.0 ± 15.5 | < 0.01* | 25.6 ± 9.2 | 21.3 ± 9.0 | < 0.01* |
| Total Training Volume | ||||||
| Lat Pull-down | 464 ± 227 | 862 ± 320 | < 0.01* | - | - | |
| Leg Press | 615 ± 270 | 1297 ± 443 | < 0.01* | - | - | |
| Bench Press | 248 ± 153 | 416 ± 264 | < 0.01* | - | - | |
| Leg Extension | 558 ± 359 | 1080 ± 491 | < 0.01* | - | - | |
| Low Row | 473 ± 226 | 826 ± 326 | < 0.01* | - | - | |
| Leg Curl | 530 ± 314 | 1051 ± 371 | < 0.01* | - | - | |
| Biceps Curl | 701 ± 280 | 1165 ± 336 | < 0.01* | - | - | |
| Tríceps Pulley | 445 ± 283 | 786 ± 546 | < 0.01* | - | - | |
| Exercise Capacity | ||||||
| 6-min Walk Test, m | 456 ± 95 | 525 ± 95 | < 0.01 | 476 ± 51 | 461 ± 75 | 0.18 |
Legend: BMI, Body Mass Index; INR, International Normalized Ratio; AST, aspartate aminotransferase; ALT, alanine aminotransferase. *Statistical difference form baseline.
Table 4.
Quality-of-life analysis.
| Exercise Group | Control Group | |||||
|---|---|---|---|---|---|---|
| Baseline | Follow-up | p value | Baseline | Follow-up | p value | |
| Quality-of-Life | ||||||
| Physical Function | 74 ± 23 | 90 ± 8 | < 0.01* | 74 ± 19 | 71 ± 20 | 0.49 |
| Role Physical | 59 ± 41 | 96 ± 12 | < 0.01* | 58 ± 47 | 61 ± 44 | 0.72 |
| Bodily Pain | 52 ± 23 | 70 ± 14 | < 0.01* | 52 ± 27 | 61 ± 23 | 0.16 |
| General Health | 64 ± 23 | 76 ± 19 | < 0.01* | 64 ± 17 | 65 ± 17 | 0.87 |
| Vitality | 68 ± 23 | 80 ± 16 | 0.06 | 56 ± 23 | 60 ± 24 | 0.45 |
| Social Function | 81 ± 23 | 95 ± 10 | 0.03* | 65 ± 36 | 68 ± 30 | 0.67 |
| Role Emotional | 54 ± 43 | 91 ± 27 | < 0.01* | 47 ± 47 | 56 ± 47 | 0.39 |
| Mental Health | 71 ± 15 | 81 ± 13 | 0.03* | 62 ± 25 | 64 ± 30 | 0.45 |
Legend: *Statistical difference form baseline.
Disclaimer/Publisher’s Note: The statements, opinions and data contained in all publications are solely those of the individual author(s) and contributor(s) and not of MDPI and/or the editor(s). MDPI and/or the editor(s) disclaim responsibility for any injury to people or property resulting from any ideas, methods, instructions or products referred to in the content. |
© 2025 by the authors. Licensee MDPI, Basel, Switzerland. This article is an open access article distributed under the terms and conditions of the Creative Commons Attribution (CC BY) license (http://creativecommons.org/licenses/by/4.0/).
Copyright: This open access article is published under a Creative Commons CC BY 4.0 license, which permit the free download, distribution, and reuse, provided that the author and preprint are cited in any reuse.


