
Submitted:
20 May 2025
Posted:
20 May 2025
You are already at the latest version
Abstract
Soil aggregates play critical roles in regulating the behavior of heavy metal in soils. To understand the distribution of cadmium (Cd) in aggregates of different soil types as well as their roles in regulating Cd bioavailability of the bulk soils, four major arable soils, including acidic, neutral and calcareous purple soils and calcareous yellow soil (APS, NPS, CPS and CYS), were sampled from Chongqing, China for aggregate separation and determination of total Cd(T-Cd) distribution, fractionation, and extractability in various-sized aggregates. A pot experiment with ryegrass (Lolium perenne L) was conducted to evaluate Cd bioavailability in bulk soils as influenced by aggregates. The results show that the composition of soil aggregates varies a lot among soils, lower soil pH tends to increase the proportion of macroaggregate while decreasing that of smaller aggregates. The Cd distribution, HCl-extractability and active fraction (AF, T-Cd/HCl-Cd) in aggregates are all soil type-dependent, with pH and particle size being the main determining factors, the distribution pattern of Cd concentrated in smaller aggregates is only found for CPS and CYS (pH>7.5) upon exogenous Cd addition, though the finest aggregates (silt-clay, < 0.053 mm) consistently exhibited the highest Cd enrichment for all tested soils. The Cd extractability and AF values in all aggregates show a sequence of APS>NPS>CPS>CYS, indicating the fundamental influence of soil pH on Cd availability. Higher AF values over bulk soils either in silt-clay aggregates or in microaggregates (0.053-0.25 mm) whereas lower AF in macroaggregates(1-2mm) are found for APS and NPS, which which correspond to the relative portions of Ex-Cd and Fe/Mn oxide-bound Cd (Fe/Mn-Cd) in these aggregates. In contrast, less variation of AF values among aggregates are observed for CPS and CYS or APS/NPS upon Cd addition. Pot experiments demonstrated strong positive correlations between ryegrass Cd uptake and HCl-Cd in silt-clay aggregates and T-Cd in microaggregates, while a negative correlation was observed with T-Cd in macroaggregates. These findings have supplied new insight into the mechanisms of aggregates in controlling Cd bioavailability in bulk soils, and shed light on the development of new strategies for remediating Cd-polluted soils.
Keywords:
Lolium perenne L
; cadmium
; soil aggregates
; distribution characteristics
; bioavailability
1. Introduction
Heavy metal contamination of soils has been an environmental concern worldwide due to its widespread sources, high toxicity, and non-biodegradability. According to the National Soil Pollution Survey Report of China, cadmium (Cd) is the most widespread soil pollutant in China, with 7.0% of soil sampling sites exceeding the risk screening values set by the “Risk control standard for soil contamination of agricultural land in China (GB15618-2018)”. Understanding Cd distribution and transformation in soils is crucial for controlling farmland Cd pollution, reducing its accumulation in the food chain, and ensuring sustainable agriculture [1,2,3]. Bioavailability can be defined as the amounts of any given metal that can be taken up by plants or microorganisms such that a physiological response is observable [4]. Generally, it is believed that the bioavailability of metals in soils depends not only on the total concentration but also on their specific chemical forms [5]. To date, a considerable research has been conducted for understanding heavy metals’ migration and transformation processes in soils and their impacts on the growth of plants [6,7,8]. However, the roles of soil aggregates in regulating the bioavailability of heavy metals have been overlooked and remained unclear.
Soil aggregates, formed by soil particles conjuncted with various cementing matters such as organic matter, are the basic functional units in soil [9,10,11], which regulate the physicochemical properties of soils and thus deeply affect the behaviors of nutrients and pollutants in soils[12,13]. Hence, understanding the distribution, forms, and migration characteristics of heavy metals in soil aggregates is crucial. Commonly, fine-sized soil aggregates have a higher capacity for Cd adsorption due to their larger specific surface area and higher active metal (hydro)oxide content[14,15,16]. Duong,
Schlenk, Chang and Kim [17] reported that the majority of elements involved in soil heavy metal contamination, including Cu, Zn, and Pb, are preferentially concentrated in tiny particle-size portions, with the tiniest particles typically showing the highest contents. Acosta, Faz, Kalbitz, Jansen
and Martínez-Martínez [18] also found that the amount of heavy metals like Cd, Cu, and Zn in soil aggregates increases dramatically as their particle size steadily decreases, and their adsorption capability also increases. However, Lombi, Sletten and Wenzel [19] observed that the distribution of As varies noticeably across aggregate particles of different sizes in As-contaminated soil, with As in larger aggregate particles having higher biological toxicity. Under certain circumstances, small-sized soil aggregate particles can aggregate into large-size particles, and the presence of heavy minerals in large-size particles will also be significantly enriched. The distribution of heavy metals among varying sizes aggregates is complicated in different soil types. Furthermore, there may be variations in the chemical forms and bioavailability of heavy metals in various aggregates. Li, Wu, Luo and
Christie [20] found that hyperaccumulators could uptake more Cd and Zn from coarse particle fractions than from fine particles.
To date, few studies have addressed the differences of the distribution characteristics of Cd in aggregates among various soil types, and how they regulate the Cd availability in bulk soil remains unclear. In this paper, we compared the distribution patterns of both native and exogenous Cd in various sized aggregates in four types of typical farmland soils with apparent differences in basic properties, and the existing sates of native Cd and transformation of exogenous Cd in aggregates of different soils were also investigated by sequential fractionation. In combination with a pot experiment, where ryegrass (Lolium perenne L.) was used as an indicator, the bioavailability of Cd in soils with varied Cd distribution patterns, existing states in soil aggregates were evaluated, and thus the roles of soil aggregates in regulating Cd availability in soils were elucidated via correlation analyses. The results supplied the basis for risk assessment of soil Cd pollution and the precise remediation of Cd-contaminated soils.
2. Materials and Methods
2.1. Soil Preparation
The tested soils encompassed the main farmland soil types in Southwest China: acidic purple soil (APS), neutral purple soil (NPS), calcareous yellow soil (CYS), and calcareous purple soil (CPS). Soil samples were collected from Jiangjin, Hechuan, Beibei, and Tongnan districts (Chongqing, China), representing the respective soil types. From each site, the 0-20 cm topsoil layer was sampled, air-dried at room temperature (~25 °C), and homogenized. Visible impurities (e.g., plant roots, gravel) were manually removed before sieving (<2 mm mesh) to ensure uniformity for subsequent analyses. The basic physicochemical properties of the tested soils are shown in Table 1. The total cadmium (T-Cd) content of all tested soils did not exceed the risk screening value set by the Chinese standard of “Soil Environmental Quality Agricultural Land Soil Pollution Risk Control Standard (Trial)” (GB 15618-2018).
2.2. Preparation of Cd-Contaminated Soil
To investigate the distribution of exogenous Cd in the aggregates of different soils, four levels of exogenous Cd were spiked into the soils in pots with a Cd (NO₃)₂·4H₂O solution and aged for 90 d in a greenhouse (25 ± 2 °C, Southwest University), to represent the control (CK, 0 mg·kg-1), low (Cd1, 1 mg·kg-1), medium (Cd2, 2 mg·kg-1), and high pollution levels (Cd4, 4 mg·kg-1) referring to GB 15618-2018. The soil moisture was maintained at 60% of the field water-holding capacity (WHC) by periodic replenishment with deionized water during the aging period. All treatments were conducted in triplicate.
2.3. Soil Aggregates Separation
Soil aggregates were fractionated into five size classes via ultrasonic dispersion-coupled wet sieving (Elliott, 1986) using a soil aggregate analyzer (XY-100): macroaggregate (1-2 mm), medium aggregate (0.5-1 mm), small aggregate (0.25-0.5 mm), microaggregate (0.053-0.25 mm) and silt-clay aggregate (< 0.053 mm). The procedure for soil aggregate separation was as follows: 300 g of air-dried soil was evenly distributed to the top sieve of a nested set of nylon sieves (apertures decreasing sequentially from top to bottom). The sieve stack was immersed in deionized water for 15 min to pre-wet soil samples, followed by up-down oscillation with an oscillator (30 mm amplitude) for 5 min under ultrasonic dispersion (25 kHz, 0.2 W·cm-³). Aggregates retained on each sieve were rinsed by deionized water into pre-labeled containers, oven-dried at 50 °C (48 h), and weighed. Dried fractions were stored in airtight containers for analyses.
2.4. Soil Determination and Analysis
All aggregate fractions (from the four soil types) and bulk soils were analyzed for total Cd (T-Cd), available Cd, and Cd fractionation. T-Cd was determined (digested with HNO3-HClO4-HF) according to the method described by Lu, Zhuang, Li, Tai, Zou, Li and McBride [21]. Available Cd content was measured by HCl extraction (soil: solution ratio 1:10, 2 h shaking), and Cd speciation was determined via Tessier sequential extraction (five-step procedure). The Cd contents in all solutions were determined by graphite furnace atomic absorption spectrometry (GFAAS; PinAAcle 900T, PerkinElmer). The national standard materials of GBW07404 (GSS-4) and GBW07428 (GSS-14) were used as soil internal standard references for quality control. All analyses were conducted in triplicate.
2.5. Pot Experiment
Pot experiment in a greenhouse was carried out for examining the Cd bioavailability in bulk soils consisting of various aggregates, in which four Cd treatments (CK: 0, Cd1: 1, Cd2: 2, Cd4: 4 mg·kg⁻¹) were applied to each soil type (n=4), with triplicate pots per treatment (total 48 pots = 4 soils × 4 treatments × 3 replicates). The aged contaminated soils (1.5kg·per pot) were loaded into PVC pots (diameter × height: 15 cm × 12cm), and the soils were amended with urea 0.483 g·kg-1, sodium dihydrogen phosphate 0.330 g·kg-1, and potassium sulfate 0.416 g·kg-1 as base fertilizers. Ryegrass (Lolium perenne L.) seeds were sown (10 seeds/pot) as a Cd bioaccumulation indicator. Soil moisture was maintained at 60% WHC by weekly replenishment with deionized water (adjusted via pot weighing). At the two-true-leaf stage, seedlings were thinned to keep 8 uniform plants per pot. After 60 days of cultivation, plant height was recorded and the aboveground and underground parts were separately harvested. Samples were triple-rinsed with deionized water, blotted dry, and fresh weights recorded. After 30 minutes of enzyme deactivation at 105 °C, the plant samples were dried to a constant weight at 70 °C. The dry weight of each treatment was weighed and then crushed for analyses. Dried tissues were ground and microwave-digested (HNO₃:HClO₄, 3:1 v/v) for GFAAS Cd analyses (PinAAcle 900T). Standard addition recoveries and certified plant materials (GBW07603) were adopted in each batch of analyses for the control of analytical quality, the relative standard deviation (RSD) was <5%.
2.6. Date Analysis
The experimental data were primarily treated in Microsoft Excel 2007 and then processed in IBM SPSS Statistics 18.0 for statistical analyses. Origin Pro 8.5 (OriginLab Corporation) was used to plot the graphs.
3. Results and Discussion
3.1. Characteristics of Aggregate Mass Distribution
The mass recovery rates of the aggregate separation method used were calculated to range from 89% to 95%, indicating the reliability of the method. As shown in Figure 1, the composition of soil aggregates varies with soil types. For purple soils, the soil pH is the key determinizing factor controlling the aggregate distribution patterns: with pH decreasing, the mass fraction of silt-clay aggregate decreased from 49.6% in CPS to 23.8% in APS, while the fractions of other aggregates all increased, for example, the fraction of macroaggregate increased from 3.7% in CPS to 9.8% in APS. This phenomenon results from H+ accumulation in acidic soils, which promotes particle sloughing and reduces permeability, thereby facilitating the transformation of small aggregates into larger ones [22]. For calcareous yellow soil, mass fractions of aggregates vary less except for the macroaggregate, which accounts for the least portion (4.8%). Consequently, the dominant aggregate fractions varied significantly among soil types, with small aggregates (24.2%) prevailing in APS, silt-clay aggregates (34.5, 49.6%) in neutral, calcareous purple soils, and medium aggregates (31.8%) in calcareous yellow soil. This may be attributed to the differences in soil properties and aggregating processes.
3.2. The Enrichment of T-Cd in Various Soil Aggregates
T-Cd content in various-sized soil aggregates may reflect the enrichment of each aggregate for Cd. The recovery rates of T-Cd in native soil and in soil samples with exogenous addition of 1,2 and 4mg·kg-1 Cd were 87.8% - 104.8%, 89.1% - 100.1%, 86.7% - 99.8%, and 97.1% - 103.3%, respectively, showing the reliability of the analysis method. T-Cd contents in v0arious-sized soil aggregates for the four types of soils are shown in Figure 2.
In native soil (CK), the general tendency of T-Cd concentrated in smaller aggregates was not always observed in our study. Instead, the T-Cd enrichments in aggregates of various soils were particle size and pH dependent and a particle size of 0.053-0.25 mm (the size of microaggregate) is crucial for Cd enrichment: for APS and NPS (pH<7.5), the Cd contents in microaggregates were lowest and lower or higher sized aggregates resulted in higher Cd enrichment, while for CPS and CYS (pH>7.5), the opposite tendency was observed with Cd contents in microaggregates being highest. When exogenous Cd was added, its enrichment patterns in aggregates were in general similar to those of CK: microaggregates showed lower Cd enrichment in APS and NPS and higher enrichment in CPS and CYS, respectively. However, the smallest silt-clay aggregates showed the highest exogenous Cd enrichment for all soils, and a clear tendency of Cd concentrated in smaller aggregates was only found for CPS and CYS. On contrast to the conventional understanding that the smaller the particle size is the higher its metal retention, our results emphasize that the enrichment of Cd in soil aggregates is not only particle-size determined but also differ with soil types, and soil pH show a profound influence.
3.3. The Distribution of T-Cd Loads in Soil Aggregates
The T-Cd distribution in aggregates is affected by both the mass fraction of each aggregate and the Cd content. Therefore, the concept of heavy metal mass loading factors [23] is introduced to evaluate the mass contribution of Cd in each particle-sized aggregate in soils. The calculation formula is as follows:
where Xi is the Cd content in specific-sized aggregate of i (mg·kg-1); GSi is the mass fraction of i in the whole soil.
The results in Figure 3 show that the mass distribution of Cd in various aggregates in purple soils showed similar patterns with and without exogenous Cd addition: with the increase of soil pH, the mass loading factors of Cd in the finest aggregate-silt clay aggregate significantly increased from 22% in APS to 47% in CPS for native soil, and 26% in APS to 53% in CPS for soils with 1 mg/kg exogenous Cd added, 29% in APS to 51% in CPS for soils with 2 mg/kg exogenous Cd added, and 30% in APS to 47% in CPS for soils with 4 mg/kg exogenous Cd added, respectively. While those in larger aggregates apparently decreased, for instance, loading factors of Cd in macroaggregate decreased from 12% in APS to 4% in CPS for native soil and 10% in APS to 3% in CPS for soils with Cd1 and Cd2, 10% in APS to 4% in CPS for soils with Cd4, respectively. The dominating Cd loads were found in silt-clay aggregate for NPS and CPS and in small aggregate for APS regardless of Cd addition. This suggests that higher soil pH promotes Cd sequestration in the finest fraction for purple soil. However, the allocation of Cd in various sized aggregates in CYS varied to a less extent except for macroaggregate, which load only 3-5% of T-Cd. Commonly, heavy metals in acidic soils are more soluble, thus having higher availability to plants and higher environmental risks to water bodies duo to their higher mobility. Our observations point out that enriched Cd in smaller aggregates in neutral and calcareous purple soils may also endow them greater environmental risks via mass transportation driven by runoff, implying that the environmental risks of soil Cd are soil type and pH dependent.
3.4. The Extractability of Cd in Soil Aggregates by HCl
The extractable soil Cd contents by various chemical agents are often used to evaluate the soil Cd availability to plants, our previous study [24] shows that HCl-extracted Cd (HCl-Cd) could demonstrate the strongest correlation with crop uptake in Southwest China. To evaluate the contribution of soil aggregates to the bulk soil regarding Cd availability, the Cd extractability by HCl in various-sized aggregates of the tested soils were measured as shown in Figure 4. It shows that the Cd extractability in aggregates varied significantly with the particle size, pH, soil type, and Cd addition.
Soil type shows a fundamental influence on the Cd extractability in soil aggregates with or without exogenous Cd added, following a general tendency of APS>NPS>>CPS>CYS, which is in accordance with the conventional knowledge that Cd in acidic soils is more liable than that in neutral or calcareous soils. For a specific soil, the extractability of native soil Cd among aggregates varies significantly, whereas the variations diminished upon exogenous Cd added. In native soils, HCl-Cd content was consistently highest in silt-clay aggregates across all soil types. Conversely, macroaggregates exhibited the lowest HCl-Cd levels, except for NPS, where the differences among aggregates were less pronounced, with small aggregates showing the lowest extractability. With exogenous Cd addiction, HCl-Cd contents in microaggregate were apparently lower than those in other aggregated in APS and NPS, which were in accordance with their Cd enrichment ability (see Figure 1). For the calcareous soils (CPS and CYS), HCl-Cd contents in aggregates tends to decrease with their increased sizes, suggesting that the smaller aggregates in these soils have higher HCl-extractable Cd due to their higher Cd loads.
The significance of Cd in aggregates to its availability in the bulk soil depends not only on their extractability but also on the total Cd loads in each aggregate. To better evaluate the availability of Cd in aggregates, we introduced the concept of active fraction (AF), defined as the ratio of HCl-extractable Cd to total Cd in each aggregate (AF=[HCl-Cd]/[T-Cd]ⅹ100). The results are shown in Table 2.
In native soil, AF values in silt-clay aggregates was the highest for all soils, and the lowest AF were found in macroaggregates for all soils except for NPS, where AF variations among aggregates were minimal, indicating that the Cd in silt-clay aggregates of native soil showed highest availability. Upon exogenous Cd added, AF values in aggregates became primarily soil-type dependent, with reduced variations among aggregates. Notably, in purple soils, AF decreased sharply with increasing soil pH, following the trend APS > NPS > CPS, confirming higher Cd availability in acidic conditions. For instance, the AF value in silt-clay aggregates for APS was nearly 3.5 times higher than those in CPS. Despite both being alkaline, CPS aggregates displayed significantly higher AF values than CYS across all size fractions, even if CPS has higher pH (7.81) than CYS (7.67), implying the higher Cd availability in CPS.
The AF values of bulk soils (Table 2) may reflect their overall Cd availability to plants, which are closely associated with those in various-sized aggregates for a specific soil type. For the native soils, higher AF values were found for microaggregate in NPS (49.25% versus 44.10%), both microaggregate and silt-clay aggregate in APS (65.05% and 65.05% versus 48.77%), and silt-clay aggregates in CPS 37.08% versus 26.02%) and CYS (23.35% versus 20.94%), respectively, as compared to the corresponding bulk soils. Upon exogenous Cd addition, only microaggregates in APS and NPS maintained higher AF values (39.12%-50.06%, 43.83%-49.47%) than bulk soil (38.43%-51.25%, 39.93%-43.37% ), which was consistent with the pattern observed in native soil. Higher AF values in aggregates over bulk soils imply that these aggregates may have higher contribution to the Cd availability of the bulk soils. For calcareous soils (CPS and CYS), the AF values in all aggregates are lower than those for APS and NPS, and are comparable to the bulk soils, suggesting that the contributions of aggregates to the Cd availability in CPS and CYS might mainly rely on their total Cd loads in each aggregate.
3.5. The Fractionation of Cd in Soil Aggregates
The extractability of heavy metals in soil or its aggregates are closely relevant to their occurring states [9]. Figure 5 illustrates the Cd fractionations in different aggregates of the tested soils (detailed data in Appendix Table A1). The Cd recovery rates for sequential fractionation varied between 82-116%, matching the analytical quality requirement.
In the test soils, the Cd in aggregates mainly exists as exchangeable (Ex-Cd), Fe and Mn bound (Fe/Mn-Cd) and residual forms (Res-Cd), and the carbonate-associated Cd (CA-Cd) and organic matter-bound Cd (OA-Cd) only account for 0%-2 % and 6%-12% respective in native soils, though the percentage of OA-Cd is increased to 5%-23% upon exogenous Cd added. Allocation of Cd in aggregates mainly varies among Ex-Cd, Fe/Mn-Cd and Res-Cd, and CA-Cd and OA-Cd are less variated regardless of Cd addition. In native soils, Ex-Cd fraction exhibited a significant pH-dependent decrease across all aggregate sizes (p<0.05), with acidic purple soil (APS) having the highest proportion (32% in silt-clay aggregates). Notably, calcareous soils (CPS and CYS) showed a distinct size-dependent attenuation of Ex-Cd, where macroaggregates (>2 mm) contained 40-50% lower Ex-Cd than silt-clay aggregates (<0.053 mm). The content distribution trend of Ex-Cd among various-sized aggregates was in accordance with the Cd activity percentage (AF) in aggregates as mentioned above. Following exogenous Cd introduction, two contrasting patterns emerged: (1)microaggregates in two kinds of purple soils (APS and NPS; pH <7.5) exhibited the lowest Ex-Cd concentrations. Whereas (2) Ex-Cd contents followed the same size-dependent pattern in the aggregates for the two calcareous soils (CPS and CYS; pH >7.5), where Ex-Cd content progressively decreased with increasing aggregate size. For the Fe/Mn oxide-bound Cd (Fe/Mn-Cd) fraction, the relative distribution patterns across different aggregate sizes remained consistent with those in the native soils after exogenous Cd introduction. However, a significant increase in its proportion was observed compared to the native soils, exhibiting the following characteristics: it ranged from 9 to 31% on acidic purple soils, 17% to 44% in neutral purple soils, and 5% to 26% on calcareous purple soils. Notably, Fe/Mn-Cd dominated across all aggregate fractions in calcareous yellow soil (CYS), representing the dominant Cd species. This distribution pattern can be attributed to the abundant Fe/Mn oxides in calcareous systems, which provide substantial sorption sites through their high density of negative surface charges and large specific surface areas. These physicochemical properties facilitate the formation of Fe/Mn oxide-bound complexes, as demonstrated by spectroscopic evidence [25,26]. These distribution patterns were strongly correlated with both T-Cd and HCl-Cd pools
3.6. Cd Contamination on Ryegrass Growth
Figure 6 illustrates the height and aboveground biomass of ryegrass under different Cd levels. The response of ryegrass growth to Cd stress differs with soil types. In NPS, Cd exposure significantly stimulates the growth of ryegrass, the aboveground biomass and the plant height are increased by 36.49-44.94% and 9.13-14.62%, respectively, as compared to the control. In APS and CPS, ryegrass growth showed minor variations in biomass and plant height with Cd addition, no statistically significant differences (p > 0.05) exist relative to the control. Conversely, in CYS, Cd exposure caused significant growth inhibition, especially at 2 mg·kg-1 Cd, plant height decreased by 36.85%, and the aboveground biomass declined to 63.14% of control levels.
3.7. Accumulation of Cd in Ryegrass
The uptake and accumulation of heavy metals in plant are the final indicators reflecting their bioavailability in soils. Contents of target heavy metals in plants are the most concern regarding to the food security. Figure 7 presents the Cd contents in aboveground and belowground parts (roots). It shows that Cd contents in both parts increased nearly linearly with soil Cd levels, with Cd content in the aboveground part being systematically higher than that in roots. At a specific soil Cd level, Cd contents in both parts show a clear soil type-dependent, following a sequence of APS>NPS>CPS in purple soils. Notably, for the two calcareous soils (CPS and CYS), the Cd accumulated in ryegrass plant in CPS is consistently higher than that in CYS. The pH-dependent Cd accumulation pattern as well as the difference of Cd accumulation in ryegrass plant between calcareous purple soil and yellow soil are well corresponded to the availability of Cd as evaluated by HCl extraction as described in the previous sections. The results prove that (1) HCl extraction could be well adapted for the evaluation of soil Cd availability, (2) soil pH is crucial to Cd bioavailability but not the solely factor controlling Cd bioavailability, similar pH in different soil type may result in different plant accumulation.
3.8. Ryegrass Cd Accumulation in Relation to Cd States in Soil Aggregates
To further reveal the roles of soil aggregates in regulating the Cd bioavailability to plants, determine the critical elements influencing Cd distribution, it is important to comprehend the relationship between cadmium uptake in ryegrass (Plant-Cd) and the T-Cd and HCl-Cd content across aggregate size fractions. As shown in Table 4, microaggregates (0.053-0.25 mm) in native soils exhibited a strong positive correlation between Plant-Cd and T-Cd (r = 0.703, p < 0.05), whereas macroaggregates (>0.25 mm) showed an exceptionally strong negative correlation (r = -0.990, p < 0.01). Following exogenous Cd addition, T-Cd content in microaggregates has a very significant positive correlation with Plant-Cd, in macroaggregates has a strong negative correlation, and the correlation of other particle size aggregates remained non-significant. As shown in Table 5, the HCl-Cd content exhibited highly significant correlations (p < 0.01) with silt-clay aggregates (<0.053 mm) and significant correlations (p < 0.05) with microaggregates in both native and exogenous Cd-contaminated soils. These results identify silt-clay, microaggregates, and macroaggregates as the key fractions controlling Cd bioavailability.
T-Cd in microaggregate on APS and NPS and in macroaggregate on CPS and CYS all are the smallest content, but it has the best correlation with plant absorption in both native and exogenous Cd-contaminated soils. This compelling evidence establishes aggregate size - rather than mass - as the primary determinant of Cd bioavailability. Notably, the HCl-Cd content in silt-clay aggregates consistently exhibited the highest extraction efficiency among all four soil types and demonstrated a significant positive correlation with plant Cd uptake (p < 0.01). This finding further confirms that more phytoavailable Cd tends to accumulate in finer particle fractions, which aligns with previously reported experimental patterns. The fine-sized aggregates (silt-clay and microaggregates) typically exhibit higher specific surface area and greater abundance of variable charge sites, which facilitate continuous Cd release through ion exchange processes. This phenomenon can be further enhanced by low-molecular-weight organic acids that promote Cd desorption, consequently increasing Cd bioavailability. In contrast, macroaggregates possess well-developed pore structures (>30 μm) that physically encapsulate heavy metals within their core through a “shielding effect”. This mechanism not only impedes direct root contact with heavy metals but also restricts the “activation” of metals by root exudates. Furthermore, macroaggregates generally contain higher concentrations of Fe/Mn oxides, organic matter, and mineral components. These constituents can immobilize Cd through specific adsorption or form stable complexes/mineral-bound fractions, ultimately reducing heavy metal uptake by plants. Overall, these findings confirm that aggregate size governs Cd mobility and bioavailability in soil-plant systems.
4. Conclusion
Our systematic investigation reveals soil pH and aggregate particle size as pivotal determinants governing Cd distribution dynamics and bioavailability in soil systems. A distinct pH-dependent pattern was identified, whereby microaggregates (0.053-0.25 mm) exhibited minimal Cd retention in acidic soils (APS/NPS; pH<7.5), but became primary Cd reservoirs in alkaline environments (CPS/CYS; pH>7.5). Notably, silt-clay aggregates in acidic soils display a superior affinity for exogenous Cd across the measured parameters (T-Cd, HCl-Cd, and Ex-Cd); microaggregates paradoxically achieve peak Cd activity fractions (AF). Pot experiments further validated these observations, revealing significant positive correlations between ryegrass Cd uptake and both HCl-Cd in silt-clay aggregates and T-Cd in microaggregates, whereas macroaggregates (1-2 mm) were negatively correlated with Cd uptake. These trends collectively indicate that aggregate size, rather than total Cd content alone, plays a dominant role in regulating Cd bioavailability. Our results establish a mechanistic framework for developing remediation strategies, highlighting the critical roles of fine-sized aggregates (silt-clay and microaggregates) and macroaggregate (1-2 mm) management in controlling cadmium transfer across different soil types to mitigate food chain contamination.
Author Contributions
Con-ceptualization, Ying Chen and Shiqiang Wei; methodology, Ying Chen; data curation, Ying Chen, Ya Zhang, and Hanqing Li; writing—original draft preparation, Ying Chen; writing—review and editing, Ying Chen and Shiqiang Wei; funding acquisition, Shiqiang Wei. All authors have read and agreed to the published version of the manuscript.
Funding
This research was funded by the National Natural Science Foundation of China (grant number 42177012).
Data Availability Statement
No data was used for the research described in the article.
Conflicts of Interest
The authors declared that they have no conflicts of interest in this work. We declare that we do not have any commercial or associative interest that represents a conflict of interest in connection with the work submitted.
Appendix

Table A1.
The contents and recovery of each morphometric of Cd in soil aggregates with varying particle sizes.
Table A1.
The contents and recovery of each morphometric of Cd in soil aggregates with varying particle sizes.
| Soil type (CK) | Particle size (mm) |
Ex-Cd (mg·kg-1) | CA-Cd (mg·kg-1) | Fe/Mn-Cd (mg·kg-1) | OM-Cd (mg·kg-1) | Res-Cd (mg·kg-1) | Rate of recovery (%) |
|---|---|---|---|---|---|---|---|
| APS | <0.053 | 0.0213 | 0.0006 | 0.0227 | 0.0052 | 0.0187 | 94 |
| 0.053-0.25 | 0.0173 | 0.0006 | 0.0145 | 0.0031 | 0.0285 | 88 | |
| 0.25-0.5 | 0.0204 | 0.0019 | 0.0201 | 0.0065 | 0.0449 | 107 | |
| 0.5-1 | 0.0203 | 0.0004 | 0.0285 | 0.0077 | 0.0346 | 93 | |
| 1-2 | 0.0193 | 0.0002 | 0.0221 | 0.0058 | 0.0202 | 82 | |
| NPS | <0.053 | 0.0212 | 0.0000 | 0.0255 | 0.0036 | 0.0309 | 88 |
| 0.053-0.25 | 0.0189 | 0.0001 | 0.0145 | 0.0019 | 0.0494 | 113 | |
| 0.25-0.5 | 0.0191 | 0.0001 | 0.0169 | 0.0043 | 0.0302 | 103 | |
| 0.5-1 | 0.0202 | 0.0002 | 0.0152 | 0.0014 | 0.0338 | 87 | |
| 1-2 | 0.0201 | 0.0000 | 0.0192 | 0.0041 | 0.0488 | 118 | |
| CYS | <0.053 | 0.0147 | 0.0000 | 0.0362 | 0.0080 | 0.0419 | 116 |
| 0.053-0.25 | 0.0080 | 0.0000 | 0.0561 | 0.0112 | 0.0214 | 101 | |
| 0.25-0.5 | 0.0133 | 0.0000 | 0.0433 | 0.0077 | 0.0308 | 112 | |
| 0.5-1 | 0.0123 | 0.0000 | 0.0214 | 0.0081 | 0.0360 | 105 | |
| 1-2 | 0.0083 | 0.0000 | 0.0420 | 0.0091 | 0.0196 | 106 | |
| CPS | <0.053 | 0.0266 | 0.0002 | 0.0263 | 0.0102 | 0.0208 | 109 |
| 0.053-0.25 | 0.0204 | 0.0002 | 0.0177 | 0.0085 | 0.0511 | 105 | |
| 0.25-0.5 | 0.0354 | 0.0002 | 0.0211 | 0.0079 | 0.0244 | 111 | |
| 0.5-1 | 0.0290 | 0.0002 | 0.0243 | 0.0050 | 0.0217 | 100 | |
| 1-2 | 0.0237 | 0.0002 | 0.0129 | 0.0010 | 0.0295 | 96 | |
| Soil type (Cd2) | Particle size (mm) |
Ex-Cd (mg·kg-1) | CA-Cd (mg·kg-1) | Fe/Mn-Cd (mg·kg-1) | OM-Cd (mg·kg-1) | Res-Cd (mg·kg-1) | Rate of recovery (%) |
| APS | <0.053 | 0.0890 | 0.0008 | 0.1348 | 0.0103 | 0.0587 | 98 |
| 0.053-0.25 | 0.0839 | 0.0008 | 0.1121 | 0.0095 | 0.0729 | 112 | |
| 0.25-0.5 | 0.0868 | 0.0008 | 0.1528 | 0.0180 | 0.0334 | 102 | |
| 0.5-1 | 0.0827 | 0.0008 | 0.1062 | 0.0150 | 0.0401 | 88 | |
| 1-2 | 0.0759 | 0.0009 | 0.0904 | 0.02119 | 0.0246 | 83 | |
| NPS | <0.053 | 0.0670 | 0.0006 | 0.1466 | 0.0506 | 0.0394 | 101 |
| 0.053-0.25 | 0.0636 | 0.0006 | 0.1605 | 0.0148 | 0.0244 | 102 | |
| 0.25-0.5 | 0.0646 | 0.0006 | 0.1471 | 0.0205 | 0.0294 | 94 | |
| 0.5-1 | 0.0419 | 0.0006 | 0.1043 | 0.0426 | 0.0272 | 83 | |
| 1-2 | 0.0583 | 0.0005 | 0.1014 | 0.0282 | 0.0238 | 88 | |
| CYS | <0.053 | 0.0435 | 0.0003 | 0.1804 | 0.0271 | 0.0414 | 97 |
| 0.053-0.25 | 0.0412 | 0.0004 | 0.1500 | 0.0261 | 0.0589 | 92 | |
| 0.25-0.5 | 0.0401 | 0.0004 | 0.1490 | 0.0257 | 0.0829 | 98 | |
| 0.5-1 | 0.0419 | 0.0004 | 0.1324 | 0.0203 | 0.0798 | 98 | |
| 1-2 | 0.0436 | 0.0004 | 0.1102 | 0.0129 | 0.0895 | 97 | |
| CPS | <0.053 | 0.0582 | 0.0008 | 0.1420 | 0.0199 | 0.0560 | 97 |
| 0.053-0.25 | 0.0597 | 0.0008 | 0.1481 | 0.0061 | 0.0745 | 104 | |
| 0.25-0.5 | 0.0670 | 0.0008 | 0.1138 | 0.0067 | 0.0737 | 99 | |
| 0.5-1 | 0.0552 | 0.0008 | 0.1598 | 0.0063 | 0.0579 | 14 | |
| 1-2 | 0.0553 | 0.0008 | 0.0666 | 0.0040 | 0.0594 | 86 |
References
- Gu, Y.; Wang, P.; Zhang, S.; Dai, J.; Chen, H.P.; Lombi, E.; Howard, D.L.; Van Der Ent, A.; Zhao, F.J.; Kopittke, P.M. Chemical Speciation and Distribution of Cadmium in Rice Grain and Implications for Bioavailability to Humans. Environmental Science & Technology 2020, 54, 12072–12080. [Google Scholar]
- Fattorini, L.; Ronzan, M.; Piacentini, D.; Della Rovere, F.; De Virgilio, C.; Sofo, A.; Altamura, M.M.; Falasca, G. Cadmium and arsenic affect quiescent centre formation and maintenance in Arabidopsis thaliana post-embryonic roots disrupting auxin biosynthesis and transport. Environmental and Experimental Botany 2017, 144, 37–48. [Google Scholar] [CrossRef]
- Cui, H.; Tang, S.; Huang, S.; Lei, L.; Jiang, Z.; Li, L.; Wei, S. Simultaneous mitigation of arsenic and cadmium accumulation in rice grains by foliar inhibitor with ZIF-8@Ge-132. Science of the Total Environment 2023, 860, 160307. [Google Scholar] [CrossRef] [PubMed]
- Shahid, M.; Dumat, C.; Khalid, S.; Niazi, N.K.; Antunes, P.M.C. Cadmium Bioavailability, Uptake, Toxicity and Detoxification in Soil-Plant System. In Reviews of Environmental Contamination and Toxicology; DeVoogt, P., Ed.; 2017; pp. 73–137. [Google Scholar]
- Cui, H.B.; Ma, K.Q.; Fan, Y.C.; Peng, X.H.; Mao, J.D.; Zhou, D.M.; Zhang, Z.B.; Zhou, J. Stability and heavy metal distribution of soil aggregates affected by application of apatite, lime, and charcoal. Environmental Science and Pollution Research 2016, 23, 10808–10817. [Google Scholar] [CrossRef]
- Liu, Y.-z.; Xiao, T.-f.; Xiong, Y.; Ning, Z.-p.; Shuang, Y.; Li, H.; Ma, L.; Chen, H.-y. Accumulation of Heavy Metals in Agricultural Soils and Craps from an with a High Geochemical Background of Cadmium, Southwestern China. Huanjing Kexue 2019, 40, 2877–2884. [Google Scholar] [CrossRef]
- Nursita, A.I.; Singh, B.; Lees, E. Cadmium bioaccumulation in Proisotoma minuta in relation to bioavailability in soils. Ecotoxicology and Environmental Safety 2009, 72, 1767–1773. [Google Scholar] [CrossRef]
- Zhou, J.W.; Li, Z.; Liu, M.S.; Yu, H.M.; Wu, L.H.; Huang, F.; Luo, Y.M.; Christie, P. Cadmium Isotopic Fractionation in the Soil-Plant System during Repeated Phytoextraction with a Cadmium Hyperaccumulating Plant Species. Environmental Science & Technology 2020, 54, 13598–13609. [Google Scholar] [CrossRef]
- Liu, M.X.; Han, Z.Q. Distribution and Bioavailability of Heavy Metals in Soil Aggregates from the Fenhe River Basin, China. Bulletin of Environmental Contamination and Toxicology 2020, 104, 532–537. [Google Scholar] [CrossRef]
- Zhang, Y. Study on cadmium sorption-desorption behavior on aggregates from black soil and its form distribution. 2011. [Google Scholar]
- Fang, X.; Zhong, X.; Cui, Z.; Zhang, Y.; Du, L.; Yang, Y.; Lv, J. Distribution and Remediation Techniques of Heavy Metals in Soil Aggregates Perspective: A Review. Water, Air, & Soil Pollution 2023, 234, 631. [Google Scholar] [CrossRef]
- Rabot, E.; Wiesmeier, M.; Schlüter, S.; Vogel, H.J. Soil structure as an indicator of soil functions: A review. Geoderma 2018, 314, 122–137. [Google Scholar] [CrossRef]
- Manirakiza, N.; Seker, C. EFFECTS OF NATURAL AND ARTIFICIAL AGGREGATING AGENTS ON SOIL STRUCTURAL FORMATION AND PROPERTIES—A REVIEW PAPER. Fresenius Environmental Bulletin 2018, 27, 8637–8657. [Google Scholar]
- Liu, G.N.; Wang, J.; Xue, W.; Zhao, J.B.; Wang, J.; Liu, X.H. Effect of the size of variable charge soil particles on cadmium accumulation and adsorption. Journal of Soils and Sediments 2017, 17, 2810–2821. [Google Scholar] [CrossRef]
- Zhang, H.B.; Luo, Y.M.; Makino, T.; Wu, L.H.; Nanzyo, M. The heavy metal partition in size-fractions of the fine particles in agricultural soils contaminated by waste water and smelter dust. Journal of Hazardous Materials 2013, 248, 303–312. [Google Scholar] [CrossRef] [PubMed]
- Wang, H.H.; Li, L.Q.; Wu, X.M.; Pan, G.X. Distribution of Cu and Pb in particle size fractions of urban soils from different city zones of Nanjing, China. Journal of Environmental Sciences 2006, 18, 482–487. [Google Scholar]
- Duong, C.N.; Schlenk, D.; Chang, N.I.; Kim, S.D. The effect of particle size on the bioavailability of estrogenic chemicals from sediments. Chemosphere 2009, 76, 395–401. [Google Scholar] [CrossRef]
- Acosta, J.A.; Faz, Á.; Kalbitz, K.; Jansen, B.; Martínez-Martínez, S. Heavy metal concentrations in particle size fractions from street dust of Murcia (Spain) as the basis for risk assessment. Journal of Environmental Monitoring 2011, 13, 3087–3096. [Google Scholar] [CrossRef]
- Lombi, E.; Sletten, R.S.; Wenzel, W.W. Sequentially extracted arsenic from different size fractions of contaminated soils. Water Air and Soil Pollution 2000, 124, 319–332. [Google Scholar] [CrossRef]
- Li, Z.; Wu, L.H.; Luo, Y.M.; Christie, P. Dynamics of plant metal uptake and metal changes in whole soil and soil particle fractions during repeated phytoextraction. Plant and Soil 2014, 374, 857–869. [Google Scholar] [CrossRef]
- Lu, H.P.; Zhuang, P.; Li, Z.A.; Tai, Y.P.; Zou, B.; Li, Y.W.; McBride, M.B. Contrasting effects of silicates on cadmium uptake by three dicotyledonous crops grown in contaminated soil. Environmental Science and Pollution Research 2014, 21, 9921–9930. [Google Scholar] [CrossRef]
- Liu, P.Y.; Wen, Q.L.; Li, Y.J.; Dong, C.X.; Pan, G.X. Kinetics of Specific and Non-Specific Copper Sorption on Aggregates of an Acidic Paddy Soil from the Taihu Lake Region in East China. Pedosphere 2015, 25, 37–45. [Google Scholar] [CrossRef]
- Zhang, Y.; Li, Y.; Xu, Y.; Huang, Q.; Sun, G.; Qin, X.; Wang, L. Effects of mercapto-palygorskite application on cadmium accumulation of soil aggregates at different depths in Cd-contaminated alkaline farmland. Environmental Research 2023, 216, 114448. [Google Scholar] [CrossRef] [PubMed]
- Chen, Y.; Liu, H.; Liu, N.; Jiang, Z.; Wei, S. Screening and evaluation of methods for determining the effectiveness of heavy metals Pb and Cd in agricultural soils. huanjingkexue 2021, 42, 3494–3506. [Google Scholar] [CrossRef]
- Li, Z.W.; Huang, B.; Huang, J.Q.; Chen, G.Q.; Zhang, C.; Nie, X.D.; Luo, N.L.; Yao, H.B.; Ma, W.M.; Zeng, G.M. Influence of removal of organic matter and iron and manganese oxides on cadmium adsorption by red paddy soil aggregates. Rsc Advances 2015, 5, 90588–90595. [Google Scholar] [CrossRef]
- Huang, B.; Li, Z.W.; Huang, J.Q.; Chen, G.Q.; Nie, X.D.; Ma, W.M.; Yao, H.B.; Zhen, J.M.; Zeng, G.M. Aging effect on the leaching behavior of heavy metals (Cu, Zn, and Cd) in red paddy soil. Environmental Science and Pollution Research 2015, 22, 11467–11477. [Google Scholar] [CrossRef] [PubMed]
Figure 1.
Mass distribution of aggregates with different particle sizes in four types of soil.
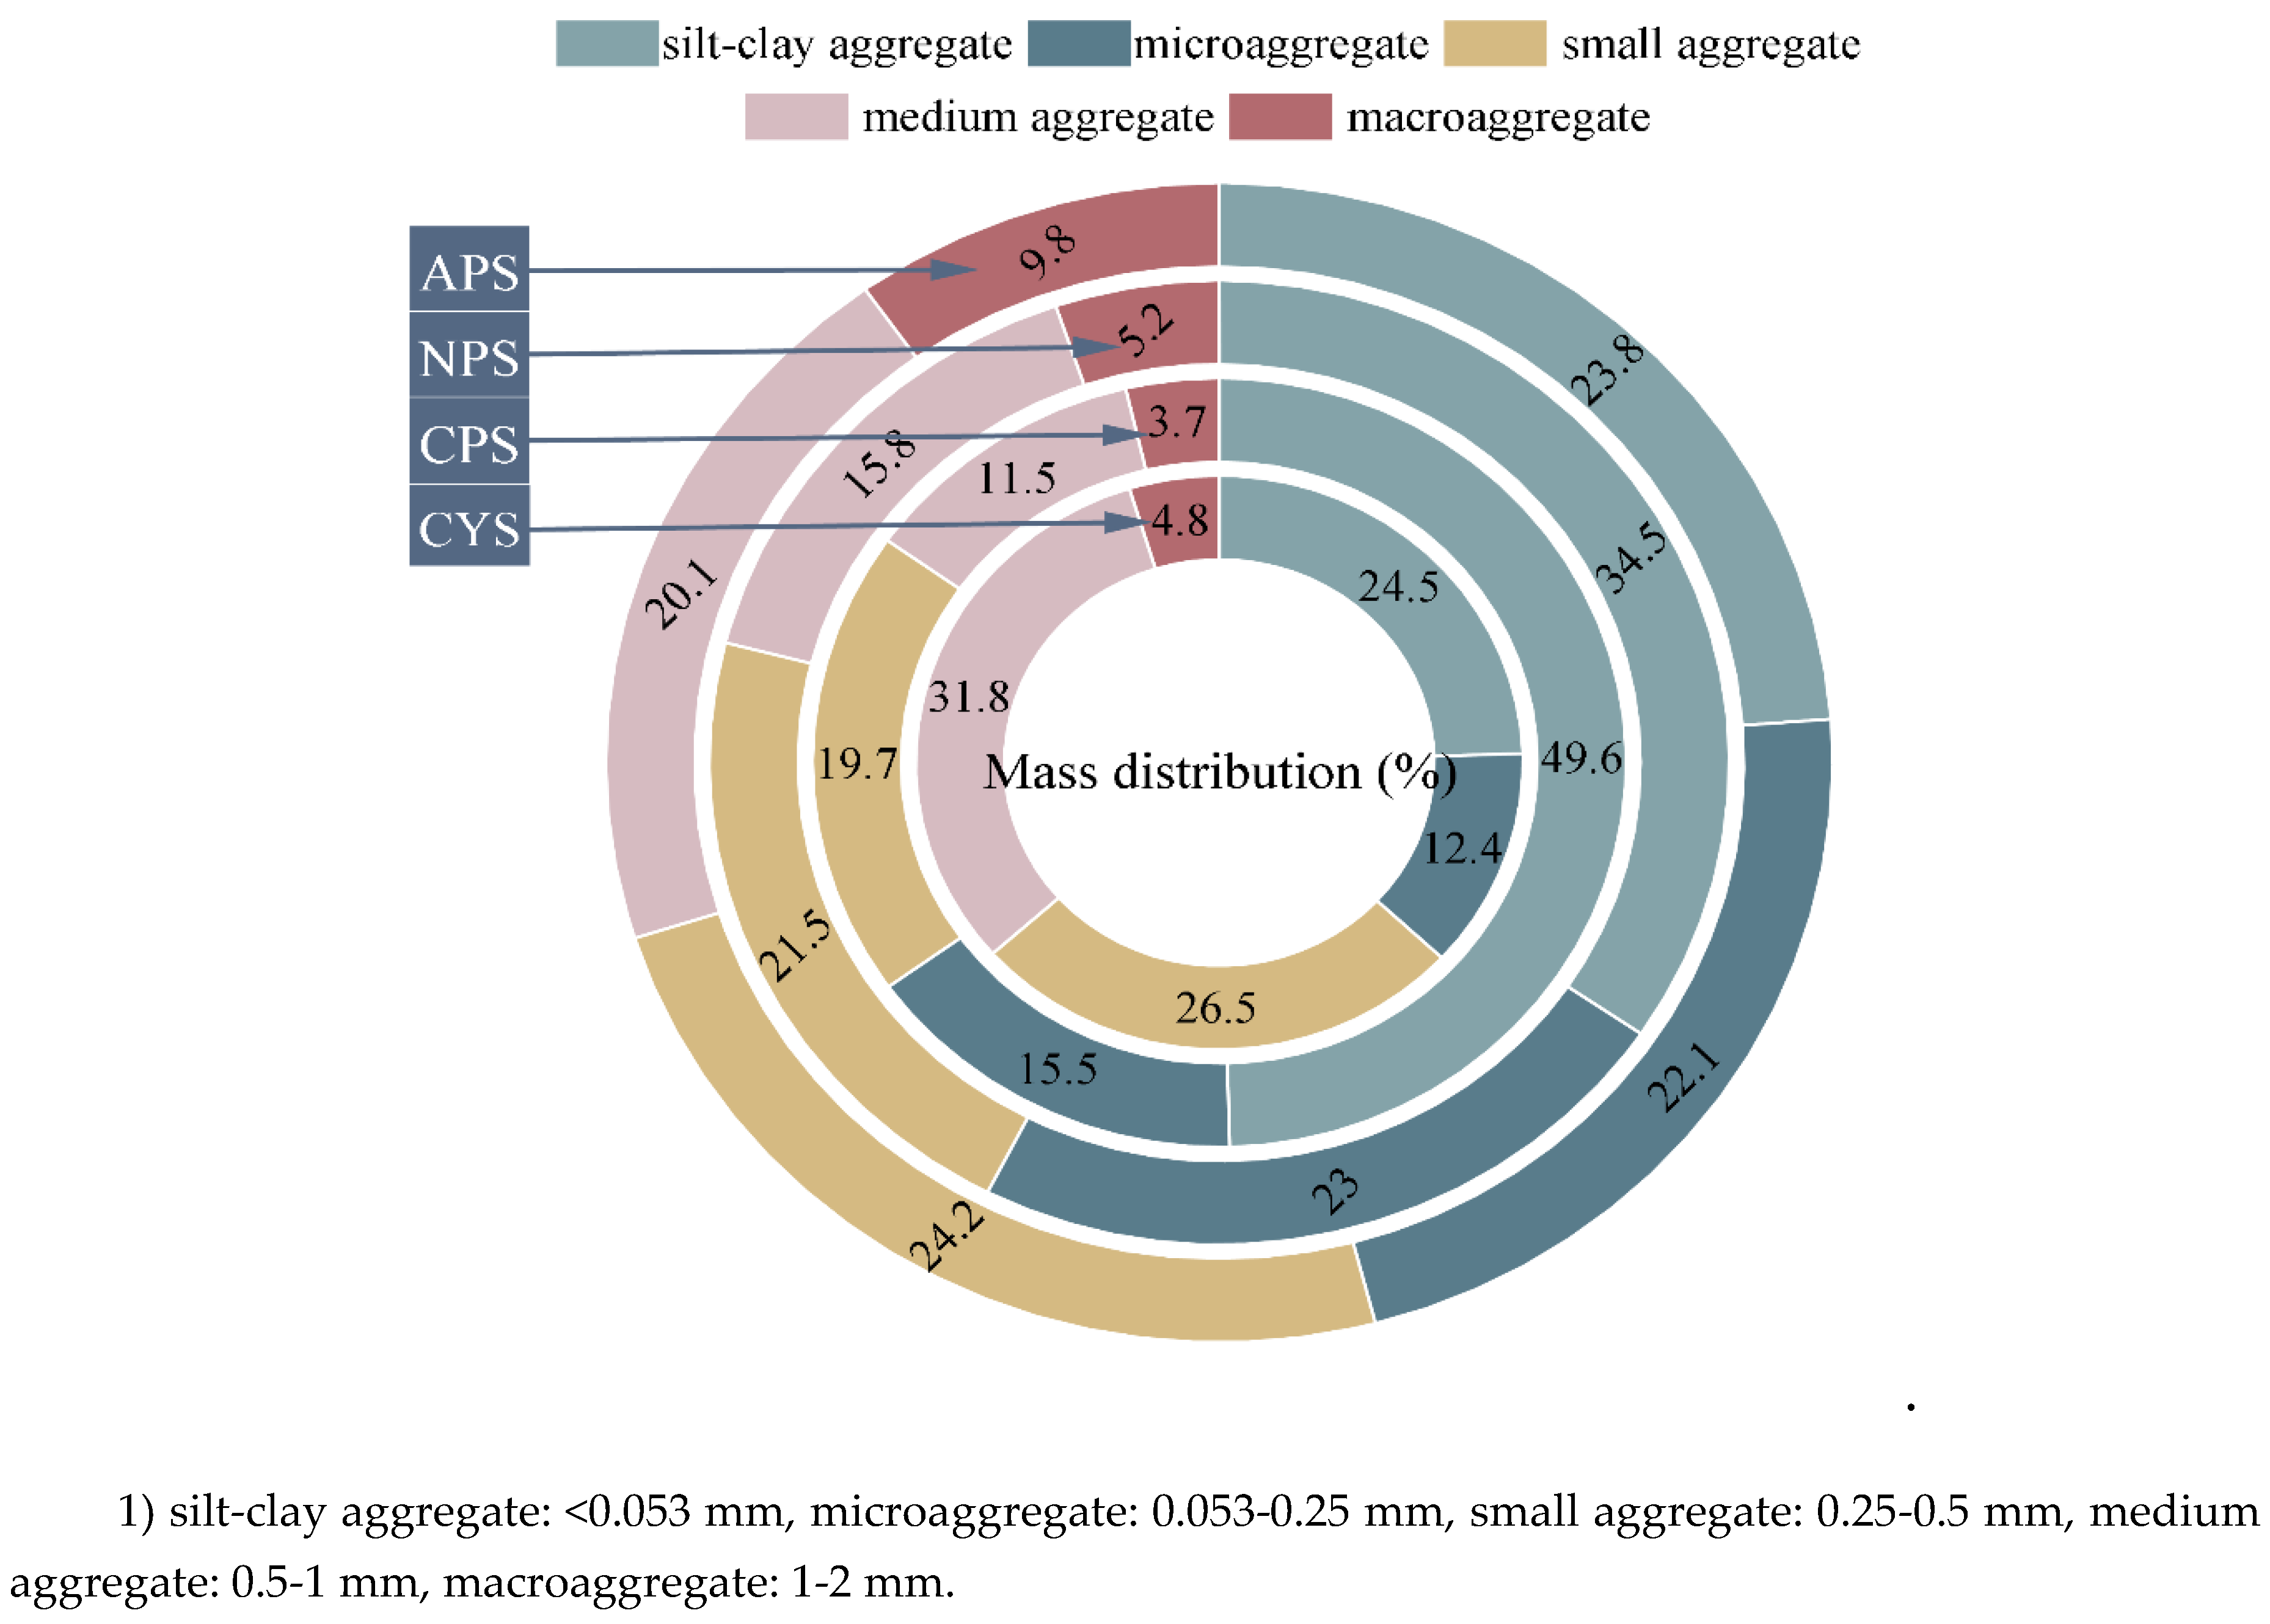
Figure 2.
The content of T-Cd in soil aggregates of different particle sizes.
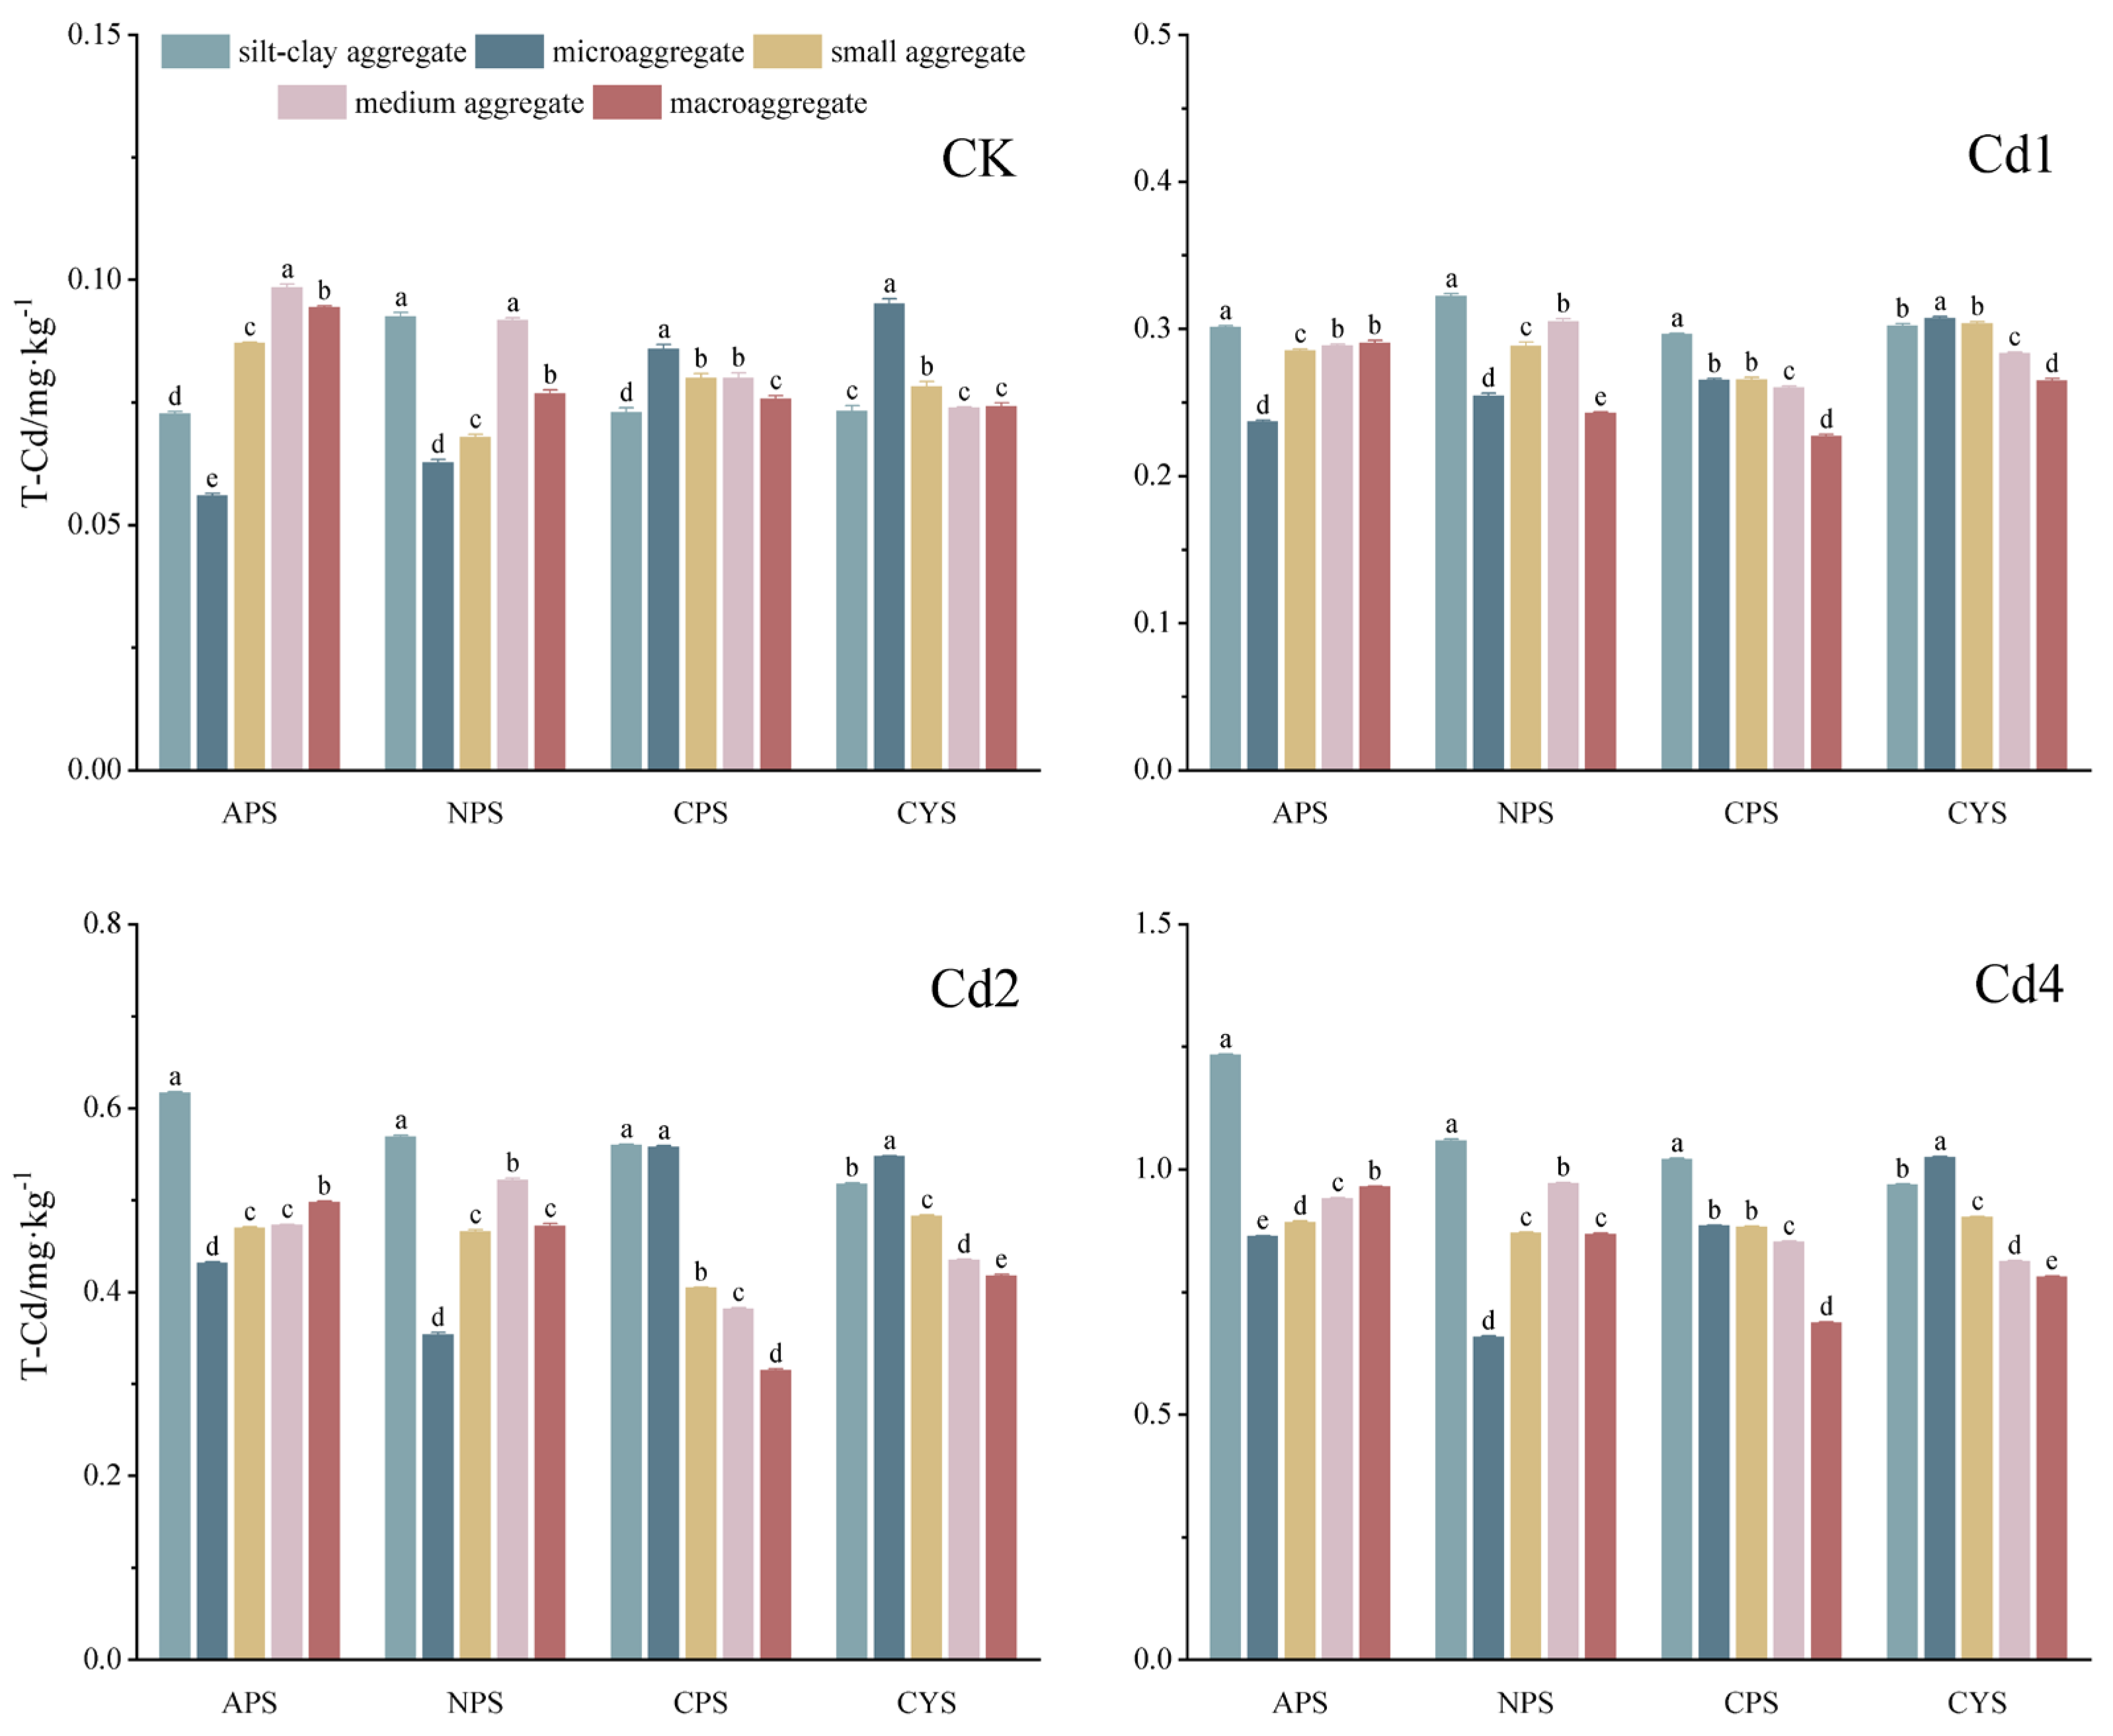
Figure 3.
Mass loading factors of Cd in soil aggregates.
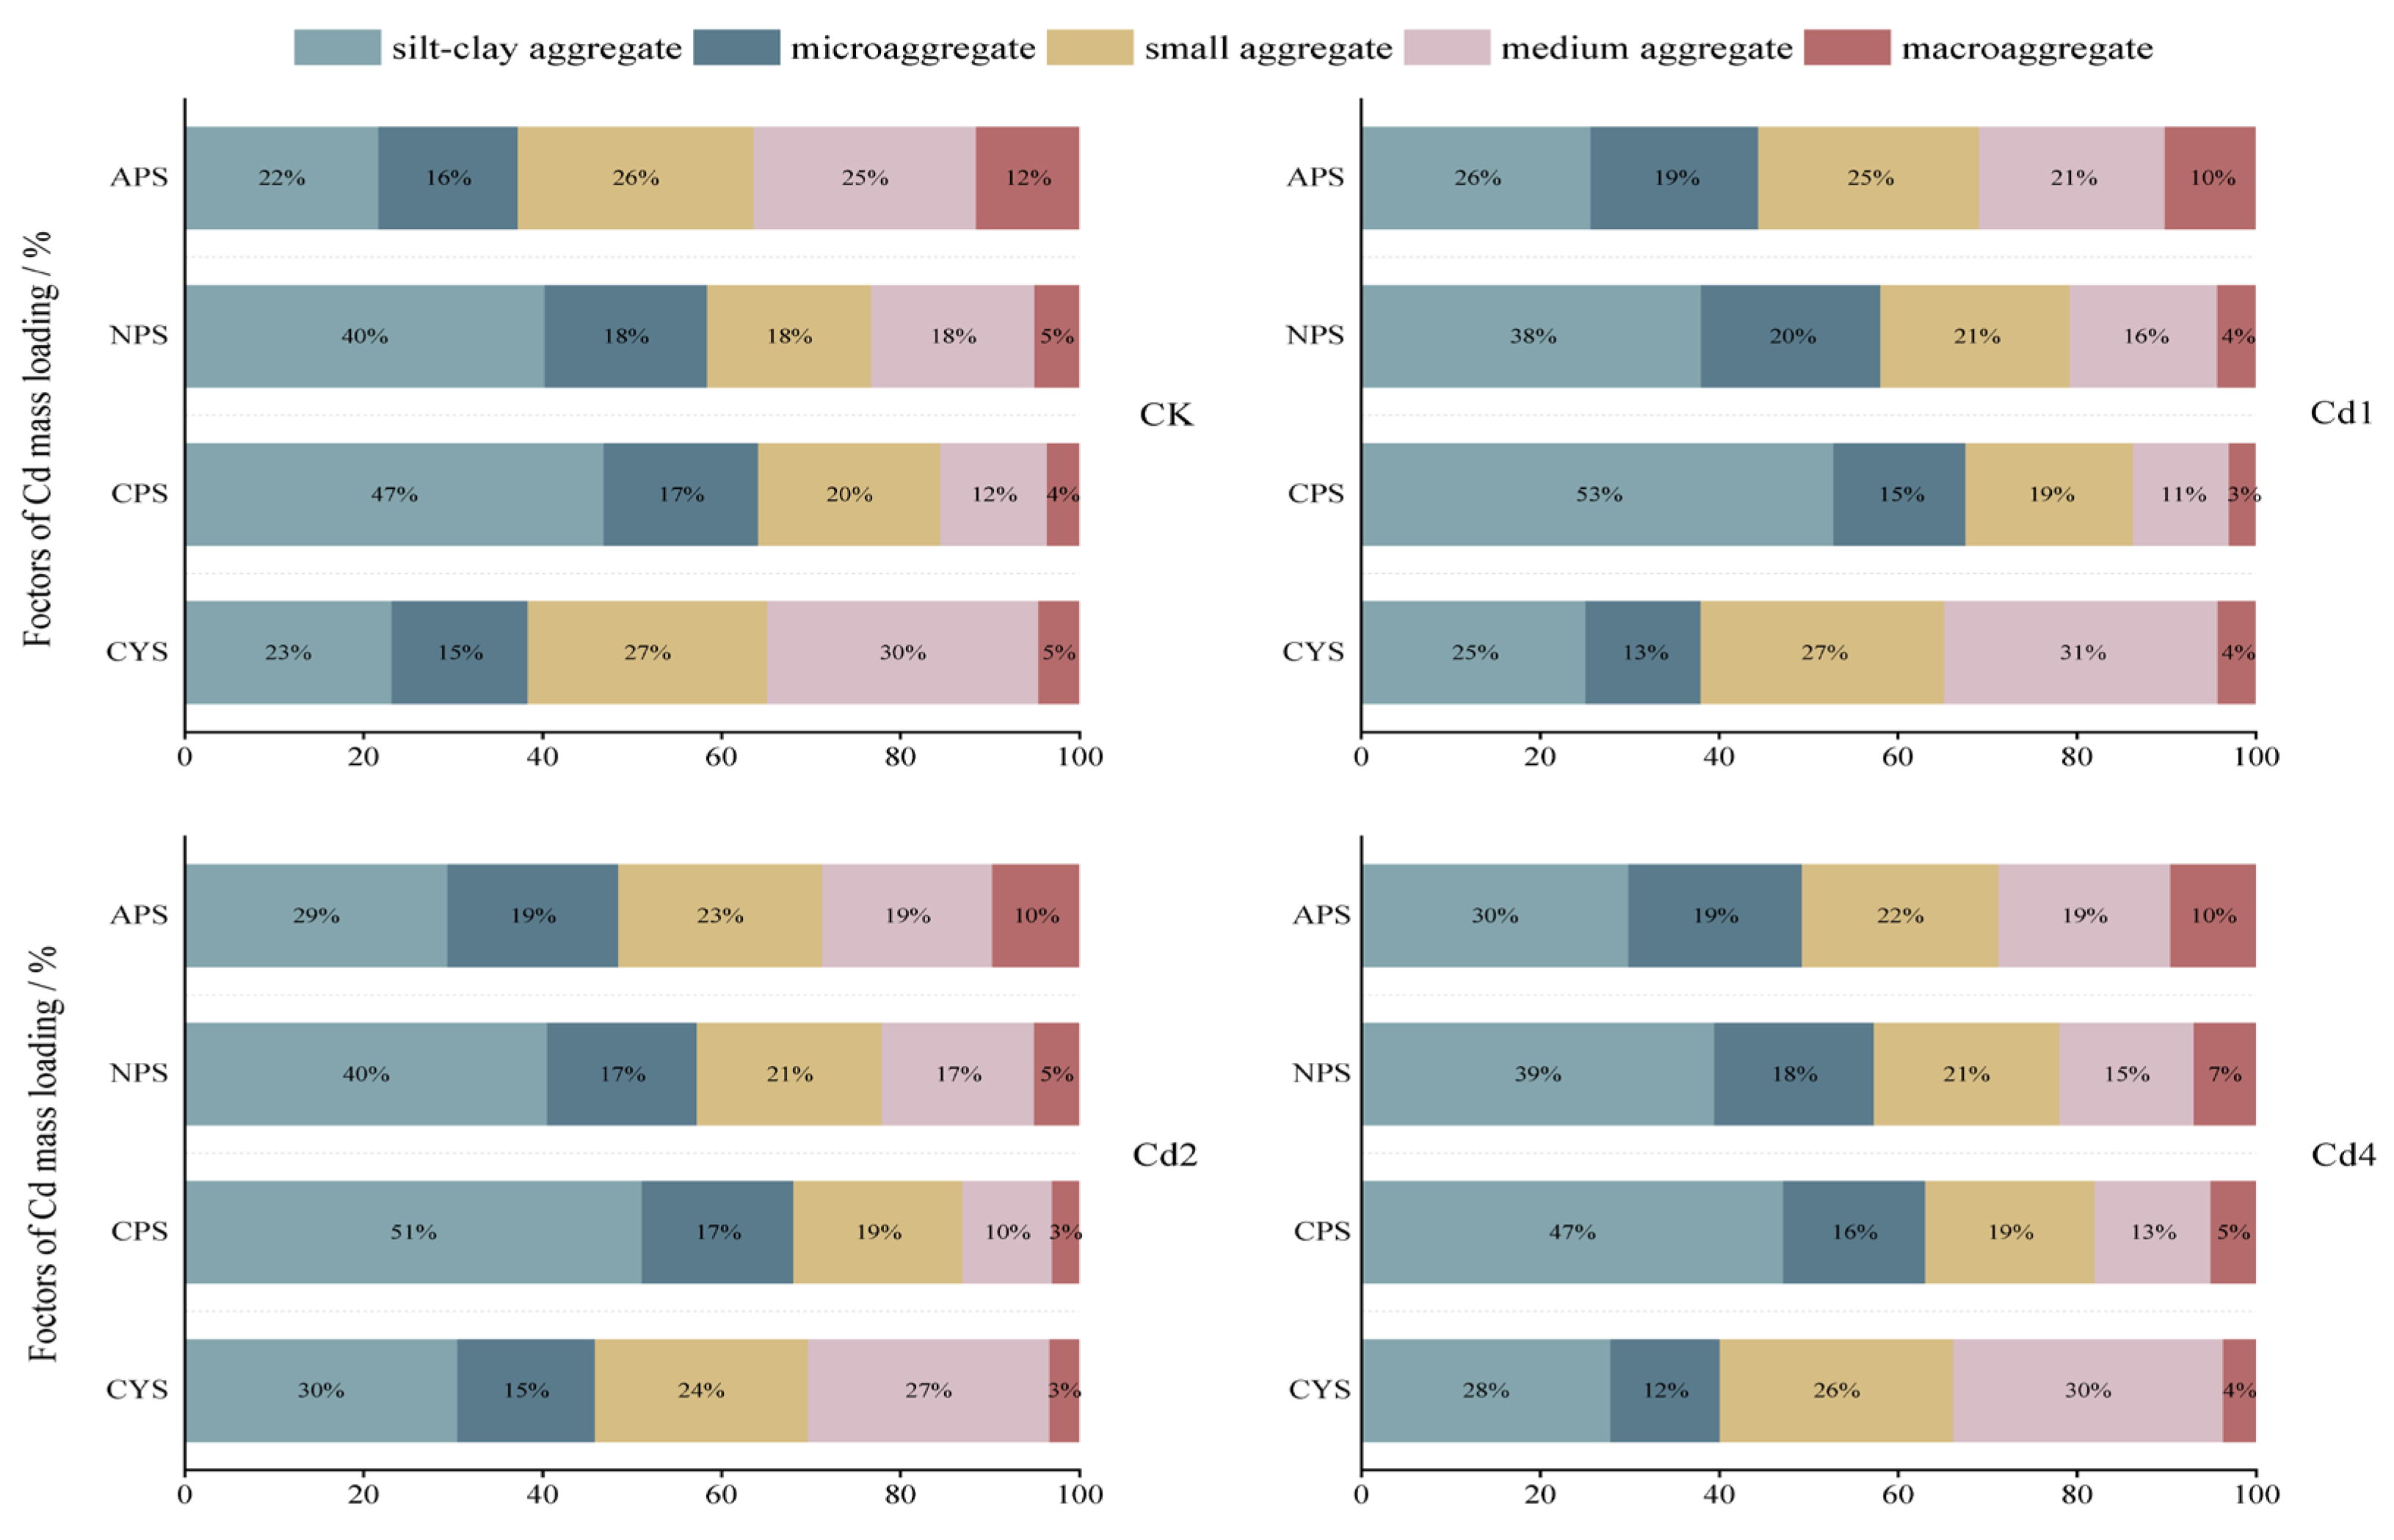
Figure 4.
The content of HCl-Cd in soil aggregates of different particle sizes.
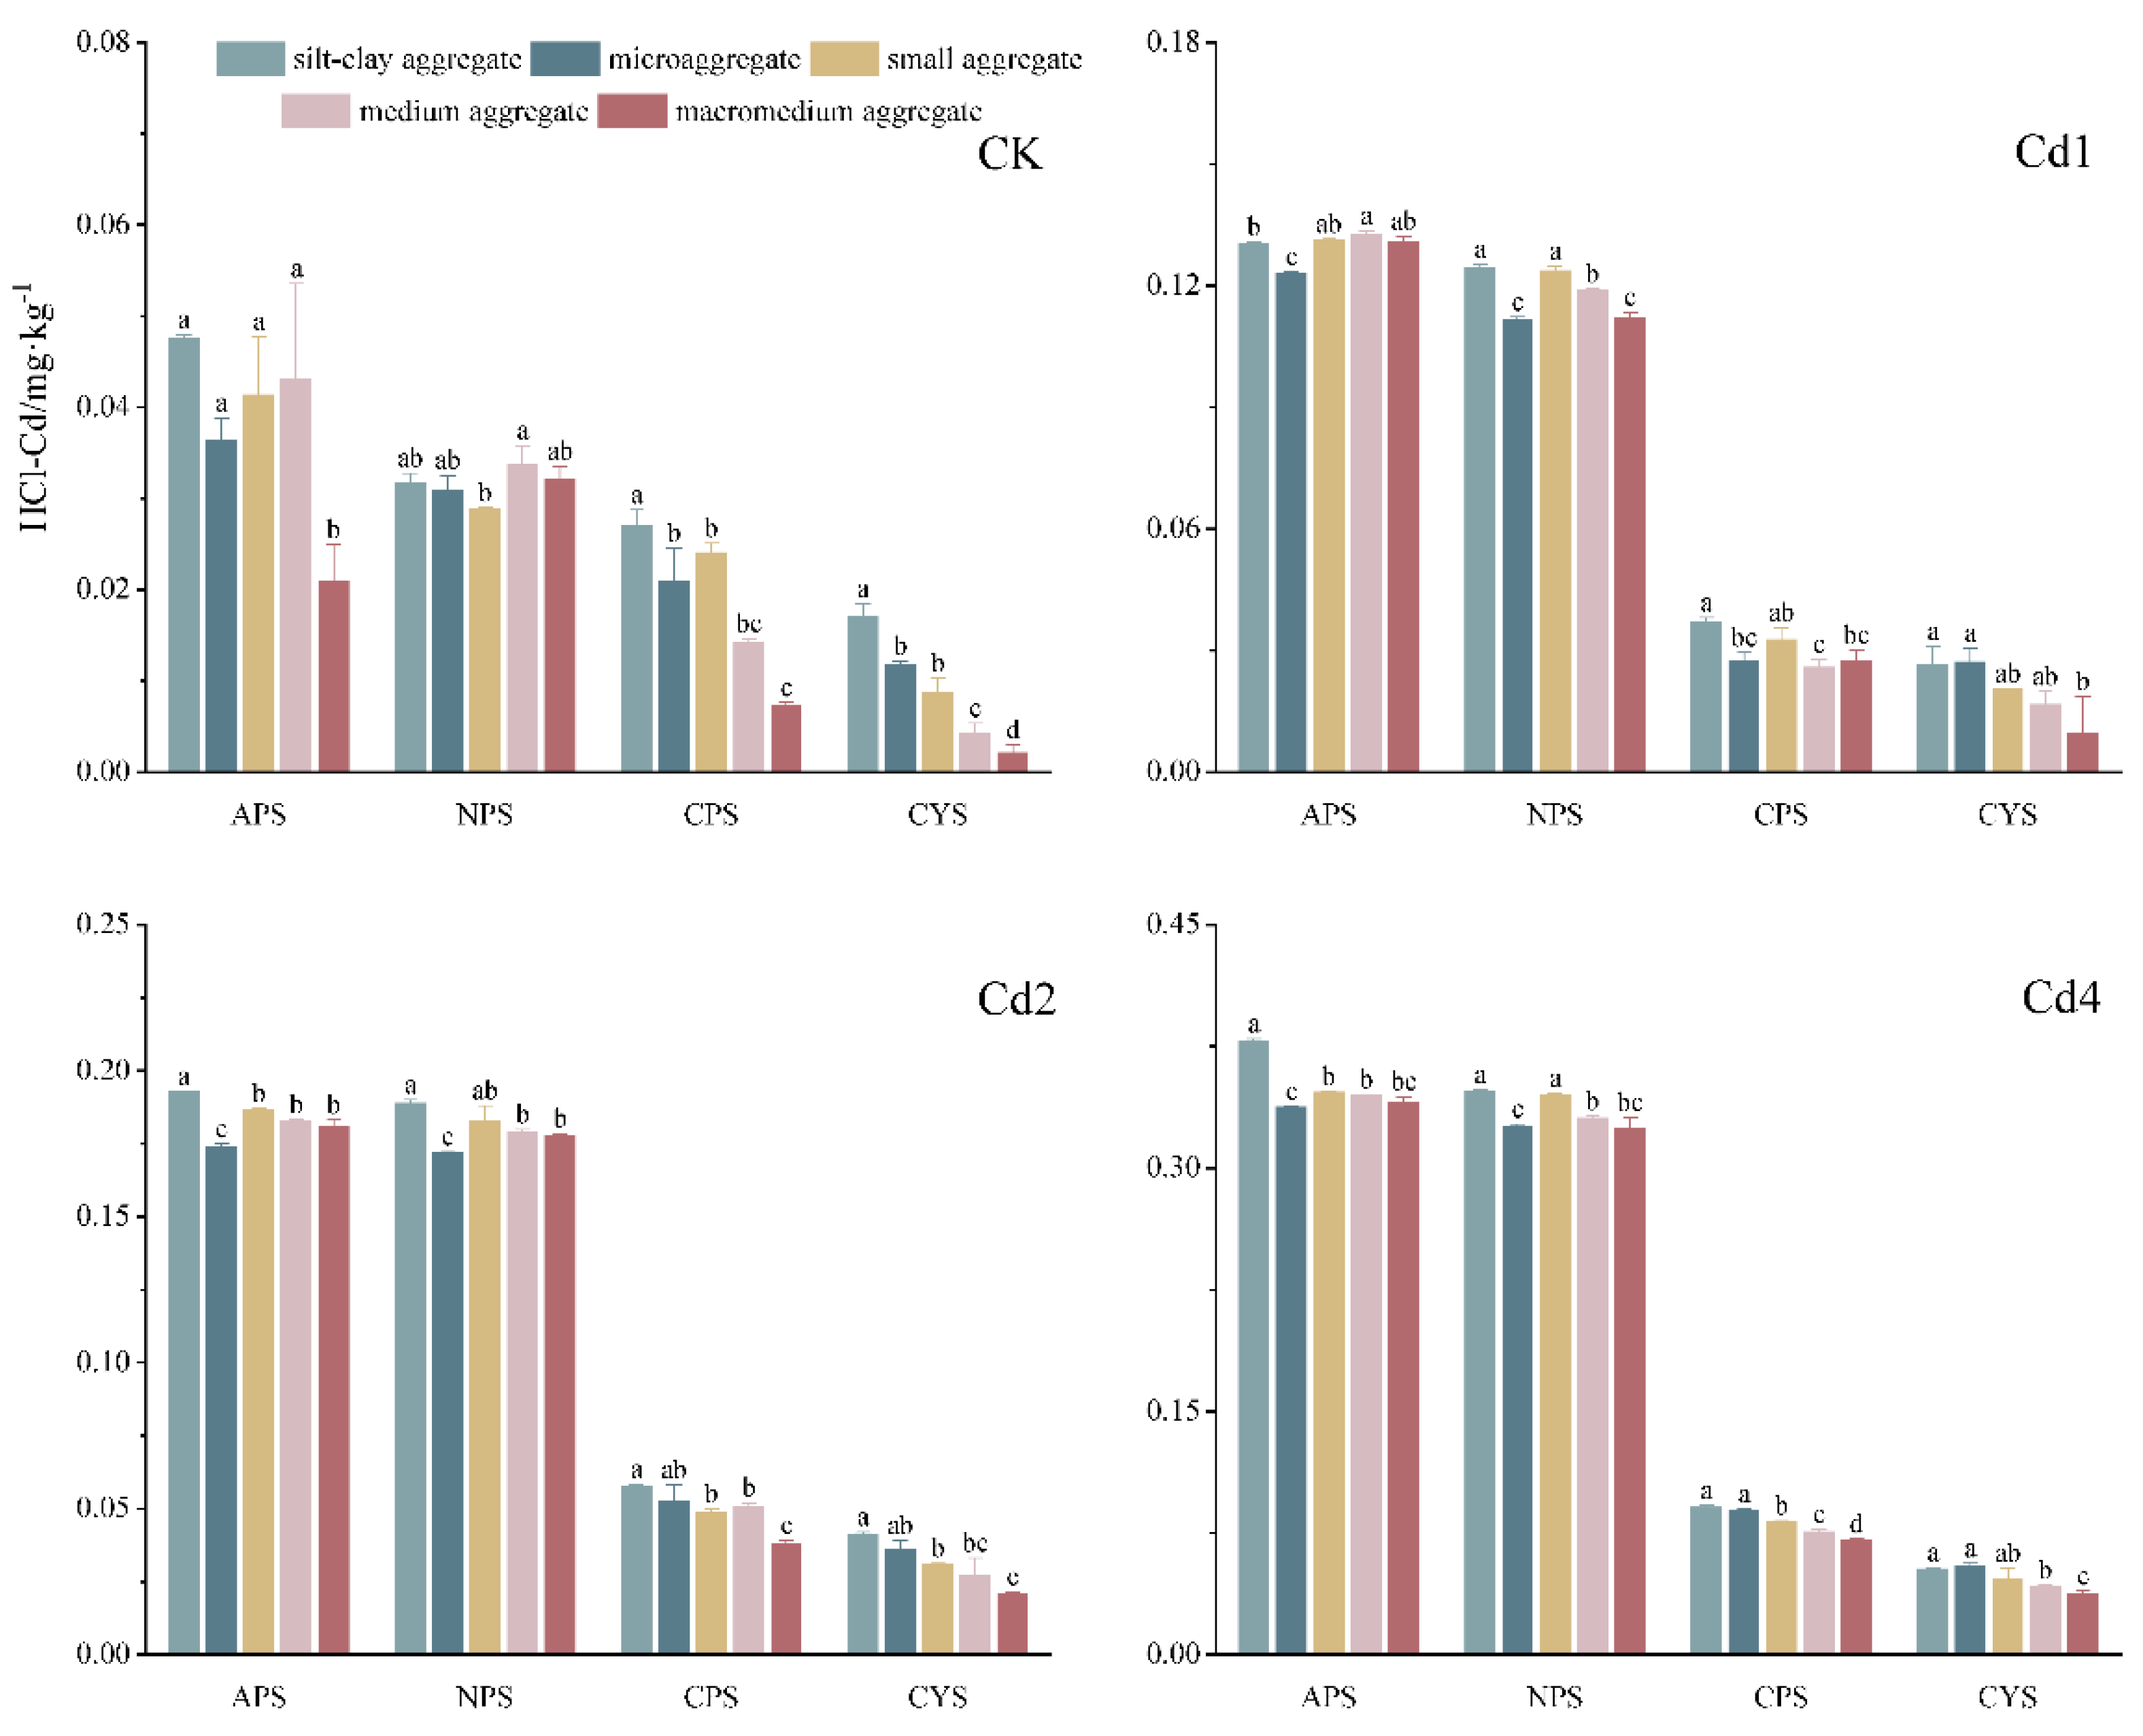
Figure 5.
The percentage of each fraction of Cd in soil aggregates with varying particle sizes. 1: Silt-clay aggregate (< 0.053 mm), 2: Microaggregate (0.053-0.25 mm), 3: Small aggregate (0.25-0.5 mm), 4: Medium aggregate (0.5-1 mm), 5: Macroaggregate (1-2 mm).
Figure 5.
The percentage of each fraction of Cd in soil aggregates with varying particle sizes. 1: Silt-clay aggregate (< 0.053 mm), 2: Microaggregate (0.053-0.25 mm), 3: Small aggregate (0.25-0.5 mm), 4: Medium aggregate (0.5-1 mm), 5: Macroaggregate (1-2 mm).
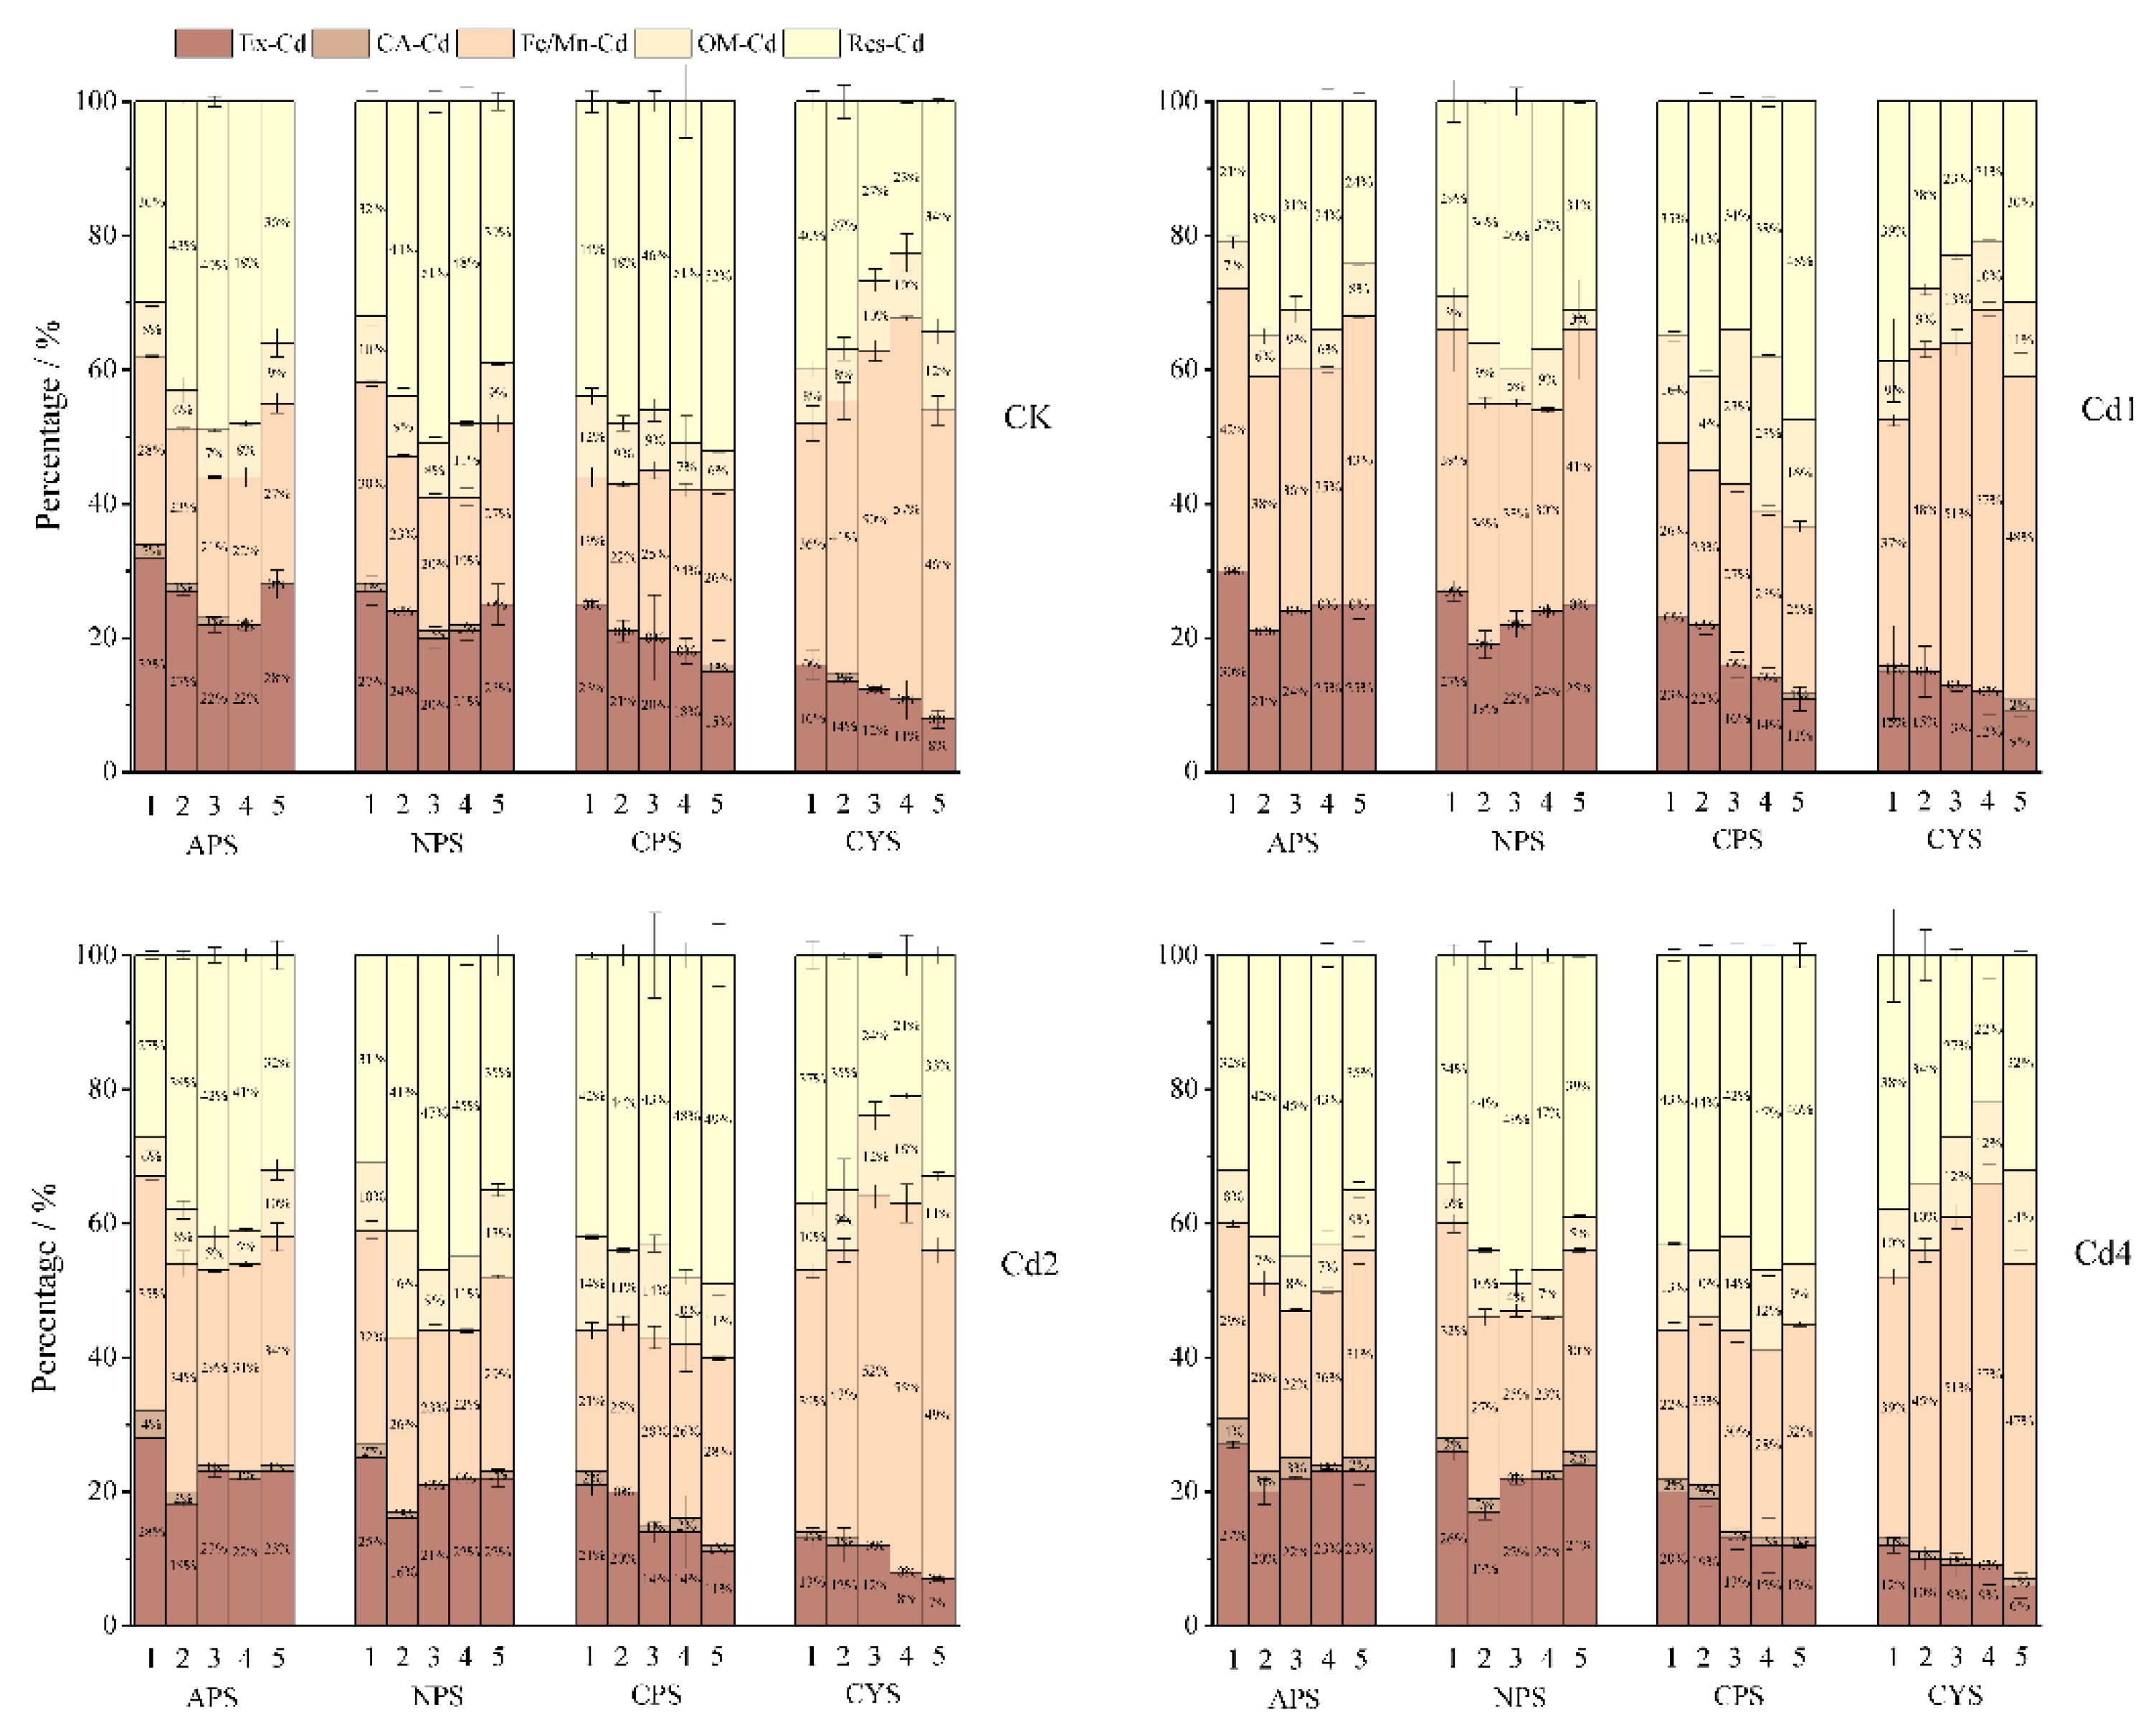
Figure 6.
Ryegrass growth indicators in different types of soils.
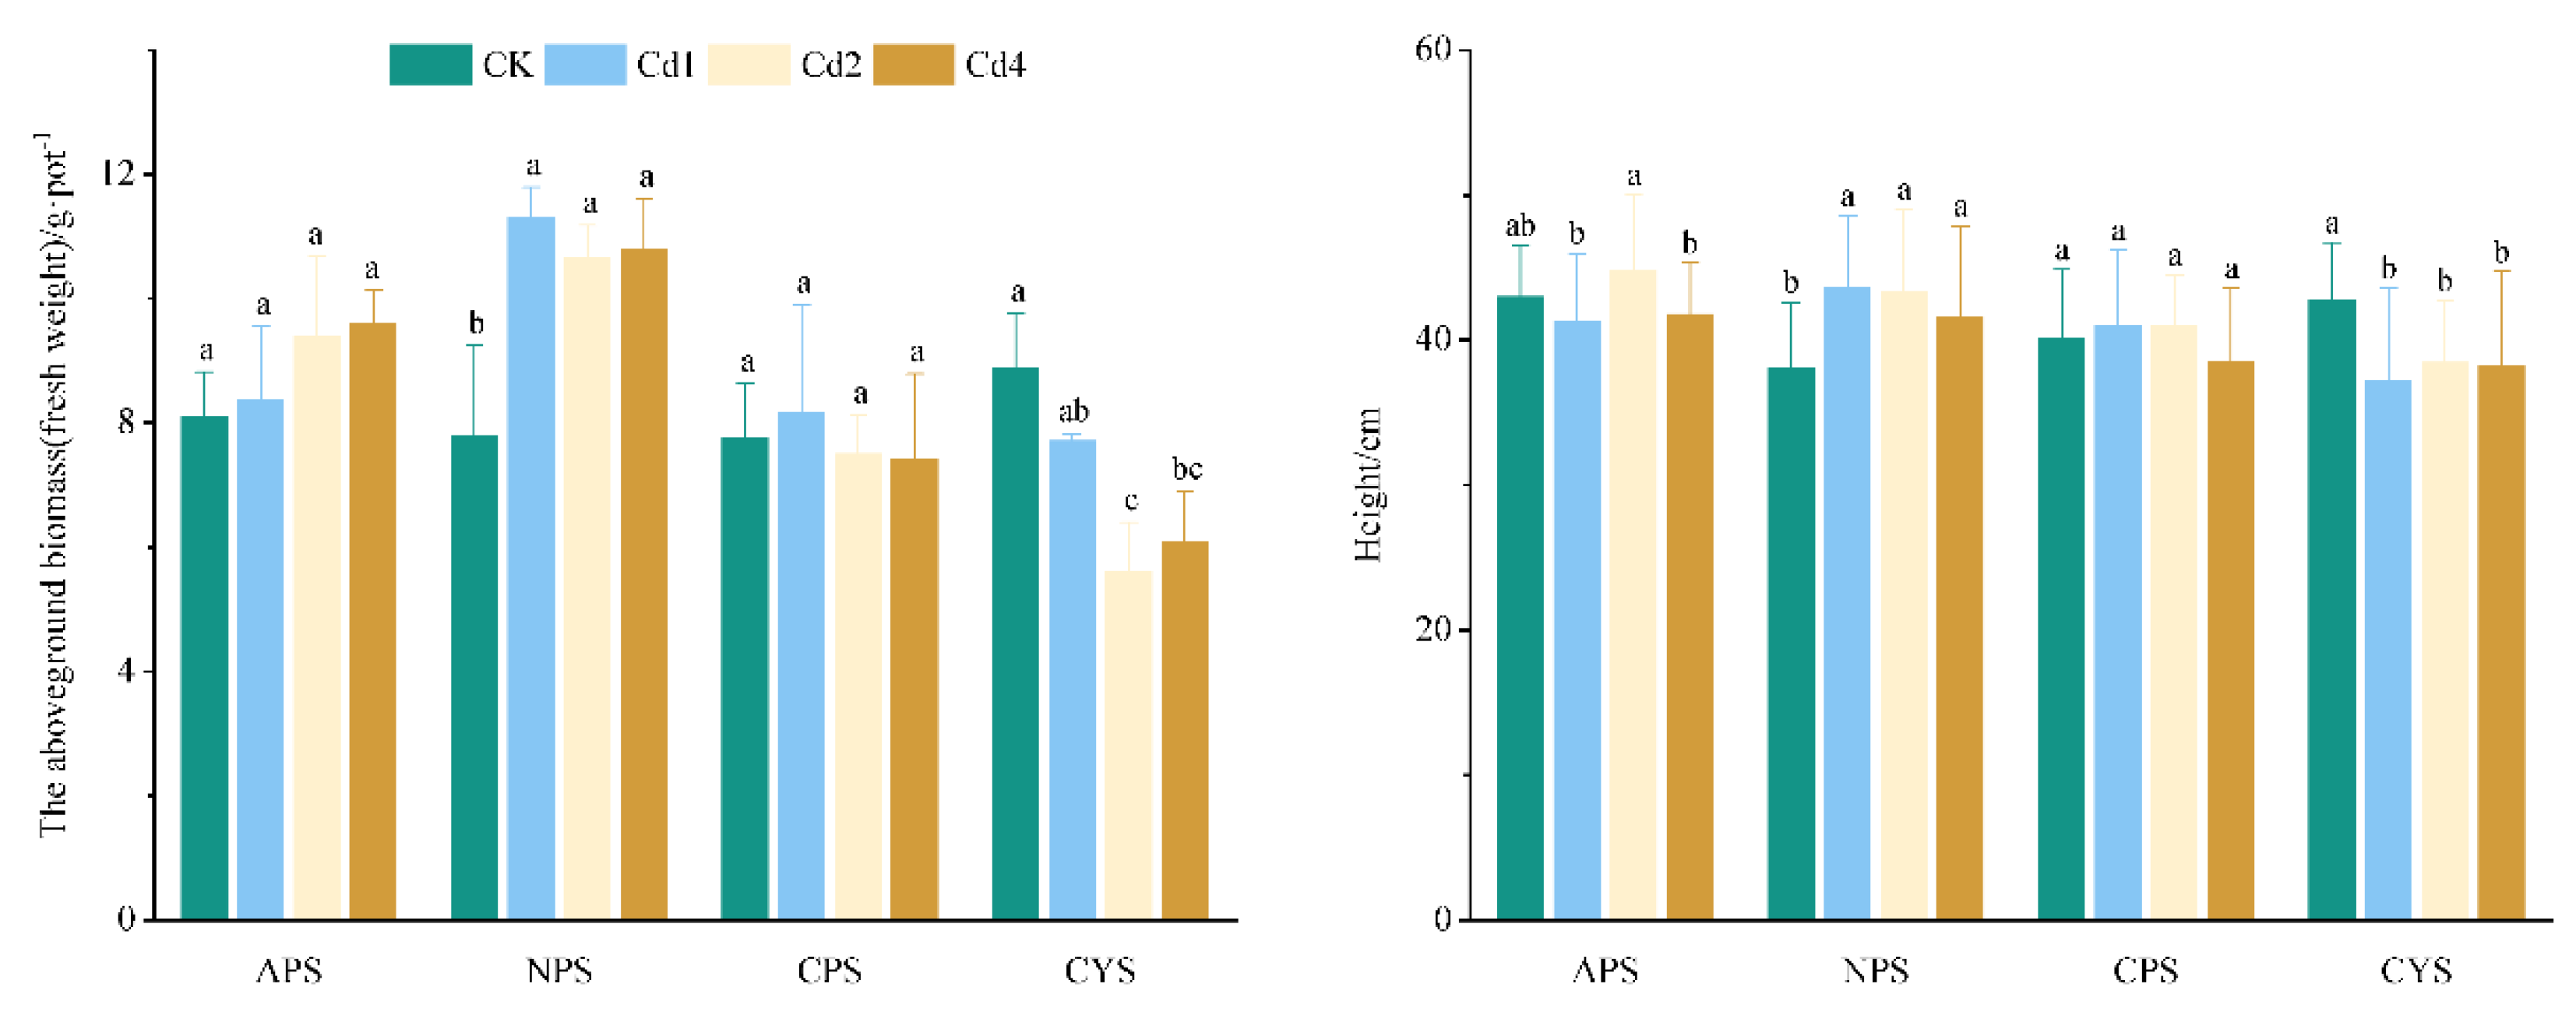
Figure 7.
Accumulation of Cd in ryegrass.
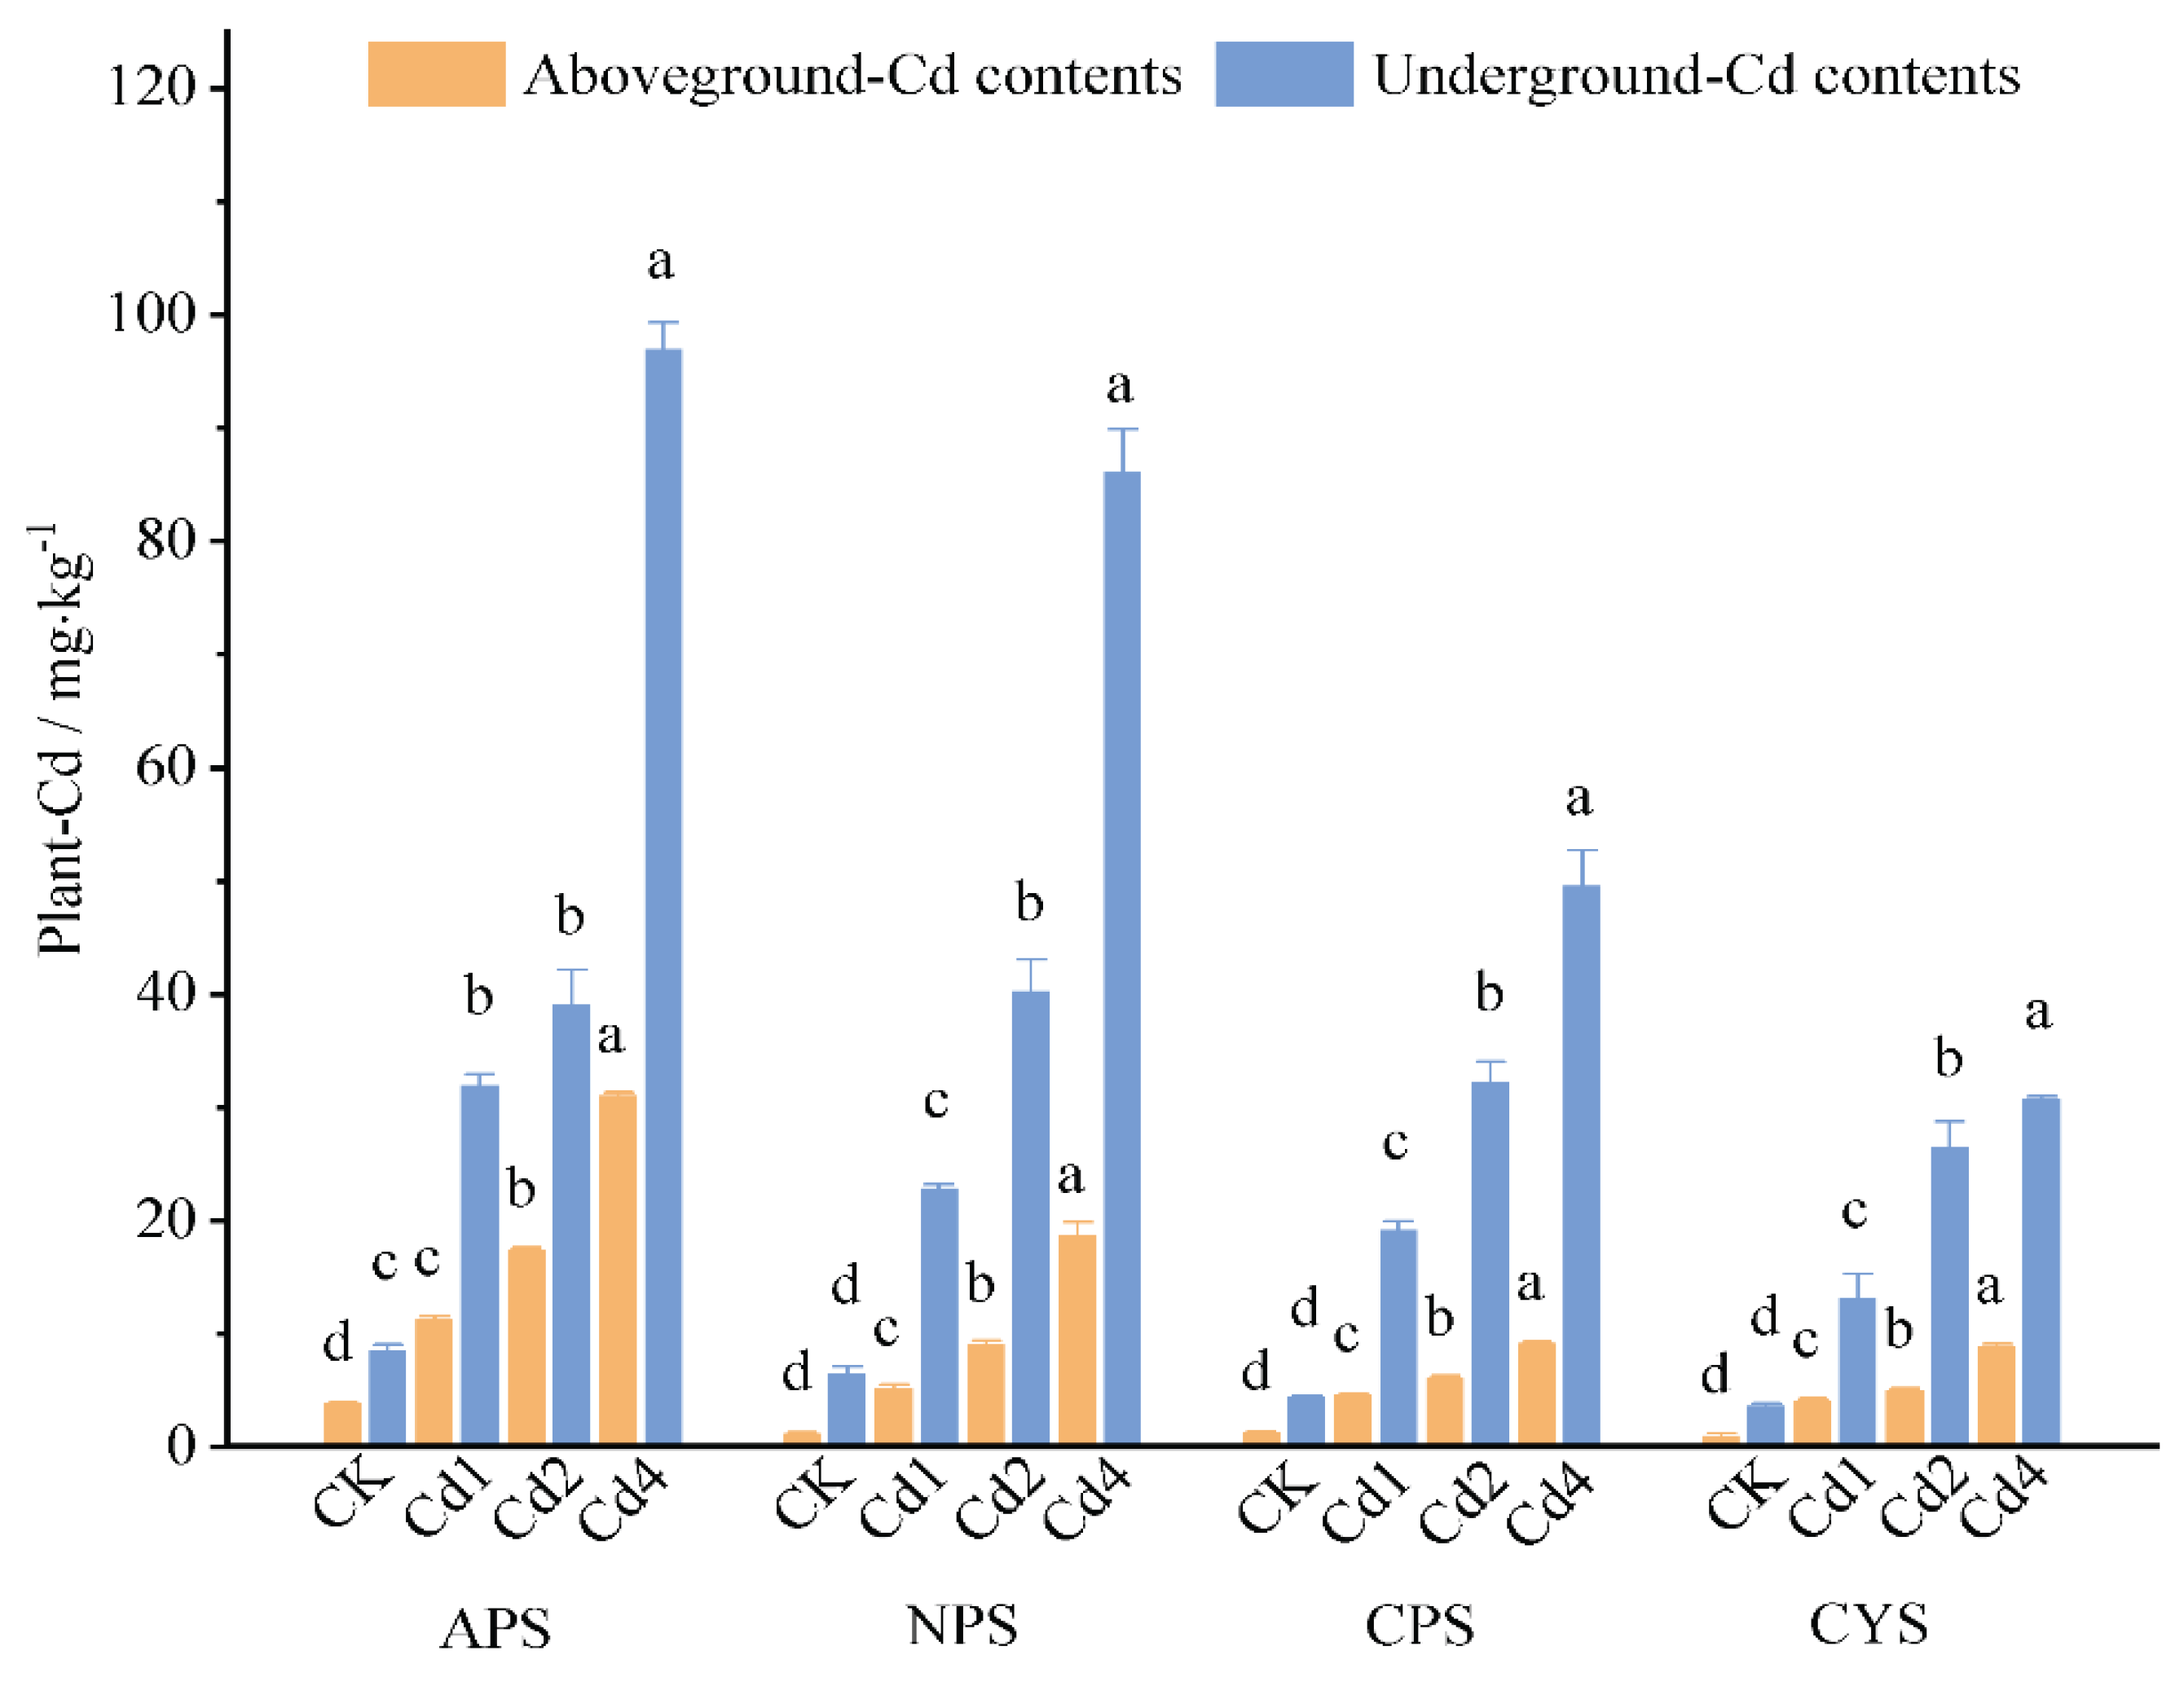
Table 1.
Basic physicochemical properties of soil.
| Soil type | pH | organic matter /g·kg-1 |
Available N /mg·kg-1 |
Available P /mg·kg-1 |
Available K /mg·kg-1 |
CEC /cmol·kg-1 |
Total Cd /mg·kg-1 |
Soil texture % | ||
|---|---|---|---|---|---|---|---|---|---|---|
| Sand | Silt | Clay | ||||||||
| APS | 6.04 | 29.42 | 205.59 | 23.40 | 88.28 | 22.00 | 0.39 | 32.00 | 36.00 | 32.00 |
| NPS | 7.30 | 31.63 | 105.91 | 24.26 | 233.22 | 24.71 | 0.40 | 44.00 | 34.00 | 22.00 |
| CPS | 7.81 | 22.55 | 80.99 | 25.69 | 161.04 | 23.00 | 0.42 | 8.00 | 30.00 | 62.00 |
| CYS | 7.67 | 19.01 | 67.28 | 24.93 | 193.48 | 22.14 | 0.45 | 20.00 | 44.00 | 36.00 |
Table 2.
AFs of Cd in bulk soil and aggregates of tested soils.
| Soil type | aggregates in native soil | bulk soils | ||||
|---|---|---|---|---|---|---|
| <0.053mm | 0.053-0.25mm | 0.25-0.5mm | 0.5-1mm | 1-2mm | 0~2mm | |
| APS | 65.45±0.47a | 65.05±4.21a | 47.56±7.26b | 43.81±10.57b | 22.15±4.25c | 48.77±0.24 |
| NPS | 34.31±1.05c | 49.29±2.62a | 42.55±0.00b | 36.79±2.21c | 41.96±1.70b | 44.10±0.16 |
| CPS | 37.08±0.48a | 24.32±4.24bc | 30.15±1.18b | 17.85±0.44c | 9.79±0.26d | 26.02±0.25 |
| CYS | 23.35±4.90a | 12.50±0.26b | 11.23±1.90b | 5.79±1.41c | 2.9±1.03d | 20.94±0.05 |
| Soil type | aggregates in soils with Cd1 addition | bulk soils | ||||
| <0.053mm | 0.053-0.25mm | 0.25-0.5mm | 0.5-1mm | 1-2mm | 0~2mm | |
| APS | 43.30±0.00d | 52.06±0.00a | 46.03±0.00b | 45.94±0.29b | 45.06±0.45c | 51.25±0.17 |
| NPS | 38.64±0.21d | 43.83±0.26b | 42.90±0.36c | 38.97±0.00d | 46.23±0.47a | 39.93±0.28 |
| CPS | 12.54±0.30a | 10.30±0.79ab | 12.33±1.09a | 9.97±0.69b | 12.10±1.07ab | 12.22±0.41 |
| CYS | 8.81±1.43a | 8.86±1.06a | 6.75±0.00b | 5.91±1.09b | 3.73±0.29c | 8.68±0.04 |
| Soil type | aggregates in soils with Cd2 addition | bulk soils | ||||
| <0.053mm | 0.053-0.25mm | 0.25-0.5mm | 0.5-1mm | 1-2mm | 0~2mm | |
| APS | 31.28±0.45d | 40.28±0.07a | 39.78±0.00a | 38.69±0.00b | 36.35±0.74c | 39.57±0.21 |
| NPS | 33.22±0.28c | 48.59±0.24a | 39.27±1.03b | 34.29±0.41c | 37.71±0.45b | 43.37±0.09 |
| CPS | 10.36±1.26b | 9.50±0.51b | 12.09±0.47b | 13.35±0.34a | 12.06±0.29b | 11.79±0.16 |
| CYS | 7.91±0.32a | 6.57±0.08b | 6.42±0.01b | 6.21±0.14b | 5.02±0.03c | 7.08±0.07 |
| Soil type | aggregates in soils with Cd4 addition | bulk soils | ||||
| <0.053mm | 0.053-0.25mm | 0.25-0.5mm | 0.5-1mm | 1-2mm | 0~2mm | |
| APS | 30.71±0.31c | 39.12±0.00a | 38.86±0.17a | 36.66±0.06b | 35.34±0.51b | 38.43±0.03 |
| NPS | 32.86±0.64c | 49.47±0.00a | 39.61±0.00b | 34.05±0.58c | 37.44±1.09b | 42.22±0.25 |
| CPS | 8.91±0.00b | 10.05±0.01a | 9.28±0.76ab | 8.91±0.22b | 10.32±0.15a | 10.39±0.06 |
| CYS | 5.47±0.13a | 5.36±0.05a | 5.20±0.02a | 5.17±0.00a | 4.86±0.03b | 6.02±0.25 |
1) A distinct letter denotes a significant difference (P < 0.05) between treatments on the same soil, whereas the same lowercase letter in the same row indicates no significant difference between treatments.
Table 4.
Correlation coefficient between Cd concentrations in ryegrass and T-Cd in soil aggregates.
| T-Cd | <0.053 mm | 0.053-0.25 mm | 0.25-0.5 mm | 0.5-1 mm | 1-2 mm |
|---|---|---|---|---|---|
| Plant -Cd (CK) | 0.329 | 0.703* | 0.423 | 0.571 | -0.990** |
| Plant -Cd (Cd1) | 0.018 | 0.806** | 0.053 | 0.361 | -0.729** |
| Plant -Cd (Cd2) | 0.214 | 0.811** | 0.416 | 0.516 | -0.807** |
| Plant -Cd (Cd4) | 0.475 | 0.793** | 0.327 | 0.104 | -0.795** |
1) * indicates a significant correlation at the 0.05 level, and ** indicates a significant correlation at the 0.01 level.
Table 5.
Correlation coefficient between Cd concentrations in ryegrass and HCl-Cd in soil aggregates.
Table 5.
Correlation coefficient between Cd concentrations in ryegrass and HCl-Cd in soil aggregates.
| HCl-Cd | <0.053 mm | 0.053~0.25 mm | 0.25~0.5 mm | 0.5~1 mm | 1~2 mm |
|---|---|---|---|---|---|
| Plant -Cd (CK) | 0.715** | 0.615* | 0.480 | 0.513 | 0.185 |
| Plant -Cd (Cd1) | 0.834** | 0.669* | 0.484 | 0.522 | 0.540 |
| Plant -Cd (Cd2) | 0.817** | 0.652* | 0.311 | 0.489 | 0.372 |
| Plant -Cd (Cd4) | 0.779** | 0.695* | 0.405 | 0.547 | 0.468 |
1) * indicates a significant correlation at the 0.05 level, and ** indicates a significant correlation at the 0.01 level.
Disclaimer/Publisher’s Note: The statements, opinions and data contained in all publications are solely those of the individual author(s) and contributor(s) and not of MDPI and/or the editor(s). MDPI and/or the editor(s) disclaim responsibility for any injury to people or property resulting from any ideas, methods, instructions or products referred to in the content. |
© 2025 by the authors. Licensee MDPI, Basel, Switzerland. This article is an open access article distributed under the terms and conditions of the Creative Commons Attribution (CC BY) license (http://creativecommons.org/licenses/by/4.0/).
Copyright: This open access article is published under a Creative Commons CC BY 4.0 license, which permit the free download, distribution, and reuse, provided that the author and preprint are cited in any reuse.


