
Submitted:
19 May 2025
Posted:
20 May 2025
You are already at the latest version
Abstract
In-season nitrogen (N) status diagnosis is an effective way to guide split N applications for improved profitability and minimized negative environmental impacts. Petiole nitrate-N concentration (PNNC) has been an industry standard indicator for in-season potato (Solanum tuberosum L.) N status diagnosis but is limited because of destructive sampling and chemical processing needs. Leaf sensors can be used to predict PNNC and other N status indicators and overcome these challenges. The SPAD meter is a sensor commonly used to estimate leaf chlorophyll (Chl) based on transmittance, while Dualex is a newer leaf sensor that can also measure leaf flavanol (Flav) and anthocyanin (Anth) through Chl fluorescence. Limited research has been conducted to compare the two leaf sensors for potato N status assessment, despite their respective success in N status diagnosis for other crops. Therefore, the objectives of this study were to 1) compare the performance of the Dualex sensor relative to the SPAD meter for predicting potato N status indicators when only sensor data are used, 2) evaluate the potential of improving potato N status prediction using multi-source data fusion compared with only using leaf sensor data, and 3) develop practical strategies for leaf-sensor-based in-season potato N status diagnosis. The plot-scale experiments were conducted in Becker, Minnesota, USA in 2018, 2019, 2021, and 2023 involving different cultivars, N treatments, and irrigation treatments in a split plot design with three replications. Leaf sensor data and plant samples were simultaneously collected and processed multiple times at key growth stages each year. Daily weather data were also collected at the on-site weather station. Different in-season potato N status indicators including PNNC and N nutrition index (NNI) were derived from plant samples, while weather- and management-related parameters were calculated using the weather data and management records. Dualex’s N balance index (NBI; Chl/Flav) always outperformed Dualex Chl but did not consistently perform better than the SPAD meter. All N status indicators were predicted with significantly higher accuracy with multi-source data fusion using machine learning models. A practical in-season potato N status diagnostic strategy was developed using linear support vector regression model with SPAD, cultivar information, accumulated growing degree days (GDDs), accumulated total moisture, and as-applied N rate to predict vine or whole plant NNI, achieving an R² of 0.80 - 0.82, accuracy of 0.75 - 0.77, and a Kappa statistic of 0.57 - 0.58 (near-substantial). Further research is also required to determine the critical N dilution curve and sufficiency ranges of NNI for potatoes based on different genetic, environmental, and management conditions to better support decision-making.
Keywords:
In-season nitrogen status diagnosis
; Leaf sensor
; SPAD
; Dualex
; Data fusion
; Machine learning
; Potato
1. Introduction
Nitrogen (N) is the most abundantly required plant nutrient, and the application of N fertilizer greatly influences the outcome of crop production. The proper management of N fertilizer application is key to achieving high crop yield and quality, while mismanagement negatively impacts not just crop yield and quality but also the environment [1]. Potato (Solanum tuberosum L.) is a shallow-rooted crop and commonly grown on irrigated coarse-textured soils for efficient tuber development, often resulting in a low N use efficiency (NUE) [2,3,4]. Agronomic research has focused on improving NUE and developed the best management practices (BMPs) for potatoes [5]. One of the strategies is in-season split N fertilizer application based on potato N status diagnosis using petiole nitrate analysis [6,7]. Petiole nitrate analysis sensitively reflects the effect of N fertilizer application and is often correlated with tuber yield, making it a useful tool for in-season potato N status diagnosis [8,9]. However, the analysis involves destructive sampling and on-site (i.e., petiole sap analysis) or laboratory testing (i.e., dry petiole analysis), requires a qualified technician, and takes hours to days until the result is delivered. The result may be highly variable and is not comprehensive because of the dependence on a single plant part. The whole plant-based approach according to the concept of critical N concentration (Nc) and N nutrition index (NNI) provides the most stable and comprehensive results [10]. The Nc is the minimum plant N concentration (PNC) required for achieving the maximum dry biomass weight, and the NNI is the ratio of measured PNC to Nc at a certain dry biomass weight [11]. The dynamic allometry of the potato crop has made the determination and interpretation of NNI an active area of potato N research [12,13,14]. Unlike petiole nitrate analysis, each application of N fertilizer can be varied in response to the degree of N stress by using predicted plant dry biomass weight and estimated N recovery rate in the NNI calculation [15]. Nevertheless, this whole plant-based approach suffers from similar or even more severe problems of destructive sampling.
Recent technological and scientific progress has made proximal and remote sensing technologies a leading candidate for addressing these problems. Proximal sensing (PS) technologies are less scalable but also less interfered with (e.g., cloud cover, soil background), more diverse, and sounder in some mechanistic principles (e.g., transmittance, fluorescence) than remote sensing (RS) technologies [16]. Soil plant analysis development (SPAD; Konica Minolta, Tokyo, Japan) estimates leaf chlorophyll (Chl) concentration based on the transmittance of red and near-infrared lights and was used in the earliest effort of PS-based maize (Zea mays L.) N status diagnosis [16]. The SPAD meter started being investigated for potato N status diagnosis around the same time and has continued to prove its usefulness in predicting petiole nitrate-N concentration (PNNC) (R2 = 0.85, [17]; r = 0.92, [18]; R2 = 0.65, [19]), leaf N concentration (LNC) (R2 = 0.69, [17]; R2 = 0.43 - 0.89, [20]; r = 0.97, [18]), and Chl concentration (r = 0.97, [18]), and by calibrating against total biomass to calculate the critical reading values (R2 = 0.83, [21]), tuber yield (R2 = 0.56 - 0.84, [17]; R2 = 0.93, [22]), and by using N sufficiency index (NSI; significantly higher NUE at p < 0.05 using NSI < 90, [23]). The challenges and limitations of the SPAD meter remain with relativity, sensitivity, and specificity [24].
Fluorescence-based sensing technologies were proposed to address these challenges and limitations in plant N status diagnosis using the SPAD meter, as well as other PS/RS technologies [25,26]. Dualex Scientific+ (Dualex; METOS® by Pessl Instruments, Weiz, Austria) and Multiplex (Force-A, Orsay, France) measure flavonols (Flav) and anthocyanins (Anth) using one of the Chl fluorescence sensing mechanisms involving the screening effect of these phenolic compounds. Flav and Anth are phenolic secondary metabolites whose production is often upregulated under N and phosphorus stress, respectively. These phenolic compounds absorb the wavelengths in the ultraviolet (UV) and green regions of the electromagnetic spectrum, respectively, which can otherwise be absorbed by Chl for fluorescence [26]. This mechanism avoids relying on a more fundamental and time-consuming Chl fluorescence mechanism called variable Chl fluorescence and enables more efficient data collection [26,27,28]. Dualex leaf sensor and Multiplex canopy sensor demonstrated comparable performance in plant N status assessment or prediction, despite some differences in their mechanisms [29,30]. Dong et al. [31,32] found that the Dualex readings modified by days after sowing could predict LNC, PNC, and above ground biomass (AGB) for maize with an R2 value of 0.61 – 0.79, 0.62 – 0.83, and 0.58 – 0.63, respectively. Padilla et al. [33] used Multiplex to predict NNI for cucumber with an R2 value of 0.65 – 0.91 and 0.71 – 0.99 in the fall and spring, respectively. Multiplex was also used to predict LNC, PNC, and NNI for rice (Oryza sativa L.) with an R2 value of 0.40 – 0.78 [34]. However, the evaluation of Dualex or Multiplex for potato N status assessment or prediction has been limited.
The manufacturer of Dualex also claimed the advantage of using red-edge over red for transmittance-based leaf Chl estimation. Cerovic et al. [27] compared the relationships between Chl extracts and Chl readings using SPAD and Dualex and demonstrated a near 1:1 linear relationship between Chl extracts and Dualex Chl readings for both monocots and dicots. Li et al. [35] also showed linear relationships between mass-based PNC and SPAD and Multiplex sensor readings for rice with an R2 value of 0.78 and 0.50 – 0.64, respectively. SPAD and Dualex are both leaf-clip sensors and use a similar transmittance-based mechanism for the Chl reading. Thus, comparing SPAD and Dualex will clarify the potential benefits of fluorescence-based sensing features for potato N status prediction.
Recent research has illustrated the effectiveness of the multi-source data fusion approach through machine learning (ML) models in predicting N status or yield of maize, rice, potato, and wheat (Triticum aestivum L.) using different PS and RS technologies including Dualex and Multiplex [19,30,36,37,38,39,40,41,42]. The benefits and incentives of upgrading sensors should also be evaluated considering the improvement magnitude of adding easily available ancillary information to potato N status prediction models. Wang et al. [40] found that the differences between two-band and three-band active canopy sensors could be significantly reduced when multi-source data was used in ML models, reducing the need to upgrade to more expensive sensors. However, similar analysis has not been reported for potato N status diagnosis using SPAD and Dualex sensors.
Therefore, the objectives of this study were to 1) determine if the Dualex sensor can perform better than the SPAD meter for predicting potato N status indicators when only sensor data are used, 2) evaluate the potential of improving potato N status prediction using multi-source data fusion compared with only using leaf sensor data, and 3) develop practical strategies for leaf-sensor-based in-season potato N status diagnosis.
2. Materials and Methods
2.1. Study Sites
The plot-scale experiments were conducted at the Sand Plain Research Farm, Becker Minnesota, USA in 2018, 2019, 2021, and 2023. The Sand Plain Research Farm was located at 45° 23’ N, 93° 53’ W and characterized as a Hubbard loamy sand (sandy, mixed, frigid Entic Hapludolls) until 2018 and was relocated to 45° 20’ N, 93° 49’ W in 2019 and characterized as a Hubbard (Sandy, mixed, frigid Entic Hapludolls)-Mosford (Sady, mixed, frigid Typic Hapludolls) complex sand soil. The average air temperature and total precipitation during the potato growing season at the Sand Plain Research Farm (i.e., mid-April to early-October) from 2013 to 2023 were 18.7 °C and 466.2 mm, respectively, according to the on-site weather station (Figure 1). Soil samples were collected at 0 – 60 cm for soil N (NO3- + NH4+) and 0 – 15 cm for pH and other standard macro- and micro-nutrients before planting each year and analyzed at the Soil Testing and Research Analytical Laboratory at the University of Minnesota. Due to the coarse soil texture, the organic matter (OM) content and soil N concentration were relatively low: 14.7 g kg-1 and 5.86 mg kg-1 on average, respectively (Table 1).
2.2. Study Designs
The experiment in 2018 (Study 1) involved three N rates (i.e., 134.5, 269.0, and 403.5 kg N ha-1) as the main plot treatment and six cultivars (i.e., Clearwater Russet, Ivory Russet, Lamoka, MN13142, Russet Burbank, and Umatilla Russet) as the subplot treatment in a split-plot design with three replications. The experiment in 2019 (Study 2) used the same design but involved five cultivars except for Ivory Russet. Russet Burbank was included twice more than other cultivars in Study 2. The seed tubers were planted at a 0.9 m between-row spacing and at a 0.23 m and 0.3 m within-row spacing for Ivory Russet and other cultivars respectively on May 14, 2018, and May 6, 2019. Diammonium phosphate (DAP; 18-46-0) was banded at planting and supplied 44.8 kg N ha-1. At emergence, the side-dressing application of controlled-release fertilizer, Environmentally Smart Nitrogen (ESN; Nutrien, Canada; 44-0-0), supplied 89.7, 179.3, or 269.0 kg ha-1. The 269.0 and 403.5 kg N ha-1 rate treatments received four fixed-split urea-ammonium nitrate (UAN; 28-0-0) applications at 11.2 and 22.4 kg N ha-1 starting at the beginning of July every 7 to 14 days. Irrigation was applied immediately after the fixed-split UAN applications to simulate fertigation. The tubers were harvested on September 25, 2018, and September 27, 2019. Additional information can be found in Gupta [43] and Gupta and Rosen [44].
The experiment in 2021 (Study 3), involved two cultivars (i.e., Hamlin Russet and Russet Burbank) as the main plot treatment and five N rates (i.e., 44.8, 89.7, 179.3, 269.0, and 358.7 kg N ha-1) as the subplot treatment in a split-plot design with three replications. The seed tubers were planted at a 0.9 m between-row spacing and a 0.3 m within-row spacing on April 16, 2021. DAP and ESN were used in the same way as Studies 1 and 2 except all other N than 44.8 kg N ha-1 from DAP was supplied by ESN (i.e., 0, 44.8, 134.5, 224.2, and 313.8 kg N ha-1) applied at emergence. The tubers were harvested on September 23, 2021. The experiment in 2023 (Study 4) involved three irrigation blocks (i.e., 60%, 80%, and 100% irrigation based on water balance). Each irrigation block included the same two cultivars as Study 3 (i.e., Hamlin Russet and Russet Burbank) as the main plot treatment in a split-plot design with three replications. The 60% and 80% irrigation blocks used four N treatments (i.e., 89.7, 179.3, 269.0 kg ha-1 and a sensor-based variable rate application (VRA) treatment) as the subplot treatment, while the 100% irrigation block included nine N treatments (i.e., 44.8, 89.7, 179.3, 269.0, 358.7 kg ha-1, fixed-split, and 3 sensor-based VRA treatments). The seed tubers were planted at a 0.9 m between-row spacing and a 0.25 m and 0.3 m within-row spacing for Hamlin Russet and Russet Burbank respectively on April 26, 2023. The five N rates received DAP and ESN in the same way as Study 3. Hamlin Russet and Russet Burbank in the fixed-split and VRA treatments received 44.8 kg N ha-1 from the banded DAP application at planting and either 44.8 or 134.5 kg N ha-1 from the side-dressed ESN application at emergence. The fixed-split treatments received four 16.8 kg N ha-1 UAN applications every 7 to 14 days, while leaf sensors (i.e., SPAD or Dualex) were used to make decisions of the UAN applications based on potato N status diagnosed through PNNC or NNI prediction or NSI calculation for the VAR treatments. The simulated fertigation method was used for the UAN application as in Studies 1 and 2. The tubers were harvested on October 5, 2023. Additional information can be found in Miao et al. [45,46] All of the other cultural practices were implemented according to the regional recommendations [47].
2.3. Collection of Plant Samples and Sensor Data
Between late-June and early-August, corresponding to the growth stages of tuber initiation and tuber bulking, vines and tubers of three plants in each plot were sampled two to four times each year (i.e., 6/26, 7/10, 7/18, and 8/1 in 2018; 6/26, 7/11, 7/24, and 8/7 in 2019; 6/30 and 7/28 in 2021; 6/20, 7/18, and 7/26 in 2023). The vines and tubers were separated, and the whole and sub-sampled fresh weights were obtained in the field. The sub-samples were transported to the laboratory, dried in the oven at 60 °C to a constant weight, and weighed again to determine percent dry matter (%DM). The dried sub-samples were ground to pass a 2 mm sieve using a Wiley mill and analyzed for vine and tuber N concentration using an Elemental CNS analyzer (Elementar Vario EL III, Elementar Americas). Whole plant N concentration (WPNC) was determined as follows:
where WPNC is in g 100 g-1, VNC is vine N concentration in g 100 g-1, TNC is tuber N concentration in g 100 g-1, Wv is dry vine biomass (Mg DM ha-1), and Wt is dry tuber biomass (Mg DM ha-1). Within a few days before or after the whole plant sampling campaigns, twenty petioles from the fourth leaf from the shoot apex were sampled in each plot. The petioles were dried, ground, and analyzed for nitrate-N concentration using water extraction and conductimetric procedures [48]. The SPAD and Dualex data were also collected within the same time window as petiole samples. Twenty or thirty SPAD readings were taken on the fourth leaf from the shoot apex and manually averaged for each plot. Fifteen Dualex readings were taken on the top fully expanded leaves, and Dualex provided the average Chl, Flav, Anth, and N balance index (NBI) values, where NBI is a Chl/Flav ratio [27].
WPNC = (VNC * Wv + TNC * Wt) / (Wv + Wt),
2.4. Data Wrangling
Plant nitrogen uptake (PNU) and NNI were used as N status indicators along with PNNC, VNC, and WPNC. PNU was calculated as follows:
PNU = 10 * WPNC * (Wv + Wt),
where PNU is in kg ha-1. The critical N dilution curves define the relationship between Nc and plant dry biomass (W) using an allometric negative power function as follows:
Nc = aW-b,
where Nc is in g 100g-1 and W is in Mg DM ha-1, and a and b are the empirical parameters. Parameter a is numerically equivalent to the Nc concentration at W = 1 Mg DM ha-1, and parameter b is the dimensionless dilution parameters defining the rate of Nc decline with an increase in W. When W was less than 1 Mg DM ha-1, the value of parameter a was always used as Nc assuming constant total N concentration [11]. The vine and whole plant critical N dilution curve coefficients were derived from Giletto et al. [14]. The parameters for Russet Burbank and Umatilla Russet were directly available. The parameters for Russet Burbank, Shepody, and Umatilla Russet were used for Hamlin Russet; Ivory Russet, MN13142; Clearwater Russet, Lamoka according to the maturity class. The parameters were summarized in Table 2.
NNI was calculated as follows:
NNI = PNC / Nc,
where PCN and Nc are in g 100g-1, and PCN is measured on the plant of interest (i.e., vines for vine NNI, and vines + tubers for WP NNI) and Nc is derived from the critical N dilution curve based on the dry biomass weight of the plant.
The cultivar information was organized categorically using the cultivar names, which were coded using dummy variables as needed. The beginning-of-the-season (initial) soil samples were collected on a replication basis. When the soil test results were collected only from a subset of replications, the rest of replications were imputed with the average soil test result values within each site-year. Daily weather information was recorded by the on-site weather station. Air temperature data were used to calculate accumulated growing degree days (GDDs) as follows:
where Tmax and Tmin are daily maximum and minimum air temperatures in °C and 7 °C is the base air temperature for potatoes [49]. The GDDs were summed up from the planting date to each sampling/sensing date. Precipitation data were used with the irrigation log to calculate accumulated total moisture as follows:
where P and IRR are precipitation and irrigation in mm. Irrigation was scheduled using the checkbook method and applied a few times a week [50]. In Study 4, irrigation was reduced in the 60% and 80% treatments proportionately except before May 29 and on August 2 because of too much drought pressure or mechanical issues with the irrigator. The summation was applied in the same way as accumulated GDDs. As-applied N rate was calculated by summing up the amount of N that has been applied until each sampling/sensing date. When ESN was applied at emergence, the N release rate of the fertilizer was considered based on the work by Wilson et al. [51] as follows:
where PNR is percent N release, and DAS is days after sowing. When other N fertilizer types were used, all of the N credit was added to as-applied N rate at once on the following sampling/sensing dates. All of the N status indicators and genetic, environmental, and management (GxExM) variables were combined with leaf sensor data. After handling missing values, the dataset amounted to 656 observations.
PNR = – 0.008 DAS2 + 2.0 DAS – 37.8,
2.5. Statistical Analysis
Regression models with varying complexities were used to compare the two leaf sensors, including simple regression (SR) models, multiple linear regression (MLR) or least absolute shrinkage and selection operator (LASSO) regression model, random forest regression (RFR) model, extreme gradient boosting (XGBoost) and support vector regression (SVR) models. Two different scenarios were considered: 1) only the leaf sensor data were available, and 2) the leaf sensor data and the available GxExM data. The models without hyperparameters were trained and tested using a 4-fold cross-validation, where each fold holds data from a different site-year. The models with hyperparameters were trained and tested a nested cross-validation with 4 outer folds and 10 inner folds. The 4 outer folds were the same as those in a 4-fold cross-validation, whereas the 10 inner folds were created randomly. This data partitioning design aimed to realize more robust model evaluation. Meanwhile, using dummy variables for nominal values (i.e., cultivar information) in the geometric models necessitated all levels of nominal values to be present in the training dataset. Ivory Russet, Lamoka, and MN13142 were, therefore, removed from the dataset, resulting in 568 observations. Important features were selected using the coefficients of the LASSO regression models and the permutation-based importance analysis using random forest called Boruta for scenario 2 [52].
Model development was conducted using an R framework, Tidymodels [53]. Bayesian optimization was initialized with 10 sets of random hyperparameters and iterated up to 50 times for hyperparameter tuning using the expected improvement with a trade-off value of 0.1 as an acquisition function. The “glmnet”, “ranger”, “xgboost”, and “kernlab” packages were used as engines for LASSO regression, RFR, and SVR in Tidymodels [54,55,56,57]. The following hyperparameters were tuned: L-1 regularization term (penalty) for LASSO regression; the number of predictor variables randomly selected at each node (mtry), the number of trees (trees), and the minimum node size (min_n) for RFR; mtry, trees, min_n, learning rate (learn_rate), the proportion of observations sampled for growing each tree (sample_size), and L-2 regularization term (lambda); cost, margin, degree, scale (scale_factor), offset, sigma (ebf_sigma) for SVR.
The coefficient of determination (R2), mean absolute error (MAE), and root mean square error (RMSE) were used to for model evaluation:
where n is the number of observations, yi is the actual value of the ith observation, is the predicted value of the ith observation, and is the mean of all the observations. The PNNC values were tentatively assigned deficient, sufficient, or excessive categories using the sufficiency thresholds established for Russet Burbank by Rosen and Bierman [5]: 17,000 - 22,000 mg kg-1 for June 15 - June 30, 11,000 - 15,000 mg kg-1 for July 1 - July 15, and 6,000 - 9,000 mg kg-1 for July 15 – August 15. The NNI values were also categorized using the sufficiency threshold of 0.95 – 1.05. Accuracy and Kappa statistics were used to evaluate diagnostic capability as follows:
where TP, TN, FP, FN are true positive, true negative, false positive, and false negative, and Po and Pe are probability of agreement observed and probability of agreement by chance, respectively. Kappa statistics measure the level of agreement between observed and predicted categories while considering the chance agreement. The Kappa value of < 0, 0 - 0.2, 0.21 - 0.40, 0.41 - 0.60, 0.61 - 0.80, and 0.81 - 1.00 corresponds with poor, slight, fair, moderate, substantial, and almost perfect level of agreement [58]. Shapley additive explanation (SHAP) was used to interpret the contribution of each feature to an output with respect to the expected output in the developed models [59]. One hundred sub-samples were randomly selected to determine SHAP values for each observation using the iml package [60]. SHAP values were visualized using [61]. All of the other statistical analysis and visualization was also conducted in R [62].
Accuracy = (TP + TN) / (TP + TN + FP + FN),
Kappa statistic = (Po – Pe) / (1 – Pe),
3. Results
Table 3 shows the summary statistics of the N status indicators. The PNNC was more variable than the other N status indicators. NNI had median and mean values close to 1 with 0.3 – 0.4 standard deviations, allowing to evaluate the diagnostic accuracy across all three N status categories. The variabilities of the N status indicators were considered when determining which metric to use for the hyperparameter tuning of the ML models in Bayesian optimization. MAE was selected for the PNNC prediction models to minimize the potential outlier effect, while RMSE was selected for the rest of the prediction models.
3.1. Scenario 1: Leaf Sensor Data Only
The SR models were applied with or without axis log-transformation (i.e., linear, logarithmic, power, exponential, and quadratic). All the SR models were originally fitted using the whole dataset to select the best performing SR model based on the R2 values. Across the N status indicators, SPAD and Dualex NBI always had the highest R2 values using the power or quadratic forms (Table A1). The R2 values were up to 0.12 higher for Dualex NBI than SPAD in the PNNC, VNC, WPNC, vine NNI, and NNI prediction models. The R2 values for the PNU prediction models were much lower for both SPAD and Dualex NBI (i.e., 0.11 and 0.08). Figure 2 shows the results of 4-fold cross-validation, and the scatter plots visualize the prediction results in the testing datasets. The performance difference between SPAD and Dualex NBI in every N status indicator prediction was negligible. The performance metrics showed similar values in both training and testing datasets due to the high bias and low variance nature of the SR models. Concisely, the PNNC, VNC, WPNC, vine NNI, and NNI prediction models all achieved an R2 value of approximately 0.6, while the PNU models remained to have a low R2 value of approximately 0.15. The systematic under- and over-estimation at low and high values with the power regression models suggest insufficient explanatory variables or a lack of model flexibility.
The multi-parametric functionality of Dualex enables the development of MLR models. The derivation of NBI (i.e., Chl/Flav) led to extremely high variance inflation factor (VIF) values, justifying the omission of NBI in the MLR model development. The MLR models did not demonstrate any improvements over the SR models (data not shown). Excluding Chl and Flav instead of NBI produced similar results. The advanced ML (i.e., RFR, XGBoost, and SVR) were also fitted using all of the Dualex parameters. Table 4 summarized the performance metric values of the best ML model for each N status indicator prediction in the training and testing datasets. Despite the ability to characterize complex non-linear relationships, little improvement was found. The PNNC and NNI prediction using the RFR and polynomial SVR models marginally improved (i.e., testing R2 = 0.66 and 0.60, respectively).
The within-year performance of the two leaf sensors was additionally evaluated, as the between-year variability of environmental factors might have obscured the advantages of the fluorescence sensor. Table 5 shows the highest R2 values of the SR models fitted using SPAD, Dualex Chl, or Dualex NBI in each year. Dualex Chl had higher R2 values than SPAD in 2019, whereas SPAD had higher R2 values than Dualex Chl in 2023. Dualex NBI had higher R2 values than Dualex Chl in most cases. However, the improvement of Dualex NBI over Dualex Chl in N status indicator prediction within each growing season was not greater than across all the growing seasons (Table A1 and Table 5).

Table 5.
The R2 values of the SR models fitted using SPAD, Dualex Chl, or Dualex NBI in each year.
| Year | N indicator | SPAD | DuxChl | DuxNBI | Year | N indicator | SPAD | DuxChl | DuxNBI |
|---|---|---|---|---|---|---|---|---|---|
| 2018 | PNNC | 0.66 | 0.60 | 0.69 | 2021 | PNNC | 0.70 | 0.79 | 0.84 |
| VNC | 0.57 | 0.58 | 0.74 | VNC | 0.87 | 0.86 | 0.67 | ||
| WPNC | 0.53 | 0.55 | 0.72 | WPNC | 0.90 | 0.87 | 0.62 | ||
| PNU | 0.06 | 0.06 | 0.15 | PNU | 0.14 | 0.12 | 0.23 | ||
| Vine NNI | 0.48 | 0.51 | 0.69 | Vine NNI | 0.83 | 0.86 | 0.73 | ||
| NNI | 0.40 | 0.43 | 0.61 | NNI | 0.83 | 0.84 | 0.69 | ||
| 2019 | PNNC | 0.43 | 0.47 | 0.53 | 2023 | PNNC | 0.71 | 0.34 | 0.50 |
| VNC | 0.38 | 0.71 | 0.76 | VNC | 0.69 | 0.33 | 0.47 | ||
| WPNC | 0.38 | 0.71 | 0.76 | WPNC | 0.74 | 0.30 | 0.46 | ||
| PNU | 0.04 | 0.29 | 0.22 | PNU | 0.34 | 0.03 | 0.07 | ||
| Vine NNI | 0.39 | 0.37 | 0.53 | Vine NNI | 0.58 | 0.33 | 0.45 | ||
| NNI | 0.43 | 0.48 | 0.66 | NNI | 0.65 | 0.34 | 0.45 |
3.2. Scenario 2: Leaf Sensor Data and GxExM Data
The SPAD or Dualex data were used with the GxExM data to improve the N status indicator prediction in the MLR models. Some of the GxExM variables, particularly the initial soil test results, showed extremely high VIF values because of the similar soil characteristics of each experimental site within the research farm. The L-1 regularization term was included in the MLR models to ensure model stability, forming the least absolute shrinkage and selection operator (LASSO) regression. NBI was removed because the regularization parameter tuning was negatively affected. The model performance greatly improved the testing R2 values for all of the N status indicator prediction (i.e., testing R2 = 0.69 - 0.85 for PNNC, VNC, WPNC, vine NNI, and NNI; testing R2 = 0.49 - 0.5 for PNU; Figure 3). However, some of the LASSO regression models (e.g., WPNC, PNU, and vine NNI prediction) had greater degrees of deviation from the 1:1 relationship likely due to overfitting.
LASSO regression induces sparsity by its geometric constraints using the regularization mechanism and selectively eliminates less informative features. The magnitude of the remaining non-zero coefficients indicate the importance of predictor variables. Figure 4 illustrates the LASSO regression coefficients for all of the eight regression models in Figure 3. The absolute values of the coefficients were used separating the positive and negative coefficients in color. Figure 4 (a) and (b) were on a logarithmic scale and the coefficient values less than 1 were replaced with 0 for practical and visualization purposes. The intercept values were also excluded. The information SPAD and Dualex Chl provided was neither outstanding nor consistent. The most important features for predicting different N status indicators were accumulated GDDs and as-applied N rate, supporting the effectiveness of data fusion approach. Dualex Flav and Anth also provided useful information, although to a lesser extent. Soil properties and nutrients that influence plant PNU or protein synthesis were other informative features (e.g., OM, S, Mg, Zn). Evaluating the importance of cultivar information in the same fashion is not appropriate because cultivar information was incorporated using the dummy variable technique. The positive and negative correlation between the N status indicators and predictor variables were reasonable.
Permutation-based importance analysis was used to further evaluate the feature importance. All of the features were regarded as important based on significant Z scores in the shadow variable Z distribution. The Boruta results were pooled across all of the eight RFR models and visualized in Figure 5. Accumulated GDDs and as-applied N rate remained to be the most important GxExM features. In contrast with the feature importance analysis results based on the LASSO regression coefficients, accumulated total moisture demonstrated similar importance to accumulated GDDs. All of the leaf sensor data, particularly SPAD and Dualex NBI, were the other most informative features. The Z-score of cultivar information was generally high but variable, reflecting the inconsistency of its contribution depending on the N status indicators. In light of the feature importance analyses and general data accessibility, the following sophisticated ML models were developed using leaf sensor data (i.e., SPAD or Dualex Chl, Flav, Anth, and NBI) the four GxExM information (i.e., cultivar information, accumulated GDDs, accumulated total moisture, and as-applied N rate).
Table 5 summarizes the performance metrics of the best ML model for each N status indicator prediction using SPAD or Dualex data with the GxExM information in the training and testing datasets. Linear SVR models presented the best performance metrics in most cases with smaller testing MAE and RMSE values than the LASSO regression models, demonstrating better ability to balance variance and bias. The leaf sensor types did not make much difference in the performance of these N status indicator prediction models. The testing R2 values of the VNC and WPNC models were very high (i.e., 0.85 - 0.90). However, the prediction of PNU remained less accurate, implying the difficulty of predicting AGB using a leaf sensor. Both vine NNI and NNI demonstrated comparable R2 values and higher diagnostic accuracy than PNNC in the testing dataset (i.e., 0.75 - 0.80 in R2, 0.63 - 0.64 vs. 0.75 – 0.77 in accuracy, and 0.42 – 0.43 vs. 0.54 – 0.58 in a Kappa statistic).
Table 5.
The summary of sophisticated ML model performance metrics using leaf sensor data and GxExM information. (a) for SPAD and (b) for Dualex.
Table 5.
The summary of sophisticated ML model performance metrics using leaf sensor data and GxExM information. (a) for SPAD and (b) for Dualex.
| (a) | |||||||
| N Indicator | Dataset | Model | R2 | MAE | RMSE | Acc | Kappa |
| PNNC | Training | SVR L | 0.81 | 2625.87 | 3513.96 | 0.71 | 0.56 |
| Testing | SVR L | 0.79 | 4189.66 | 5285.45 | 0.64 | 0.42 | |
| VNC | Training | SVR L | 0.84 | 0.39 | 0.50 | - | - |
| Testing | SVR L | 0.85 | 0.56 | 0.68 | - | - | |
| WPNC | Training | SVR R | 0.94 | 0.25 | 0.34 | - | - |
| Testing | SVR R | 0.90 | 0.40 | 0.50 | - | - | |
| PNU | Training | SVR L | 0.62 | 26.43 | 36.54 | - | - |
| Testing | SVR L | 0.55 | 34.57 | 45.39 | - | - | |
| Vine NNI | Training | SVR L | 0.80 | 0.09 | 0.12 | 0.79 | 0.65 |
| Testing | SVR L | 0.80 | 0.11 | 0.14 | 0.75 | 0.57 | |
| NNI | Training | SVR L | 0.81 | 0.12 | 0.16 | 0.82 | 0.68 |
| Testing | SVR L | 0.82 | 0.16 | 0.20 | 0.77 | 0.58 | |
| (b) | |||||||
| N Indicator | Dataset | Model | R2 | MAE | RMSE | Acc | Kappa |
| PNNC | Training | RFR | 0.99 | 653.64 | 891.39 | 0.91 | 0.86 |
| Testing | RFR | 0.75 | 3399.62 | 4266.46 | 0.63 | 0.43 | |
| VNC | Training | SVR L | 0.87 | 0.36 | 0.46 | - | - |
| Testing | SVR L | 0.85 | 0.51 | 0.63 | - | - | |
| WPNC | Training | SVR L | 0.90 | 0.35 | 0.45 | - | - |
| Testing | SVR L | 0.87 | 0.47 | 0.58 | - | - | |
| PNU | Training | SVR L | 0.64 | 25.70 | 35.32 | - | - |
| Testing | SVR L | 0.57 | 32.74 | 43.21 | - | - | |
| Vine NNI | Training | SVR L | 0.81 | 0.09 | 0.12 | 0.80 | 0.65 |
| Testing | SVR L | 0.80 | 0.12 | 0.15 | 0.75 | 0.57 | |
| NNI | Training | SVR L | 0.83 | 0.11 | 0.15 | 0.84 | 0.71 |
| Testing | SVR L | 0.81 | 0.17 | 0.22 | 0.75 | 0.54 | |
Figure 6 shows the results of SHAP analysis for the best vine NNI and NNI prediction models using SPAD or Dualex in the beeswarm plots. The features were ordered by the level of contribution from top to bottom. The distribution of SHAP values and the range of feature values were also visualized in the plots. Regardless of the leaf sensor types, accumulated GDDs, as-applied N rate, and accumulated total moisture were the top three contributing features, reaffirming the effectiveness of data fusion approach. Dualex Flav and NBI appeared to be slightly more conducive for predicting vine NNI and NNI than SPAD.
4. Discussion
4.1. Comparing the Ability of SPAD and Dualex to Predict Potato N Status Indicators
An improvement in the ability to predict potato N status indicators using Dualex over SPAD across years was not apparent in this study, despite additional functionality provided by Dualex (Figure 2 and Table 4). Padilla et al. [33] found that leaf Chl reading was more useful on a standardized growth stage basis, while Flav or NBI was more useful within each growing season because of its sensitivity to variable environmental factors including solar radiation and air temperature. If Dualex NBI is superior to SPAD within each growing season, the NSI approach can utilize this advantage. Table 5 summarized the within-year performance of the two leaf sensors. The 2018 and 2019 experiments shared the same design and had similar annual total precipitation, while the average air temperatures in 2018 were the highest between 2013 and 2023. Comparing the summary statistics of the N status indicators in 2018 and 2019 revealed consistently higher mean N status indicator values in 2019 (i.e., 1700 mg kg-1 in PNNC, 1.0 g 100 g-1 in VCN, 0.7 g 100 g-1, 0.24 in vine NNI, and 0.21 in NNI). The controlled-release N fertilizer may have been released more quickly and potentially leached more by early-season precipitation in 2018, inducing different plant N status in response to similar management [51]. Because SPAD and Dualex Chl readings have exponential and linear relationships with Chl concentration, relatively higher sensitivity to lower and higher ranges of Chl concentration can be expected and, thus, might explain lower and higher R2 values of SPAD and Dualex Chl in 2019, respectively [27]. The 2023 experiment included all treatments of the 2021 experiment and had additional treatments. The average air temperatures and total precipitation were higher in 2023 than 2021, although not to the extent of 2018 vs. 2019. The summary statistics of these two years were similar, whether all treatments or the treatments shared in the 2021 and 2023 experiments were included. SPAD and Dualex use red and red-edge spectral bands for the transmittance-based mechanism to obtain Chl reading [27]. Due to the combined spectral characteristics of red and near-infrared, the red-edge band is more influenced by leaf structure (e.g., mesophyll) than the red band. Different types of plant stress (e.g., N, heat, water, pest) can alter leaf structure, potentially making Dualex Chl reading less N specific in some conditions than SPAD.
Dualex NBI demonstrated improvements over Dualex Chl, while the degree of improvement was influenced by the N stress levels introduced by the experimental treatments (e.g., cultivars with different NUE, N fertilizer application rate and method). The benefit of using Dualex NBI within a single year over across multiple years was not observed in this study. Neither was there enough evidence to claim that Dualex NBI outperformed SPAD within each growing season. Ultimately, rather than demonstrating the superiority of one leaf sensor over the other, the results revealed the unsatisfactory and inconsistent performance of both leaf sensors when used independently - potentially caused by low sensitivity or specificity - as previously summarized by Goffart et al. [24]. The data fusion approach has been proven effective to overcome similar weaknesses of other proximal or sensing technologies and achieve satisfactory N status diagnosis of different crops [36,38,39,41,40,42].
4.2. Improvements of Potato N Status Indicator Prediction Using Multi-Source Data Fusion
The GxExM information was found equally or more important for potato N status indicator prediction than leaf sensor data, as revealed by LASSO coefficients and Boruta analysis. Because fertilization, irrigation, and environmental conditions largely influence the demand and accessibility of N to plants, quantifying these environmental and management factors is important to predict N status indicators [1]. Previous research has also found that N fertilizer application rate helped greatly improve plant N status or yield prediction for corn, rice, and winter wheat, while parameters related to air temperature, precipitation, and irrigation had lesser and varying levels of contribution [38,30,15,41,40]. Air temperature information was parameterized using accumulated GDDs in this study and was considered most conducive in Figure 6, but other types of parameters such as day-night temperature difference might provide additional insight because of the effects on the allometric dynamics of above and belowground biomass [63]. Other potentially useful environmental and management information include solar radiation and planting population [13]. One of the roles Flav and Anth play in plants is photoprotection, creating a high positive correlation between Dualex Flav/Anth and solar radiation and possibly accounting for some of the importance of Dualex Flav/Anth observed in this study [33]. The genetic information is the other important factor to be considered because the allometric dynamics also greatly varies among varieties [13].
The linear SVR models effectively combined leaf sensor data with the GxExM information in predicting most of the N status indicators. Linear SVR is also a more computationally efficient ML option than RF and XGBoost. The LASSO and linear SVR models had similar performance in the training dataset, but the linear SVR model outperformed the LASSO model in the testing dataset. Both LASSO and linear SVR are regularized linear models. LASSO minimizes the ordinary least square loss with a L1 regularization term, while linear SVR uses support vectors with the epsilon-insensitive loss function and a L2 regularization term. The linear SVR model was superior to the LASSO model because of its better ability to generalize and handle multicollinearity through the more elaborate design (e.g., loss function, error margin, sparsity). Nevertheless, the linear relationships between the selected features and N status indicators were found, coinciding with our previous findings [19]. The SVR linear model showed high predictive and diagnostic performance across most N status indicators with an R2 value of 0.75 – 0.87, accuracy of 0.63 – 0.75, and a Kappa statistic of 0.42 – 0.58 (moderate), demonstrating the improvements of potato N status indicator prediction using multi-source data fusion. It is worth noting that the relationships may become slightly less linear as more input features are added, favoring RF and XGBoost models over linear SVR [19].
4.3. Practical Strategy for in-Season Potato N Status Diagnosis Using a Leaf Sensor and Limitations
PNNC has been used as an industry standard N status indicator for in-season potato N status diagnosis and is therefore used as a reference for comparison here [5].The R2 values of the VNC and WPNC prediction models were higher than those of the PNNC prediction models (i.e., 0.85 – 0.90 vs. 0.75 – 0.79). However, the effectiveness of VNC and WPNC in potato N status diagnosis must be investigated in comparison with PNNC, and if validated, the determination of VNC and WPNC sufficiency ranges is also necessary to be used in place of PNNC. The PNNC sufficiency ranges become progressively narrower and decrease in value across the vegetative, tuber bulking, and maturation stages, reflecting the plant's declining N demand and uptake as plant metabolic apparatus with varying N concentration develops at different rates toward maturation [11]. The decreasing trend of VNC and WPNC sufficiency ranges across growth stages must be characterized with reference to yield or biomass. PNU (i.e., WPNC × AGB) was predicted less accurately, despite the accurate WPNC prediction, indicating the difficulty in predicting ABG using a leaf sensor. The AGB has been more successfully predicted using canopy sensors for corn, rice, and winter wheat [64,65,15,38]. For potato crops, belowground biomass (e.g., tubers) makes the prediction of whole plant biomass using canopy sensors more challenging. Vine NNI and NNI were predicted as accurately as PNNC with an R2 value of approximately 0.80, while the diagnostic accuracy based on predicted vine NNI or NNI was higher than PNNC (Near-fair Kappa value of 0.42 – 0.43 vs. near-substantial Kappa value of 0.54 – 0.58). The improved diagnostic accuracy may be attributed to the less variable and more robust nature of NNI resulting from derivation based on a more holistic (e.g., vines) or whole plant parts. The vine NNI and NNI prediction and diagnostic accuracy was comparable, despite the difficulty of sensing belowground biomass as explained above. Leaf sensor data and plant samples were collected mostly between 60 and 90 days after planting, during which tuber growth is still minimal warranting the high performance of vine NNI [14].
NNI calculation (4) can be modified using AGB,
where PNUc is critical PNU and ΔPNU is the difference between PNUc and PNU at the particular ABG in Mg DM ha-1. This modification clarifies the potential to implement variable rate N (VRN) application according to NNI, where ΔPNU can be converted to N fertilizer application rate using estimated N recovery rate. The capability to implement VRN application favors the NNI calculation through predicted PNU and AGB, as long as the prediction of PNU and AGB is equal to or more accurate than direct prediction of NNI. In our study, PNU was less accurately predicted due to the inability of leaf sensors to account for canopy structure, making this indirect NNI calculation approach unfavored. Even if both PNC and PNU were predicted as accurately as PNNC and NNI, their cumulative error effect in the NNI calculation process must also be carefully evaluated. Therefore, the most practical strategy for in-season potato N status diagnosis using a leaf sensor is to directly predict NNI using the data fusion approach and linear SVR. Vegetation indices (e.g., Normalized Difference Vegetation Index, Normalized Difference Red-Edge Index) calculated using canopy sensors may predict AGB or PNU more accurately, potentially enabling the indirect NNI approach and VRN application. The sensor fusion approach (e.g., leaf and canopy sensor) could also further improve the accuracy and scalability of NNI prediction.
This study used the Nc dilution curves developed by Giletto et al. [14] because they assessed a number of cultivars and both vine and whole plant NNI. Nevertheless, the study was conducted in Canada and Argentina and the exact cultivar matches only included Russet Burbank and Umatilla Russet, resorting to substitution for other cultivars based on maturity class. The reduced irrigation treatments in the 2023 experiment was not taken into account when using the NNI framework either. Bohman et al. [13] found the significant GxExM effect on the determination of Nc dilution curves. The robustness of the NNI framework across major environmental factors was reported by Gastal and Lemaire [66], but the contrasting effects of water stress on Nc have also been reported [67,68]. NNI sufficiency thresholds have been commonly set at 0.95 – 1.05, but this convention also requires reconsideration. Bohman et al. (2023) suggested to use the 95% confidence interval of the posterior distribution of Nc directly or parametrically. Another potential approach is to adjust the sufficiency threshold for each GxExM condition empirically. These limitations do not affect the findings of this study but have implications on decision-making based on the predicted NNI values. More studies on these agronomic topics must be conducted to ensure the accurate recommendations of in-season N fertilizer application for potatoes based on precision agriculture technologies.
5. Conclusions
The SPAD meter and Dualex sensor predicted various in-season potato N status indicators with similar accuracy across site-years, cultivars and N rates, although one sensor might perform better than the other under different conditions. The multi-parametric functionality of Dualex improved prediction over its single parameters but not consistently over the SPAD meter, regardless of model complexity. The data fusion approach using the leaf sensor and GxExM data in sophisticated ML models significantly improved prediction and diagnosis accuracy than using leaf sensor data alone. Linear SVR model demonstrated the most consistent and accurate performance, revealing the linear relationship between the N status indicators and the selected variables including leaf sensor data, cultivar information, accumulated GDDs, accumulated total moisture, and as-applied N rate. Directly predicting NNI using the linear SVR model presented the highest prediction and diagnosis accuracy in the testing datasets with an R² of 0.80 - 0.82, accuracy of 0.75 - 0.77, and a Kappa statistic of 0.54 - 0.58 (near-substantial). The leaf sensors did not perform well for predicting AGB or PNU. Canopy sensors may complement the leaf sensor’s lack of ability to predict AGB and PNU, help derive NNI through predicting its mechanistic components with higher accuracy and enable VRN application. Further research is required to determine the Nc dilution curves and NNI sufficiency ranges of potatoes according to different GxExM conditions for proper decision-making.
Author Contributions
Conceptualization, Y.M.; methodology, S.W and Y.M.; software, S.W.; validation, S.W.; formal analysis, S.W.; investigation, C.R., D.L, J.Z., and S.W.; resources, C.R., S.G., and Y.M.; data curation, D.L, J.Z., and S.W.; writing—original draft preparation, S.W.; writing—review and editing, C.R. and Y.M.; visualization, S.W.; supervision, C.R. and Y.M.; project administration, C.R. and Y.M.; funding acquisition, C.R., S.G., and Y.M. All authors have read and agreed to the published version of the manuscript.
Funding
This research was funded by the Minnesota Department of Agriculture Specialty Crop Block Grant, CON000000098568; Minnesota Area I and Area II Potato Growers Association, CON000000110660; National Institute of Food and Agriculture, State Project: MIN-25-134.
Data Availability Statement
Data will be made available on request.
Acknowledgments
This work was supported by DSI-MnDRIVE Graduate Assistantship. We also would like to acknowledge the contributions of Matthew McNearney, Seonghyun Seo, and Nicholas Brand for field data collection.
Conflicts of Interest
Authors declare no conflicts of interest.
Abbreviations
The following abbreviations are used in this manuscript:
| AGB | Above ground biomass |
| Anth | Anthocyanin |
| BMP | Best management practice |
| Chl | Chlorophyll |
| DAP | Diammonium phosphate |
| DAS | Days after sowing |
| DM | Dry matter |
| Dualex | Dualex Scientific+ |
| ebf_sigma | RBF kernel parameter sigma |
| ESN | Environmentally Smart Nitrogen |
| Flav | Flavonol |
| FN | False negatives |
| FP | False positives |
| GDD | Growing degree days |
| GxExM | Genetic × environmental × management |
| IRR | Irrigation |
| lambda | L2 regularization term |
| LASSO | Least absolute shrinkage and selection operator |
| learn_rate | Learning rate |
| LNC | Leaf nitrogen concentration |
| MAE | Mean absolute error |
| margin | SVR epsilon margin |
| min_n | Minimum samples per node |
| ML | Machine learning |
| mtry | Number of variables randomly selected at each split |
| MLR | Multiple linear regression |
| n | Number of observations |
| N | Nitrogen |
| NBI | Nitrogen balance index |
| Nc | Critical nitrogen concentration |
| NNI | Nitrogen nutrition index |
| NSI | Nitrogen sufficiency index |
| NUE | Nitrogen use efficiency |
| NPNC | Petiole nitrate-nitrogen concentration |
| OM | Organic matter |
| P | Precipitation |
| penalty | L1 regularization term |
| PNC | Plant nitrogen concentration |
| PNNC | Petiole nitrate-N concentration |
| PNR | Percent nitrogen release |
| PNU | Plant nitrogen uptake |
| Pₑ | Expected agreement by chance |
| Pₒ | Observed agreement |
| PS | Proximal sensing |
| R2 | Coefficient of determination |
| RFR | Random forest regression |
| RMSE | Root mean square error |
| RS | Remote sensing |
| sample_size | Proportion of data sampled per tree |
| scale_factor | Scaling factor |
| SHAP | Shapley additive explanation |
| SPAD | Soil plant analysis development |
| SR | Simple regression |
| SVR | Support vector regression |
| TN | True negatives |
| Tmax | Daily maximum temperature |
| Tmin | Daily minimum temperature |
| TP | True positives |
| TNC | Tuber nitrogen concentration |
| trees | Number of trees in the forest |
| UAN | Urea-ammonium nitrate |
| UV | Ultraviolet |
| VIF | Variance information factor |
| VNC | Vine nitrogen concentration |
| VRA | Variable rate application |
| VRN | Variable rate nitrogen |
| W | Plant dry biomass |
| Wt | Dry tuber biomass |
| Wv | Dry vine biomass |
| WPNC | Whole plant nitrogen concentration |
| XGBoost | Extreme gradient boosting |
| yᵢ | Observed value of the i-th observation |
| ŷᵢ | Predicted value of the i-th observation |
| ȳ | Mean of observed values |
Appendix A
Appendix A.1
Table A1.
The relationship between SPAD or Dualex and different N status indicators.
| PNNC | |||
| Sensor | Type | Equation | R2 |
| SPAD | power | y = 4.32 × 10- 10 x8.11 | 0.55 |
| DuxChl | power | y = 8.52 × 10- 5 x5.46 | 0.38 |
| DuxFlav | quadratic | y = - 10342.21 x2 - 129710.52 x + 10896.26 | 0.41 |
| DuxAnth | quadratic | y = - 29994.25 x2 - 73319.01 x + 10896.26 | 0.15 |
| DuxNBI | quadratic | y = - 6568.29 x2 - 149803.83 x + 10896.26 | 0.55 |
|
VNC |
|||
| Sensor | Type | Equation | R2 |
| SPAD | power | y = 4.15 × 10- 3 x1.81 | 0.48 |
| DuxChl | power | y = 7.65 × 10- 2 x1.16 | 0.31 |
| DuxFlav | quadratic | y = - 0.47 x2 - 23.40 x + 3.77 | 0.51 |
| DuxAnth | quadratic | y = - 3.29 x2 - 13.68 x + 3.77 | 0.19 |
| DuxNBI | quadratic | y = - 0.08 x2 + 25.33 x + 3.77 | 0.60 |
|
WPNC |
|||
| Sensor | Type | Equation | R2 |
| SPAD | power | y = 5.84 × 10- 4 x2.28 | 0.52 |
| DuxChl | power | y = 1.98 × 10- 2 x1.50 | 0.35 |
| DuxFlav | exponential | y = 21.26 e- 1.34 x | 0.45 |
| DuxAnth | quadratic | y = - 5.52 x2 - 13.24 x + 3.16 | 0.16 |
| DuxNBI | quadratic | y = 3.37 x2 + 27.71 x + 3.16 | 0.61 |
|
PNU |
|||
| Sensor | Type | Equation | R2 |
| SPAD | quadratic | y = - 488.13 x2 - 247.01 x + 155.02 | 0.11 |
| DuxChl | quadratic | y = - 127.65 x2 - 71.00 x + 155.02 | 0.01 |
| DuxFlav | quadratic | y = - 213.96 x2 + 80.41 x + 155.02 | 0.02 |
| DuxAnth | quadratic | y = 306.50 x2 + 76.48 x + 155.02 | 0.04 |
| DuxNBI | quadratic | y = - 411.87 x2 - 154.86 x + 155.02 | 0.08 |
|
Vine NNI |
|||
| Sensor | Type | Equation | R2 |
| SPAD | power | y = 1.89 × 10- 3 x1.65 | 0.49 |
| DuxChl | quadratic | y = - 2.00 x2 + 3.39 x + 0.941 | 0.31 |
| DuxFlav | quadratic | y = - 0.791 x2 - 5.20 x + 0.941 | 0.55 |
| DuxAnth | quadratic | y = - 1.06 x2 - 1.83 x + 0.941 | 0.09 |
| DuxNBI | power | y = 5.24 × 10- 2 x0.967 | 0.60 |
|
NNI |
|||
| Sensor | Type | Equation | R2 |
| SPAD | power | y = 3.21 × 10- 4 x2.12 | 0.52 |
| DuxChl | power | y = 8.95 × 10- 3 x1.39 | 0.34 |
| DuxFlav | exp | y = 5.42 e- 1.21 x | 0.42 |
| DuxAnth | quadratic | y = - 2.43 x2 - 1.18 x + 0.96 | 0.08 |
| DuxNBI | power | y = 2.99 × 10- 2 x1.16 | 0.54 |
References
- Havlin, J.L.; Tisdale, S.L.; Nelson, W.L.; Beaton, J.D. Nitrogen. In Soil fertility and fertilizers: an introduction to nutrient management; Upper Saddle River, N.J.: Pearson, 2013; pp. 117–184 ISBN 978-0-13-503373-9.
- Errebhi, M.; Rosen, C.J.; Gupta, S.C.; Birong, D.E. Potato Yield Response and Nitrate Leaching as Influenced by Nitrogen Management. Agron. J. 1998, 90, 10–15. [Google Scholar] [CrossRef]
- Lesczynski, D.B.; Tanner, C.B. Seasonal Variation of Root Distribution of Irrigated, Field-Grown Russet Burbank Potato. Am. Potato J. 1976, 53, 69–78. [Google Scholar] [CrossRef]
- Westermann, D.T.; Kleinkopf, G.E.; Porter, L.K. Nitrogen Fertilizer Efficiencies on Potatoes. Am. Potato J. 1988, 65, 377–386. [Google Scholar] [CrossRef]
- Rosen, C.J.; Bierman, P.M. Best Management Practices for Nitrogen Use: Irrigated Potatoes. 2008.
- Errebhi, M.; Rosen, C.J.; Birong, D.E. Calibration of a Petiole Sap Nitrate Test for Irrigated ‘Russet Burbank’ Potato. Commun. Soil Sci. Plant Anal. 1998, 29, 23–35. [Google Scholar] [CrossRef]
- Zhang, H.; Smeal, D.; Arnold, R.N.; Gregory, E.J. Potato Nitrogen Management by Monitoring Petiole Nitrate Level. J. Plant Nutr. 1996, 19, 1405–1412. [Google Scholar] [CrossRef]
- Roberts, S.; Cheng, H.H.; Farrow, F.O. Nitrate Concentration in Potato Petioles from Periodic Applications of 15N-Labeled Ammonium Nitrate Fertilizer. Agron. J. 1989, 81, 271–274. [Google Scholar] [CrossRef]
- Wu, J.; Wang, D.; Rosen, C.J.; Bauer, M.E. Comparison of Petiole Nitrate Concentrations, SPAD Chlorophyll Readings, and QuickBird Satellite Imagery in Detecting Nitrogen Status of Potato Canopies. Field Crops Res. 2007, 101, 96–103. [Google Scholar] [CrossRef]
- Greenwood, D.J.; Lemaire, G.; Gosse, G.; Cruz, P.; Draycott, A.; Neeteson, J.J. Decline in Percentage N of C3 and C4 Crops with Increasing Plant Mass. Ann. Bot. 1990, 66, 425–436. [Google Scholar] [CrossRef]
- Lemaire, G.; Gastal, F. N Uptake and Distribution in Plant Canopies. In Diagnosis of the Nitrogen Status in Crops; Lemaire, G., Ed.; Springer: Berlin, Heidelberg, 1997; pp. 3–43. ISBN 978-3-642-60684-7. [Google Scholar]
- Bélanger, G.; Walsh, J.R.; Richards, J.E.; Milburn, P.H.; Ziadi, N. Critical Nitrogen Curve and Nitrogen Nutrition Index for Potato in Eastern Canada. Am. J. Potato Res. 2001, 78, 355–364. [Google Scholar] [CrossRef]
- Bohman, B.J.; Culshaw-Maurer, M.J.; Ben Abdallah, F.; Giletto, C.; Bélanger, G.; Fernández, F.G.; Miao, Y.; Mulla, D.J.; Rosen, C.J. Quantifying Critical N Dilution Curves across G × E × M Effects for Potato Using a Partially-Pooled Bayesian Hierarchical Method. Eur. J. Agron. 2023, 144, 126744. [Google Scholar] [CrossRef]
- Giletto, C.M.; Reussi Calvo, N.I.; Sandaña, P.; Echeverría, H.E.; Bélanger, G. Shoot- and Tuber-Based Critical Nitrogen Dilution Curves for the Prediction of the N Status in Potato. Eur. J. Agron. 2020, 119, 126114. [Google Scholar] [CrossRef]
- Lu, J.; Dai, E.; Miao, Y.; Kusnierek, K. Improving Active Canopy Sensor-Based in-Season Rice Nitrogen Status Diagnosis and Recommendation Using Multi-Source Data Fusion with Machine Learning. J. Clean. Prod. 2022, 380, 134926. [Google Scholar] [CrossRef]
- Mulla, D.J. Twenty Five Years of Remote Sensing in Precision Agriculture: Key Advances and Remaining Knowledge Gaps. Biosyst. Eng. 2013, 114, 358–371. [Google Scholar] [CrossRef]
- Gianquinto, G.; Goffart, J.P.; Olivier, M.; Guarda, G.; Colauzzi, M.; Dalla Costa, L.; Delle Vedove, G.; Vos, J.; Mackerron, D.K.L. The Use of Hand-Held Chlorophyll Meters as a Tool to Assess the Nitrogen Status and to Guide Nitrogen Fertilization of Potato Crop. Potato Res. 2004, 47, 35–80. [Google Scholar] [CrossRef]
- Vos, J.; Bom, M. Hand-Held Chlorophyll Meter: A Promising Tool to Assess the Nitrogen Status of Potato Foliage. Potato Res. 1993, 36, 301–308. [Google Scholar] [CrossRef]
- Wakahara, S.; Miao, Y.; McNearney, M.; Rosen, C.J. Non-Destructive Potato Petiole Nitrate-Nitrogen Prediction Using Chlorophyll Meter and Multi-Source Data Fusion with Machine Learning. Eur. J. Agron. 2025, 164, 127483. [Google Scholar] [CrossRef]
- Nigon, T.J.; Mulla, D.J.; Rosen, C.J.; Cohen, Y.; Alchanatis, V.; Rud, R. Evaluation of the Nitrogen Sufficiency Index for Use with High Resolution, Broadband Aerial Imagery in a Commercial Potato Field. Precis. Agric. 2014, 15, 202–226. [Google Scholar] [CrossRef]
- Giletto, C.M.; Echeverría, H.E. Chlorophyll Meter for the Evaluation of Potato N Status. Am. J. Potato Res. 2013, 90, 313–323. [Google Scholar] [CrossRef]
- Zheng, H.; Liu, Y.; Qin, Y.; Chen, Y.; Fan, M. Establishing Dynamic Thresholds for Potato Nitrogen Status Diagnosis with the SPAD Chlorophyll Meter. J. Integr. Agric. 2015, 14, 190–195. [Google Scholar] [CrossRef]
- Fernandes, F.M.; Soratto, R.P.; Fernandes, A.M.; Souza, E.F.C. Chlorophyll Meter-Based Leaf Nitrogen Status to Manage Nitrogen in Tropical Potato Production. Agron. J. 2021, 113, 1733–1746. [Google Scholar] [CrossRef]
- Goffart, J.P.; Olivier, M.; Frankinet, M. Potato Crop Nitrogen Status Assessment to Improve N Fertilization Management and Efficiency: Past–Present–Future. Potato Res. 2008, 51, 355–383. [Google Scholar] [CrossRef]
- Mohammed, G.H.; Colombo, R.; Middleton, E.M.; Rascher, U.; van der Tol, C.; Nedbal, L.; Goulas, Y.; Pérez-Priego, O.; Damm, A.; Meroni, M.; et al. Remote Sensing of Solar-Induced Chlorophyll Fluorescence (SIF) in Vegetation: 50 years of Progress. Remote Sens. Environ. 2019, 231, 111177. [Google Scholar] [CrossRef]
- Tremblay, N.; Wang, Z.; Cerovic, Z.G. Sensing Crop Nitrogen Status with Fluorescence Indicators. A Review. Agron. Sustain. Dev. 2012, 32, 451–464. [Google Scholar] [CrossRef]
- Cerovic, Z.G.; Masdoumier, G.; Ghozlen, N.B.; Latouche, G. A New Optical Leaf-clip Meter for Simultaneous Non-destructive Assessment of Leaf Chlorophyll and Epidermal Flavonoids. Physiol. Plant. 2012, 146, 251–260. [Google Scholar] [CrossRef] [PubMed]
- Feng, W.; He, L.; Zhang, H.-Y.; Guo, B.-B.; Zhu, Y.-J.; Wang, C.-Y.; Guo, T.-C. Assessment of Plant Nitrogen Status Using Chlorophyll Fluorescence Parameters of the Upper Leaves in Winter Wheat. Eur. J. Agron. 2015, 64, 78–87. [Google Scholar] [CrossRef]
- Ben Abdallah, F.; Philippe, W.; Goffart, J.P. Comparison of Optical Indicators for Potato Crop Nitrogen Status Assessment Including Novel Approaches Based on Leaf Fluorescence and Flavonoid Content. J. Plant Nutr. 2018, 41, 2705–2728. [Google Scholar] [CrossRef]
- Liu, Q.; Wang, C.; Jiang, J.; Wu, J.; Wang, X.; Cao, Q.; Tian, Y.; Zhu, Y.; Cao, W.; Liu, X. Multi-Source Data Fusion Improved the Potential of Proximal Fluorescence Sensors in Predicting Nitrogen Nutrition Status across Winter Wheat Growth Stages. Comput. Electron. Agric. 2024, 219, 108786. [Google Scholar] [CrossRef]
- Dong, R.; Miao, Y.; Wang, X.; Chen, Z.; Yuan, F.; Zhang, W.; Li, H. Estimating Plant Nitrogen Concentration of Maize Using a Leaf Fluorescence Sensor across Growth Stages. Remote Sens. 2020, 12, 1139. [Google Scholar] [CrossRef]
- Dong, R.; Miao, Y.; Wang, X.; Yuan, F.; Kusnierek, K. Combining Leaf Fluorescence and Active Canopy Reflectance Sensing Technologies to Diagnose Maize Nitrogen Status across Growth Stages. Precis. Agric. 2022, 23, 939–960. [Google Scholar] [CrossRef]
- Padilla, F.M.; Peña-Fleitas, M.T.; Gallardo, M.; Thompson, R.B. Proximal Optical Sensing of Cucumber Crop N Status Using Chlorophyll Fluorescence Indices. Eur. J. Agron. 2016, 73, 83–97. [Google Scholar] [CrossRef]
- Huang, S.; Miao, Y.; Yuan, F.; Cao, Q.; Ye, H.; Lenz-Wiedemann, V.I.S.; Bareth, G. In-Season Diagnosis of Rice Nitrogen Status Using Proximal Fluorescence Canopy Sensor at Different Growth Stages. Remote Sens. 2019, 11, 1847. [Google Scholar] [CrossRef]
- Li, J.W.; Zhang, J.X.; Zhao, Z.; Lei, X.D.; Xu, X.L.; Lu, X.X.; Weng, D.L.; Gao, Y.; Cao, L.K. Use of Fluorescence-Based Sensors to Determine the Nitrogen Status of Paddy Rice. J. Agric. Sci. 2013, 151, 862–871. [Google Scholar] [CrossRef]
- Chlingaryan, A.; Sukkarieh, S.; Whelan, B. Machine Learning Approaches for Crop Yield Prediction and Nitrogen Status Estimation in Precision Agriculture: A Review. Comput. Electron. Agric. 2018, 151, 61–69. [Google Scholar] [CrossRef]
- Dong, R.; Miao, Y.; Wang, X.; Chen, Z.; Yuan, F. Improving Maize Nitrogen Nutrition Index Prediction Using Leaf Fluorescence Sensor Combined with Environmental and Management Variables. Field Crops Res. 2021, 269, 108180. [Google Scholar] [CrossRef]
- Li, D.; Miao, Y.; Ransom, C.J.; Bean, G.M.; Kitchen, N.R.; Fernández, F.G.; Sawyer, J.E.; Camberato, J.J.; Carter, P.R.; Ferguson, R.B.; et al. Corn Nitrogen Nutrition Index Prediction Improved by Integrating Genetic, Environmental, and Management Factors with Active Canopy Sensing Using Machine Learning. Remote Sens. 2022, 14, 394. [Google Scholar] [CrossRef]
- Li, D.; Miao, Y.; Gupta, S.K.; Rosen, C.J.; Yuan, F.; Wang, C.; Wang, L.; Huang, Y. Improving Potato Yield Prediction by Combining Cultivar Information and UAV Remote Sensing Data Using Machine Learning. Remote Sens. 2021, 13, 3322. [Google Scholar] [CrossRef]
- Wang, X.; Miao, Y.; Dong, R.; Kusnierek, K. Minimizing Active Canopy Sensor Differences in Nitrogen Status Diagnosis and In-Season Nitrogen Recommendation for Maize with Multi-Source Data Fusion and Machine Learning. Precis. Agric. 2023, 24, 2549–2565. [Google Scholar] [CrossRef]
- Wang, X.; Miao, Y.; Dong, R.; Zha, H.; Xia, T.; Chen, Z.; Kusnierek, K.; Mi, G.; Sun, H.; Li, M. Machine Learning-Based in-Season Nitrogen Status Diagnosis and Side-Dress Nitrogen Recommendation for Corn. Eur. J. Agron. 2021, 123, 126193. [Google Scholar] [CrossRef]
- Zha, H.; Miao, Y.; Wang, T.; Li, Y.; Zhang, J.; Sun, W.; Feng, Z.; Kusnierek, K. Improving Unmanned Aerial Vehicle Remote Sensing-Based Rice Nitrogen Nutrition Index Prediction with Machine Learning. Remote Sens. 2020, 12, 215. [Google Scholar] [CrossRef]
- Gupta, S. Nitrogen Fertilization Rate and Cold-Induced Sweetening in Potato Tubers during Storage.; 2018; pp. 12–19;.
- Gupta, S.; Rosen, C. Nitrogen Fertilization Rate and Cold-Induced Sweetening in Potato Tubers During Storage; 2019; pp. 13–20;.
- Miao, Y.; Wakahara, S.; Rosen, C.; Gupta, S. Proximal Sensing-Based Non-Destructive Diagnosis of Potato Nitrogen Status; 2022; pp. 4–14;.
- Miao, Y.; Wakahara, S.; Sharma, V.; McNearney, M.; Crants, J.; Rosen, C. Developing Variable Rate Nitrogen and Water Management Strategies for Sustainable Potato Production; 2024; pp. 148–166;.
- Egal, D. Midwest Vegetable Production Guide for Commercial Growers 2024. Available online: https://edustore.purdue.edu/ (accessed on 11 January 2025).
- Carlson, R.M.; Cabrera, R.I.; Paul, J.L.; Quick, J.; Evans, R.Y. Rapid Direct Determination of Ammonium and Nitrate in Soil and Plant Tissue Extracts. Commun. Soil Sci. Plant Anal. 1990, 21, 1519–1529. [Google Scholar] [CrossRef]
- Worthington, C.; Hutchinson, C. Accumulated Growing Degree Days as a Model to Determine Key Developmental Stages and Evaluate Yield and Quality of Potato in Northeast Florida. 2006.
- Steele, D.; Scherer, T.; Hopkins, D.; Tuscherer, S.; Wright, J. Spreadsheet Implementation of Irrigation Scheduling by the Checkbook Method for North Dakota and Minnesota. Appl. Eng. Agric. 2010, 26. [Google Scholar] [CrossRef]
- Wilson, M.L.; Rosen, C.J.; Moncrief, J.F. Potato Response to a Polymer-Coated Urea on an Irrigated, Coarse-Textured Soil. Agron. J. 2009, 101, 897–905. [Google Scholar] [CrossRef]
- Kursa, M.B.; Rudnicki, W.R. Feature Selection with the Boruta Package. J. Stat. Softw. 2010, 36, 1–13. [Google Scholar] [CrossRef]
- Kuhn, M.; Wickham, H. Tidymodels: A Collection of Packages for Modeling and Machine Learning Using Tidyverse Principles. 2020.
- Chen, T.; He, T.; Benesty, M.; Khotilovich, V.; Tang, Y.; Cho, H.; Chen, K.; Mitchell, R.; Cano, I.; Zhou, T.; et al. Xgboost: Extreme Gradient Boosting 2024.
- Friedman, J.H.; Hastie, T.; Tibshirani, R. Regularization Paths for Generalized Linear Models via Coordinate Descent. J. Stat. Softw. 2010, 33, 1–22. [Google Scholar] [CrossRef]
- Karatzoglou, A.; Smola, A.; Hornik, K.; Australia (NICTA), N.I.; Maniscalco, M.A.; Teo, C.H. Kernlab: Kernel-Based Machine Learning Lab 2024.
- Wright, M.N.; Ziegler, A. Ranger: A Fast Implementation of Random Forests for High Dimensional Data in C++ and R. J. Stat. Softw. 2017, 77, 1–17. [Google Scholar] [CrossRef]
- Landis, J.R.; Koch, G.G. The Measurement of Observer Agreement for Categorical Data. Biometrics 1977, 33, 159–174. [Google Scholar] [CrossRef]
- Lundberg, S.; Lee, S.-I. A Unified Approach to Interpreting Model Predictions 2017.
- Molnar, C.; Casalicchio, G.; Bischl, B. Iml: An R Package for Interpretable Machine Learning. J. Open Source Softw. 2018, 3, 786. [Google Scholar] [CrossRef]
- Mayer, M.; Stando, A. Shapviz: SHAP Visualizations 2025.
- R Core Team R: A Language and Environment for Statistical Computing 2024.
- Thornton, M. Potato Growth and Development. In Potato Production Systems; Stark, J.C., Thornton, M., Nolte, P., Eds.; Springer International Publishing: Cham, 2020; pp. 19–33. ISBN 978-3-030-39157-7. [Google Scholar]
- Cao, Q.; Miao, Y.; Feng, G.; Gao, X.; Li, F.; Liu, B.; Yue, S.; Cheng, S.; Ustin, S.L.; Khosla, R. Active Canopy Sensing of Winter Wheat Nitrogen Status: An Evaluation of Two Sensor Systems. Comput. Electron. Agric. 2015, 112, 54–67. [Google Scholar] [CrossRef]
- Lu, J.; Miao, Y.; Shi, W.; Li, J.; Yuan, F. Evaluating Different Approaches to Non-Destructive Nitrogen Status Diagnosis of Rice Using Portable RapidSCAN Active Canopy Sensor. Sci. Rep. 2017, 7, 14073. [Google Scholar] [CrossRef]
- Gastal, F.; Lemaire, G. N Uptake and Distribution in Crops: An Agronomical and Ecophysiological Perspective. J. Exp. Bot. 2002, 53, 789–799. [Google Scholar] [CrossRef]
- Errecart, P.M.; Agnusdei, M.G.; Lattanzi, F.A.; Marino, M.A.; Berone, G.D. Critical Nitrogen Concentration Declines with Soil Water Availability in Tall Fescue. Crop Sci. 2014, 54, 318–330. [Google Scholar] [CrossRef]
- Kunrath, T.R.; Lemaire, G.; Sadras, V.O.; Gastal, F. Water Use Efficiency in Perennial Forage Species: Interactions between Nitrogen Nutrition and Water Deficit. Field Crops Res. 2018, 222, 1–11. [Google Scholar] [CrossRef]
Figure 1.
Annual temperature and precipitation.
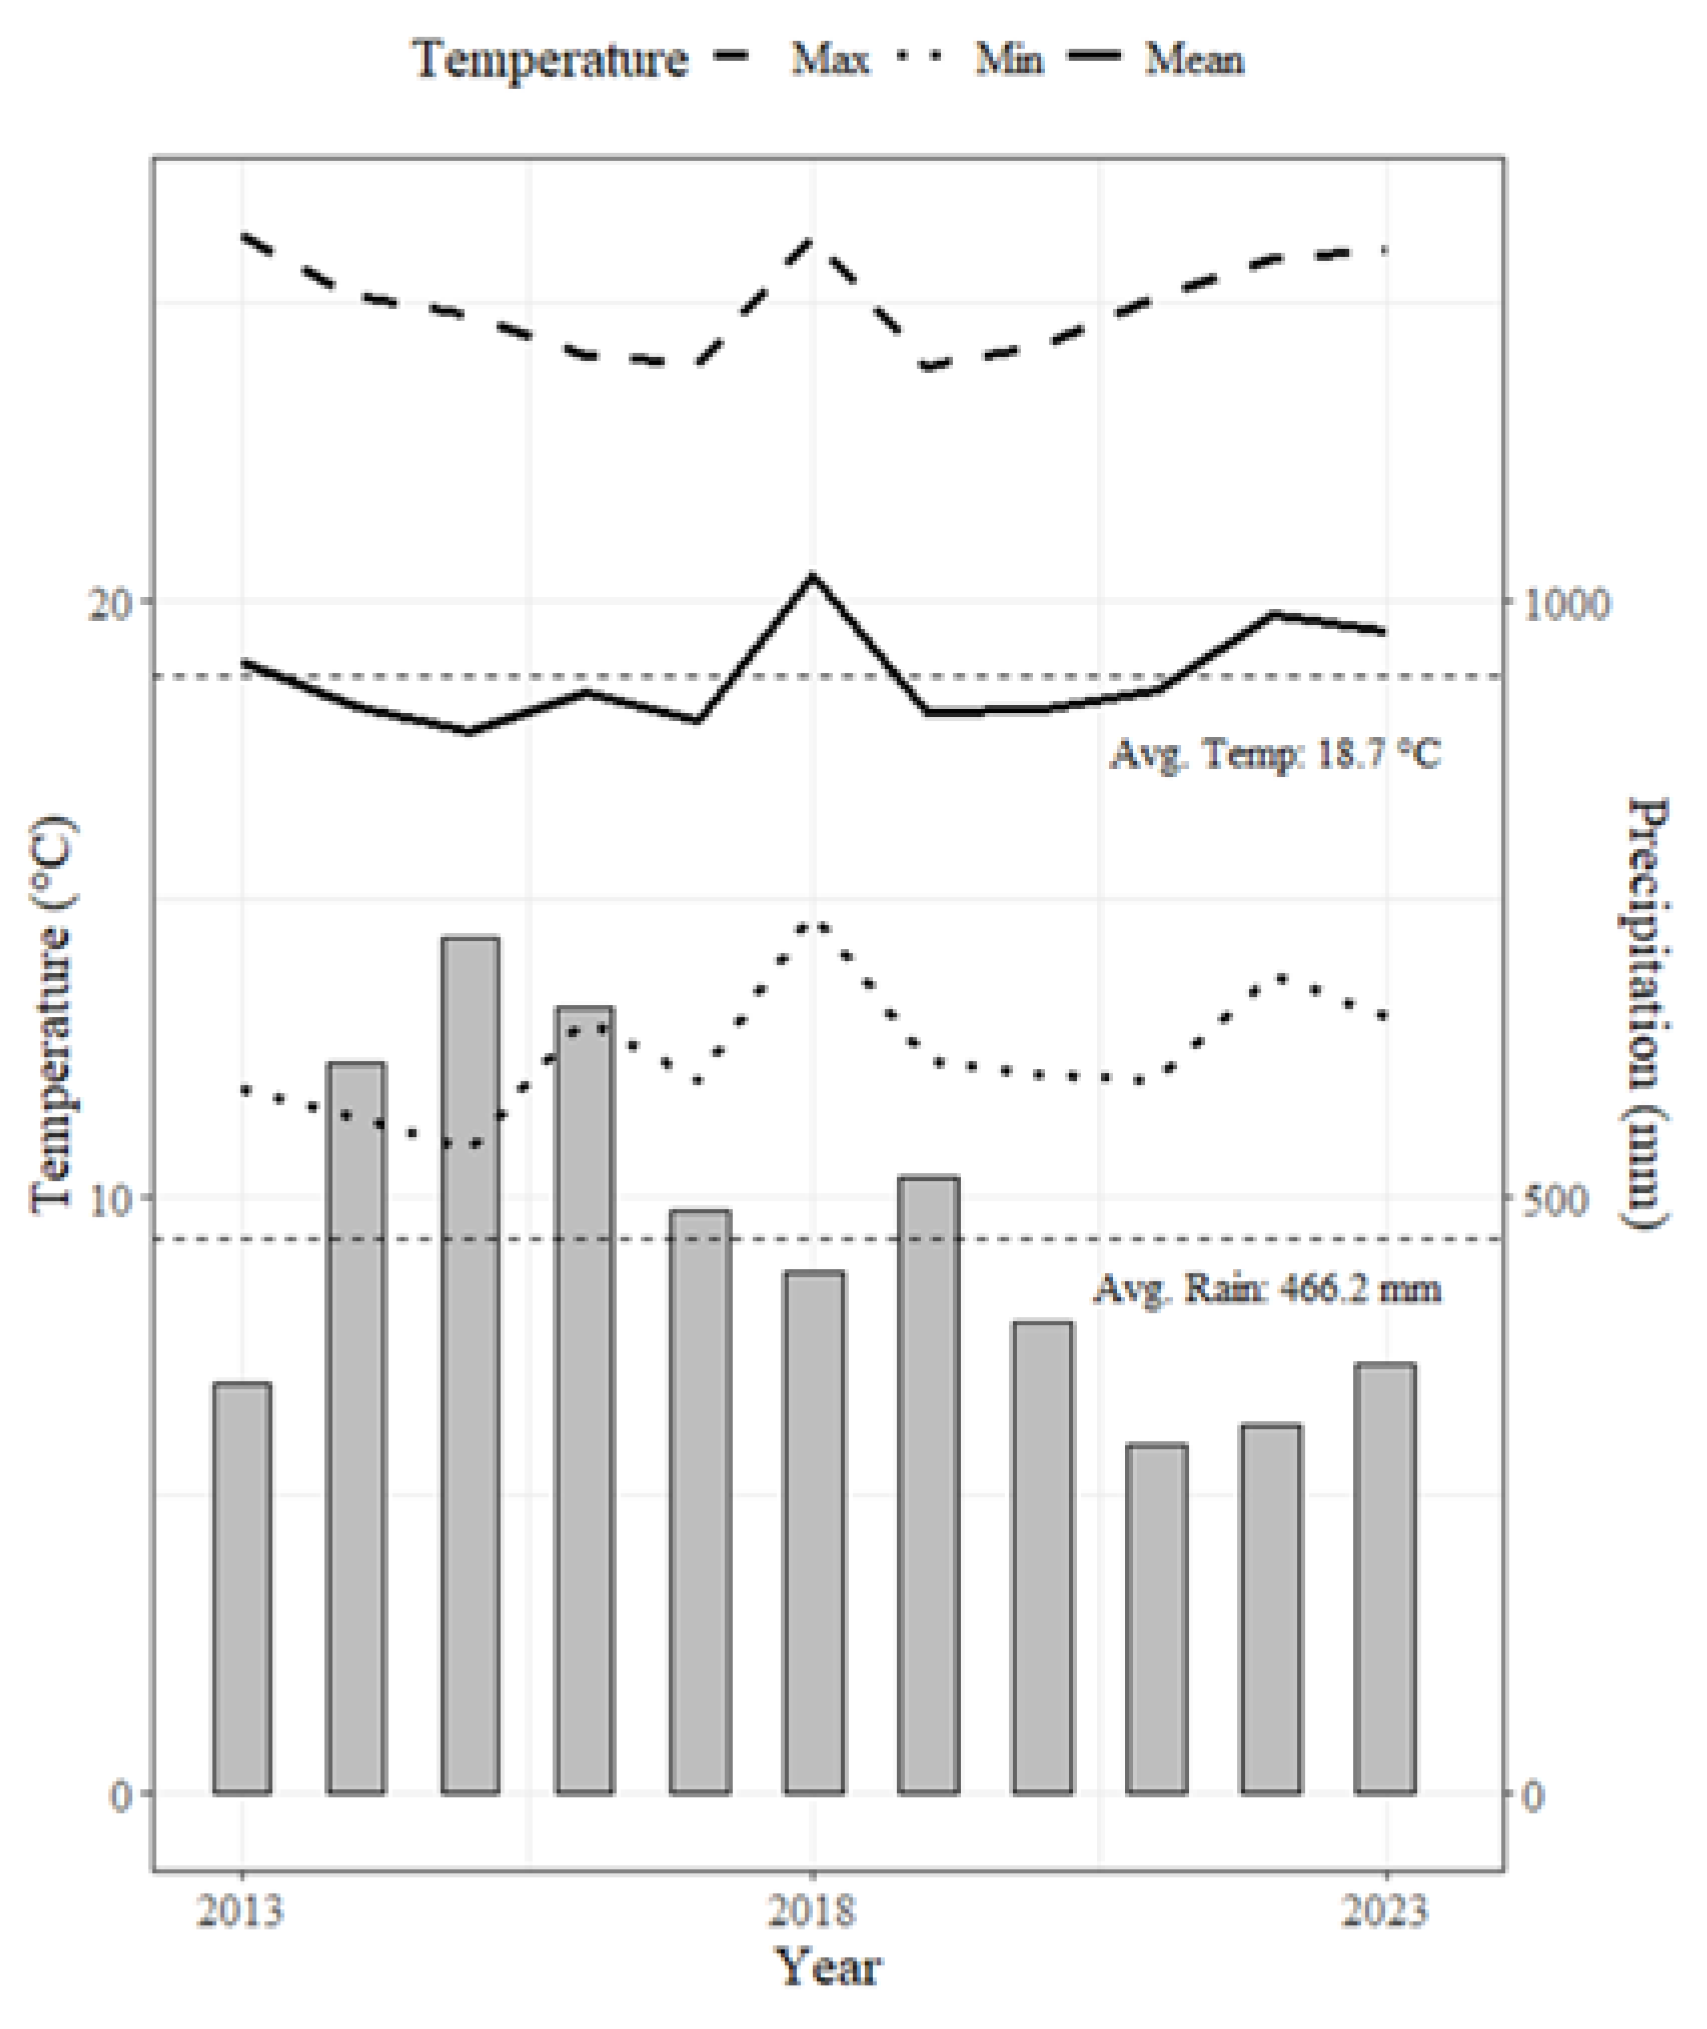
Figure 2.
The cross-validation results of the best simple regression models using SPAD or Dualex. (a) PNNC – SPAD, (b) PNNC – NBI, (c) VNC – SPAD, (d) VNC – NBI, (e) WPNC – SPAD, (f) WPNC – NBI, (g) PNU – SPAD, (h) PNU – NBI, (i) vine NNI – SPAD, (j) vine NNI – NBI, (k) NNI – SPAD, (l) NNI – NBI. (a), (c), (e), (i), (j), (k), (h) are power regressions and the rest of them is quadratic regressions.
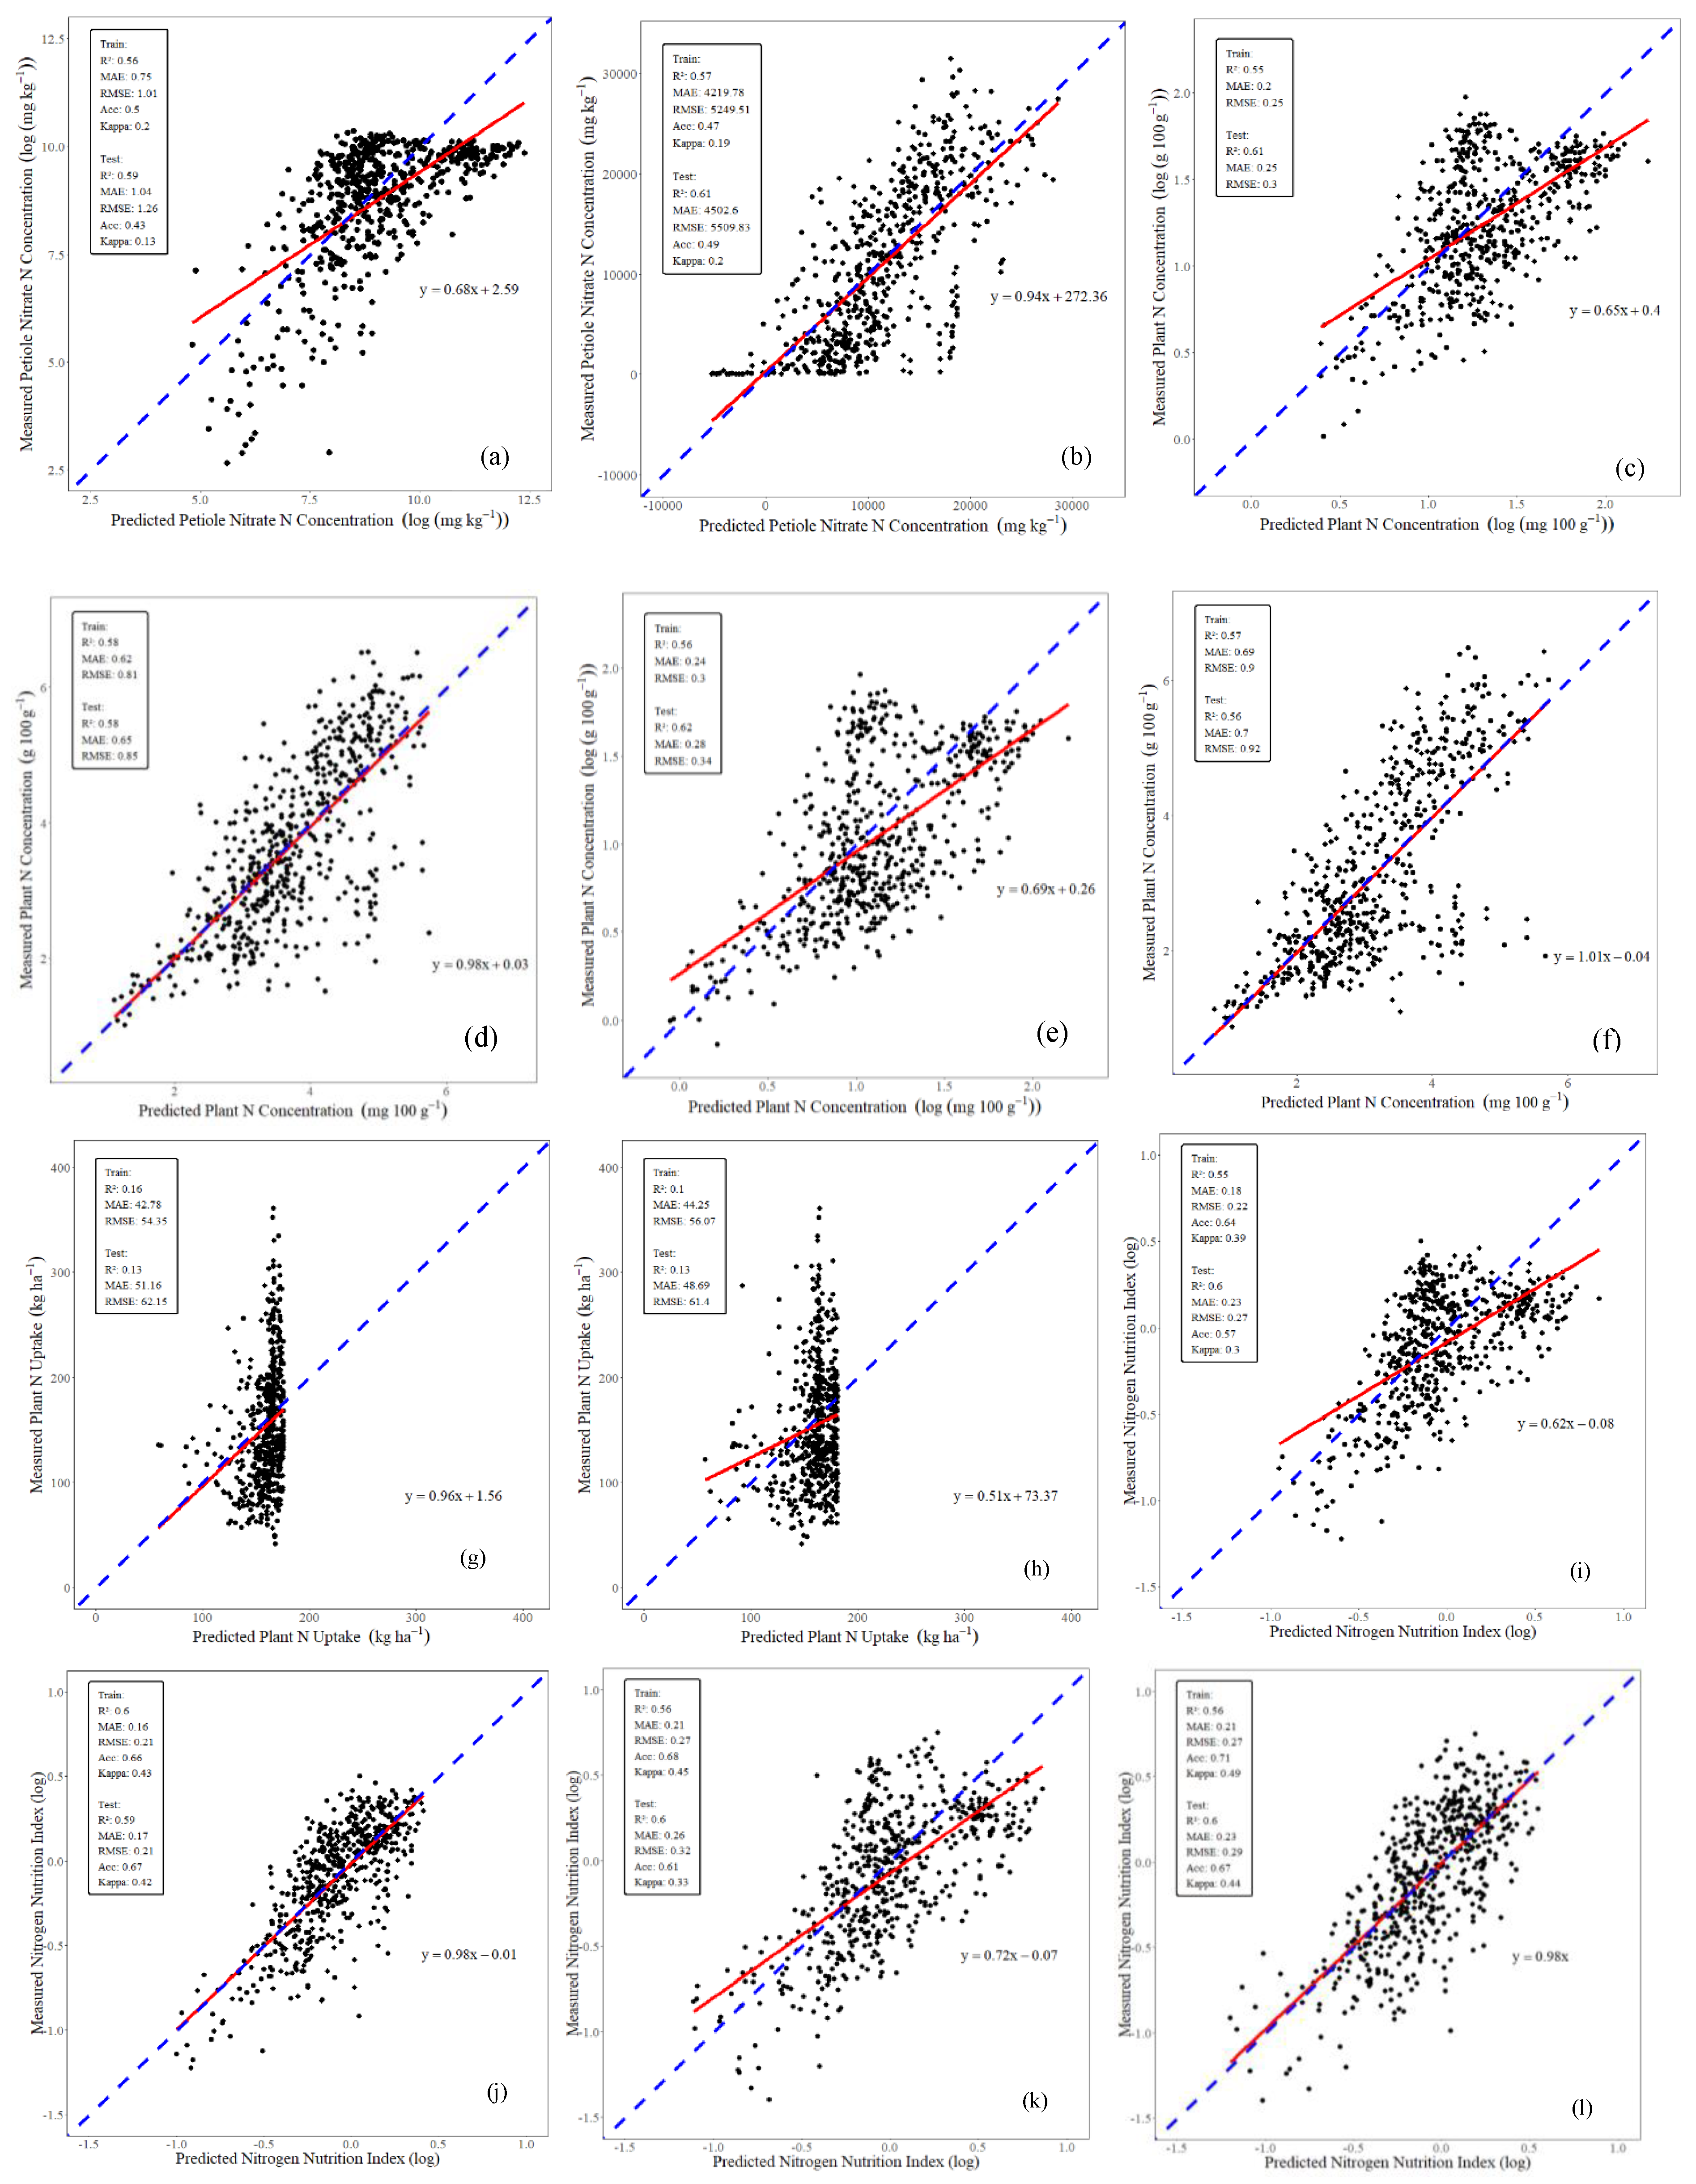
Figure 3.
The cross-validation results of the LASSO regression models using SPAD or Dualex. (a) PNNC – SPAD, (b) PNNC – NBI, (c) VNC – SPAD, (d) VNC – NBI, (e) WPNC – SPAD, (f) WPNC – NBI, (g) PNU – SPAD, (h) PNU – NBI, (i) vine NNI – SPAD, (j) vine NNI – NBI, (k) NNI – SPAD, (l) NNI – NBI.
Figure 3.
The cross-validation results of the LASSO regression models using SPAD or Dualex. (a) PNNC – SPAD, (b) PNNC – NBI, (c) VNC – SPAD, (d) VNC – NBI, (e) WPNC – SPAD, (f) WPNC – NBI, (g) PNU – SPAD, (h) PNU – NBI, (i) vine NNI – SPAD, (j) vine NNI – NBI, (k) NNI – SPAD, (l) NNI – NBI.
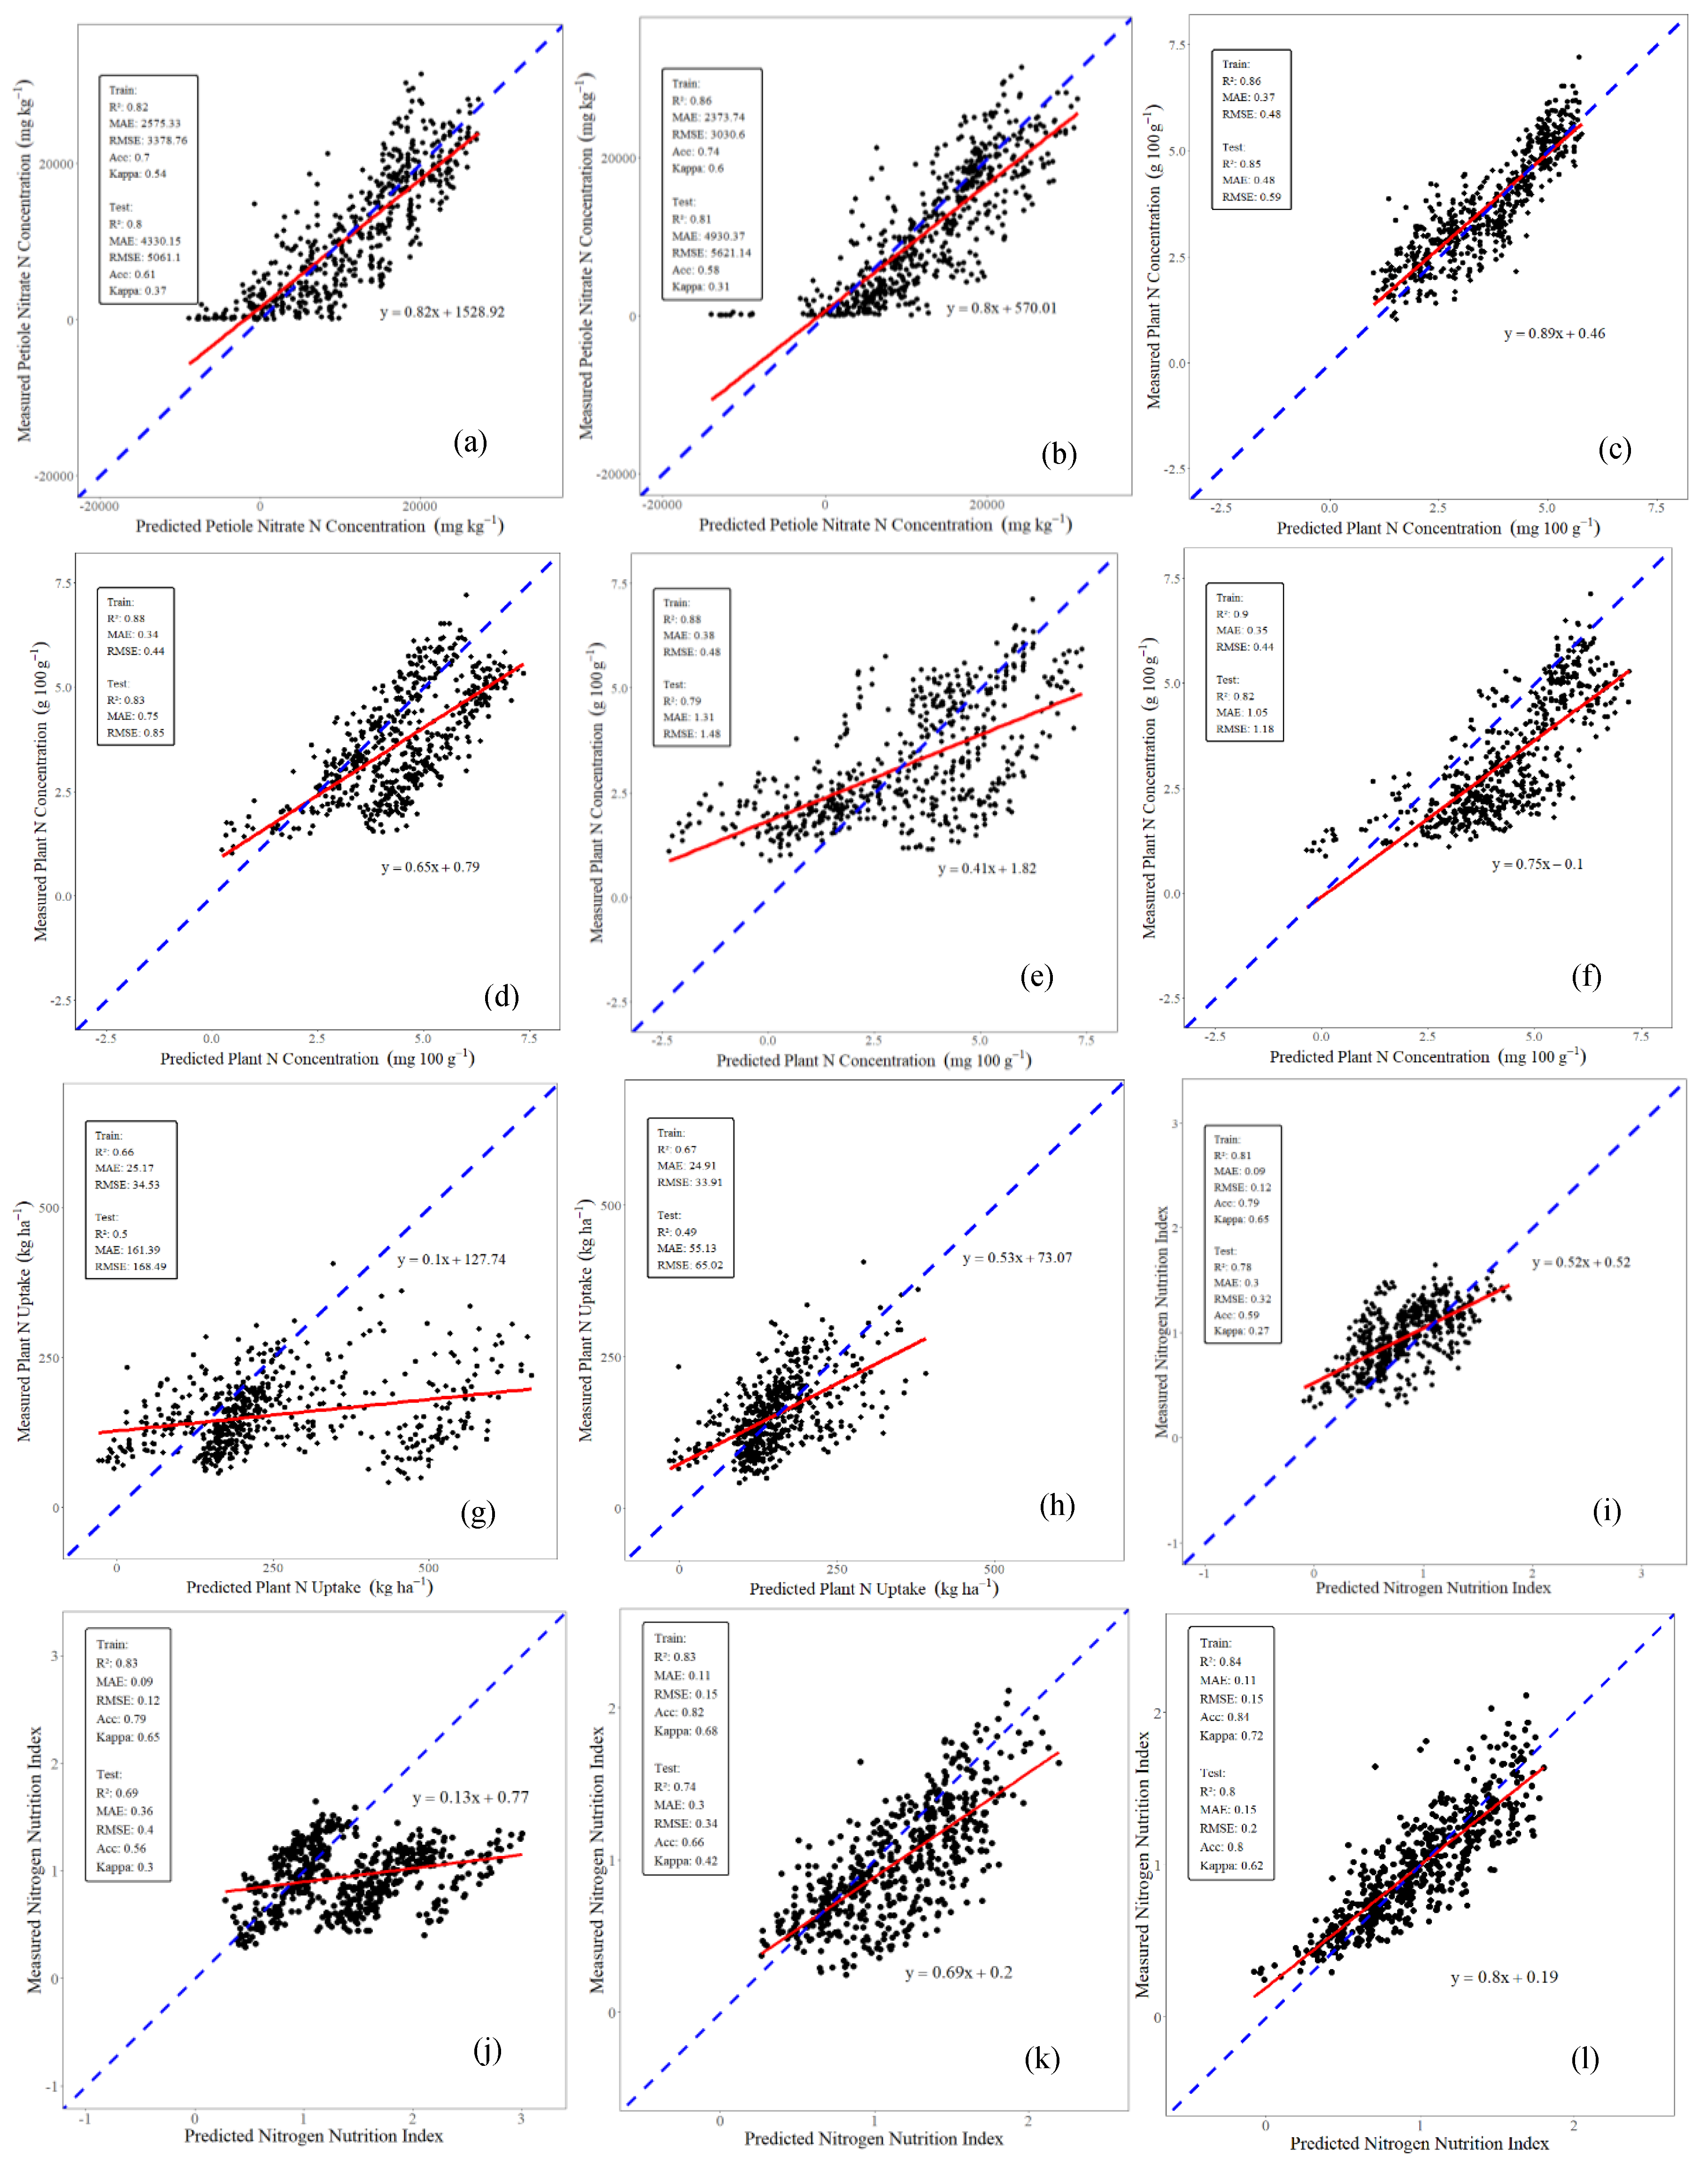
Figure 4.
Visualization of feature importance based on the LASSO regression coefficient values. (a) PNNC – SPAD, (b) PNNC – NBI, (c) VNC – SPAD, (d) VNC – NBI, (e) WPNC – SPAD, (f) WPNC – NBI, (g) PNU – SPAD, (h) PNU – NBI, (i) vine NNI – SPAD, (j) vine NNI – NBI, (k) NNI – SPAD, (l) NNI – NBI.
Figure 4.
Visualization of feature importance based on the LASSO regression coefficient values. (a) PNNC – SPAD, (b) PNNC – NBI, (c) VNC – SPAD, (d) VNC – NBI, (e) WPNC – SPAD, (f) WPNC – NBI, (g) PNU – SPAD, (h) PNU – NBI, (i) vine NNI – SPAD, (j) vine NNI – NBI, (k) NNI – SPAD, (l) NNI – NBI.
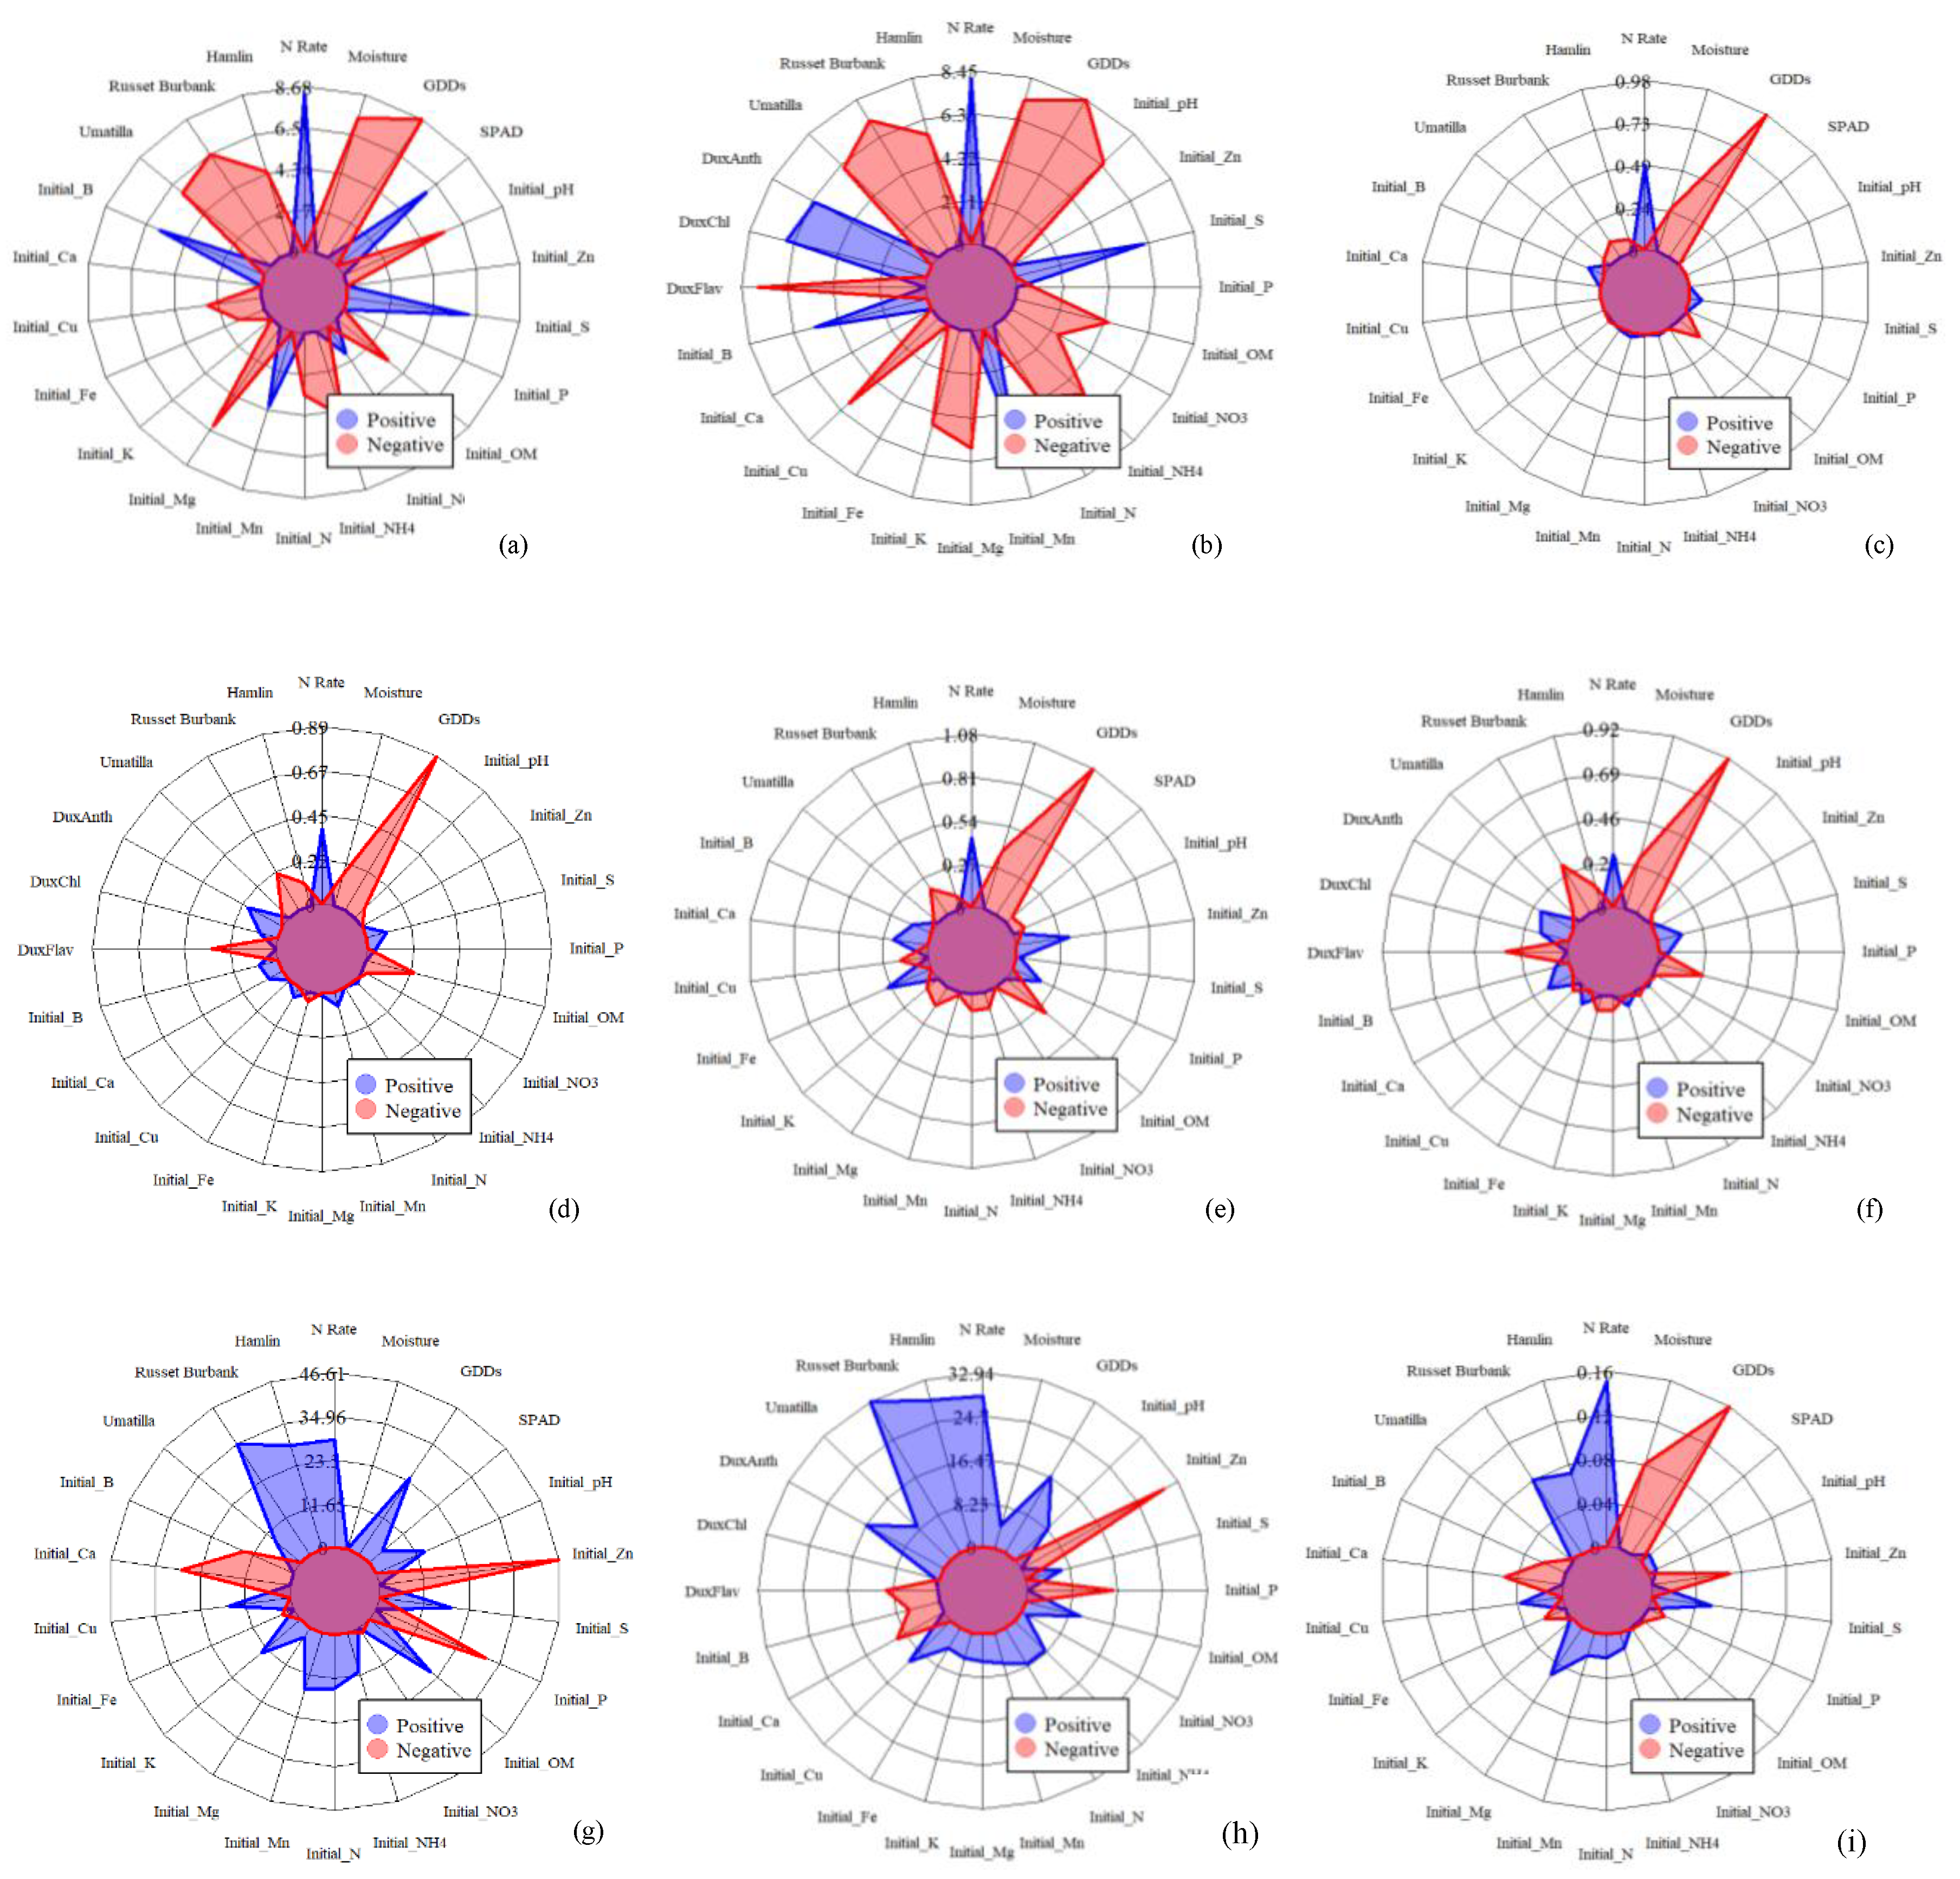
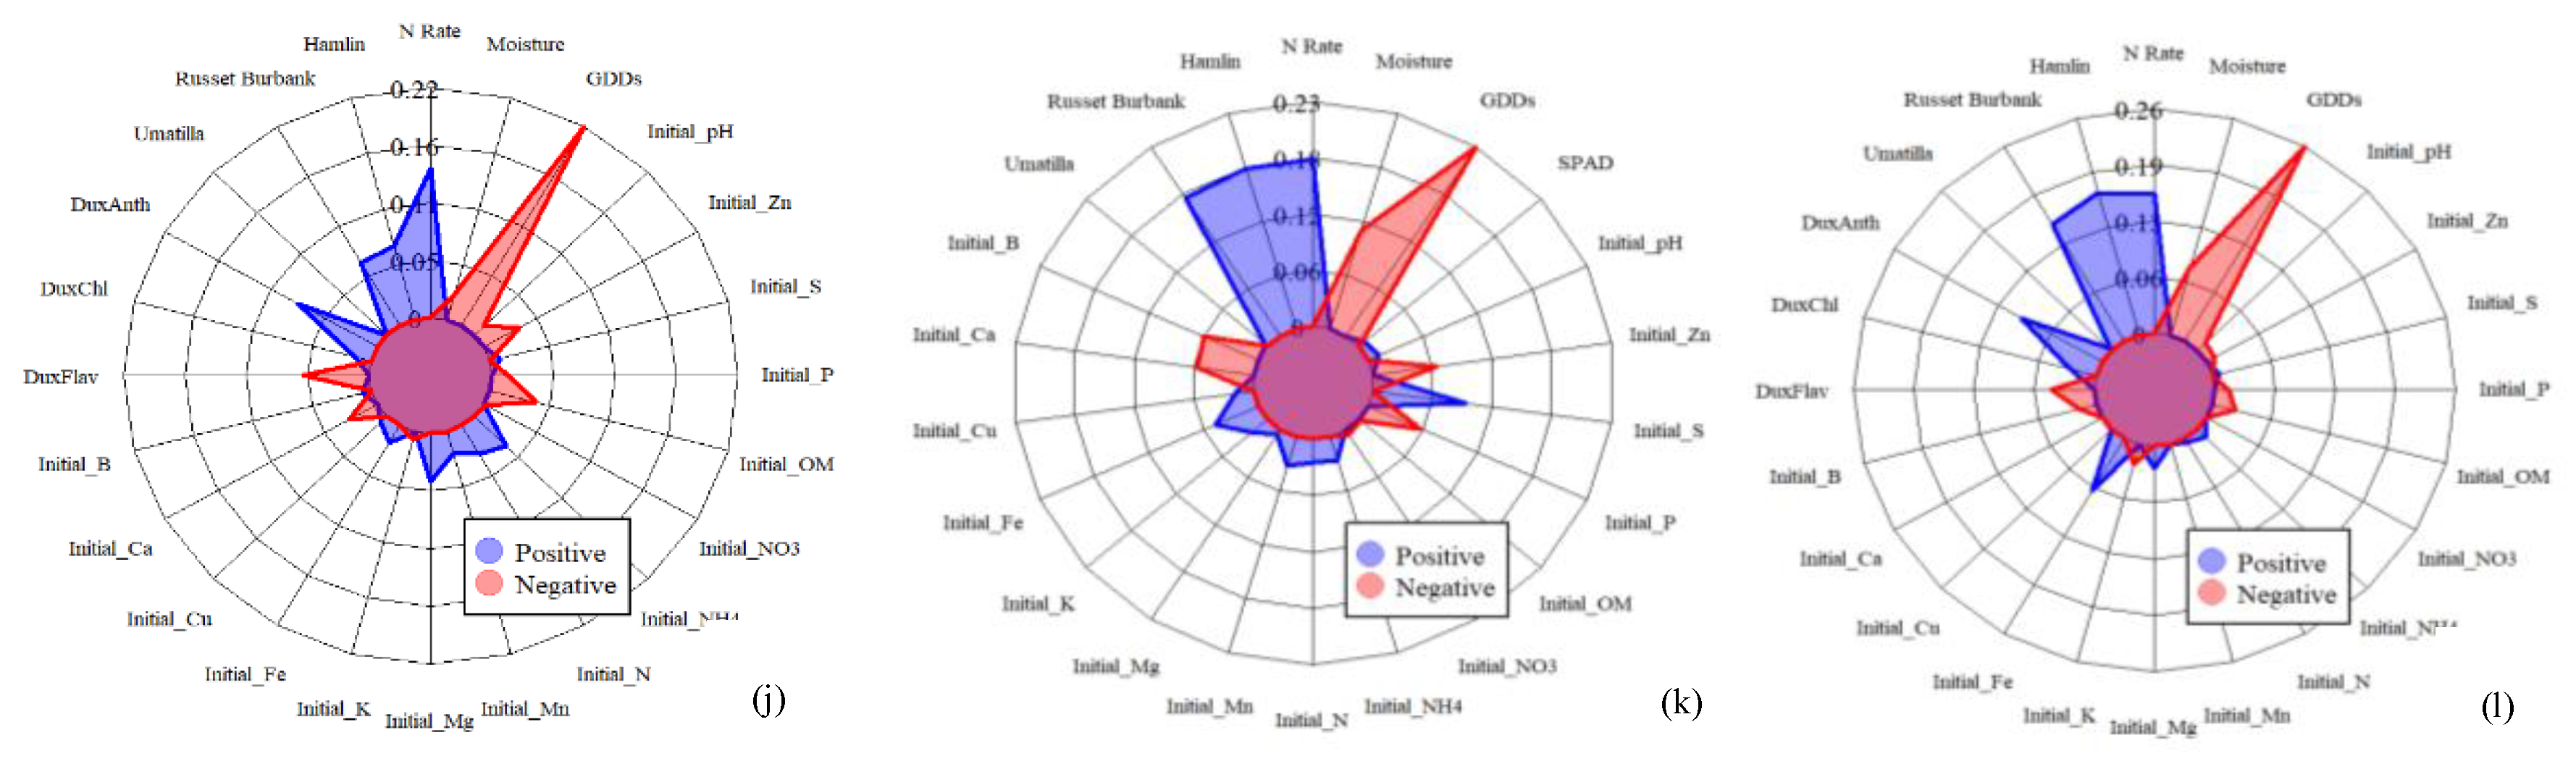
Figure 5.
Pooled permutation-based feature importance results using random forest.
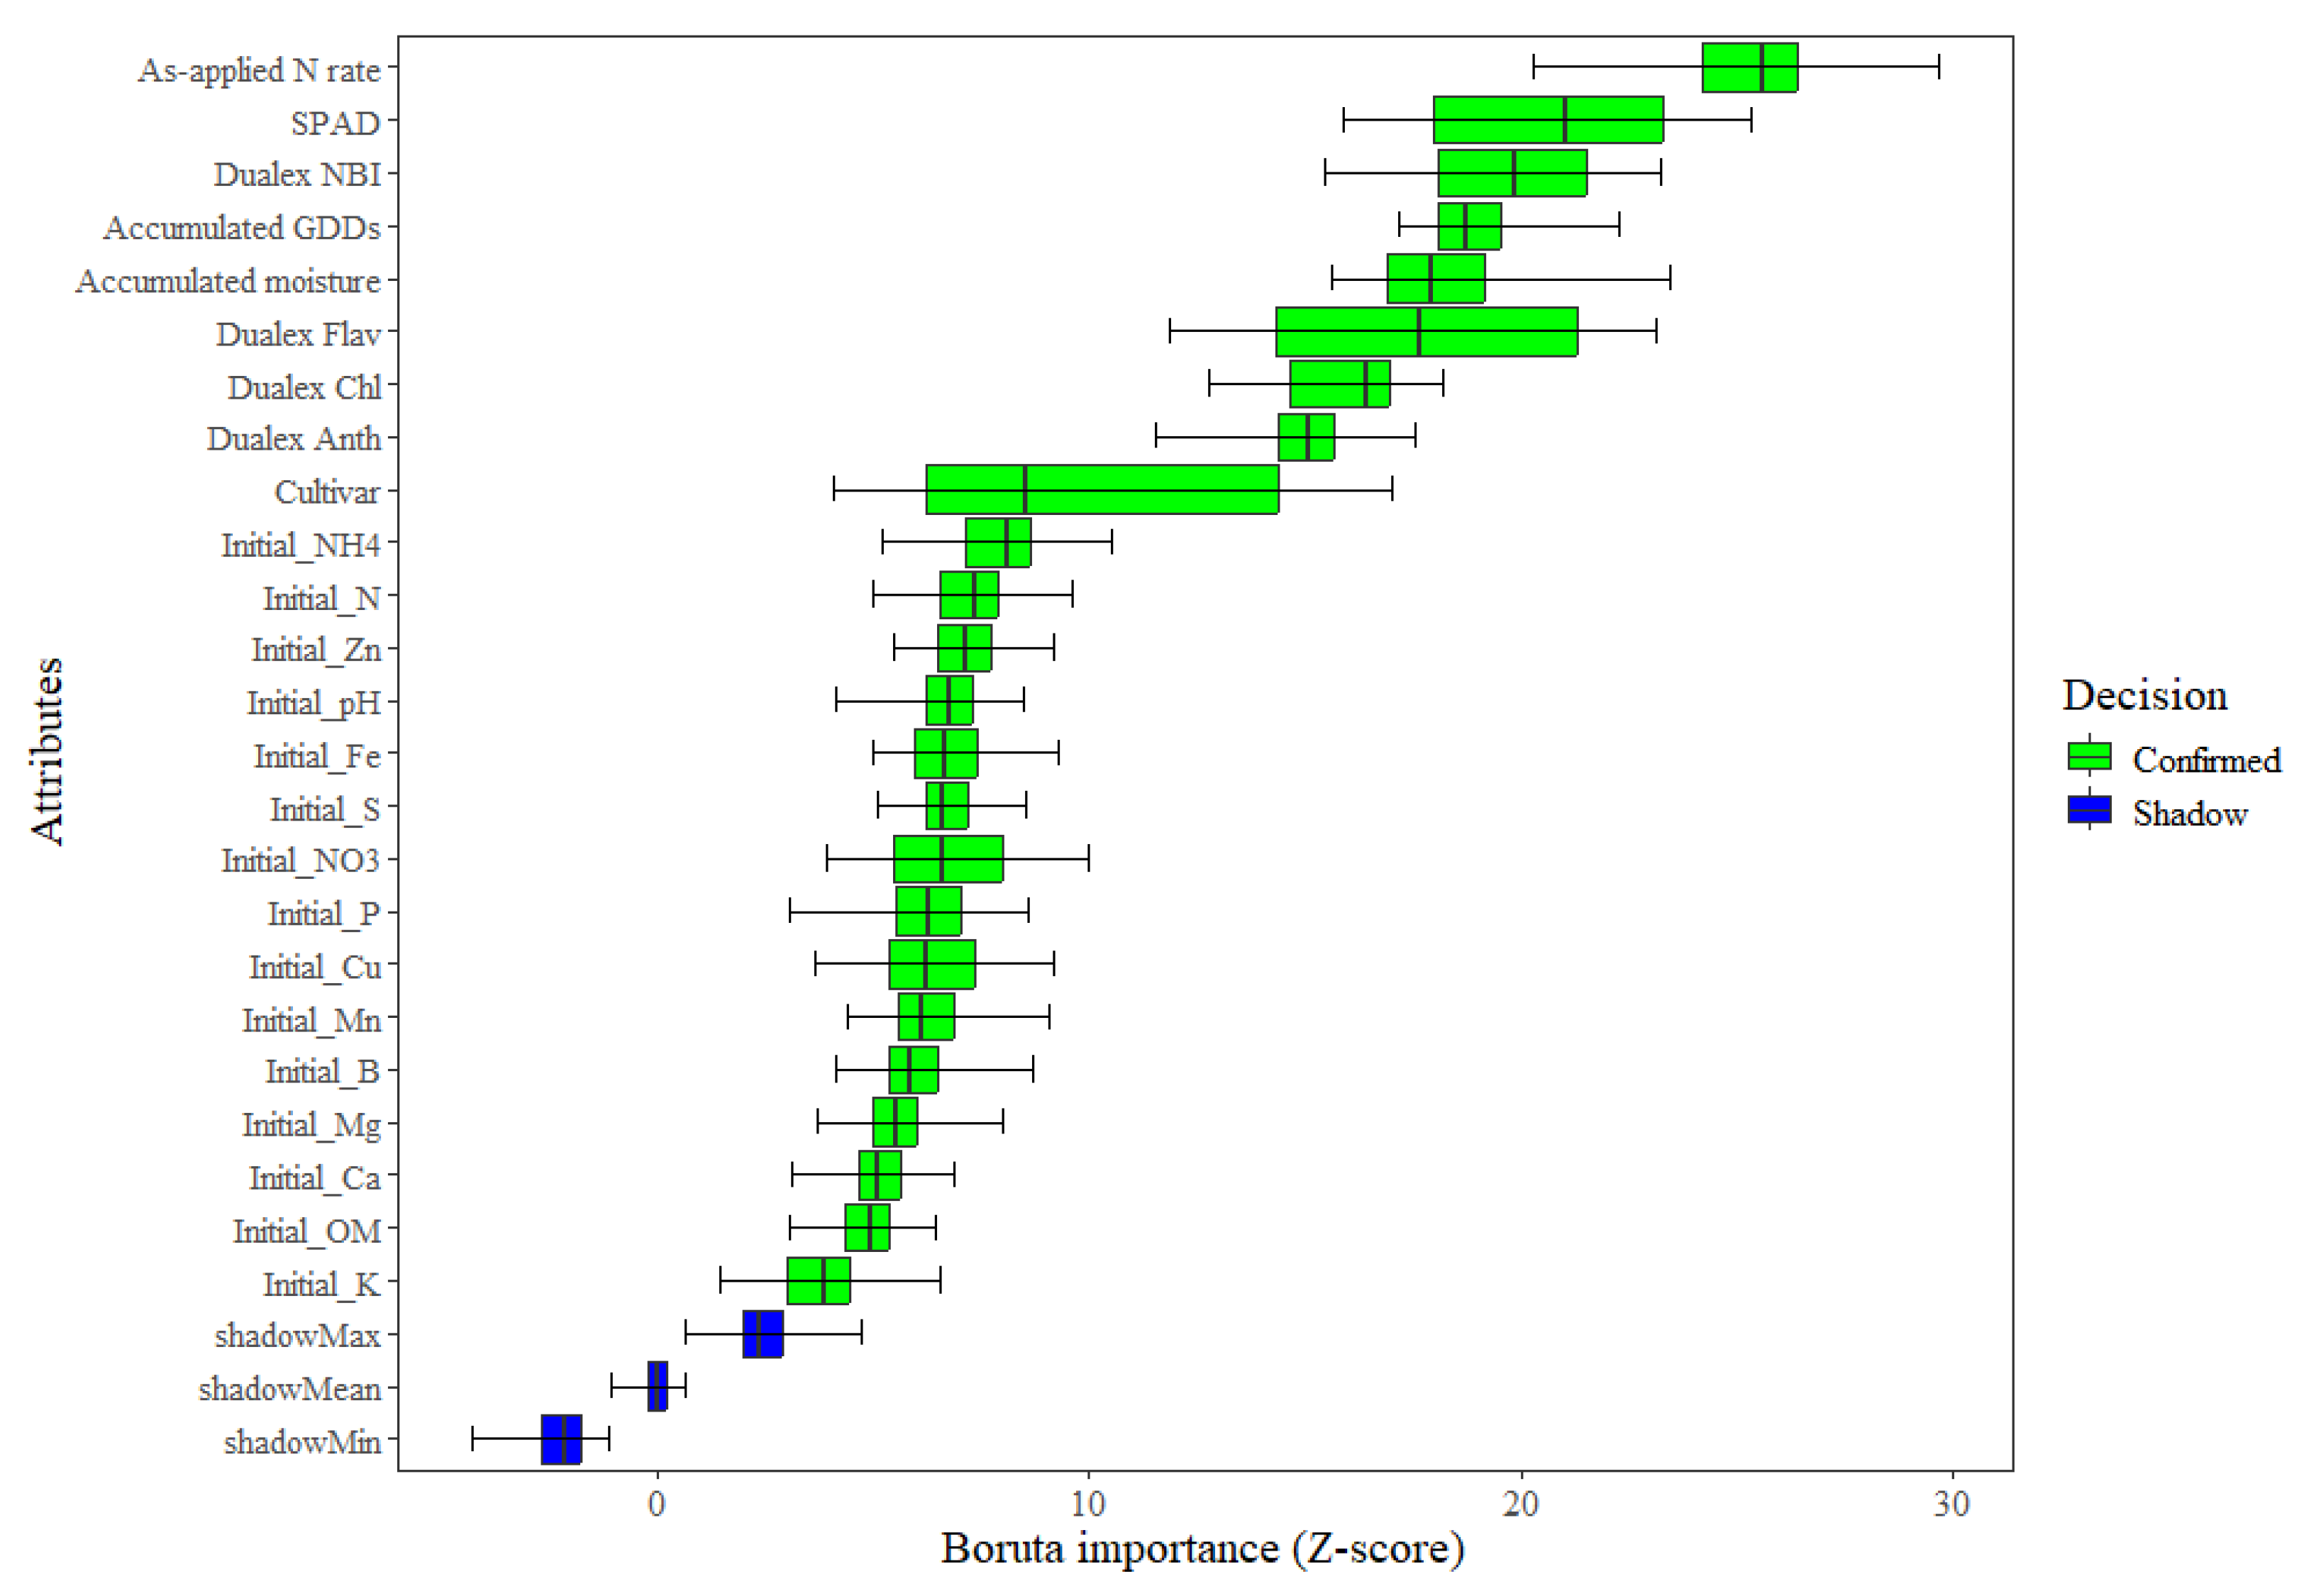
Figure 6.
Beeswarm plots of SHAP values showing the contribution of each feature to the model prediction. (a) Vine NNI – SPAD, (b) NNI – SPAD, (c) Vine NNI – Dualex, (d) NNI – Dualex.
Figure 6.
Beeswarm plots of SHAP values showing the contribution of each feature to the model prediction. (a) Vine NNI – SPAD, (b) NNI – SPAD, (c) Vine NNI – Dualex, (d) NNI – Dualex.
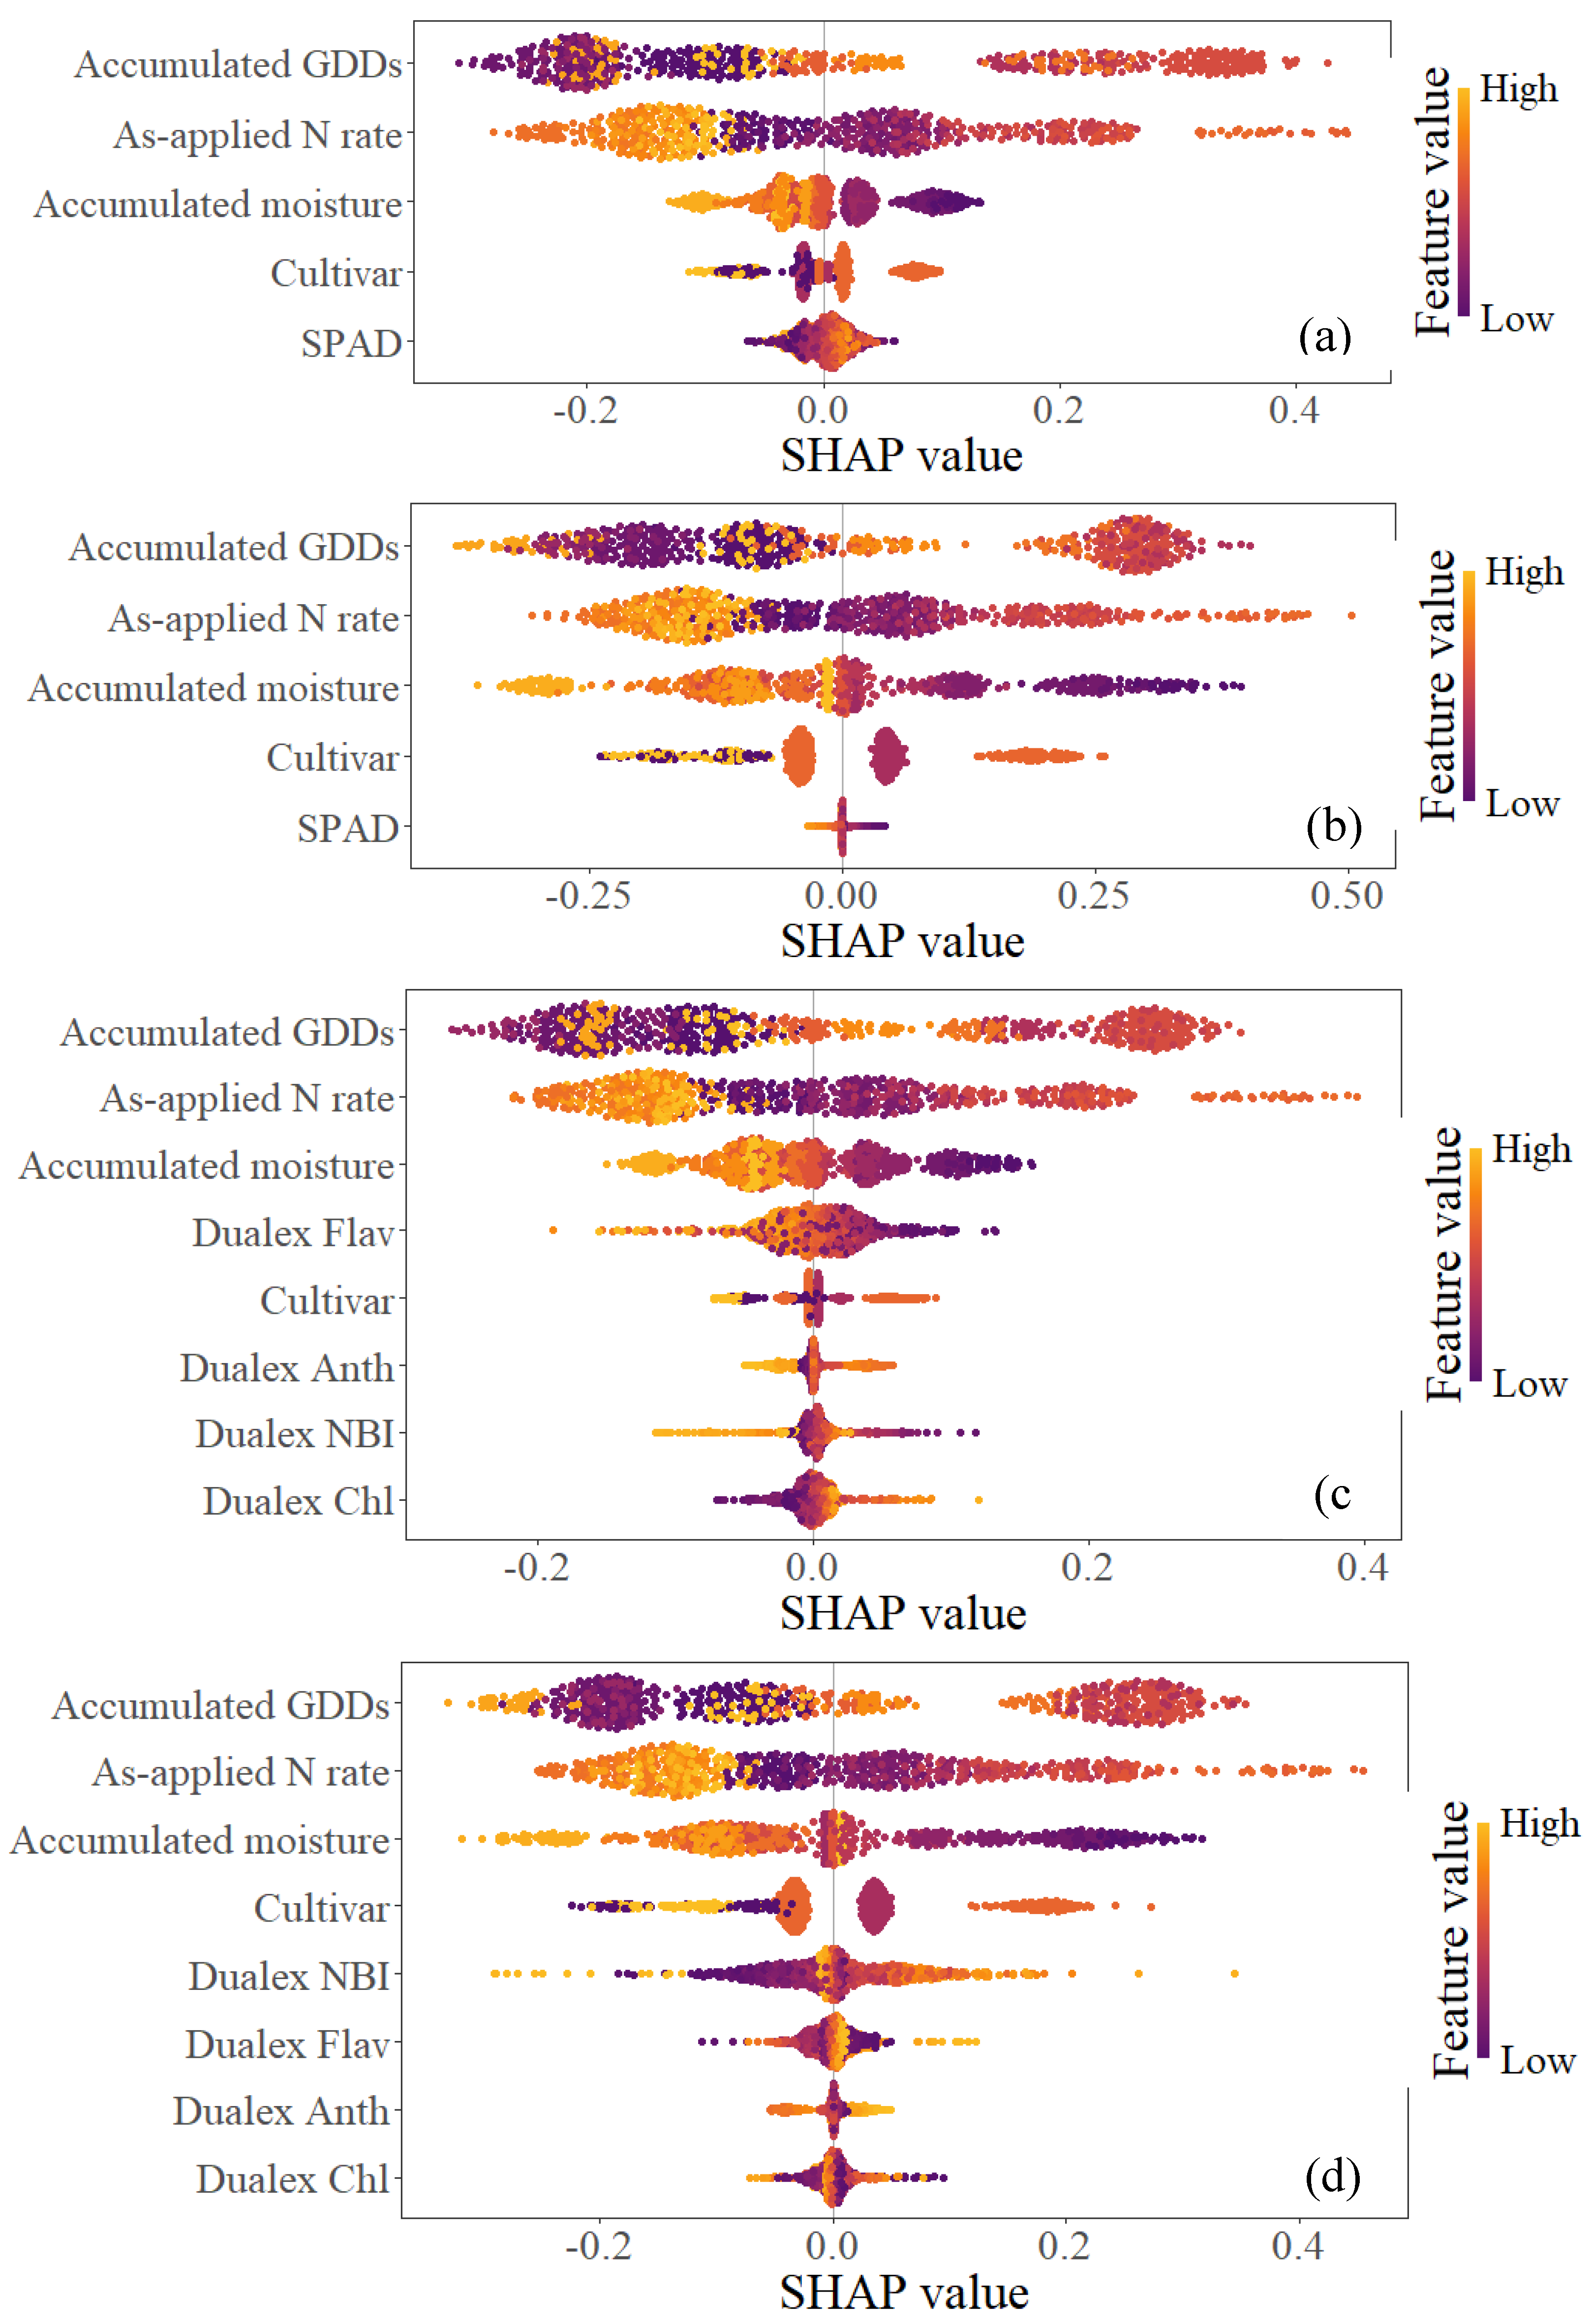
Table 1.
Summary of replant soil tests.
| Max | Min | Mean | Median | |
| OM | 22.0 | 10.0 | 14.7 | 14.0 |
| pH | 7.4 | 6.0 | 6.7 | 6.8 |
| N | 11.7 | 1.7 | 5.9 | 5.9 |
| P | 69.0 | 18.0 | 46.2 | 55.0 |
| K | 157.0 | 74.0 | 100.5 | 94.0 |
| S | 12.2 | 4.4 | 8.0 | 7.0 |
| Ca | 958.8 | 620.2 | 781.2 | 731.7 |
| Mg | 185.1 | 115.2 | 150.6 | 154.6 |
| B | 0.3 | 0.1 | 0.2 | 0.2 |
| Fe | 33.4 | 10.4 | 20.5 | 17.5 |
| Mn | 25.7 | 3.9 | 11.1 | 7.9 |
| Zn | 11.9 | 1.1 | 5.6 | 3.4 |
| Cu | 1.2 | 0.5 | 0.8 | 0.8 |
0-60 cm for N and 0-15 cm for other elements. OM in g kg-1, pH in unitless, the rest in mg kg-1.
Table 2.
Critical N dilution curve parameters for vine and whole plant.
| Cultivar | Vine a | Vine b | WP a | WP b |
|---|---|---|---|---|
| Russet Burbank Hamlin Russet | 5.08 | 0.28 | 4.57 | 0.42 |
| Umatilla Russet Clearwater Russet Lamoka | 5.44 | 0.27 | 5.04 | 0.42 |
| Ivory Russet MN13142 | 5.17 | 0.18 | 5.19 | 0.25 |
Table 3.
Summary statistics of N status indicators.
| PNNC | VNC | WPNC | PNU | Vine NNI | NNI | |
| (mg kg-1) | (g 100g-1) | (g 100g-1) | (kg ha-1) | |||
| Min | 5 | 1.02 | 0.87 | 41.05 | 0.29 | 0.25 |
| Mean | 10896 | 3.77 | 3.16 | 155.02 | 0.94 | 0.96 |
| Median | 9984 | 3.65 | 2.73 | 143.84 | 0.96 | 0.93 |
| Max | 31410 | 7.22 | 7.12 | 405.37 | 1.65 | 2.11 |
| SD | 7898 | 1.28 | 1.4 | 59.37 | 0.28 | 0.37 |
| CV | 1 | 0.34 | 0.44 | 0.38 | 0.3 | 0.39 |
Table 4.
The summary of advanced ML model performance metrics using all Dualex parameters.
| N Indicator | Dataset | Model | R2 | MAE | RMSE | Acc | Kappa |
|---|---|---|---|---|---|---|---|
| PNNC | Training | RFR | 0.94 | 1600.58 | 2052.82 | 0.77 | 0.65 |
| Testing | RFR | 0.66 | 3898.12 | 4864.5 | 0.56 | 0.32 | |
| VNC | Training | SVR L | 0.65 | 0.6 | 0.75 | - | - |
| Testing | SVR L | 0.57 | 0.69 | 0.88 | - | - | |
| WPNC | Training | RFR | 0.95 | 0.24 | 0.32 | - | - |
| Testing | RFR | 0.62 | 0.72 | 1 | - | - | |
| PNU | Training | SVR L | 0.09 | 44.11 | 56.31 | - | - |
| Testing | SVR L | 0.11 | 54.14 | 69.72 | - | - | |
| Vine NNI | Training | SVR L | 0.62 | 0.14 | 0.17 | 0.71 | 0.51 |
| Testing | SVR L | 0.55 | 0.16 | 0.2 | 0.69 | 0.45 | |
| NNI | Training | SVR P | 0.53 | 0.2 | 0.26 | 0.7 | 0.5 |
| Testing | SVR P | 0.54 | 0.26 | 0.32 | 0.64 | 0.4 |
Disclaimer/Publisher’s Note: The statements, opinions and data contained in all publications are solely those of the individual author(s) and contributor(s) and not of MDPI and/or the editor(s). MDPI and/or the editor(s) disclaim responsibility for any injury to people or property resulting from any ideas, methods, instructions or products referred to in the content. |
© 2025 by the authors. Licensee MDPI, Basel, Switzerland. This article is an open access article distributed under the terms and conditions of the Creative Commons Attribution (CC BY) license (http://creativecommons.org/licenses/by/4.0/).
Copyright: This open access article is published under a Creative Commons CC BY 4.0 license, which permit the free download, distribution, and reuse, provided that the author and preprint are cited in any reuse.


