
Submitted:
19 May 2025
Posted:
20 May 2025
You are already at the latest version
Abstract
Innovation-driven labor markets play a pivotal role in economic development, yet significant disparities exist in how efficiently countries transform innovation inputs into labor market outcomes. This study addresses the critical gap in benchmarking multi-stage innovation efficiency by developing an integrated framework combining Data Envelopment Analysis (DEA) Super Slack-Based Measure (Super-SBM) for static effi-ciency evaluation and the Malmquist Productivity Index (MPI) for dynamic productivity decomposition, enhanced with cooperative game theory for robustness testing. Focusing on the top 20 innovative economies over a five-year period, we analyze key inputs (innovation index, GDP, trade openness) and outputs (labor force, unemploy-ment rates), revealing stark efficiency contrasts: China, Luxembourg, and the U.S. demonstrate optimal performance (mean scores >1.9), while Singapore and the Netherlands show significant underutilization (scores < 0.4). Our results identify a critical productivity shift period (average MPI = 1.325) driven primarily by technological advancements. The study contributes a replicable, data-driven model for cross-domain efficiency assessment and provides empirical evidence for policymakers to optimize innovation-labor market conversion. The methodological framework offers scalable applications for future research in computational economics and productivity analysis.
Keywords:
Data Envelopment Analysis
; Super Slack-Based Measure
; Malmquist Productivity In-dex
; efficiency measurement
; computational economics
; productivity decomposition
; benchmarking
1. Introduction
The transformative power of innovation in shaping economies and labor markets cannot be overstated. In an era characterized by rapid technological progress and intense global competition, the ability of a country to innovate is often seen as a key determinant of its economic success and resilience. Innovation drives growth, creates jobs, and opens new markets, thus playing a pivotal role in national and global economic landscapes. However, the mere presence of innovative activities within a country does not automatically ensure that these benefits will materialize in the form of enhanced labor market outcomes or economic growth. This realization has sparked an interest in understanding the mechanisms through which innovation influences economic variables and the efficiency with which countries convert their innovative inputs into tangible outputs. [1]
This study is motivated by the observation that, despite the recognized importance of innovation, there is a significant variance among countries in how effectively they translate their innovation-related resources into labor market success [2]. Some countries achieve remarkable results with relatively modest innovation inputs, while others struggle to realize the full potential of their substantial innovation investments [3]. This discrepancy raises critical questions about the factors contributing to such differences and the strategies that could be adopted to enhance the efficiency of innovation-led growth [4]. Furthermore, the evolving global economic environment, marked by fluctuations in trade dynamics, investment patterns, and technological advancements, adds layers of complexity to this issue, making it a ripe area for investigation.
While there is extensive literature on the impact of innovation on economic growth and development, less attention has been paid to the efficiency with which countries utilize their innovation capabilities to achieve favorable labor market outcomes. Specifically, there is a gap in understanding the role of various factors, such as trade openness, capital investment, and high-tech exports, in mediating this process. Additionally, existing studies often fail to employ comprehensive analytical frameworks that can account for the multi-dimensional nature of innovation efficiency. This gap signifies the need for a study that not only examines the efficiency of innovation in a holistic manner but also incorporates the dynamics of global economic conditions and their impact on innovation efficiency.
The primary objective of this study is to analyze the efficiency with which the world’s top 20 innovative countries convert their resources into favorable labor market outcomes. This involves a detailed examination of the role played by the innovation index, GDP, trade openness, capital investment, and high-tech exports in shaping these outcomes. To achieve this objective, the study employs a methodological approach that combines Data Envelopment Analysis (DEA) Super SBM and the Malmquist Productivity Index (MPI), offering a nuanced understanding of both static and dynamic aspects of innovation efficiency. Through this analysis, the study aims to highlight the disparities in efficiency among the leading innovative countries and explore the implications of these differences for policy and strategy formulation. Ultimately, this research seeks to contribute to the broader discourse on innovation and economic development by providing insights that could inform the efforts of policymakers and stakeholders to optimize the impact of innovation on labor markets.
This paper is structured as follows: After this introduction, Section 2 provides a review of the relevant literature on innovation and labor market outcomes. Section 3 describes the methodology, including the Super SBM model and the MPI. Section 4 presents the data and the empirical results. Finally, Section 5 concludes the paper with a discussion of the findings and their implications. In examining the impact of the Innovation Index on labor force and unemployment rates in the top 20 innovating countries in a five-year period (Year 1 to Year 5) [5], it is essential to consider the influence of innovation on labor market dynamics. Several studies have shed light on the relationship between innovation and labor force outcomes. Aldieri and Vinci [6] identified a complex interplay of job displacement and compensation forces resulting from labor innovation effects. Moreover, Choi et al. [7] suggested that enhancing technology startup companies could address concerns of unemployment and insecure labor forces due to environmental changes.
To enhance the benchmarking process, this study aligns with Moradi et al. [8] approach of projecting inefficient DMUs onto the efficient frontier with minimal input-output adjustments, ensuring precise efficiency evaluation using advanced DEA methodologies. The integration of DEA with cooperative game theory, as demonstrated by Zhang et al. [9] offer a compelling perspective on resource-sharing and collaborative efficiency enhancement, which is pertinent to analyzing innovation-driven labor market outcomes. Shakouri et al. [10] draw upon the framework of the stochastic p-robust approach to two-stage network DEA models as outlined in prior research, which effectively addresses uncertainties in data and facilitates robust efficiency evaluations in multi-stage processes. Akram et al. [11] incorporate an extended DEA method combined with Fermatean fuzzy sets to evaluate multi-objective performance efficiency, addressing uncertainty and decision-making complexity in resource allocation and performance benchmarking
Lyu et al. [12] highlight the crucial role of environmental regulation in driving green technology innovation, emphasizing the importance of a supportive regulatory environment for fostering innovation. Similarly, Yi et al. [13] discuss how government R&D subsidies and environmental regulations affect green innovation efficiency in the manufacturing industry, underscoring the significance of policy interventions in stimulating innovation. Furthermore, Zeng et al. [14] concentrate on assessing technological innovation efficiency in China’s strategic emerging industries, providing insights into the effectiveness of innovation processes in key sectors. Bao et al. [15] explore the green innovation efficiency of cities in the Yangtze River Delta region, demonstrating the application of models like Super-SBM to evaluate innovation outcomes. The relationship between environmental performance and economic performance is explored by Liu et al. [16] indicating a connection between environmental sustainability and economic outcomes. In addition, Chen et al. [17] emphasize the role of environmental regulation in advancing industrial green development, highlighting the interconnected nature of environmental policies and economic performance. Regarding efficiency and productivity evaluations, studies by Tran et al. [18] and Alves and Meza [19] offer methodological insights into utilizing data envelopment analysis (DEA) models for efficiency assessment. To further provide concrete evidence in the field of efficiency assessment research using the Data Envelopment Analysis (DEA), Wang et al. [20] successfully applied an integrated DEA and hybrid ordinal priority approach for multicriteria wave energy locating, focusing on South Africa, thereby offering key insights into renewable energy, [21] expanded the DEA model using prospect theory for wave-wind energy site selection in New Zealand, demonstrating the potential of merging different analytical approaches for decision-making in energy site selection, and [22] mapping sustainable logistics on the 21st-Century Maritime Silk Road, emphasizing the importance of risk considerations in logistics planning for sustainable development. These studies underscore the relevance and versatility of DEA in assessing efficiency across various domains.
Innovations have been found to positively correlate with skill premia in companies, leading to an increased quality of the labor force and company brand. This positive effect of innovation on labor is further supported by Goel et al. [23] who found that both R&D and innovation increased employment growth, indicating strong complementarities between labor and other inputs. Additionally, Asiedu et al. [24] highlighted that innovative firms exhibited higher growth rates in employment and labor productivity compared to non-innovative firms. Furthermore, the impact of innovation on labor productivity and outcomes is evident in various contexts. For instance, Salimova et al. [25] found that paying higher wages to ordinary workers contributes to better innovation outcomes in terms of patent quantity and quality. Additionally, Ou and Zhao [26] emphasized the long-term impact of highly educated workers on technological innovation and economic growth, particularly in innovative firms.
The relevance of the Innovation Index on labor force and unemployment rates is also influenced by factors such as education and digitalization. Formal and non-formal education has been shown to play a significant role in fostering innovation and competitiveness, thereby affecting the labor force. Moreover, Androniceanu et al. [27] highlighted the structural changes required by new economic and social models due to digitalization’s impact on the labor force in different countries. Yıldırım et al. [28] specifically focused on the innovation-unemployment nexus in EU countries, aiming to elucidate how innovation influences unemployment rates. Their study contributes significantly to the broader understanding of how innovation impacts labor markets. Furthermore, Lydeka and Karaliūtė [29] examined the effect of technological innovations on unemployment in European Union countries, emphasizing that the level of innovativeness may have diverse effects on unemployment rates. This variability underscores the necessity for a nuanced analysis of the relationship between innovation and unemployment. Moreover, Padi and Musah [30] discussed entrepreneurship as a potential solution to high unemployment, highlighting that entrepreneurship combined with innovation can be a potent force in addressing unemployment conditions. This suggests that a multifaceted approach involving both entrepreneurship and innovation may be crucial in tackling unemployment challenges.
Afzal et al. [31] delved into understanding NIS using Porter’s Diamond model in ASEAN-05 countries, shedding light on how innovation plays a pivotal role in shaping the competitiveness of nations. This perspective underscores the significance of innovation in driving economic growth and potentially affecting labor markets. Moreover, the study by Oloruntoba and Oladipo [32] on modelling carbon emissions efficiency in UK higher education institutions using Data Envelopment Analysis (DEA) highlighted the importance of technological innovation in enhancing energy efficiency and productivity. This emphasizes the critical role of innovation in improving overall efficiency, which could have implications for labor force dynamics and unemployment rates. Additionally, Mavi et al. [33] focused on eco-innovation analysis in OECD countries, emphasizing the link between eco-innovation efficiency and sustainable development. The study’s use of the Malmquist productivity index (MPI) to measure eco-innovation efficiency underscores the relevance of innovation in driving sustainable practices, which could have implications for labor force trends and unemployment rates. Furthermore, Aydin [34] discussed benchmarking healthcare systems in OECD countries using a DEA-based Malmquist Productivity Index approach, highlighting the transformative impact of technological innovations on healthcare. This suggests that advancements in technology and innovation play a crucial role in improving productivity and efficiency in various sectors, potentially influencing labor force dynamics.
Studies by Tien et al. [35], Wang et al. [36], and Dakpo et al. [37] emphasize the importance of technological progress and innovation in enhancing productivity and efficiency. These findings suggest that a focus on improving technological innovation can lead to advancements in productivity, which may have implications for labor force dynamics and unemployment rates. Furthermore, the research by Mitropoulos et al. [38] on the impact of the economic crisis on Greek hospitals’ productivity highlights the role of reform and technological advancements in achieving productivity gains. This underscores the potential of innovation to drive efficiency improvements even in challenging economic environments, which could positively influence labor force outcomes. Additionally, the study by Bozkurt et al. [39] on the relationship between productivity, digitalization, and the Tobit model based on the Malmquist Index highlights the role of technological advances in driving growth and productivity. This suggests that embracing digitalization and technological advancements can lead to improvements in productivity, potentially impacting labor force trends and unemployment rates.
Research by Pham et al. [40] on statistical inference for the aggregation of Malmquist Productivity Indices emphasizes the importance of robust statistical methods in analyzing productivity trends. This underscores the significance of accurate measurement and analysis techniques in understanding productivity changes, crucial for assessing the impact of innovation on labor force dynamics. Moreover, the study by Sukmaningrum et al. [41] on productivity analysis of family takaful in Indonesia and Malaysia using the Malmquist Productivity Index approach highlights the role of technological change in driving productivity improvements. This underscores the importance of technological advancements in enhancing productivity levels, which could have implications for labor market outcomes.
Chen et al. [42] highlighted the substantial role of environmental regulation in advancing industrial green development. This finding suggests that policies related to environmental factors, often associated with innovation, can impact economic performance, including labor force dynamics and unemployment rates. Moreover, Wang and Chen [43] emphasized the contribution of culture to sustainable development. Understanding how cultural aspects interact with innovation and economic growth is crucial for a comprehensive analysis of the implications of the Innovation Index on labor force and unemployment rates.
Despite the extensive exploration of innovation’s impact on labor markets, a significant research gap remains in quantitatively assessing how the world’s top innovating countries efficiently convert their innovation inputs into concrete labor market outcomes, such as employment growth and reduced unemployment. The literature largely overlooks a direct, empirical comparison of these countries’ performance in leveraging their innovation indices, GDP, trade openness, capital investments, and high-tech exports towards achieving favorable labor market impacts. This gap highlights the need for a focused study employing a unified methodological framework to benchmark and analyze the efficiency with which these nations utilize their resources, filling a crucial void in understanding the specific dynamics at play in optimizing innovation’s impact on labor markets.
2. Materials and Methods
2.1. Data Collection
This study focuses on the top 20 countries for the innovation index in the most recent year of the five-year period (Year 5). The innovation index is a composite measure that encapsulates the level of innovation within a country. It is derived from a variety of factors that capture different facets of innovation. These include the number of patents filed, the extent of research and development expenditure, the quality of scientific research institutions, the standard of education and training, the degree of ICT access and use, and the level of business sophistication. The countries selected for this study, which are presented in the subsequent tables, were chosen based on their performance in these areas and aim to be analyzed further by incorporating additional input and output factors for the past 5 years.

Table 1.
The DMU designation for the Top 20 Countries by Innovation Index.
| Rank | Name of Countries | DMUs |
|---|---|---|
| 1 | Switzerland | SWZ |
| 2 | United States of America | USA |
| 3 | Sweden | SWD |
| 4 | United Kingdom | UNK |
| 5 | Netherlands | NDL |
| 6 | South Korea | KOR |
| 7 | Singapore | SGP |
| 8 | Germany | GMN |
| 9 | Finland | FNL |
| 10 | Denmark | DMK |
| 11 | China | CHN |
| 12 | France | FRN |
| 13 | Japan | JPN |
| 14 | Hongkong | HNK |
| 15 | Canada | CND |
| 16 | Austria | AST |
| 17 | Estonia | EST |
| 18 | Israel | ISR |
| 19 | Luxembourg | LXM |
| 20 | Iceland | ICL |
Table 2.
Declaration of input and output variables.
| Variables | Definition | |
|---|---|---|
| Inputs | Innovation Index (II) Capital Investment (CI) Trade Openness (TO) High Tech Exports (HTE) Gross Domestic Product (GDP) |
Innovation score (0-100). Calculated new plant and equipment purchases by firms, as a percentage of GDP. Sum of exports and imports divided by GDP. Percent of exported manufactured products with high research and development intensity. Total monetary value of all final goods and services produced in billion USD. |
| Outputs | Labor Force (LF) Unemployment Rate (UR) |
The population 15 years and over who are either employed, unemployed, or seeking employment. Unemployed individuals in an economy among individuals currently in labor force |
Table 3.
Five-year summary of statistics for the input and output variables.
| Year | Statistics | (I)-II | (I)-CI | (I)-TO | (I)-HTE | (I)-GDP | (O)-LF | (O)-UR |
|---|---|---|---|---|---|---|---|---|
| Year 1 | Max | 68.400 | 43.790 | 376.890 | 64.650 | 20533.060 | 776.280 | 9.020 |
| Min | 50.500 | 17.040 | 27.610 | 6.970 | 26.260 | 0.220 | 2.470 | |
| Average | 57.075 | 24.677 | 124.415 | 22.672 | 2854.104 | 60.536 | 4.653 | |
| SD | 4.496 | 5.401 | 102.563 | 13.899 | 5086.519 | 168.350 | 1.583 | |
| Year 2 | Max | 67.200 | 43.250 | 382.350 | 65.560 | 21380.980 | 775.320 | 8.410 |
| Min | 50.000 | 18.190 | 26.450 | 6.570 | 24.680 | 0.220 | 2.350 | |
| Average | 57.155 | 24.310 | 123.292 | 23.329 | 2906.832 | 60.703 | 4.474 | |
| SD | 4.361 | 5.326 | 102.210 | 14.320 | 5278.262 | 168.185 | 1.483 | |
| Year 3 | Max | 66.100 | 43.370 | 372.270 | 69.650 | 21060.470 | 751.450 | 9.660 |
| Min | 48.300 | 17.350 | 23.380 | 5.620 | 21.570 | 0.220 | 2.810 | |
| Average | 55.480 | 24.614 | 117.805 | 23.797 | 2891.527 | 59.337 | 5.723 | |
| SD | 4.473 | 5.757 | 103.607 | 14.977 | 5267.564 | 163.084 | 1.820 | |
| Year 4 | Max | 65.500 | 43.140 | 402.510 | 65.500 | 23315.080 | 780.370 | 8.720 |
| Min | 49.000 | 16.780 | 25.480 | 49.000 | 25.600 | 0.220 | 2.830 | |
| Average | 56.225 | 24.902 | 127.289 | 56.225 | 3273.465 | 60.878 | 5.473 | |
| SD | 4.285 | 5.568 | 110.981 | 4.285 | 5998.516 | 169.227 | 1.500 | |
| Year 5 | Max | 64.600 | 43.290 | 388.510 | 34.810 | 25439.700 | 781.830 | 781.830 |
| Min | 49.500 | 14.960 | 27.360 | 5.870 | 28.060 | 0.230 | 0.230 | |
| Average | 55.360 | 25.238 | 135.889 | 19.668 | 3325.903 | 61.262 | 61.262 | |
| SD | 4.411 | 5.921 | 105.952 | 7.256 | 6368.976 | 169.602 | 169.602 |
According to similar studies, a variety of inputs and outputs are used for an examination related to this. Hence, the research specifically adopts four distinct inputs and two outputs, as demonstrated in the subsequent Table 2. Table 3 below provides a summary of the input and output statistics for the 20 countries from Year 1 to Year 5. It includes the maximum, minimum, average, and standard deviation (SD) for each year.
2.2. DEA Super Efficiency Slacks-Based Measure Model
Tone [44] introduced a method in Data Envelopment Analysis (DEA) known as the slacks-based measure (SBM model). This model is effective in distinguishing between efficient and inefficient Decision-Making Units (DMUs). However, it falls short in differentiating between high-performing DMUs that are fully efficient. To address this, Tone [44] developed the super efficiency slacks-based measure model in DEA (Super-SBM model). This model excludes the efficient DMUs from the efficient frontier of the SBM model and calculates the non-radial distance between the omitted efficient DMUs and the efficient frontier formed by the remaining efficient DMUs. It simultaneously addresses both input and output slacks, making it more suitable for real-world applications.
The model is used to analyze n DMUs with input and output matrices and respectively. The production possibility set P is defined as: where λ is a nonnegative vector in .
Tone [40] uses the following expression to describe a specific DMU ): = . The vectors represent the input surplus and output shortfall of this expression, respectively, and are known as slacks. The SBM model is as follows:
Subject to:
2.3. DEA Malmquist Productivity Index (MPI)
To measure efficiency not just at a specific point in time but also over duration, the Malmquist Productivity Index (MPI) was introduced by [45]. This extension of the Data Envelopment Analysis (DEA) model allows for the assessment of the change in total factor productivity of a Decision-Making Unit (DMU) across years. MPI provides a means to evaluate the shift in total factor productivity of a DMU between two time periods. By comparing efficiency patterns over time, researchers can gain deeper insights into how efficiency evolves across different periods. Färe [45] identified the total productivity factor derived from DEA as MPI.
This index is acknowledged as one of the most effective techniques for evaluating the shift in productivity of a group of DMUs over time. In this method, each DMU is examined at two distinct periods, t1 and t2, and the change in the combined total factor productivity of that DMU is compared. Given two time periods t1 and t2, MPI is calculated as:
The Malmquist Index assesses the changes in total productivity factor of each DMU by calculating the efficiency score. MPI is defined as the product of the “catch-up” and “frontier-shift” components. The term “catch-up” refers to changes in technical efficiency (given a fixed technology), while “frontier-shift” refers to changes in the technology available to an organization. Total factor efficiency can be enhanced by better utilization of current technologies and economic inputs, a process known as “catch-up”. Total factor productivity can also be improved if organizations implement technological innovations or advancements, such as the introduction of new products, processes, and technologies into their operations that lead to improved manufacturing methods, known as “frontier shift”.
MPI can be calculated as follows:
MPI = (catch-up) × (frontier-shift).
This equation can then be further transformed into:
where is the distance function at time ( and is the distance function at time , efficiency change (catch-up) = and
technological change (frontier-shift) =
Therefore, an MPI value greater than 1 indicates an increase in productivity from period t1 to t2. As per the definition of MPI, enhancements in productivity are influenced by changes in efficiency and technology.
3. Results
3.1. Efficiency Analysis Using Super-SBM Model
According to Table 4, China (CHN) consistently holds the top rank from Year 1 to Year 5, with a mean score of 4.078, indicating a strong innovation index and labor market outcomes. Luxembourg (LXM) follows as the second most efficient country, with a mean score of 3.209. United States (USA) ranks third with a mean score of 1.905, showing a slight fluctuation but maintaining a top-tier position.
Singapore (SGP) has the lowest mean score of 0.361, indicating room for improvement in innovation-related labor market outcomes. Hong Kong (HNK), despite a significant improvement in Year 5, stays near the bottom with a mean score of 0.601. Netherlands (NDL) also remains towards the lower end with a mean score of 0.387. Iceland (ICL) shows a remarkable trend with a significant jump to the third position in Year 2 and maintaining high efficiency scores thereafter. Finland (FNL) and Estonia (EST) display consistent performance, staying within the top six throughout the period. Canada (CND) and Austria (AST) show fluctuations but remain in the middle tier.
Table 4.
Score and Ranking Using Super-SBM Model (Year 1 – Year 5).
| DMU | Year 1 | Year 2 | Year 3 | Year 4 | Year 5 | Mean | ||||||
|---|---|---|---|---|---|---|---|---|---|---|---|---|
| Score | Rank | Score | Rank | Score | Rank | Score | Rank | Score | Rank | Score | Rank | |
| SWZ | 0.471 | 14 | 0.481 | 14 | 0.445 | 15 | 0.490 | 15 | 0.434 | 16 | 0.464 | 15 |
| USA | 1.980 | 3 | 1.974 | 4 | 2.020 | 3 | 1.746 | 4 | 1.808 | 4 | 1.905 | 3 |
| SWD | 0.700 | 8 | 0.818 | 8 | 0.880 | 8 | 1.025 | 9 | 1.037 | 9 | 0.892 | 9 |
| UNK | 0.511 | 13 | 0.512 | 13 | 0.471 | 14 | 0.596 | 11 | 0.519 | 14 | 0.522 | 14 |
| NDL | 0.384 | 18 | 0.368 | 18 | 0.367 | 20 | 0.415 | 18 | 0.401 | 18 | 0.387 | 19 |
| KOR | 0.406 | 16 | 0.444 | 15 | 0.380 | 18 | 0.383 | 20 | 0.376 | 20 | 0.398 | 18 |
| SGP | 0.331 | 19 | 0.314 | 20 | 0.369 | 19 | 0.407 | 19 | 0.384 | 19 | 0.361 | 20 |
| GMN | 0.414 | 15 | 0.415 | 16 | 0.395 | 16 | 0.429 | 17 | 0.402 | 17 | 0.411 | 17 |
| FNL | 1.577 | 4 | 1.336 | 6 | 1.288 | 6 | 1.254 | 6 | 1.372 | 6 | 1.365 | 6 |
| DMK | 0.621 | 9 | 0.670 | 10 | 0.636 | 10 | 0.573 | 13 | 0.551 | 12 | 0.610 | 11 |
| CHN | 4.140 | 1 | 4.138 | 1 | 3.948 | 1 | 4.004 | 1 | 4.159 | 1 | 4.078 | 1 |
| FRN | 1.349 | 6 | 1.307 | 7 | 0.737 | 9 | 1.053 | 7 | 1.152 | 8 | 1.120 | 7 |
| JPN | 0.401 | 17 | 0.410 | 17 | 0.389 | 17 | 0.458 | 16 | 0.468 | 15 | 0.425 | 16 |
| HNK | 0.286 | 20 | 0.336 | 19 | 0.543 | 12 | 0.524 | 14 | 1.318 | 7 | 0.601 | 12 |
| CND | 0.707 | 7 | 0.751 | 9 | 1.215 | 7 | 1.037 | 8 | 0.770 | 10 | 0.896 | 8 |
| AST | 0.594 | 10 | 0.607 | 11 | 0.597 | 11 | 0.751 | 10 | 0.611 | 11 | 0.632 | 10 |
| EST | 1.569 | 5 | 1.475 | 5 | 1.371 | 5 | 1.377 | 5 | 1.495 | 5 | 1.457 | 5 |
| ISR | 0.513 | 12 | 0.532 | 12 | 0.510 | 13 | 0.584 | 12 | 0.526 | 13 | 0.533 | 13 |
| LXM | 2.987 | 2 | 3.047 | 2 | 3.884 | 2 | 3.437 | 2 | 2.690 | 2 | 3.209 | 2 |
| ICL | 0.587 | 11 | 2.549 | 3 | 1.810 | 4 | 2.088 | 3 | 2.289 | 3 | 1.865 | 4 |
| Mean | 1.026 | 1.124 | 1.113 | 1.132 | 1.138 | 1.107 | ||||||
Top performers like CHN, LXM, USA, and EST, as shown in Figure 1, consistently achieve high ranks, demonstrating their effective use of resources such as GDP, capital investments, trade openness, and high-tech exports to foster innovation. This effective resource utilization likely contributes to a robust labor force and lower unemployment rates.
Conversely, DMUs such as SGP, NDL, KOR, GMN, and JPN consistently rank lower. Their subpar efficiency scores indicate difficulties in effectively using their resources, particularly in trade openness as depicted in Table A1, Table A2, Table A3, Table A4 and Table A5. This could affect their labor markets and potentially lead to an excess input, without yielding the desired impact on the labor force and unemployment rates. It may be necessary for these DMUs to tackle these issues to enhance their labor market results.
On the other hand, in Table A5, HNK demonstrated an effective approach to managing its trade openness in Year 5, as evidenced by a significant increase in efficiency. This suggests promising prospects for its performance in the years ahead.
From Year 1 to Year 5, the average efficiency score was 1.107, suggesting that these countries generally maintained a high level of efficiency in their innovation activities during this period. However, the yearly scores are fluctuating, as seen in Figure 2, indicating differences in resource utilization efficiency among these countries from one year to the next. This variation could be attributed to a range of factors, including but not limited to the input factors identified in this study, potential policy changes, and differing external economic conditions in each and all the countries.
3.2. Performance Trends Over Time Analysis Using Malmquist Productivity Index (MPI)
3.2.1. Overall Efficiency Analysis
When Decision-Making Units (DMUs) register scores above 1, such as HNK with 1.426 and ICL with 1.211 in Table 5, it reflects a notable improvement in their efficiency over the observed five-year period. Conversely, a score of 1 indicates a steady state of efficiency, exemplified by UNK’s average of 1.015, which suggests minimal change. Scores falling below 1, like those of FNL at 0.968 and DMK at 0.972, point to a diminishing efficiency, signaling potential difficulties in capitalizing on innovation for favorable labor market outcomes.
A closer examination of efficiency trends reveals that HNK has experienced a significant increase, particularly during Year 2 - Year 3 and Year 4 - Year 5 intervals, which underscores a robust advancement in innovation and associated elements. ICL has also seen considerable gains, especially in the initial and concluding years of the timeframe.
On the other end of the spectrum, FNL and DMK are trailing, with their efficiency scores persistently below 1, which may indicate obstacles in harnessing innovation for labor market benefits. The collective efficiency score across all DMUs stands at an average of 1.044, suggesting an overarching trend of amelioration. Year 3 – Year 4 witnessed the highest mean score of 1.064, implying that most countries bolstered their efficiency despite widespread challenges. The subsequent year, Year 4 – Year 5, recorded the lowest average score of 1.009, potentially reflecting stabilization or adaptation to external influences impacting innovation and labor markets.
3.2.2. Frontier Shift Index
The frontier shift index scores, also defined as technological change, are indicative of shifts in the production frontier, reflecting how the adoption of new technologies has redefined best practices. Scores above 1 signify that a DMU has effectively integrated new technologies, moving closer to the frontier, while scores below 1 suggest a lag in adopting new technologies or advancements in the frontier by others.
In this table, we observe that Decision-Making Units with scores above 1, such as the USA and EST, have shown significant technological advancements, particularly highlighted in the Year 2 – Year 3. A score of 1 would indicate no change in technological capability; however, no DMU hit this mark precisely, though CHN’s average score suggests a stable technological landscape throughout the period. Scores below 1, like HNK’s notable decline in the Year 4 – Year 5, point to a potential regression in technological efficiency, signaling a need for reassessment or increased investment in technology.
The USA and EST emerge as leaders in technological progress, demonstrating strong improvements that are especially pronounced in the second year of the period. FNL also shows a consistent upward trajectory in technology, maintaining the highest average score over the five years. On the other hand, HNK’s significant drop in the last year raises concerns, pulling its average down and indicating a potential area for technological revaluation. ISR’s position as the lowest scorer suggests it is an area ripe for technological development.
Looking at the broader picture, the average technological change score across all DMUs is 0.980, hinting at a slight overall decline in technological efficiency. Year 2-Year 3 stands out with the highest average score, suggesting a period where most countries experienced technological improvements. In contrast, the Year 4 – Year 5 reflects the lowest average score, which may be indicative of global challenges impacting technological progress.
3.2.3. Malmquist Productivity Index
The MPI offers an insightful perspective on the evolution of total factor productivity for each Decision-Making Unit over time. A score above 1 denotes enhanced efficiency in transforming inputs into outputs, while a score below 1 reflects a downturn in productivity, suggesting less effective utilization of resources. A score of exactly 1 would imply no change in productivity levels.
Table 7.
Total Factor Productivity Change – MPI.
| Malmquist | Year 1 -Year 2 | Year 2 -Year 3 | Year 3 -Year 4 | Year 4 -Year 5 | Average |
|---|---|---|---|---|---|
| SWZ | 0.939 | 1.068 | 1.041 | 0.782 | 0.957 |
| USA | 0.934 | 1.854 | 0.664 | 0.707 | 1.039 |
| SWD | 1.067 | 1.302 | 1.027 | 0.790 | 1.046 |
| UNK | 0.933 | 1.224 | 1.029 | 0.626 | 0.953 |
| NDL | 0.889 | 1.141 | 1.070 | 0.859 | 0.990 |
| KOR | 1.007 | 1.063 | 0.873 | 0.884 | 0.956 |
| SGP | 0.883 | 1.348 | 1.044 | 0.838 | 1.028 |
| GMN | 0.937 | 1.218 | 0.911 | 0.852 | 0.980 |
| FNL | 0.841 | 1.147 | 0.912 | 0.998 | 0.974 |
| DMK | 0.988 | 1.106 | 0.850 | 0.856 | 0.950 |
| CHN | 1.011 | 0.982 | 0.980 | 1.063 | 1.009 |
| FRN | 0.930 | 0.921 | 0.955 | 0.879 | 0.921 |
| JPN | 0.978 | 1.167 | 0.959 | 0.929 | 1.008 |
| HNK | 1.098 | 2.337 | 0.919 | 0.966 | 1.330 |
| CND | 0.969 | 1.938 | 0.717 | 0.641 | 1.066 |
| AST | 0.938 | 1.141 | 1.185 | 0.662 | 0.982 |
| EST | 0.804 | 1.335 | 0.842 | 1.085 | 1.017 |
| ISR | 0.967 | 1.114 | 1.069 | 0.630 | 0.945 |
| LXM | 1.034 | 1.310 | 0.660 | 0.883 | 0.972 |
| ICL | 1.647 | 1.779 | 1.047 | 0.564 | 1.259 |
| Average | 0.990 | 1.325 | 0.938 | 0.825 | 1.019 |
Highlighting the leaders, HNK emerges with an impressive average score, signaling a robust enhancement in productivity throughout the five-year timeline. ICL follows suit, marking its progress, particularly in the initial years. In contrast, FRN’s position at the lower end of the spectrum, along with UNK and DMK, points to a struggle to sustain or elevate productivity levels.
Table 8 reveals a notable peak in productivity during Year 2-Year 3, with most DMUs reaching their zenith in performance improvements. However, this upward trend seems to go the opposite way by Year 4 -Year 5, where a general dip in productivity is observed. Despite these fluctuations, the overall average score across all DMUs indicates a marginal uptick in productivity, with SGP, EST, and CHN consistently surpassing the threshold of improvement. Meanwhile, DMUs like FNL and LXM display a more erratic pattern, hinting at the complex nature of their productivity dynamics.
4. Discussion
The Malmquist Productivity Index (MPI) results indicate a varied landscape of productivity changes across the top 20 innovative countries between Year 1 and Year 5. On average, there appears to be overall productivity growth, as suggested by the average MPI value over the observed period, being greater than 1 (1.019). This suggests that, collectively, these countries have managed to improve their productivity over the five years in question.
Country-specific trends reveal notable insights. For example, ICL (presumably Iceland), with an impressive average MPI of 1.259, demonstrates robust productivity improvements, suggesting effective utilization of innovation and other resources to enhance labor market outcomes. Conversely, SWZ (presumably Switzerland) shows a modest average MPI of 0.957, hinting at the potential underutilization of resources or other economic factors that may have impeded productivity gains. Several countries, including the USA, SWD (Sweden), and CHN (China), exhibit a fluctuating trend in TFP, with substantial inter-annual variability. The USA, for instance, demonstrates a significant spike in Year 2-Year 3 followed by a drop in the subsequent year, possibly reflecting the impact of external economic shocks or policy changes affecting innovation and productivity. It is striking to note that for many countries, there was a notable dip in productivity in Year 3-Year 4, likely due to external economic shocks or global disruptions. For example, HNK (presumably Hong Kong) shows a high variability with a peak in Year 2 – Year 3 and then a decline. This reflects the broader challenges faced globally during this period, potentially including disruptions in trade, investment, and labor mobility.
Conversely, some countries like CHN show an upward trend in the final year, which may indicate a rapid recovery and adaptation to the post-pandemic economic environment, highlighting the resilience of their innovation systems.
The general trend seems to be a recovery in Year 4 -Year 5, although the extent of this recovery varies significantly across countries. The overall improvement in MPI scores in the last year could be associated with the stabilization of the global economy and the adoption of new technologies and innovative practices in response to the pandemic.
These results also highlight the importance of considering external economic and political factors when interpreting MPI scores. For instance, trade conflicts, policy changes, and environmental regulations can significantly influence innovation efficiency and, consequently, productivity. The findings underscore the need for tailored policy interventions. For countries with declining productivity, targeted strategies may be necessary to overcome structural challenges and enhance the effectiveness of innovation inputs. For those with improving productivity, it is crucial to understand the contributing factors to sustain and build upon these gains.
5. Conclusions
The primary motivation behind this study was to elucidate the intricate relationship between a country’s innovation inputs and its labor market outcomes, focusing specifically on the top 20 innovative nations. Recognizing the need for a deeper mathematical understanding of how innovation influences labor productivity and employment rates underpins the significance of this research. Our objective was to evaluate the efficiency with which these countries convert innovation-related resources into labor market benefits over the five-year period (Year 1 to Year 5), highlighting the leading and lagging nations in this respect.
To achieve this, we employed the Malmquist Productivity Index (MPI), a robust mathematical tool that measures productivity changes over time by considering both technological advancements and efficiency improvements. This method provided a quantitative basis for assessing and comparing the innovation efficiency of each country. Our findings revealed significant inter-country variability, with nations like Iceland showing robust gains in productivity while others, such as Switzerland, struggled to optimize their innovation outputs. The fluctuations in productivity observed through the MPI also captured the impact of external shocks, notably the COVID-19 pandemic, on the innovation-productivity nexus.
This study contributes to the existing literature by highlighting the heterogeneity in innovation efficiency across nations and the importance of temporal dynamics in influencing productivity outcomes. It underscores the utility of the MPI in analyzing productivity trends and extends the discourse on innovation’s role in labor market performance.
One limitation of this study is the potential oversimplification of labor market dynamics, which may not be fully captured by the MPI alone. Future research could address this by incorporating additional variables such as quality of education, demographic shifts, and sector-specific innovation trends. Moreover, longitudinal studies could provide insights into the long-term effects of innovation on labor markets. Another direction would be the qualitative examination of policy frameworks across the countries studied to determine how different innovation strategies translate into varying levels of labor market efficiency. By expanding the scope and depth of analysis, subsequent research can offer more nuanced understandings that better inform policymakers and stakeholders.
Author Contributions
Conceptualization, G.C.; methodology, G.C.; software, C-N.W..; validation, G.C. and C-N.W.; formal analysis, G.C.; investigation, G.C.; resources, C-N.W.; data curation, G.C.; writing—original draft preparation, G.C.; writing—review and editing, G.C.; visualization, G.C.; supervision, C-N.W.; project administration, C-N.W.; All authors have read and agreed to the published version of the manuscript.
Funding
This research received no external funding.
Data Availability Statement
The datasets analyzed in this study are derived from publicly available sources, including the Global Innovation Index (GII) rankings, World Bank Open Data, and OECD Statistics. The original data supporting the findings of this study can be accessed through the following repositories:
- Global Innovation Index: https://www.theglobaleconomy.com/rankings/GII_Index/OECD/
- World Bank Open Data: https://data.worldbank.org/
- OECD Statistics: https://stats.oecd.org/
Processed data (e.g., input-output variables, efficiency scores) and supplementary calculations are provided in the tables and appendices of this manuscript.
Conflicts of Interest
The authors declare that no conflicts of interest exist in this paper.
Appendix A
Table A1.
Slacks in input and output variables (Year 1).
| DMU | GDP | CI | TO | II | HTE | LF | UR |
|---|---|---|---|---|---|---|---|
| SWZ | 492.398 | 9.439 | 74.427 | 30.184 | 7.439 | 0 | 0 |
| USA | 0 | 43.5 | 27.909 | 18.668 | 28.153 | 981.83 | 2.469 |
| SWD | 263.607 | 4.06 | 21.596 | 11.527 | 6.263 | 0 | 0 |
| UNK | 2137.791 | 3.214 | 22.395 | 26.935 | 16.301 | 0 | 0 |
| NDL | 630.887 | 7.515 | 118.215 | 32.1 | 17.529 | 0 | 0 |
| KOR | 1102.145 | 17.361 | 38.695 | 25.03 | 30.79 | 0 | 0 |
| SGP | 204.033 | 12.286 | 286.871 | 30.517 | 47.064 | 0 | 0 |
| GMN | 3091.238 | 8.718 | 53.065 | 29.627 | 10.151 | 0 | 0 |
| FNL | 367.086 | 4.83 | 24.954 | 13.421 | 7.366 | 3.499 | 0 |
| DMK | 145.641 | 4.946 | 52.482 | 16.833 | 6.027 | 0 | 0 |
| CHN | 82526.38 | 55.81 | 92.084 | 227.715 | 55.183 | 0 | 14.004 |
| FRN | 0 | 13.637 | 41.008 | 29.195 | 0 | 6.775 | 0 |
| JPN | 3287.267 | 16.555 | 18.43 | 37.968 | 8.663 | 0 | 0 |
| HNK | 203.989 | 12.231 | 347.069 | 31.776 | 61.106 | 0 | 0 |
| CND | 1184.654 | 2.649 | 4.751 | 5.282 | 7.647 | 0 | 0 |
| AST | 220.707 | 8.699 | 55.575 | 11.312 | 5.513 | 0 | 0 |
| EST | 36.966 | 0 | 129.618 | 22.735 | 5.407 | 0 | 0 |
| ISR | 183.657 | 10.283 | 17.273 | 24.995 | 17.648 | 0 | 0 |
| LXM | 5.051 | 52.578 | 0 | 70.926 | 38.159 | 1.429 | 7.747 |
| ICL | 10.864 | 8.017 | 15.272 | 25.809 | 14.334 | 0.132 | 0 |
Table A2.
Slacks in input and output variables (Year 2).
| DMU | GDP | CI | TO | II | HTE | LF | UR |
|---|---|---|---|---|---|---|---|
| SWZ | 487.598 | 10.522 | 71.965 | 27.902 | 6.766 | 0 | 0 |
| USA | 0 | 43.437 | 27.287 | 20.35 | 27.476 | 993.764 | 3.158 |
| SWD | 211.593 | 0.434 | 10.217 | 2.601 | 5.013 | 0 | 0 |
| UNK | 2096.97 | 3.762 | 20.952 | 27.267 | 16.879 | 0 | 0 |
| NDL | 627.342 | 9.649 | 115.24 | 31.041 | 18.121 | 0 | 0 |
| KOR | 1004.007 | 17.041 | 31.783 | 22.585 | 26.372 | 0 | 0 |
| SGP | 211.389 | 13.359 | 284.864 | 30.649 | 47.471 | 0 | 0 |
| GMN | 2976.968 | 9.067 | 51.979 | 29.349 | 10.688 | 0 | 0 |
| FNL | 254.427 | 0.515 | 9.946 | 2.594 | 4.993 | 2.588 | 0 |
| DMK | 127.539 | 3.74 | 50.506 | 13.51 | 5.099 | 0 | 0 |
| CHN | 84924.71 | 55.672 | 86.834 | 231.479 | 55.806 | 0 | 12.468 |
| FRN | 0 | 10.468 | 37.939 | 27.766 | 0 | 0.692 | 0 |
| JPN | 3334.989 | 16.588 | 17.209 | 37.529 | 8.187 | 0 | 0 |
| HNK | 195.106 | 7.579 | 319.059 | 29.348 | 61.452 | 0 | 0 |
| CND | 1120.522 | 2.127 | 0 | 3.375 | 7.23 | 0 | 0 |
| AST | 210.933 | 8.834 | 53.693 | 10.089 | 5.114 | 0 | 0 |
| EST | 13.598 | 0 | 0 | 15.765 | 27.455 | 0 | 0.282 |
| ISR | 205.535 | 10.029 | 11.945 | 24.012 | 17.873 | 0 | 0 |
| LXM | 12.777 | 50.598 | 0 | 79.491 | 38.487 | 1.542 | 6.246 |
| ICL | 45.186 | 37.889 | 240.28 | 60.897 | 0 | 1.354 | 6.493 |
Table A3.
Slacks in input and output variables (Year 3).
| DMU | GDP | CI | TO | II | HTE | LF | UR |
|---|---|---|---|---|---|---|---|
| SWZ | 509.782 | 14.229 | 77.428 | 30.623 | 6.533 | 0 | 0 |
| USA | 0 | 42.819 | 32.002 | 20.307 | 26.515 | 905.631 | 0 |
| SWD | 75.908 | 0 | 10.531 | 4.093 | 4.072 | 0 | 0 |
| UNK | 1462.009 | 6.188 | 30.302 | 34.708 | 15.114 | 0 | 0 |
| NDL | 618.249 | 9.39 | 111.386 | 30.561 | 17.957 | 0 | 0 |
| KOR | 592.272 | 21.952 | 44.009 | 34.105 | 28.844 | 0 | 0 |
| SGP | 164.916 | 9.589 | 295.024 | 26.439 | 49.919 | 0 | 0 |
| GMN | 2566.758 | 11.557 | 56.511 | 34.351 | 8.261 | 0 | 0 |
| FNL | 200.371 | 0 | 13.089 | 1.221 | 4.966 | 2 | 0 |
| DMK | 137.185 | 4.641 | 51.809 | 16.049 | 5.942 | 0 | 0 |
| CHN | 80856.15 | 52.126 | 71.317 | 221.621 | 57.094 | 0 | 31.52 |
| FRN | 1024.262 | 5.056 | 5.896 | 9.859 | 10.006 | 0 | 0 |
| JPN | 3397.928 | 16.077 | 13.242 | 35.256 | 12.156 | 0 | 0 |
| HNK | 105.54 | 0.554 | 297.175 | 11.483 | 62.117 | 0 | 0 |
| CND | 0 | 8.096 | 22.602 | 17.893 | 0 | 0 | 0 |
| AST | 198.706 | 9.096 | 51.84 | 11.842 | 5.48 | 0 | 0 |
| EST | 14.144 | 0 | 0 | 25.077 | 18.229 | 0 | 1.509 |
| ISR | 216.596 | 10.788 | 12.577 | 22.812 | 22.75 | 0 | 0 |
| LXM | 10.637 | 66.879 | 0 | 79.052 | 49.816 | 1.562 | 11.511 |
| ICL | 20.967 | 21.092 | 119.74 | 16.293 | 0 | 0.729 | 3.741 |
Table A4.
Slacks in input and output variables (Year 4).
| DMU | GDP | CI | TO | II | HTE | LF | UR |
|---|---|---|---|---|---|---|---|
| SWZ | 543.953 | 9.86 | 77.41 | 26.282 | 7.238 | 0 | 0 |
| USA | 0 | 35.341 | 23.321 | 10.397 | 19.308 | 854.793 | 0.603 |
| SWD | 0 | 1.876 | 0 | 3.245 | 0 | 0.865 | 0 |
| UNK | 2084.15 | 2.414 | 10.82 | 23.97 | 15.222 | 0 | 0 |
| NDL | 681.748 | 7.92 | 113.403 | 26.085 | 16.039 | 0 | 0 |
| KOR | 1055.031 | 19.809 | 42.799 | 30.666 | 30.369 | 0 | 0 |
| SGP | 203.815 | 8.346 | 285.243 | 22.148 | 48.633 | 0 | 0 |
| GMN | 3183.631 | 10.158 | 51.945 | 28.292 | 9.172 | 0 | 0 |
| FNL | 265.53 | 0 | 8.027 | 0 | 2.826 | 2.005 | 0 |
| DMK | 181.35 | 8 | 58.458 | 18.591 | 6.917 | 0 | 0 |
| CHN | 91658.99 | 55.938 | 82.345 | 233.043 | 63.436 | 0 | 20.572 |
| FRN | 0 | 1.268 | 8.565 | 4.247 | 0 | 0 | 0 |
| JPN | 2960.941 | 14.368 | 13.546 | 32.739 | 10.666 | 0 | 0 |
| HNK | 122.452 | 0.361 | 348.919 | 13.974 | 63.489 | 0 | 0 |
| CND | 0 | 0 | 8.09 | 2.836 | 0 | 0 | 0 |
| AST | 174.646 | 7.15 | 44.016 | 1.266 | 2.203 | 0 | 0 |
| EST | 16.45 | 0 | 0 | 21.003 | 21.054 | 0 | 1.999 |
| ISR | 244.972 | 10.021 | 5.339 | 16.424 | 23.01 | 0 | 0 |
| LXM | 7.57 | 57.178 | 0 | 75.985 | 45.602 | 1.423 | 10.229 |
| ICL | 34.773 | 26.819 | 178.103 | 29.206 | 0 | 0.916 | 4.002 |
Table A5.
Slacks in input and output variables (Year 5).
| DMU | GDP | CI | TO | II | HTE | LF | UR |
|---|---|---|---|---|---|---|---|
| SWZ | 564.126 | 7.619 | 80.744 | 28.136 | 23.567 | 0 | 0 |
| USA | 0 | 40.608 | 26.654 | 16.517 | 14.893 | 938.009 | 3.403 |
| SWD | 0 | 1.924 | 5.421 | 3.987 | 0 | 0.787 | 0 |
| UNK | 2183.211 | 2.983 | 18.901 | 27.563 | 21.286 | 0 | 0 |
| NDL | 669.795 | 7.202 | 128.292 | 28.054 | 16.107 | 0 | 0 |
| KOR | 916.105 | 21.136 | 58.037 | 33.112 | 12.866 | 0 | 0 |
| SGP | 270.63 | 7.815 | 287.218 | 26.869 | 20.623 | 0 | 0 |
| GMN | 2970.151 | 11.431 | 58.094 | 29.888 | 11.247 | 0 | 0 |
| FNL | 251.4 | 0 | 4.537 | 0 | 7.498 | 2.211 | 0 |
| DMK | 184.901 | 6.51 | 67.626 | 18.369 | 10.423 | 0 | 0 |
| CHN | 99566.35 | 52.342 | 88.261 | 230.211 | 59.346 | 0 | 11.883 |
| FRN | 0 | 3.612 | 31.163 | 10.878 | 0 | 0 | 0 |
| JPN | 2602.444 | 14.417 | 13.373 | 30.443 | 8.737 | 0 | 0 |
| HNK | 0 | 16.275 | 0 | 25.897 | 0 | 0 | 1.399 |
| CND | 1120.356 | 3.92 | 0 | 7.325 | 4.484 | 0 | 0 |
| AST | 200.127 | 7.946 | 54.686 | 7.903 | 10.404 | 0 | 0 |
| EST | 17.862 | 1.708 | 0 | 21.303 | 26.968 | 0 | 0 |
| ISR | 305.552 | 12.428 | 9.506 | 18.908 | 17.304 | 0 | 0 |
| LXM | 269.048 | 0 | 0 | 5.628 | 29.602 | 3.409 | 0.196 |
| ICL | 43.658 | 34.401 | 229.385 | 44.994 | 0 | 1.144 | 6.695 |
References
- N. Lind and N. Ramondo, “Global Knowledge and Trade Flows: Theory and Measurement,” Cambridge, MA, Oct. 2022. [CrossRef]
- C. V. Cervantes and R. Cooper, “Labor market implications of education mismatch,” Eur Econ Rev, vol. 148, p. 104179, Sep. 2022. [CrossRef]
- J. Lerner and S. Stern, “Innovation Policy and the Economy: Introduction to Volume 19,” Innovation Policy and the Economy, vol. 19, pp. xi–xiv, Jan. 2019. [CrossRef]
- K. Maryam and Z. Jehan, “Total Factor Productivity Convergence in Developing Countries: Role of Technology Diffusion,” South African Journal of Economics, vol. 86, no. 2, pp. 247–262, Jun. 2018. [CrossRef]
- “‘Innovation index by country, around the world TheGlobalEconomy.com,’ TheGlobalEconomy.com. https://www.theglobaleconomy.com/rankings/GII_Index/OECD/.
- L. Aldieri and C. Vinci, “Green Economy and Sustainable Development: The Economic Impact of Innovation on Employment,” Sustainability, vol. 10, no. 10, p. 3541, Oct. 2018. [CrossRef]
- D. S. Choi, C. S. Sung, and J. Y. Park, “How Does Technology Startups Increase Innovative Performance? The Study of Technology Startups on Innovation Focusing on Employment Change in Korea,” Sustainability, vol. 12, no. 2, p. 551, Jan. 2020. [CrossRef]
- Moradi, A. Amirteimoori, S. Kordrostami, and M. Vaez, “Closest reference point on the strong efficient frontier in data envelopment analysis,” AIMS Mathematics, vol. 5, no. 2, pp. 811–827, Dec. 2019. [CrossRef]
- Q. Zhang, Z. Yang, and B. Gui, “Two-stage network data envelopment analysis production games,” AIMS Mathematics, vol. 9, no. 2, pp. 4925–4961, Jan. 2024. [CrossRef]
- R. Shakouri, M. Salahi, and S. Kordrostami, “Stochastic p-robust approach to two-stage network DEA model,” Quantitative Finance and Economics, vol. 3, no. 2, pp. 315–346, Jan. 2019. [CrossRef]
- M. Akram, S. M. U. Shah, M. M. A. Al-Shamiri, and S. A. Edalatpanah, “Extended DEA method for solving multi-objective transportation problem with Fermatean fuzzy sets,” AIMS Mathematics, vol. 8, no. 1, pp. 924–961, Oct. 2022. [CrossRef]
- Y. Lyu, J. Zhang, L. Wang, F. Yang, and Y. Hao, “Towards a win-win situation for innovation and sustainable development: The role of environmental regulation,” Sustainable Development, vol. 30, no. 6, pp. 1703–1717, Dec. 2022. [CrossRef]
- 13. M. Yi, Y. Wang, M. Yan, L. Fu, and Y. Zhang, “Government R&D Subsidies, Environmental Regulations, and Their Effect on Green Innovation Efficiency of Manufacturing Industry: Evidence from the Yangtze River Economic Belt of China,” Int J Environ Res Public Health, vol. 17, no. 4, p. 1330, Feb. 2020. [CrossRef]
- G. Zeng, H. Guo, and C. Geng, “A Five-Stage DEA Model for Technological Innovation Efficiency of China’s Strategic Emerging Industries, Considering Environmental Factors and Statistical Errors,” Pol J Environ Stud, vol. 30, no. 1, pp. 927–941, Nov. 2020. [CrossRef]
- H. Bao, T. Teng, X. Cao, S. Wang, and S. Hu, “The Threshold Effect of Knowledge Diversity on Urban Green Innovation Efficiency Using the Yangtze River Delta Region as an Example,” Int J Environ Res Public Health, vol. 19, no. 17, p. 10600, Aug. 2022. [CrossRef]
- R. Liu, F. He, and J. Ren, “Promoting or Inhibiting? The Impact of Enterprise Environmental Performance on Economic Performance: Evidence from China’s Large Iron and Steel Enterprises,” Sustainability, vol. 13, no. 11, p. 6465, Jun. 2021. [CrossRef]
- H. Chen, Y. Yang, M. Yang, and H. Huang, “The impact of environmental regulation on China’s industrial green development and its heterogeneity,” Front Ecol Evol, vol. 10, Jul. 2022. [CrossRef]
- T. H. Tran, Y. Mao, P. Nathanail, P.-O. Siebers, and D. Robinson, “Integrating slacks-based measure of efficiency and super-efficiency in data envelopment analysis,” Omega (Westport), vol. 85, pp. 156–165, Jun. 2019. [CrossRef]
- C. G. M. de F. Alves and L. A. Meza, “A review of network DEA models based on slacks-based measure: Evolution of literature, applications, and further research direction,” International Transactions in Operational Research, vol. 30, no. 6, pp. 2729–2760, Nov. 2023. [CrossRef]
- C.-N. Wang and N.-L. Nhieu, “Integrated DEA and hybrid ordinal priority approach for multi-criteria wave energy locating: a case study of South Africa,” Soft comput, vol. 27, no. 24, pp. 18869–18883, Dec. 2023. [CrossRef]
- C. Wang, H. Nguyen, N. Nhieu, and H. Hsu, “A prospect theory extension of data envelopment analysis model for wave-wind energy site selection in New Zealand,” Managerial and Decision Economics, vol. 45, no. 1, pp. 539–553, Jan. 2024. [CrossRef]
- C.-N. Wang, N.-L. Nhieu, and C.-M. Chen, “Charting sustainable logistics on the 21st-Century Maritime Silk Road: a DEA-based approach enhanced by risk considerations through prospect theory,” Humanit Soc Sci Commun, vol. 11, no. 1, p. 398, Mar. 2024. [CrossRef]
- 23. R. K. Goel and M. A. Nelson, “Employment effects of R&D and process innovation: evidence from small and medium-sized firms in emerging markets,” Eurasian Business Review, vol. 12, no. 1, pp. 97–123, Mar. 2022. [CrossRef]
- M. Asiedu, S. C. M. Nazirou, D. S. Mousa, S. J. Sabrina, and A. A. Rosemary, “Analysis of Working Capital Sources on Firm Innovation, and Labor Productivity among Manufacturing Firms in DR Congo,” Journal of Financial Risk Management, vol. 10, no. 02, pp. 200–223, 2021. [CrossRef]
- G. Salimova et al., “Recent trends in labor productivity,” Employee Relations: The International Journal, vol. 44, no. 4, pp. 785–802, Apr. 2022. [CrossRef]
- D. Ou and Z. Zhao, “Higher Education Expansion in China, 1999–2003: Impact on Graduate Employability,” China & World Economy, vol. 30, no. 2, pp. 117–141, Mar. 2022. [CrossRef]
- A.-M. Androniceanu, I. Georgescu, M. Tvaronavičienė, and A. Androniceanu, “Canonical Correlation Anal-ysis and a New Composite Index on Digitalization and Labor Force in the Context of the Industrial Revolu-tion 4.0,” Sustainability, vol. 12, no. 17, p. 6812, Aug. 2020. [CrossRef]
- D. Ç. Yildirim, S. Yildirim, S. Erdogan, and T. Kantarci, “Innovation—Unemployment Nexus: The case of EU countries,” International Journal of Finance & Economics, vol. 27, no. 1, pp. 1208–1219, Jan. 2022. [CrossRef]
- Z. Lydeka and A. Karaliute, “Assessment of the Effect of Technological Innovations on Unemployment in the European Union Countries,” Engineering Economics, vol. 32, no. 2, pp. 130–139, Apr. 2021. [CrossRef]
- P. and A. M., “Entrepreneurship as a Potential Solution to High Unemployment: A Systematic Review of Growing Research and Lessons For Ghana,” International Journal of Entrepreneurship and Business Innovation, vol. 5, no. 2, pp. 26–41, Nov. 2022. [CrossRef]
- M. Afzal, R. Lawrey, and J. Gope, “Understanding national innovation system (NIS) using porter’s diamond model (PDM) of competitiveness in ASEAN-05,” Competitiveness Review: An International Business Journal, vol. 29, no. 4, pp. 336–355, Jul. 2019. [CrossRef]
- Oloruntoba and J. T. Oladipo, “Modelling Carbon Emissions Efficiency from UK Higher Education Insti-tutions Using Data Envelopment Analysis,” Journal of Energy Research and Reviews, pp. 1–18, Sep. 2019. [CrossRef]
- R. Kiani Mavi, N. Kiani Mavi, R. Farzipoor Saen, and M. Goh, “Eco-innovation analysis of OECD countries with common weight analysis in data envelopment analysis,” Supply Chain Management: An International Journal, vol. 27, no. 2, pp. 162–181, Feb. 2022. [CrossRef]
- AYDIN, “Benchmarking healthcare systems of OECD countries: A DEA – based Malmquist Productivity Index Approach,” Alphanumeric Journal, vol. 10, no. 1, pp. 25–40, Jun. 2022. [CrossRef]
- Y. Tian and Z. Ma, “An Efficiency Analysis Of Chinese Coal Enterprises By Using Malmquist Productivity Indexes,” in Proceedings of the 2016 International Conference on Advances in Energy, Environment and Chemical Science, Paris, France: Atlantis Press, 2016. [CrossRef]
- C.-N. Wang, H. Tibo, V. T. Nguyen, and D. H. Duong, “Effects of the Performance-Based Research Fund and Other Factors on the Efficiency of New Zealand Universities: A Malmquist Productivity Approach,” Sustainability, vol. 12, no. 15, p. 5939, Jul. 2020. [CrossRef]
- K. H. Dakpo, P. Jeanneaux, L. Latruffe, C. Mosnier, and P. Veysset, “Three decades of productivity change in French beef production: a Färe-Primont index decomposition,” Australian Journal of Agricultural and Resource Economics, vol. 62, no. 3, pp. 352–372, Jul. 2018. [CrossRef]
- P. Mitropoulos, I. Mitropoulos, H. Karanikas, and N. Polyzos, “The impact of economic crisis on the Greek hospitals’ productivity,” Int J Health Plann Manage, vol. 33, no. 1, pp. 171–184, Jan. 2018. [CrossRef]
- E. BOZKURT, Ö. TOPÇUOĞLU, and A. ALTINER, “RELATIONSHIP BETWEEN PRODUCTIVITY AND DIGITALIZATION WITH TOBIT MODEL BASED ON MALMQUIST INDEX,” Verimlilik Dergisi, pp. 67–78, Jan. 2022. [CrossRef]
- M. Pham, L. Simar, and V. Zelenyuk, “Statistical Inference for Aggregation of Malmquist Productivity Indi-ces,” Oper Res, Jan. 2023. [CrossRef]
- P. S. Sukmaningrum, A. Hendratmi, S. A. Rusmita, and S. Abdul Shukor, “Productivity analysis of family takaful in Indonesia and Malaysia: Malmquist productivity index approach,” Journal of Islamic Accounting and Business Research, vol. 13, no. 4, pp. 649–665, Apr. 2022. [CrossRef]
- H. Chen, Y. Yang, M. Yang, and H. Huang, “The impact of environmental regulation on China’s industrial green development and its heterogeneity,” Front Ecol Evol, vol. 10, Jul. 2022. [CrossRef]
- W. Wang and T. Chen, “Efficiency Evaluation and Influencing Factor Analysis of China’s Public Cultural Services Based on a Super-Efficiency Slacks-Based Measure Model,” Sustainability, vol. 12, no. 8, p. 3146, Apr. 2020. [CrossRef]
- K. Tone, “A slacks-based measure of efficiency in data envelopment analysis,” Eur J Oper Res, vol. 130, no. 3, pp. 498–509, May 2001. [CrossRef]
- Färe, R.; Grosskopf, S.; Margaritis, D. Malmquist Productivity Indexes and DEA. In Handbook on Data Envelopment Analysis; Springer: Boston, MA, USA, 2011; pp. 127–150. [CrossRef]
Figure 1.
The annual Efficiency scores of each DMU (Year 1 – Year 5).
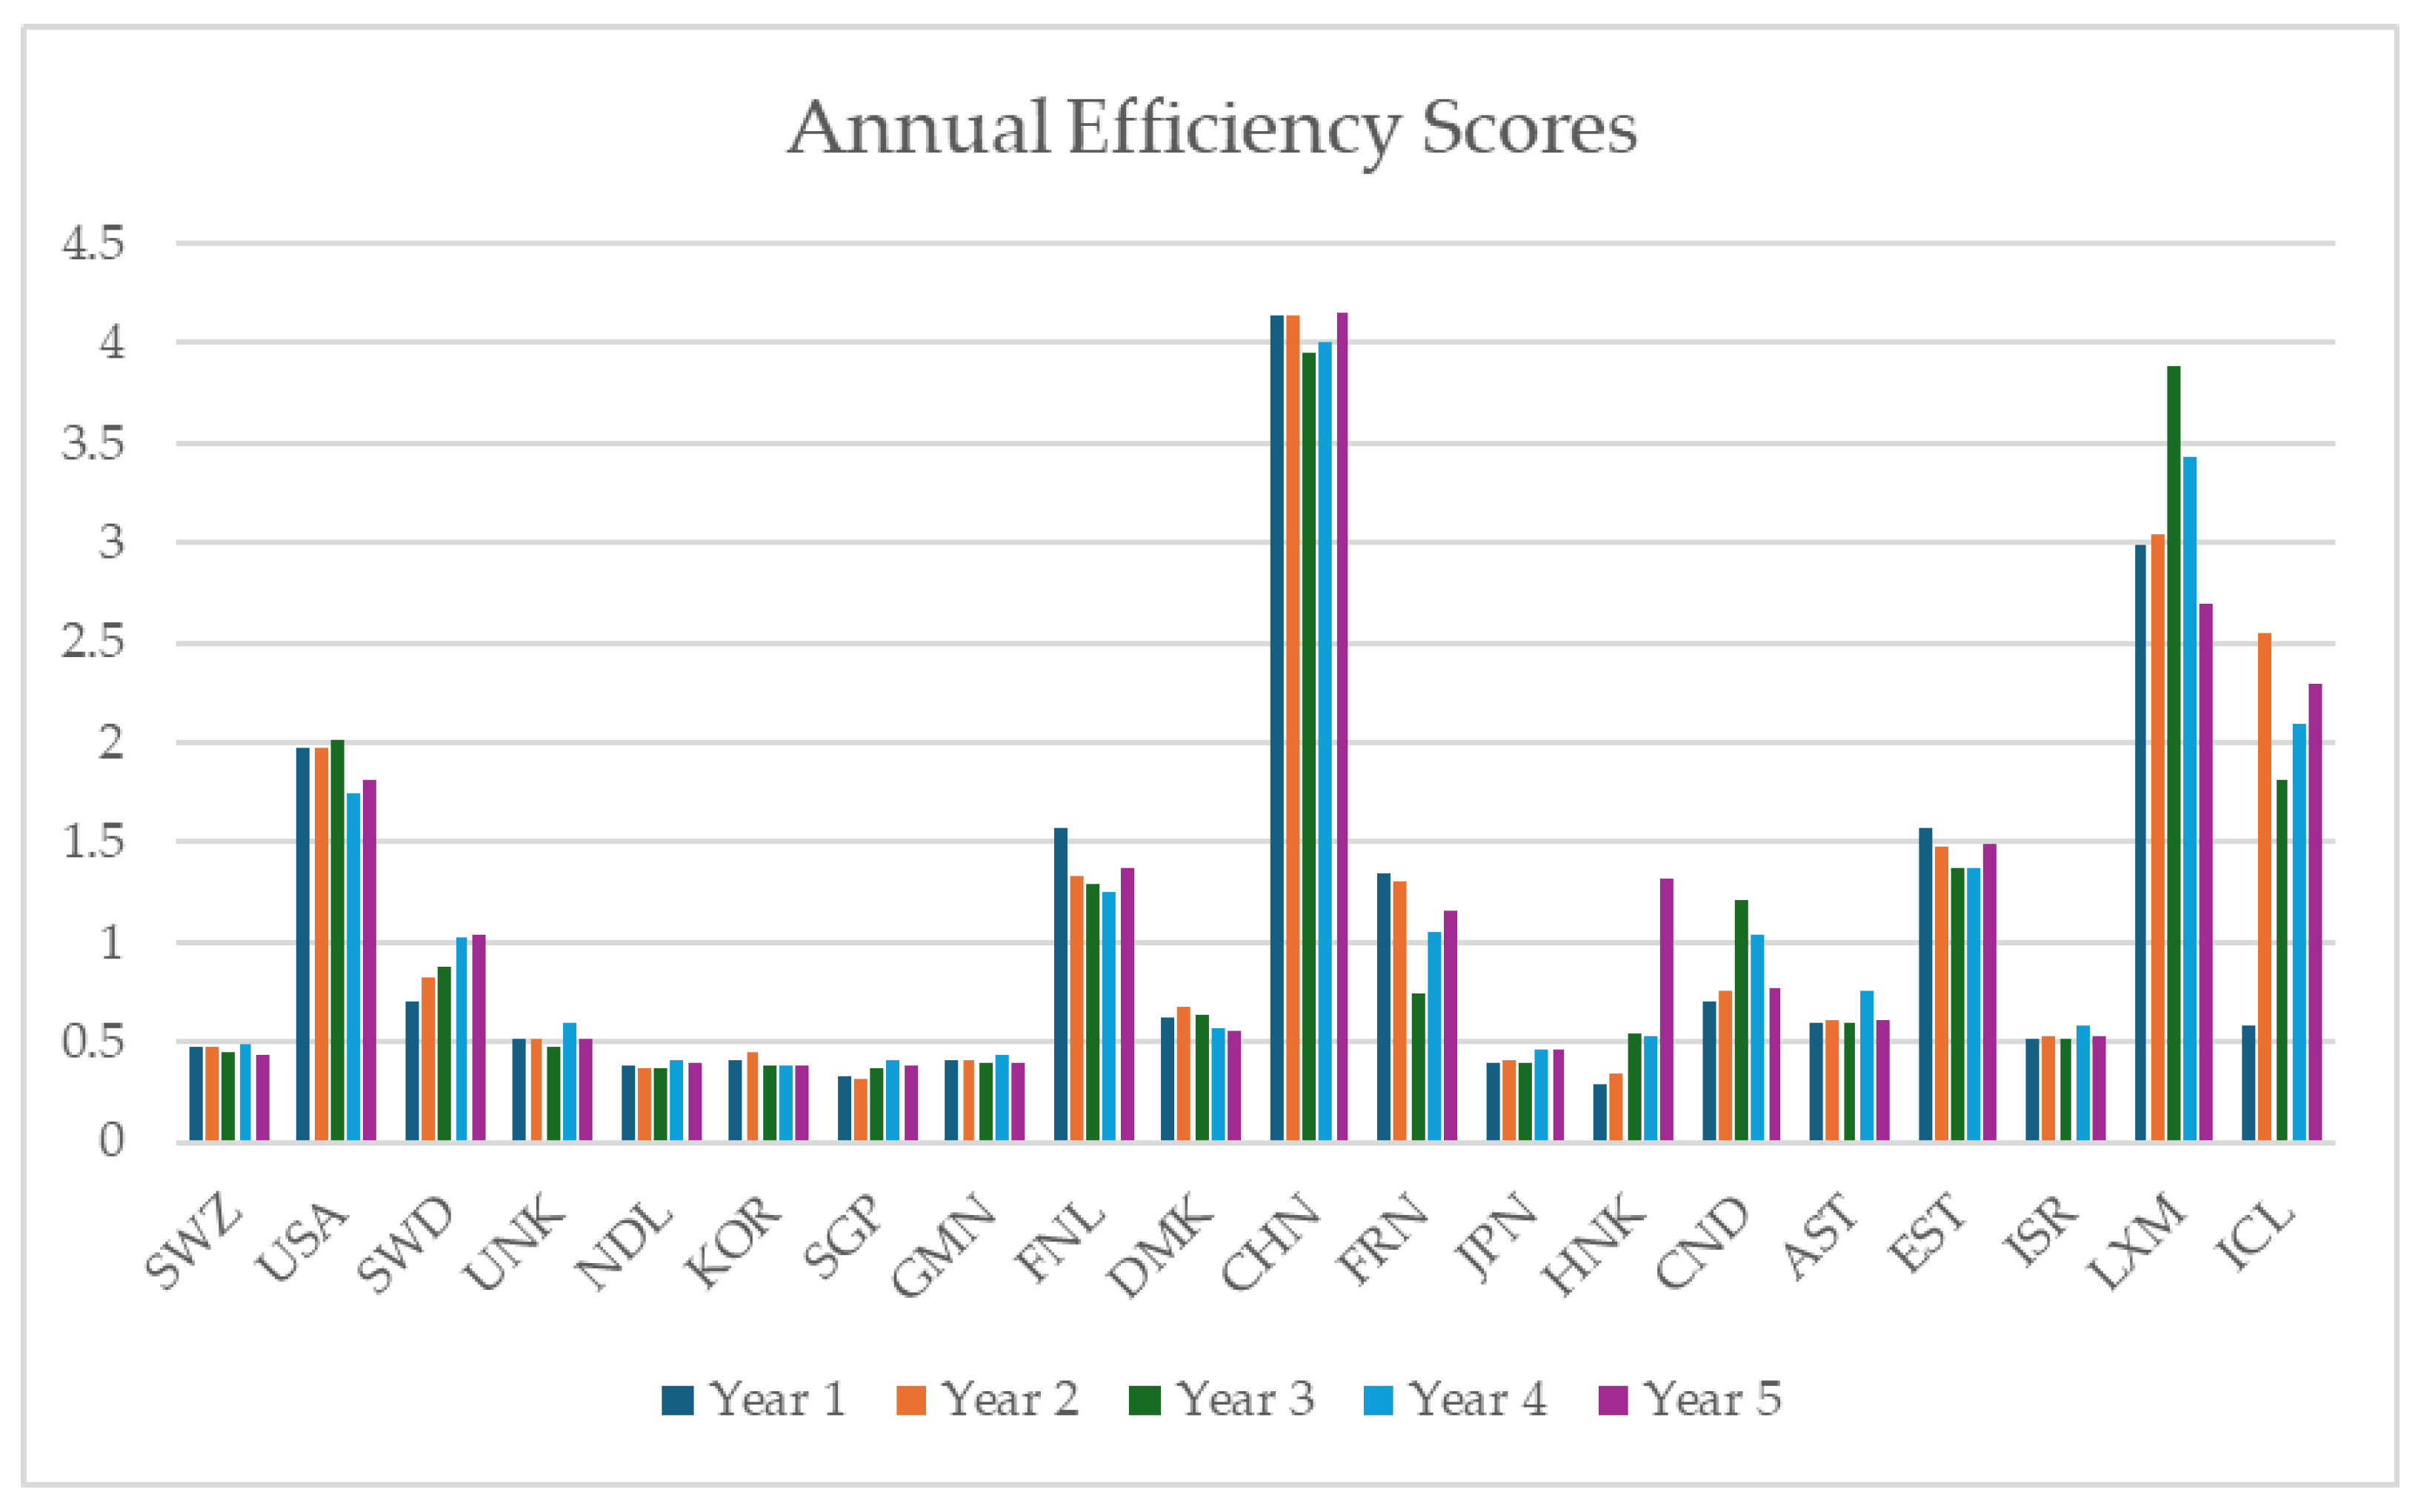
Figure 2.
Graph of all the annual efficiency scores of each DMU (Year 1 – Year 5).
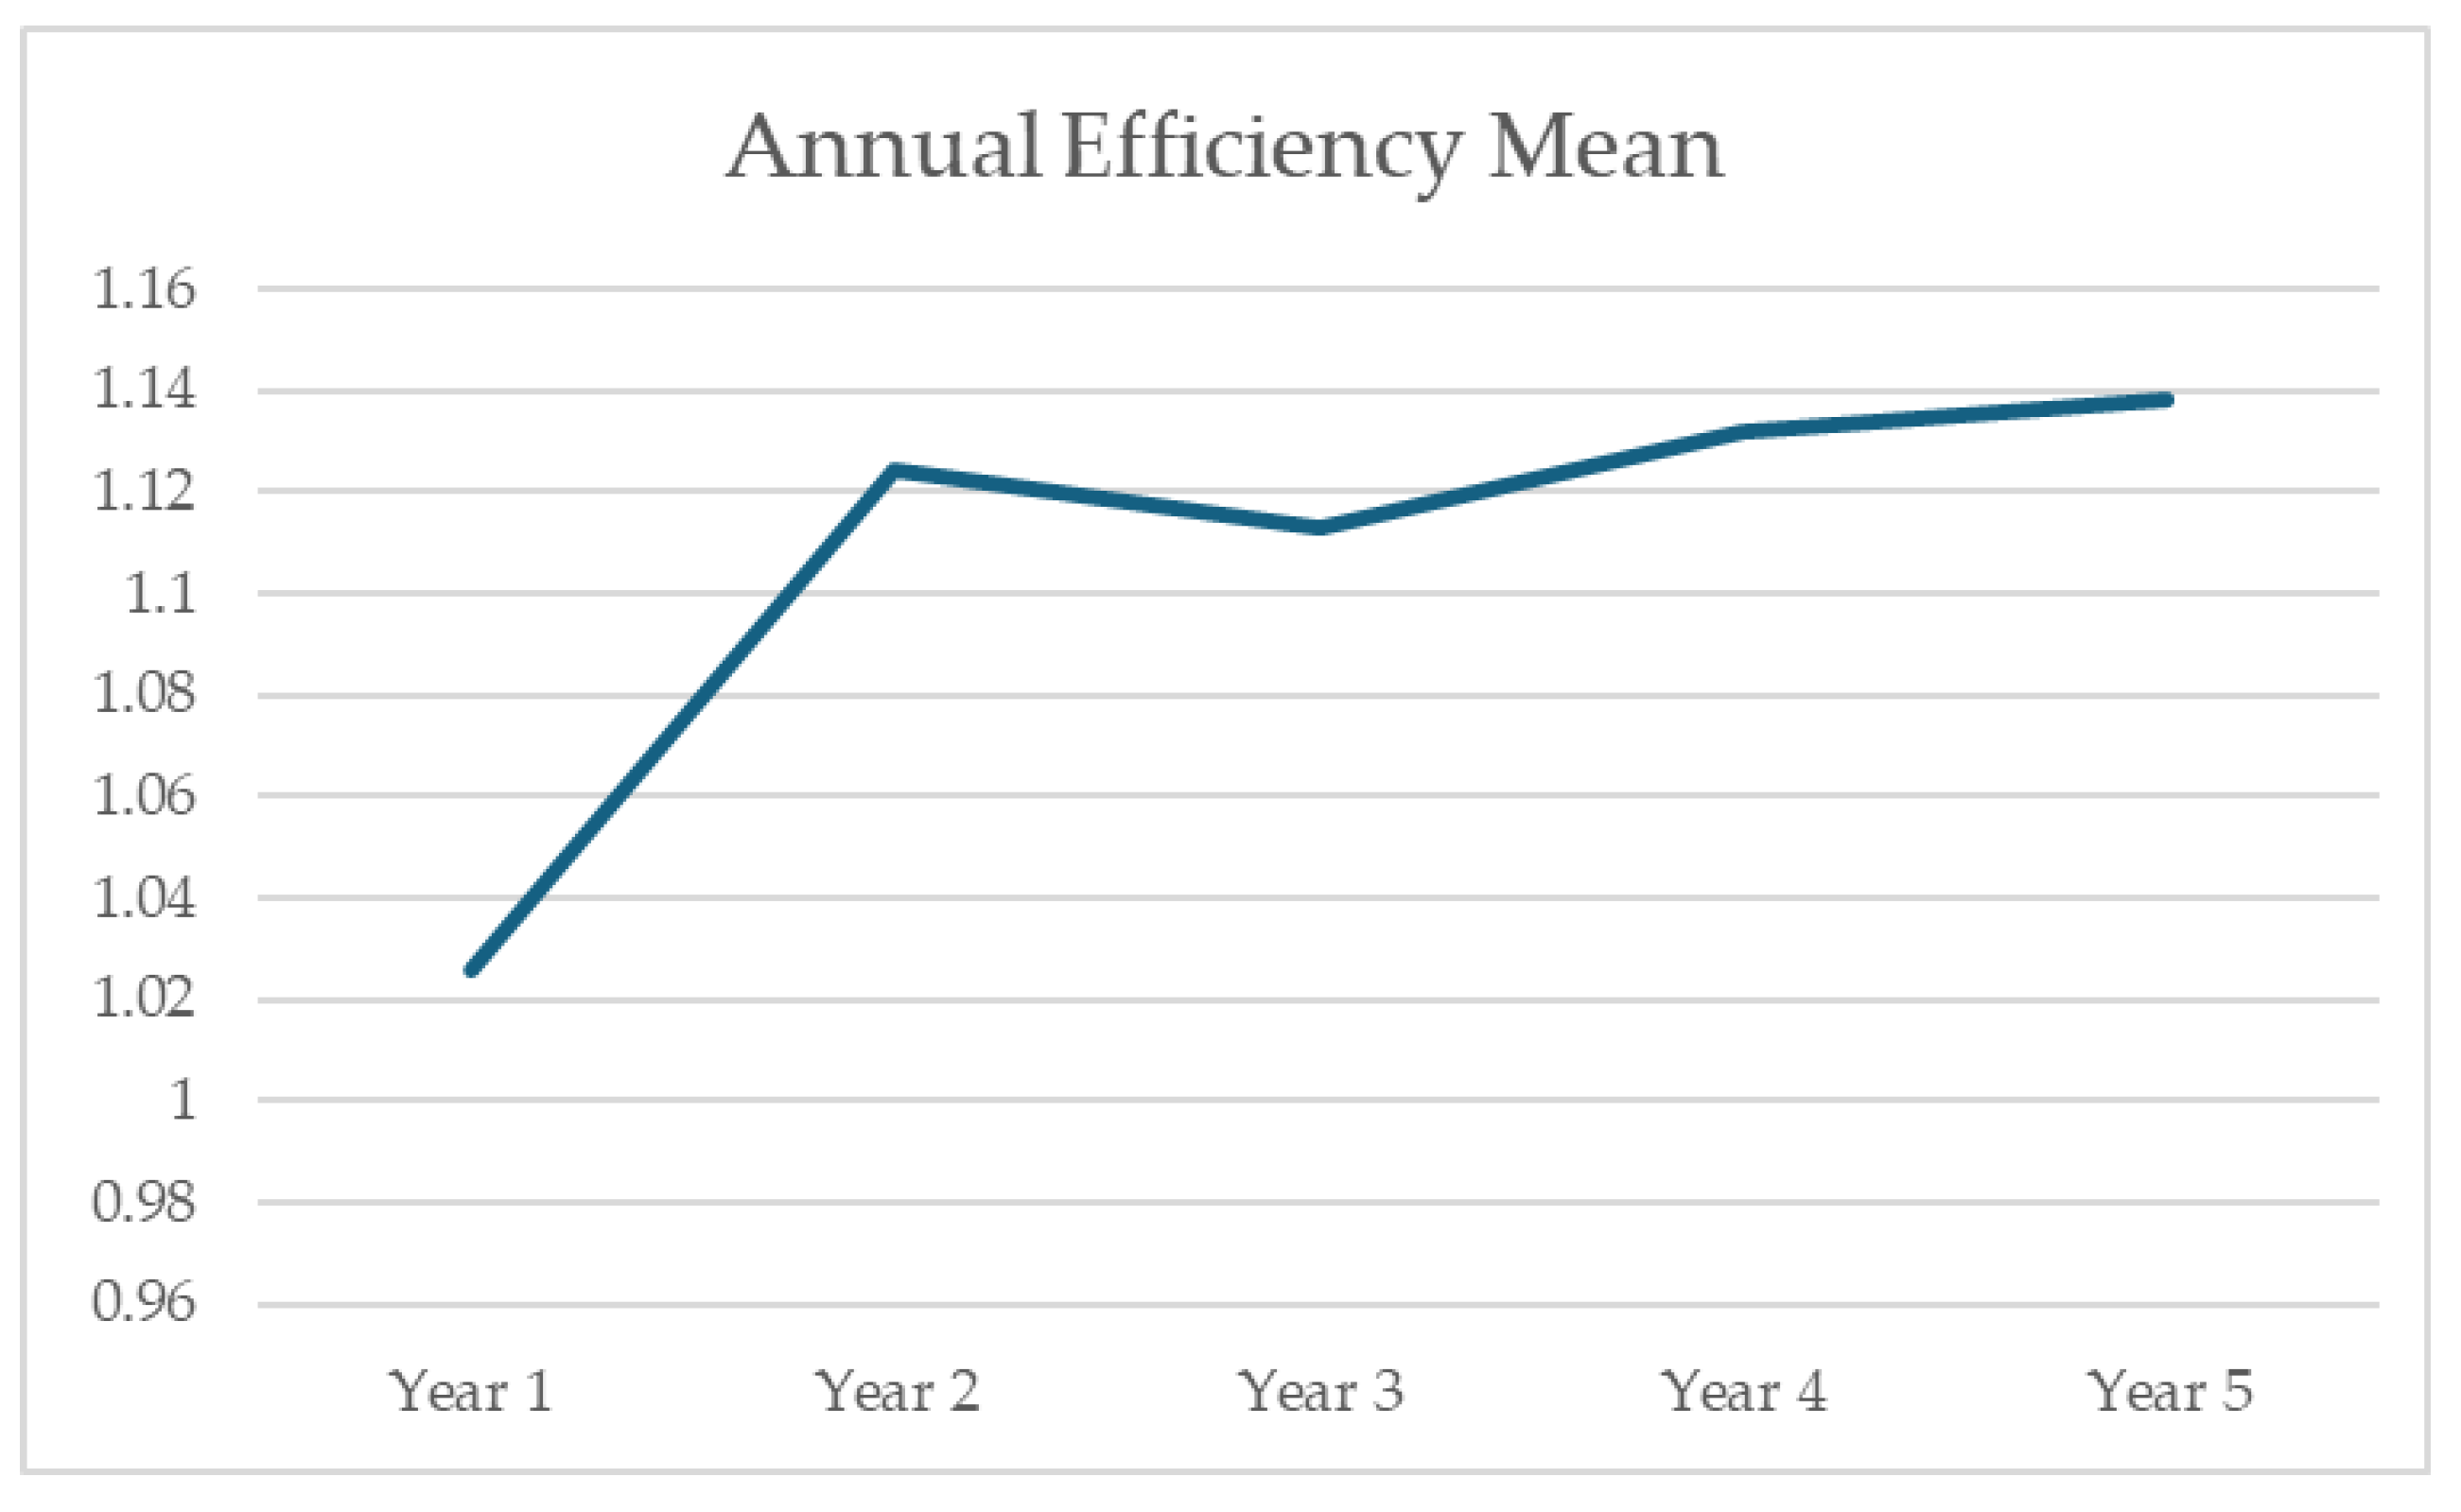
Table 5.
Catch-up Efficiency Analysis (Year 1 – Year 5).
| Catch-up | Year 1 - Year 2 | Year 2 - Year 3 | Year 3 - Year 4 | Year 4 - Year 5 | Average |
|---|---|---|---|---|---|
| SWZ | 1.022 | 0.923 | 1.101 | 0.887 | 0.983 |
| USA | 1.002 | 1.262 | 0.896 | 0.910 | 1.017 |
| SWD | 1.164 | 1.080 | 1.162 | 0.980 | 1.096 |
| UNK | 1.000 | 0.921 | 1.267 | 0.871 | 1.015 |
| NDL | 0.957 | 0.997 | 1.131 | 0.967 | 1.013 |
| KOR | 1.081 | 0.864 | 1.009 | 0.982 | 0.984 |
| SGP | 0.951 | 1.172 | 1.102 | 0.943 | 1.042 |
| GMN | 0.998 | 0.957 | 1.086 | 0.936 | 0.994 |
| FNL | 0.851 | 0.957 | 0.944 | 1.121 | 0.968 |
| DMK | 1.076 | 0.951 | 0.901 | 0.961 | 0.972 |
| CHN | 0.995 | 0.958 | 1.014 | 1.039 | 1.002 |
| FRN | 1.008 | 0.591 | 1.375 | 1.102 | 1.019 |
| JPN | 1.022 | 0.949 | 1.176 | 1.023 | 1.042 |
| HNK | 1.176 | 1.611 | 0.965 | 1.950 | 1.426 |
| CND | 1.063 | 1.617 | 0.851 | 0.745 | 1.069 |
| AST | 1.021 | 0.985 | 1.258 | 0.814 | 1.019 |
| EST | 0.867 | 0.910 | 0.948 | 1.305 | 1.008 |
| ISR | 1.053 | 0.944 | 1.147 | 0.901 | 1.011 |
| LXM | 1.084 | 1.054 | 0.821 | 0.968 | 0.982 |
| ICL | 1.823 | 1.119 | 1.124 | 0.778 | 1.211 |
| Average | 1.061 | 1.041 | 1.064 | 1.009 | 1.044 |
Table 6.
Frontier Shift Analysis (Year 1-Year 5).
| Frontier | Year 1 -Year 2 | Year 2 - Year 3 | Year 3 - Year 4 | Year 4 -Year 5 | Average |
|---|---|---|---|---|---|
| SWZ | 0.919 | 1.157 | 0.945 | 0.882 | 0.976 |
| USA | 0.932 | 1.468 | 0.741 | 0.777 | 0.980 |
| SWD | 0.917 | 1.206 | 0.883 | 0.806 | 0.953 |
| UNK | 0.933 | 1.328 | 0.812 | 0.719 | 0.948 |
| NDL | 0.929 | 1.145 | 0.946 | 0.889 | 0.977 |
| KOR | 0.931 | 1.229 | 0.865 | 0.899 | 0.981 |
| SGP | 0.929 | 1.151 | 0.948 | 0.889 | 0.979 |
| GMN | 0.939 | 1.272 | 0.839 | 0.911 | 0.990 |
| FNL | 0.989 | 1.198 | 0.966 | 0.890 | 1.011 |
| DMK | 0.918 | 1.163 | 0.943 | 0.890 | 0.979 |
| CHN | 1.016 | 1.025 | 0.966 | 1.023 | 1.008 |
| FRN | 0.923 | 1.558 | 0.695 | 0.797 | 0.993 |
| JPN | 0.957 | 1.230 | 0.816 | 0.909 | 0.978 |
| HNK | 0.933 | 1.451 | 0.952 | 0.496 | 0.958 |
| CND | 0.911 | 1.199 | 0.843 | 0.860 | 0.953 |
| AST | 0.918 | 1.159 | 0.942 | 0.814 | 0.958 |
| EST | 0.928 | 1.466 | 0.888 | 0.831 | 1.029 |
| ISR | 0.919 | 1.181 | 0.932 | 0.700 | 0.933 |
| LXM | 0.954 | 1.243 | 0.804 | 0.913 | 0.978 |
| ICL | 0.903 | 1.589 | 0.932 | 0.725 | 1.037 |
| Average | 0.935 | 1.271 | 0.883 | 0.831 | 0.980 |
Table 8.
Annual Mean of Efficiency Change, Technological Change, and Total Productivity Change.
| Year | Efficiency Change | Technological Change | TFP Change |
|---|---|---|---|
| Year 1-Year 2 | 1.061 | 0.935 | 0.99 |
| Year 2-Year 3 | 1.041 | 1.271 | 1.325 |
| Year 3-Year 4 | 1.064 | 0.883 | 0.938 |
| Year 4-Year 5 | 1.009 | 0.831 | 0.825 |
| Average | 1.044 | 0.98 | 1.019 |
Disclaimer/Publisher’s Note: The statements, opinions and data contained in all publications are solely those of the individual author(s) and contributor(s) and not of MDPI and/or the editor(s). MDPI and/or the editor(s) disclaim responsibility for any injury to people or property resulting from any ideas, methods, instructions or products referred to in the content. |
© 2025 by the authors. Licensee MDPI, Basel, Switzerland. This article is an open access article distributed under the terms and conditions of the Creative Commons Attribution (CC BY) license (http://creativecommons.org/licenses/by/4.0/).
Copyright: This open access article is published under a Creative Commons CC BY 4.0 license, which permit the free download, distribution, and reuse, provided that the author and preprint are cited in any reuse.


