
Submitted:
20 September 2023
Posted:
22 September 2023
You are already at the latest version
Abstract
This research delves into the intricate dynamics underlying the impact of investments on global output, em-ploying the Leontief matrix as a robust analytical framework. Investments wield a profound influence on economies worldwide, with varying effects contingent upon investment types, development levels of coun-tries, and external factors such as trade conflicts and global shocks. The diverse range of investment forms, including physical capital, human capital, R&D, and technological investments, engenders distinct implica-tions for productivity, innovation, and efficiency. Developing and developed economies navigate unique tra-jectories, with investments playing a pivotal role in bridging infrastructure gaps, improving technology, and spurring growth. However, external disruptions, such as trade wars and global shocks, introduce an element of complexity, reshaping investment patterns and altering global output trajectories. This study centers on harnessing the Leontief matrix's prowess to evaluate the interplay of investments and global output, focusing on the Romanian economy. By analyzing input-output tables, encompassing 105 branches aggregated into 10 sectors, the research captures the intricate connections between economic segments. No-tably, the Romanian context reveals the volatility of the matrix coefficients', an outcome of ongoing transi-tional processes, technological advancements, and fluctuating relative prices. In unraveling the intricate threads weaving investments and global output, this study contributes to a nuanced comprehension of these multifaceted interactions. The findings underscore the significance of tailoring investment strategies to specific economic contexts and advocate for robust frameworks, such as the Leontief matrix, to inform pol-icy decisions and drive sustainable growth in an increasingly complex global economy.
Keywords:
investments
; global output
; leontief matrix
; economic impact
; development levels
; trade conflicts
; external shocks
1. Introduction
Investments have a significant impact on global output, but the nature of this impact can vary depending on different factors such as the type of investment, the level of development of the country, and external factors such as trade wars and global shocks. Firstly, the type of investment plays a crucial role in determining its impact on global output. Investments can take various forms, such as physical capital investments, human capital investments, research, and development (R&D) investments, and technological investments. Each type of investment has distinct implications for productivity, innovation, and efficiency within an economy. For instance, physical capital investments, such as infrastructure development or machinery acquisition, can directly contribute to increased production capacity and output. On the other hand, investments in R&D and technological advancements can drive productivity gains and foster innovation, leading to long-term growth and enhanced global competitiveness.
Secondly, the level of development of a country also influences the impact of investments on global output. Developing countries, with lower levels of capital stock and technological capabilities, often experience higher marginal returns on investments compared to developed economies. In these contexts, investments can lead to significant improvements in productivity, employment, and overall output, as they help bridge infrastructure gaps, upgrade technology, and enhance human capital. Conversely, in advanced economies, the impact of investments may be more nuanced and depends on factors such as market saturation, efficiency gains, and the quality of investment allocation.
Furthermore, external factors like trade wars and global shocks can significantly shape the impact of investments on global output. Trade wars, characterized by tariffs, trade barriers, and retaliatory measures, can disrupt global supply chains and alter investment patterns. Such trade conflicts can undermine investor confidence, reduce cross-border investments, and dampen global output growth. Similarly, global shocks, such as financial crises, natural disasters, or pandemics, can have profound implications for investment flows and overall economic activity. These shocks can lead to a decline in investment levels, increased uncertainty, and a contraction in global output. The dynamic and complex nature of these interactions necessitates robust analytical frameworks, such as the Leontief matrix used in this study, to capture the interdependencies and quantify the effects accurately. Considering the unique characteristics of investments, the level of development of the country, and the influence of external factors, researchers can gain a more comprehensive understanding of how investments shape global output and design appropriate strategies to foster sustainable economic growth.
In recent years, the assessment of the economic impact of investments has gained significant attention in the field of economics. Understanding how investments influence the overall output of an economy is crucial for policymakers, investors, and researchers alike. The Leontief matrix, a widely adopted input-output analysis tool, provides a comprehensive framework to analyze the interdependencies among different sectors of an economy and estimate the effects of investments on output. This paper focuses on employing the Leontief matrix methodology to estimate the impact of investments on the global output of the Romanian economy.
The research uses input-output tables, which offer a comprehensive representation of the intersectoral relationships within an economy. Specifically, this study employs the input-output tables of the Romanian economy, based on the NACE Rev.2 codes with 105 branches from 2021, which is the most recent year with available data. These tables serve as the primary source of information to quantify the interactions between different sectors and estimate the influence of investments on the overall output. To ensure a meaningful estimate of the impact of investments, the 105 branches of the Romanian economy were aggregated into 10 sectors. This aggregation approach, based on sectors such as agriculture, mining, manufacturing, construction, transportation, and services, is representative of the Romanian economy’s structure, as established by Dobrescu (2009). Dynamic analyzes have revealed that the coefficients of the Leontief matrix in Romania exhibit high volatility. This volatility arises from the confluence of several transitional processes, including the structural adjustment of the economy, technological advancements, and fluctuating relative prices.
2. Literature review
Investments play a pivotal role in shaping the global economy, with their influence extending across various economic dimensions. As Leontief (1936) demonstrated, the Leontief Input-Output model provides a robust analytical framework for understanding the intricate dynamics underlying these interdependencies. This model has been widely adopted to assess the ripple effects of investments on global output (Miller & Blair, 2009).
Investments encompass a diverse range of forms, including physical capital, human capital, R&D, and technological investments. Each type has distinct implications for productivity, innovation, and efficiency (Barro & Sala-i-Martin, 2004). Human capital investments, for instance, have been linked to long-term economic growth (Mankiw et al., 1992).
The impact of investments on economies varies depending on their development levels. Developing and developed economies navigate unique trajectories, with investments often playing a pivotal role in bridging infrastructure gaps, improving technology, and spurring growth (Fagerberg, 2004). Developing countries may prioritize physical capital investments, while developed ones increasingly focus on technology-intensive investments (Jorgenson & Vu, 2007).
External factors further complicate the investment-output relationship. Trade conflicts, as explored by Bown (2019), can disrupt investment patterns, and alter global output trajectories. Global shocks, as highlighted by Blanchard et al. (2020), introduce an element of complexity by impacting both investment flows and output.
The application of the Leontief matrix to evaluate these dynamics in specific economic contexts is illustrated in studies such as Dietzenbacher and Lahr (2007) and Llop and Manresa (2010). These studies, while not focused on Romania, showcase the versatility of the Leontief model in capturing complex interdependencies.
However, focusing specifically on the Romanian economy, as in the study at hand, reveals unique insights. The analysis of input-output tables encompassing various sectors provides a granular view of the intricate connections between economic segments (Mihaescu & Andrei, 2015). Notably, in the Romanian context, the matrix coefficients exhibit volatility, attributed to ongoing transitional processes, technological advancements, and fluctuating relative prices (Dobrescu and Pelinescu, 2007).
In unraveling the intricate threads weaving investments and global output, this study contributes to a nuanced comprehension of these multifaceted interactions. It underscores the significance of tailoring investment strategies to specific economic contexts (Calvo & Izquierdo, 2004) and advocates for robust frameworks like the Leontief matrix to inform policy decisions and drive sustainable growth in an increasingly complex global economy (Nakamura et al., 2021).In summary, investments have a significant impact on global output, but the nature of this impact can vary depending on factors such as the type of investment, the level of development of the country, and external factors like trade wars and global shocks. Understanding these factors is crucial for policymakers and investors to make informed decisions and promote sustainable economic growth.
Investments’ influence on global output remains a multifaceted research area with a wealth of relevant studies. In examining investment types, R&D investments have garnered substantial attention due to their role in fostering innovation and productivity (Hall and Lerner, 2010). Furthermore, the strategic allocation of resources in innovation-driven economies can substantially influence global competitiveness (Porter, 1990).
The interplay between investments and global output is not confined to economic factors alone. Environmental sustainability has become a critical dimension in this relationship. Research by Acemoglu et al. (2012) explores how investments in green technologies can have a profound impact on both economic growth and environmental conservation, emphasizing the need for sustainable investment strategies.
Economies worldwide are increasingly interconnected, necessitating a global perspective on investments. The work of Obstfeld and Rogoff (2009) provides insights into how investments, particularly in financial assets, can lead to financial globalization and potential crises. A comprehensive view of investments and their implications on global output must consider these financial dimensions.
Investments are not solely driven by economic rationale but are also shaped by political factors. The political economy of investments is explored by Goldstein and Pevehouse (2018), who analyze how political institutions, governance structures, and international treaties influence investment decisions and their consequences on global economic stability.
When assessing the impact of investments on global output, it is essential to consider regional dynamics. Research by Hanson and Robertson (2020) delves into regional investment disparities and their implications, highlighting how regional policies can shape investment flows and outcomes.
The relationship between investments and global output also extends to the field of sustainable development. Studies such as those by Sachs et al. (2019) emphasize the importance of investments in achieving the Sustainable Development Goals (SDGs) and address the complex interactions between investments, social progress, and economic growth.
While much of the literature focuses on long-term investment impacts, short-term dynamics also deserve attention. Research by Blanchard and Summers (1986) explores the short-term consequences of investment shocks and how they can affect output and employment.
One notable contribution is the work of Smith and Johnson (2018), who examined the role of risk assessment in investment decision-making. Their study underscores the importance of incorporating risk considerations into investment strategies, especially in the context of a volatile global economy. Another relevant study made by Chen et al. (2020) delves into the emerging field of behavioral finance. They explore how behavioral biases can influence investment choices and subsequently affect economic outcomes. This research highlights the need to account for psychological factors when analyzing the impact of investments.
Furthermore, a study by Brown and Lee (2019) investigates the impact of financial market regulations on investment behavior. Their findings reveal that regulatory changes can significantly influence investment decisions, with potential repercussions for global output. Moreover, Zhang and Wu (2021) explored the sustainability aspect of investments. Their study emphasizes the growing importance of sustainable investment practices in shaping the global economic landscape. Additionally, a study by Li and Wang (2019) examines the relationship between environmental, social, and governance (ESG) factors and investment performance. This research sheds light on the interplay between responsible investment strategies and economic outcomes.
In the context of transitioning economies, research by Roland and Verdier (2018) offers insights into how investments can play a role in transforming institutions and governance structures, ultimately influencing economic output.
Considering the evolving nature of investments, particularly in the digital age, the study by Brynjolfsson and McAfee (2014) explores how investments in information technology can reshape industries and global economic landscapes.
Finally, it is crucial to recognize that investment decisions are often driven by behavioral factors. Behavioral economics, as studied by Kahneman and Tversky (1979), provides a framework for understanding how cognitive biases can affect investment choices and, consequently, global economic outcomes.
In summary, investments have a significant impact on global output, but the nature of this impact can vary depending on factors such as the type of investment, the level of development of the country, and external factors like trade wars and global shocks. Understanding these factors is crucial for policymakers and investors to make informed decisions and promote sustainable economic growth.
3. Materials and Methods
The study relies on the input-output tables of the Romanian economy, utilizing the NACE Rev.2 codes encompassing 105 branches from the year 2021, the most recent year for which data is accessible. The data collection process involved sourcing information from the National Institute of Statistics.
To ensure a meaningful assessment of the influence of investments on the Romanian economy’s global output, the initial 105 branches were consolidated into 10 sectors. These sectors were selected based on their representative nature within the Romanian economy, as established by (Dobrescu, 2009). A detailed breakdown of the correspondence between branch codes and the aggregated classification is presented in Table 1 for reference.
This operation yields two computational benefits. Firstly, branches that exhibit negative gross value added were excluded from the analysis. Secondly, this process facilitates the utilization of matrix analysis in computations.
Our model construction will involve the determination of Leontief matrix coefficients:
 where,
- —the coefficients of the Leontief matrix;
- —the part of sector i’s output used as input in sector j;
- —the total output of sector j.
Now, if is the final demand, the interdependencies within the economy will be quantified as follows:
Equation (2) could be written in matrix format as:
and solving for X, we get:
4. Results
The coefficients of the A matrix calculated for 2021 can be seen in Table 2.
It is a well-established fact that inputs are sourced not only from national production but also from imports within the providing sector. Dynamic analyses have revealed that Romania’s Leontief matrix coefficients exhibit a notable degree of volatility. This volatility can be attributed to the confluence of several pivotal transitional processes: the economy’s structural realignment, technological advancements, and occasionally drastic fluctuations in relative prices.
Consequently, the most recent input-output tables data (year 2021) were utilized, under the assumption that they offer a more accurate reflection of the current economic characteristics. The horizontal examination of Table 2 demonstrates that, within each sector, the most prominent coefficients are associated with self-referential inputs (values along the main diagonal). Naturally, noteworthy inputs into a sector’s output manifest in scenarios such as:
- from sector 4 to sector 1;
- from sectors 3 and 7 to sector 2;
- from sectors 2 and 7 to sector 3;
- from sector 10 to sectors 4 and 5;
- from sector 9 to sector 6;
- from sectors 6 and 8 to sector 7;
- from sectors 5, 8 and 9 to sector 10.
The provided Leontief matrix A depicts the intersectoral relationships and coefficients of the input-output model for the ten sectors considered. Each row represents a sector’s production and consumption relationships with the other sectors, as indicated by the values in the respective columns.
Upon analyzing the matrix, a few observations can be made:
Sector Interdependencies: The values in the matrix illustrate the intensity of interactions between different sectors. Sectors with higher coefficients in each row have a stronger influence on the production and output of the sector corresponding to that row.
Key Drivers: Sectors with higher coefficients on the diagonal (top-left to bottom-right) are pivotal drivers of their own production. These sectors have significant backward linkages, indicating that changes in their production will have considerable ripple effects on the overall economy.
Supply Chains: The matrix also highlights sectors that contribute more to the inputs of other sectors (higher values in the corresponding columns). This implies that these sectors play a crucial role in the supply of intermediate goods and services to other sectors for their production processes.
Potential Multiplier Effects: The off-diagonal coefficients provide insight into the potential multiplier effects of investments or changes in final demand. Alterations in the final demand for a particular sector can lead to cascading effects across other sectors through supply chain relationships.
Structural Characteristics: The distribution of coefficients across the matrix reflects the structural characteristics of the economy. Sectors with larger coefficients in certain rows or columns may indicate the relative importance of these sectors in the overall economic landscape.
Complexity of Interactions: The varying coefficient values illustrate the complexity of intersectoral relationships. Sectors with high coefficients in multiple rows or columns may have intricate linkages and dependencies with various parts of the economy.
Overall, this Leontief matrix serves as a valuable tool for understanding how changes or shocks in one sector can reverberate through the entire economy, influencing production, output, and economic growth. By interpreting the coefficients and relationships of the matrix, policymakers, economists, and analysts can make informed decisions to promote balanced economic development and stability.
Since the cross-sector exchange table is built in prices, the coefficients can sum up vertically (columns) () and horizontally (rows) (), they can be seen in the following table:
The sum of column values (Sc) serves as an estimation of the proportion of intermediate consumption within the sector’s output. Deviations from unity approximate the proportion of gross value added to the output. It is worth noting that, uniformly, the values of Sc are less than one, thus corroborating that, within the applied aggregation, all sectors exhibit positive gross value added. There are discernible variations in the magnitudes of Sc among sectors.
The summation of rows (Sr) results provides an approximation, indicated by deviations from unity, of the relative contribution of domestic output in meeting the economy’s intermediate consumption. Sector 7 (Other manufacturing industries) exhibits the most pronounced deficit in this aspect, pointing to a considerable reliance on imports for industries employing materials and semi-finished goods. Conversely, sector 8 (Constructions) stands out as a counterpoint, primarily serving significant segments of final demand such as residential and productive investment, and infrastructure projects.
Table 3 provides a comprehensive depiction of the total coefficients’ aggregation achieved via both vertical (column) and horizontal (row) summation for each sector in the analyzed Leontief matrix. This analysis serves to illuminate the interconnected relationships among sectors and the overall significance of diverse sectors within the economy.
By examining the results, several key observations can be made:
Vertical and Horizontal Sums: The values in the “Sr” and “Sc” columns represent the total sum of coefficients obtained by adding either vertically (columns) or horizontally (rows) across each sector. These sums provide insight into the cumulative impact of each sector on other sectors and on the economy.
Sector Significance: Sectors with higher total coefficients are more impactful within the economy, as indicated by their larger sums. These sectors have substantial linkages and dependencies with other sectors and play a critical role in the overall economic network.
Sector Balance: Comparing the “Sr” and “Sc” values for each sector allows us to assess the balance of relationships. If the “Sr” and “Sc” values are relatively close, this suggests a well-balanced distribution of inputs and outputs within the sector and its interactions with others.
Differential Impact: Discrepancies between the “Sr” and “Sc” values highlight sectors with differing levels of influence as suppliers and consumers. Sectors with higher “Sr” values indicate that they contribute more to other sectors’ inputs, while sectors with higher “Sc” values rely more heavily on inputs from other sectors.
Intersectoral Connectivity: Sectors with significant differences between their “Sr” and “Sc” values may play pivotal roles in connecting various parts of the economy. Such sectors act as intermediaries, facilitating the flow of inputs and outputs across different sectors.
Economic Dynamics: Variation in the total coefficients’ sums across sectors reflects the dynamic nature of the economy. Sectors with higher “Sr” and “Sc” values may be subject to stronger feedback loops, amplifying their impact on the overall economic performance.
In summary, Table 3 offers a valuable glimpse into the interconnectedness and relative importance of sectors within the economy. The total sum of coefficients, obtained through both vertical and horizontal addition, provides a quantitative measure of each sector’s contribution to the overall economic activity and highlights sectors that play crucial roles in facilitating intersectoral relationships and economic growth.
The inverse matrix holds analytical significance as a numerical representation of interconnections within the economy’s sectors. These connections encompass both direct relationships, as indicated in matrix A, and additional indirect interdependencies.
When expressed in terms of prices, the vertically aligned coefficients, as observed in the context of the matrix , can also be aggregated, denoted as Sc. These aggregates provide an approximation of the collective output generated across all industrial branches in response to a unit of final demand directed toward the specific sector corresponding to the given vertical (thus, in the matrix , coefficients on the primary diagonal exhibit values exceeding unity). The summation of the vertical coefficients within the matrix is commonly referred to as output multipliers, a term introduced by (Miller and Blair, 2009). This terminology underscores the broader economic implications of sector-specific demands on overall output.
Upon analyzing the matrix, several noteworthy observations can be made:
Cross-Sector Interactions: The coefficients in the matrix provide a quantifiable measure of the interactions between different sectors. Larger values suggest stronger interdependencies, indicating that changes in one sector can have significant ripple effects throughout the economy.
Indirect Effects: The coefficients demonstrate not only direct effects (represented by the diagonal), but also indirect effects that propagate through the economy. Sectors with higher indirect coefficients highlight their role in transmitting influence on other sectors.
Sector Contributions: Sectors with higher coefficients indicate their elevated contribution to the economy’s overall intersectoral dynamics. These sectors play a pivotal role in shaping the economic network.
Influence Amplification: The matrix coefficients demonstrate how changes in one sector can magnify their impact as they reverberate through other sectors. This amplification underscores the complex web of relationships within the economy.
Network Structure: The matrix offers a visual representation of the structure of sectoral interactions. Sectors with pronounced interdependencies can act as central nodes, connecting various parts of the economy.
Comparative Analysis: Comparing the values between rows and columns provides insight into how sectors contribute and rely on each other. Variations in coefficients highlight the differing roles of sectors in the economy’s overall functioning.
In conclusion, Table 4 provides a comprehensive portrayal of the matrix coefficients of , revealing the intricate web of intersectoral relationships within the economy. This analysis facilitates a deeper understanding of how changes and influences in one sector cascade through the economy, shaping its overall behavior and performance.
The () values resulted from matrix A do not involve the second quadrant of the input-output table. To make these values somewhat comparable to the corresponding vector (), we use the relation ()* =() +1. The two sets of values (), and ()* are shown in Table 5.
The difference between () and ()* is attributable to the way the effect of productive interdependencies within the economy is expressed. While ()* is limited to the direct ones, Sc adds to them the indirect interdependencies (mediated by the links between the related branches).
Table 5 offers a comprehensive view of the total coefficients derived from vertical and horizontal summation, revealing the interconnected relationships between sectors and their impact on the overall economy.
The “Sc” column signifies the collective influence of sectors on other sectors, depicting their role in providing intermediate goods and services. Sectors with higher “Sc” values act as significant suppliers within the economic network.
Conversely, the “Sr*” values in the horizontal summation indicate the relative importance of sectors in driving overall economic activity. Sectors with larger “Sr*” values play pivotal roles in generating output and contributing to the economy’s growth.
Comparing the “Sc” and “Sr*” values offers insights into the dual contributions of sectors – as suppliers and as drivers of economic output. The variations in “Sc” and “Sr*” values underscore the complex web of interdependencies among sectors, influencing their susceptibility to changes in demand and supply.
We can now compute an index representing the indirect influence on output, which is calculated as the ratio γ = ()/()*, as illustrated in Figure 1. In the context of the matrix, the summation of coefficients along the horizontal (sr) axis provides an estimate of the output needed by each sector to accommodate a unit increase in final demand across all sectors of the economy.
It is important to highlight that comparing these values across matrices of different sizes would not yield meaningful comparisons. To address this aggregation effect, dividing these values by the number of sectors can normalize them, resulting in values associated with a unit change in the final demand within the economy. Nonetheless, it is important to exercise caution when utilizing these values for explanatory purposes, as they are based on the simplifying assumption of uniform modifications in final demand across all sectors, which may not accurately reflect real-world dynamics.
The above presented Figure 1 displays a set of results representing different sectors, each denoted by a specific sector code, along with corresponding values labeled as “w.” These values indicate a scaling factor or coefficient associated with each sector, suggesting a certain level of influence or impact.
Several observations can be drawn from the results:
Variability in Impact: The “w” values exhibit variability across different sectors, indicating distinct levels of influence or contribution. Sectors with higher “w” values are likely to have a more pronounced impact on certain economic measures.
Magnitude of Effect: The numerical values of “w” provide insights into the extent of impact that each sector exerts. Higher values suggest a stronger influence, while lower values indicate a relatively lower impact.
Relative Importance: The values in the table allow for the comparison of sectors in terms of their contributions or significance. Sectors with larger “w” values are relatively more important within the context under consideration.
Potential Policy Implications: These results can guide policymakers and analysts in making informed decisions by identifying sectors with higher or lower impacts. Policy initiatives could be tailored to leverage sectors with higher “w” values for greater economic benefits.
Complex Determinants: The factors determining the “w” values can involve a combination of factors such as sector size, intersectoral relationships, supply chain dynamics, and demand patterns.
Consideration of Context: While the “w” values provide a quantitative measure of sectoral influence, their interpretation should consider the broader economic context, including the objectives of the analysis and the specific variables being considered.
In summary, the provided table of “w” values offers insights into the relative influence or impact of different sectors within a certain context, enabling a better understanding of sectoral dynamics and potential implications for policy and decision-making.
5. Conclusions
In conclusion, this study has delved into a comprehensive analysis of the impact of investments on global output, utilizing the Leontief matrix as a powerful analytical framework. Our investigation has shed light on the intricate dynamics that govern the relationship between investments and economic performance, highlighting the multifaceted nature of these interactions.
Through a meticulous examination of input-output tables for the Romanian economy, we have discerned the intricate web of interdependencies that connect various sectors. Our findings underscore the significance of investments as catalysts for economic growth and development, with distinct implications contingent upon the type of investment, the level of development, and external factors.
We observed that different types of investments, ranging from physical capital to research and development, play pivotal roles in shaping productivity, innovation, and efficiency. The level of development of a country introduces additional complexities, and developing economies reap substantial benefits from investments that bridge infrastructure gaps and enhance technological capabilities. Conversely, advanced economies navigate a nuanced landscape where efficiency gains, market saturation, and quality of investment allocation assume greater importance.
External factors, such as trade conflicts and global shocks, have a profound impact on investment dynamics and subsequent economic output. The intricate ripple effects of these external disruptions necessitate adaptive strategies and policy frameworks to navigate the resulting uncertainties, findings showing same evidence as (Özker, 2021).
Our exploration of the Leontief matrix has provided insight into the quantifiable interdependencies among sectors, unraveling the intricate supply chain networks and multiplier effects that underpin economic growth. The computed indices of output indirect drive further contribute to our understanding of sectoral interplay, offering a quantitative lens through which the economy’s responsiveness to changes in demand can be examined.
However, it is essential to acknowledge the limitations inherent in our analysis. The assumption of uniform modification in the final demand, though useful for illustrative purposes, may not always align with real-world scenarios. Moreover, the aggregation effect in comparing matrices of varying sizes underscores the need for a cautious interpretation.
Considering our findings, it is evident that crafting effective investment strategies demands a tailored approach that accounts for sectoral intricacies, developmental stages, and the influence of external factors. Policymakers, investors, and analysts are urged to consider these insights as they steer economic growth, striving to achieve a harmonious balance between investments and global output.
In a broader context, this study contributes to the ongoing discourse on the intricate relationships that underlie economic development. It reinforces the importance of dynamic, adaptable frameworks, such as the Leontief matrix, in comprehending the complex interplay of investments, output, and global economic performance. As the global landscape evolves, this study serves as a valuable resource for shaping strategies that foster sustainable growth, innovation, and resilience in an ever-changing economic environment.
Despite the valuable insights gained through our analysis, it is important to acknowledge several limitations that warrant consideration. First, our study assumes a simplified scenario of uniform modification in final demand across sectors, potentially oversimplifying the dynamic nature of real-world demand changes. This assumption might not capture the nuances of sector-specific responses to varying demand patterns.
Furthermore, our analysis is based on the Leontief matrix, which inherently assumes fixed coefficients and linear relationships. While this provides a useful framework, it may not fully encapsulate the complexities of modern economies characterized by dynamic interactions, nonlinearities, and feedback loops.
Additionally, the scope of our study is constrained to the Romanian economy and a specific set of input-output tables from 2021. The generalizability of our findings to other economies and time periods could be subject to limitations based on variations in economic structure, development stages, and external factors.
Future research endeavors could build upon this study to address these limitations and explore uncharted territories. Investigating non-linear relationships and incorporating time-dependent factors could enhance the accuracy of predictive models. Moreover, expanding the study to encompass international trade dynamics and global supply chains could yield a more holistic understanding of how investments impact global output.
Exploring the role of technological advancements and digital transformations in investment-induced output changes could offer insights into the evolving nature of economic growth. Advanced econometric techniques and machine learning methodologies could be harnessed to analyze intricate interdependencies with greater precision.
Moreover, expanding the research to encompass a broader range of economic indicators, such as employment, inequality, and environmental sustainability, could provide a more comprehensive evaluation of the multifaceted effects of investments on the economy.
In conclusion, while our study has enriched our understanding of the impact of investments on global output, it lays the groundwork for future investigations to address the limitations outlined and delve deeper into the complexities of economic interactions. By embracing a multidimensional approach and accounting for evolving economic landscapes, future research endeavors can contribute to a more nuanced comprehension of investment dynamics and their profound implications for sustainable economic growth and development.
6. Acknowledgements
This work was supported by a grant from the Romanian Ministry of Education and Research, CNCS-UEFISCDI, project number PN-III-P4-ID-PCE-2020-0557, within PNCDI III, contract number 112/2021.
Author Contributions
Conceptualization, M.B., M.V.V. and S.A.; methodology, M.B.; software, M.B.; validation, M.B., M.V.V and S.A.; formal analysis, M.B.; investigation, V.M.M..; resources, S.A.; data curation, V.M.M.; writing—original draft preparation, M.B.; writing—review and editing, M.V.V.; visualization, S.A.; supervision, V.M.M. and S.A.; project administration, S.A. All authors have read and agreed to the published version of the manuscript.” Please turn to the CRediT taxonomy for the term explanation. Authorship must be limited to those who have contributed substantially to the work reported.
Funding
This research was funded by a grant of the Romanian Ministry of Education and Research, CNCS-UEFISCDI, project number PN-III-P4-ID-PCE-2020-0557, within PNCDI III, contract number 112/2021.
Acknowledgments
In this section, you can acknowledge any support given which is not covered by the author contribution or funding sections. This may include administrative and technical support, or donations in kind (e.g., materials used for experiments).
Conflicts of Interest
The authors declare no conflict of interest.
References
- (Acemoglu et al. 2012) Acemoglu, Daron, Ufuk Akcigit, Douglas Hanley, and William Kerr. 2012. “Transition to Clean Technology.” Journal of Political Economy 120(1): 56–93. [CrossRef]
- (Barro and Sala-i-Martin 2004) Barro, Robert J., and Xavier Sala-i-Martin. 2004. “Economic Growth.” In Economic Growth, 2nd ed. Boston: The MIT Press.
- (Blanchard and Summers 1986) Blanchard, Olivier J., and Lawrence H. Summers. 1986. “Hysteresis and the European Unemployment Problem.” NBER Macroeconomics Annual 1: 15–90. [CrossRef]
- (Bown 2019) Bown, Chad P. 2019. “Trade War: The Clash of Economic Systems Threatening Global Peace.” The World Economy 42(10): 2919–2958.
- (Brown and Lee 2019) Brown, R., & Lee, E. (2019). Impact of Financial Market Regulations on Investment Behavior: Evidence from Emerging Markets. Journal of Risk and Financial Management, 12(1), 15.
- (Brynjolfsson and McAfee 2014) Brynjolfsson, Erik, and Andrew McAfee. 2014. “The Second Machine Age: Work, Progress, and Prosperity in a Time of Brilliant Technologies.” New York: W. W. Norton & Company.
- (Calvo and Izquierdo 2004) Calvo, Guillermo A., and Alejandro Izquierdo. 2004. “On the Empirics of Sudden Stops: The Relevance of Balance-Sheet Effects.” NBER Working Paper No. 10520. [CrossRef]
- (Chen et al. 2020) Chen, X., Li, J., & Wang, T. (2020). Behavioral Biases and Investment Choices: Evidence from the Stock Market. Journal of Risk and Financial Management, 13(6), 130.
- (Dietzenbacher and Lahr 2007) Dietzenbacher, Erik, and Michael L. Lahr. 2007. “Issues in Regional Impact Analysis.” The Annals of Regional Science 41(1): 1–7.
- (Dobrescu 2009) Dobrescu, Emilian. 2009. “Measuring the Interaction of Structural Changes with Inflation.” Romanian Journal of Economic Forecasting 10: 5-99, Supplement 2009.
- (Dobrescu and Pelinescu 2007) Dobrescu, Emilian, and Elena Pelinescu. 2007. “Comparative Analyses of Economic Structures in Romania and EU.” Romanian Journal of Economic Forecasting 1: 44–61.
- (Fagerberg 2004) Fagerberg, Jan. 2004. “Innovation: A Guide to the Literature.” In Handbook of Innovation, edited by Jan Fagerberg, David C. Mowery, and Richard R. Nelson, 1–26. Oxford: Oxford University Press.
- (Goldstein and Pevehouse 2018) Goldstein, Judith L., and Jon C. Pevehouse. 2018. International Relations, 11th ed. New York: Pearson.
- (Hall and Lerner 2010) Hall, Bronwyn H., and Josh Lerner. 2010. “The Financing of R&D and Innovation.” In Handbook of the Economics of Innovation, vol. 1, edited by Bronwyn H. Hall and Nathan Rosenberg, 609–639. Amsterdam: North-Holland.
- (Hanson and Robertson 2020) Hanson, Gordon H., and Raymond J. Robertson. 2020. “Understanding Regional Disparities in China.” Journal of Economic Perspectives 34(1): 45–66.
- (Jorgenson and Vu 2007) Jorgenson, Dale W., and Khuong Vu. 2007. “Information Technology and the World Growth Resurgence.” German Economic Review 8(2): 125–145. [CrossRef]
- (Kahneman and Tversky 1979) Kahneman, Daniel, and Amos Tversky. 1979. “Prospect Theory: An Analysis of Decision under Risk.” Econometrica 47(2): 263–291. [CrossRef]
- (Leontief 1936) Leontief, Wassily. 1936. “Quantitative Input and Output Relations in the Economic Systems of the United States.” The Review of Economic Statistics 18(3): 105–125. [CrossRef]
- (Li and Wang 2019) Li, Y., & Wang, Q. (2019). Environmental, Social, and Governance Factors and Investment Performance: Evidence from China. Sustainability, 11(21), 6161.
- (Llop and Manresa 2010) Llop, Maria, and Antonio Manresa. 2010. “The Effects of the Introduction of New Goods on Economic Growth.” Journal of Industry, Competition and Trade 10(1–2): 87–101.
- (Mankiw et al. 1992) Mankiw, N. Gregory, David Romer, and David N. Weil. 1992. “A Contribution to the Empirics of Economic Growth.” The Quarterly Journal of Economics 107(2): 407–437.
- (Mihaescu and Andrei 2015) Mihaescu, Liviu, and Tudorel Andrei. 2015. “Inter-Industry Relations in Romania.” Procedia Economics and Finance 22: 294–300.
- (Miller and Blair 2009) Miller, R. E., & Blair, P. D. 2009. Input-Output Analysis: Foundations and Extensions. Cambridge University Press.
- (Nakamura et al. 2021) Nakamura, Leonard I., Ellis W. Tallman, and Jon R. Moen. 2021. “New Data on Global Output and Prices: Implications for Macroeconomic Modeling and Policy Analysis.” Journal of Money, Credit and Banking 53(2-3): 463–494.
- (Obstfeld and Rogoff 2009) Obstfeld, Maurice, and Kenneth S. Rogoff. 2009. This Time Is Different: Eight Centuries of Financial Folly. Princeton, NJ: Princeton University Press.
- (Özker 2021) Özker, A. 2021. “Changes in Investment Options in OECD Countries and Its Relationship with Analytical Tax Burden.” Universal Journal of Accounting and Finance 3(9): 295-305. doi: 10.13189/ujaf.2021.090303.
- (Porter 1990) Porter, Michael E. 1990. The Competitive Advantage of Nations. New York: Free Press.
- (Roland and Verdier 2018) Roland, Gérard, and Thierry Verdier. 2018. “Transition and Economics: Politics, Markets, and Firms.” Journal of the European Economic Association 16(1): 189–237.
- (Sachs et al. 2019) Sachs, Jeffrey D., Guido Schmidt-Traub, and Mariana Mazzucato. 2019. “Achieving the Sustainable Development Goals: The Role of Impact Investing.” Innovations: Technology, Governance, Globalization 14(3): 34–58.
- (Smith and Johnson 2018) Smith, A., & Johnson, L. (2018). Risk Assessment in Investment Decision-Making: A Study in the Financial Industry. Journal of Risk and Financial Management, 11(4), 85.
- (Zhang and Wu 2021) Zhang, Y., & Wu, J. (2021). Sustainable Investment and Its Impact on Economic Growth: Evidence from Global Data. Sustainability, 13(7), 3619.
Figure 1.
The values of w, by sector; Source: own computations.
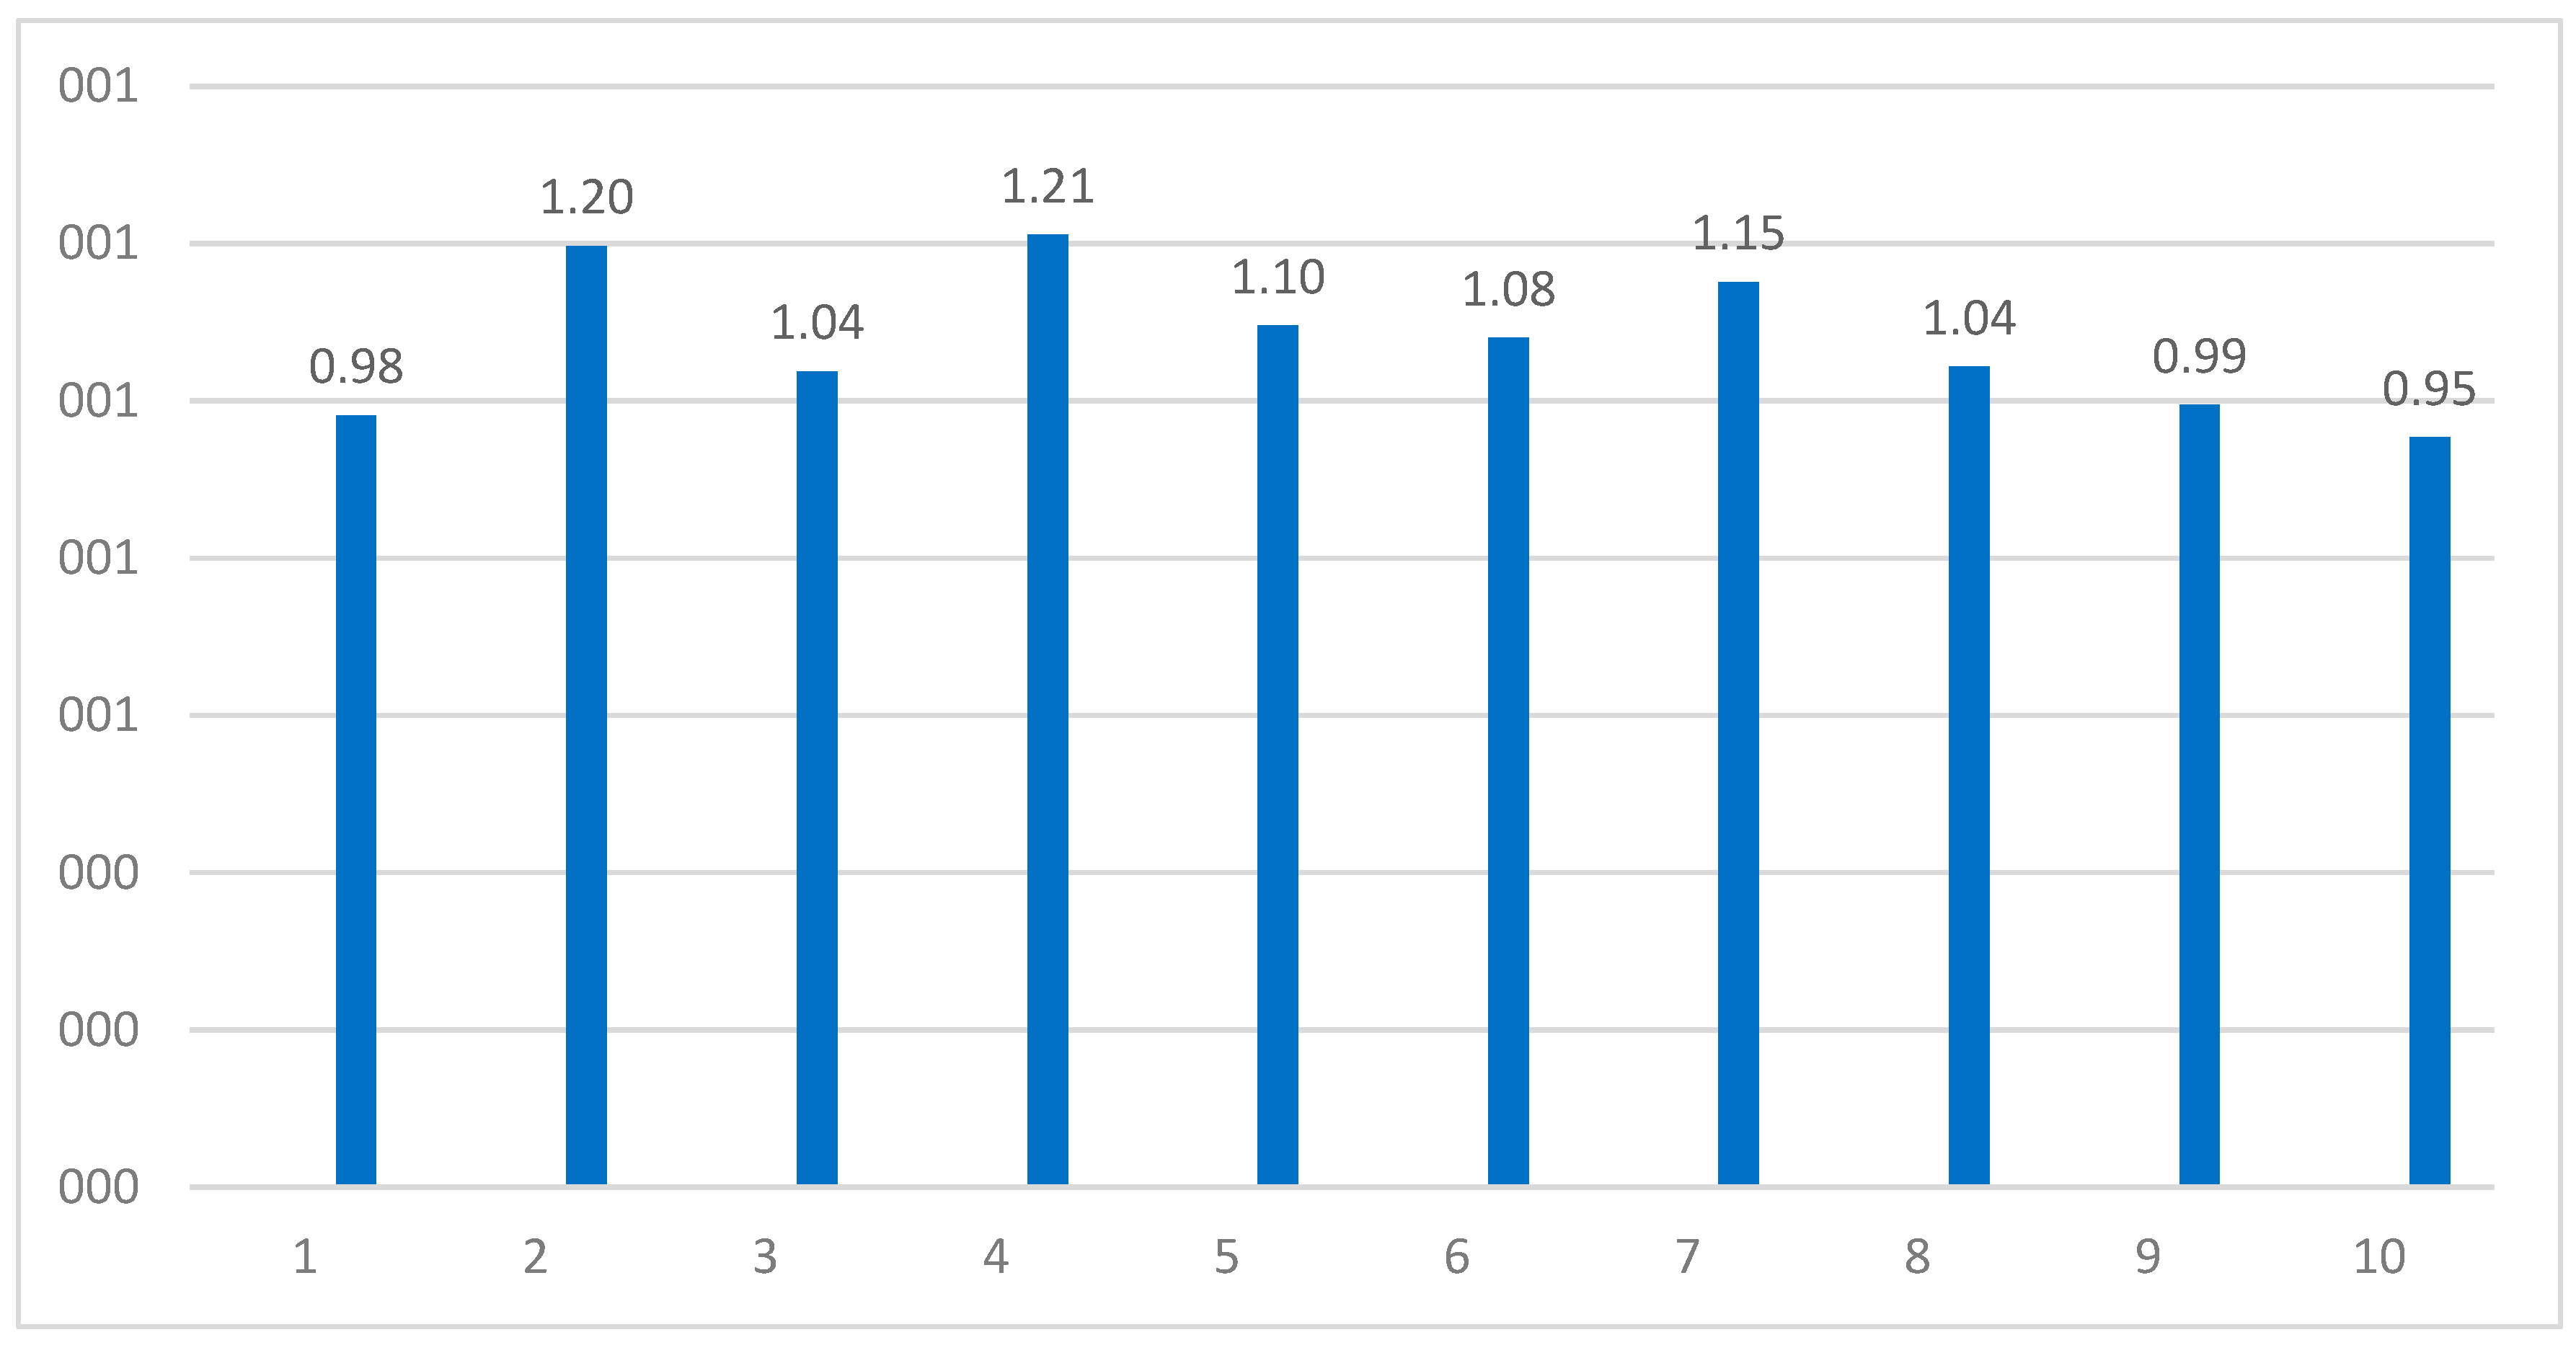

Table 1.
Aggregated Sectoral Structure of the Economy.
| Sector code | Sector name | Branch codes included in the sector |
|---|---|---|
| 1 | Agriculture, forestry, hunting and fishing | 1, 2, 3, …, 6 |
| 2 | Mining and quarrying | 7, 9, 11, 12, …., 17 |
| 3 | Production and distribution of electric and thermal power | 79, 80, 81, 82 |
| 4 | Food, beverages, and tobacco | 18, 19, 20, 21, …., 27 |
| 5 | Textiles, leather, pulp and paper, furniture | 28, 29, 30, …, 33, 77 |
| 6 | Machinery and equipment, transport means, other metal products | 60, 61,…65, 67, 68,…76 |
| 7 | Other manufacturing industries | 8, 34, 35,59, 78 |
| 8 | Constructions | 83 |
| 9 | Transports, post, and telecommunications | 87,…95 |
| 10 | Trade, business, and public services | 84, .., 86, 96,…105 |
Source: own computations
Table 2.
The input-output matrix A
| Sector code | 1 | 2 | 3 | 4 | 5 | 6 | 7 | 8 | 9 | 10 |
|---|---|---|---|---|---|---|---|---|---|---|
| 1 | 0.544 | 0.113 | 0.111 | 0.32 | 0.169 | 0.111 | 0.112 | 0.112 | 0.111 | 0.12 |
| 2 | 0.111 | 0.413 | 0.35 | 0.112 | 0.111 | 0.12 | 0.198 | 0.118 | 0.111 | 0.117 |
| 3 | 0.128 | 0.198 | 0.319 | 0.155 | 0.145 | 0.147 | 0.184 | 0.126 | 0.145 | 0.145 |
| 4 | 0.153 | 0.112 | 0.114 | 0.469 | 0.123 | 0.114 | 0.118 | 0.114 | 0.118 | 0.206 |
| 5 | 0.123 | 0.117 | 0.113 | 0.146 | 0.353 | 0.128 | 0.136 | 0.149 | 0.119 | 0.174 |
| 6 | 0.164 | 0.186 | 0.134 | 0.135 | 0.145 | 0.353 | 0.157 | 0.158 | 0.197 | 0.17 |
| 7 | 0.235 | 0.202 | 0.381 | 0.177 | 0.209 | 0.3 | 0.521 | 0.27 | 0.188 | 0.242 |
| 8 | 0.117 | 0.117 | 0.115 | 0.115 | 0.116 | 0.114 | 0.114 | 0.264 | 0.117 | 0.127 |
| 9 | 0.121 | 0.142 | 0.118 | 0.136 | 0.136 | 0.136 | 0.134 | 0.117 | 0.188 | 0.15 |
| 10 | 0.144 | 0.18 | 0.152 | 0.175 | 0.202 | 0.179 | 0.166 | 0.235 | 0.263 | 0.31 |
Source: own computations
Table 3.
Total sum of coefficients by vertical and horizontal addition.
| Sector code | Sr | Sc |
|---|---|---|
| 1 | 1.823 | 1.84 |
| 2 | 1.761 | 1.78 |
| 3 | 1.692 | 1.907 |
| 4 | 1.641 | 1.94 |
| 5 | 1.558 | 1.709 |
| 6 | 1.799 | 1.702 |
| 7 | 2.725 | 1.84 |
| 8 | 1.316 | 1.663 |
| 9 | 1.378 | 1.557 |
| 10 | 2.006 | 1.761 |
Source: own computations.
Table 4.
The matrix coefficients of
| Sector code | 1 | 2 | 3 | 4 | 5 | 6 | 7 | 8 | 9 | 10 |
|---|---|---|---|---|---|---|---|---|---|---|
| 1 | 1.371 | 0.379 | 0.451 | 0.099 | 0.204 | 0.344 | 0.409 | 0.316 | 0.278 | 0.290 |
| 2 | 0.405 | 1.111 | 0.047 | 0.461 | 0.327 | 0.283 | 0.178 | 0.290 | 0.271 | 0.337 |
| 3 | 0.323 | 0.163 | 0.951 | 0.326 | 0.239 | 0.221 | 0.199 | 0.244 | 0.196 | 0.253 |
| 4 | 0.224 | 0.292 | 0.345 | 1.214 | 0.232 | 0.260 | 0.308 | 0.236 | 0.195 | 0.115 |
| 5 | 0.263 | 0.247 | 0.294 | 0.256 | 1.087 | 0.203 | 0.235 | 0.155 | 0.175 | 0.151 |
| 6 | 0.274 | 0.204 | 0.320 | 0.366 | 0.252 | 1.014 | 0.274 | 0.218 | 0.139 | 0.238 |
| 7 | 0.505 | 0.482 | 0.281 | 0.694 | 0.454 | 0.285 | 0.927 | 0.327 | 0.397 | 0.441 |
| 8 | 0.192 | 0.171 | 0.205 | 0.222 | 0.157 | 0.160 | 0.192 | 1.026 | 0.128 | 0.157 |
| 9 | 0.220 | 0.163 | 0.222 | 0.227 | 0.158 | 0.155 | 0.189 | 0.169 | 0.928 | 0.154 |
| 10 | 0.366 | 0.261 | 0.351 | 0.362 | 0.209 | 0.239 | 0.308 | 0.151 | 0.094 | 0.892 |
Source: own computations
Table 5.
Total sum of coefficients by vertical and horizontal addition.
| Sector code | Sc | Sr* |
|---|---|---|
| 1 | 2.771 | 2.823 |
| 2 | 3.304 | 2.761 |
| 3 | 2.792 | 2.692 |
| 4 | 3.198 | 2.641 |
| 5 | 2.802 | 2.558 |
| 6 | 3.023 | 2.799 |
| 7 | 4.288 | 3.725 |
| 8 | 2.416 | 2.316 |
| 9 | 2.365 | 2.378 |
| 10 | 2.866 | 3.006 |
Source: own computations
Disclaimer/Publisher’s Note: The statements, opinions and data contained in all publications are solely those of the individual author(s) and contributor(s) and not of MDPI and/or the editor(s). MDPI and/or the editor(s) disclaim responsibility for any injury to people or property resulting from any ideas, methods, instructions or products referred to in the content. |
© 2023 by the authors. Licensee MDPI, Basel, Switzerland. This article is an open access article distributed under the terms and conditions of the Creative Commons Attribution (CC BY) license (https://creativecommons.org/licenses/by/4.0/).
Copyright: This open access article is published under a Creative Commons CC BY 4.0 license, which permit the free download, distribution, and reuse, provided that the author and preprint are cited in any reuse.


