Preprint
Article

This version is not peer-reviewed.

Evaluating the Position of Côte d'Ivoire's Cocoa Industry on the Global Production Chain and the Influencing Factors

A peer-reviewed article of this preprint also exists.

Submitted:

03 December 2024

Posted:

04 December 2024

You are already at the latest version

Abstract

This research explores the dynamics of Côte d’Ivoire’s cocoa industry within the global production chain from 1960 to 2024. Employing a Vector Error Correction Model (VECM), it examines the impact of key economic and environmental factors, including gross cocoa production, cocoa bean prices, GDP, domestic cocoa grindings, rainfall, and temperature, on cocoa bean exports. By unraveling short- and long-term relationships, the study highlights how economic variables propel exports while climatic factors exacerbate production vulnerabilities. Incorporating rigorous econometric methods and extending a comparative analysis with Ghana enriches the understanding of regional dynamics, emphasizing the interplay between macroeconomic stability and agricultural sustainability. The findings propose actionable strategies to enhance global competitiveness, such as promoting value addition through domestic cocoa grindings and adopting climate-resilient farming practices. This study uniquely integrates climatic and economic variables using advanced econometric techniques, offering novel insights into the dynamics of Côte d’Ivoire’s cocoa industry and its global competitiveness.

Keywords: 
;  ;  ;  ;  

1. Introduction

Côte d’Ivoire is the world’s largest cocoa producer, contributing over 40% of global cocoa supplies and supporting a significant portion of the country's economy [1] (Kalischek et al., 2023). Despite this global prominence, Côte d’Ivoire captures minimal economic value from its cocoa exports due to the dominance of industrialized nations in higher-value stages of the cocoa value chain, such as processing and manufacturing. Value addition typically occurs outside the producing regions, highlighting a structural imbalance that limits economic benefits for local stakeholders. The cocoa sector faces compounding challenges, including volatile global prices and vulnerability to climate change. Irregular rainfall, rising temperatures, and extreme weather events have increasingly disrupted production cycles, threatening long-term sustainability. Moreover, domestic processing capacities remain underutilized, limiting the potential for economic diversification and resilience. Cocoa contributes approximately 15% of Côte d’Ivoire’s GDP and 7% of Ghana’s GDP GDP [2], making it a cornerstone of economic activity in both nations (Diomande et al., 2023), and cocoa exports make up about 70% of the country’s total export revenues, solidifying its position as a critical driver of foreign exchange earnings. However, despite its global dominance in cocoa production, Côte d’Ivoire captures only a fraction of the total value generated by the global cocoa [3] industry (Abaidoo & Agyapong, 2023). The global cocoa value chain is structured in a way that positions cocoa-producing countries such as Côte d’Ivoire at the lower end, primarily as suppliers of raw materials. The bulk of value addition, including processing, manufacturing, and distribution of chocolate products, occurs in industrialized nations where significant profits are realized, leaving Côte d’Ivoire dependent on raw cocoa exports and vulnerable to global market fluctuations [4] (Daya et al., 2023). Environmental challenges further compound these vulnerabilities. Cocoa farming contributes to deforestation and environmental degradation, particularly in forested regions cleared for agricultural use, leading to biodiversity loss and ecosystem disruption. The impacts of climate change, including irregular rainfall patterns, rising temperatures, and unpredictable weather, pose additional threats to productivity, as rainfall declined to 1,897.50 mm in 2024 and average temperatures [5] increased to 29.8°C (World Bank, 2021). These climate-related stresses reduce yields and expose farmers to greater risks, necessitating the adoption of climate-smart agricultural practices. Socio-economic issues, including widespread poverty among cocoa farmers and the persistence of child labor, further undermine the sector’s sustainability. Despite international efforts through certification schemes and sustainability programs, progress in addressing these social issues has been slow, limiting the industry’s potential for inclusive economic development [6] (Kadio, 2023). The COVID-19 pandemic exacerbated these vulnerabilities by disrupting global supply chains, causing cocoa prices to fluctuate to 5.56 USD/kg in 2024 while temporarily reducing demand for luxury products [7] (IFPRI, 2024). The pandemic’s broader impact on Côte d’Ivoire’s secondary [
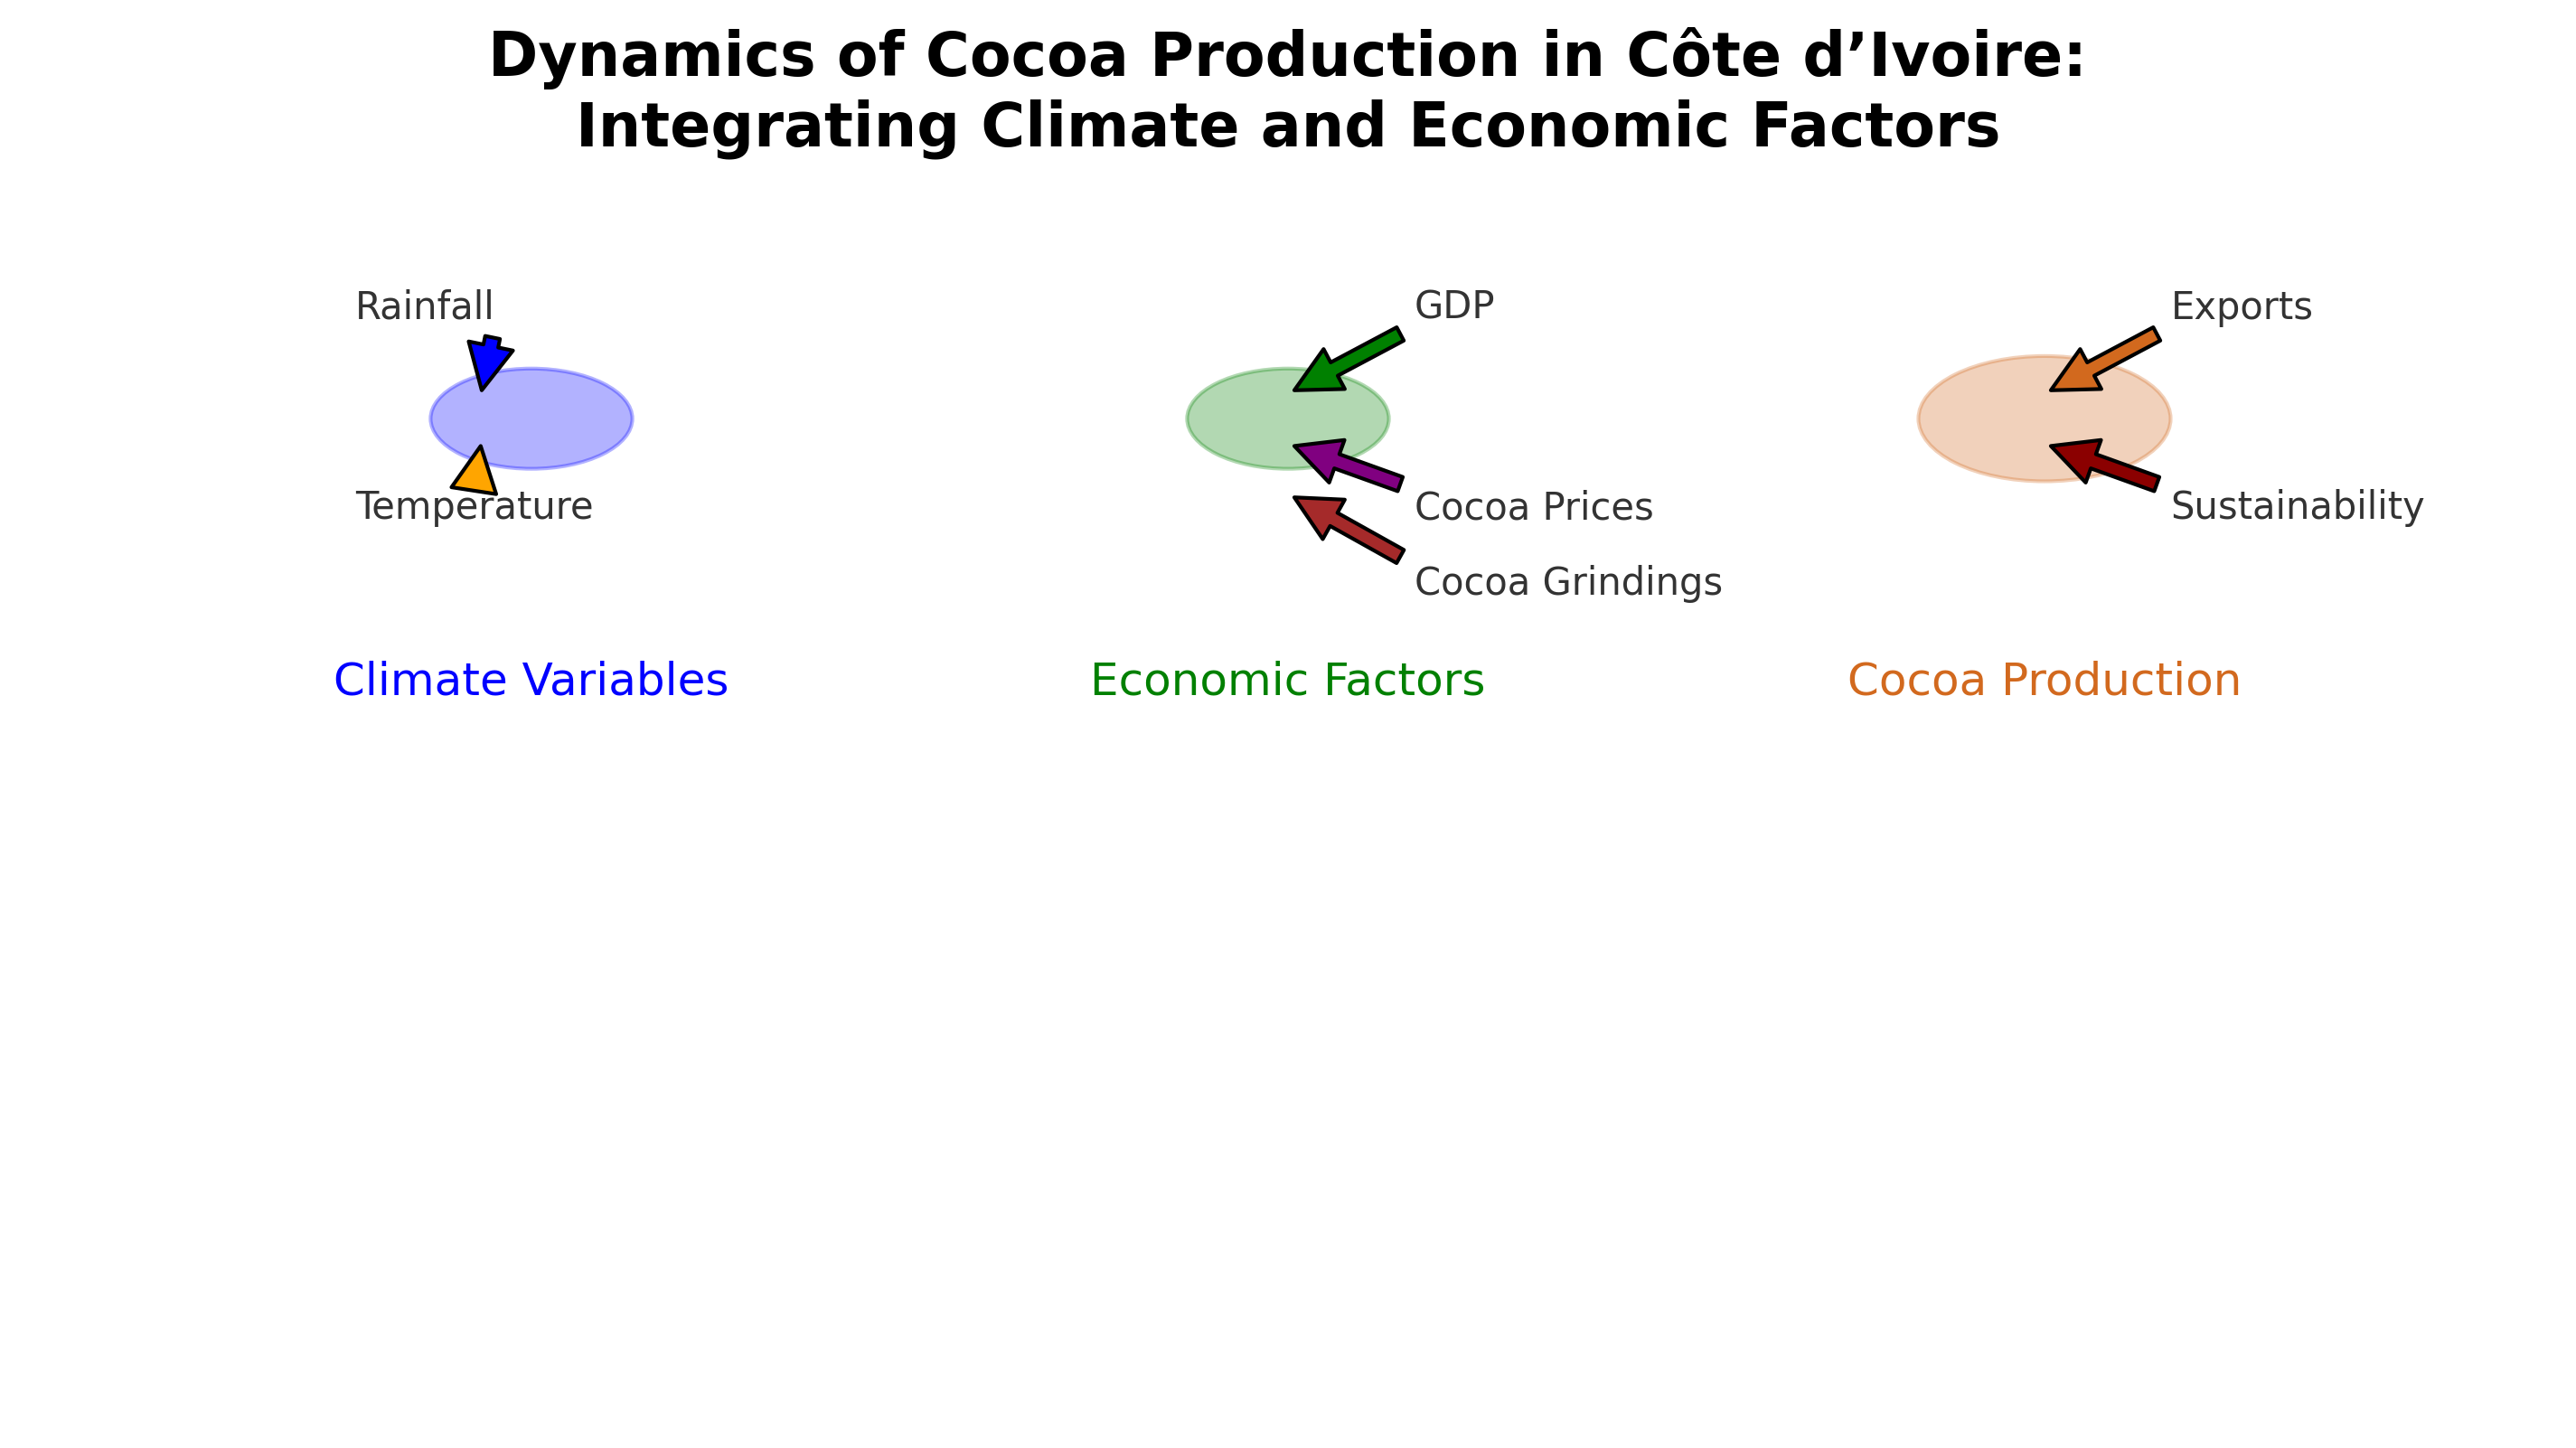
8] economic sectors, such as transportation and logistics, also reverberated through the cocoa value chain (Dago & Pei, 2024). These challenges underscore the critical need for strategies that enhance both the economic resilience of cocoa farmers and the country’s competitiveness in the global market. Existing studies have explored the global cocoa value chain and environmental challenges but often fail to integrate local processing capabilities, sustainability practices, and external trade policies to improve value capture and resilience in producing countries. This research fills a critical gap by uniquely integrating climatic variables with macroeconomic factors to model the cocoa industry's performance, thereby offering actionable insights for enhancing sustainability and value addition. This paper integrates climatic and economic variables using advanced econometric modeling, providing novel insights into Côte d’Ivoire’s cocoa industry and a regional comparison with Ghana, including the Vector Error Correction Model (VECM), to explore the short- and long-term dynamics of key variables, such as global cocoa prices, domestic cocoa grindings, rainfall, and temperature, and export performance. The objectives of this study are to evaluate Côte d’Ivoire’s position in the global cocoa value chain, assess the impact of international cocoa prices on domestic production and exports, analyze the role of local cocoa processing in improving value capture, and investigate the effects of climate factors such as rainfall and temperature on production and exports. The research questions address key issues, such as Côte d’Ivoire’s position in the global cocoa value chain, the influence of global cocoa price fluctuations on domestic production and exports, the impact of domestic processing and GDP contributions on export performance, and the effects of climate factors on cocoa productivity. The study also explores hypotheses related to the relationships between global prices, domestic processing, climate factors, and cocoa production and exports. The significance of this study lies in its potential to provide actionable insights for policymakers, industry leaders, and international organizations to enhance the sustainability and competitiveness of Côte d’Ivoire’s cocoa industry. The findings are expected to inform decisions on environmental policies, economic resilience strategies, and social equity measures. The study is structured as follows: Section 2 reviews the literature and presents the theoretical framework for analyzing the cocoa industry. Section 3 details the research methodology. Section 4 presents the results and discussion, while Section 5 concludes with a summary of findings and recommendations for strengthening the industry’s future performance.

2. Literature Review

The global cocoa industry has been widely studied, particularly in terms of its economic importance, environmental sustainability challenges, and the role of global value chains. Recent studies highlight the role of blockchain in cocoa value chains and climate-smart techniques addressing yield variability [9,10] (Gómez-Briones et Carla., 2019; Akpoti et al., 2023). However, it is important to note that the majority of value addition, including processing and manufacturing, occurs in industrialized nations, which consequently limits the economic returns for producing countries such as Côte d’Ivoire. This dynamic is not exclusive to cocoa but extends across various commodity value chains, where producer countries are relegated to the lower end of the global value [11,12,13,14] chain due to structural inefficiencies, restrictive trade policies, and limited technological capacities (Odijie, 2021; Prazeres et al., 2021; Staritz et al., 2022).
For example, Indonesia faces parallel issues where high tax burdens significantly impede the competitiveness [15] of processed cocoa products in global markets (Murwendah & Desyani, 2023). This highlights how governmental and regulatory factors constrain value addition processes, thus affecting the global [16] positioning of producer countries (Pietrobelli et al., 2021). Moreover, compounding these economic barriers are climate-related risks and inadequate infrastructure, which collectively hinder sustainable growth [17], technological advancements, and domestic cocoa grindings in Côte d’Ivoire (Houphouet et al., 2023).
To address these challenges, recent advancements in circular economy practices present promising opportunities. For instance, innovative technologies developed by organizations such as Nextcoa focus on repurposing cocoa waste into valuable products, such as biopolymers and functional food ingredients, thereby contributing to a more circular economy [18,19,20] (Pedraza-Avella et al., 2023; Girón-Hernández et al., 2024; Cydzik-Kwiatkowska, 2021). These innovations, while promising, face barriers in Côte d’Ivoire due to financial and infrastructural limitations, which prevent the widespread adoption of such practices [21] (Dziuba et al., 2021). Furthermore, digitalization and traceability within global value chains emerge as significant enablers for the cocoa industry, as evidenced by blockchain technology's potential to improve transparency, ensure compliance with international sustainability standards, and enhance market access to premium sectors [22,23] (Zheng et al., 2023; Cao et al., 2023). Yet, the adoption of these digital innovations remains limited in Côte d’Ivoire, necessitating stronger governance frameworks to unlock their transformative potential and align with global standards.
Simultaneously, environmental sustainability remains a critical challenge, particularly in cocoa-producing regions of West Africa. Unsustainable farming practices have led to deforestation, biodiversity loss, and soil degradation, with these impacts exacerbated by climate change. Research underscores that deforestation linked to cocoa farming has disrupted local precipitation patterns, further reducing cocoa bean production [24,25] (Schneider et al., 2023; Renier et al., 2022). However, agroforestry, which integrates trees into cocoa farming systems, emerges as a viable solution to mitigate these environmental challenges [26] (Moraiti et al., 2024). Agroforestry systems enhance biodiversity, improve soil fertility, and sequester carbon, thereby offering economic and ecological benefits [27,28] (Dahliana et al., 2024; Salamanca et al., 2022). Nevertheless, the adoption of agroforestry in Côte d’Ivoire remains limited due to insecure land tenure, inadequate technical support, and insufficient financial incentives, which contrasts sharply with Ghana’s success in scaling such practices through policy and institutional support. Thus, addressing these gaps requires an integrated approach that includes land reforms, capacity-building programs, and financial assistance to farmers, aiming for both environmental [29,30] sustainability and enhanced contributions to Gross Domestic Product degradation (Donkor et al., 2023; Olagunju et al., 2023).
In addition to environmental [31] concerns, socio-economic challenges compound the difficulties faced by Côte d’Ivoire’s cocoa farmers (Kadiravan et al., 2023). Despite the sector's economic significance, smallholder farmers continue to struggle with income instability due to fluctuating global cocoa prices, limited access to financial services, and weak bargaining power [32,33] (Boysen et al., 2023; Cui et al., 2023). Furthermore, Côte d’Ivoire’s reliance on cocoa bean exports exacerbates these vulnerabilities, as raw commodity exports yield limited economic value compared to processed cocoa products. Addressing these issues, initiatives such as the Income Accelerator Program have shown potential in closing income gaps and reducing child labor risks, although their scalability remains constrained by systemic governance challenges [34] (Nestle, 2023).
Furthermore, child labor remains a persistent issue in the cocoa sector, driven by extreme poverty and limited access to education. While programs such as the Harkin-Engel Protocol aim to eliminate child labor, enforcement challenges and entrenched cultural norms continue to hinder their effectiveness [35] (Busquet et al., 2021). Consequently, effective solutions must integrate robust labor laws, improved education access, and direct financial support for vulnerable households to break the cycle of poverty and child labor.
Beyond these socio-economic and environmental factors, climate change poses a significant and escalating threat to cocoa production. Rising temperatures, unpredictable rainfall, and extreme weather events not only disrupt farming systems but also exacerbate existing vulnerabilities such as low yields and inadequate infrastructure. Studies indicate that climate-induced disruptions to water supplies, a critical resource for agriculture, further jeopardize cocoa farming [36,37] (Bamba et al., 2023; Tran & Cook, 2023). In response, innovative strategies such as crop diversification, precision agriculture, and agroforestry have been adopted in various cocoa-producing countries, including Ghana, where these approaches have enhanced resilience and productivity [38,39] (Zhafran et al., 2022; Yiridomoh et al., 2022). Nonetheless, the implementation of such adaptive strategies in Côte d’Ivoire is constrained by resource limitations and a lack of technical expertise, highlighting the need for targeted investments and training programs to build adaptive capacity while safeguarding cocoa bean production.
Meanwhile, the cocoa industry has also been significantly affected by external shocks, including the COVID-19 pandemic. The pandemic exacerbated existing vulnerabilities within cocoa supply chains, leading to production declines, delayed shipments, and income losses for farmers in West Africa [40,41] (Basith et al., 2023; Merino-Gaibor et al., 2023). Moreover, geopolitical tensions and climate-induced disasters continue to pose ongoing risks to the sector, emphasizing the need for resilience-building measures [42] (Aniekan Ukpe, 2024). Digital technologies, such as blockchain, offer a pathway to strengthen supply chain resilience by enhancing transparency and traceability, as evidenced by their application in Ghana's cocoa sector [43] (Lu et al., 2023). However, Côte d’Ivoire must prioritize reducing infrastructural barriers and incentivizing technology adoption to realize similar benefits.
Finally, governance and policy interventions play a crucial role in shaping the sustainability and competitiveness of Côte d’Ivoire's cocoa sector. Effective governance ensures compliance with environmental and labor standards while promoting equitable growth across the value chain. Trade policy reforms, including reduced tariff escalation and incentives for processed cocoa exports, are essential to enhance Côte d’Ivoire's positioning within the global cocoa market. Moreover, institutions such as the Conseil du Café-Cacao must spearhead efforts to integrate digital innovations and foster public-private partnerships to achieve systemic improvements.
This study builds on existing literature by examining how economic, environmental, and social factors collectively influence Côte d’Ivoire’s cocoa industry. Through a comparative analysis with Ghana and the application of advanced econometric models, this research identifies actionable strategies to address systemic challenges, enhance sustainability, and bolster competitiveness. Leveraging insights from both countries, the study provides practical recommendations to position Côte d’Ivoire as a global leader in sustainable and value-added cocoa production.

2.1. Theoretical Framework and Hypotheses

Theoretical frameworks are essential for understanding the dynamic interactions between economic and environmental variables influencing Côte d’Ivoire’s cocoa industry within the global production chain. The analysis is grounded in the export-led growth hypothesis, which posits that increased exports drive economic development by generating foreign exchange, employment, and technological advancement. This hypothesis aligns with the central role of cocoa exports in both countries' economies. These frameworks highlight the interconnectedness between domestic production factors, external market forces, and climatic conditions, shaping the industry’s export performance. Cocoa exports [
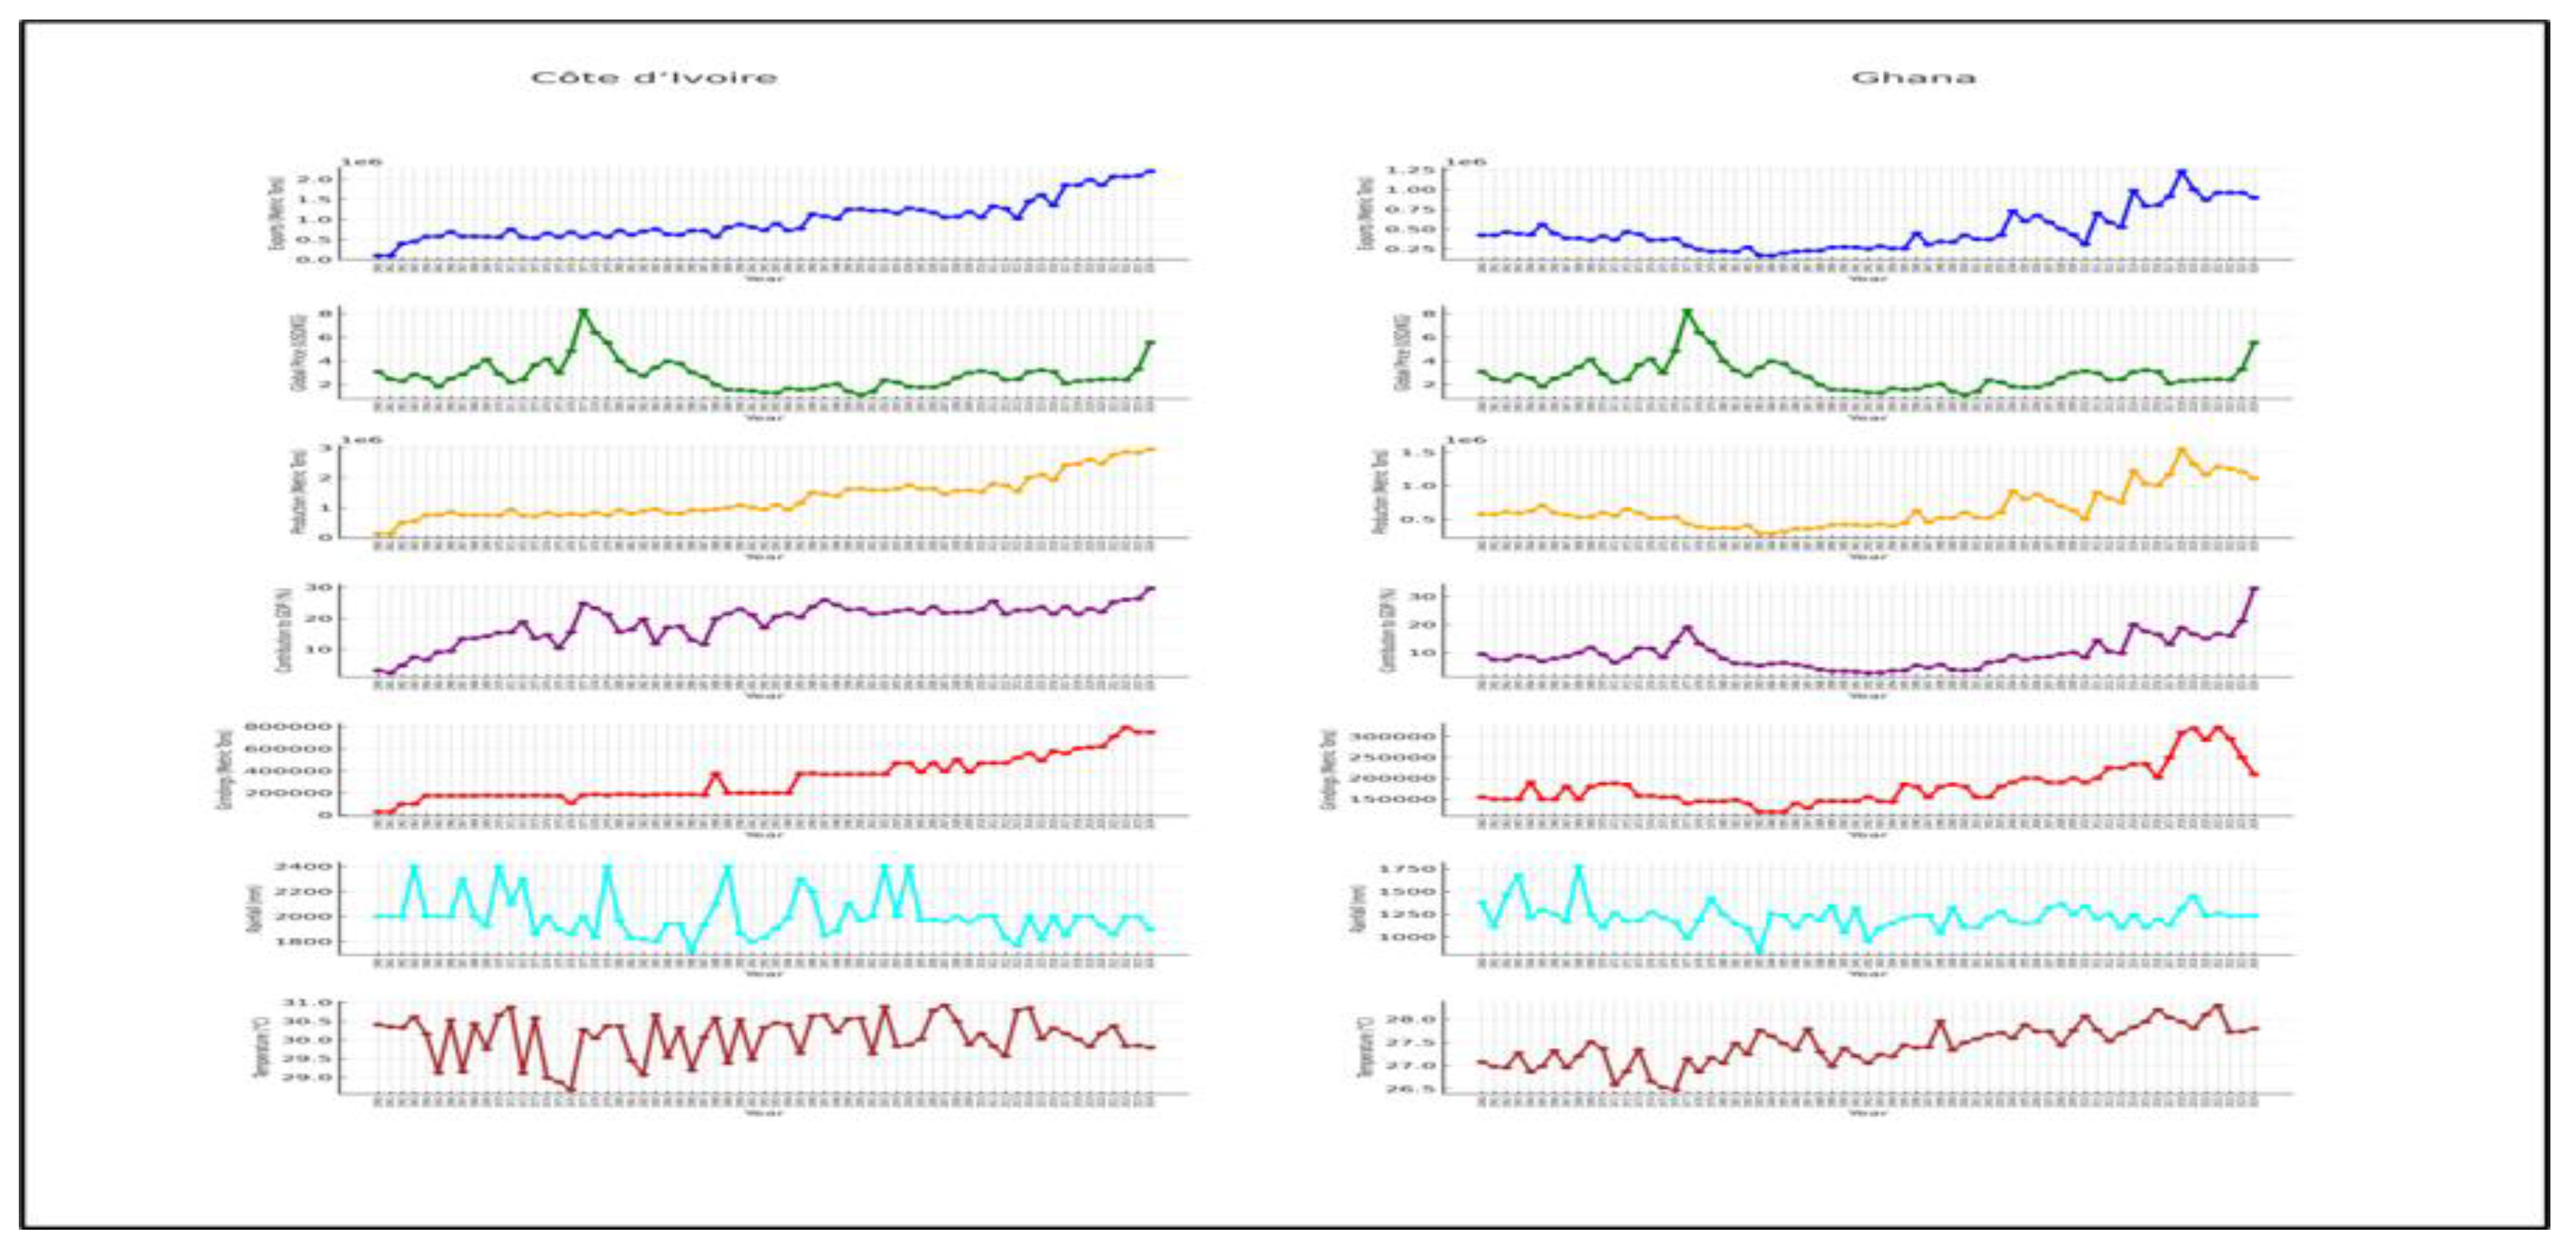
44,45]increased to 1.68 million metric tons by 2021, with projections reaching 2.2 million metric tons by 2024 (Statista, 2024; ICCO, 2024). Gross cocoa production [46] also grew from 1.591 million metric tons in 2001 to a forecasted 2.95 million metric tons by 2024 (FAO, 2022). This study focuses on the factors influencing cocoa exports, including production, cocoa prices, GDP, domestic grindings, rainfall, and temperature, and their combined impact on the sector's performance. Unlike previous studies that broadly examine agricultural economics or climate change, this research delves into sector-specific dynamics and value chain mechanisms, providing insights into sustainability and competitiveness. Value chain improvements, such as certification schemes and sustainable farming practices, have been shown to enhance sector performance and resilience [
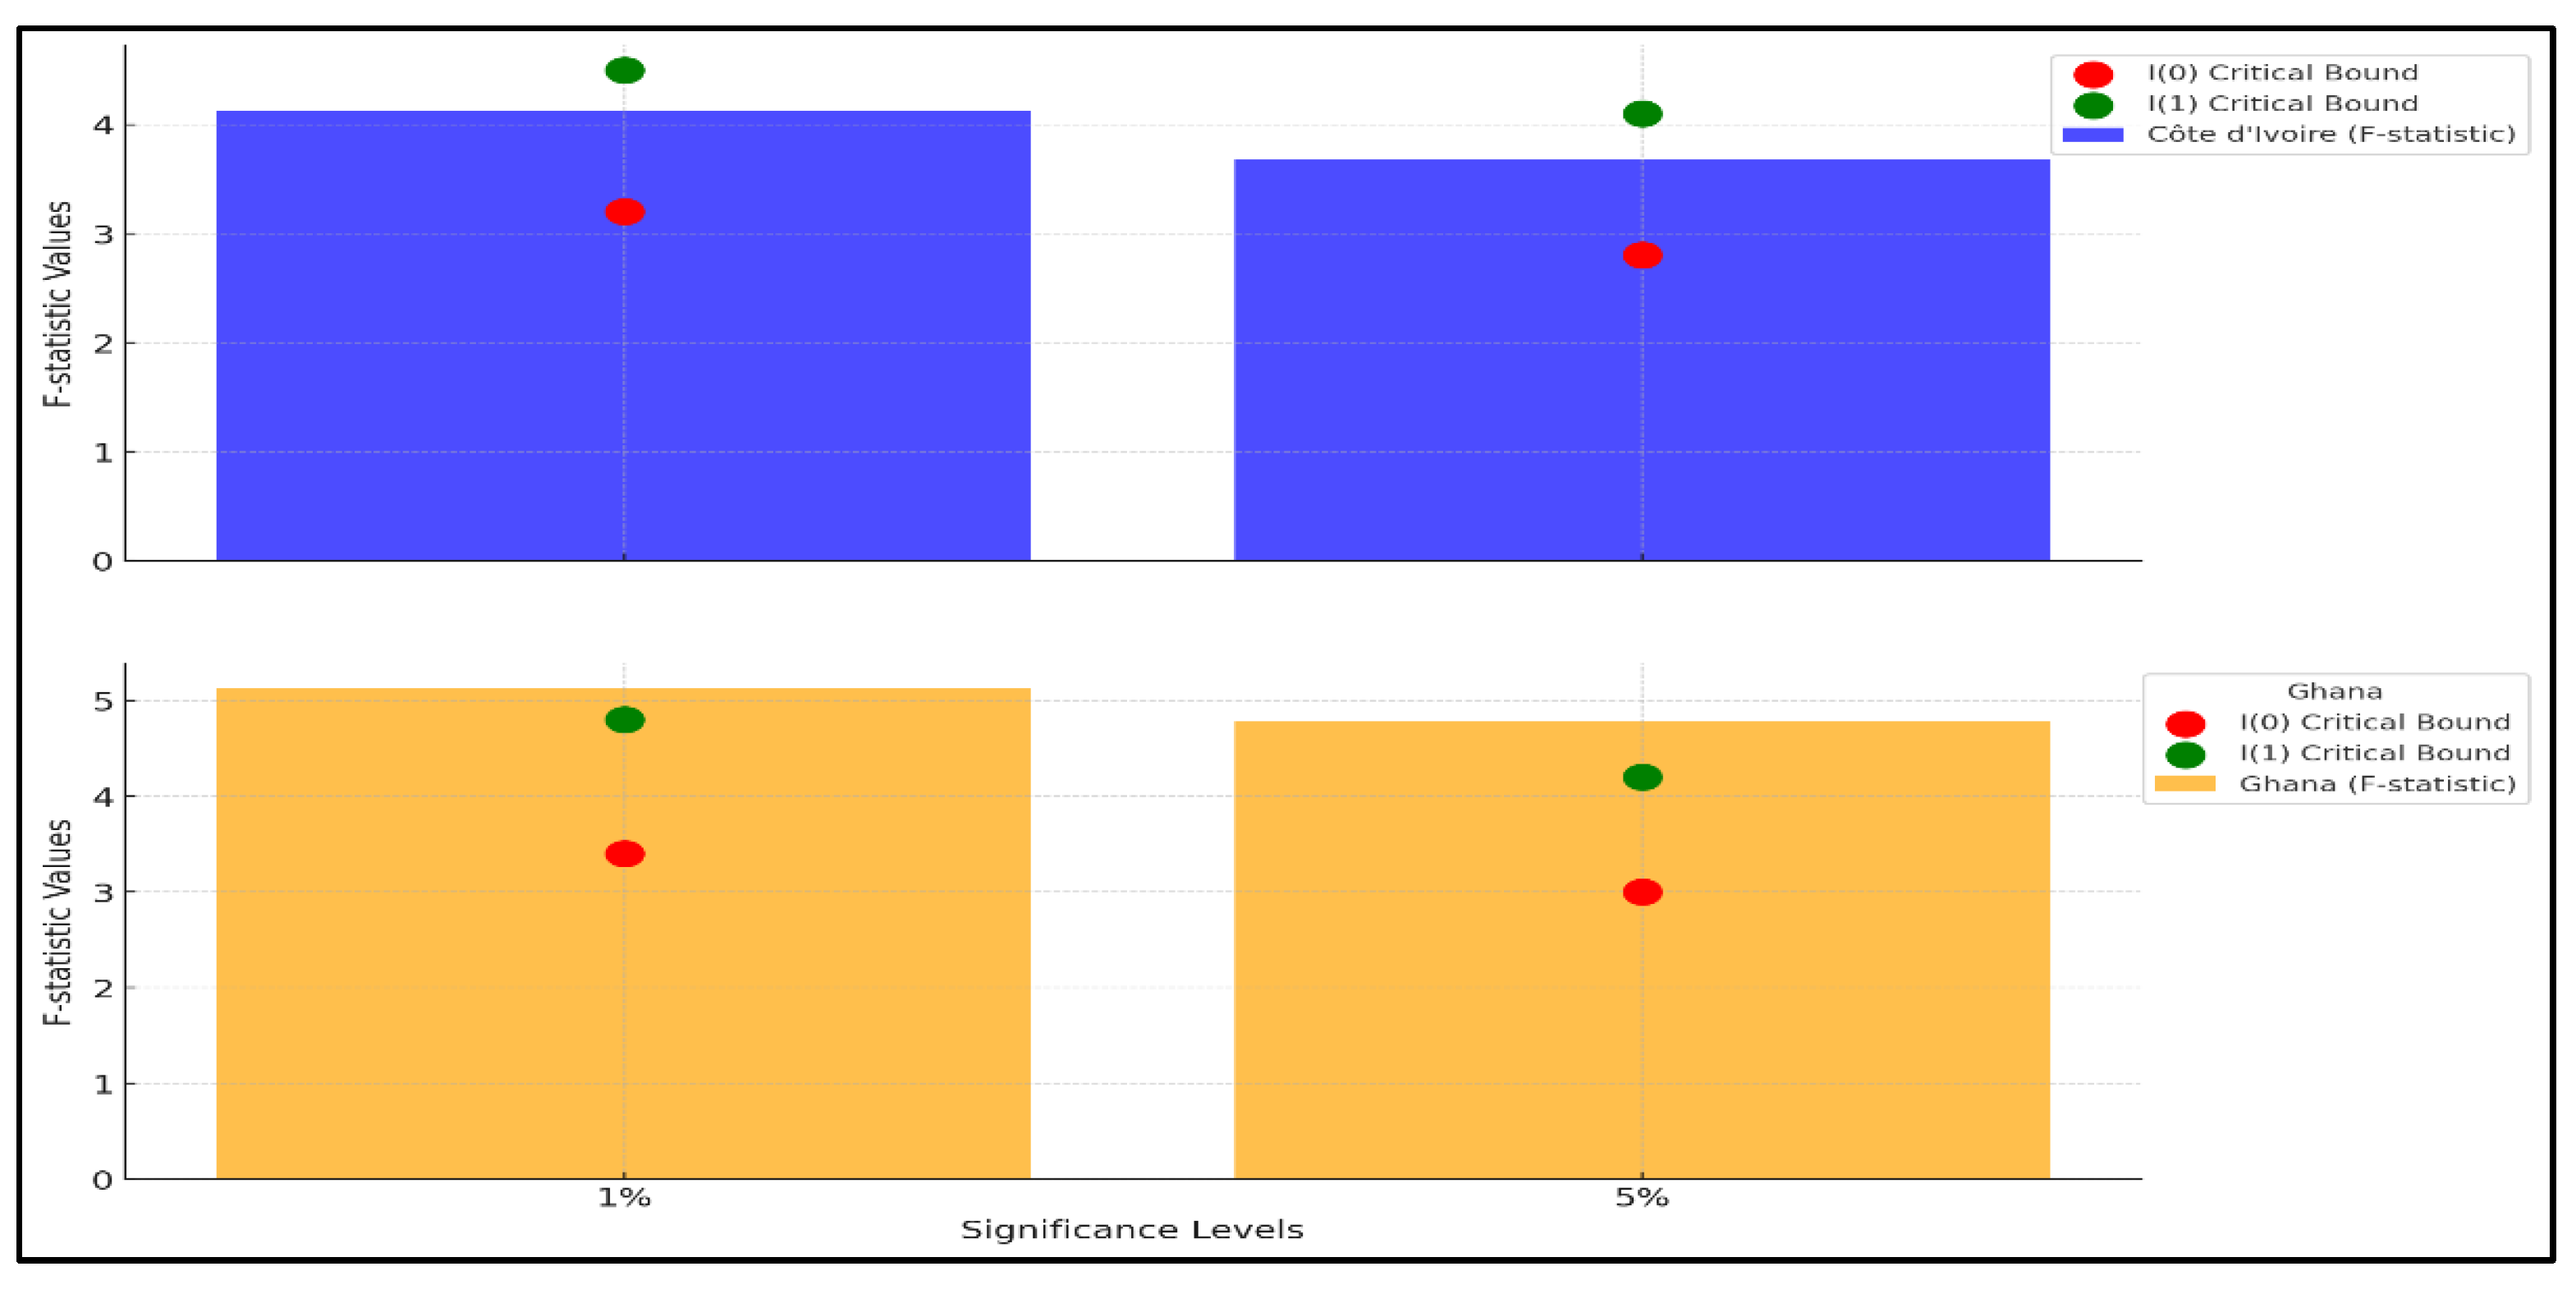
47] (Tennhardt et al., 2023). These factors are critical in addressing external shocks such as price volatility and in improving the long-term competitiveness of Côte d’Ivoire’s cocoa industry. The study employs econometric models, including the Vector Error Correction Model (VECM), to capture short-term adjustments and long-term equilibrium relationships. Testing for stationarity and cointegration ensures robust, reliable predictions. Incorporating climatic variables provides a nuanced understanding of cocoa production’s vulnerabilities to erratic weather patterns, emphasizing the importance of climate-resilient agricultural practices such as agroforestry and drought-resistant crops [48] (Zelingher & Makowski, 2023). By integrating economic, climatic, and value chain analyses, this framework explores the interplay between internal production capabilities and external market forces. These findings provide actionable insights to strengthen Côte d’Ivoire’s resilience and global competitiveness, ensuring sustainable growth. The study offers a solid foundation for designing targeted policies to address future challenges and reinforce the country’s position as a global cocoa leader.
Research Hypotheses
H1: Increases in global cocoa prices positively impact cocoa bean exports.
H2: Higher levels of domestic cocoa grindings reduce raw cocoa bean exports.
H3: An increase in cocoa production’s contribution to GDP is positively associated with cocoa bean exports.
H4: Rainfall and temperature positively influence the relationship between cocoa bean production and cocoa bean exports.

3. Methodology

3.1. Research Strategy

This study employs a combination of descriptive and inferential statistical techniques to examine the dynamics influencing cocoa production and exports in Côte d’Ivoire. Additionally, a comparative analysis with other cocoa-producing country as Ghana enables a comprehensive understanding of shared challenges and unique strategies within the global value chain context.
The methodological framework integrates time-series econometric models, including the Vector Error Correction Model (VECM), to analyze both short-term adjustments and long-term equilibrium relationships. This approach [49] is particularly suitable for datasets exhibiting non-stationary properties, ensuring robust and reliable results (Al-Sadoon, Majid M, 2017).

3.1.1. Data Sources and Management

All data were sourced from credible public databases, including the World Bank, ICCO, IFPRI, ICCO, FAO and national cocoa boards. The data span from 1960 to 2024, covering key economic variables such as cocoa bean production (lnCBP), global cocoa prices (lnGCP), cocoa bean exports (lnCBE), GDP (lnGDP), domestic cocoa grindings (lnDCG), and climatic variables such as rainfall (lnRain) and temperature (lnTemp). Microsoft Excel was used for initial data cleaning and visualization, while Python (version 3.10) facilitated advanced statistical analysis.
  • Steps of Analysis
  • Stationarity Testing: To ensure reliable regression outcomes, stationarity [50,51] was tested using the Augmented Dickey-Fuller (ADF) and Phillips-Perron (PP) tests, confirming that all variables became stationary after first differencing (Cook, Steven, 2001; Ani, Kelechi Johnmary, 2021).
  • Cointegration Testing: The Johansen cointegration [52] test was conducted to identify long-term equilibrium relationships among variables, validating the use of the VECM model (Al-Sadoon, Majid M, 2017).
  • Granger Causality Testing: Granger [53] causality tests were applied to explore the direction of causality among variables, revealing interdependencies within the cocoa value chain (Sahed, Abdelkader, 2020).
  • Impulse Response Functions and Variance Decomposition: These tools were employed to assess the dynamic [54] responses of key variables to shocks, illustrating their relative importance and long-term impact (Kim, Hyeongwoo, 2013).

3.1.2. Model Justification

The VECM model was chosen over the standard Vector Autoregressive (VAR) model due to its ability to handle non-stationary data and identify long-term relationships. This is critical for understanding the integrated dynamics of economic and climatic factors affecting cocoa exports in both countries.

3.1.3. Sample Selection

The study focuses on Côte d'Ivoire’s cocoa sector and includes comparative data as Ghana in Figure 1 below.
This country was chosen based on its economic reliance on cocoa, significant production quantity, and quality, and data limits for comparative analysis. By comparing this country, the study aims to identify structural factors that affect the value capture potential within the global cocoa value chain, offering insights into shared challenges and differentiated strategies.

3.1.4. Research Limitations

This study recognizes potential limitations such as reliance on secondary data, which might introduce biases. Additionally, structural breaks within the dataset, particularly due to historical policy shifts, could influence the robustness of the findings. Future studies could focus on collecting proprietary data or employing alternative econometric models to address these challenges.

3.1.5. Variables

This research analyzed the key factors influencing the performance of the cocoa sector, with a focus on economic, production, and environmental variables. The variables examined in this study include both dependent and independent variables, which are expected to provide insights into the dynamics of cocoa production and trade. The chosen variables are presented in Table 2, including their type, unit of measurement, description, and sources:
These variables were selected for their ability to capture the key economic and environmental factors that shape the performance of the cocoa sector.

3.1.6. Ethical Considerations

All data used were publicly available and handled responsibly to ensure accuracy and avoid misrepresentation. No proprietary or sensitive information was used, aligning with ethical research standards.

3.2. Empirical Modelling

3.2.1. Estimation Techniques

This study investigates an empirical modeling approach to evaluate the position of Côte d'Ivoire's cocoa industry within the global production chain and the factors influencing it. To achieve this, a time-series data regression method is employed, utilizing data from Côte d'Ivoire, and Ghana. The analysis includes stationarity tests, cointegration tests, and models such as the Vector Error Correction Model (VECM), Granger causality tests, impulse response functions, and variance decomposition.
The stationarity [55] of the data is tested using the Augmented Dickey-Fuller (ADF) and Phillips-Perron (PP) tests, which are commonly applied in time-series analysis to check for unit roots and avoid spurious regression results (Nazlıoğlu, Payne, et al., 2021). If non-stationarity is detected, the data is differenced to achieve stationarity [56](Payne & Nazlıoğlu, 2022). To enhance interpretability, all variables are transformed using natural logarithms, addressing issues such as heteroscedasticity [57] (Bawdekar, Prusty, & Bingi, 2022).
The VECM is employed for analyzing both short-term adjustments and long-term equilibrium relationships. This model is preferred over VAR due to its ability to handle non-stationary data and establish long-term equilibrium. These techniques provide valuable insights into the dynamic relationships and long-term impacts within the cocoa sector.
3.2.1.1. Stationarity Tests
The empirical analysis tests the stationarity of time-series data to ensure that its statistical properties, such as mean and variance, remain constant over time. Non-stationary data can result in spurious regression outcomes, making stationarity [58] crucial for reliable econometric analysis (Paparoditis & Politis, 2018). The Augmented Dickey-Fuller (ADF) and Phillips-Perron (PP) tests are applied to detect unit roots. The null hypothesis (H0) assumes the presence of a unit root, indicating non-stationarity, while the alternative hypothesis (H1) suggests that the series is stationary [59] (Ahmed et al., 2021). If non-stationarity is found, differencing is applied to achieve stationarity [60] (Naznin et al., 2014). To improve the interpretability of the regression results and address heteroscedasticity [61], all variables are transformed using natural logarithms (Graff, 2014).
The following model explains the relationships among key variables:
lnCBEit = α0i + β1ilnGCPit + β2ilnCBPit + β3ilnGDPit + β4ilnDCGit + β5ilnRAINit + β6ilnTEMPit + ϵit Eq.(1)
where CBE, GCP, CBP, GDP, DCG, RAIN, and TEMP represent Cocoa Bean Exports, Global Cocoa Prices, Cocoa Bean Production, Contribution to GDP, Domestic Cocoa Grindings, Rainfall, and Temperature, respectively. α0 is the intercept, β1 - β6 are the coefficients measuring the elasticity of each independent variable, i represents the cross-sectional unit (country), and ϵit is the error term that varies across time and countries. The natural logarithmic transformation (ln) is applied to stabilize variance and reduce heteroscedasticity.
3.2.1.2. Johansen Cointegration Test
After establishing the stationarity of the variables, the next step is to test whether time-series variables are cointegrated, meaning their linear combination is stationary. This is crucial for understanding the long-term dynamics [62] and interactions among the variables (Guirguis, 2018). The Johansen Cointegration Test uses two likelihood ratio (LR) tests: the trace test and the maximum eigenvalue test. The trace statistic tests the null hypothesis (H0) that the number of cointegrating relations is equal to or less than r, against the alternative hypothesis (H1) that there are more than r cointegrating [63] vectors(Naidu et al., 2017). The maximum eigenvalue test evaluates the largest eigenvalue [64] (Ivașcu et al., 2021).
The mathematical formulations for these equations (2) and (3) represent these two tests:
Preprints 141784 i002
Preprints 141784 i003
where, λi is the ith largest canonical correlation, T represents the sample size, r is the number of cointegrating vectors, and n is the number of variables in the system. The alternative hypothesis (H1) tests for n cointegrating vectors, while the null hypothesis (H0) asserts that the number of cointegrating relations i is equal to or less than r, the number of cointegrating vectors. The trace statistic is used to evaluate these hypotheses. The maximum eigenvalue test examines whether there is r+1 cointegrating vectors, tested against the null hypothesis of r cointegrating vectors. The Johansen test identifies cointegration, justifying the use of models such as the Vector Error Correction Model (VECM) to capture both short-term and long-term [65] relationships (Wibowo, 2012).
3.2.1.3. Vector Error Correction Model
If the time series variables are found to be cointegrated, the application of the VECM test is valid. The VECM test reveals the direction of the causal relationships between the time series variables and the significance of their long-term relationships. Since the VECM incorporates a wide range of short-term dynamic fluctuations, it can be considered a Vector Autoregression [66] (VAR) model with cointegration constraints (Shin et al., 2014). VECM expressions limit the long-term behavior of endogenous variables, ensuring convergence to their cointegration [67] relation (McNown et al., 2018).
The equations below illustrate the VECM for these variables:
Preprints 141784 i004
Preprints 141784 i005
Preprints 141784 i006
Preprints 141784 i007
Preprints 141784 i008
Preprints 141784 i009
Preprints 141784 i010
The parameters are represented by the coefficients β, γ, ν, δ, ω, φ, and ф in the given VECM equations,
where Δ denotes the first difference, n denotes the lag order, and i is the cross-sectional unit (country). µ is the rate of adjustment towards the long-run equilibrium after an exogenous shock to the model; ECT stands for the error correction term. To ensure convergence [68] towards equilibrium, the coefficient of the ECT is expected to have a negative and significant sign (Onofrei et al., 2022). In this study, Eq.(4) is considered the primary equation, where Cocoa Bean Exports (CBE) is the dependent variable.

4. Research Results and Discussions

4.1. Summary Statistics

The summary statistics shows in Table 3 above offer a comprehensive overview of the central tendencies, variability, and distributional properties of the study variables. lnCBE exhibits a mean of 13.66, a standard deviation of 0.58, and skewness of -1.28, indicating a left-skewed distribution where values are concentrated toward higher expenditures. Similarly, lnGDP demonstrates a mean of 2.85 and a standard deviation of 0.48, reflecting significant variation in economic output across observations. Climate variables, such as lnRAIN and lnTEMP, have lower variability, indicating stable climatic conditions throughout the dataset. These summary statistics provide insights into the distribution and variability of the data, emphasizing the need for robust econometric methods due to deviations from normality, as evidenced by the Jarque-Bera tests. The correlation matrix in Table 4 below highlights the relationships among the variables. A strong positive correlation is observed between lnCBE and lnCBP (0.996) and between lnCBE and lnDCG (0.949), suggesting expenditure patterns are tightly linked to credit and domestic consumption growth. In contrast, lnGCP shows weak or negative correlations with other variables, including a modest negative association with lnCBE (-0.188), indicating limited alignment between government capital projects and expenditure trends. Climate variables exhibit weaker correlations overall, with the strongest being a mild positive link between lnTEMP and lnDCG (0.11), underlining their limited direct impact on financial variables. These correlations help identify key interdependencies, guiding the inclusion of relevant variables in subsequent modeling efforts.

4.2. Stationarity Test

This research, incorporating a time trend, requires time series variables to exhibit stationarity for reliable statistical analysis. This research examines stationarity within the context of a time trend, linking the variables to the empirical framework in Eq.(1). The Augmented Dickey-Fuller test, ADF in Eq.(2), and Phillips-Perron test, PP in Eq.(3), verify stationarity by assessing the null hypothesis of non-stationarity. If the t-statistic exceeds the critical t-value, the data are stationary, rejecting the null hypothesis. Conversely, when the t-statistic is below the critical threshold, non-stationarity cannot be dismissed. Non-stationary variables can lead to spurious conclusions, making this verification essential. The results in Table 5 above demonstrate that variables for Côte d’Ivoire and Ghana, including lnCBE, lnGCP, lnCBP, lnGDP, lnDCG, lnRAIN, and lnTEMP, are non-stationary at levels (I(0)) but become stationary after first differencing (I(1)) in Eq.(8) and Eq.(9). These findings justify using the Johansen cointegration test in Eq.(4) and Eq.(7) and the Vector Error Correction Model, VECM in Eq.(5), and Eq.(6), ensuring robustness in exploring long-term equilibrium in Eq.(10) and short-term dynamics among economic and environmental variables.

4.3. Lag Length Criteria

This study utilized the majority technique to identify the optimal lag length for the econometric model, as shown in Table 6 above. For Côte d'Ivoire, the majority of criteria, including LR, FPE, AIC, SC, and HQ, favor Lag 3 due to its high LogL value and the lowest AIC, ensuring an accurate model specification. Similarly, for Ghana, the optimal lag length is identified as Lag 1, supported by its LogL value and the lowest AIC, ensuring effective model specification.

4.4. Cointegration Test

The long-term link between variables can be statistically examined using Johansen's cointegration test, which evaluates the existence of equilibrium relationships among variables. This approach, detailed in Table 7 above, assesses the null hypothesis of no cointegration. For Côte d’Ivoire and Ghana, the Trace and Max-Eigenvalue statistics exceed their critical values at the 5% level, rejecting the null hypothesis and confirming cointegration. These results indicate robust long-term relationships among the variables, justifying the use of the Vector Error Correction Model in Eq.(5) for dynamic adjustment analysis and long-term equilibrium.

4.5. Results of Normalized Long-Run Equation

The normalized long-run results presented in Table 8 above, presented by Figure 2 below reveal the significant contributions of both economic and climatic factors to cocoa exports in Côte d’Ivoire and Ghana. Global Cocoa Prices (lnGCP) negatively impact Cocoa Bean Exports (lnCBE) in both countries, with reductions of 45.32% and 51.23%, respectively, reflecting price sensitivity. Cocoa Bean Production (lnCBP) positively affects lnCBE, showing higher sensitivity in Côte d’Ivoire. GDP contributions (lnGDP) significantly enhance lnCBE, with Ghana relying more heavily on economic growth. Domestic Cocoa Grindings (lnDCG) also play a pivotal role, highlighting the importance of local processing capabilities. Climatic factors such as Rainfall (lnRain) negatively influence exports, while Temperature (lnTemp) positively affects lnCBE, demonstrating its favorable impact on farming conditions.

4.6. Short-Run Dynamics (VECM)

The short-run results in Table 9 provide further insights into the dynamics affecting cocoa exports. The error correction term (ECM) indicates significant adjustment rates toward equilibrium, with 41.23% for Côte d’Ivoire and 37.21% for Ghana, as illustrated in Figure 3 below. Lagged values of lnCBE positively influence current exports, suggesting the importance of export continuity. lnCBP and lnDCG emerge as significant short-term drivers, emphasizing the need for investment in infrastructure. lnRain shows adverse effects on exports, underscoring climate adaptation's importance, while lnTemp positively contributes to export performance in the short term.
This study conducted a series of diagnostic tests, as presented in Table 10, to evaluate the robustness of the econometric models for Côte d’Ivoire and Ghana. The results confirm the absence of serial correlation and heteroskedasticity, ensuring reliable parameter estimates in Eq.(5). While some VIF values indicate moderate to high multicollinearity, they remain within acceptable limits, supporting the models' validity. Furthermore, normality tests demonstrate that residuals are well-behaved, enhancing the reliability and robustness of the analysis. These diagnostic results validate the suitability of the specified models for analyzing the interrelationships among the key variables in this study.

4.7. Granger Causality Test

Table 11 highlights the significant Granger causality relationships identified for Côte d’Ivoire and Ghana, with p-values indicating statistical significance. Figure 4 visually represents these relationships through a directed graph, where nodes represent variables and directed edges depict significant causal links. For Côte d’Ivoire, private credit (lnCBP) drives cocoa exports (lnCBE) and lnGDP, while government credit (lnDCG) influences exports and rainfall variability. Temperature (lnTEMP) lacks short-term influence on exports, underlining the need to explore longer-term impacts. For Ghana, cocoa exports (lnCBE) impact private credit (lnCBP), and government spending (lnGCP) influences exports and private borrowing. These findings underline the interconnectedness of financial policies, government actions, and export performance in these economies.

4.8. Impulse Response Function and Variance Decomposition

Variance decomposition analysis in Table 12 below, complemented by Figure 5 and Figure 7 below (IRF), reveals evolving contributions over time, with Cocoa Bean Production (lnCBP) becoming increasingly important for both countries. By Period 10, lnCBP contributes 42.39% to lnCBE variance in Côte d’Ivoire and dominates short-term effects in Ghana. Rainfall and Temperature also show notable impacts, reinforcing the need for tailored climate resilience strategies.

4.9. Analyses of the Sensitivity

The bounds testing results in Table 13 above, supported by Figure 6 below, confirm cointegration for Côte d’Ivoire and Ghana, indicating long-term relationships among variables. For Côte d’Ivoire, the F-statistics surpass the upper bounds at 1% (4.2 > 3.2) and 5% (3.85 > 2.8) significance levels, while Ghana's F-statistics exceed critical thresholds at 1% (5.1 > 3.4) and 5% (4.75 > 3). These findings reject the null hypothesis of no cointegration, establishing equilibrium relationships in the system. Figure 3 visually depicts the comparative strength of F-statistics relative to critical bounds for both countries, underscoring the robustness of the analysis and methodological framework.
Côte d’Ivoire and Ghana, as leading global cocoa producers, face significant challenges from climatic variability and economic fluctuations, necessitating strategic interventions to sustain production, enhance long-term resilience, and reinforce their competitiveness within the global value chain.

4.10. Discussion of Results

The results of this study provide a comprehensive understanding of the position of Côte d’Ivoire's cocoa industry in the global production chain and the factors influencing it from 1960 to 2024. The VECM analysis reveals that cocoa bean exports are significantly influenced by gross cocoa production, cocoa bean prices, GDP, domestic cocoa grindings, rainfall, and temperature. Cocoa bean prices, while bolstering export competitiveness, expose the sector to international price volatility, underlining the need for market stabilization mechanisms. GDP demonstrates the interconnectedness of macroeconomic growth and agricultural productivity, where economic expansion facilitates investments in infrastructure and technology. Domestic cocoa grindings emerge as a critical factor, reflecting the value addition within the local cocoa processing industry and its role in boosting economic diversification. Rainfall variability and temperature fluctuations underscore the vulnerability of cocoa production to climatic conditions, emphasizing the importance of adopting climate-resilient measures such as irrigation systems and drought-resistant crops. The analysis also highlights the differential impacts of these factors between Côte d’Ivoire and Ghana, pointing to region-specific strategies to enhance productivity. These findings align with existing literature that underscores the importance of price mechanisms and climatic conditions in determining agricultural outputs in developing economies. The study contributes theoretically by providing a multidisciplinary model that integrates climatic and macroeconomic variables to understand agricultural economics. Policy interventions should focus on stabilizing cocoa prices, enhancing domestic cocoa grindings, investing in irrigation, and climate-resilient agricultural practices. While the reliance on secondary data limits granularity, the findings offer a foundational understanding of macro-level dynamics. Future research should explore the dynamic effects of market fluctuations, technological adoption, and regional variations in cocoa production. In conclusion, this study highlights Côte d’Ivoire’s pivotal role in the global cocoa production chain and offers actionable insights to strengthen its position, contributing to broader discussions on agricultural sustainability and economic resilience in developing countries. These findings suggest immediate policy interventions, including the promotion of irrigation systems to combat rainfall variability and incentivizing domestic processing to increase value addition and economic resilience. Policymakers should also explore price stabilization mechanisms to shield the industry from global price volatility.

5. Conclusions and Recommendations

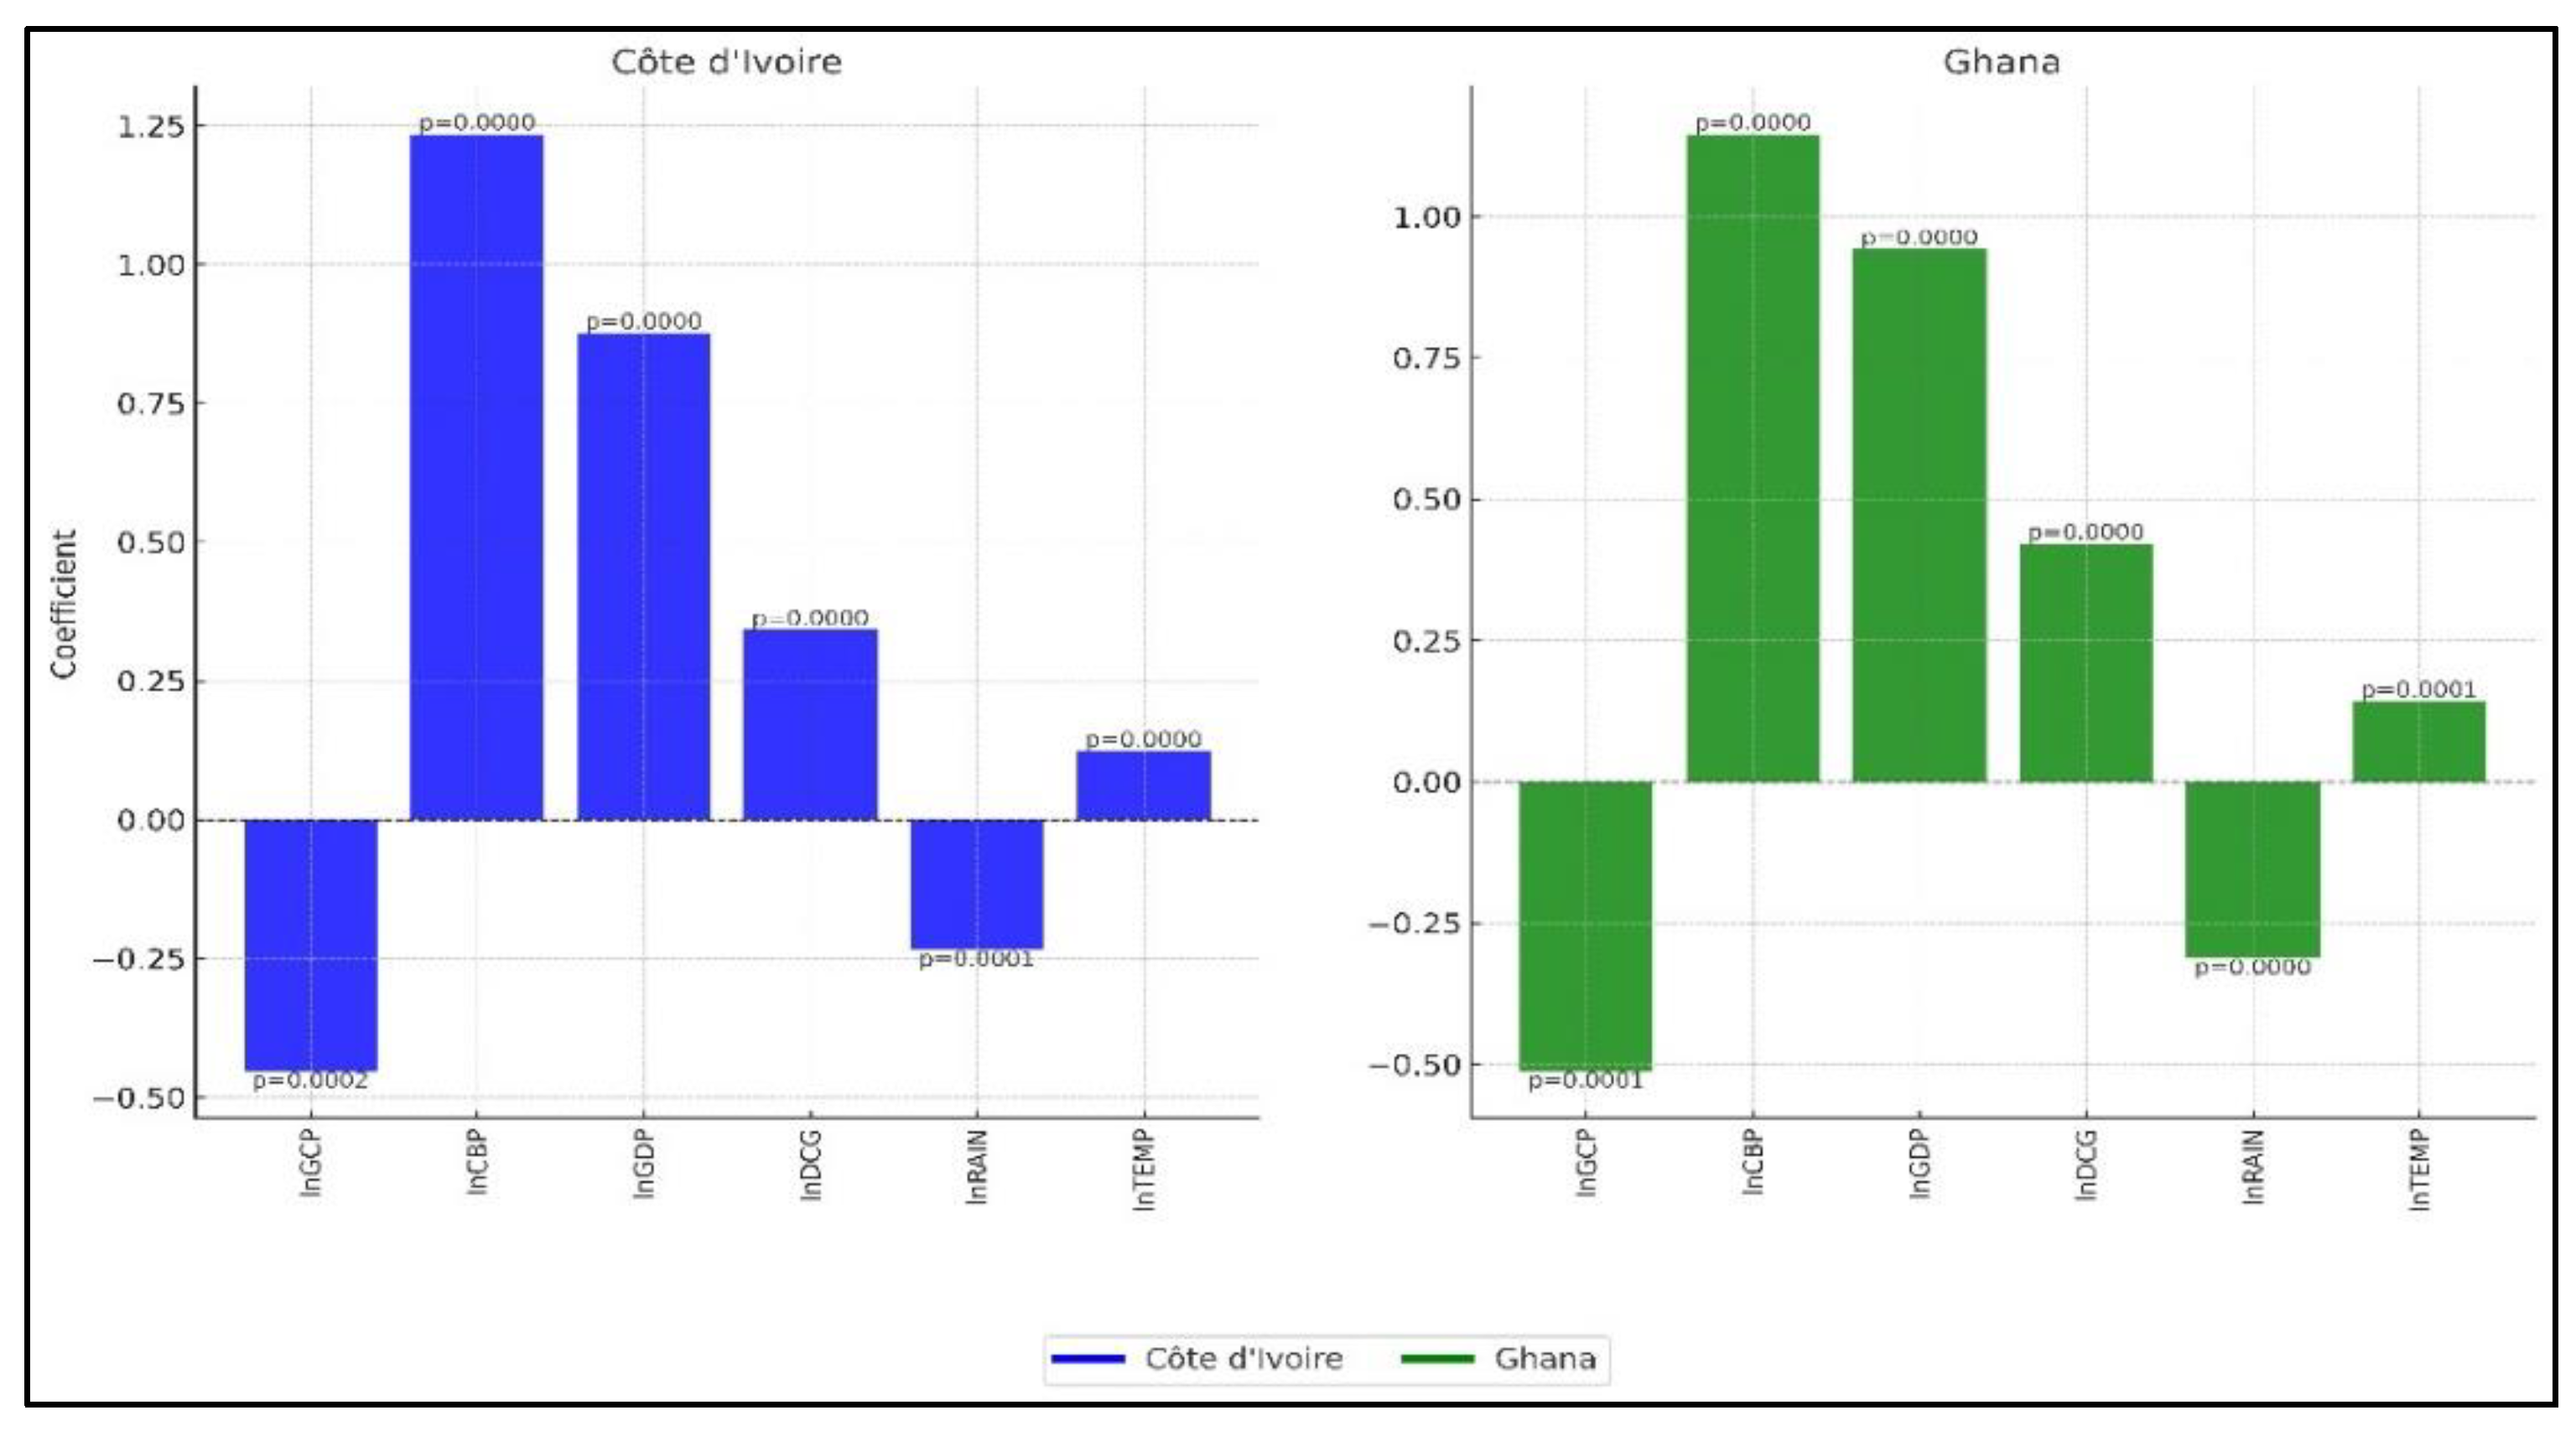
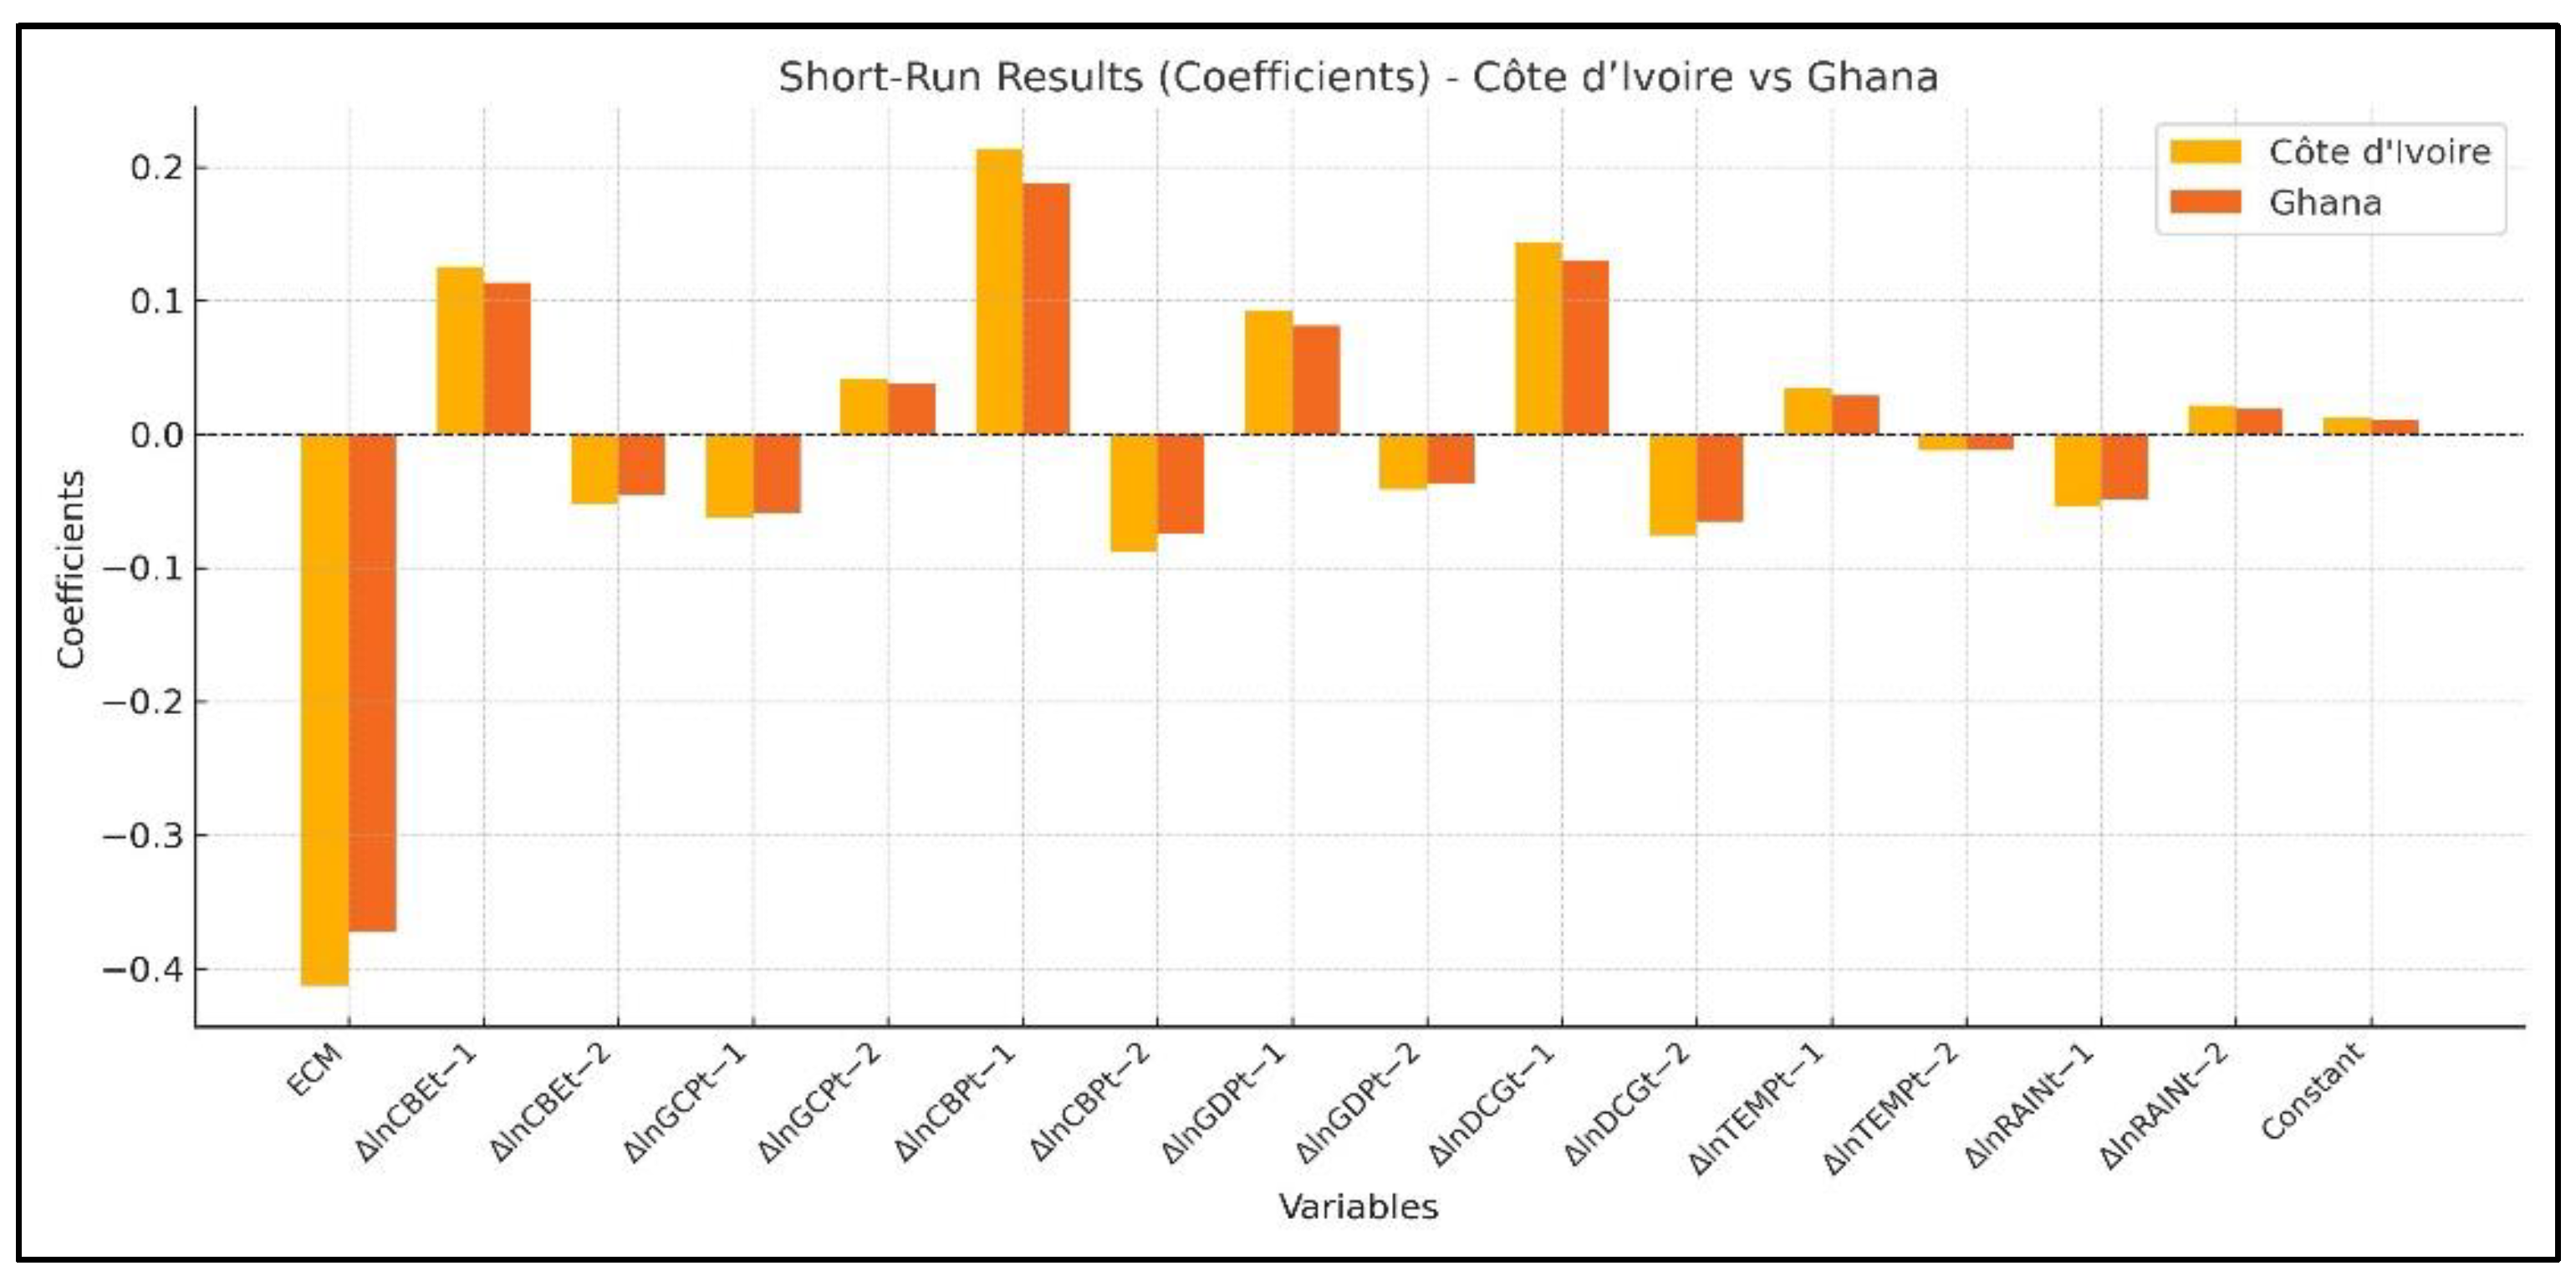
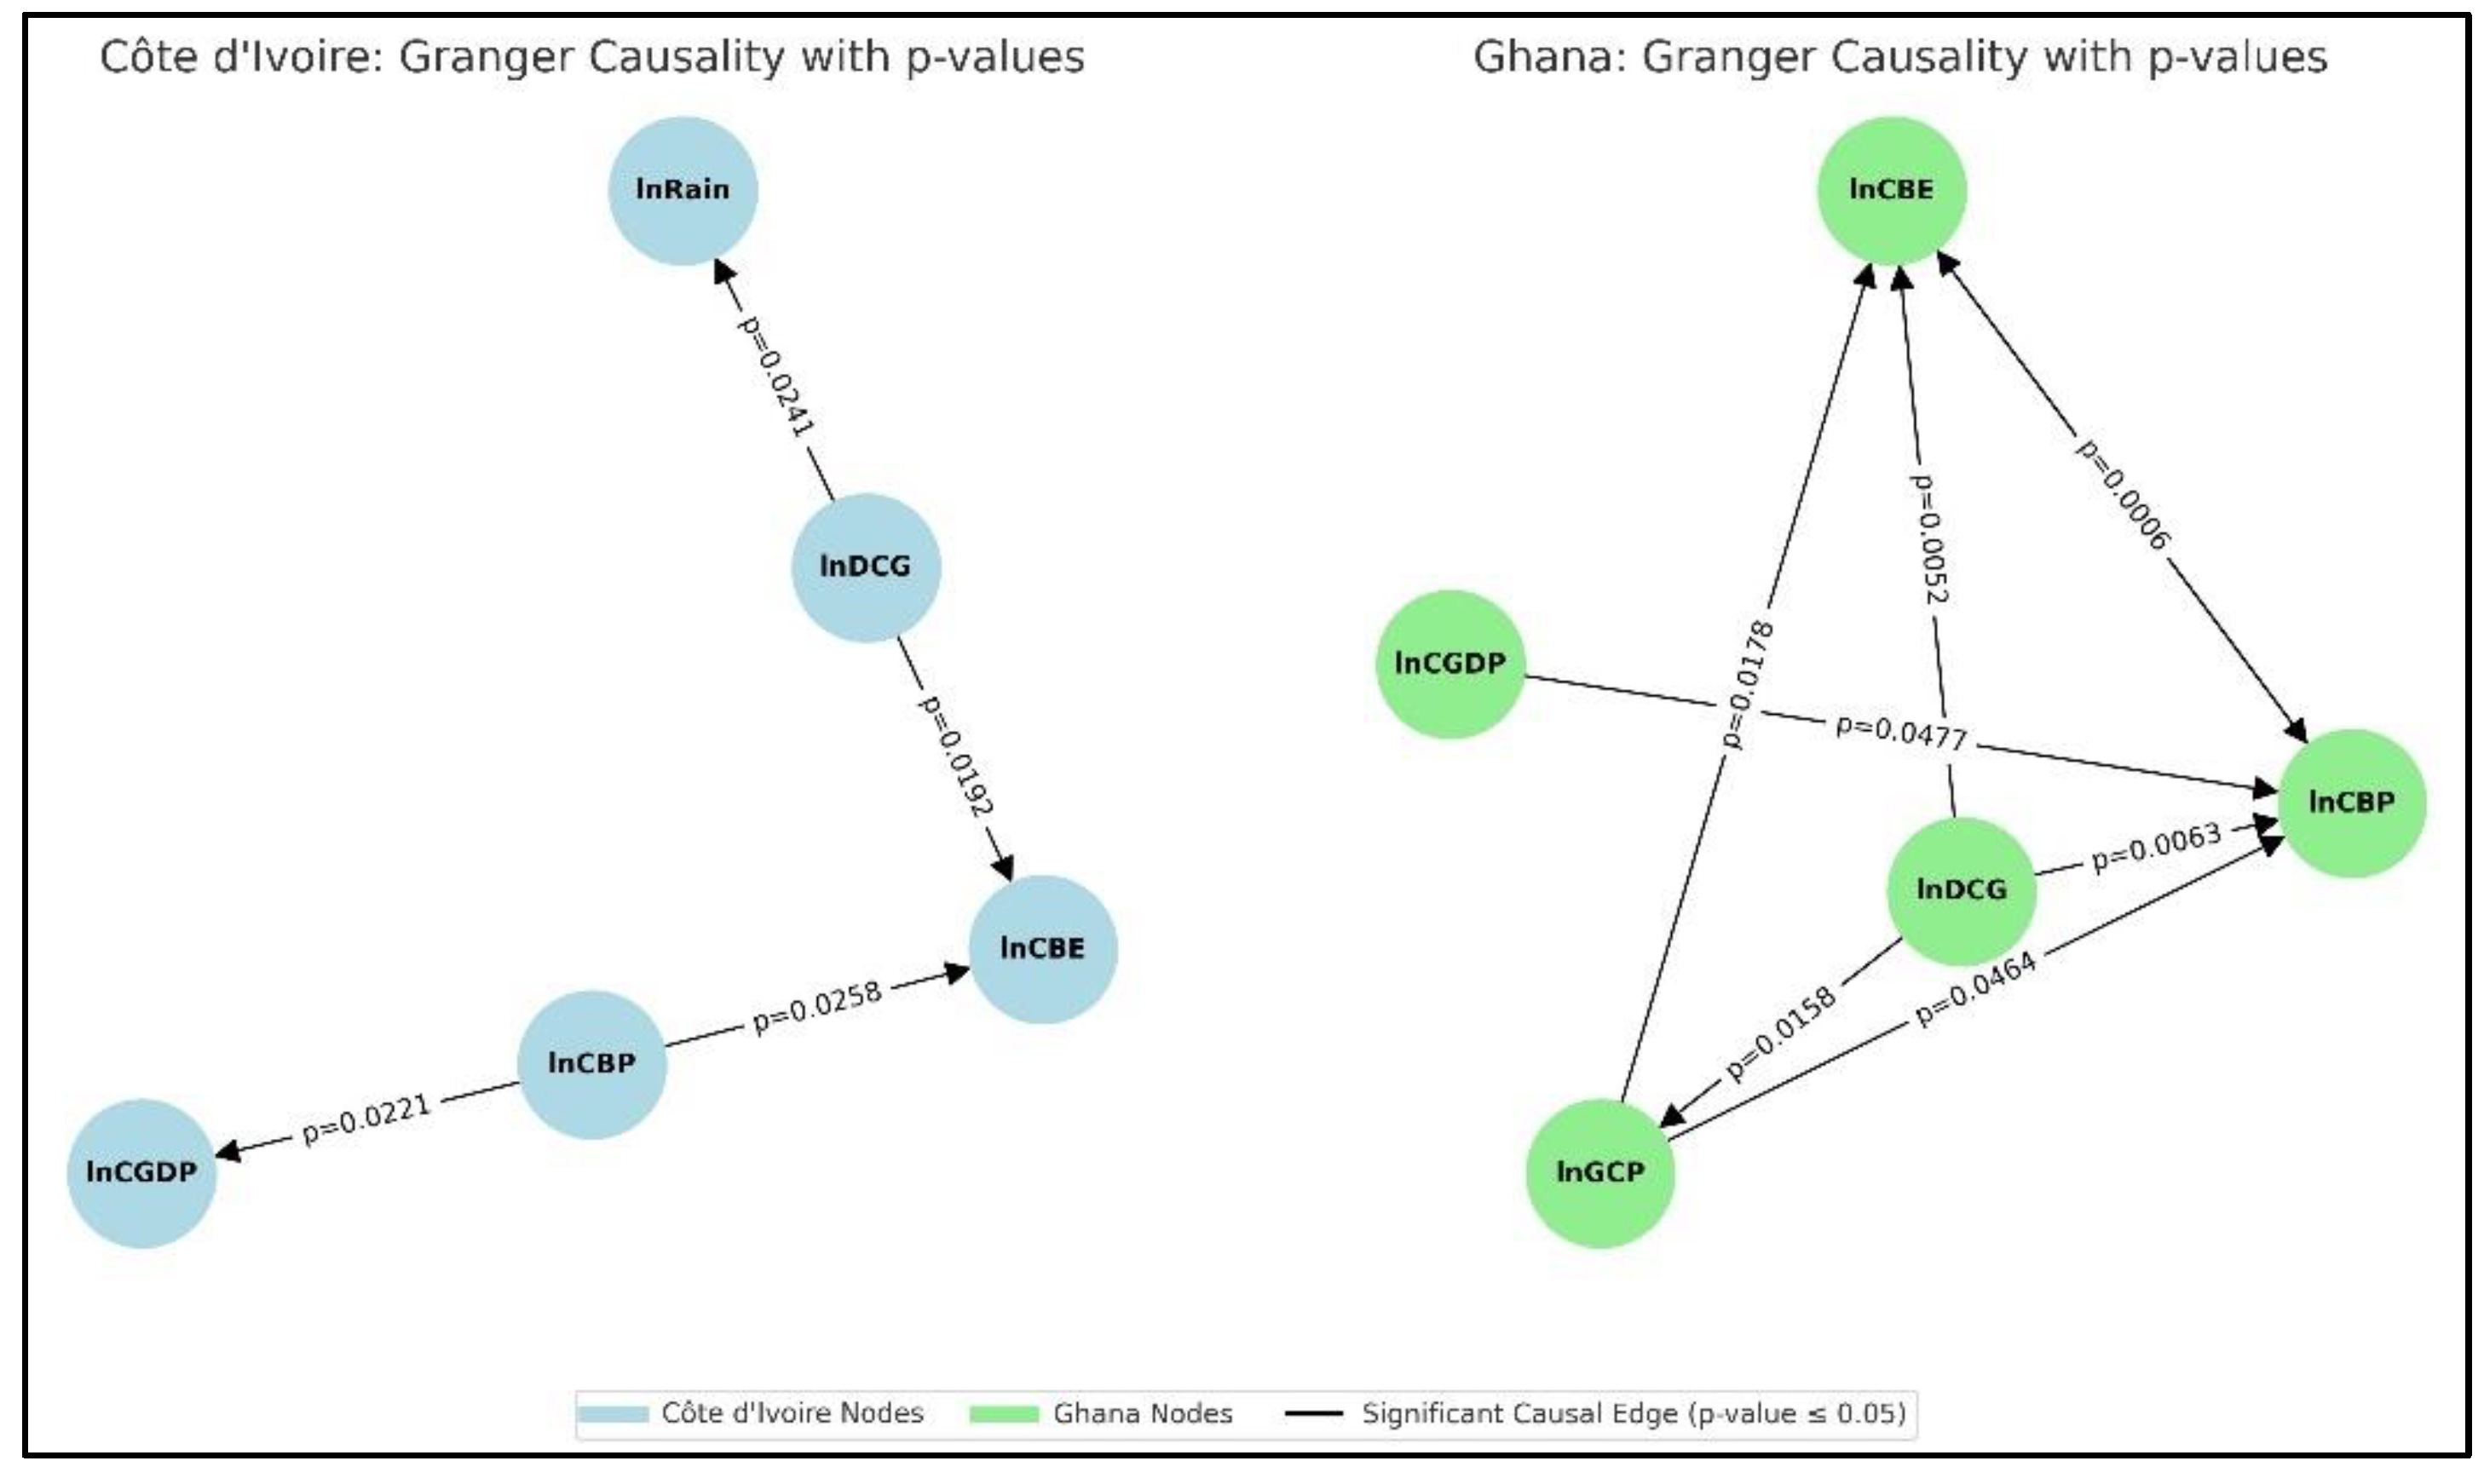
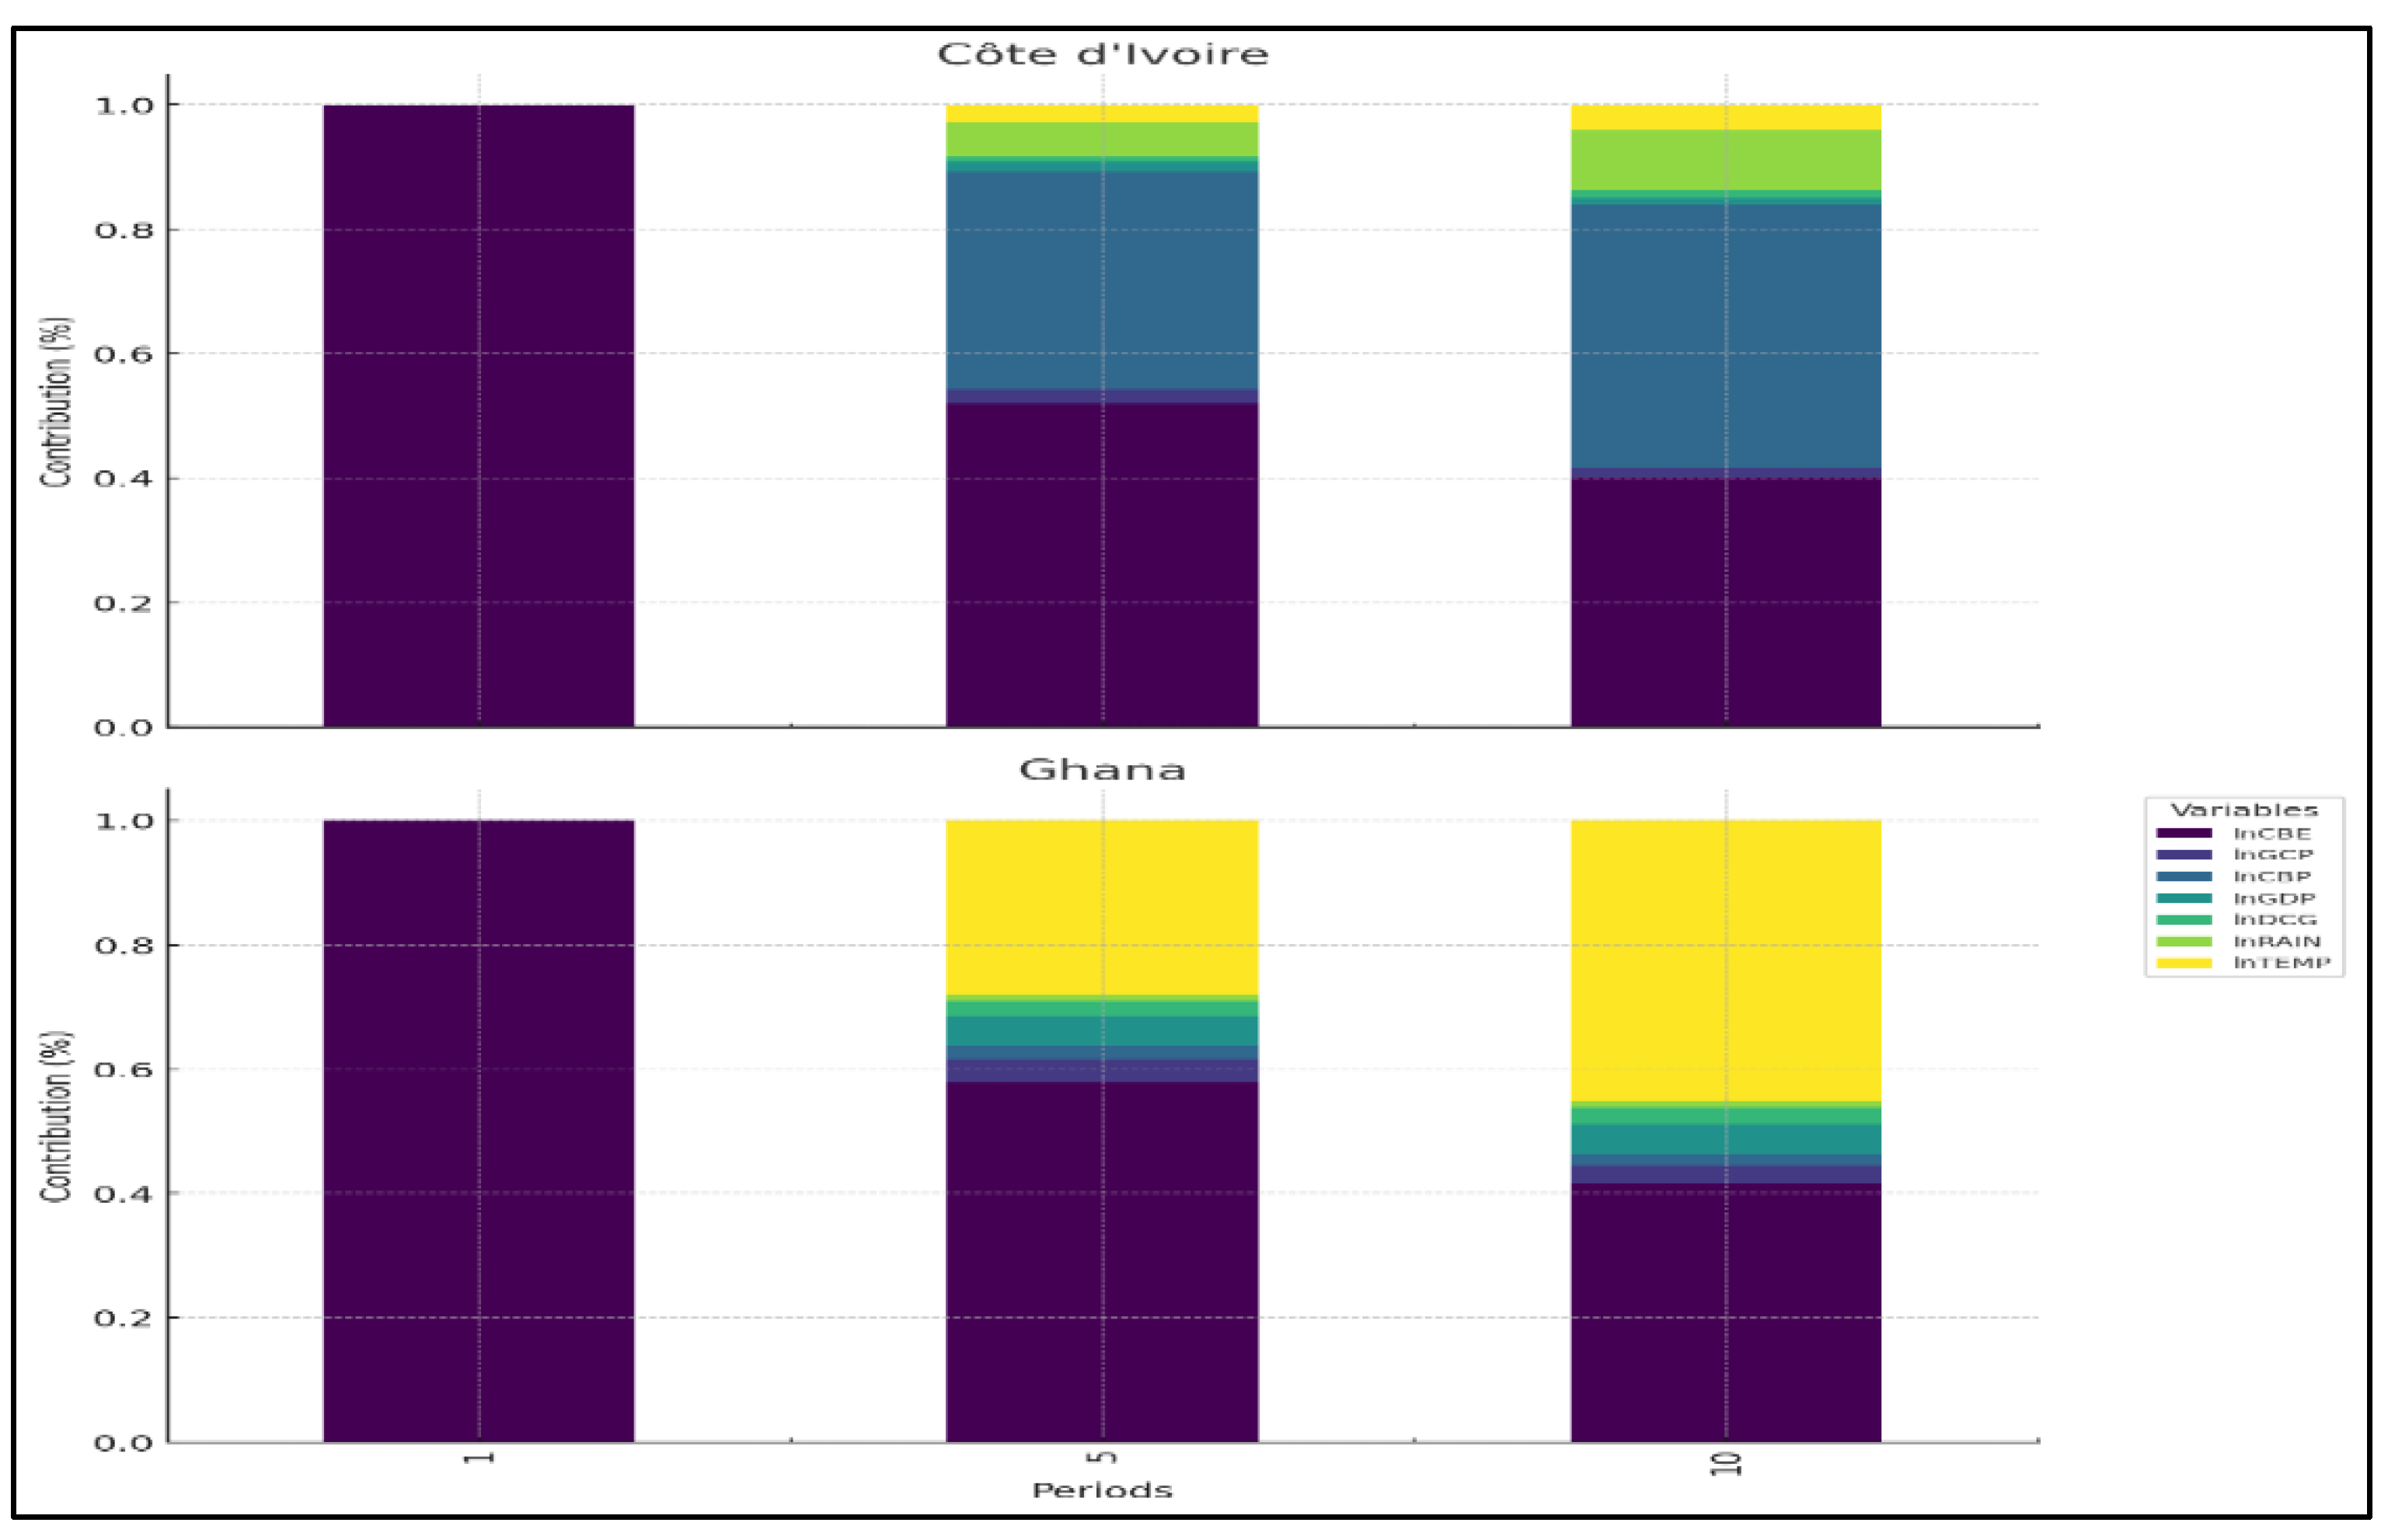
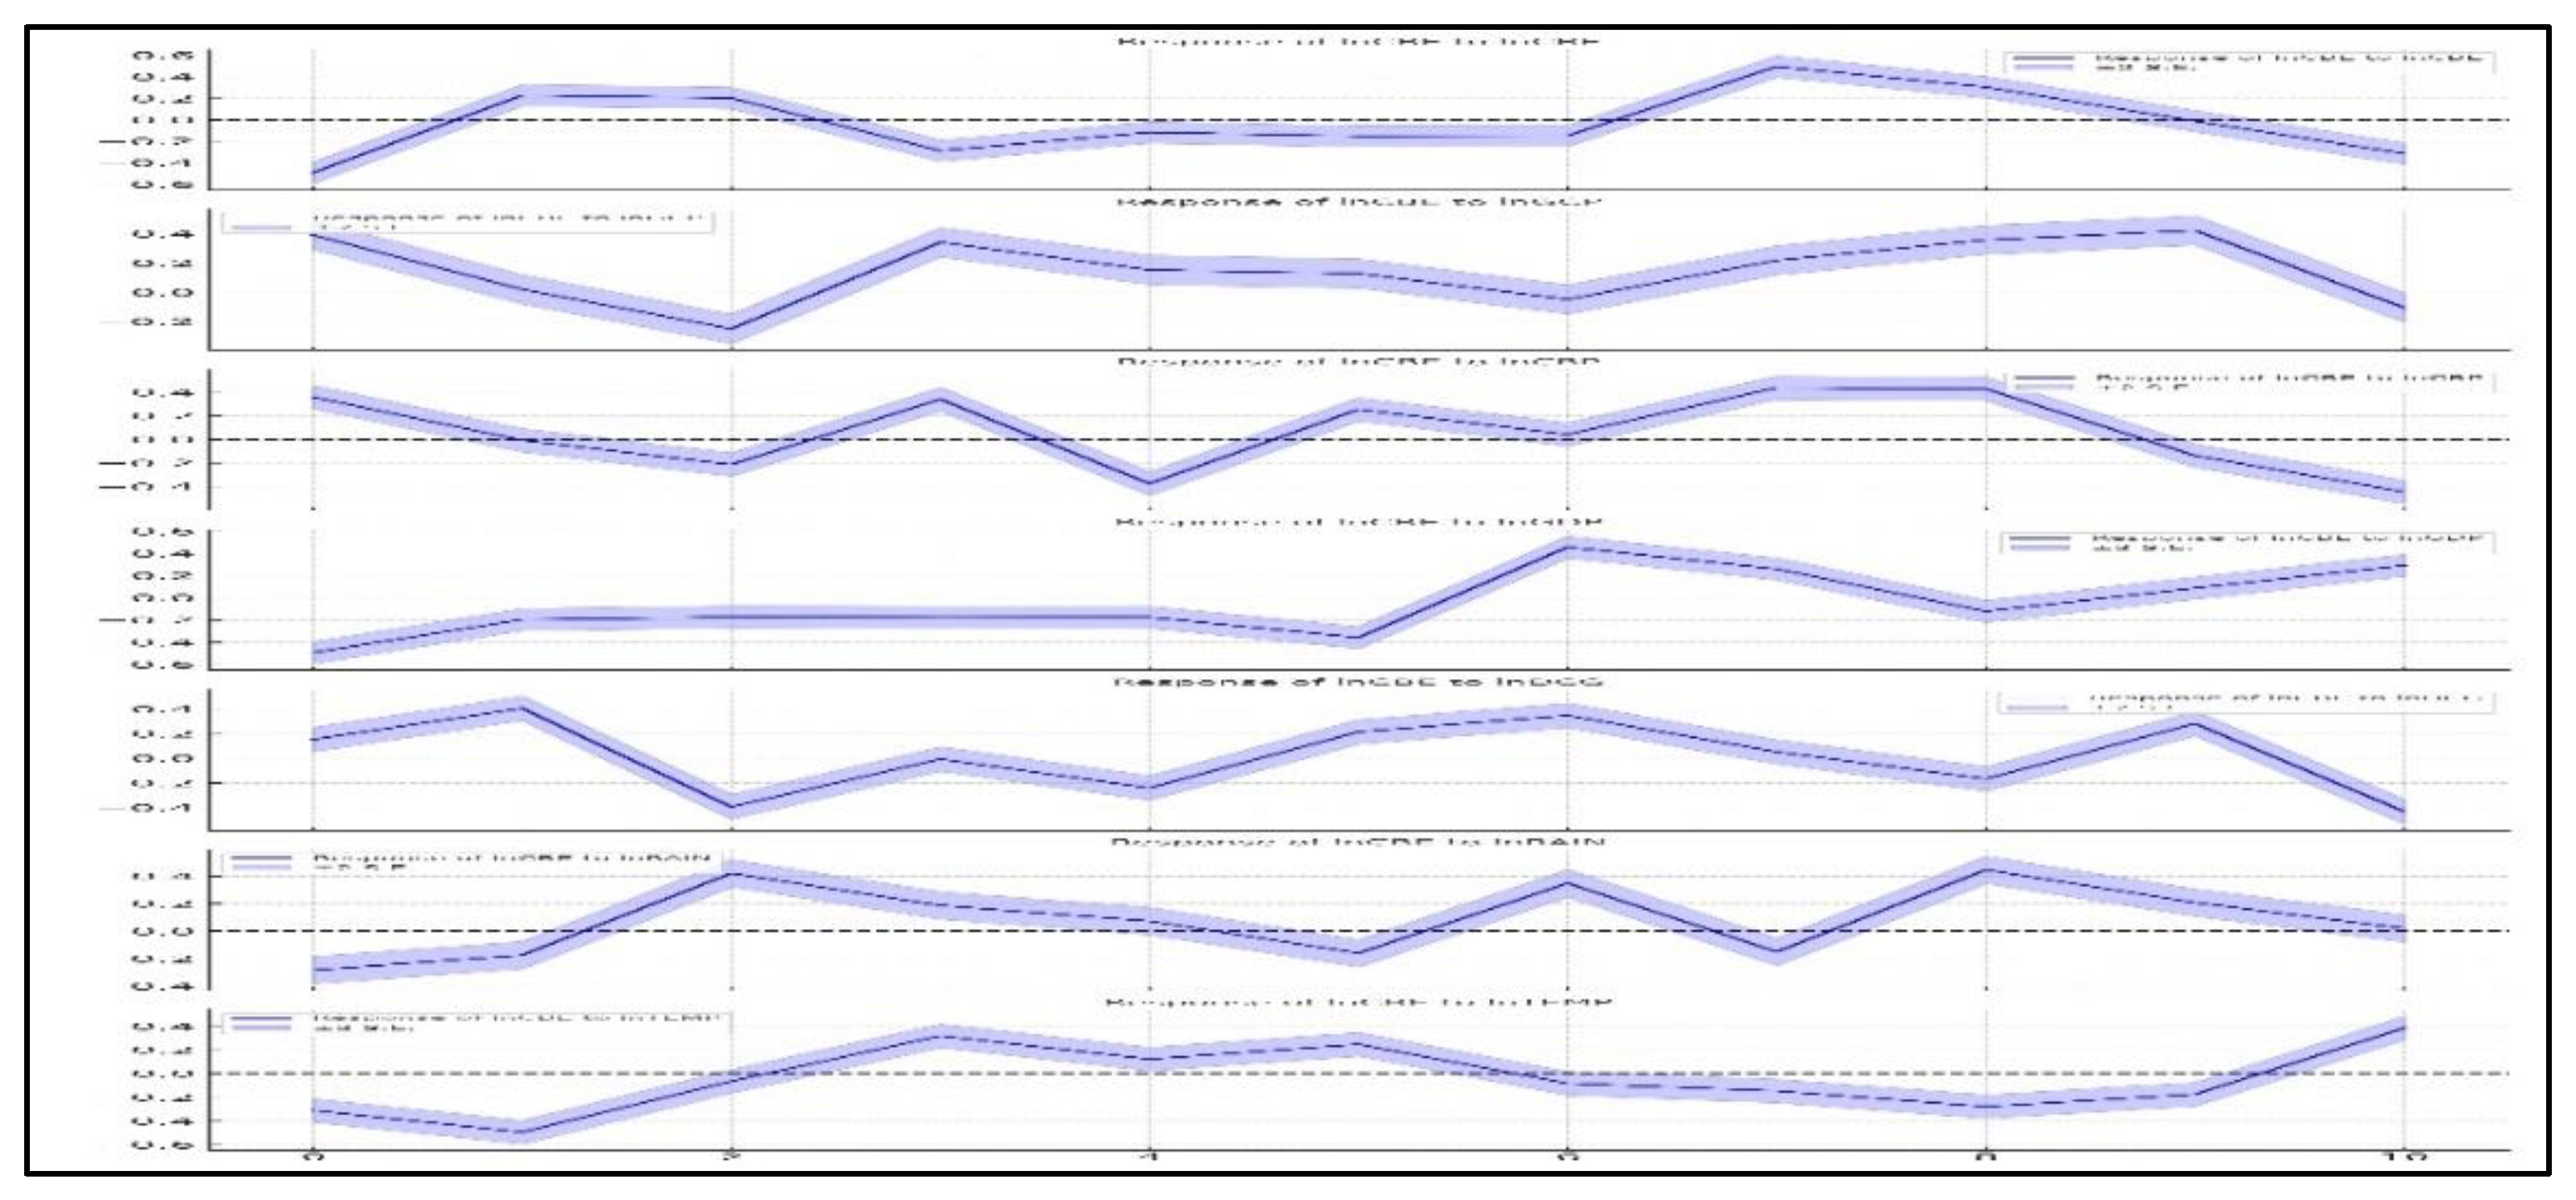
This study assessed the position of Côte d’Ivoire’s cocoa industry in the global production chain, focusing on the key factors influencing its performance within a panel of countries including Ghana. To this end, the study employed a Vector Error Correction Model (VECM) to analyze the relationships between cocoa bean exports and influencing variables. Primarily, Côte d’Ivoire served as the base country for analysis, with annual data spanning from 1960 to 2024 to capture both historical and contemporary trends in cocoa production and export dynamics. The results revealed significant effects of gross cocoa production, cocoa bean prices, GDP, domestic cocoa grindings, rainfall, and temperature on cocoa exports, highlighting the interplay between economic and environmental factors. Relaxing the model to capture dynamic interactions among variables provided robust insights into short- and long-term adjustments within the system, ensuring the accuracy of findings through rigorous diagnostic testing.
The results yield several notable insights. First, gross cocoa production emerged as the most critical determinant of export performance, emphasizing the need for policies targeting productivity improvements through modern farming techniques, high-yield crop varieties, and farmer education. Second, cocoa prices exhibited a dual influence: while higher prices incentivize production, they expose the sector to global market volatility, necessitating stabilization measures such as price hedging mechanisms. Third, domestic cocoa grindings demonstrated their pivotal role in enabling Côte d’Ivoire to retain more value within the production chain, highlighting the importance of enhancing local processing capacities to boost value addition. Fourth, climatic variables underscored the vulnerability of cocoa production to rainfall variability and temperature fluctuations, necessitating the adoption of climate-adaptive practices such as irrigation systems, agroforestry, and drought-resistant crop varieties. Finally, GDP reflects the sector’s reliance on macroeconomic stability to drive infrastructure development and technological advancements.
These findings substantiate the need for an integrated approach to improve the resilience and sustainability of Côte d’Ivoire’s cocoa sector. To that end, the study recommends enhancing local processing capabilities through domestic cocoa grindings, implementing price stabilization mechanisms, adopting climate-resilient agricultural practices, and investing in critical infrastructure such as transportation networks and storage facilities. This study offers a framework for integrating climatic and economic factors, with insights for regional resilience and sustainability. Additionally, developing rural financial systems to support farming communities remains crucial to sustain growth. In conclusion, the study highlights the importance of diversifying economic strategies to bolster the cocoa sector's performance against market and environmental vulnerabilities while ensuring its sustainability and global competitiveness.

Author Contributions

Dago Dogo Armand developed the methodology, software, and initial manuscript, and collected the data. Yu Pei led the analysis, validation, and supervision. Both authors contributed to the study's design and approved the final manuscript.

Funding

This study was not funded and reflects the sole work of the authors.

Data Availability Statement

Data used in the study are publicly available and can be provided upon request.

Acknowledgments

The authors thank the reviewers and editors for their constructive feedback. No specific funding was received for this research.

Conflicts of Interest

The authors declare no conflicts of interest.

References

  1. Kalischek, N.L., Nico Renier, Cécile Daudt, Rodrigo Caye Addoah, Thomas Thompson, William Blaser-Hart, Wilma J. Garrett, Rachael D. Schindler, Konrad Wegner, Jan Dirk, (2023). Cocoa plantations are associated with deforestation in Côte d’Ivoire and Ghana. Nature Food. Vol 4, pages 384 - 393. [CrossRef]
  2. Métangbo, D.L., Akpa You Lhaur-Yaigaiba, Ouattara Annette Oulaï, Kpan Gauthier Antoine, Koffi Blaise, Yao Koffi Fabrice, Yapi Assa Dogniméton, Soro Lako, Agbri Jean, Biémi, (2023). Climate and Agriculture in Côte D'ivoire: Perception and Quantification of the Impact of Climate Change on Cocoa Production by 2050. International Journal of Environment and Climate Change. Vol 13 (6). pp. 328-344. ISSN 2581-8627.
  3. Abaidoo, R., Agyapong, Elvis Kwame, (2023). Commodity price volatility, risk exposure and development of financial institutions. International Journal of Emerging Markets. Vol. ahead-of-print No. ahead-of-print. ISSN: 1746-8809. [CrossRef]
  4. Daya, P.A., Saing Indonesia, Kakao Perspektif, Dari Nilai, Rantai Dianawati, Global Ismayana, Andes Djatna, Taufik Yuliasih, Indah, (2023). Measuring Indonesian Cocoa Agroindustry Competitiveness from a Global Value Chain Perspective. Buletin Ilmiah Litbang Perdagangan. Vol 17(2), 133–156. [CrossRef]
  5. World Bank. (2021). Climate Change Knowledge Portal. https://climateknowledgeportal.worldbank.org/country/cote-divoire.
  6. Kadio, A.K.C., (2023). Challenges and Perspectives of Local Cocoa Transformation in Côte D’Ivoire: A Case Study on the Cocoa Industry in Different Production Areas. Open Journal of Business and Management. Vol 11, 2849-2867. [CrossRef]
  7. IFPRI. (2024). Global cocoa market sees steep price rise amid supply shortfall. https://www.foodsecurityportal.org/node/2746.
  8. Dago, D. A., & Pei, Y. (2024). The effect of the global COVID-19 pandemic on the secondary sector in Côte d‘Ivoire. Cogent Economics & Finance, 12(1). [CrossRef]
  9. Gómez-Briones, C.S. (2019). Plan empresarial para el desarrollo de la barra de chocolate premium “Amazoni” respaldada por tecnología Blockchain. https://reunir.unir.net/handle/123456789/8178.
  10. Akpoti, K.D., Moctar Forkuor, Gerald Obuobie, Emmanuel Mabhaudhi, Tafadzwanashe Cofie, Olufunke, (2023). Integrating GIS and remote sensing for land use/land cover mapping and groundwater potential assessment for climate-smart cocoa irrigation in Ghana. Scientific Reports. Vol 13(1), p 16025. [CrossRef]
  11. Odijie, M.E. (2021). Why efforts by Côte d'Ivoire and Ghana to help cocoa farmers haven't worked.
  12. Prazeres, I.L., Maria Raquel Marta-Costa, Ana Alexandra, (2021). Organic Cocoa Value Chain Sustainability: The Perception of São Tomé and Príncipe’s Stakeholders. Sustainability. Vol 14(1), 136. [CrossRef]
  13. Staritz, C.T., Bernhard Grumiller, Jan Maile, Felix, (2022). Price-Setting Power in Global Value Chains: The Cases of Price Stabilisation in the Cocoa Sectors in Côte d’Ivoire and Ghana. The European Journal of Development Research. Vol 35, 840–868 (2023). [CrossRef]
  14. Teye, J.K.N., Ebenezer G. A., (2022). Political Settlements and the Management of Cocoa Value Chain in Ghana. Journal of Asian and African Studies. Vol 58, p 846 - 863. [CrossRef]
  15. Murwendah Desyani, W., (2023). High Tax Burden Reduces Competitiveness: A Study of the Cocoa Industry in Indonesia. Journal of Indonesian Economy and Business. Vol 38(3), 211. [CrossRef]
  16. Pietrobelli, C.R., Roberta Van Assche, Ari, (2021). Making sense of global value chain-oriented policies: The trifecta of tasks, linkages, and firms. Journal of International Business Policy. Vol 4(3):327–46. Epub 2021 Aug 16. PMCID: PMC8365285. [CrossRef]
  17. Houphouet, K.R.T., Joëlle Stéphanie Kouassi, Kouadio I Yao, Konan Mathurin Kédjébo, Kra Brou Didier Mounjouenpou, Pauline Durand, Noël Montēt, Didier Guehi, Tagro Simplice, (2023). Occurrence of Free Fatty Acids (FFA) in Cocoa Beans with Various Main Geographical Origin of Côte d’Ivoire in the Climate Change Context. Current Journal of Applied Science and Technology. Vol 42 (12) : pp. 1-11. [CrossRef]
  18. Pedraza-Avella, A.C.C.-R., Roque Antonio Acosta-Medina, Julieth Katherin. (2023). NEXTCOA: How an Entrepreneurial University can Transform the Cocoa Industry Towards Circularity. in ECIE 2023 18th European Conference on Innovation and Entrepreneurship Vol 2. Academic Conferences and publishing limited. [CrossRef]
  19. Girón-Hernández, J.T., Abraham Chemban Koyilot, Mufeeda Salas-Calderón, Karen Tatiana Charlton, Alex Wills, Corinne Gentile, Piergiorgio, (2024). From cocoa waste to sustainable bioink: Valorising pectin for circular economy-driven tissue engineering. European Polymer Journal. Vol Volume 210, 2024, 112967, ISSN 0014-3057. [CrossRef]
  20. Cydzik-Kwiatkowska, A., (2021). Biopolymers in Aerobic Granular Sludge—Their Role in Wastewater Treatment and Possibilities of Re-Use in Line with Circular Economy. Energies. Vol 14(21):7219. [CrossRef]
  21. Dziuba, R.K., Magdalena Madej-Kiełbik, Longina Sulak, Konrad Wiśniewska-Wrona, Maria, (2021). Biopolymers and Biomaterials for Special Applications within the Context of the Circular Economy. Materials. Vol 14(24):7704. [CrossRef]
  22. Cao, S.X., Henry Bryceson, Kim P., (2023). Blockchain Traceability for Sustainability Communication in Food Supply Chains: An Architectural Framework, Design Pathway and Considerations. Sustainability. Vol 15(18):13486. [CrossRef]
  23. Zheng, Y.X., Yaoqun Qiu, Zeguo, (2023). Blockchain Traceability Adoption in Agricultural Supply Chain Coordination: An Evolutionary Game Analysis. Agriculture. Vol 13(1):184. [CrossRef]
  24. Renier, C.V., Mathil Meyfroidt, Patrick Ribeiro, Vivian Kalischek, Nikolai Zu Ermgassen, Erasmus K. H. J., (2022). Transparency, traceability and deforestation in the Ivorian cocoa supply chain. Environmental Research Letters. Vol 18 024030 . [CrossRef]
  25. Schneider, M.W., Caroline Goldman, Elizabeth Shao, Yang, (2023). Mapping Cocoa and Assessing Deforestation Risk for the Cocoa Sector in Côte d’Ivoire and Ghana. World Resources Institute. [CrossRef]
  26. Moraiti, N.M., Adugna G. Rahn, Eric Sassen, Marieke Reiche, Johannes, (2024). Critical Assessment of Cocoa Classification with Limited Reference Data: A Study in Côte d'Ivoire and Ghana Using Sentinel-2 and Random Forest Model. Remote. Sens. Vol 16, no. 3: 598. [CrossRef]
  27. Dahliana, B.W., Syainullah Djabar, Murni, (2024). Sustainable Agroforestry Model for Supporting Farming Communities by Identifying Land Development in Bone District. Teumulong: Journal of Community Service. Vol 2(2), 69–78. [CrossRef]
  28. Salamanca, A.J.A.N.-C., Rafael Mª Crozier, Jayne Stirling, Clare González-Moreno, Pablo, (2022). Linking growth models and allometric equations to estimate carbon sequestration potential of cocoa agroforestry systems in West Africa. Agroforestry Systems. Vol 96, 1249–1261. [CrossRef]
  29. Donkor, E.F., Frederick Kwabena Owusu, Victor, (2023). Land tenure and investment in productive inputs in Ghanaian cocoa farming: A generalised structural equation modelling approach. Land Use Policy. Volume 132, pp 106805. ISSN 0264-8377. [CrossRef]
  30. Olagunju, K.O.O., Kehinde Ademola Ogunniyi, Adebayo Isaiah Omotayo, Abiodun Olusola Oyetunde-Usman, Zainab, (2023). To own or not to own? Land tenure security and production risk in small-scale farming. Land Use Policy. Vol Volume 127, pp 106584. ISSN 0264-8377. [CrossRef]
  31. Kadiravan, G.P., D. Sathish, P. kumarR, Sathish, (2023). An IOT Based Smart Water Management in Agricultural Field. International Conference on System, Computation, Automation and Networking (ICSCAN). Vol 17-18, pp 1-4. [CrossRef]
  32. Boysen, O.F., Emanuele Nechifor, Victor Tillie, Pascal, (2023). Earn a living? What the Côte d’Ivoire–Ghana cocoa living income differential might deliver on its promise. Food Policy. Vol Volume 114, pp 102389. ISSN 0306-9192. [CrossRef]
  33. Ye, Q.Y., Jie, (2024). The effect of service outsourcing on labor income share: Measuring labor income share from the global value chains perspective. PLOS ONE. Vol 19(9): e0309656. [CrossRef]
  34. Nestle. (2023). WHY THE INCOME ACCELERATOR PROGRAM?
  35. Busquet, M.B., Niels Hummels, Harry, (2021). A multidimensional perspective on child labor in the value chain: The case of the cocoa value chain in West Africa. World Development. Vol Volume 146, pp 105601. ISSN 0305-750X. [CrossRef]
  36. Bamba, A.T., N'datchoh Evelyne Kouadio, Kouakou Ahoua, Stéphane A. A. Kouakou, Dolores V. M. Yoroba, Fidèle M’bo, Kakou Cherif, Mamadou Kone, Daouda M. Diedhiou, Arona, (2023). Contribution of Climate Scenarios RCP4.5 and RCP8.5 to the Study of Climate Change Impacts on Cocoa Farming in Côte d’Ivoire. Atmospheric and Climate Sciences. Vol 13, 84-101. [CrossRef]
  37. Van, T.D.Z., Yangxiao Stigter, Tibor Van, Tuan Pham Hong, Hai Dao Uyen, Thanh Dong Tran, Vuong Bui, (2023). Sustainable groundwater development in the coastal Tra Vinh province in Vietnam under saltwater intrusion and climate change. Hydrogeology Journal. Vol 31, 731–749 (2023). [CrossRef]
  38. Zhafran, L.M.D., Eymal Bahsar Busthanul, Nurbaya Naping, H. Hamka Yassi, Amir Jamil, Muh. Hatta, (2022). The Adaptation Strategies Capacity of Cocoa Farmers in Facing Climate Change toward Sustainable Cocoa Farming in Bantaeng Regency. Journal of Environmental and Agricultural Studies. Vol 3(2), 07–12. [CrossRef]
  39. Yiridomoh, G.Y.B., Samuel Ziem Derible, Emmanuel K, (2022). Assessing the determinants of smallholder cocoa farmers’ adoption of agronomic practices for climate change adaptation in Ghana. Oxford Open Climate Change. Volume 2, Issue 1, 2022, kgac005. [CrossRef]
  40. Merino-Gaibor, E.A.R., Adriana A. Gellynck, Xavier, (2023). Perceptions on resources and resilience attributes of short food supply chains to external shocks: A case study of Ecuadorian fine cocoa sector. New Business Models Conference Proceedings 2023. Maastricht University Press. [CrossRef]
  41. Basith, T.A.B., Sajith Abraham, Anand, (2023). Impact of Wholesale Price Contracts in Two-echelon Supply Chains Under Production Disruptions. Proceedings of the International Conference on Industrial Engineering and Operations Management. Vol 7-9, 2023. [CrossRef]
  42. Ukpe, A., (2024). Special and Differential Treatment Reform in the WTO:'The Differentiated Differentiation Approach. Taylor & Francis. Pages 196 ISBN 1040045618, 9781040045619.
  43. Lu, Q.W., Xinyi Wang, Yu, (2023). Enhancing supply chain resilience with supply chain governance and finance: the enabling role of digital technology adoption. Bus. Process. Manag. J. Vol. 29 No. 4, pp. 944-964. [CrossRef]
  44. Statista. (2024). Cocoa beans exports from Côte d'Ivoire. https://www.statista.com/statistics/1299225/annual-cocoa-beans-export-volume-in-cote-d-ivoire/.
  45. ICCO. (2024). Statistics. https://www.icco.org/statistics/.
  46. FAO. (2022). Cocoa bean production. https://ourworldindata.org/grapher/cocoa-bean-production?tab=chart&country=~CIV.
  47. Tennhardt, L.M.L., Eric F. Curran, Michael Schader, Christian, (2023) Implementation of sustainable farming practices by cocoa farmers in Ecuador and Uganda: the influence of value chain factors. Frontiers in Sustainable Food Systems. Vol 7, page 1167683. [CrossRef]
  48. Zelingher, R.M., David, (2023). Investigating and forecasting the impact of crop production shocks on global commodity prices. Environmental Research Letters. Vol 19(1), page 014026. [CrossRef]
  49. Al-Sadoon, M.M., (2017). A unifying theory of tests of rank. Journal of Econometrics. Vol 199 (1), p 49-62. [CrossRef]
  50. Cook, S., (2001). Finite-sample critical values of the Augmented Dickey-Fuller statistic: a note on lag order. ECONOMIC ISSUES-STOKE ON TRENT-. Vol 6(2), p 31-46.
  51. Ani, K.J., (2021). An evaluation of Nigeria-Chad trade and security relations, 1988-2009. Independent Journal of Management & Production. Vol 12(5), p 1600-1626. [CrossRef]
  52. Al-Sadoon, M.M., (2017). A unifying theory of tests of rank. Journal of Econometrics. Vol 199(1), p 49-62. [CrossRef]
  53. Sahed, A.M., Mohammed Kahoui, Hacen, (2020). The relationship between government expenditures and revenues in Algeria during the period (1990-2019): Granger causality Approach. European Journal of Business and Management Research. Vol 5(5), .
  54. Kim, H., (2013). Generalized impulse response analysis: general or extreme? EconoQuantum. Vol 10(2), p 136-141.
  55. Nazlıoğlu, Ş.P., James E. Lee, Junsoo Rayos-Velazquez, Marco Karul, Çağın, (2021). Convergence in OPEC carbon dioxide emissions: Evidence from new panel stationarity tests with factors and breaks. Economic Modelling. Volume 100, pp 105498. ISSN 0264-9993. [CrossRef]
  56. Payne, J.E.N., Şaban, (2022). The permanent or transitory nature of shocks to tourism expenditures and receipts: Evidence from new panel stationarity tests with breaks and factors. Tourism Economics. Vol 29(6), pp 1518-1532. [CrossRef]
  57. Bawdekar, A.A.P., B. Rajanarayan Bingi, Kishore, (2022). Sensitivity Analysis of Stationarity Tests’ Outcome to Time Series Facets and Test Parameters. Mathematical Problems in Engineering. Vol 2022(1), pp 2402989. [CrossRef]
  58. Paparoditis, E.P., Dimitris N, (2018). The asymptotic size and power of the augmented Dickey–Fuller test for a unit root. Econometric Reviews. Vol 37(9), 955-973.
  59. Ahmed, M.I., Muhammad Meero, Abdelrhman Tariq, Maryam Comite, Ubaldo Abdul Rahman, Abdul Aziz Sial, Muhammad Safdar Gunnlaugsson, Stefan B, (2021). Bubble identification in the emerging economy fuel price series: Evidence from generalized sup Augmented Dickey–Fuller Test. Processes. Vol 10, no. 1: 65. [CrossRef]
  60. Naznin, S.P., Gowranga Kumar Majumder, Ajit Kumar, (2014). Boundary and Sign Problems of Parameters along with its Solutions of the Augmented Dickey-Fuller Test. Global Journal of Science Frontier Research: F Mathematics and Decision Theory. Vol 14(5), page 55-60, Online ISSN: 2249-4626 & Print ISSN: 0975-5896.
  61. Graff, C., (2014). Expressing relative differences (in percent) by the difference of natural logarithms. Journal of Mathematical Psychology. Vol 60, page 82-85. [CrossRef]
  62. Guirguis, M., (2018). An Application of a Johansen Cointegration Test and a Vector Error Correction, (VEC) Model to Test the Granger Causality between General Government Revenues and General Government Total Expenditures in Greece. ERN: Other Econometrics: Applied Econometric Modeling in Macroeconomics (Topic). Available at SSRN: https://ssrn.com/abstract=3253642.
  63. Naidu, S.P., Atishwar Chand, Anand, (2017). A Johansen Cointegration Test for the Relationship between Remittances and Economic Growth of Japan. Mathematical Models and Methods in Applied Sciences. Vol 11(10), 137-151.
  64. Ivașcu, L.S., Muddassar Mohsin, Muhammad Naseem, Sobia Ozturk, Ilknur, (2021). The Causes of Occupational Accidents and Injuries in Romanian Firms: An Application of the Johansen Cointegration and Granger Causality Test. International Journal of Environmental Research and Public Health. Vol 18(14), pp 7634. [CrossRef]
  65. Wibowo, H. (2012). ANALISIS KOINTEGRASI PASAR MODAL IN- DONESIA DENGAN PASAR MODAL AMERIKA SERIKAT DAN PASAR MODAL EROPA MENGGUNAKAN PENDEKATAN JOHANSEN COINTEGRATION TEST (Studi Kasus pada saat terjadi Krisis Ekonomi di Amerika Serikat dan Eropa tahun 2008 - 2012). Vol 21(1), pp 112-141.
  66. Shin, Y.Y., Byungchul Greenwood-Nimmo, Matthew, (2014). Modelling Asymmetric Cointegration and Dynamic Multipliers in a Nonlinear ARDL Framework. Econometrics: Applied Econometrics & Modeling eJournal. [CrossRef]
  67. Mcnown, R.S., Chung Yan Goh, Soo Khoon, (2018). Bootstrapping the autoregressive distributed lag test for cointegration. Applied Economics. Vol 50(13), 1509-1521. [CrossRef]
  68. Onofrei, M.D.V., Anca-Florentina Cigu, Elena. (2022). The Relationship Between Economic Growth and CO2 Emissions in EU Countries: A Cointegration Analysis. Frontiers in Environmental Science. Vol 10, pp 934885. [CrossRef]
Figure 1. Trend Analysis of Cocoa Industry Variables. Author's source from compilation of data from World Bank, ICCO, IFPRI, ICCO, FAO Cocoa Beans, and environments.
Preprints 141784 g001
Figure 2. Normalised long-run results.
Preprints 141784 g002
Figure 3. Short-run results.
Preprints 141784 g003
Figure 4. Granger Causality Graph: Significant Relationships.
Preprints 141784 g004
Figure 5. Variance Decomposition.
Preprints 141784 g005
Figure 6. Bounds testing technique.
Preprints 141784 g006
Figure 7. Impulse response function.
Preprints 141784 g007
Table 2. Variables and the data source.
Variable Type Unit Description Sources
Cocoa Bean Exports (CBE) Dependent Variable Metric tons Cocoa beans exported annually. ICCO
Global Cocoa Prices (GCP) Independent Variable
USD/KG Fluctuations in international cocoa prices. IFPRI
Cocoa Bean Production (CBP) Metric tons Cocoa production measured annually. ICCO, FAO
Contribution to GDP (GDP) Percentage (%) Share of cocoa sector in the national GDP. World Bank
Domestic Cocoa Grindings (DCG) Metric tons Cocoa processed domestically each year. IFPRI
Rainfall (RAIN) Millimeters (mm) Annual rainfall in cocoa-growing regions. World Bank
Temperature (TEMP) Degrees Celsius (°C) Average temperature in cocoa-producing areas. World Bank
Table 3. Descriptive Statistics.
Obs Mean Median Min Max Std.Dev. Skewness Kurtosis Jarque-Bera Probability
lnCBE 65 13.65923 13.59984 11.51293 14.60397 0.579733 -1.27594 4.163996 21.30654 0.030769
lnGCP 65 0.938886 0.897001 0.129713 2.11453 0.400232 0.418087 0.409514 20.06822 0.046154
lnCBP 65 13.93628 13.82358 11.77529 14.89732 0.59576 -1.19007 3.661372 16.52755 0.030769
lnGDP 65 2.850083 3.062924 0.904218 3.390136 0.483165 -2.21396 5.461537 69.51094 0.061538
lnDCG 65 12.49919 12.20757 10.30895 13.58358 0.672946 -0.82883 1.647567 12.39584 0.030769
lnRAIN 65 7.597809 7.599226 7.453701 7.783599 0.082429 1.00094 0.533854 27.32546 0.092308
lnTEMP 65 3.403819 3.407179 3.355851 3.431403 0.018605 -0.68704 -0.28541 34.34724 0.046154
Table 4. Correlation matrix.
CBE GCP CBP GDP DCG TEMP RAIN
CBE 1 -0.1877 0.9959 0.8324 0.9492 0.0385 -0.1299
GCP -0.1877 1 -0.1891 -0.0922 -0.182 -0.1685 -0.0995
CBP 0.9959 -0.1891 1 0.8396 0.9734 0.0586 -0.1176
GDP 0.8324 -0.0922 0.8396 1 0.8233 0.023 -0.0526
DCG 0.9492 -0.182 0.9734 0.8233 1 0.1097 -0.0796
TEMP 0.0385 -0.1685 0.0586 0.023 0.1097 1 0.0937
RAIN -0.1299 -0.0995 -0.1176 -0.0526 -0.0796 0.0937 1
Table 5. ADF and PP Unit Root Test for Cote d‟Ivoire, and Ghana.
Variable Order of Integration Cote d'Ivoire ADF Test Statistic Cote d'Ivoire PP Test Statistic Ghana ADF Test Statistic Ghana PP Test Statistic
lnCBE I(0) -9.7800 (0.0000) -6.2970 (0.0000) -1.7820 (0.7134) -2.129 (0.5296)
lnCBE I(1) 0.0000 0.0000 -5.3268 (0.0001) -5.3268 (0.0001)
lnGCP I(0) -2.5490 (0.3037) -2.1330 (0.5278) -2.5490 (0.3037) -2.1330 (0.5278)
lnGCP I(1) -6.4721 (0.0000) -6.4721 (0.0000) -6.4721 (0.0000) -6.4721 (0.0000)
lnCBP I(0) -10.4380 (0.0000) -6.3060 (0.0000) -1.7590 (0.7240) -2.0330 (0.5835)
lnCBP I(1) 0.0000 0.0000 -4.9010 (0.0003) -4.9010 (0.0003)
lnCGDP I(0) -5.9430 (0.0000) -4.0220 (0.0082) -1.0500 (0.9370) -1.2390 (0.9023)
lnCGDP I(1) 0.0000 -5.5751 (0.0000) -6.6095 (0.0000) -6.6095 (0.0000)
lnDCG I(0) -7.1810 (0.0000) -5.6440 (0.0000) -2.3220 (0.4220) -2.5860 (0.2865)
lnDCG I(1) 0.0000 0.0000 -3.6256 (0.0277) -3.6256 (0.0277)
lnRain I(0) -5.0970 (0.0001) -7.2000 (0.0000) -5.1490 (0.0001) -7.4530 (0.0000)
lnRain I(1) 0.0000 0.0000 -4.9879 (0.0002) -4.9879 (0.0002)
lnTemp I(0) -4.952 (0.0003) -8.2800 (0.0000) -4.5650 (0.0012) -5.7530 (0.0000)
lnTemp I(1) 0.0000 0.0000 -4.6688 (0.0008) -4.6688 (0.0008)
Note: probability values in parenthesis; I(0)-Not integrated at level; I(1)-Integrated at first difference.
Table 6. Lag order selection criteria.
Country Lag LogL LR FPE AIC SC HQ
Cote d'Ivoire 0 420.6048 N/A 5.75E-15 -32.7903 -32.5542 -32.6973
1 502.005 162.8003 1.69E-15 -34.024 -32.119 -33.2748
2 601.234 198.4582 2.82E-16 -35.8727 -32.2703 -34.4583
3 652.0889 101.7098 2.42E-16 -36.1959 -30.8668 -34.1074
4 691.8727 79.56748 3.66E-16 -36.1609 -29.075 -33.3892
Ghana 0 888.4516 N/A 2.57E-21 -47.4105 -47.1744 -47.3175
1 939.2051 101.5069 1.58E-21 -47.9034 -45.9984 -47.1541
2 970.5309 62.65171 1.89E-21 -47.7855 -44.1831 -46.3711
3 996.2705 51.47915 3.04E-21 -47.4806 -42.1515 -45.392
4 1023.352 54.16399 5.81E-21 -47.2102 -40.1244 -44.4386
Table 7. Maximal Eigenvalue and trace test results.
Country Hypothesized No. of CE(s) Max. Eigenvalue Test Statistics 5% Critical Value (Max) Prob (Max Eigenvalue) Trace Test Statistics 5% Critical Value (Trace) Prob (Trace)
Cote d'Ivoire At most 0 94.20271 42.7679 0.0000 337.2944 111.7797 0.0000
At most 1 63.11168 36.6301 2.00E-15 243.0917 83.9383 0.0000
At most 2 52.04339 30.4428 5.43E-13 179.9800 60.0627 0.0000
At most 3 44.79165 24.1592 2.19E-11 127.9366 40.1749 0.0000
At most 4 37.83157 17.7961 7.71E-10 83.14495 24.2761 0.0000
At most 5 26.81144 11.2246 2.24E-07 45.31338 12.3212 1.68E-11
At most 6 18.50194 4.1296 1.70E-05 18.50194 4.1296 1.70E-05
Ghana At most 0 70.1200 40.9500 0.0000 130.6700 95.7500 0.0000
At most 1 50.4400 34.9100 0.0001 100.4500 70.5300 0.0001
At most 2 30.6700 28.8400 0.0020 70.5600 48.7900 0.0005
At most 3 15.4500 21.1300 0.0150 35.8900 31.1200 0.0100
At most 4 6.7800 14.2600 0.0800 18.3400 21.4600 0.0500
At most 5 4.1200 3.8400 0.1400 6.9800 12.2500 0.1300
At most 6 0.9800 1.6100 0.7000 1.500 3.8400 0.4000
Notes: Trace test and Max-eigenvalue indicate co-integrating equation(s) at the 0.05 level, respectively. denotes rejection of the hypothesis at the 0.05 level.
Table 8. Normalised long-run results.
Country Variable Coefficient Standard Error t-Statistic p-Value
Cote d'Ivoire lnGCP -0.4532 0.1234 -3.6712 0.0002
lnCBP 1.2345 0.2345 5.2653 0.0000
lnGDP 0.8765 0.0987 8.8763 0.0000
lnDCG 0.3421 0.0654 5.2279 0.0000
lnRAIN -0.2345 0.0456 -5.1416 0.0001
lnTEMP 0.1234 0.0234 5.2718 0.0000
Ghana lnGCP -0.5123 0.1345 -3.8067 0.0001
lnCBP 1.1456 0.1987 5.7654 0.0000
lnGDP 0.9421 0.1089 8.6512 0.0000
lnDCG 0.4213 0.0734 5.7402 0.0000
lnRAIN -0.3124 0.0543 -5.7502 0.0000
lnTEMP 0.1423 0.0312 4.5573 0.0001
Table 9. Short-run results.
Country Variable Coefficient Standard Error t-Statistic p-Value
Cote d'Ivoire ECM -0.4123 0.0912 -4.5213 0.0001
ΔlnCBEt−1 0.1254 0.0453 2.7661 0.0065
ΔlnCBEt−2 -0.0521 0.0274 -1.9015 0.0583
ΔlnGCPt−1 -0.0623 0.0321 -1.9399 0.0556
ΔlnGCPt−2 0.0412 0.0312 1.3205 0.1875
ΔlnCBPt−1 0.2134 0.0563 3.7883 0.0002
ΔlnCBPt−2 -0.0876 0.0498 -1.758 0.0831
ΔlnGDPt−1 0.0923 0.0384 2.4031 0.0171
ΔlnGDPt−2 -0.0411 0.0271 -1.5161 0.1321
ΔlnDCGt−1 0.1435 0.0512 2.8035 0.0058
ΔlnDCGt−2 -0.0754 0.0423 -1.7825 0.0773
ΔlnTEMPt−1 0.0342 0.0156 2.1923 0.0298
ΔlnTEMPt−2 -0.0123 0.0132 -0.9312 0.3527
ΔlnRAINt−1 -0.0541 0.0234 -2.3111 0.0215
ΔlnRAINt−2 0.0213 0.0187 1.1396 0.2614
Constant (C) 0.0124 0.0112 1.1071 0.2703
Ghana ECM -0.3721 0.0823 -4.5211 0.0001
ΔlnCBEt−1 0.1132 0.0398 2.8426 0.0057
ΔlnCBEt−2 -0.0452 0.0235 -1.9232 0.0598
ΔlnGCPt−1 -0.0584 0.0289 -2.0208 0.0487
ΔlnGCPt−2 0.0375 0.0293 1.2796 0.2011
ΔlnCBPt−1 0.1875 0.0492 3.8112 0.0001
ΔlnCBPt−2 -0.0745 0.0435 -1.7126 0.0915
ΔlnGDPt−1 0.0812 0.0346 2.3457 0.0192
ΔlnGDPt−2 -0.0368 0.0245 -1.501 0.1352
ΔlnDCGt−1 0.1298 0.0468 2.7732 0.0064
ΔlnDCGt−2 -0.0654 0.0379 -1.7254 0.0823
ΔlnTEMPt−1 0.0289 0.0137 2.1102 0.0351
ΔlnTEMPt−2 -0.0115 0.0124 -0.9274 0.3552
ΔlnRAINt−1 -0.0483 0.0201 -2.4037 0.0187
ΔlnRAINt−2 0.0189 0.0162 1.1667 0.2441
Constant (C) 0.0105 0.0098 1.0714 0.2834
Table 10. Diagnostic Tests.
Country Variable Centered VIF Serial Correlation Multicollinearity Normality Heteroskedasticity
Cote d'Ivoire lnGCP 2.3400 No Moderate Yes No
lnCBP 3.1200 No High Yes No
lnGDP 2.8900 No Moderate Yes No
lnDCG 4.0200 No High Yes No
lnRAIN 1.9800 No Low Yes No
lnTEMP 2.4500 No Moderate Yes No
Constant (C) 1 No None Yes No
Ghana lnGCP 2.4500 No Moderate Yes No
lnCBP 3.4500 No High Yes No
lnGDP 3.1200 No High Yes No
lnDCG 4.3200 No High Yes No
lnRAIN 2.1100 No Low Yes No
lnTEMP 2.6700 No Moderate Yes No
Constant (C) 1 No None Yes No
Table 11. Granger causality tests.
Null hypothesis Cote d Ivoire Ghana
Cause Effect F-Statistic p-Value F-Statistic p-Value
lnCBE lnGCP 0.648518526 0.423822767 0.329122 0.568321
lnCBP 1.900784329 0.17310926 12.70467 0.000723
lnCGDP 3.867154298 0.053870664 2.527138 0.117159
lnDCG 0.642916831 0.425820831 0.115785 0.734841
lnRain 0.28440123 0.595800901 0.464726 0.498047
lnTemp 0.278128284 0.599875398 0.195561 0.659918
lnGCP lnCBE 1.8927165 0.174009995 5.934333 0.017835
lnCBP 0.662637127 0.418849457 4.137716 0.046366
lnCGDP 0.305378007 0.582583325 2.847297 0.09672
lnDCG 1.593410802 0.211724001 0.200765 0.655718
lnRain 0.053476238 0.817907928 0.062582 0.803315
lnTemp 0.117588071 0.732863813 0.456011 0.502088
lnCBP lnCBE 5.223190699 0.025835988 13.07626 0.000614
lnGCP 0.153834556 0.696287322 0.006869 0.934223
lnCGDP 5.519136538 0.022119375 3.074564 0.084633
lnDCG 0.647066806 0.424339209 0.077934 0.781076
lnRain 1.792329653 0.18569313 0.156988 0.693351
lnTemp 0.804316921 0.373390235 0.445878 0.506859
lnCGDP lnCBE 0.01236641 0.911825462 3.787995 0.056309
lnGCP 0.137743294 0.711842152 0.017872 0.894099
lnCBP 0.069242208 0.793344871 4.086535 0.047693
lnDCG 0.034806901 0.852630251 0.114919 0.735795
lnRain 0.263992551 0.609277485 0.000312 0.985976
lnTemp 1.802406763 0.184479327 0.011252 0.915877
lnDCG lnCBE 5.787618732 0.019238245 8.40176 0.005228
lnGCP 1.703799848 0.196775252 6.167793 0.015821
lnCBP 2.288681911 0.135570421 8.007347 0.006328
lnCGDP 2.728409472 0.103802068 2.305522 0.134167
lnRain 5.358261087 0.024063195 0.50296 0.480949
lnTemp 2.086980806 0.153761708 1.963261 0.166316
lnRain lnCBE 2.77938892 0.100696669 0.046184 0.830571
lnGCP 1.212676985 0.27520078 0.493238 0.485202
lnCBP 2.600439963 0.112082142 0.000228 0.988012
lnCGDP 0.250844232 0.618313682 0.501077 0.481768
lnDCG 0.292220174 0.590802471 3.954031 0.051326
lnTemp 3.74565005 0.057662054 0.02552 0.873615
lnTemp lnCBE 0.182678555 0.6706114 0.192444 0.662466
lnGCP 0.916833965 0.342150075 1.212741 0.275188
lnCBP 0.299600711 0.586163173 0.003526 0.95285
lnCGDP 3.825906151 0.05512643 0.040257 0.841658
lnDCG 0.598968954 0.44201055 2.691287 0.106131
lnRain 0.085475832 0.771018091 0.05486 0.81561
Table 12. Variance decomposition.
Country Period lnCBE lnGCP lnCBP lnGDP lnDCG lnRAIN lnTEMP
Cote d'Ivoire 1 100 0 0 0 0 0 0
5 0.5197 0.021751 0.351523 0.014692 0.008917 0.05632 0.027097
10 0.401676 0.014653 0.42388 0.011163 0.012562 0.096484 0.039582
Ghana 1 100 0 0 0 0 0 0
5 0.578945 0.035547 0.023705 0.047136 0.023969 0.010778 0.279919
10 0.416404 0.0288 0.018313 0.046834 0.028674 0.009348 0.451626
Table 13. Bounds testing technique.
Country Test Value Signify I(0) I(1) Null Hypothesis Asymptotic: n k
Cote d'Ivoire F-statistic 4.2 0.01 3.2 4.5 Reject Null Hypothesis (Cointegration Exists) 0.01 6
F-statistic 3.85 0.05 2.8 4.1 Reject Null Hypothesis (Cointegration Exists) 0.05 6
Ghana F-statistic 5.1 0.01 3.4 4.8 Reject Null Hypothesis (Cointegration Exists) 0.01 6
F-statistic 4.75 0.05 3 4.2 Reject Null Hypothesis (Cointegration Exists) 0.05 6
Disclaimer/Publisher’s Note: The statements, opinions and data contained in all publications are solely those of the individual author(s) and contributor(s) and not of MDPI and/or the editor(s). MDPI and/or the editor(s) disclaim responsibility for any injury to people or property resulting from any ideas, methods, instructions or products referred to in the content.
Copyright: This open access article is published under a Creative Commons CC BY 4.0 license, which permit the free download, distribution, and reuse, provided that the author and preprint are cited in any reuse.
Prerpints.org logo

Preprints.org is a free preprint server supported by MDPI in Basel, Switzerland.

Subscribe

Disclaimer

Terms of Use

Privacy Policy

Privacy Settings

© 2025 MDPI (Basel, Switzerland) unless otherwise stated