
Submitted:
19 May 2025
Posted:
19 May 2025
You are already at the latest version
Abstract
This study aimed to examine measures of dynamic balance during a single turn en dehors pirouette in healthy female amateur ballet dancers. Four participants performed pirouettes until five successful pirouettes were achieved without hopping or loss of balance. The center of mass (CoM), extrapolated center of mass (XCoM), center of pressure (CoP), and base of support (BoS) were determined using ground reaction forces recorded from floor-embedded force plates and the motion trajectories of anatomical reflective markers based on modified Plug-in Gait and Oxford Foot models. The CoM, XCoM, CoP, and BoS were determined throughout the turn phase using a laboratory and virtual left (LFT) foot coordinate system located in the dancer’s stance foot. Two calculations were used to measure the margin of stability (MoS), the distance between the: 1) XCoM and CoP and 2) XCoM and BoS. Both methods resulted in similar distances, with a smaller distance between the components along the antero-posterior axis (AP) of the virtual LFT foot coordinate system and a greater distance along the medio-lateral (ML) axis throughout the turn phase. Both measurements of the MoS demonstrated increased distances at the beginning and end of each turn, and the least distance during the middle of the turn phase. The topple angle was greater at the beginning and end of the turn phase and minimized during the middle period of the turn. Since this study included healthy dancers and only analyzed successful turns, the variability between trials within a dancer and across participants and trials was documented and showed moderate inter-trial and across-participant variations. Although our results are preliminary, they suggest that the MoS may be useful for detecting faults in the control of dynamic balance of dehors pirouette performance as part of training and rehabilitation following injury.
Keywords:
ballet
; pirouette
; inverted pendulum model
; margin of stability
; center of mass
; extrapolated center of mass
; base of support
; center of pressure
1. Introduction
The pirouette is a fundamental movement in classical ballet. In this turn, the dancer balances on a single limb while on the toes (pointe) or is on the ball of the foot (demi-pointe) and revolves once or multiple times around a pivot axis through the stance leg [1]. A pirouette is classified by the direction the turn is initiated. The direction most often seen in classical ballet choreography, and research is the en dehors pirouette. This means the dancer rotates outward, away from the stance leg. A pirouette can also be performed in en dedans by rotating inwards, toward the stance leg. In either turn, the leg used in push-off is lifted from the ground and held in a retiré position (Figure 1.1).
A pirouette consists of two phases (Figure 1.1), a turn initiation phase and a turn phase. The turn initiation phase consists of the dancer’s mass shifting in preparation for the turn while supported in a static double-leg stance in the 4th or 5th position [1,2]. In the 4th position, one foot rests about 12 inches in advance of the other, both are turned out, and the weight is divided between them; whereas, in the 5th position, the feet are turned out and pressed closely together, the heel of the one foot against the toe of the other. The turn phase is performed in a single-leg stance while the dancer completes one or more rotations at the pivot point through the stance leg, usually on the metatarsal heads 2]. During this phase, the turn leg works in an open kinematic chain, while the stance leg works in a closed kinematic chain and helps to control posture [3].
When studying the body’s reactions to maintain balance, the inverted pendulum model (IPM) has been used to describe the control of the center of mass (CoM) about a fixed base of support (BoS) [4,5]. Lower extremity muscles are recruited to shift the center of pressure (CoP), which helps to maintain the CoM within the BoS [4]. The CoM is controlled in the sagittal plane by the ankle dorsi-/plantar flexor muscles and in the frontal plane by the hip abductor/adductor and ankle invertor/evertor muscles, leading to a change in the CoP as a reaction to these adjustments, i.e., changes in the position of the CoP is the central nervous system’s response to internal and external perturbations [4]. Research findings reported by Winter et. al. and Gage et. al demonstrated that the difference between the location of the CoM to the CoP, when projected on the ground (Figure 1.2), would be positively related to the horizontal acceleration of body CoM [4,5]. Therefore, as the horizontal acceleration of the CoM increases during a task the distance between the CoP and CoM will increase, and vice versa. The IPM model has only recently been applied to the study of ballet. Lott applied the model to investigate how the number of rotations during a pirouette affected dynamic balance. She found it to be beneficial as a reference model, however, the intermediate-advanced dancers in her study revealed that their BoS, i.e., CoP, shifted to maintain balance during their turns [6]. These findings differ from the traditional IPM due to the dynamic nature of a pirouette. The righting strategies associated with the IPM are based on a fixed BoS whereas the pirouette is a dynamic movement with dynamic righting strategies with potential for an unstable BoS.
When performing the pirouette, the BoS transitions from a double-leg stance to a single-leg stance which greatly decreases the area within the BoS. Therefore, an en dehors pirouette requires the body’s CoM to shift toward the stance leg during the turn initiation phase to allow the body’s CoM to remain centered over the stance leg during the turn phase [2]. Velocity is generated during the turn initiation phase to bring the dancer up onto their stance leg and to spin the body around for the desired number of revolutions. Generally, to maintain balance the CoM must stay within the BoS, but there are other factors involved in maintaining dynamic balance. According to Hof et al. [7], if the velocity of the CoM was directed outward then balance may be lost even if the individual was over the BoS, and if one’s CoM was outside of the BoS but their velocity was directed inward then balance may be maintained. This effect of an individual’s velocity of their CoM during a dynamic movement was expressed as the extrapolated center of mass (XCoM), which is the velocity-adjusted position of the CoM [8]. Applying this concept to investigate turns performed by ballet dancers makes intuitive sense. In generating enough velocity to perform the pirouette, a dancer must also be able to control the direction of their velocity to remain balanced during their turn. It has been shown that changes in the relative positions of the CoP and XCoM are useful tools in the examination of balance and its perturbation [8].
The distance between the XCoM and the dancer’s BoS that still allows them to maintain their balance and successfully complete their pirouette has been defined as the margin of stability (MoS) [8]. The MoS is determined as a time series throughout the movement and is the deviation of the XCoM from the BoS; its magnitude provides a metric of the dancer's dynamic balance. The MoS is thought to be proportional to the impulse needed to unbalance a participant [7]. The MoS could be related to the amount of self-generated impulse or disruption of balance a dancer experiences during the turn initiation or turn phase of their pirouette. Traditionally, the IPM has been applied to study quiet standing postures, i.e., a static BoS [4,5]. However, using the IPM as a framework and based on extensive use of the MoS in biomechanics research [9], the CoP, BoS, and XCoM metrics could also provide insight related to the dynamics of dance.
When there is a disruption in balance while walking (i.e., an obstacle, shortened step length, or external push), the person compensates while stepping to regain balance [8]. The same thing happens with dancers. For example, if there is a disturbance in the turn initiation phase the dancer will compensate for that disturbance using a hop, allowing their stance foot to travel, or by moving the trunk. Likewise, when attempting to perform multiple revolutions during a pirouette the body’s center of mass faces more challenges related to the number of turns that require compensatory actions. The initial direction of the velocity of the CoM and the ability to maintain balance could be a factor in the success of the pirouette. Since the MoS is a function of the excursion of the XCoM from the BoS this distance will determine if compensation is needed and to what extent. If the dancer has a minor loss of control associated with a small MoS they may be able to correct with muscular actions, but if they experience a larger internal or external disturbance they will likely need to hop or will fall out of a turn.
At key points during a pirouette muscle activation in the trunk, pelvis, and upper and lower extremities during both phases of the pirouette also affects the relationship between CoM and BoS to maintain balance. The hip and ankle/foot of the stance leg are two joint complexes that play important roles in controlling dynamic balance. The position and kinetics of the hip joint appear to be a vital component in both the generation of momentum and control of the CoM during a pirouette. Zaferiou et al. [10] found that the net angular and linear impulse generation during the turn initiation phase tended to be greater during pirouettes initiated with hip external rotation. The hip also plays an important role on the upper body during a pirouette. During the start of the double stance phase, the hip joint moments appear to be the main contributor to generating the angular momentum of the upper body [11]. Therefore, as the hip complex and surrounding muscles influence multiple regions of the body, intuition suggests that it is an important factor in whether or not the turn is successful. The use of the IPM to study the pirouette is relevant because the knee of the stance limb is in a relatively close-packed position in extension during the turn phase, so the motion is mainly controlled by key hip and ankle muscles.
In ballet, the topple angle refers to the planar angle between the vertical and a line connecting the dancer’s CoM to the center of the BoS at the floor [6]. Zaferiou et al. [12] found that for dancers the topple angle, on average, was five degrees during the turn phase of double and single pirouettes. One can only remain balanced during a pirouette if the topple angle is small enough that neural control mechanisms can make the needed corrections; however, if the topple angle increases the dancer will likely have to resort to a hop or end their turn [13]. It has been shown that the topple angle decreases as the number of turns increases with a significant difference in the topple angle between the single and triple turn conditions for elite dancers [1]. Using the IPM as a framework the topple angle associated with the pirouette might provide additional insight into its relationship with the CoP, CoM, XCoM, and MoS, and control mechanisms of successful and unsuccessful single- and multiple-turn pirouettes.
The margin of stability has been used extensively to measure dynamic control in individuals who are prone to falls [14], have Parkinson’s disease [15,16,17], have multiple sclerosis [18,19], had a stroke [20,21], or have had an amputation [22,23,24]. To our knowledge, the use of measures of dynamic balance within a framework of the IPM, to examine the margin of stability during the pirouette is minimal. Tsubaki et al. [25] examined the coordination of laterality, i.e., limb preference in turn initiation, in professional and amateur ballet dances performing a single pirouette in pointe shoes. For both groups, they found no difference in the CoM-CoP inclination (i.e., toppling) angle between limbs, but noted that amateurs had a greater anterior tilt during left rotation. Professionals showed a slight difference in hop-up time during right versus left turns. In a related study, Tsubaki et al. [26] measured differences in the rotation axis between professional and elite amateur ballet dancers during an en dehors pirouette with pointe shoes. They reported that professional dancers exhibited a reduced posterior inclination angle and hop-up time during single-leg support in mid-swing (or mid-turn) phase. Lott [6] examined the ability of healthy, adolescent female dancers to perform as many revolutions in each pirouette as they were capable of doing. Her primary purpose was to evaluate the relationship between specific anthropometric and kinematic variables and the number of successful turns, i.e., n, a dancer could perform. She hypothesized that the prediction of large-n pirouettes would be initiated in a more balanced position, i.e., smaller initial topple angle, or with a larger initial MoS than pirouettes with a reduced n. However, only the normalized BoS distance traveled per revolution was significantly related to n. Despite Lott’s limited use of the MoS previous research has shown that this metric usefully provides insight into activities that require dynamic balance, e.g., gait, stepping over obstacles, etc. [9]. Furthermore, the determination of the MoS metric in healthy elite dancers could provide valuable information that would assist ballet instructors, professional dancers, and collegiate dancers in practice and performance as they work to perfect the control of their pirouettes. Therefore, the purpose of this research was to determine the margin of stability as a measure of dynamic balance during a single turn en dehors pirouette in female amateur ballet dancers. We aimed to examine these variables in normal, healthy dancers to begin to create a normative database that could be used to improve performance, evaluate abnormal mechanics in ballet dancers, and assist in the prevention of ballet-related injuries.
2. Materials and Methods
2.1. Participants
Participants were recruited by their response to an email sent out to professional dance companies, pre-professional companies, and dance studios in West Michigan within a 100-mile radius of a local university and other colleges in Michigan with dance programs. Ten dancers responded, and five met the inclusion criteria and participated in data collection; they were all amateurs . Participant #4 was unable to complete turns without hopping so her data were not analyzed.
Participants were included if they were healthy elite amateur or professional ballet dancers between 18-40 years old, which was determined based on a medical history and physical examination; no professional dancers were included. Individuals were excluded if they had: 1) a significant medical condition or a neurological condition, 2) a significant orthopaedic injury to the spine, upper, or lower extremities within the past 12 months, 3) reconstructive joint surgery, 4) they were pregnant, or 5) if they were unable to complete a triple pirouette from 4th position. Before the recruitment of participants and data collection, this study was reviewed and approved by the Office of Research Compliance and Integrity and the Institutional Review Board (19-296-H). Oral and written informed consent was obtained from all the dancers before all activities related to the project.
2.2. Instrumentation and Experimental Procedures
Marker trajectories were recorded using 16 Vicon MX-T40 cameras at 120 Hz and Nexus motion capture software v2.81 (Vicon Motion System Ltd., Oxford Metrics, UK). Motion data were synchronized with ground reaction forces (GRFs) collected from two force plates (FPs) (1200 Hz) embedded in the laboratory floor (Advanced Mechanical Technology, Inc., Watertown, MA). To prevent slipping Marley flooring was secured to the surface of FPs three and five. Before data collection, the motion capture area was calibrated at a length of 10m, width of 2m, and height of 2m, and the volume origin of the laboratory coordinate system (LCS) was set at the corner of FP2 (Figure 2.1).
Marker placement was consistent with modified full-body Plug-in Gait (PiG) and Oxford Foot models (OFM) [27,28,29,30]. Unilateral markers included: spinous processes of C7 and T10, clavicle (jugular notch), xiphoid process at distal sternum, and right back at the midportion of the right scapula. Markers placed bilaterally included: the front (temples) and back of the head (level with the front markers), acromioclavicular joint, cluster of three markers placed on the upper lateral surface of humerus, lateral epicondyle, lower lateral surface of forearm, radial styloid process, ulnar styloid process, head of 3rd metacarpal joint in hand, bilateral anterior superior iliac spines (the accuracy of ASIS marker placement was verified by the distance between the ASISs (mid-sphere to mid-sphere) as measured by the anthropometric measure made on the examination table), bilateral posterior superior iliac spines, mid-lateral thigh, lateral and medial femoral epicondyles (flexion-extension axis of the knee), mid-lateral shank, head of fibula, tibial tuberosity, anterior aspect of mid-shank, lateral and medial malleoli, heel (posterior end of calcaneus), posterior calcaneus proximal, lateral calcaneus, sustentaculum tali, distal and proximal 1st metatarsal, distal and proximal 5th metatarsal, toe (between 2nd and 3rd metatarsal heads), and hallux. The PiG model was modified by placing markers on the medial femoral condyle and medial malleolus. This method was used in place of the knee alignment device. Using the medial markers on the femoral condyle and malleolus can improve the location of knee and ankle joint centers, as well as define the longitudinal torsional profiles of the thigh and shank. To ensure repeatable rearfoot marker placements the lateral and medial calcaneal markers were placed the same linear distance from the heel marker (as measured from center-to-center of the marker spheres by a short centimeter ruler); all three markers were placed at the same height (from center of marker spheres) from the floor. The OFM was also modified to not include the bilateral CPG marker (i.e., peg marker on the posterior end of the calcaneus) due to the increased likelihood of it being displaced or interfering with foot placement of the turning foot while in retiré. Accurate and consistent marker placement was assured by having only one researcher, verified by the laboratory director, place markers for all test sessions.
Data collection was performed at the University Biomechanics and Motor Performance Laboratory. Before testing, the participants’ health assessment included: a medical history and a physical examination that consisted of range of motion, muscular strength tests, and anthropometric measures that were performed by a graduate student, under the supervision of the principal investigator. Anthropometric measurements included body mass, height, leg lengths, inter-ASIS distance, ankle and knee widths, elbow and wrist width, hand thickness, hip rotation, and tibial torsion. An anthropometer was used to determine the inter-ASIS distance, ankle and knee widths, elbow and wrist width, and hand thickness measures. A tape measure was used for leg length measurements [31,32]. Physical examination and anthropometric measurements were performed by the same researcher for each participant. Markers were placed on the body using two-sided, hypoallergenic tape. Extra tape was applied around marker bases to minimize marker movement and prevent detachment. Once the markers were placed, the participants had an opportunity to warm up, including dynamic stretching, to prevent injury and to prepare for data collection. To best expose relevant anatomy for marker placement, participants wore tight shorts and a sports bra.
2.3. Protocol
Initial data collection included a static standing calibration trial that was used to establish the participant pose, location of anatomical and technical markers, and joint centers. For the static data collection trial, participants stood in an anatomical position with feet shoulder-width apart, knees slightly bent, and arms slightly abducted for four seconds. The static trial was followed by a walking trial which was fully processed to verify marker placement accuracy and to compare the accuracy of the knee frontal and transverse plane kinematics to the laboratory’s control data set. In the walking trial, participants traversed the calibrated volume along the positive y-axis (see the LCS in Figure 2.1).
During data collection of the pirouette participants faced in the negative-x direction (relative to the laboratory coordinate system), with both feet on FP5 (Figure 2.1). In preparation for the turn phase the dancers placed their right leg laterally (positive-y), then posteriorly (positive-x) onto FP3. The turn phase began when the right leg moved off FP3 (toe off) and ended when the right leg made ground contact on or near FP3 (toe touch). Participants were allowed time to practice their turns to become comfortable with the floor surface and attached markers. A verbal cue was given to the dancer to execute the pirouette. Two pirouette conditions were tested: 1) one-turn and 2) three-turns, both initiated from 4th position. The order of the turn trials was randomly assigned at the beginning of each participant’s session to decrease the carry-over effect of fatigue and increase trial consistency. Participants were given 30 seconds in between each attempted pirouette. The turns were considered successful if the participant executed the desired number of turns without hopping on their stance leg on the force plate surface area within toe-off and toe-touch on or near FP3. Both one- and three-turn conditions were performed until five successful trials were captured for each condition. For this study, only data from the single-turn pirouette was analyzed. Of the five successful single-turn trials for each participant, three were analyzed based on the following criteria: 1) the stance leg having maintained contact with the FP5, 2) the greatest amount of time spent in demi-pointe, and 3) the least translation of the BoS across the force plate throughout the turn phase.
2.4. Data Analysis
2.4.1. Data Reduction
Raw marker trajectory and ground reaction force data were reduced using Vicon Nexus v2.8.2. Trajectory data were smoothed using a Woltring filter (MSE 15), and raw ground reaction force data were filtered with a 4th-order, zero-lag Butterworth (high pass cut-off 10 Hz). Nexus dynamic pipelines were used to determine joint kinematics and kinetics, and pirouette cycle events, i.e., initial toe touch, toe off (i.e., turn initiation), and second toe touch. These data were exported to Visual3D biomechanics software (C-Motion Inc., Germantown, MD) for recreating the PiG and Oxford foot models and data reduction. The PiG model was modified by using Harrington’s predictive equations to determine the hip joint center [33]. Using a 15-link biomechanical model, the total body CoM was defined as the center of mass in three-dimensional space and was computed as the weighted average of each body segment’s CoM. The velocity of the CoM was estimated using a first order difference formula [34,35].
The primary variables of interest included the: 1) CoM-CoP angle of inclination (i.e., topple angle); 2) anterior/posterior (A/P) and mediolateral (M/L) excursion of the XCoM from the CoP; and 3) A/P and M/L excursion of the XCoM from the BoS center. These variables were determined for a one-turn pirouette from the time of right toe off from FP3 (Figure 2.1) to the time of right toe touch on FP3.
The locations of the CoM and CoP determined in Visual 3D throughout the turn phase were used to calculate the topple angle [6]. The topple angle was the CoM-CoP inclination angle between the vertical projection of the CoM to the ground and a line connecting the CoM to the most lateral position of the CoP (Figure 2.2).
Based on rigid body and IPM assumptions, the XCoM accounted for the projection of the CoM and its horizontal velocity, and was computed as follows:
where ; = angular natural frequency of the pendulum, g = 9.81 m/s, and l = leg length (defined as the distance from the CoM and ankle joint center); was the CoM projected to the floor; and was the instantaneous position and velocity of the body’s CoM [7].
The BoS was described as the BoS center and defined by the head and bases of the 1st and 5th metatarsal anatomical markers and expressed using a virtual foot coordinate system, i.e., virtual LFT left CS, projected to the ground. Based on these four markers two vectors were created: 1) one from the midpoint of the proximal markers to the midpoint of the distal markers and 2) one from the midpoint of the lateral proximal and distal markers to the midpoint of the medial proximal and distal markers. These two vectors intersected at a unique point in between all four markers, and that point was projected to the floor. The point created was labeled the BoS center and was used to define the BoS about which the dancer turned (Figure 2.3).
The margin of stability (MoS) during a one-turn pirouette was determined by the XCoM, the CoP, and the BoS center (defined above) in the virtual LFT foot CS, which necessitated transforming the CoP from the LCS to the virtual LFT foot CS. In the first case, the antero-posterior (A/P) and medio-lateral (M/L) was determined as:
In the second case, the A/P and M/L was determined as:
where MoS was the distance in millimeters (mm) between the XCoM and 1) the CoP and 2) the midpoint boundary, i.e., BoS center. The measurement of the distance in mm between XCoM to the CoP and between the XCoM to the BoS center were determined along the y- (A/P) and x- (M/L) axes in the virtual LFT foot coordinate system (Figure 2.4) hereafter referred to as the A/P and M/L axes.
2.4.2. Statistical Analysis
Statistical analysis was performed using R: A Language and Environment for Statistical Computing (4.4.3) [R Core Team (2025). R Foundation for Statistical Computing, Vienna, Austria. <https://www.R-project.org/>] and JMP Pro 14 software (SAS Institute Inc., Cary, NC). Demographic data (i.e., gender, age, etc.) were analyzed using descriptive statistics (mean and standard deviation). The sample size was too small to warrant use of a nested random design for intra- and inter-participant variation. Instead, simple group means without inferential statistics were calculated for the four margin of stability metrics (mm) along the A/P and M/L axes of the virtual left coordinate system and the topple angle (degrees).
Each measurement throughout each trial’s turn phase was used to calculate the mean absolute measurement for each trial. Intra-participant standard deviation (SD), and coefficient of variation (CV%) were then calculated between the three trial means for each participant and between the four participant means for inter-participant values. The advantages of using this index are twofold: 1) it is independent of the units of measurement, and 2) it expresses the standard deviation as a proportion of the mean, accounting for differences in the magnitude of the mean. Thus, the CV is a measure of relative variability. Examining the CV was used to examine the variation across variables as well as participants. Since the CV is a function of the standard deviation its usefulness may be limited by overly large or small standard deviations when using a small sample size (as in this study).
3. Results
All participants were female elite amateur ballet dancers. The demographic characteristics of the participants included: mean age (24.25 ± 2.05 yrs.), height (162.1 ± 4.12 cm), body mass (54.08 ± 5.94 kg), and BMI (20.51 ± 1.32 kg/m2).
The positions of the CoM, XCoM, and CoP were determined in two coordinate systems: the laboratory coordinate system (LCS) and the virtual LFT foot coordinate system (LFT CS). A representative participant and trial was used to demonstrate the changes in position for all variables and to demonstrate the relationship between the CoM, XCoM, and CoP along the A/P and M/L axes of both coordinate systems. A summary of mean (± 1 SD) data across all participants can be found in Appendix A.
3.1. Excusions of the CoM and XCoM Relative to Laboratory and Left Foot Coordinate Systems
3.1.1. CoM and XCoM Relative to the CoP in the LCS
At the beginning of the turn along the M/L axis, we noted greater excursion of the XCoM away from the LCS origin, i.e., to the right, and beyond the constraint of the CoP. Movement of the CoM was minimal. By approximately 50% of the turn the CoM and XCoM appeared to converge, and both were within the CoP. At about 75% of the turn, we again noted greater excursion of the XCoM. Prior to toe touch, i.e., end of the turn, movements of the CoM and XCoM again converged but were both somewhat beyond the CoP, which moved farther to the right, i.e., a greater distance from the LCS origin (left graph in Figure 3.1).
At the initiation of the turn phase the CoM was more posterior than the XCoM relative to the CoP, along the A/P (or x) axis in the LCS. At midstance the CoM and XCoM appeared to converge and moved anterior. During the final 25% of the turn the CoM and XCoM moved posterior, with greater excursion of the XCoM relative to the CoP. The center of pressure maintained a relatively constant position during the entire turn (right graph in Figure 3.1), more so than its path along the M/L axis.
3.1.2. CoM and XCoM Relative to the CoP in the LFT CS
Along the A/P axis during turn initiation both the CoM and XCoM moved in an anterior direction relative to a relatively stationary position of the CoP. Just prior to 50% stance during the turn phase the CoM and XCoM reached a maximum anterior position and moved slightly beyond the CoP. From midstance to toe touch (100% of stance during the turn phase) both the CoM and XCoM were less anteriorly positioned relative to the CoP; the XCoM exhibited slightly greater excursion than the CoM (left graph in Figure 3.2).
During turn initiation along the M/L axis both the CoM and XCoM moved right, i.e., medial, relative to the LFT CS origin, with the CoM a greater distance away. At 50% stance during the turn phase the positions of the CoM and XCoM converged, having moved to the left, i.e., lateral, of coordinate system’s origin. At toe touch both the CoM and XCoM continued to move further left of the system’s origin, with the XCoM having demonstrated greater excursion (right graph in Figure 3.2).
3.2. Comparison of the Two Methods for Determining the MoS: XCoM to CoP and XCoM to BoS Center
3.2.1. MoS Excursion Patterns
The magnitude of the MoSs were greater at turn initiation and toe touch. During the turn phase along the A/P axis (left graph in Figure 3.3), the XCoM generally moved from posterior to anterior to posterior relative to both the CoP and BoS center. From approximately 20% to 50% of stance during the turn phase the MoS was minimized as the XCoM appeared to be closely aligned with both the CoP and BoS center. At 75% stance during the turn phase, the same pattern of movement of the XCoM relative to each reference point was noted but with greater distance between the XCoM and the CoP.
From turn initiation to toe touch movement of the XCoM along the M/L axis was very similar relative to both the CoP and BoS center. The minimum magnitude of the MoSs was reached from approximately 20% to 40% of stance during the turn phase. These relationships from 0% to 30% stance during the turn phase indicated that the XCoM was medial to the CoP and BoS center, which increasingly moved lateral to the reference points by toe touch (right graph in Figure 3.3). As noted with MoS along the A/P axis, the MoSs along the M/L axis were largest at the beginning and end of the turn.
3.2.2. Magnitude and Variability of MoS Excursion
To this point we presented data from a representative trial and participant to demonstrate the general relationships between the CoM, XCoM, CoP, and BoS center, and the margin of stability during the one-turn pirouette. We were also interested in the magnitude and variability of the MoS since it is a marker of control during dynamic activities. Although there are limitations imposed by our sample size some generalizations can be highlighted by observation from Table 3.1.
- -
- There was a larger mean MoS in the M/L direction for XCoM to both CoP and BoS center
- -
- Each participant demonstrated the largest coefficients of variation with XCoM to the BoS center in the A/P direction
- -
- Participants #1 and #5 demonstrated the largest mean MoS in the M/L direction for XCoM to CoP and BoS center
- -
- Participant #2 demonstrated the smallest mean MoS in the A/P direction for XCoM to CoP and BoS center.
Table 3.1. The mean (mm), SD, and CV for the distance between XCoM to BoS center and XCoM to CoP for each participant in the A/P (y-axis) and M/L (x-axis) directions in the LFT CS.
We also examined the mean MoS across all participants (Table 3.2) and made the following observations:
- -
- The MoS in the M/L direction demonstrated greater values
- -
- There was greater mean variation in the MoS in the M/L direction
- -
- The largest coefficient of variation was the excursion of the XCoM to BoS center in the A/P direction.
3.3. Topple Angle
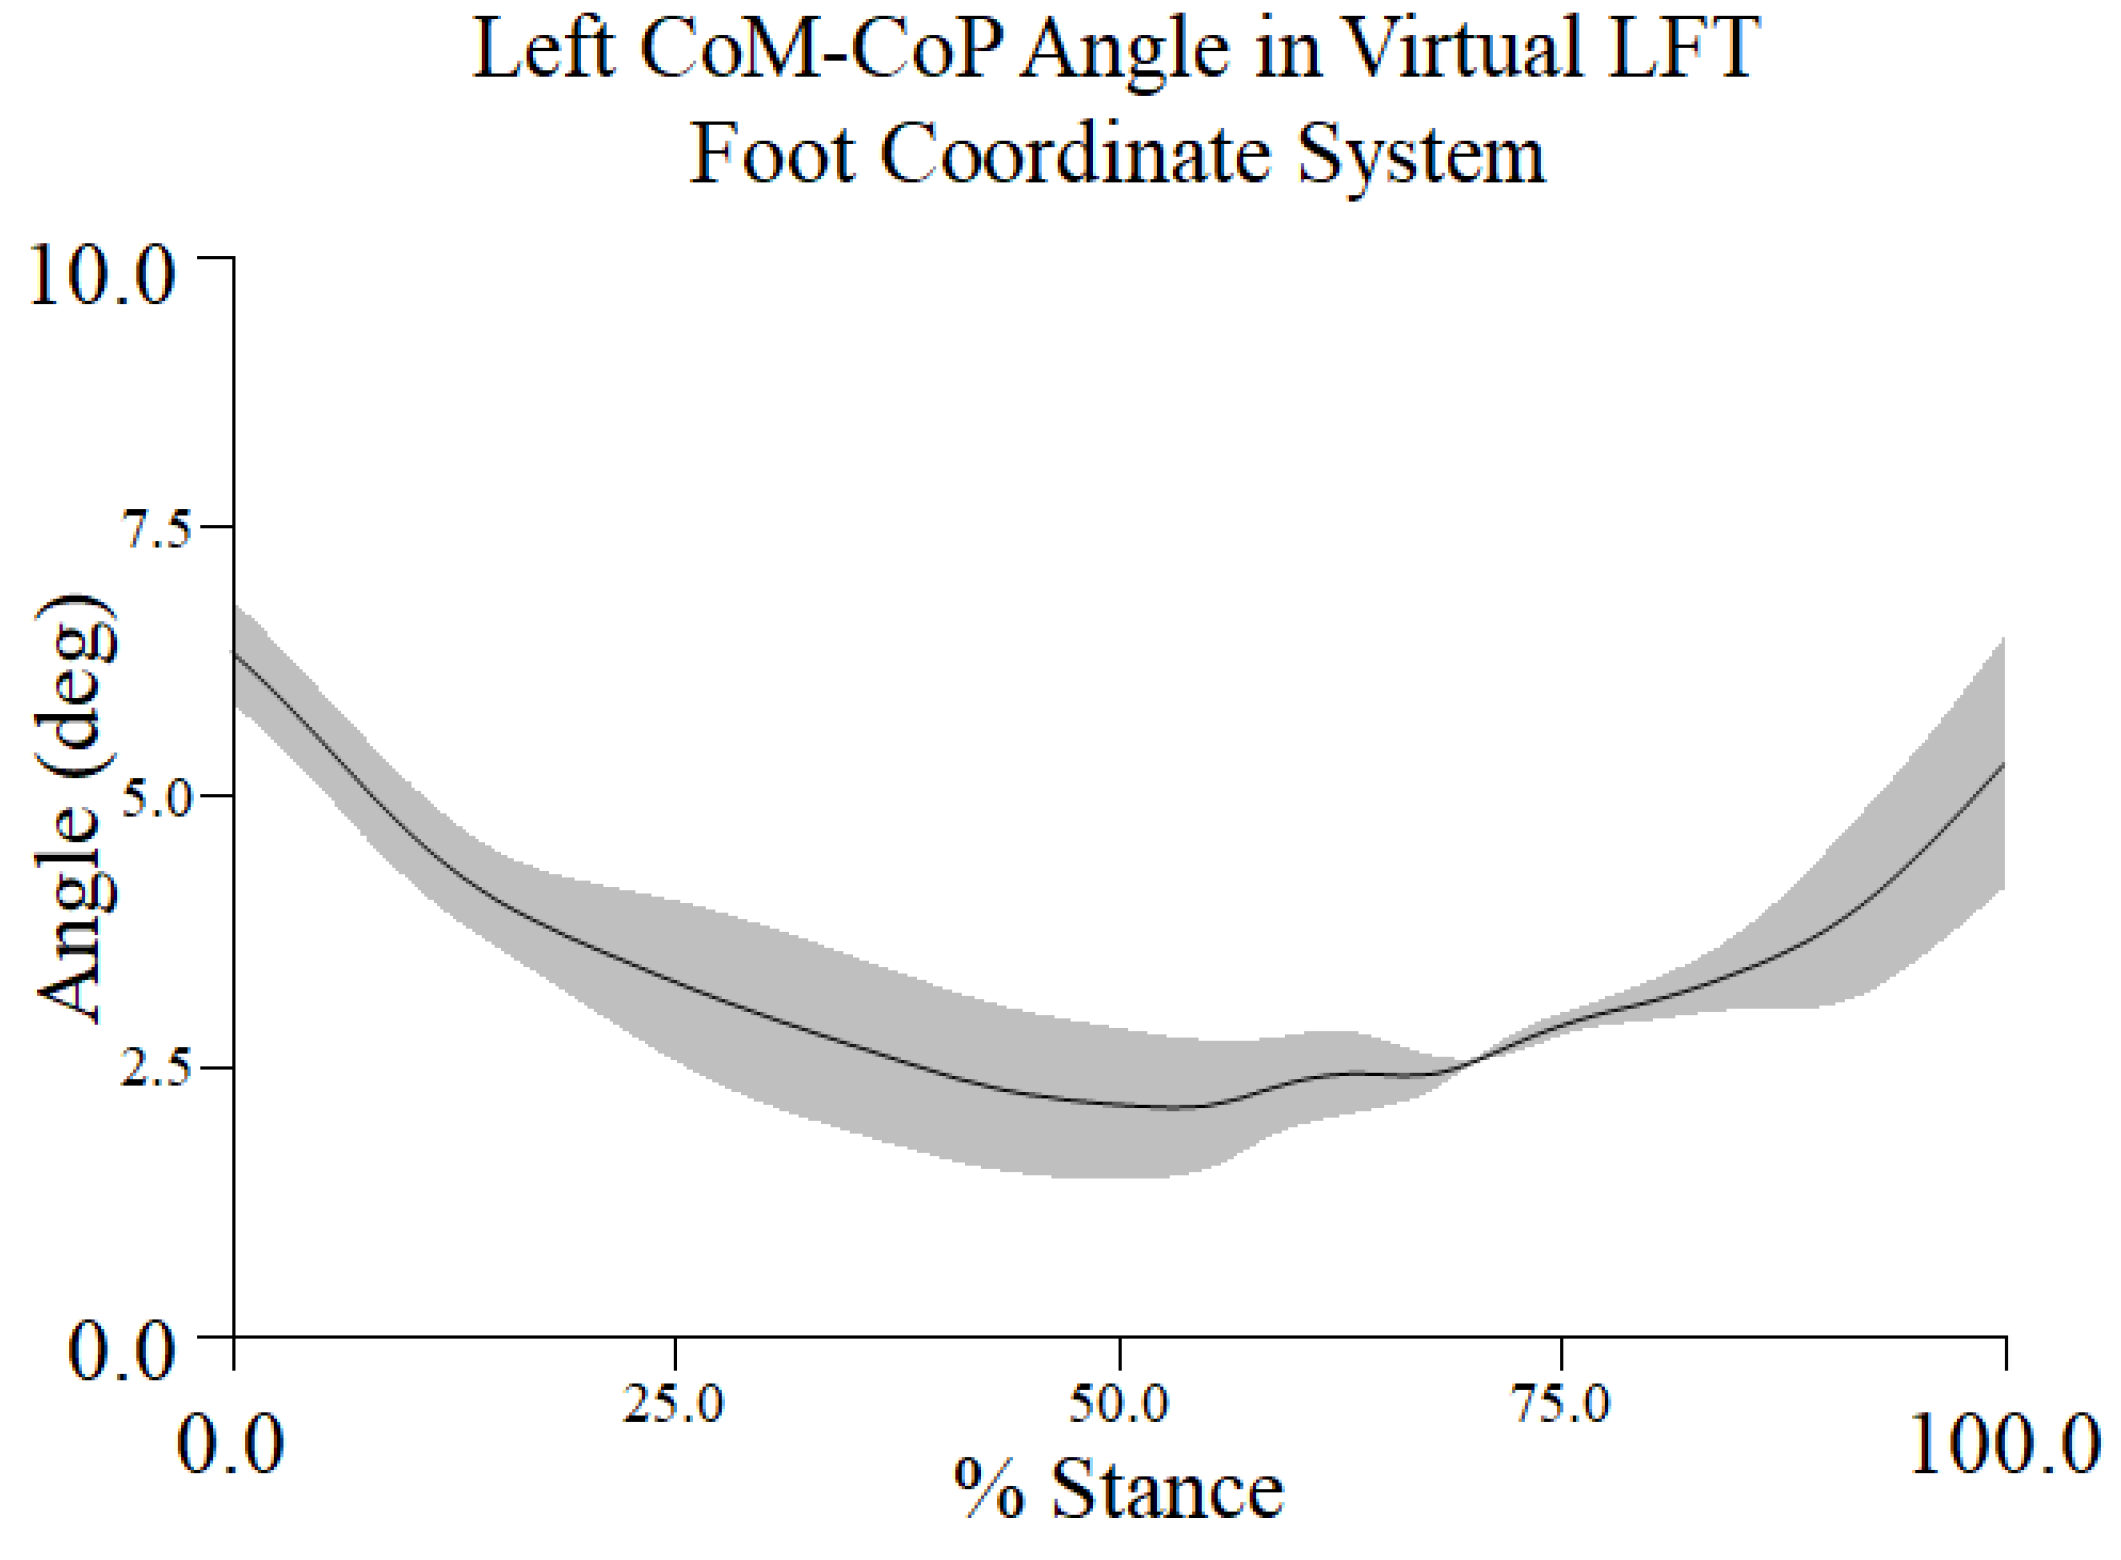
The same participant and representative trial that was used to demonstrate the CoM, XCoM, and COP metrics was used to examine the topple angle. The topple angle was determined in the LFT CS. It reached a maximum of approximately 6.5° at turn initiation and its minimum value around 50% to 60% of stance during the turn phase and began to increase as the dancer neared toe touch (Figure 3.4).
Group descriptive statistics showed that across participants the mean topple angle ranged from approximately 2.8° to 3.9°. Between trial variability, i.e., coefficient of variation (CV%), for the participants ranged from approximately 11% to 23% and was nearly 20% across participants (Table 3.3 and Table 3.4).
4. Discussion
Previous research using the inverted pendulum model to examine biomechanical properties of the pirouette is limited. The purpose of this research was to measure and examine the MoS and topple angle as measures of dynamic balance during a single turn pirouette in female amateur ballet dancers.
4.1. Rationale for Using Different Coordinate Systems; Comparison of Dynamic Balance Metrics in the LCS Versus the LFT CS
Dynamic balance was calculated using two different coordinate systems, a laboratory coordinate system (LCS) and left foot coordinate system (LFT CS). The location of the dancer’s starting position on the force plates was never the same during data collection, therefore the CoP and BoS would have variable initial positions for each trial. Since we decided not to standardize participants’ fourth position initial postures, we believed it was important to analyze our data determined using both the LCS and LFT CS. Using the LFT CS, located in the stance foot that moved with the dancer, would allow, we believed, a more consistent representation of the results between trials and across participants because it was unaffected by the difference in starting locations.
Recall, that the orientation of the two coordinate systems was different. In the LCS, the x- and y-axes represented antero-posterior and medio-lateral motions, respectively (Figure 2.1). Because we used FPs #3 and #5 to record the dance turns the orientation of the left foot on FP3 dictated that its CS would have the x- and y-axes represent medio-lateral and antero-posterior motions in the LFT CS, respectively (Figure 2.3). Therefore, when we compared the results that were generated using different coordinate systems: 1) the left graph in Figure 3.1 to the right graph in Figure 3.2 for the M/L excursions of the CoM and XCoM and 2) the right graph in Figure 3.1 to the left graph in Figure 3.2 for the A/P excursions of the CoM and XCoM.
Along the medio-lateral axes of both coordinate systems, we observed greater excursion of the XCoM, than the CoM, relative to the CoP. Greater excursion of the XCoM may be explained by its relationship to its velocity component. However, in the LFT CS both the CoM and XCoM moved left (lateral) similarly relative to the CS’s origin during the later part of the turn, with seemingly greater excursions away from the CoP than observed in the LCS. Convergence of the CoM and XCoM movements near midstance (or midturn) were shown using either CS. There appeared to be less variation of the CoP during the turn when evaluated using the LFT CS. This may indicate that the dancer’s turn foot may not have translated appreciably during the turn phase in the M/L direction.
The A/P excursion time series in the LCS generally demonstrated a U-shaped pattern. Both the CoM and XCoM moved anterior from turn initiation to about 60% stance during the turn phase then moved posterior until touch; they remained posterior to the CoP, which remained approximately constant during the turn. Each time series had a unique position but the XCoM demonstrated a larger excursion throughout the turn. The CoM and XCoM time series in the LFT CS demonstrated an inverted U-shape, and their movement characteristics were similar, with the following exception: from approximately 20% to 60% of stance during the turn phase they were nearly coincident. Along the A/P axis, excursion of the XCoM was greater only in the LCS. Contrary to what we identified relative to variation of the CoP time series along the M/L axis, there was less variation of the CoP during the turn when evaluated using the LCS, suggesting that translation of the supporting foot in the A/P direction was minimal. In contrast to our data, Lott [6] reported a Pearson’s r = 0.873 between the percent distance movement of the normalized (to dancer’s height) BoS and the number of pirouette revolutions. Therefore, Lotta concluded that some translation of the body is required to maintain balance when performing multiple-turn pirouettes. An apparent inconsistency in the dynamics of the CoP time series analyzed using different coordinate systems in our study suggests that additional research is needed to understand the role of total body translation during the performance of a pirouette. In summary, we initially intuited that using a virtual coordinate system fixed to the foot would provide more reliable data on the neurological response, i.e., CoP dynamics, to postural challenges during a pirouette. However, that may not be the case since our results demonstrated that use of either coordinate system provided meaningful data and insights on dynamic balance metrics during a one-turn pirouette.
4.2. Margin of Stability
The margin of stability, defined as the distance between the XCoM and the border of an individual’s BoS at any given moment, has been proposed as a measure of stability during dynamic situations [7]. In the classic inverted pendulum model the CoM needs to stay within the boundaries of the BoS to maintain stability [35]. However, Pai and Patton showed that this condition, i.e., CoM within BoS, was not applicable to dynamic situations, e.g., walking, and that the velocity of the CoM needed to be accounted for when predicting maintenance of stability [36]. That is, although the CoM lies within the BoS, the CoM velocity is pointing away so that stability may not be achieved if the CoM velocity is sufficiently large. Conversely, if the CoM is outside the BoS, stability may be regained if the CoM velocity is pointing towards the BoS. Based on the work of [36,37], Hof et al. [7] derived, using the linear IPM, the extrapolated center of mass as the vector quantity XCoM as the velocity and eigen-frequency adjusted projection of the CoM.
For this study we defined the MoS using two different equations: 1) BoS center - XCoM and 2) CoP - XCoM. We used the 1st and 5th metatarsal foot markers (from the OFM) as the boundary of the BoS center to avoid over- or under-estimating distancing MoS along the A/P and M/L axes. The CoP was used as the preferred reference for determining the MoS since it represents the neurological response to perturbation. The distance between the XCoM and the BoS center appeared similar to the distance between the XCoM and the CoP along the M/L and A/P axes throughout the turn phase (Figure 3.3). This suggests that during a single turn pirouette, the BoS center and the CoP remained near each other, which was expected since the CoP is the plantar location of the vertical ground reaction force and the BoS center was a discrete point within the forefoot. Our results suggest that either a BoS, as we determined, or the CoP would equally render valid and reliable MoS measures for research related to investing the mechanics of single- or multi-turn pirouettes.
Using a representative participant and trial, we found that along the A/P axis the magnitudes of the MoSs were greater at turn initiation and toe touch, although they were different (left graph in Figure 3.3). This greater MoS was likely related to beginning the turn in 4th position and then making foot contact on FP3 at the end of the turn phase, rather than some compensation for an internal perturbation. During the period from 20% to 50% of stance during the turn phase the MoS was minimized as the XCoM appeared to be closely aligned with both the CoP and BoS center, suggesting a period of good dynamic balance. From turn initiation to toe touch, movement of the XCoM along the M/L axis was very similar relative to both the CoP and BoS center (right graph in Figure 3.3). The magnitude of the MoSs appeared reduced from approximately 20% to 40% of stance during the turn phase, suggesting that this was a period of relatively good postural control. On the other hand, the MoS magnitudes were generally greater along the M/L axis, particularly at the beginning and end of the turn, an indication that balance in the medio-lateral direction may have been more challenging. For both methods used to determine the MoS, the greatest mean values, as well as participant and cohort variability, were found along the M/L axis for each individual and for the cohort, which may support our speculation that medio-lateral control was more challenging (Table 3.1 and Table 3.2).
We determined the coefficient of variation, i.e., CV%, within and across participants because of its potential to provide insight into both biological and inter-individual variability. Inter-trial CVs ranged from 27% to 51% along the A/P and 16% to 29% along the M/L axes for XCoM to BoS center, whereas they ranged from 1% to 24% along the A/P and 16% to 25% along the M/L axes for XCoM to CoP. In general, it appears that inter-trial variation was moderately large, yet differences between individuals make it difficult to attribute this primarily to biological variation. Inter-participant CVs for the XCoM to BoS center along the A/P and M/L axes were 23% and 14%, respectively, while for XCoM to CoP they were 10% and 28% along the A/P and M/L axes, respectively. Previously, we suggested that control along the M/L axis may have been more challenging. However, the variability both within and between participants generally demonstrated mixed CV% magnitudes of variability for MoS metrics along the A/P and M/L axes, posing a challenge for making any reasonable generalizations. Additional research using different methods are likely needed to further investigate the natural biological variability related to ballet pirouettes.
In a seminal paper, Hof et al. [7] tested their margin of stability theory by collecting force plate data on healthy participants under four standing conditions (5 sec.): 1) standing on two feet, 2) standing on one foot, 3) standing tiptoe on two feet, and 4) standing tiptoe with one foot; and a fifth condition: walking on an instrumented treadmill at a self-selected speed. They determined the BoS by recording the extreme boundaries of the CoP collected as the participant stood on one foot (using support to maintain balance) and shifted their weight as much as possible laterally, anteriorly, medially, and posteriorly; in this way, the boundary of the BoS was recorded as a loop of the CoP. Two pieces of information are somewhat germane to our results. First, they reported a mean margin of stability of - 9.3 (± 14) mm for the standing tiptoe on one foot condition. Although the magnitude of that MoS was much smaller than our results along either the A/P or M/L axes, the ‘sign’ of their value indicated that the MoS was initiated outside the BoS, similar to what we found. Additionally, the smaller MoS magnitude that Hof et al. reported may be related to two factors: 1) our BoS center included a smaller area and 2) performance of a pirouette is a more dynamic skill. Secondly, the relationships between the CoM, XCoM, and CoP Hof et al. reported for one-foot tiptoe standing were like the results we illustrated in Figure 3.1 and Figure 3.2. In the only study similar to ours, Lott [6] examined the MoS associated with the pirouette. She reported a negative MoS value at turn initiation and concluded, based on her cohort who performed multi-turn pirouettes, that dancers initiated pirouettes with the XCoM outside of the BoS, a finding consistent with ours.
4.3. Topple Angle
The stability of a dancer during a pirouette can also be evaluated by examining the topple angle throughout the turn phase. The topple angle from a representative trial and participant was greater at turn initiation and termination, periods when the dancer was in 4th position and toe touch, respectively. As illustrated in Figure 1.1 several factors during the early and later phases of the pirouette contribute to a ‘splaying’ of the body’s CoM, and, thus, a greater topple angle: 1) the hips are flexed (left)/extended (right) and externally rotated, 2) the arms are away from the body, and 3) both feet are on the ground with an approximate BoS shoulder width apart. The topple angle was reduced at 50% of stance during the turn phase, while the dancer balanced on the ball of the turning foot. During this short time period the location of the CoM must coincide as much as possible with the reactive CoP to maintain the dancer’s balance. As we showed, the approximate midpoint of the turn was also a period when the MoS along both A/P and M/L axes was minimized. Recall, however, that there was some evidence that the CoP translated as adjustments to control the CoM.
For the participant and trial chosen, the topple angle’s maximum and minimum values were approximately 6.5° and 2.4°, respectively. The mean topple angle from the time series across participants was 3.34° (± 0.66) ° with a range of 2.75° to 3.88°. The range of intra-participant (inter-trial) variations (CV%) was 10.9% to 23.3%, values suggestive of biological variability and experience level. The CV% across all participants of 19.9% may also be indicative of differences in skill between dancers.
In our review of the literature, several findings were of interest. Lott and Laws [13] tested nine dancers (8 female, 1 male) aged 16 ± 2.3 years who had intermediate to advanced training. The maximum topple angle of 9.3° ± 1.9° during the attempt at multi-turn pirouettes was reported. In a later study, Lott [6] reported a maximum topple angle of 9.8° ± 6.8° during multi-turn pirouettes in adolescent female dancers (16 ± 1.4 years). Likewise, Lin et al. [3] found that novice, compared to experienced dancers exhibited greater and more variable topple angles in the antero-posterior and medio-lateral directions during the preparatory, double-leg support, and ending phases of a single-turn pirouette. These results likely reflected the reduced expertise in both studies. Zaferiou et al. [12], employing 10 female professional and pre-professional dancers (aged 20.4 ± 3.17 years) in a study of one- and two-turn pirouettes and piqués, reported a mean topple angle of 4° ± 1° for both types of pirouettes. However, for single and double piqués they reported mean angles of 13° ± 2° and 8° ± 1°, respectively. More recently, Tsubaki et al. [26] measured the topple angle, i.e., posterior inclinations, of single pirouettes comparing professional and experienced amateur dancers (aged 21.9 ± 2.6 years) donning pointe shoes. They analyzed three phases: turning with double-leg support (TDS), turning with single-leg support (TSSp), and turning with single-leg support in mid-swing (TSSm) and found no difference between groups in the TDS and TSSp phases. Professional dancers, however, demonstrated a significantly reduced topple angle during TSSm (2.05° ± 0.90° to 3.88° ± 1.67°). As in [6] it appears that less experienced dancers in [26] exhibited more variability. Although it is difficult to make comparisons between studies because of methodological differences. For example, our mean topple angles may differ slightly because the CoP was mapped in a foot coordinate system. Moreover, some studies measured maximum topple angles prior to compensatory hops during multi-turn pirouettes. Our results were most comparable to those reported by Zaferiou et al. [12] and Tsubake et al. [26]. What our study has added to previous work is an extended look at trial-to-trial and across participant variability, i.e., CV%. We reported the variability using both standard deviations and coefficient of variation to illustrate the biological variability that is inherent even in elite amateur dancers who completed single turn pirouettes successfully. This biological variability suggests that the time series of the pirouette balance metrics we recorded have dynamic (and chaotic) characteristics that cannot be fully understood using the typical linear measures we used in this study. Thus, future research on the biomechanics of dance and control of dynamic balance should consider tools relevant to non-linear time series.
4.4. Methodological Limitations
This study was limited by its small sample size and the inclusion of only female elite amateur ballet dancers. This limited the applicability of this study’s data to male or professional dancers; therefore, further research should be conducted to examine male and professional level population. In this study, the dancers were instructed to perform en dehors pirouettes, decreasing the generalizability of the results to other styles of pirouettes. All participants chose to perform their turns standing on their left leg, limiting the application of the results to pirouettes performed with a right stance leg. The participants in this study used ballet slippers rather than pointe shoes when performing their turn to allow for correct marker placement on the foot and ankle, so the results of this study were limited in the application to maintaining stability during a single turn pirouette when wearing ballet shoes. The laboratory setting may also have caused limitations to the dancer’s ability to complete a successful turn by being constrained to land their turn within the area of the force plate. This was done to provide some control of their landing point for the purpose of recording toe off and toe touch of their turn leg to define the start and end of the turn phase. The order of triple or single pirouette turn conditions were randomized by a coin toss to reduce error caused by fatigue across dancers. However, for each dancer a significant number of turns were performed for each of the turn conditions which may have added a fatigue component that impacted their performance for both turn conditions. Error due to fatigue of repeated testing was minimized by allowing the dancers breaks between turn trials. Error from soft tissue artifact related to the use of the PiG model is expected for all studies using motion capture with markers. However, this study did not analyze joint angles or net joint moments, which are affected most by soft tissue artifact.
4.5. Implications for Further Research
Further research is needed with a larger sample of both male and female professional dancers to analyze the MoS during pirouettes with single and multiple rotations on both the left and right stance legs. This may increase the external validity of the data across ballet dancers to provide insight into faulty mechanics that could lead to injury. Future research involving other styles of pirouettes would also be beneficial to assist with training and improving the performance of amateur and professional dancers. This would provide more information on how to improve their biomechanics with the variety of turn styles seen in ballet choreography. To further increase the applicability to female amateur and professional dancers, further research on MoS and dynamic balance with dancers in pointe shoes would be beneficial since most of their performances are performed with pointe shoes. Additionally, future research involving dance mechanics should consider alternative methods that improve the validity of the MoS or offer an alternative measure of stability, as suggested by Terry et al. [38] and Kazanski et al. [39], respectively. Terry et al. have identified a limitation of the MoS, as originally described by Hof et al. [7], for activities where the CoP is not stationary, e.g., walking, dancing, etc., and offered a possible solution. Likewise, Kazanski et al. suggested a MoS related metric, i.e., Probability of Instability, which may be a more insightful measure of medio-lateral stability. Future research might also consider methodological approaches that combine the use of the MoS with the examination of preferred kinematic and muscular synergistic coordination strategies [40]; a combination of musculoskeletal modeling, electromyography and induced acceleration analysis [41,42,43,44], or the application of whole-body angular momentum and its relationship to the pirouette motion [45,46,47]. Any combination of these methods may provide valuable information on the biomechanical aspects of balance control of a pirouette, changes in control related to overuse or injury, and assess the effectiveness on training and rehabilitation programs.
5. Conclusions
The MoS was used to examine dynamic stability during three successful single turn pirouettes during the turn phase for each participant. The MoS distance was largest immediately after toe-off and just before toe touch. The MoS distance was also greater along the M/L axis than the A/P axis. Although the topple angle may also provide some descriptive information on single turn pirouettes, we believe that the MoS can provide more insightful information on the neurological control of dynamic balance. Margin of stability metrics may be useful to analyze amateur and professional dancers to assist with training and performance, and to help decrease injury related to faulty mechanics.
Author Contributions
Conceptualization, A.D., A.K., N.M., and G.A.; methodology, G.A. and L.H.; software, L.H. and D.W.Z; validation, G.A. and L.H.; investigation, A.D., A.K., N.M., and G.A.; resources, G.A.; data curation, G.A.; writing—original draft preparation, A.D., A.K., and N.M.; writing—review and editing, A.D., A.K., N.M., D.W.Z, and G.A.; visualization, A.D., A.K., N.M., L.H., and G.A.; supervision, G.A.; project administration, G.A. Note: L.H. (Lauren Hickox) was acknowledged because of her contribution to data reduction but was not a co-author. All authors have read and agreed to the published version of the manuscript.
Funding
This research received no external funding.
Institutional Review Board Statement
The study was conducted in accordance with the Declaration of Helsinki and approved by the Institutional Review Board of Grand Valley State University (protocol code: 19-296-H; approval date: May 16, 2019).
Informed Consent Statement
Informed consent was obtained from all subjects involved in the study.
Data Availability Statement
The data presented in this study are available on request from the corresponding author due to (specify the reason for the restriction).
Acknowledgments
Lauren Hickox for technical assistance; Samantha Shelton for dance consultation.
Conflicts of Interest
The authors declare no conflicts of interest.
Abbreviations
The following abbreviations are used in this manuscript:
| IPM | Inverted pendulum model |
| CoM | Center of mass |
| XCoM | Extrapolated center of mass |
| BoS | Base of support |
| CoP | Center of pressure |
| MoS | Margin of stability |
| GRF | Ground reaction force |
| FP | Force plate |
| PiG | Plug-in Gait |
| OFM | Oxford foot model |
| ASIS | Anterior superior iliac process |
| CPG | Peg marker posterior end of the calcaneus |
| CV% | Coefficient of variation percentage |
| A/P | Antero-posterior |
| M/L | Medio-lateral |
| LCS | Laboratory coordinate system |
| LFT CS | Virtual left foot coordinate system |
| LP1M | Left proximal 1st metatarsal |
| LD1M | Left distal 1st metatarsal |
| LP5M | Left proximal 5th metatarsal |
| LD5M | Left distal 5th metatarsal |
Appendix A
Mean ± 1 SD mm in percent stance across all trials and participants for all dynamic balance metrics examined in this study.
Figure A1.
Mean ± 1 SD mm in percent stance across all trials and participants for the center of mass (CoM), extrapolated center of mass (XCoM), and center of pressure (CoP) along the y- (medio-lateral) and x- (antero-posterior) axes in the laboratory coordinate system (LCS). Negative distance along the x-axis is posterior and along the y-axis is lateral.
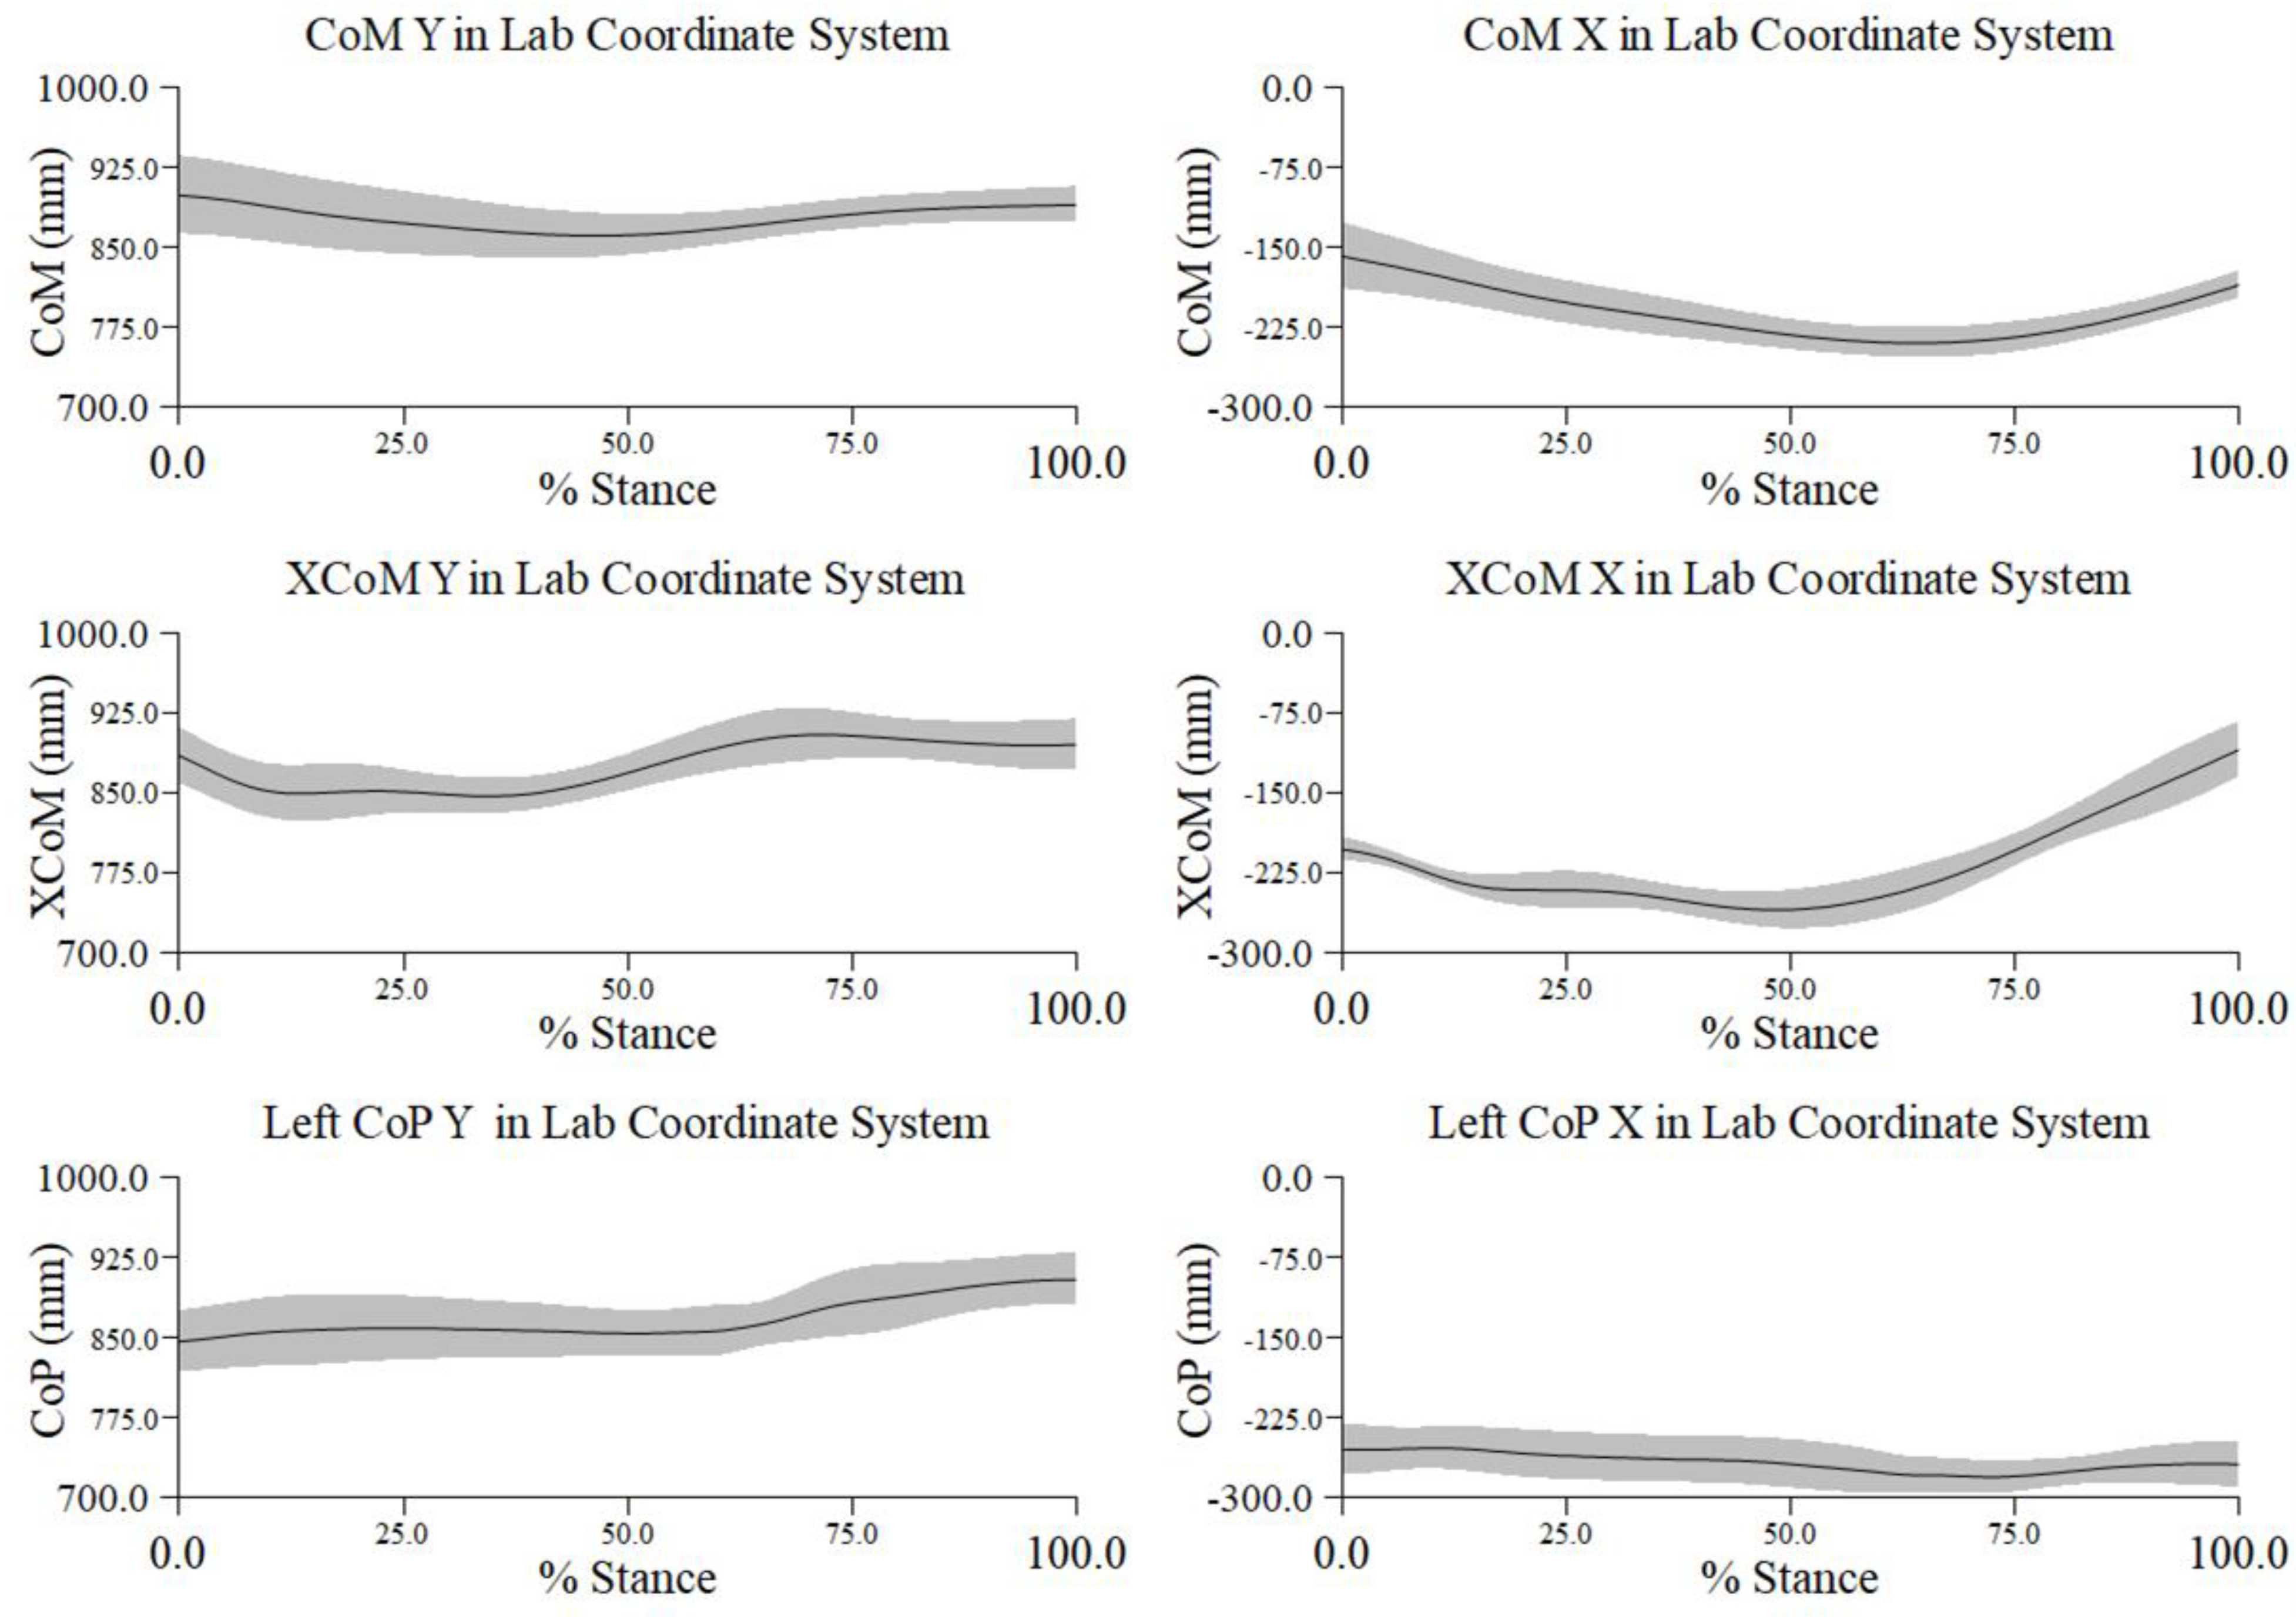
Figure A2.
Mean ± 1 SD mm in percent stance across all trials and participants for the center of mass (CoM), extrapolated center of mass (XCoM), and center of pressure (CoP) along the x- (medio-lateral) and y- (antero-posterior) axes in the virtual left foot coordinate system (LFT CS). Negative distance along the x-axis is lateral and along the y-axis is posterior.
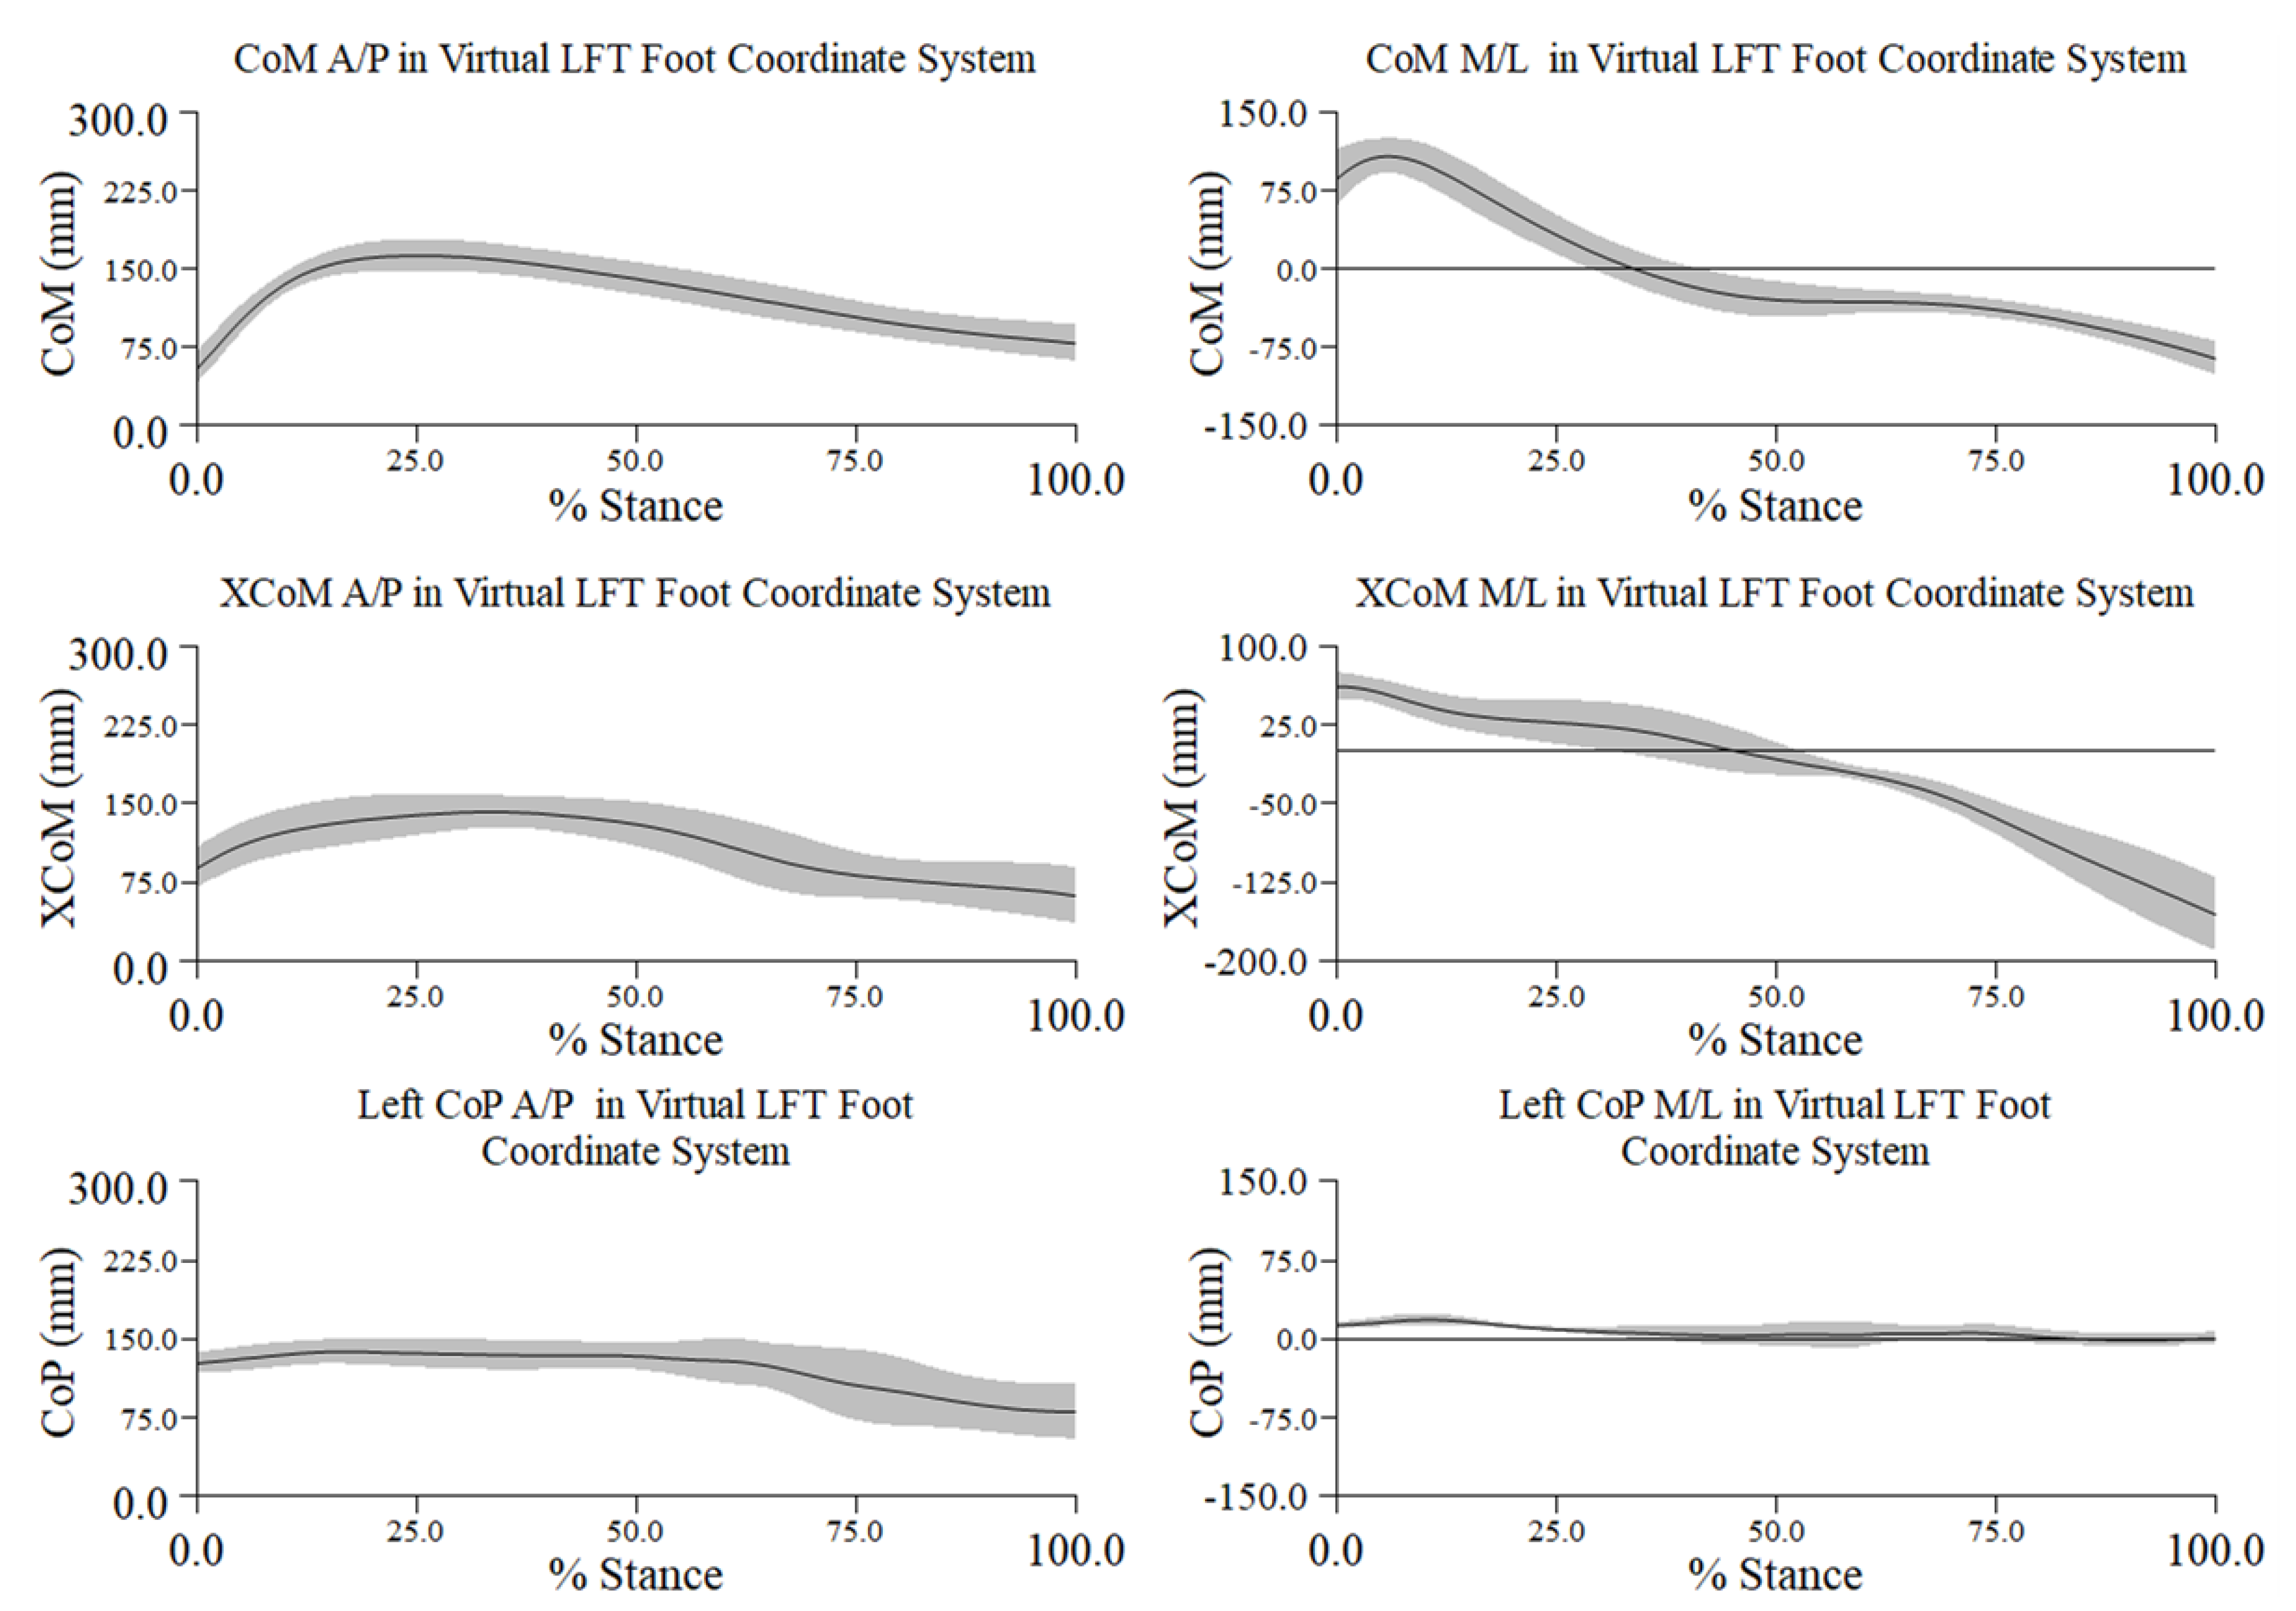
Figure A3.
Mean ± 1 SD mm in percent stance across all trials and participants for the distance between the center of mass (CoM) to center of pressure (CoP), extrapolated center of mass (XCoM) to CoP, and XCoM to base of support center (BoS center) along the x- (medio-lateral) and y- (antero-posterior) axes in the virtual left foot coordinate system (LFT CS). Negative distance along the x-axis represents the distance of CoP or BoS center was lateral to CoM or XCoM; negative along the y-axis represents the distance of CoP or BoS center was posterior to CoM or XCoM.
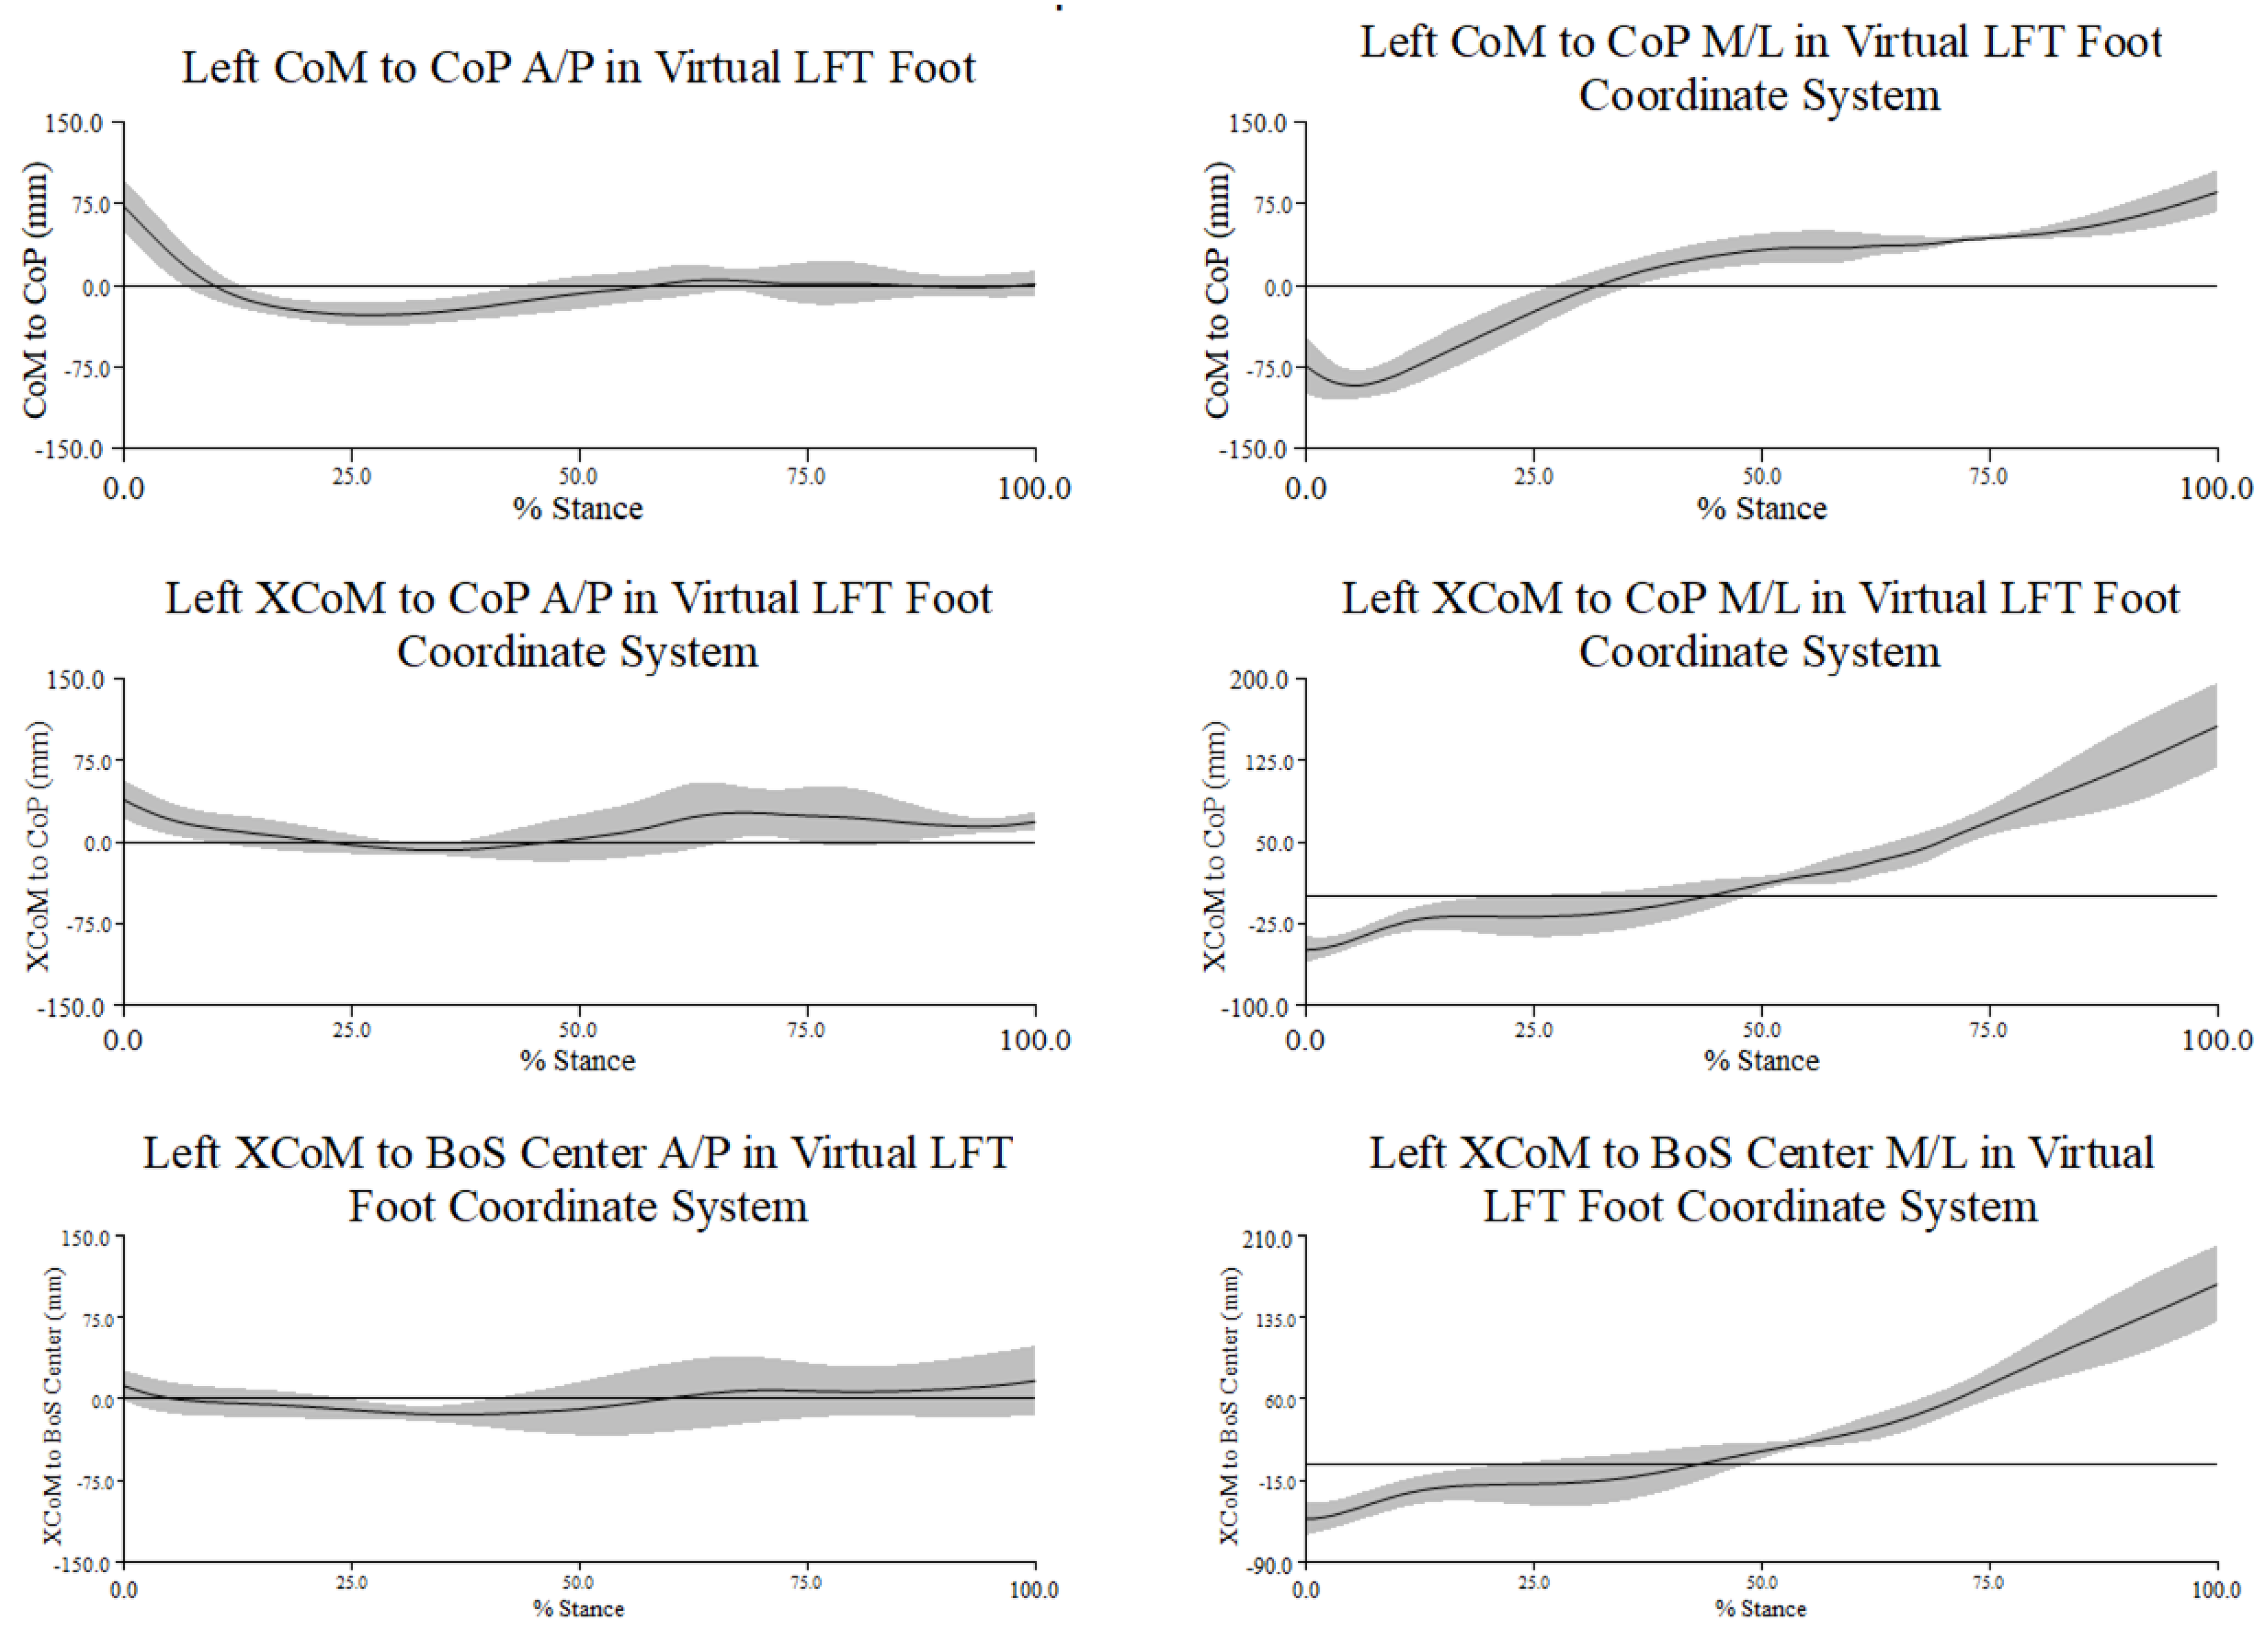
Figure A4.
Mean ± 1 SD mm in percent stance across all trials and participants for the topple angle. The topple angle was created by the vertical projection of the center of mass (CoM) to the ground and a line connecting the CM to the most lateral position of the center of pressure (CoP) in the virtual left foot coordinate system (LFT CS).
References
- Kim, J.; Wilson, M.A.; Singhal, K.; Gamblin, S.; Suh, C.-Y.; Kwon, Y.-H. Generation of vertical angular momentum in single, double, and triple-turn pirouette en dehors in ballet. Sports Biomech. 2014, 13(3), 215–19. [Google Scholar] [CrossRef]
- Zaferiou, A.M.; Wilcox, R.R.; McNitt-Gray, J.L. Modification of impulse generation during pirouette turns with increased rotational demands. J Appl Biomech. 2016, 32(5), 425–432. [Google Scholar] [CrossRef] [PubMed]
- Lin, C.W.; Su, F.C.; Wu, H.W.; Lin, C.F. Effects of leg dominance on performance of ballet turns (pirouettes) by experienced and novice dancers. J Sports Sci. 2013, 31(16), 1781–1788. [Google Scholar] [CrossRef]
- Winter, D.A.; Patla, A.E.; Prince, F.; Ishac, M.; Gielo-Perczak, K. Stiffness control of balance in quiet standing. J Neurophysiol. 1998, 80(3), 1211–1221. [Google Scholar] [CrossRef] [PubMed]
- Gage, W.H.; Winter, D.A.; Frank, J.S.; Adkin, A.L. Kinematic and kinetic validity of the inverted pendulum model in quiet standing. Gait Posture 2004, 19(2), 124–132. [Google Scholar] [CrossRef]
- Lott, M.B. Translating the base of support: a mechanism for balance maintenance during rotations in dance. J Dance Med Sci. 2019, 23(1), 17–25. [Google Scholar] [CrossRef]
- Hof, A.L.; Gazendam, M.G.J.; Sinke, W.E. The condition for dynamic stability. J Biomech. 2005, 38(1), 1–8. [Google Scholar] [CrossRef] [PubMed]
- Hof, A.L. The ‘extrapolate center of mass’ concept suggests a simple control of balance in walking. Hum Mov Sci. 2008, 27(1), 112–125. [Google Scholar] [CrossRef]
- Curtze, C.; Buurke, T.J.W.; McCrum, C. Notes on the margin of stability. J Biomech. 2024, 166, 112045. [Google Scholar] [CrossRef]
- Zaferiou, A.M.; Flashner, H.; Wilcox, R.R.; McNitt-Gray, J.L. Lower extremity control during turns initiated with and without hip external rotation. J Biomech. 2017, 52, 130–139. [Google Scholar] [CrossRef]
- Imura, A.; Iino, Y. Regulation of hip joint kinetics for increasing angular momentum during the initiation of a pirouette en dehors in classical ballet. Hum Mov Sci. 2018, 60, 18–31. [Google Scholar] [CrossRef] [PubMed]
- Zaferiou, A.M.; Wilcox, R.R.; McNitee-Gray, J.L. Whole-body balance regulation during the turn phase of the piqué and pirouette turns with varied rotational demands. Med Probl Perform Art. 2016, 31(2), 96–103. [Google Scholar] [CrossRef] [PubMed]
- Lott, M.B.; Laws, K.L. The physics of toppling and regaining balance during a pirouette. J Dance Med Sci. 2012, 16(4), 167–274. [Google Scholar]
- Bierbaum, S.; Peper, A.; Karamanidis, K.; Arampatzis, A. Adaptive feedback potential in dynamic stability during disturbed walking in the elderly. J Biomech. 2011, 44(10), 1921–1926. [Google Scholar] [CrossRef]
- Martelli, D.; Luo, L.; Kang, J.; Kang, U.J.; Fahn, S.; Agrawal, S.K. Adaptation of stability during perturbed walking in Parkinson’s disease. Sci Rep. 2017, 7, 17875. [Google Scholar] [CrossRef] [PubMed]
- Alderink, G.; Harro, C.; Hickox, L.; Zeitler, D.W.; Bourke, M.; Gosla, A.; Rustmann, S. Dynamic measures of balance during a 90° turn in self-selected gait in individuals with Parkinson’s disease. Appl Sci. 2023, 13(9), 5428. [Google Scholar] [CrossRef]
- Harro, C.; Alderink, G.; Hickox, L.; Zeitler, D.W.; Avery, M.; Daman, C.; Laker, D. Dynamic measures of balance during obstacle-crossing in self-selected gait in individuals with mild to moderate Parkinson’s disease. Appl Sci. 2024, 14(3), 1271. [Google Scholar] [CrossRef]
- Peebles, A.T.; Reinholdt, A.; Bruetsch, A.P.; Lynch, S.G.; Huisinga, J.M. Dynamic margin of stability during gait is altered in persons with multiple sclerosis. J Biomech. 2016, 49(16), 3949–3955. [Google Scholar] [CrossRef]
- Anastasi, D.; Lencioni, T.; Carpinella, I.; Castagna, A.; Crippa, A.; Gervasoni, E.; Corrini, C.; Marzegan, A.; Rabuffetti, M.; Ferrarin, M.; Cattaneo, D. Dynamic balance during walking in people with multiple sclerosis: A cross-sectional study. Proc Inst Mech Eng H 2023, 237(2), 199–208. [Google Scholar] [CrossRef]
- Tisserand, R.; Armand, S.; Allali, G.; Schnider, A.; Baillieul, S. Cognitive-motor dual-task interference modulates mediolateral dynamic stability during gait in post-stroke individuals. Hum Mov Sci. 2018, 58, 175–184. [Google Scholar] [CrossRef]
- Buurke, T.J.W.; Liu, C.; Park, S.; den Otter, R.; Finley, J.M. Maintaining sagittal plane balance compromises frontal plane balance during reactive stepping in people post-stroke. Clin Biomech 2020, 80, 105135. [Google Scholar] [CrossRef] [PubMed]
- Hak, L.; van Dieén, J.H.; van der Wurff, P.; Houdijk, H. Stepping asymmetry among individuals with unilateral transtibial limb loss might be functional in terms of gait stability. Phys Ther. 2014, 94(10), 1480–1488. [Google Scholar] [CrossRef]
- Curtze, C.; Hof, A.L.; Otten, B.; Postema, K. Balance recovery after an evoked forward fall in unilateral transtibial amputees. Gait Posture 2020, 32(3), 336–341. [Google Scholar] [CrossRef]
- Rodrigues, F.B.; de Sá e Souza, G.S.; de Mendonça Mesquita, E.; de Sousa Gomide, R.; Baptista, R.R.; Pereira, A.A.; Andrade, A.O.; Fraga Viera, M. Margins of stability of persons with transtibial or transfemoral amputations walking on sloped surfaces. J Biomech. 2021, 123, 110453. [Google Scholar] [CrossRef] [PubMed]
- Tsubaki, Y.; Kawano, Y.; Lin, C.-F.; Kuno-Mizumura, K. Laterality in body composition of professional and amateur ballet dancers while performing a single pirouette with pointe shoes. Med Probl Perform Art. 2024, 39(1), 8–17. [Google Scholar] [CrossRef] [PubMed]
- Tsubaki, Y.; Kawano, Y.; Lin, C.-F.; Kuno-Mizumura, M. Differences in the rotation axis between professional and experienced amateur ballet dancers during pirouette en dehors in classical ballet wearing pointe shoes: A pilot study. J Dance Med Sci. 2024, 28(1), 43–50. [Google Scholar] [CrossRef]
- Baker, R. The conventional gait model. In Measuring Walking: A Handbook of Clinical Gait Analysis; Mac Keith Press: London, UK, 2013; pp. 29–49. [Google Scholar]
- Molina-Rueda, F.; Fernández-González, P.; Cuesta-Gómez, A.; Koutsou, A.; Carratalá, M.; Miangolarra-Page, J.C. Test-retest reliability of a conventional gait model for registering joint angles during initial contact and toe-off in healthy subjects. Int J Environ Res Public Health 2021, 18, 1843. [Google Scholar] [CrossRef] [PubMed]
- Carson, M.C.; Harrington, M.E.; Thompson, N.; O’Connor, J.J.; Theologis, T.N. Kinematic analysis of a multi-segment foot model for research and clinical applications: a repeatability analysis. J Biomech. 2001, 34, 1299–1307. [Google Scholar] [CrossRef]
- Reay, J.; Leboeuf, F.; Hanssen, B.; Chiu, J.; Jones, R. Repeatability of the Oxford Foot Model: Comparison of a team of assessors with different backgrounds and no prior experience of the Oxford Foot Model. Gait Posture 2022, 92, 191–198. [Google Scholar] [CrossRef]
- Keuhnapfel, A.; Ahnert, P.; Loeffler, M.; et al. Reliability of 3D laser-based anthropometry and comparison with classical anthropometry. Sci Rep. 2016, 6, 26672. [Google Scholar] [CrossRef]
- Neelly, K.; Wallmann, W.; Backus, C.J. Validity of measuring leg length with a tape measure compared to a computed tomography scan. Physiother Theory Pract. 2013, 29(6), 487–492. [Google Scholar] [CrossRef] [PubMed]
- Harrington, M.E.; Zavatsky, A.B.; Lawson, S.E.M.; Yuan, Z.; Theologis, T.N. Prediction of the hip joint centre in adults, children, and patients with cerebral palsy based on magnetic resonance imaging. J Biomech. 2007, 40(3), 595–602. [Google Scholar] [CrossRef]
- Winter, D.A. Biomechanics and motor control of human movement, 4th ed.; John Wiley & Sons, Inc.: Hoboken, NJ, USA, 2009; pp. 82–106. [Google Scholar]
- Winter, D.A. Human balance and posture control during standing and walking. Gait Posture 1995, 3(4), 193–214. [Google Scholar] [CrossRef]
- Pai, Y.C.; Patton, J. Center of mass velocity-position predictions for balance control. J. Biomech. 1997, 30(4), 347–354. [Google Scholar] [CrossRef]
- Townsend, M.A. Biped gait stabilization via foot placement. J Biomech. 1985, 18(1), 21–38. [Google Scholar] [CrossRef]
- Terry, K.; Stanley, C.; Damiano, D. A new perspective on the walking margin of stability. J. Appl. Biomech. 2014, 30, 737–741. [Google Scholar]
- Kazanski, M.E.; Cusumano, J.P.; Dingwell, J.B. Rethinking margin of stability: incorporating step-to-step regulation to resolve the paradox. J. Biomech. 2022, 144, 111334. [Google Scholar] [CrossRef]
- Lott, M.B.; Xu, G. Joint angle coordination strategies during whole body rotations on a single lower-limb support: an investigation through ballet pirouettes. J Appl Biomech. 2020, 36, 103–112. [Google Scholar] [CrossRef]
- Hirashima, M. Induced acceleration of three-dimensional multi-joint movements and its application to sports movements. In Theoretical Biomechanics; Klika, V., Ed.; IntechOpen Limited: London, UK, 2011; pp. 303–318. [Google Scholar] [CrossRef]
- Graham, D.F.; Carty, C.P.; Lloyd, D.G.; Lichtwark, G.A.; Barrett, R.S. Muscle contributions to recovery from forward loss of balance by stepping. J Biomech. 2014, 47, 667–674. [Google Scholar] [CrossRef]
- Sasagawa, S.; Shinya, M.; Nakazawa, K. Interjoint dynamic interaction during constrained human quiet standing examined by induced acceleration. J Neurophysiol. 2014, 111, 313–322. [Google Scholar] [CrossRef]
- Ogaya, S.; Okita, Y.; Fuchioka, S. Muscle contributions to center of mass excursion in ankle and hip strategies during forward body tilting. J Biomech. 2016, 49, 3381–3386. [Google Scholar] [CrossRef] [PubMed]
- Neptune, R.R.; Vistamehr, A. Dynamic balance during human movement: measurement and control mechanisms. J Biomech Eng. 2019, 141, 070801–1. [Google Scholar] [CrossRef] [PubMed]
- Begue, J.; Peyrot, N.; Dalleau, G.; Caderby, T. Age-related changes in the control of whole-body angular momentum during stepping. Exp Gerontol. 2019, 127, 110714. [Google Scholar] [CrossRef] [PubMed]
- Begue, J.; Peyrot, N.; Lesport, A.; Turpin, N.A.; Watier, B.; Dalleau, G.; Caderby, T. Segmental contribution to whole-body angular momentum during stepping in healthy young and old adults. Sci Rep. 2021, 11, 19969. [Google Scholar] [CrossRef]
Figure 1.1.
Phases of a pirouette beginning in the 4th position from turn initiation phase (green outline), to turn phase (red outline), showing toe-off and toe-touch events (blue outline).
Figure 1.1.
Phases of a pirouette beginning in the 4th position from turn initiation phase (green outline), to turn phase (red outline), showing toe-off and toe-touch events (blue outline).
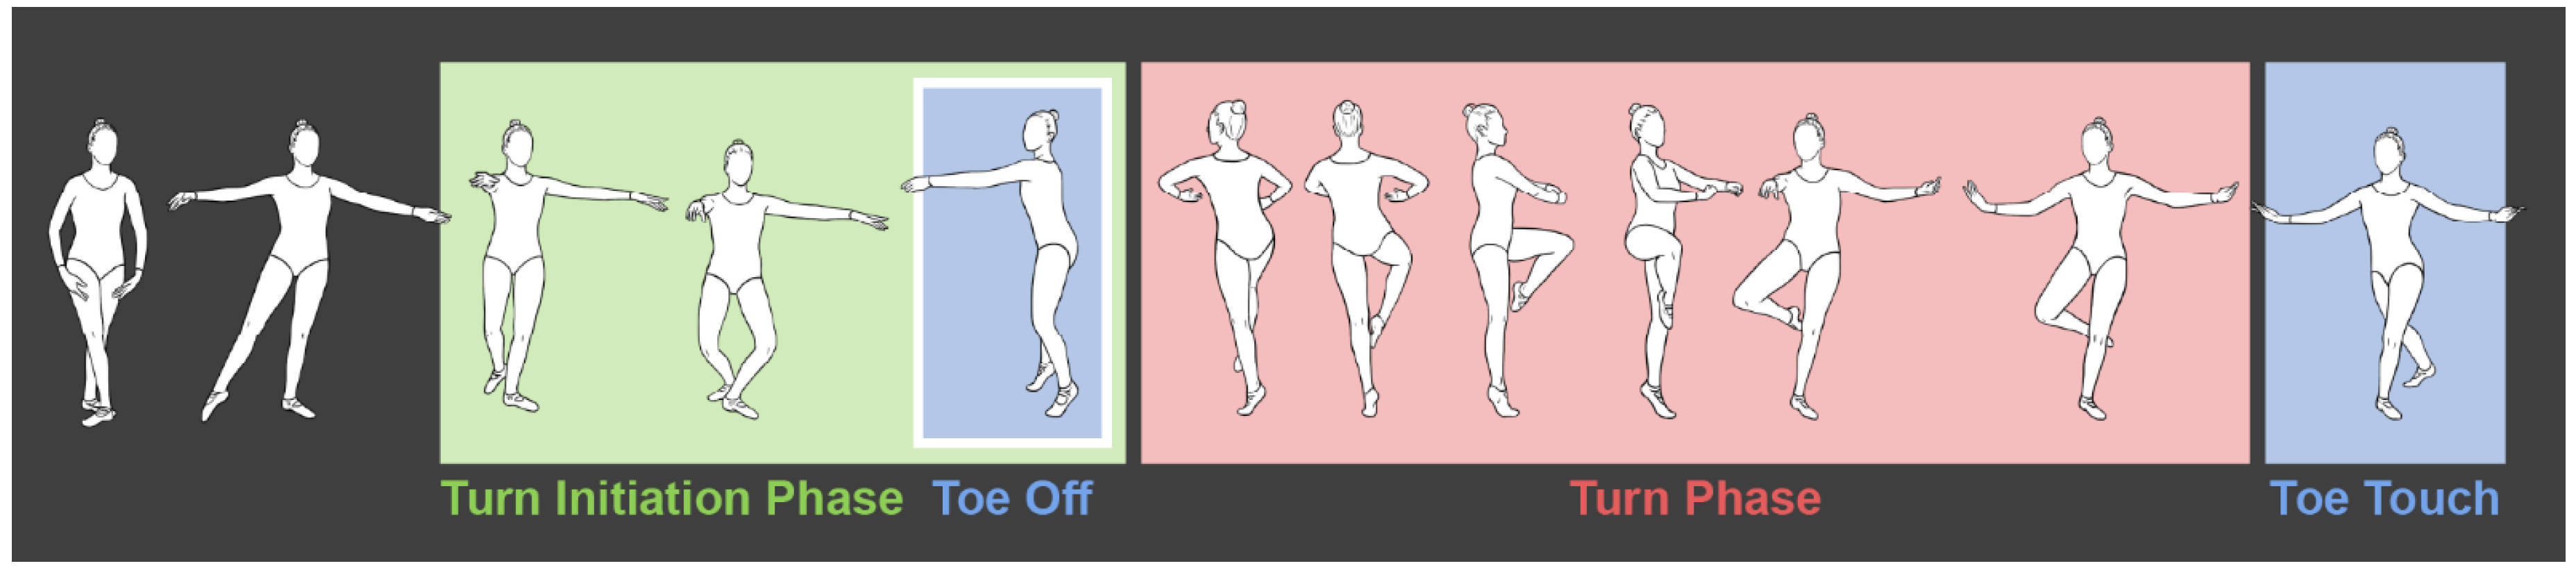
Figure 1.2.
Inverted pendulum model. The body’s total mass minus the foot mass (m) times gravity (g) is balanced on top of the lower extremity whose length = l; u = the CoP location; effective ground reaction force = -mg; x = the projected CoM onto the ground; and the BoS is the plantar portion of the foot that is in contact with the ground [7]. The yz plane reflects the orientation of the laboratory coordinate system.
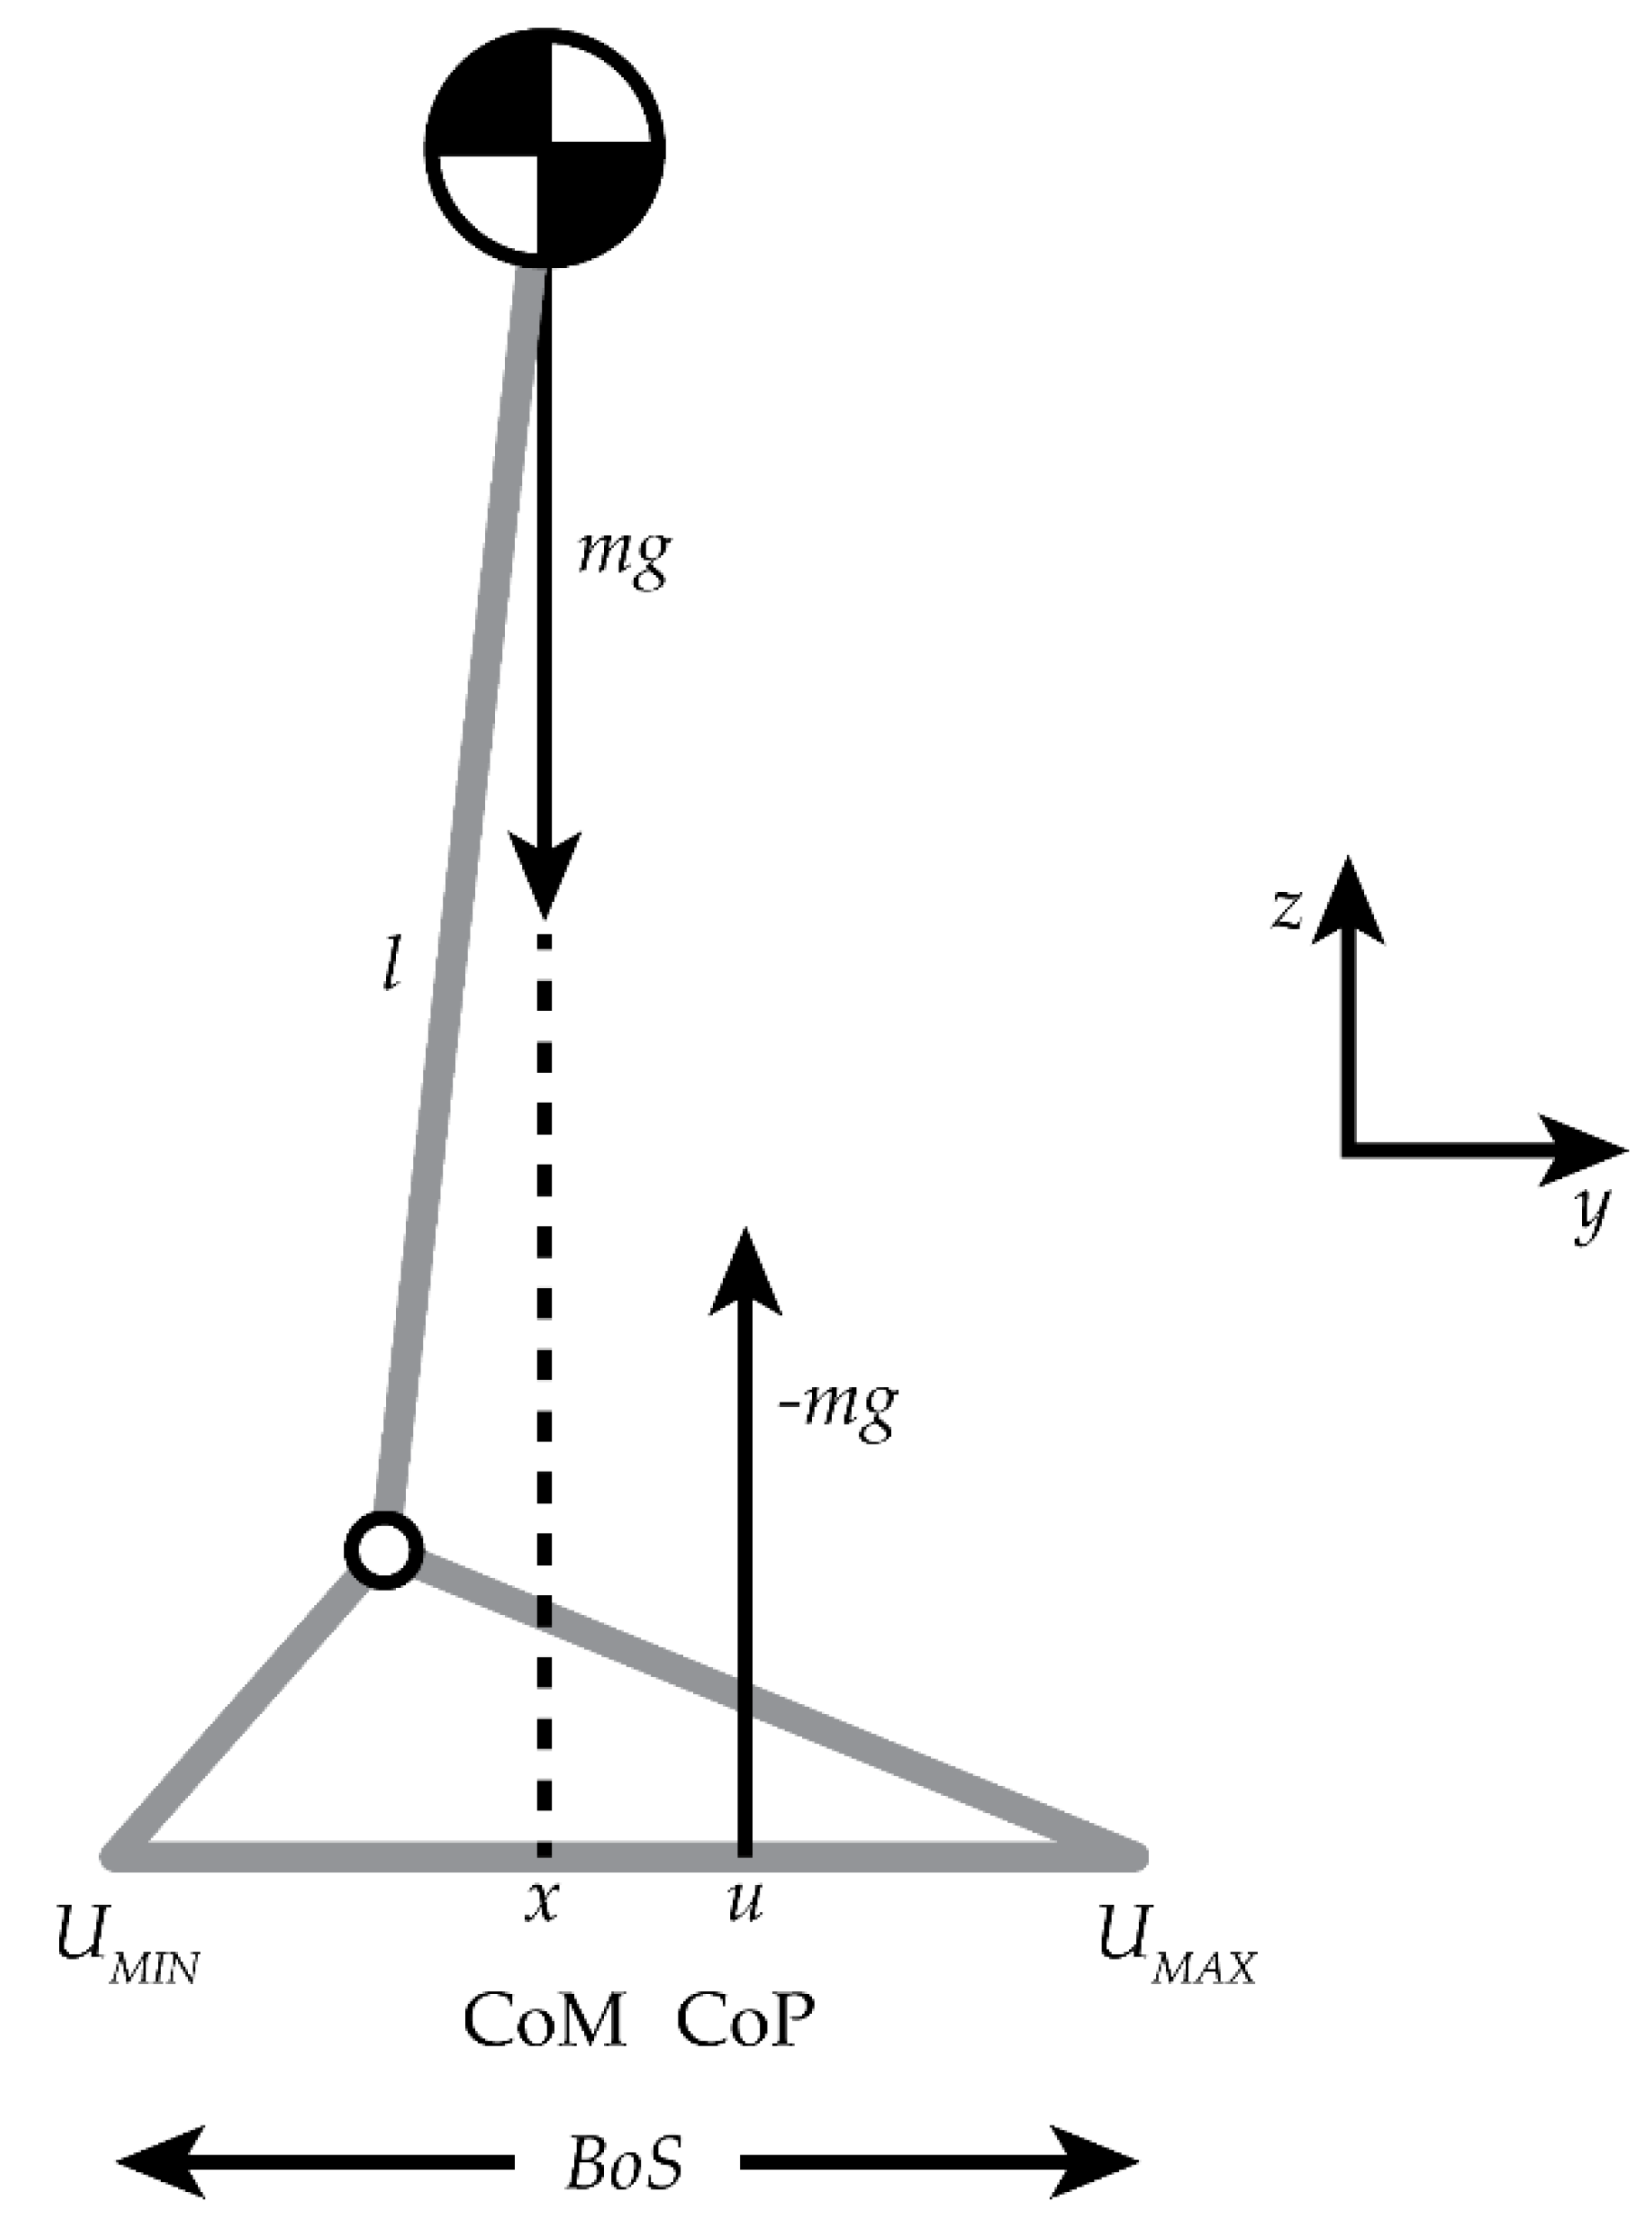
Figure 2.1.
The laboratory coordinate system established at the corner of FP2 with positive-x directed posterior, positive-y directed toward the dancer, and positive-z upward relative to the turn initiation position, with the right and left feet placed on FP3 and FP5, respectively. The blue arrows projecting in the z-direction represent vertical ground reaction forces.
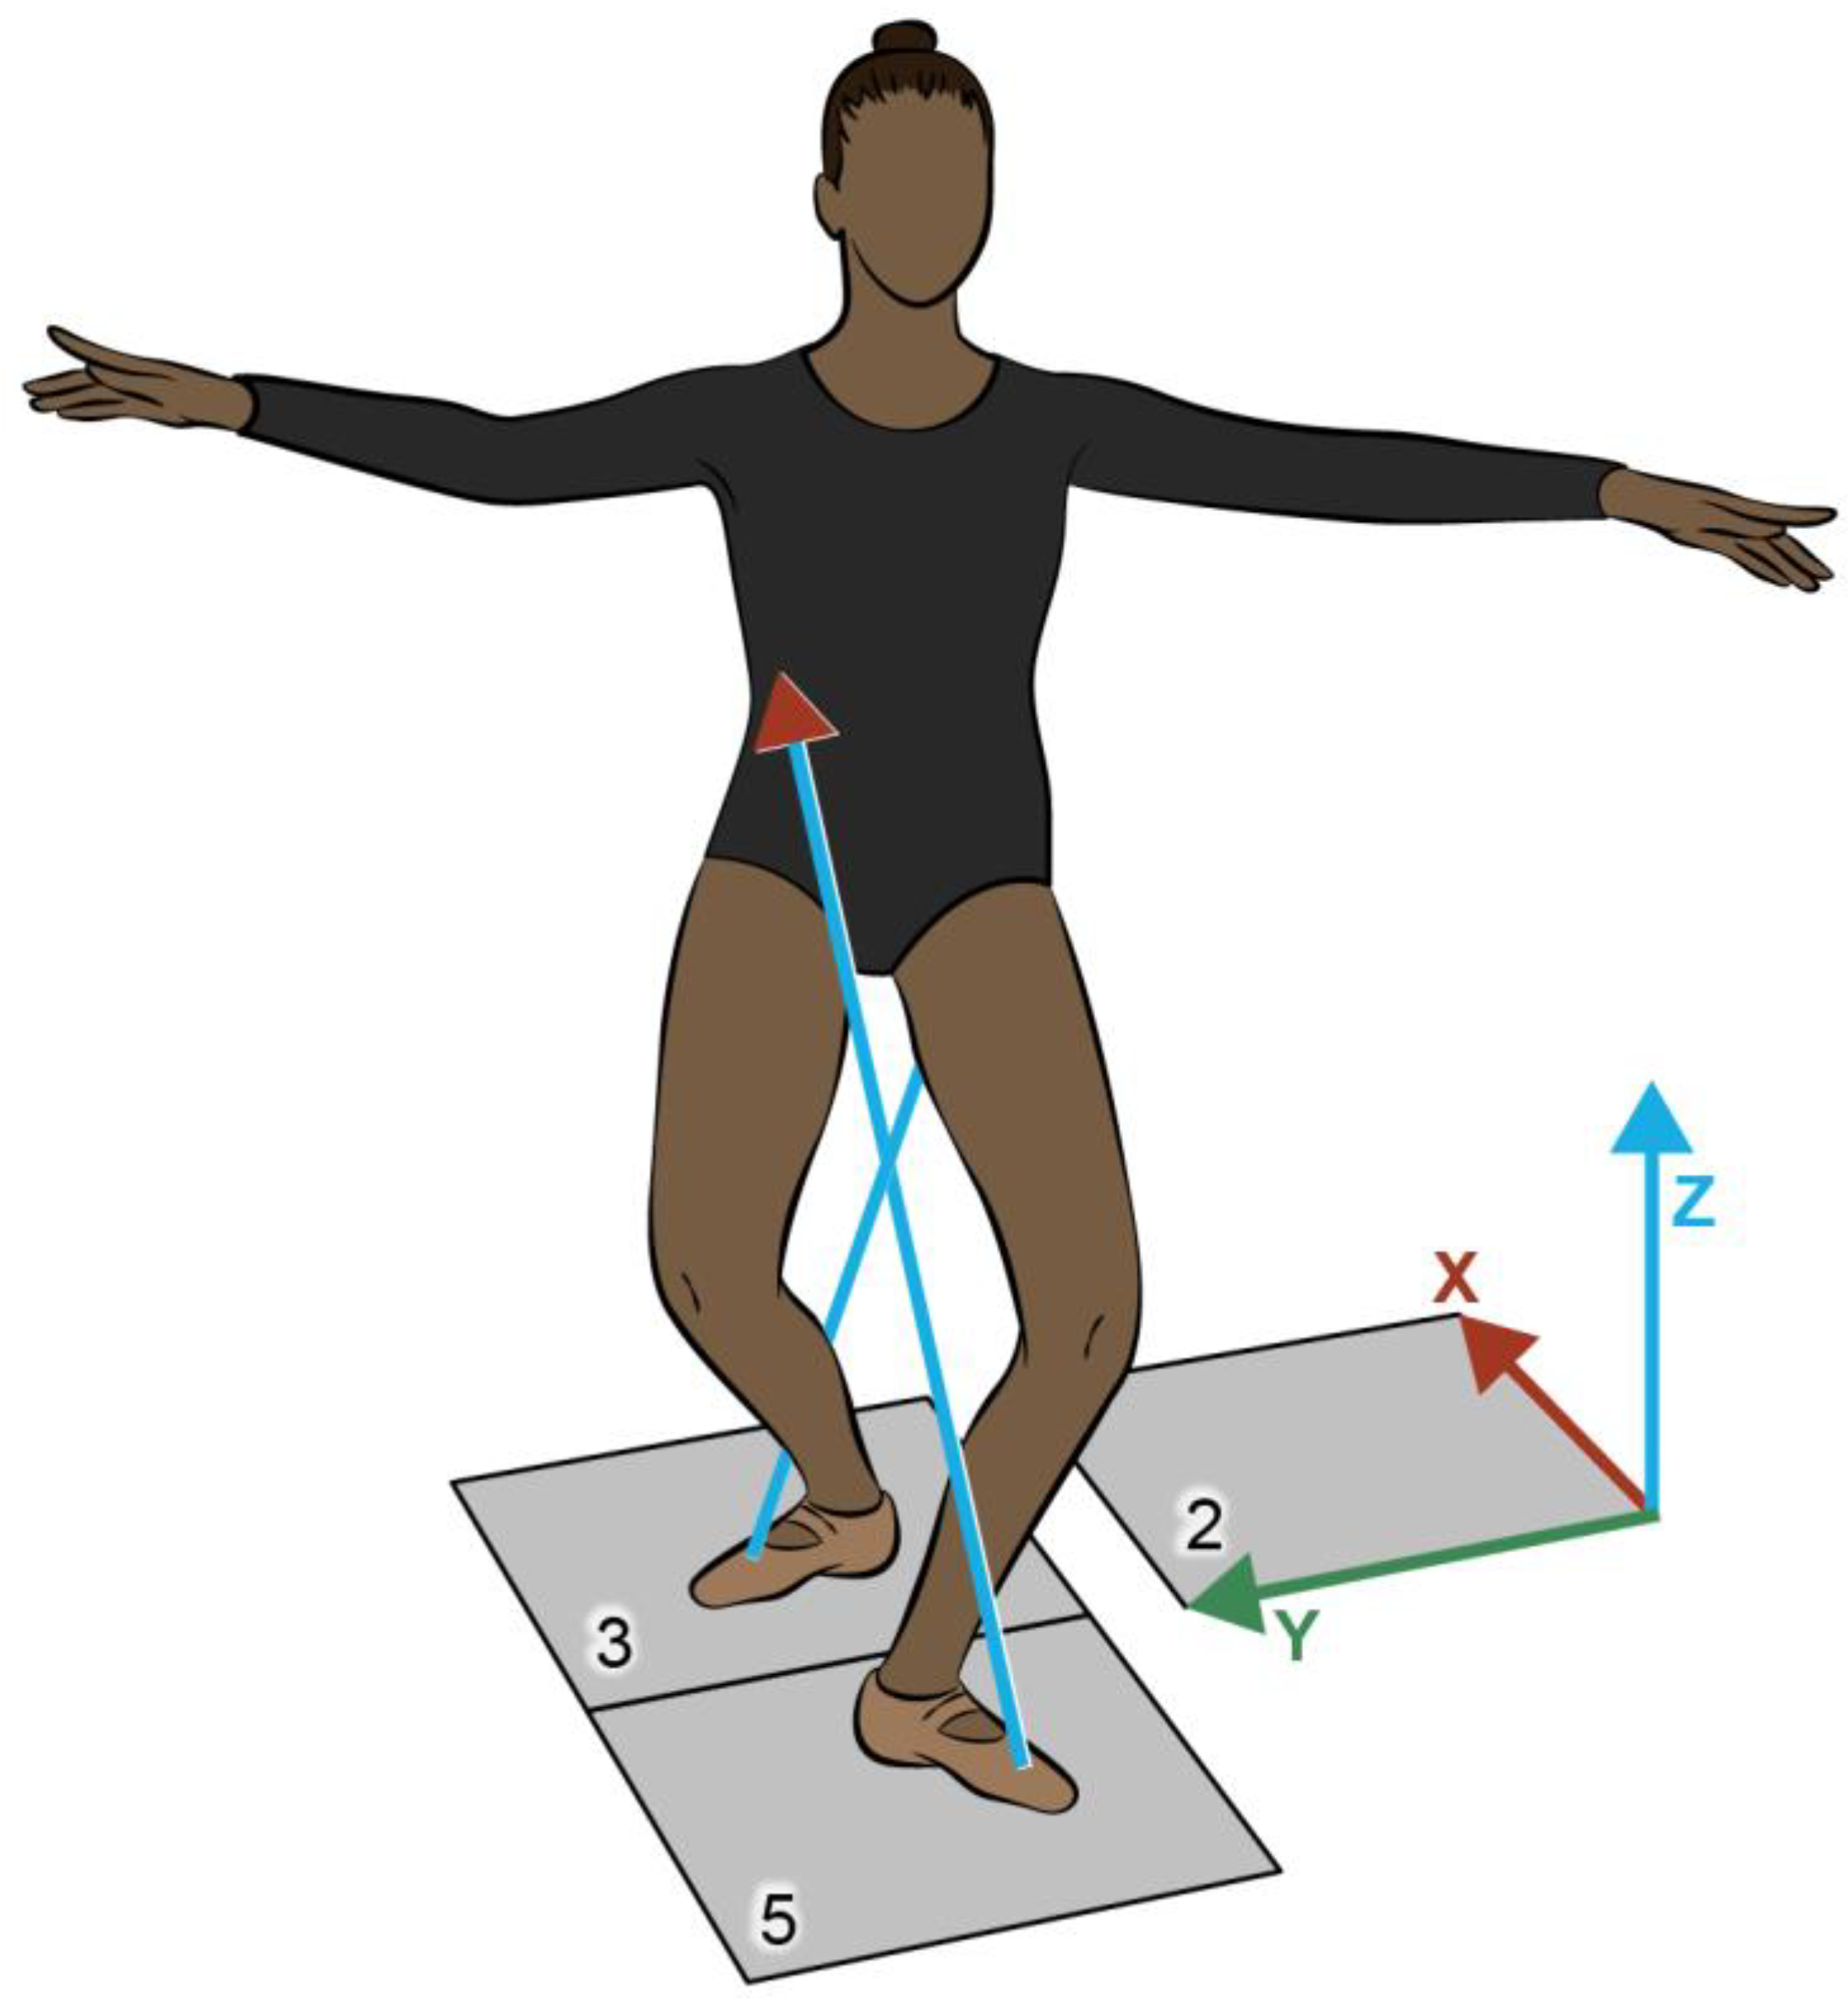
Figure 2.2.
The topple angle, θ, is the angle between the vertical dotted. line and the line connecting the dancer’s CoM to the center of the C0P (i.e., BoS) on the floor.
Figure 2.2.
The topple angle, θ, is the angle between the vertical dotted. line and the line connecting the dancer’s CoM to the center of the C0P (i.e., BoS) on the floor.
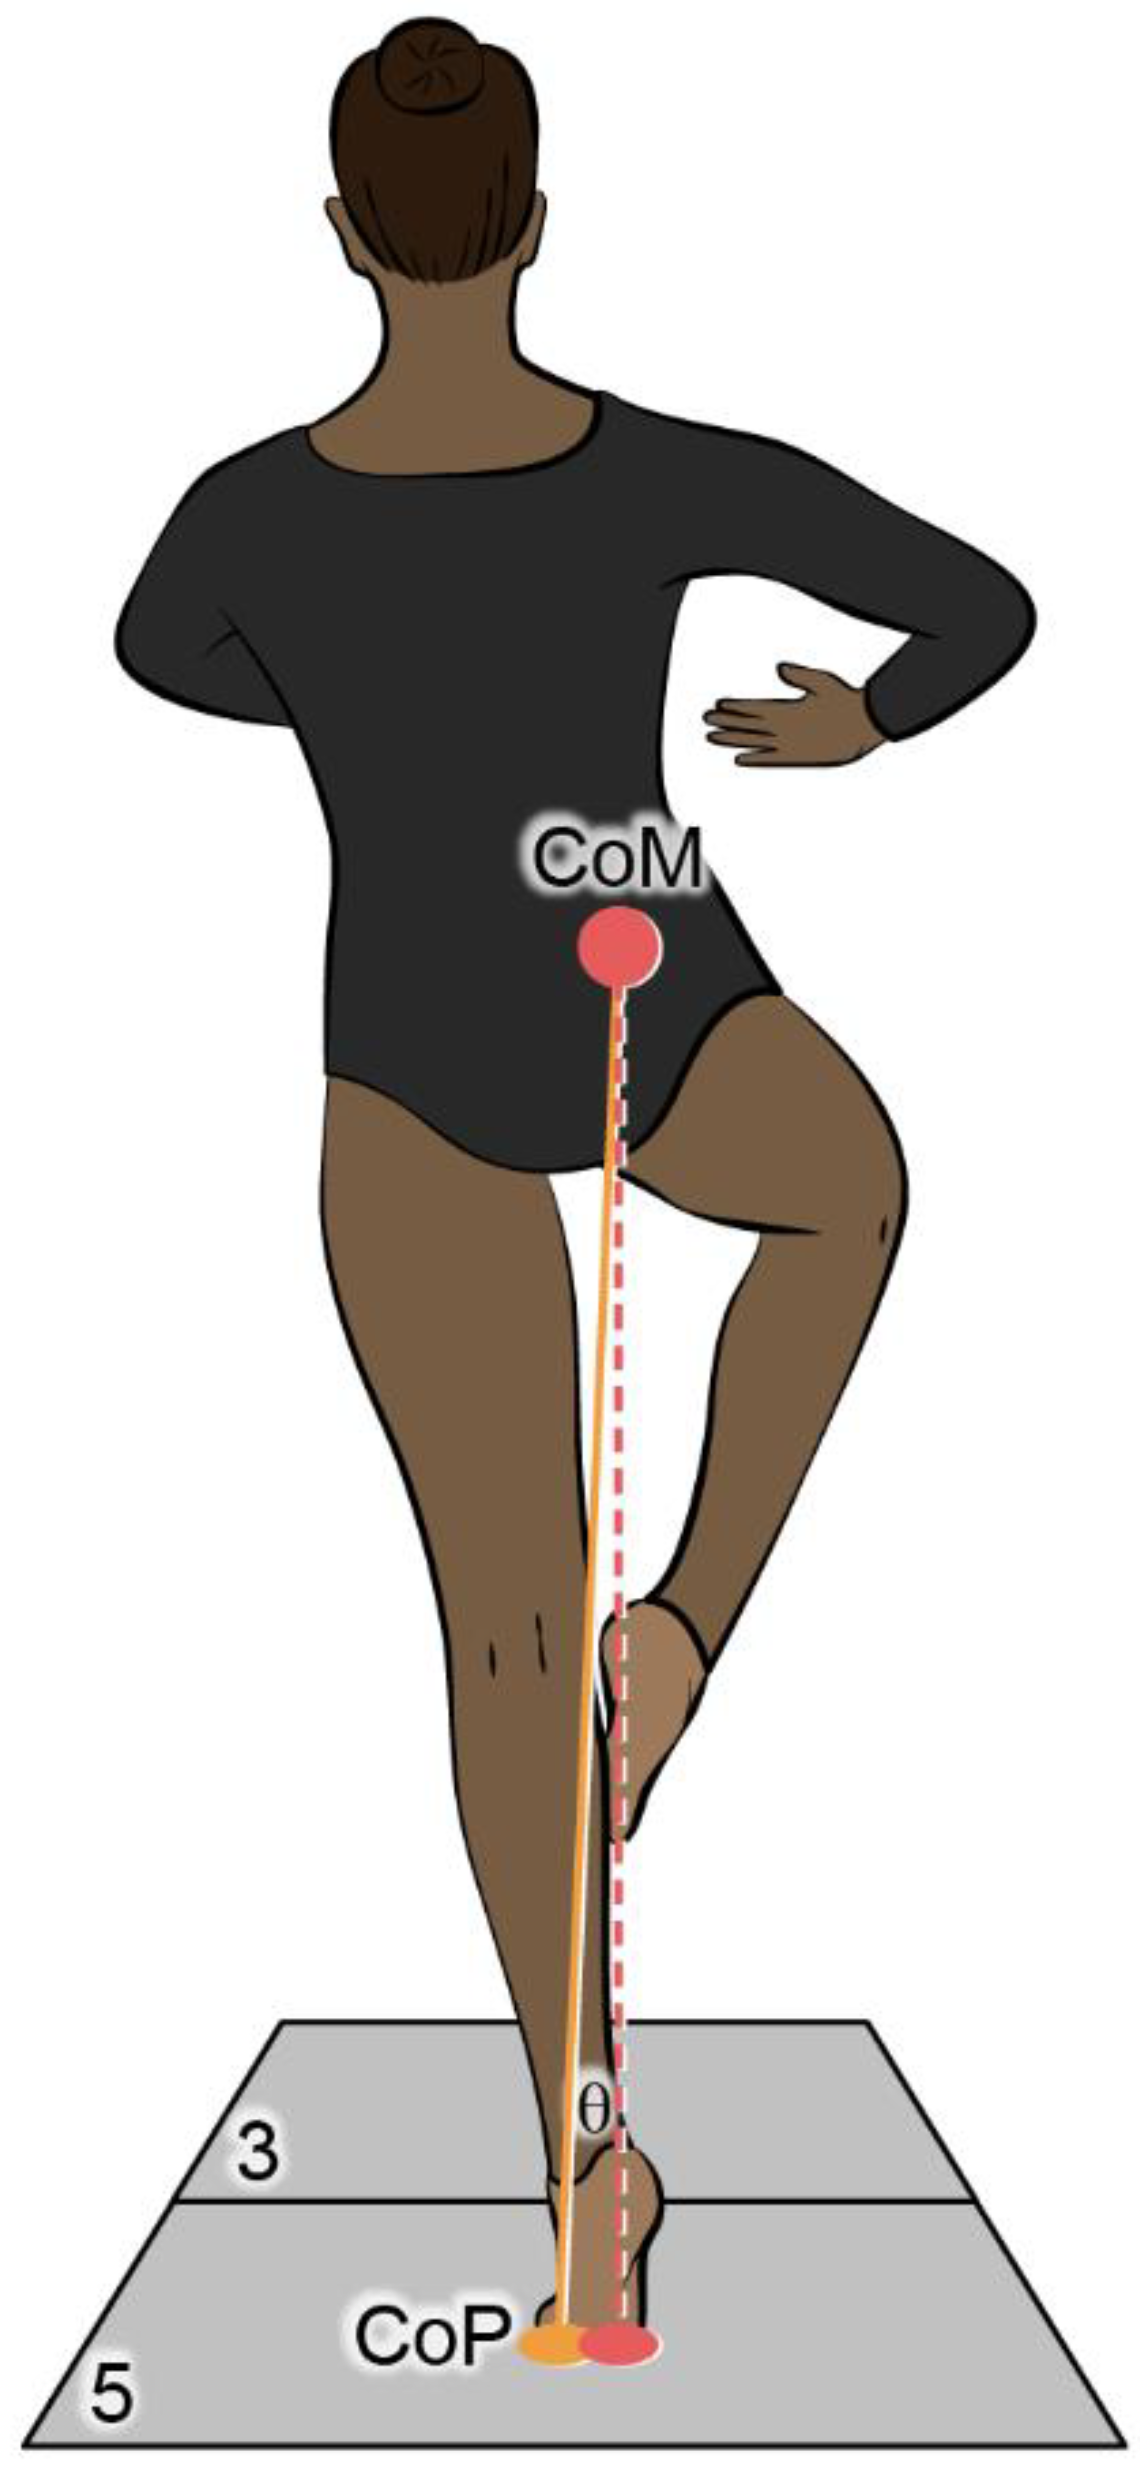
Figure 2.3.
A) The BoS center was determined for this study by the boundary created by the left proximal 1st metatarsal (LP1M), left distal 1st metatarsal (LD1M), left proximal 5th metatarsal (LP5M), and left distal 5th metatarsal (LD5M) markers, B) the virtual LFT foot coordinate system originated at the left ankle joint center then projected to the floor with the y-axis representing the A/P direction of the left foot and the x-axis representing the M/L direction of the left foot.
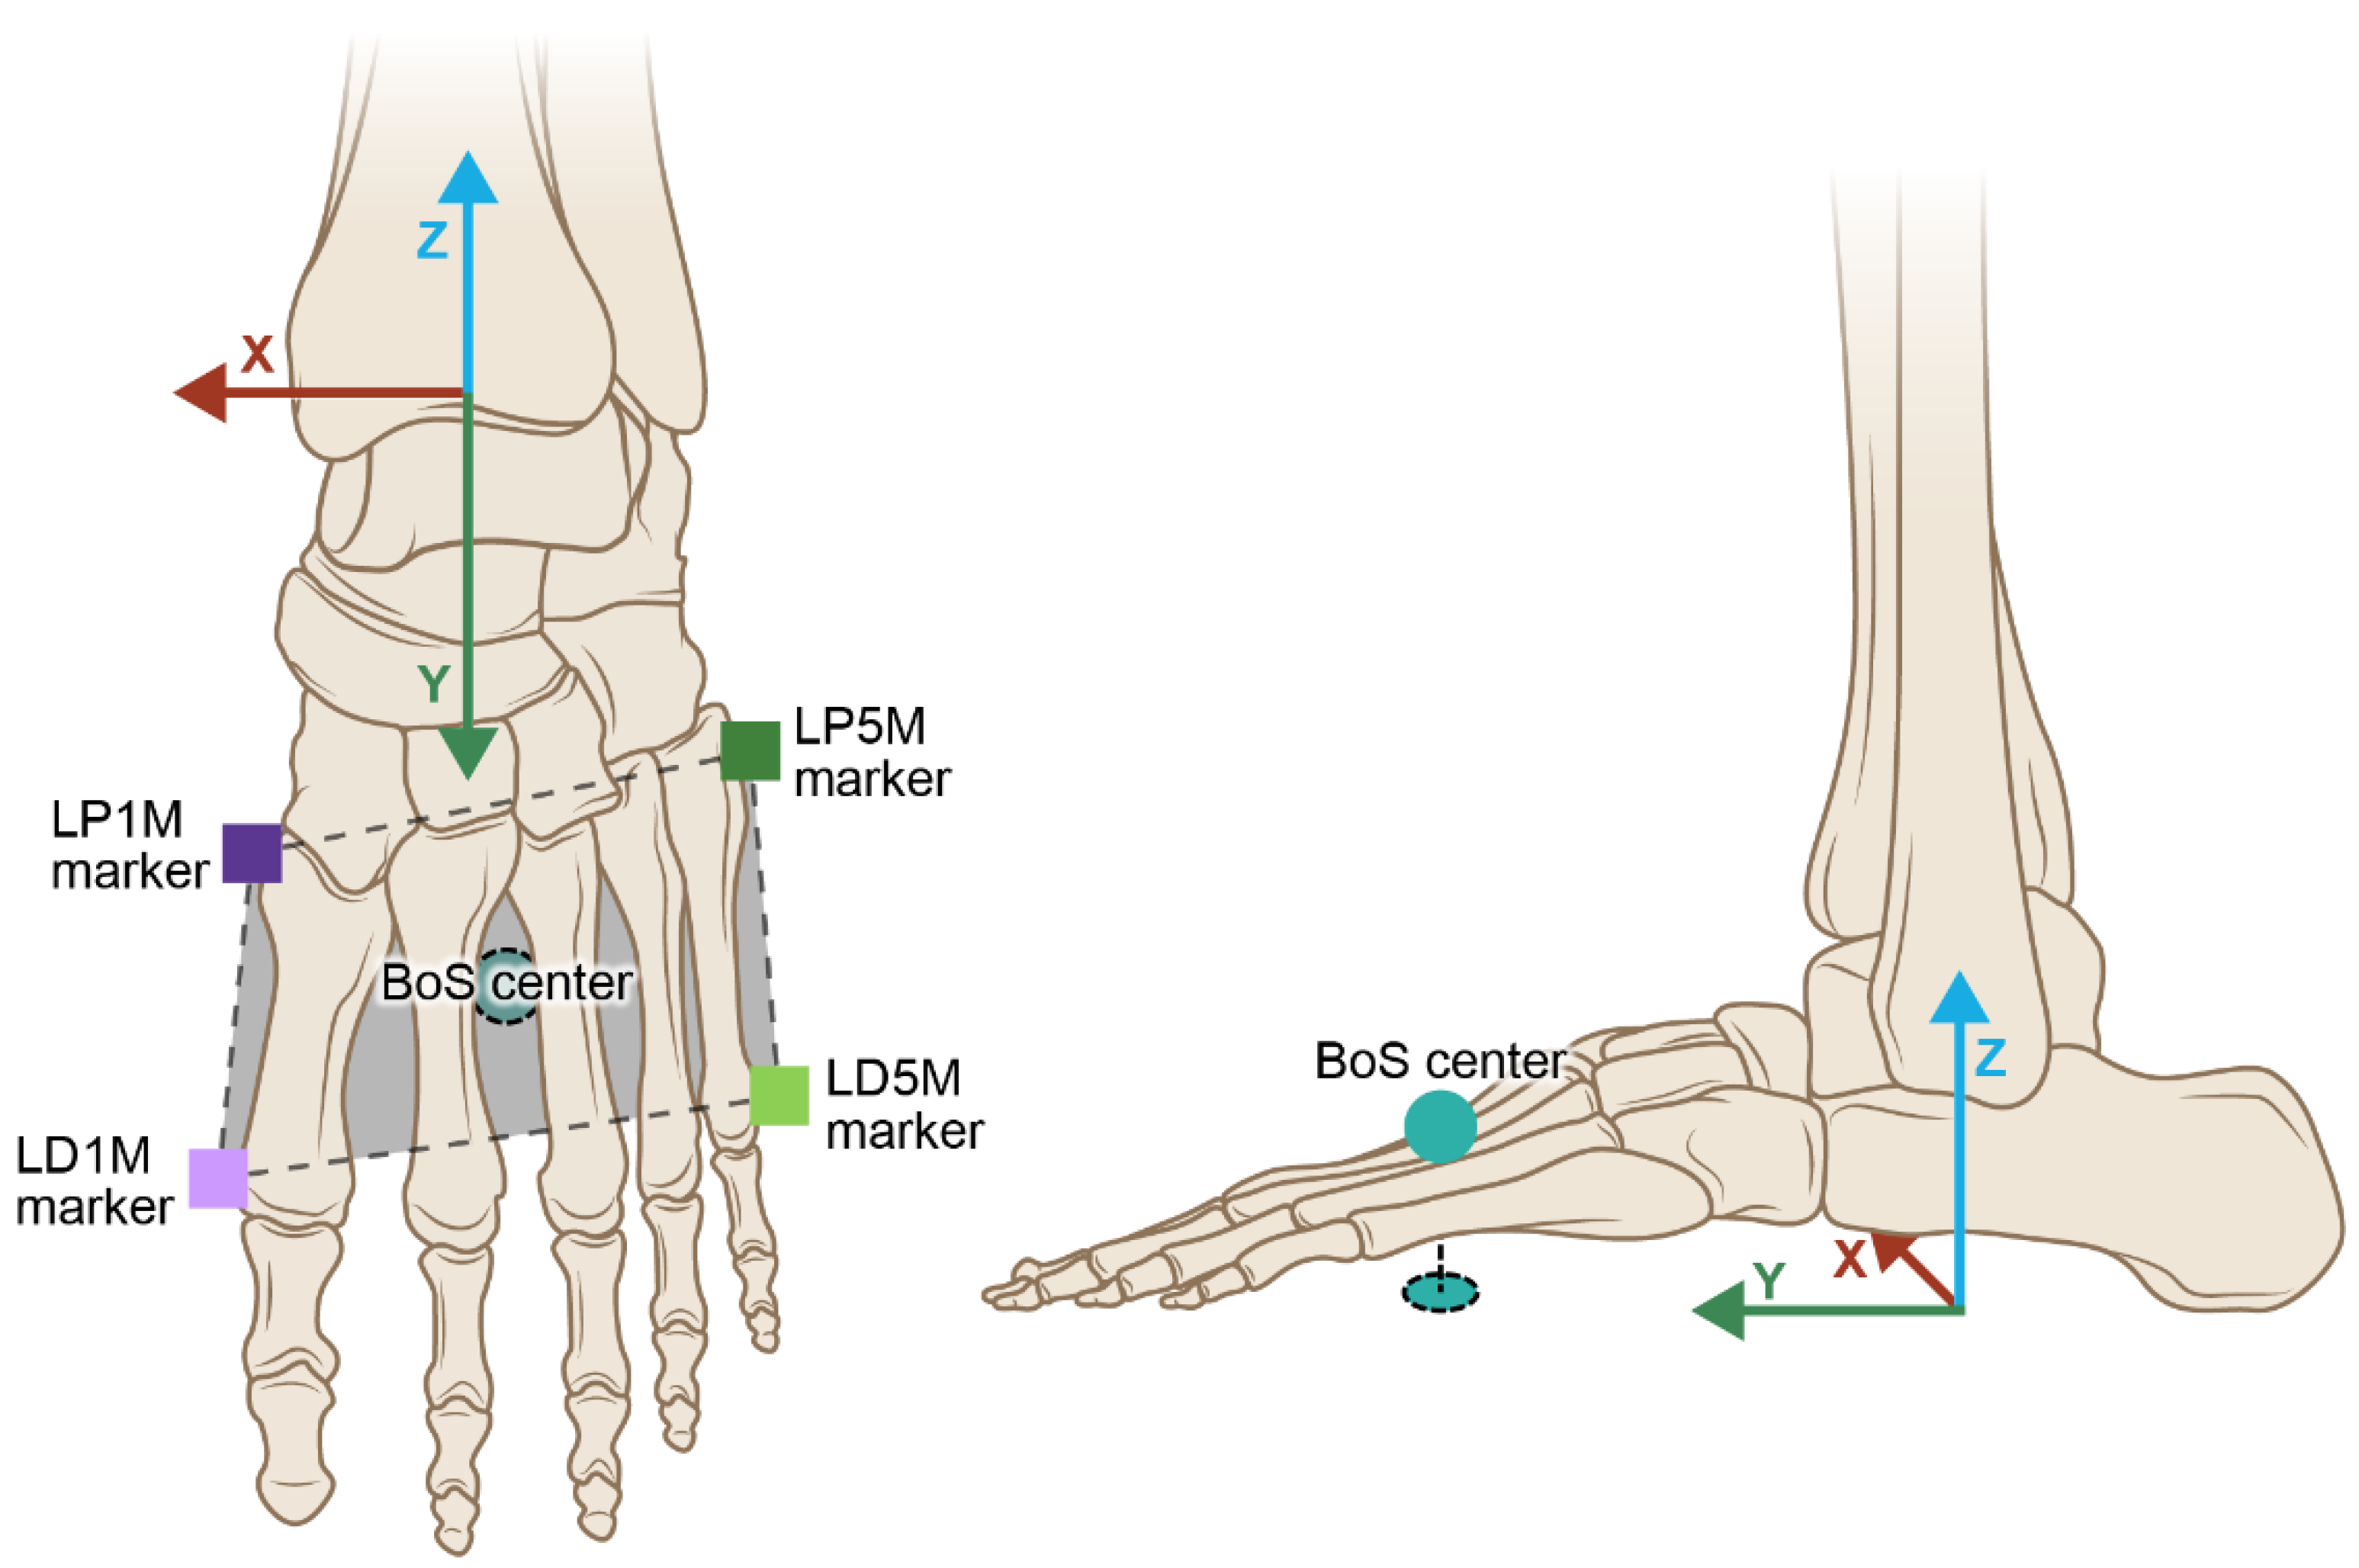
Figure 2.4.
The MoS was determined in two ways during a successful turn: 1) the distance from the XCoM to the BoS center and 2) the distance from the XCoM to the CoP. The MoS represents the magnitude of excursion that the XCoM moves relative to the BoS center or the CoP as the dancer balances while turning.
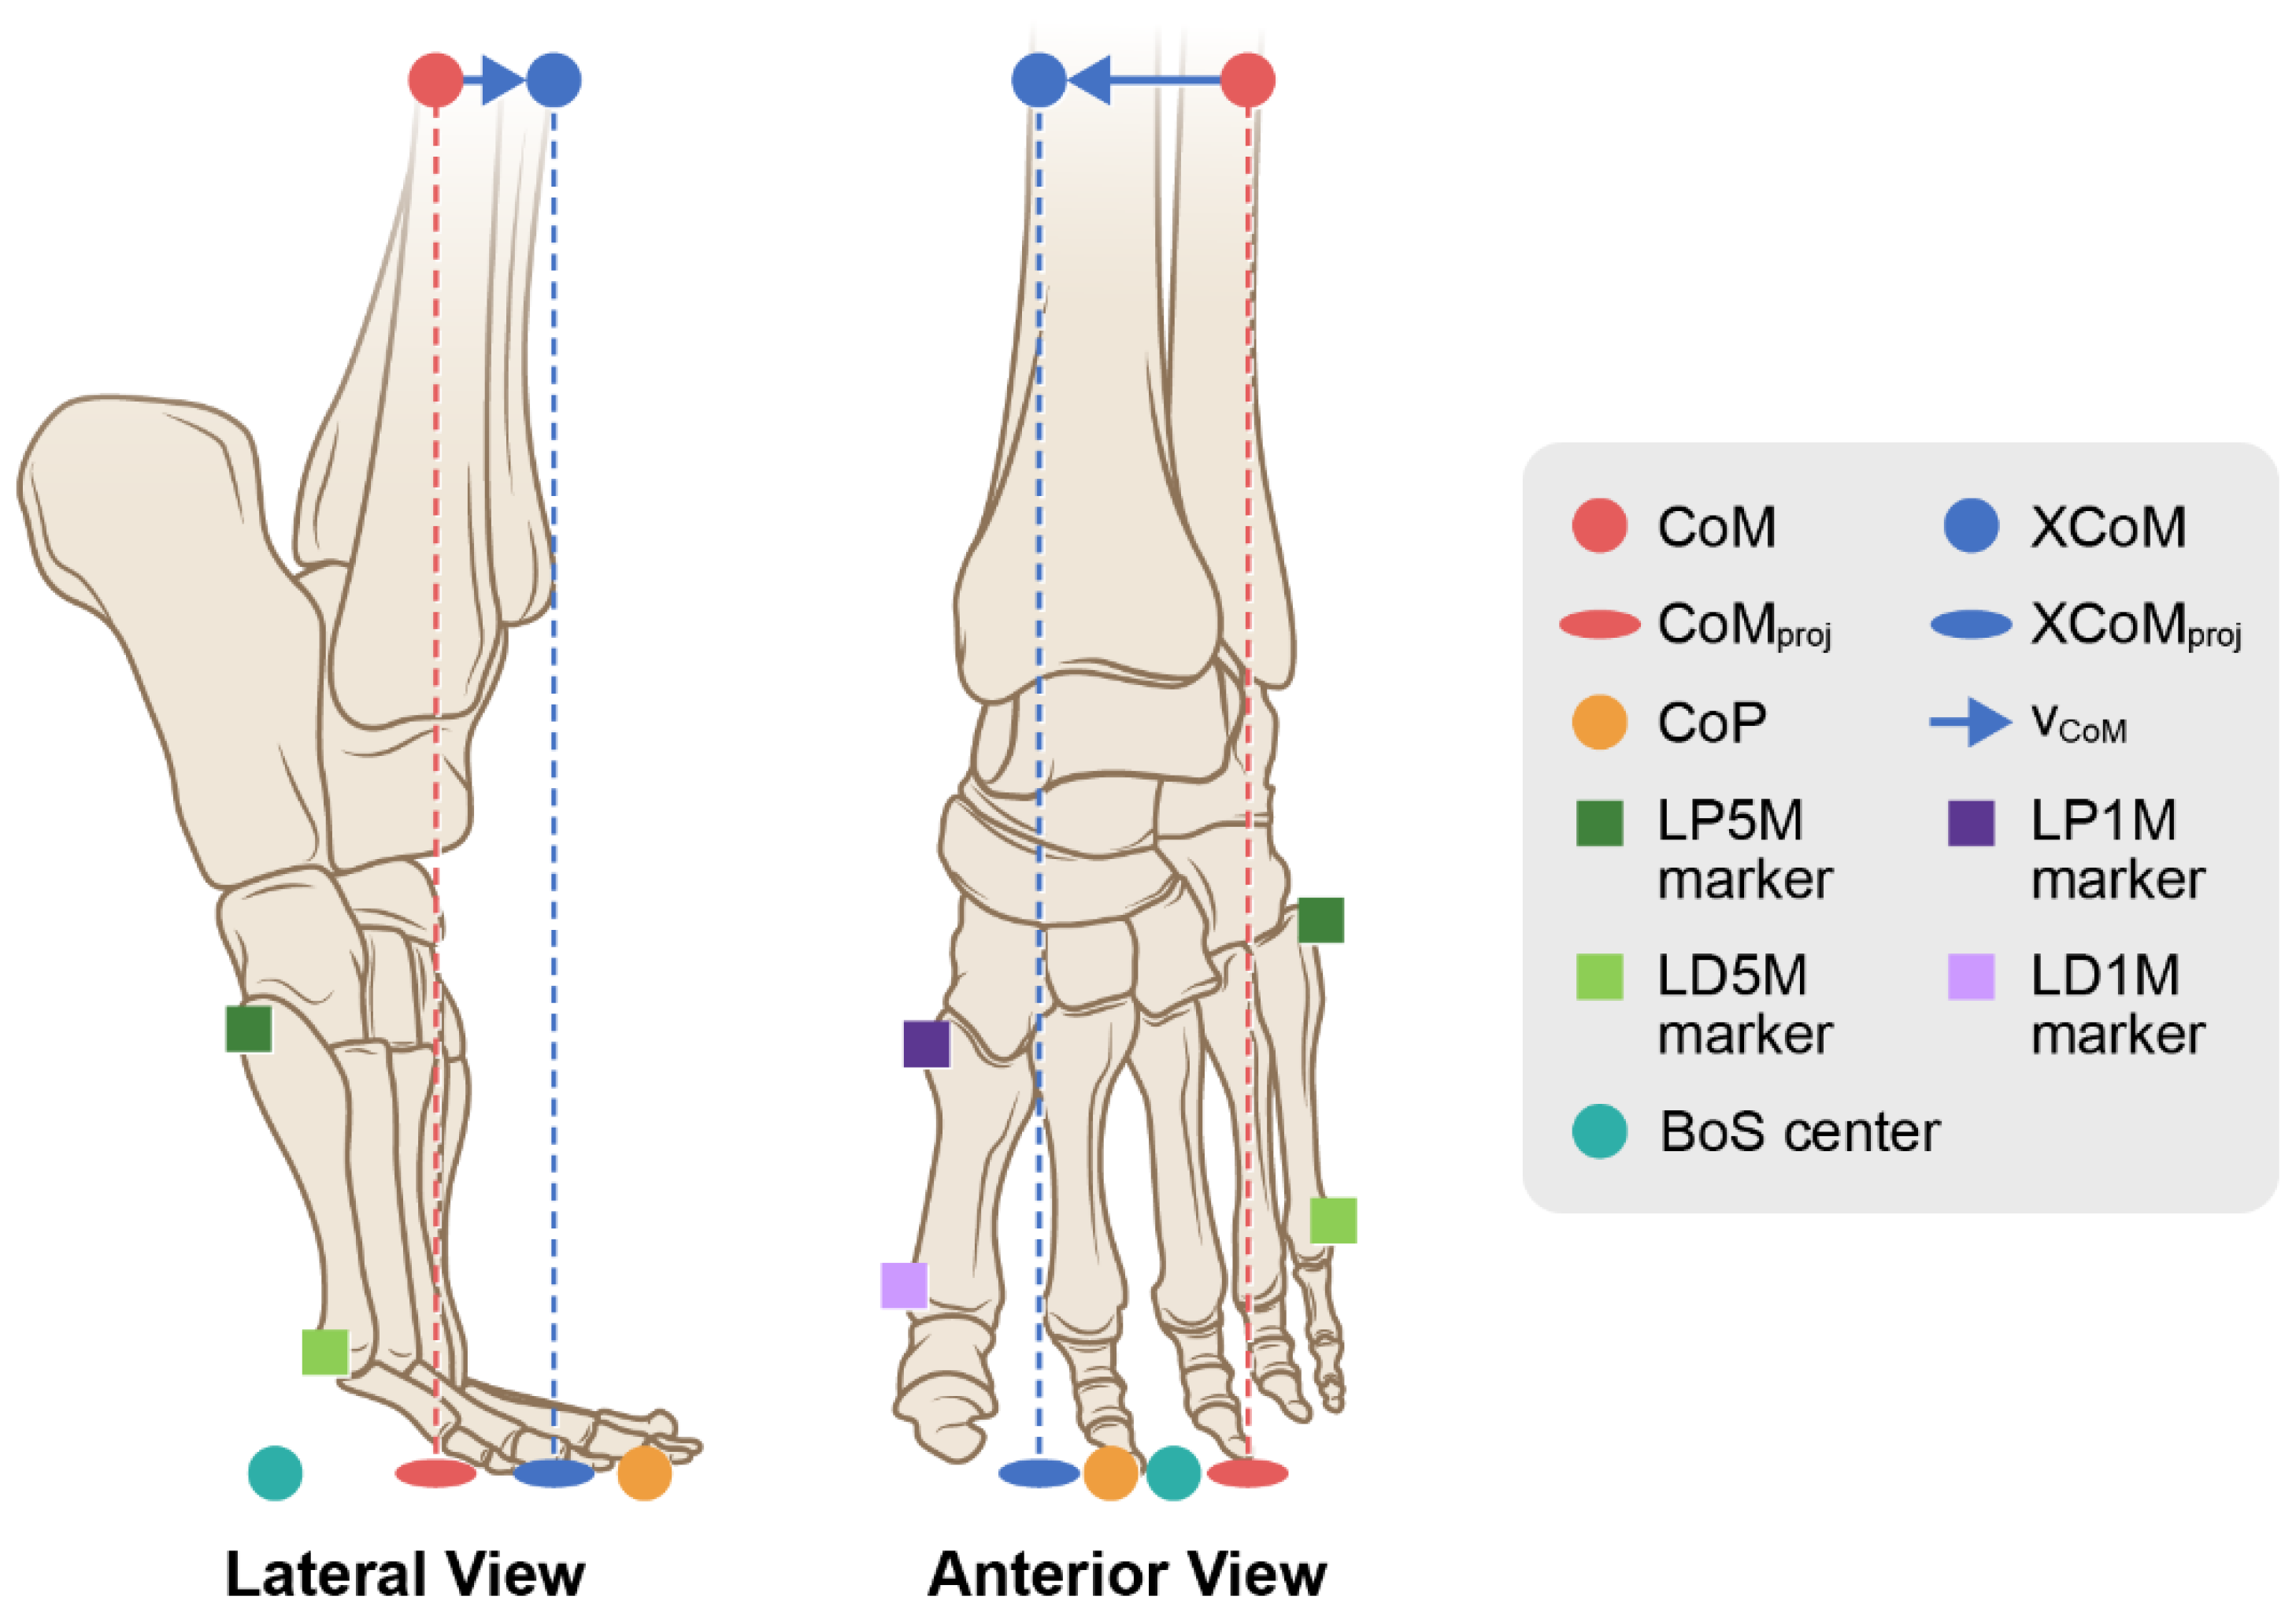
Figure 3.1.
The location of the projected CoM onto the floor (black), projected XCoM (red), and CoP (green) of the stance leg along the y- (M/L) (graph on the left) and x- (A/P) axes (graph on the right) of the LCS in percent stance during the turn phase of a representative trial. For movement along the M/L axis a larger value indicates movement toward the origin (or to the right); along the A/P axis a reduced negative value indicates a posterior movement, and a greater negative value indicates a forward movement (see Figure 2.1).
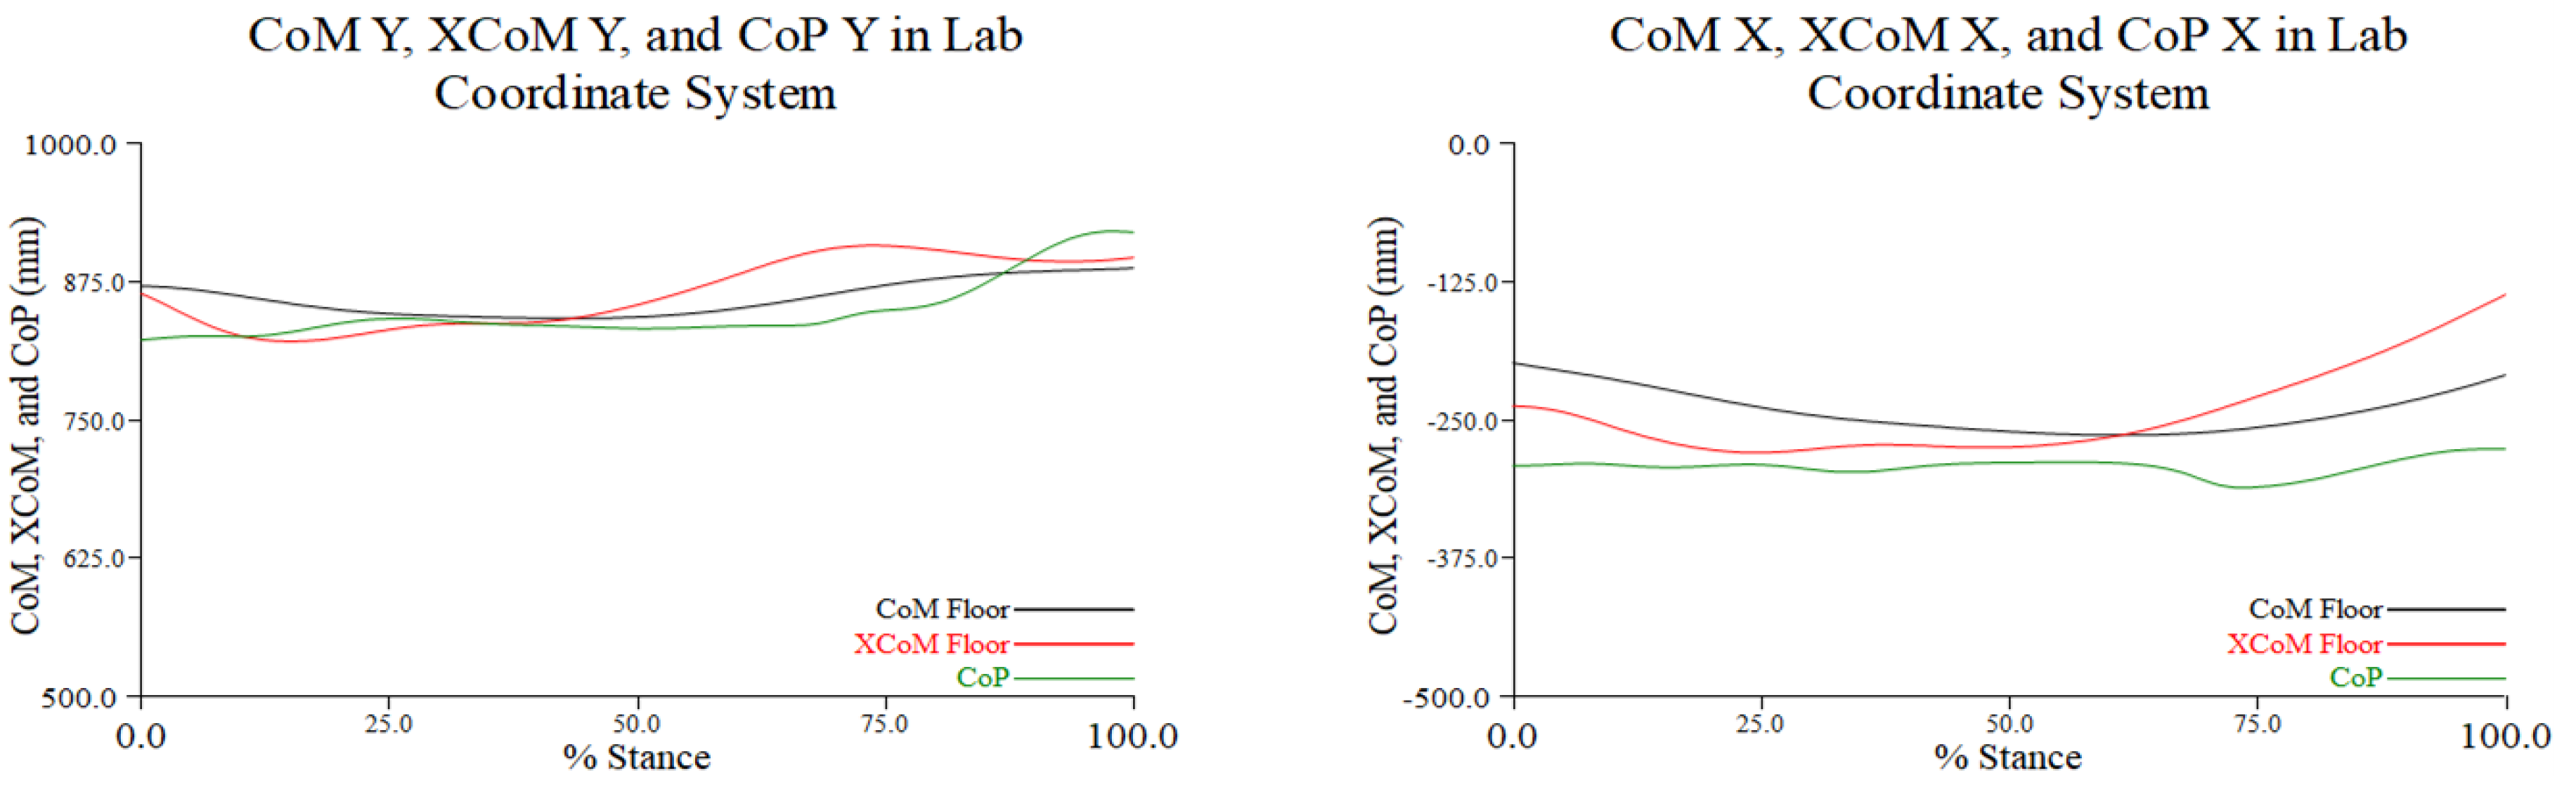
Figure 3.2.
The location of the projected CoM onto the floor (black), projected XCoM (red), and CoP (green) of the stance leg along the y- (A/P) (graph on the left) and x- (M/L) (graph on the right) axes of the LFT CS in percent stance during the turn phase of a representative trial. For movement along the A/P axis a positive value indicates anterior positioning and posterior movement as the metrics approach the origin, i.e., 0; for movement along the M/L axis a positive value reflects movement to the right (or medial) and negative values reflect a posterior excursion (see Figure 2.3).
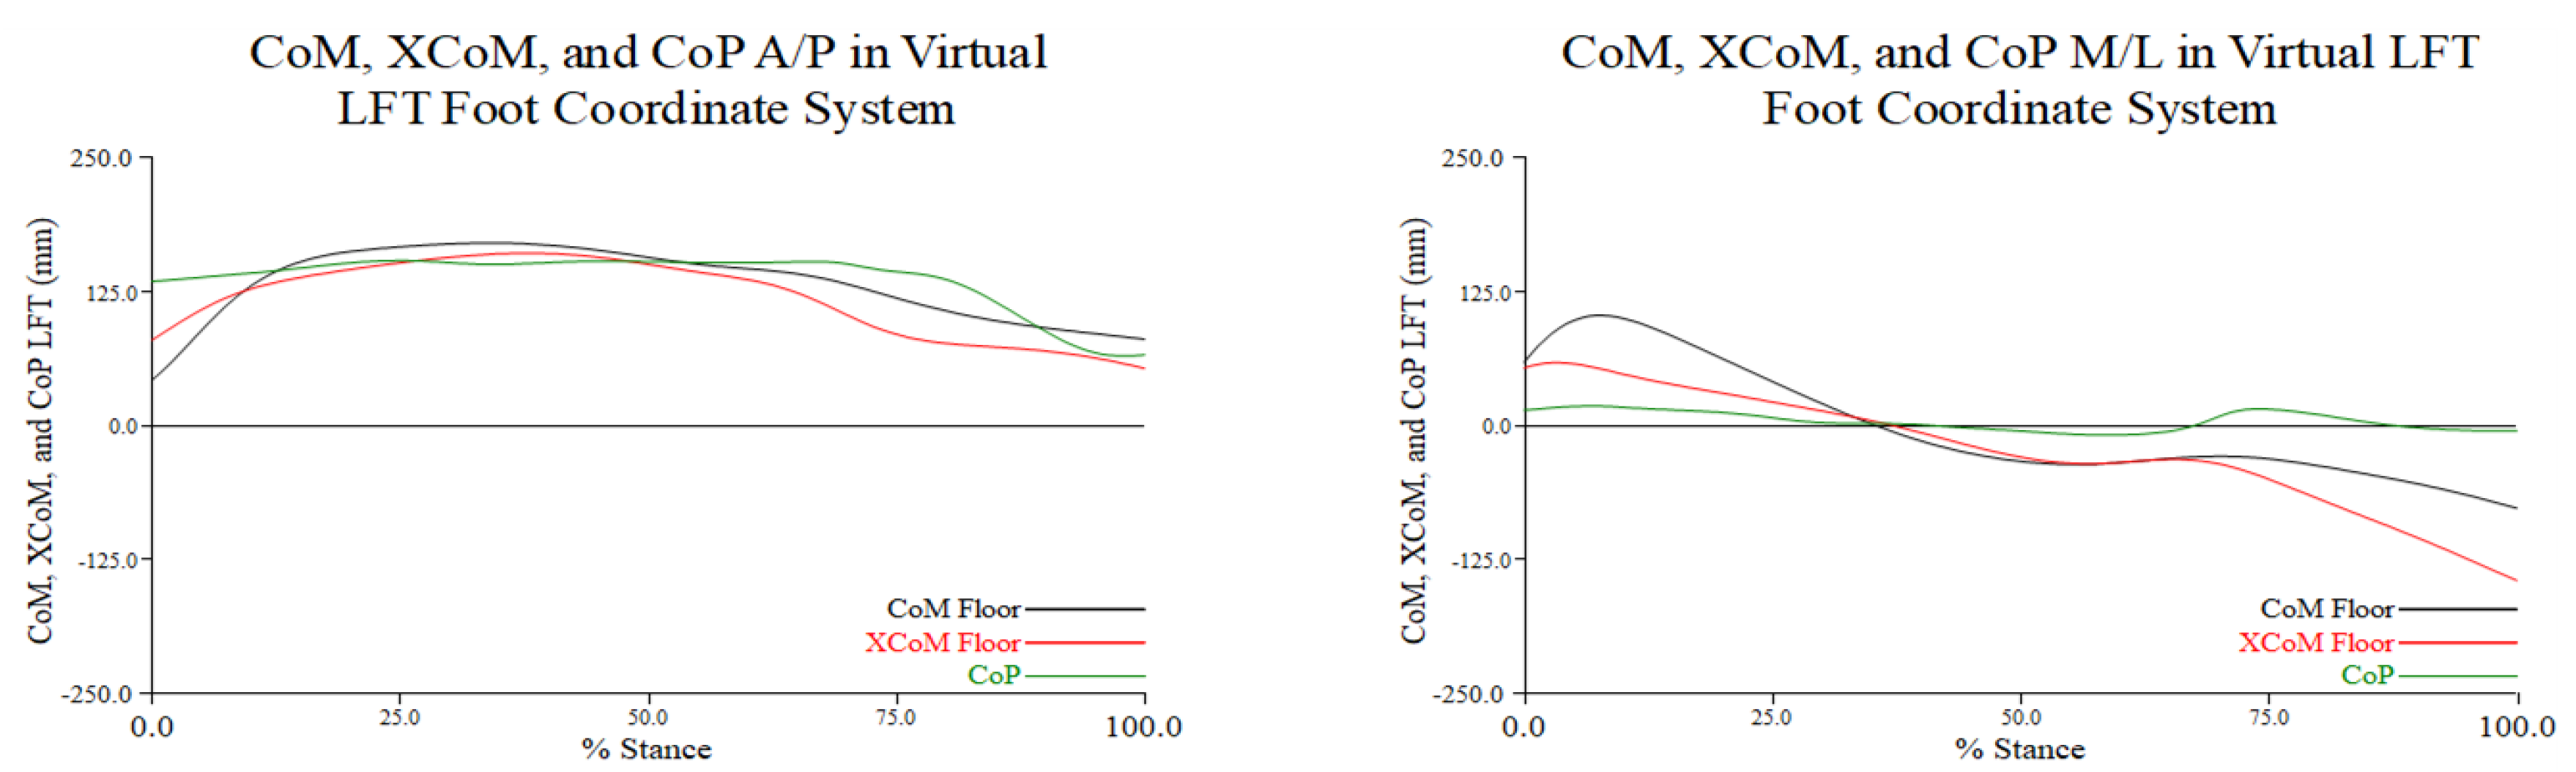
Figure 3.3.
The distance in millimeters between XCoM and CoP of the stance leg (black) and the distance between the XCoM and BoS center (red) along the A/P (graph on the left) and M/L (graph on the right) axes of the LFT CS throughout the turn phase in percent stance. Positive values along the A/P axis indicate that the CoP or BoS center is anterior to the XCoM, and negative values indicate that the CoP or BoS center is posterior to the XCoM; positive values along the M/L axis indicate that the CoP or BoS center is medial to the XCoM, and negative values indicate that the CoP or BoS center is lateral to the XCoM. Note: distance is the excursion or movement of the XCoM relative to the CoP and BoS center.
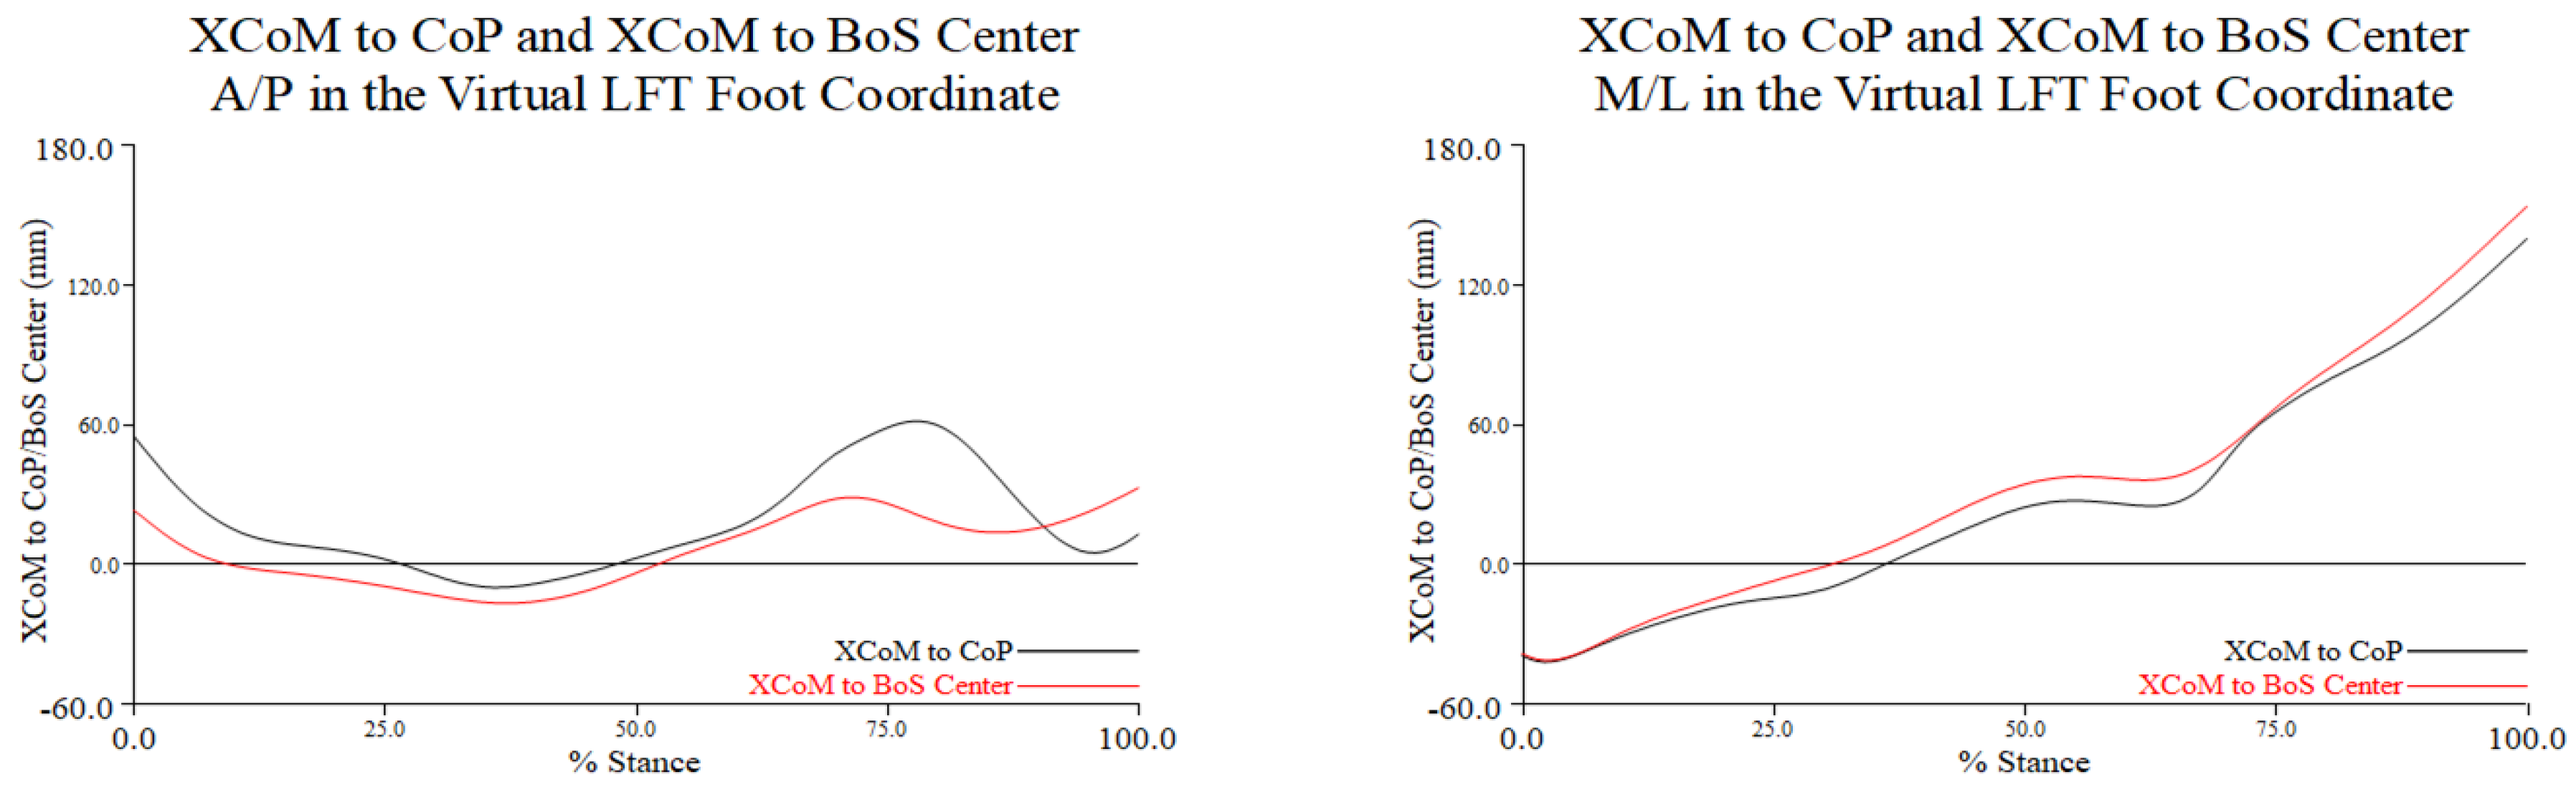
Figure 3.4.
The topple angle during the turn phase in percent stance. This angle is created by the vertical projection of the CoM to the ground and a line connecting the CoM to the most lateral position of the CoP.
Figure 3.4.
The topple angle during the turn phase in percent stance. This angle is created by the vertical projection of the CoM to the ground and a line connecting the CoM to the most lateral position of the CoP.
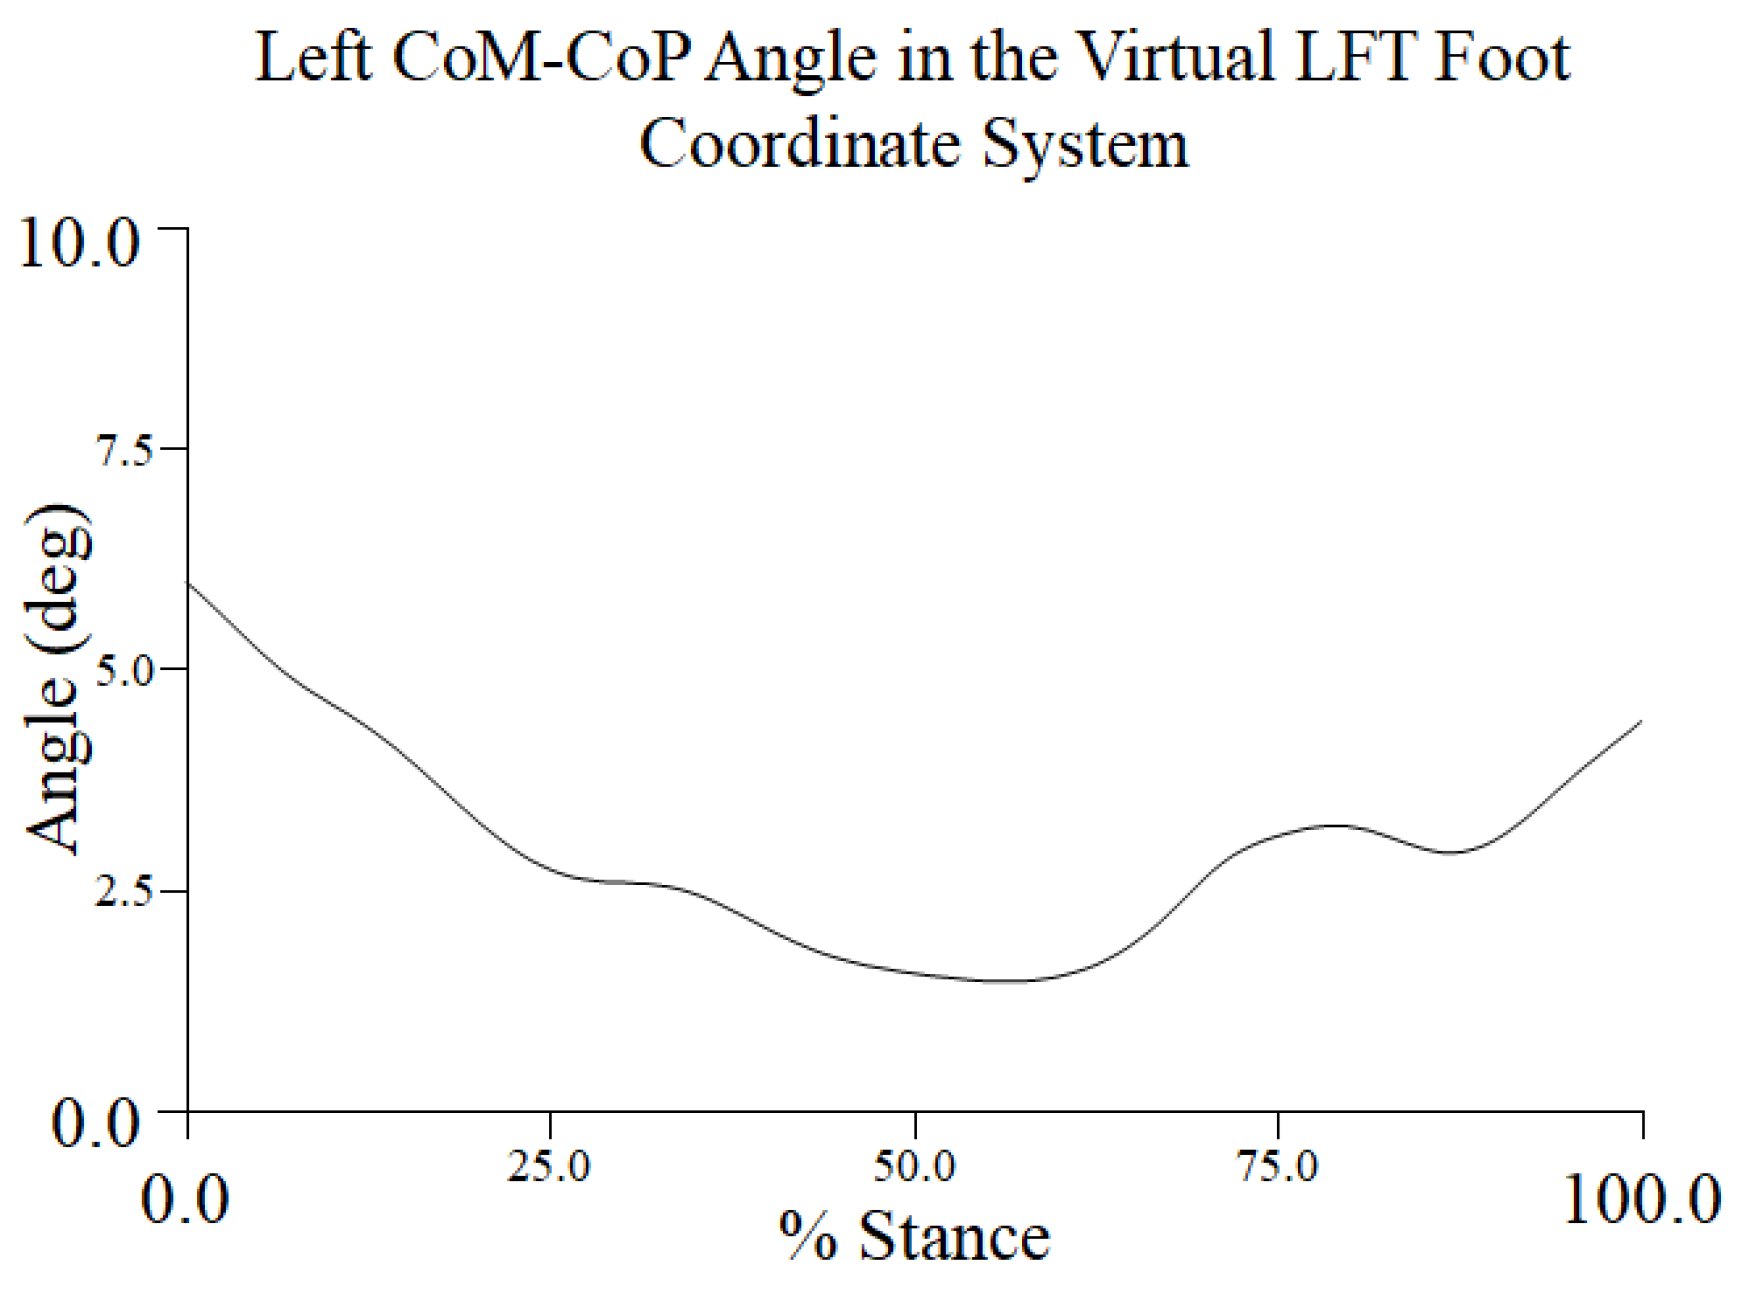

Table 3.1.
The mean (mm), SD, and CV for the distance between XCoM to BoS center and XCoM to CoP for each participant in the A/P (y-axis) and M/L (x-axis) directions in the LFT CS.
Table 3.1.
The mean (mm), SD, and CV for the distance between XCoM to BoS center and XCoM to CoP for each participant in the A/P (y-axis) and M/L (x-axis) directions in the LFT CS.
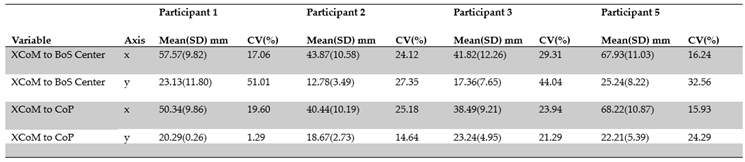 |
Table 3.2.
The mean (mm), SD, and CV for the distance between XCoM to BoS center and XCoM to CoP across the four participants in the A/P (y-axis) and M/L (x-axis) directions in the LFT CS.
Table 3.2.
The mean (mm), SD, and CV for the distance between XCoM to BoS center and XCoM to CoP across the four participants in the A/P (y-axis) and M/L (x-axis) directions in the LFT CS.
| Variable | Axis | Mean(SD) mm | CV(%) |
|---|---|---|---|
| XCoM to BoS Center | x | 52.80(12.28) | 14.31 |
| XCoM to BoS Center | y | 19.63(5.65) | 23.25 |
| XCoM to CoP | x | 49.37(13.60) | 27.54 |
| XCoM to CoP | y | 21.10(2.03) | 9.62 |
Table 3.3.
The mean (degrees), SD, and CV for the topple angle within participants in the LFT CS.
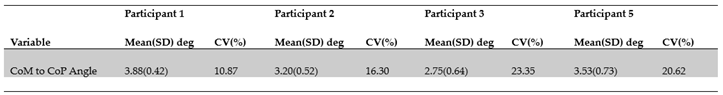 |
Table 3.4.
The mean (degrees), SD, and CV for the topple angle across all participants in the LFT CS.
Table 3.4.
The mean (degrees), SD, and CV for the topple angle across all participants in the LFT CS.
| Variable | Mean(SD) deg | CV(%) |
|---|---|---|
| CoM to CoP Angle | 3.34(0.48) | 14.31 |
Disclaimer/Publisher’s Note: The statements, opinions and data contained in all publications are solely those of the individual author(s) and contributor(s) and not of MDPI and/or the editor(s). MDPI and/or the editor(s) disclaim responsibility for any injury to people or property resulting from any ideas, methods, instructions or products referred to in the content. |
© 2025 by the authors. Licensee MDPI, Basel, Switzerland. This article is an open access article distributed under the terms and conditions of the Creative Commons Attribution (CC BY) license (https://creativecommons.org/licenses/by/4.0/).
Copyright: This open access article is published under a Creative Commons CC BY 4.0 license, which permit the free download, distribution, and reuse, provided that the author and preprint are cited in any reuse.


