Submitted:
17 May 2025
Posted:
19 May 2025
You are already at the latest version
Abstract
The notion of Dark Matter originates from the violation of Virial Theorem in galaxy clusters and the empirical evidence of flat or increasing rotation curves in disk galaxies. From novel advances on basic properties of cosmic rays it emerges the necessity of ubiquitous electrostatic fields in disk galaxies and galaxy clusters. In this study it is argued that the electrostatic field in the Milky Way Galaxy exerts an attractive force on rotating stars and clouds which adds to gravity yielding slightly increasing rotation curves in the radial range from 8.5 to 15 kpc and decreasing curves beyond 15 kpc. Calculations are favorably compared with the rotation curves based on 21 cm HI gas emission, infrared emission from molecular clouds, Cepheid stars, Carbon stars, Planetary Nebulae and MASER from clouds excited by O and B stars. The results of this work interfuse with the numerous null results of Dark Matter quest in laboratories, caverns and particle accelerators during half a century and it is concluded that Dark Matter does not exist. It is a simple electrostatic effect of giant material bodies absorbing positive electric charge from extinguished cosmic rays.
Keywords:
dark matter
; rotation curves in spiral galaxies
; flat rotation curves
; galactic electric field
1. Introduction
It is a fact that most spiral galaxies of the nearby Universe do have flat rotation curves but not those in the remote Universe [1]. Since more than half a century flat rotation curves of some hundreds of spiral galaxies have been well measured. On the contrary, it is known that the gravitational pull of galactic materials leads to decreasing rotation curves, not flat. Therefore, a problem developed during 90 years which was termed Dark Matter problem in spiral galaxies.
In other terms, the matter amount reckoned by astronomers generates an attractive force which is not sufficient to account for the observed flat rotation curves of stars and clouds orbiting the Galactic center. In a vast and persistent literature, imaginary material entities called Dark Matter are posited in such a way to exert an attractive force on material bodies. This paper presents a solution of dark matter problem : the attractive force is generated by the Galactic electrostatic field named here (g on foot for Galactic) and, consequently, Dark Matter as material bodies of any stock does not exist at all.
The force is necessarily attractive because the Galactic electrostatic field is directed toward the Galactic center [2,3] and rotating stars and clouds globally retain positive electric charge deposited by the extinguished cosmic rays.
Stars and clouds in the Galaxy retain a notable amount of positive electric charge deposited by cosmic-ray nuclei pervading the Galaxy. Consider as an example the , a typical G star. Charge deposition by cosmic rays occurs in two different modes in two separated stellar regions : the first process is the stopping of low-energy cosmic rays in the solar wind region and the second process is the stopping of all cosmic rays of low and high energies in the body by ionization and nuclear interactions. By solar body is meant all the high density material residing within photosphere. The electric charge per second deposited in the solar wind region and in the will be designated by (s for solar w for wind) and (ds for dense ), respectively.
Several fundamental prerequisites of empirical nature are inputs (1), (2), (3) to this work. (1) Cosmic rays above energies of a few have a prevailing positive charge. (2) The electric charge deposition by cosmic nuclei in the solar wind region mentioned above also apply to any stars as stellar winds are universal [4]. (3) Sun is a common G star with a typical stellar wind. It occupies a central position in the mass spectrum of stars, frequently termed the Salpeter initial function or any of its variants. lifetime and stellar wind are regarded as typical of G star category.
This paper is organized as follows : in Section 2 it is defined the volume occupied by the solar wind designated by ( on foot for solar cavity) where charge deposition of cosmic rays takes place. The adopted stationary condition of the electric charge flows within is based on potassium data of terrestrial meteorites [5] : the negative charge entering the solar cavity has to equalize the positive charge to avoid an unlimited accumulation. In Section 3 the equation governing the rotational motion of stars and clouds in the Galaxy is written down. Gravity and the electrostatic field cooperate to bind stars and clouds in the Galaxy. In Section 4 the radial dependence of the Galactic electric field relevant to this work is given. In Section 5 data of the visible mass of the Galaxy are summarized : they determine the attractive gravitational force. In Section 6 measurements of empirical rotation curves are compared with the computed rotation curves. In Section 7 some features of the rotation curves data are debated. Compendium and conclusion are in Section 8.
The focus of this work is on the rotation curves in the outer Galaxy, in the radial Galactocentric range, ≤r ≤ 18 where the Galactic electrostatic field is known better than that in the inner Galaxy. In this radial interval the basic discriminant is rising or decreasing rotation curves.
2. Charge Balance Around Single Stars and Multiple Stellar Systems
The region occupied by the solar wind has been measured in two different locations of the nearby circumstellar space by the Voyager Probes and at 94 [6] and 84 AU [7], respectively. This region might be approximated by a sphere of nominal radius (sc for solar cavity). Crudely and nominally, ≡ (94 + 84)/2 = 89 AU = m. The corresponding spherical volume, ≡ (4/3) = is a surrogate of the non spherical volume delimited by the termination shock positions observed by the Voyager mission.
According to Potassium abundance in terrestrial meteorites [5] the cosmic-ray intensity in the last 2 billion years has maintained approximately constant. This datum is regarded as solid input here to state, or posit, the quasi stationary state in the flows of the electric charge in the volume .
At the time interval t from an arbitrary initial zero time, the positive electric charge deposited by cosmic rays in the volume amounts to : ( + ) t. Recent calculations [8] reports = /s (hereafter C/s) above 5 and = C/s in the range 3 - 20 of the cosmic-ray spectrum where measurements are available.
The neutralization of the positive charge excess during the arbitrary time span t in the volume , namely, t + t promotes a quiescent electron current designated by ( on foot for neutralization) and called neutralization current. The current is qualitatively represented by the thick blue arrows in Figure 1 and it enters the solar cavity coming from the nearby interstellar space, beyond the radius transporting the negative electric charge = t in the arbitrary time span t. Thus, the total electric charge contained in the solar cavity in the arbitrary time interval t is given by :
where (0) is the total electric charge in the volume at initial time t = 0. Any arbitrary time may be chosen as initial time, or zero time, taking into account the age of about . The charge within the volume at time t is denoted by R().
The stationary state during the time interval t posits, + + = 0 and, therefore, (0) = R() where R() designates the residual electric charge at the time . For instance, during the temporal span surveyed by Potassium data [5] of ≈ 2 (Giga ), the residual charge R() remained constant and the time t = 0, i.e. the initial time of the calculation is 2 back in time from the present epoch.
In the steady condition, regardless of the complexity of the environment, the neutralization charge entering the solar cavity from the adjacent space has to equalize, or nearly equalize, the positive electric charge deposited by cosmic nuclei in the same volume.
Due to a deferred neutralization, a residual charge R() permanently remains on the star and stellar wind region as extensively advocated in 3, 4 and 5 of ref. [8]. This residual charge is positive as it derives from the extinction of positively charged cosmic nuclei. By this charge stars experience an attractive force toward the center because the Galactic electric field has a centripetal direction [2,3]. The neutralization process always lags behind the electric charge deposition of the cosmic rays which penetrate the solar cavity at light velocity. Thus, any negative charge transfer through the neutralization process, from the exterior to the interior of the solar cavity, is necessarily slow and it is deferred face to the rapid charge deposition.
3. Electrostatic and Gravitational Attractive Forces in the Galaxy
The Galactic electrostatic field (see next Section 4) exerts an attractive force on stars and clouds imbued with positive electric charge. This electric force adds to the gravity force. As the radial field intensity (r) ≡ increases with the distance from the solar circle of up to = 15 , the attractive force increases with the radial distance. Beyond the radius of 15 the electrostatic force diminishes as cosmic-ray sources fade away.
Consider a generic star of mass m and electric charge q in circular motion about the Galactic center in the disk plane. For sake of simplicity, admit a common barycenter for both charge and mass distributions. The electric and gravity forces in a circular motion are : q/m + GM(r)m/ where G is the gravitational constant, r the distance of the star from the Galactic center, , and M(r) is the visible mass of the Galaxy within the radial distance r. Accordingly, the velocities squared of the stars (r) about the center-of-mass of the Galaxy are given by :
The mass M(r) can be expressed as a fraction p of the total mass of the Galaxy, M, within the distance r. Hence, M(r) = p(r)M with p≤ 1 while the ratio q/m is expressed by the dimensionless parameter 1 (s on foot for a generic star or cloud). Notice that the quantities v(r), M(r), m and r in Equation (2) are measured with fair precision. For the the circular velocity = 230 /s is adopted and, accordingly, = /.
For instance, with M = and p(8.5 ) = , the factor GM()/ = ()/() = /. The Equation (2) gives the radial dependence of the star velocity revolving around with a circular motion. The velocity v depends on the functions , M, p, the radius r and the dimensionless parameter which expresses the electric charge residing on a given star or a gaseous complex.
The distance of the Galactic center from the , (s on foot for ), is a critical parameter to build rotation curves from observations. Some measurements [10] provide = ± and a velocity of 240 /s while others [11] using RR Lyrae stars in the direction of the measure = ± . It seems that the velocity of 220 /s around the Galactic center , recommended by the International [12], does not exactly coincide with recent measurements of which would suggest a larger value of about 245 /s [13]. Thus, the adopted values of = 230 /s and = in the Equation (2) is compatible with current data.
Stars, clouds and molecular clouds are used in the measurements of rotation curves (see Section 6, Section 7 and Appendix A). It is known that multiple stellar systems and related stellar winds inhabit gaseous complexes such as High Mass Star Forming regions, regions and others. Accordingly, the electric charge stored by a generic star, designated by , (see footnote 1) is also attributable to clouds and gaseous complexes without a fine distinction.
4. The Galactic Electrostatic Field Acting on Stars and Clouds
The Galactic field strength versus radius used in this work is shown in Figure 2. It is calculated elsewhere [14] in four different conditions regarding the charge distribution originated and regulated by the motion of cosmic rays (see also ref. [2]). The interpolation of the radial electric field adopted here is the following :
with = V/m and = . Equation (3-a) applies to r≤ 1 while (3-b) in the range 1 ≤r≤ 15 . In the interval 15 ≤r≤ 18 beyond the nominal disk rim of 15 [15,16], the radial field intensity has unsurprisingly a rapid decrease. The following parabolic functions imitate the radial decrease of the electric field :
equation (3-c) applies in the range, 15 ≤r ≤ 17 while (3-d) in 17 ≤r ≤ 18 . The negative sign of the field strength in Figure 3 labels its centripetal direction.
The mass adopted in this work is (see next Section 5). Accordingly, Equation (2) can be practically rearranged in this way :
where is the mass in unit of and the numerical constant 0.265 908 is from : ×m = m/s (= 100 /s× ( . For example, with the Galactic mass M of = at the arbitrary radius = 9 , = 2.5, electric field strength from (3-b), = 0.162 V/m and an arbitrary p() = 0.65, the resulting rotation velocity would be, 100 ( km/s) = /s.
5. The Galactic Mass Based on Optical, Radio and Infrared Data
The function is empirically known since many decades. In the simplest approach it is the sum of an exponential disk and a spherical halo.
Two exponential disks are usually distinguished; a thin disk containing a major fraction of matter (about 85 per cent) and a thick disk of tenuous matter (about 15 per cent of the total mass) (see, for example, ref. [17]). Here, to simplify, a single disk instead of two is adopted with its characteristic radius . Traditionally, measurements during three decades indicate that ranges from 2 to 4.5 . Likely, depends on the celestial object used in the measurements (referred to as tracer) besides other parameters.
Matter in the spherical halo consists of stars and includes a substructure named . Shapes and intensities from light is used to classify spiral galaxies and many functions are used for its interpolation. Accordingly it is set : = ( + )/( + ) where and designate, respectively, the disk and halo masses within the radius r and + the total .
The mass contained in the exponential disk within the radius r, (r), can be adequately represented by :
where is the characteristic radius of the exponential disk and the surface brightness density extrapolated at the center , at r = 0. At the solar ringF the observed surface brightness ranges from 35 to 55 /.
Models of the halo mass indicate that it amounts to 9-12 per cent of the disk mass regardless of the details i.e. spherical or axisymmetric haloes with a bar or without it. Moreover, to resolve the Dark Matter problem the critical radial range is the outer Galaxy.
The Galactic halo extends up to and beyond 30 and has a characteristic radius b. Some studies admit an axisymmetric halo where r is the radial distance and z the Galactic elevation. A radial cutoff, , is also contemplated in some models. An example of mass profile, (r), is the following one :
where is a constant, u is a combination of the elevation z and radial r distance, namely, u≡ ( + /, the radial halo cutoff and q the axial ratio. Ultimately, the radial mass profiles (5) and (6) are carved on the observed profiles of the Galactic optical light.
As an example, a measurement of the Galactic mass subdivided in exponential disk, halo and gas by a sample of 16 000 G dwarf stars [18] gives, = , = and = . This measurement adopts a solar ring of 8 . With = 8.5 it becomes = and = . According to the studies [10]-[13] on the solar circle radius quoted in Section 3, the value = is adequate and, therefore, the mass M from [18] becomes, M = + = + = = solar masses. From the same source [18] = . Recently, by a different method, a Galactic mass of solar masses [19] has been also estimated in agreement with [18].
An example of function p(r) is displayed in Figure 4 for for an exponential disk with characteristic length = 4.5 .
The literature reports a number of interpolations of the visible Galactic mass; they are only slightly different from those given above. These slightly different representations of the matter distributions, however, do not alter the basic traits of the rotation curves obtainable by Equation (4).
The results of the calculation via Equation (4) are shown in Figure 5 for M = , = and also = (blue curves). As it is visually realized, the effect of the electric field relative to that of gravity (black curves) for r≤ is quite modest becoming instead notable, with a prominent increasing trend, in the radial range ≤r≤ 15 . Beyond 15 rotation velocity curves decrease as the radial electric field strength falls off.
The dependence of the rotation curves on the electric charge is shown in Figure 6 for = 1.5, 2.5 and 3.0. Here extreme values of M and ( and = , respectively) are used to offer the global view spanned by the calculation. The black curve in Figure 6 refers to the rotation curve forged only by gravity, purposely omitting the electric field to evidence the relative role of the two forces.
6. Data on Rotation Curves of Stars and Clouds in the Milky Way Galaxy
Numerous measurements of rotation curves of stars and clouds about the Galactic center are available. The measurements are based on the emission at 21 cm by HI gas [20,21], infrared emission of CO dispersed in molecular clouds [22], the motion of halo stars reconstructed in the optical band [23], ethanol, hydroxyl and water in clouds excited by O and B stars [10], the motion of planetary nebulae [24,25] and Carbon stars of type N [26].
Data take advantage of rotational models of the Galactic disk as the 9 parameters used to determine v(r) are not all measured. These parameters are the three dimensional velocity, the distance and position of stars or clouds. Due to this shortcoming caution is mandatory in the scrutiny of the available measurements. In order to build the rotation curves two crucial parameters are the distance of the from the Galactic center and the circular velocity of the about called here () and concisely, (s for ).
The Galaxy is not a rigid body but any parts rotate with a circular velocity (R) depending on the radial distance R from the Galactic center . An expression of the rotation velocity (R) used in the data analysis of the rotation velocity curves is, (R) = (R/ where is the rotation index. A second expression is the polynomial function : (R) = + (R -) + (R - which depends on the constants and .
In order to fully appreciate the comparison of the rotation curves based on Equation (4) shown in Figure 5 and Figure 6 and experimental data [20]–26], the essential properties of gaseous matter and stars imbued with positive electric charge attracted by the electrostatic field are here summarized.
(1) The electric field intensity increases with the radius r between 8.5 and 15 by more than a factor of 2 regardless of the approximation of the charge distributions which generate the field in the Milky Way Galaxy [14]. The increment of the electric field entails the increment of the restoring force on stars and clouds toward the Galactic center. This characteristic feature, for an arbitrary given radius r between 8.5 and 15 , lifts rotation velocities of any charged bodies (stars and clouds) : from Keplerian descending rotation curves to slightly increasing up to the radial distance = 15 as shown in Figure 5 and Figure 6.
(2) Inevitably, the radial electric field strength diminishes beyond the nominal Galactic rim = 15 . As it is well known since long time, there are stars and gaseous materials beyond 15 , in the Galaxy (see, for example, [27,28]) but their total mass fraction is negligible face to the mass enclosed within the nominal disk rim of 15 . Let us remind here that the nominal disk border = 15 is not a working hypothesis but a solid empirical datum anchored to the drop of the optical luminosity of the Galaxy beyond 14-16 (see, for instance, [15,16]).
(3) The electric charge captured by a stellar category (for example Carbon stars) is expressed by the variable , the charge-to-mass ratio of the star, which is expected not to depend on the radial distance beyond a certain characteristic distance from the Galactic center . This characteristic distance is not exactly evaluated in this work but it is certainly minor than = . Thus, it is admitted an average constant value for a given stellar category in the interval ≤r≤ 15 .
The observational data [20]–26] on the rotation curves in the radial range ≤r≤ 18 are shown in Figure 7, Figure 8, Figure 9, Figure 10 and Figure 11 along with the rotation curves of the Equation (4) with = (blue and green curves). The particular value = in Equation (4) is motivated by the fair agreement with the classical observational data on rotation velocity curves shown in Figure 7 [20].
The order of magnitude of the electric charge stored around stars is based on the total electric charge transported by cosmic rays, about 2.5 C [2,3] and the number of stars in the Galaxy, about 100-200 billion from a initial mass function with low and high mass cuts of -20 and an index of 2.35. Thus, C/ = C. This estimate assumes that the dominant channel for cosmic-ray extinction occurs in stellar winds.
7. Galactic Rotation Curves and Charge Retention in Stars and Clouds
Some aspects in the comparison between measurement and calculation of the rotation curves in spiral galaxies are here highlighted. Rotation curves in spirals are designated by v(r).
According to the explanation of the Dark Matter offered here via Equation (4), material bodies orbiting the Galactic center have the same value = or values quite close to . Equivalently stated, they retain an electric charge proportional to their masses. It would seem implausible that two diverse categories of celestial bodies (age, chemical composition, dynamical status, environment), like planetary nebulae and blue giant horizontal branch stars might have exactly the same mass-to-charge ratio, for instance the adopted value = , thereby exhibiting the same rotation velocity curves. Plausibly, the average value of the parameter not only changes, depending on the particular category of celestial body examined but, likely, it will fluctuate with a characteristic dispersion () around its average value. The fluctuations are caused by plenty of mechanisms which may favor or restrain the accumulation and release of electric charge (see of ref. [2] and [8]).
Generally a variation of the parameter versus time is expected for the same object. A star like the at = takes about 240 years to complete a turn about the Galactic center . A star at the radial distance of 15 takes approximately half billion years to complete a full circular turn on the Galactic midplane. Some young celestial bodies aged (10-20) years, for instance H regions illuminated by O and B stars , might have values which vary on time intervals shorter than their intrinsic ages.
Following these premises it has to be noted -:
() If the value for a given category of objects and for a given disk radius r fluctuates due to intrinsic environmental causes, then, in turn, the corresponding rotation velocities will also fluctuate as dictated by Equation (4).
An example of rotation curve obtained with Carbon stars of type N [26] is shown in Figure 11. It is quickly realized a large dispersion in the measurements : at the radial distance of rotation velocities jerk from 20 to 280 /s. It is a common practice that even with this large velocity fan, average rotation velocity curves v(r) are anyway forced and superimposed to the data.
() If the average values for two categories of celestial bodies differ in a sensible way, then rotation velocity curves will be different as required by Equation (4). This effect differs from that of () mentioned in the point .
It has been remarked by others that the rotation curves v(r) based on Carbon star of type N in the Milky Way Galaxy lie below the corresponding rotation curves obtained via HI cloud emission. For example, by comparing the data [20] displayed in Figure 7 with those in Figure 11 [26] emerges a systematic difference of 30-50 /s in the radial interval 10 ≤r≤ 15 . In order to explain the velocity gap, besides possible instrumental effects, one can legitimately speculate that Carbon stars of type N retain average values inferior to those of the HI clouds.
() Often in the literature average rotation curves are superimposed a in the attempt at framing vast arrays of observational data of the unseizable Dark Matter by simple interpolation functions. Let us remind here that more than one thousand rotational curves of spiral galaxies are empirically known and tabulated. The practice of averaging rotation curves tends to destroy precious details of the data which would remain unexplained by the notion of Dark Matter recurrent in the literature, which is too simplistic and exerts only an attractive force.
For example, as asserted by others (page 17 ref. [30]) : " Clearly, real galaxies are more complex than the simple URC prescription suggests and other factors than luminosity must contribute to the detailed shape of a rotation curve as well " ( is for Universal Rotation Curve).
Frequently average rotation curves in spirals are imposed both at a particular radial distance and on an entire selected range of radial distances.
The sentiment here is that some recent works on rotation curves using trigonometric parallaxes herald decreasing rotation curves in a vast radial range but, as a matter of fact, increasing rotation curves in the range 9-15 are observed (see, for example, data points from 773 in Figure 3 of ref. [31] in the limited range 9-14 which display an increasing tendency). A second example comes from the study of the proper motion of 3500 (see Figure 3 in ref. [32]) where rotation curves in the radial range - show an increasing tendency). A third example is based from a sample of 2401 blue horizontal branch halo stars [33] where the first two data points in Figure 15, 16 and 17 mark an increasing tendency.
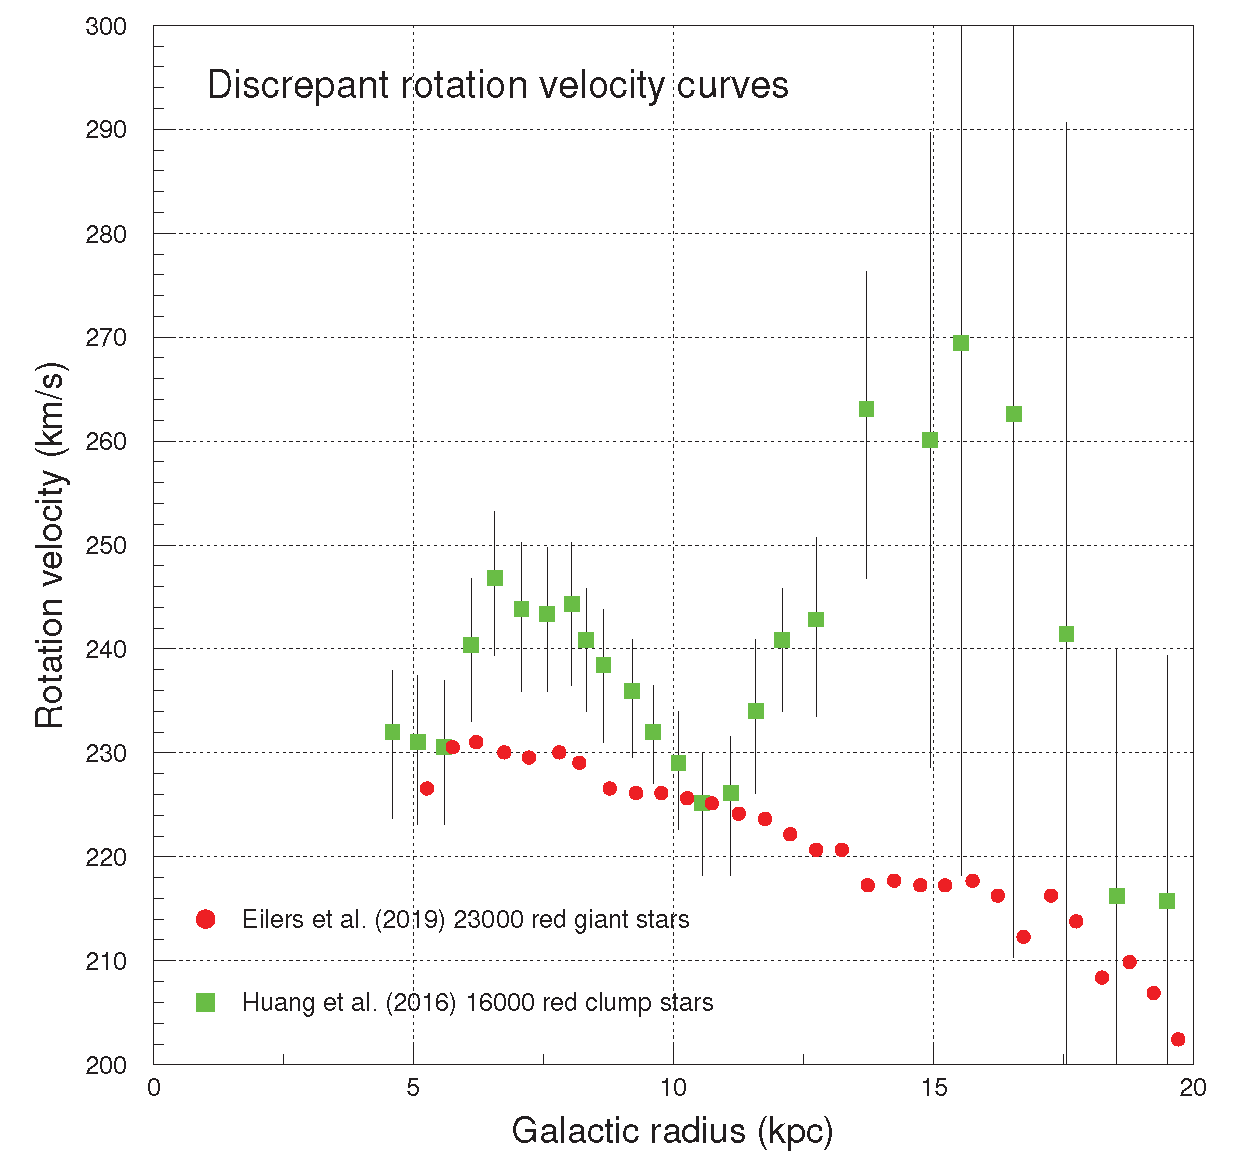
Rich data samples based on trigonometric parallaxes of 23000 red giant stars [34] are mutually inconsistent with the rotation curves based on 16000 primary red clump giants and 5700 halo K giants [35] as depicted in Figure 12. Notice further that both these experiments [34,35] assume the mechanical equilibrium of the Galaxy and use stellar dispersion velocities to determine rotation curves. The ironic side here is that if a straight line is anyway forced in the range 4-18 through the blue curve labeled = in Figure 5, a decreasing rotation curve looms out.
() If, for instance, the value = were inserted in Equation (4) or even a lower value, no significant effect of the electrostatic field on the rotation curves v(r) would result. In this case gravity would govern v(r) (black curves in Figure 5 and Figure 6).
() Rising rotation curves in the Milky Way Galaxy are in accordance with the existence of the electrostatic field as advocated in this work. Rising rotation curves in the radial range from to 15 have been assessed during four decades of measurements as explicitly vented by consummate, top astronomers [23] : " All the rotation velocities are in agreement in the sense that they show the tendency of increasing with the galacto-centric distance. ". This statement applies to the radial range to 15 . Of the same token [22] : " All nine of the above methods for determining the rotation curve to large R show that the rotation curve does not fall out to the last measured point, at a distance (generally) near to 2 . These results indicate that beyond ≈ 2, the mean of the binned points lie above a flat rotation curve by ≈ 10-20 per cent of the circular velocity. ". Here signifies 8.5 , the distance from the Galaxy center.
8. Compendium and Conclusion
The attractive electrostatic force2 on stars and clouds in the Milky Way Galaxy rests on two pillars : (1) the Galactic electrostatic field and (2) the positive electric charge deposited by cosmic rays around stars in the stellar wind regions [8,37].
A pervasive, permanent electrostatic field was introduced in 2020 in the search for the correct acceleration mechanism of cosmic rays in the Milky Way Galaxy from energies of a few up to [2,3,14]. As cosmic-ray sources mainly reside in the molecular and atomic clouds, they predominantly store negative electric charge made of orbital electrons abandoned by the accelerated cosmic-ray nuclei. This negative charge of quiescent electrons of -C, designated in ref. [2] by ( w for ), inhabits the Galactic core in cold molecular and atomic clouds, while cosmic-ray nuclei with global positive charge, = - spreads out around the core, due to their overwhelming high energies. These spatially disjoint positive and negative electric charge distributions, essentially and ultimately, generate the electrostatic field [2,3,14] which is directed from periphery to the center.
The electrostatic field generates the additional attractive force, which constrains stars and clouds impregnated with positive electric charge, to rotate about the Galactic center with a velocity greater than that caused by gravity only.
The agreement between the increment of the rotation curve in Figure 5 beyond and the increment displayed by the observational data [20] is evident. On the contrary, calculations based on yield decreasing rotation curves beyond 4-5 , i. e. Keplerian curves like those in Figure 5 and Figure 6 (black curves), in apparent disagreement with the data [20]-[26].
The result of this work adheres to the severe, inescapable results from experimental physics in the quest for Dark Matter during half a century. all the experimental quests of the dark matter in laboratories, caverns and particle accelerators have produced null results over a period of more than 50 years with heterogeneous techniques and in diverse areas. See, for example, the important null results of LUX experiment [38] and [39] along with those at accelerators gleaned by ATLAS and CMS detectors at the Large Hadron Collider [40,41] and many other null results of the same two experiments and others.
Historically the or Dark Matter problem firstly emerged in 1932 [42] in the empirical study of stellar motions close to the Galactic midplane : gravity force measured by optical observations was insufficient to constrain stars in the Galactic midplane as they were actually observed. Some years later the computed dispersion of the velocity distribution of galaxies in the cluster of 80 /s appeared to suffer the same fault, as the observed velocity dispersion was much larger, about 1000 /s.
Thus, Dark Matter problem since 1932, walked on two imaginary wheels ; rotation curves of stars and clouds in spiral galaxies is one wheel. The violation of in galaxy clusters is the second wheel e. g. observed galaxy velocities in galaxy clusters require an attractive binding potential greater than the gravitational potential inferred from optical observations. Since then, a plethora of empirical studies on other spiral galaxies and galaxy clusters reiterate the deficit of gravitational force, accompanied by an explosive proliferation of futile, mystique papers on unreal material bodies.
A recently published (2022) outsize work [37] recognizes that any galaxy clusters have permanent and ubiquitous electrostatic fields designated by (c on foot for cluster) generated by the motion of cosmic rays in cluster galaxies. From [37] it turns out that the elusive Dark Matter in galaxy clusters is an effect of the cluster electric fields .
The quartet of empirical and logical evidence : (1) the account of flat rotation curves in spiral galaxies by the galactic electric fields reported in this work; (2) the vast null results of any forms of Dark Matter from laboratories, caverns and accelerator experiments ; (3) the absence of astronomical evidence of low luminosity material bodies postulated ad hoc to account for the deficit of gravitational force in galaxies (see for example [43] along with many others); (4) and the account of in galaxy clusters by cluster electrostatic fields , leads to the simplest conclusion that Dark Matter does not exist at all ; Dark Matter is only an electrostatic effect.
Conflicts of Interest
The author declare no conflicts of interest.
Appendix A. Notes on the Calculation of the Galactic Rotation Curves
The solution of the Dark Matter problem via the electrostatic field is thoroughly new. As the basic concept is simple, many details have been purposely omitted to preserve the simple skeleton of the solution. Nevertheless the following notes (1)-(6) may be useful.
(1) The amount of charge stored by stars and clouds denoted in this work (defined in the footnote 1) is hardly constant because the sizes solar wind regions, stellar velocities, stellar radii, cosmic-ray intensities conspicuously vary over the Galactic volume. On average, different stellar categories may retain quite different amounts of electric charge.
(2) The radial electric field of the outer galaxy, represented by equation (3-b), has been calculated for the particular aim to prove that cosmic-ray acceleration is an electrostatic process up to energies of [2,3]. Therefore, the radial profile of equation (3-b) is not an adjustment for the solution of the Dark Matter problem : it derives from a different research area and has an intrinsic solidity independent from the Dark Matter problem. As increasing or flat rotation curves in spiral galaxies are caused by electric fields generated by cosmic rays, it is unsurprising that early spirals with low cosmic-ray intensities display descending rotation curves [1].
(3) The radial electric field in the inner Galaxy (3-a) is certainly not adequate as amply debated elsewhere [2]. The inadequacy hinges on two mechanisms : the cosmic-ray intensity is higher than that measured in the solar vicinity. This fact implies that the number of cosmic-ray extinguished in stellar winds is larger than those at the solar circle. In some respects this would qualitatively agree with the gamma ray excess observed in the central region of the Galaxy. In this circumstance the electric charge reflected in the parameter is expected to be higher that the value = 2.5 adopted solar radius of and beyond.
Notice that there is a degeneracy in the computed rotation curves at small galactic radii, 1 ≤r≤ 5 : both the electric charge stored in stars and the electric field are enhanced. The enhancement is presently ungauged and, a , rotation curves might be affected. For example, rotation data reflecting masers emission of massive stars [10] in the small radial range 1 ≤r≤ 5 differ from those based on HI emission [20].
(4) It is well known that the same amount of matter M spherically or cylindrically (disk) distributed generate rotation curves which differ along the radius by 15 per cent at most; the maximum difference occurring around the characteristic radius of the exponential disk, . As a consequence, the rotation curves shown in Figure 5 and Figure 6 are only slightly shifted by removing the assumption of a spherical distribution of matter.
(5) Cosmic-rays extinguished in the inner by nuclear interactions at the radius r produce hadronic showers whose particles remain trapped by the electrostatic potential (in the inner galaxy portion featured by distances ≤r). This occurrence enhances the electric charge retained at small radii and, accordingly, the intensity of the electrostatic field relative to that at solar circle at . The amount of this enhancement has never been calculated and it is unpredictable without .
(6) Presently the credence in the existence of is largely widespread in spite of the negative results in laboratories, caverns and particle accelerators along with the null results of astronomical observations mentioned in Section 8, Compendium and Conclusion.
A gravity only has been an excessive simplification to resolve the Dark Matter problem during 90 years. Adding an unseen mass to the deficit of the gravitational force has been the simplest idea at hand but many data have proved that this simple idea is fallacious3.
Appendix A. The Acceleration Imparted by the Galactic Electrostatic Field
This study explains the rotation curve of the Milky Way Galaxy in a limited but critical radial range ≤r≤ 18 by the Galactic electrostatic field (hereafter ). The acceleration caused only by the , without gravity, amounts to about m/ according to Equation (4). For example, at the disk border, r = 15 , the radial field strength from equation (3-b) is 0.322 V/m, = 2.5 implying a velocity of 179 /s and an acceleration, /r of m/.
Believers on the Modified Newtonian Dynamics (concisely MOND; see ref. [44] for the context and implication) trivially share the same desire contemplated by believers on the fictive Dark Matter in the sense that both wish to solve the problem of the deficit of gravitational force at cosmic scale. According to a surplus of force, not a lack of force, adds to standard gravity in spiral galaxies at the arbitrary acceleration of about 10−10 m/. This is the basic statement of applied to galactic rotation curves.
On one side, Dark Matter believers try to explain the deficit of gravitational force positing fictive material bodies ( ) which added to the standard gravity compensate the deficit. On the other side, at the acceleration of about m/ (MOND), an additional attractive force appears from nothing which adds to standard gravity. By standard gravity is meant the attractive gravitational force generated by the masses inferred by canonical astronomical measurements. It seems here that two unjustified and unsupported hypotheses, MOND and Dark Matter, work in tandem.
Countless of objections have been formulated against MOND (see for a partial list ref. [44]) because it ignores fundamental Physics Principles valid in Nuclear Physics, Elementary Particle Physics and in the solar system during four centuries ; while doing so the MOND doctrine debouches into prescientific ideation and irony. The sentiment is that the diffusion of MOND in some fragments of the scientific literature implanted just because it was an attempt to repudiate the Dark Matter hypothesis which it is disproved by astrophysical observations and empirical data. The impression, in the year 2025, is that the remedy (MOND) has been worse than the disease (Dark Matter) .
Here the conclusion is that the surplus of attractive force implied by the acceleration of m/ is nothing but the electric field.
References
- Genzel, R.; Förster Schreiber, N.M.; Übler, H.; et al. . Strongly baryon-dominated disk galaxies at the peak of galaxy formation ten billion years ago. Nature 2017, arXiv:astro-ph.GA/1703.04310]543, 397–401. [Google Scholar] [CrossRef]
- Codino, A. The ubiquitous mechanism accelerating cosmic rays at all the energies; Società editrice Esculapio: Bologna, 2020. [Google Scholar]
- Codino, A. The ubiquitous mechanism accelerating cosmic rays at all the energies. In Proceedings of the 37th International Cosmic Ray Conference; 2022; p. 450. [Google Scholar] [CrossRef]
- Kudritzki, R.P.; Puls, J. Winds from Hot Stars. Annual Review of Astronomy and Astrophysics 2000, 38, 613–666. [Google Scholar] [CrossRef]
- Voshage, H.; Feldmann, H.; Braun, O. Investigations of cosmic-ray-produced nuclides in iron meteorites: 5. More data on the nuclides of potassium and noble gases, on exposure ages and meteoroid sizes. Zeitschrift Naturforschung Teil A 1983, 38, 273–280. [Google Scholar] [CrossRef]
- Stone, E.C.; Cummings, A.C.; McDonald, F.B.; et al. . Voyager 1 Explores the Termination Shock Region and the Heliosheath Beyond. Science 2005, 309, 2017–2020. [Google Scholar] [CrossRef]
- Richardson, J.D.; Kasper, J.C.; Wang, C.; et al. . Cool heliosheath plasma and deceleration of the upstream solar wind at the termination shock. Nature 2008, 454, 63–66. [Google Scholar] [CrossRef]
- Codino, A. Cosmic electron spectra by the Voyager instruments and the Galactic electrostatic field. arXiv e-prints 2025, p. arXiv:2502.06646, [arXiv:astro-ph.HE/2502.06646]. [CrossRef]
- Codino, A. On the overflowing of cosmic rays from galaxies and the expansion of cosmic matter. In Proceedings of the 37th International Cosmic Ray Conference; 2022; p. 150. [Google Scholar] [CrossRef]
- Reid, M.J.; Menten, K.M.; Brunthaler, A.; et al. . Trigonometric Parallaxes of High Mass Star Forming Regions: The Structure and Kinematics of the Milky Way. Astrophys. J. 2014, arXiv:astro-ph.GA/1401.5377]783, 130. [Google Scholar] [CrossRef]
- Majaess, D. Concerning the Distance to the Center of the Milky Way and Its Structure. Acta Astron. 2010, arXiv:astro-ph.GA/1002.2743]60, 55–74. [Google Scholar] [CrossRef]
- Kerr, F.J.; Lynden-Bell, D. Review of galactic constants. Monthly Notices of the Royal Astronomical Society 1986, 221, 1023–1038. [Google Scholar] [CrossRef]
- Vallée, J.P. Recent advances in the determination of some Galactic constants in the Milky Way. Astrophysics and Space Science 2017, arXiv:astro-ph.GA/1703.05822]362, 79. [Google Scholar] [CrossRef]
- Codino, A. Models and formulae of the Galactic electric field. submitted to Astronomy and Astrophysics.
- Robin, A.C.; Creze, M.; Mohan, V. The radial structure of the galactic disc. Astron. Astrophys. 1992, 265, 32–39. [Google Scholar] [CrossRef]
- Robin, A.C.; Creze, M.; Mohan, V. The Edge of the Galactic Disk. Astrophysical Journal Letters 1992, 400, L25. [Google Scholar] [CrossRef]
- Habing, H.J. IRAS edge-on view of our Galaxy - The disk. Astronomy and Astrophysics 1988, 200, 40–50. [Google Scholar]
- Bovy, J.; Rix, H.W. A Direct Dynamical Measurement of the Milky Way’s Disk Surface Density Profile, Disk Scale Length, and Dark Matter Profile at 4 kpc <~R <~9 kpc. The Astrophysical Journal 2013, arXiv:astro-ph.GA/1309.0809]779, 115. [Google Scholar] [CrossRef]
- Hofmeister, A.M.; Criss, R.E.; Chou, H. Baryonic Mass Inventory for Galaxies and Rarefied Media from Theory and Observations of Rotation and Luminosity. Galaxies 2023, 11. [Google Scholar] [CrossRef]
- Clemens, D.P. Massachusetts-Stony Brook Galactic plane CO survey: the galactic disk rotation curve. The Astrophysical Journal 1985, 295, 422–436. [Google Scholar] [CrossRef]
- Merrifield, M.R. The Rotation Curve of the Milky Way to 2.5 R/o From the Thickness of the HI Layer. Astronomical Journal 1992, 103, 1552. [Google Scholar] [CrossRef]
- Fich, M.; Blitz, L.; Stark, A.A. The Rotation Curve of the Milky Way to 2R 0. The Astrophysical Journal 1989, 342, 272. [Google Scholar] [CrossRef]
- Honma, M.; Sofue, Y. Rotation Curve of the Galaxy. Publications of the Astronomical Society of Japan 1997, 49, 453–460. [Google Scholar] [CrossRef]
- Schneider, S.E.; Terzian, Y. Planetary nebulae and the galactic rotation curve. Astrophysical Journal Letters 1983, 274, L61–L64. [Google Scholar] [CrossRef]
- Maciel, W.J.; Lago, L.G. A New Determination of the Rotation Curve from Galactic Disk Planetary Nebulae. Revista mexicana de astronomía y astrofísica 2005, 41, 383–388. [Google Scholar]
- Demers, S.; Battinelli, P. C stars as kinematic probes of the Milky Way disk from 9 to 15 kpc. Astronomy & Astrophysics 2007, 473, 143–148. [Google Scholar] [CrossRef]
- Brand, J.; Wouterloot, J.G.A. IRAS sources beyond the solar circle. IV. Maps of far-outer Galaxy molecular clouds. Astronomy and Astrophysics Suppl. 1994, 103, 503–540. [Google Scholar]
- Jurić, M.; Ivezić, Ž.; Brooks, A.; et al. . The Milky Way Tomography with SDSS. I. Stellar Number Density Distribution. The Astrophysical Journal 2008, 673, 864–914. [Google Scholar] [CrossRef]
- Bhattacharjee, P.; Chaudhury, S.; Kundu, S. Rotation Curve of the Milky Way out to ~200 kpc. The Astrophysical Journal 2014, arXiv:astro-ph.GA/1310.2659]785, 63. [Google Scholar] [CrossRef]
- Noordermeer, E.; van der Hulst, J.M.; Sancisi, R.; et al. . The mass distribution in early-type disc galaxies: declining rotation curves and correlations with optical properties. Monthly Notices of the Royal Astronomical Society 2007, 376, 1513–1546. [Google Scholar] [CrossRef]
- Mróz, P.; Udalski, A.; Skowron, D.M.; et al. . Rotation Curve of the Milky Way from Classical Cepheids. Astrophysical Journal Letters 2019, arXiv:astro-ph.GA/1810.02131]870, L10. [Google Scholar] [CrossRef]
- Ablimit, I.; Zhao, G.; Flynn, C.; Bird, S.A. The Rotation Curve, Mass Distribution, and Dark Matter Content of the Milky Way from Classical Cepheids. Astrophysical Journal Letters 2020, arXiv:astro-ph.GA/2004.13768]895, L12. [Google Scholar] [CrossRef]
- Xue, X.X.; Rix, H.W.; Zhao, G.; et al. . The Milky Way’s Circular Velocity Curve to 60 kpc and an Estimate of the Dark Matter Halo Mass from the Kinematics of ~2400 SDSS Blue Horizontal-Branch Stars. The Astrophysical Journal 2008, arXiv:astro-ph/0801.1232]684, 1143–1158. [Google Scholar] [CrossRef]
- Eilers, A.C.; Hogg, D.W.; Rix, H.W.; Ness, M.K. The Circular Velocity Curve of the Milky Way from 5 to 25 kpc. The Astrophysical Journal 2019, arXiv:astro-ph.GA/1810.09466]871, 120. [Google Scholar] [CrossRef]
- Huang, Y.; Liu, X.W.; Yuan, H.B.; et al. . The Milky Way’s rotation curve out to 100 kpc and its constraint on the Galactic mass distribution. Monthly Notices of the Royal Astronomical Society 2016, arXiv:astro-ph.GA/1604.01216]463, 2623–2639. [Google Scholar] [CrossRef]
- Codino, A. Concerning the missing and overabundant mass in Milky Way Galaxy and Magellanic Clouds. submitted to Astronomy and Astrophysics.
- Codino, A. How electrostatic fields generated by cosmic rays cause the expansion of the nearby universe; Società editrice Esculapio: Bologna, 2022. [Google Scholar]
- Akerib, D.S.; Alsum, S.; Araújo, H.M.; et al. .; LUX Collaboration. Results of a Search for Sub-GeV Dark Matter Using 2013 LUX Data. Phys. Rev. Lett. 2019, arXiv:astro-ph.CO/1811.11241]122, 131301. [Google Scholar] [CrossRef] [PubMed]
- Aprile, E.; Aalbers, J.; Agostini, F.; et al. .; Xenon Collaboration. Dark Matter Search Results from a One Ton-Year Exposure of XENON1T. Phys. Rev. Lett. 2018, arXiv:astro-ph.CO/1805.12562]121, 111302. [Google Scholar] [CrossRef] [PubMed]
- ATLAS Collaboration. Search for new phenomena in dijet events using 37 fb-1 of pp collision data collected at s=13 TeV with the ATLAS detector. arXiv e-prints 2017, p. arXiv:1703.09127, [arXiv:hep-ex/1703.09127]. [CrossRef]
- Sirunyan, A.M.; Tumasyan, A.; Adam, W.; et al. . Search for dijet resonances in proton-proton collisions at s = 13TeV and constraints on dark matter and other models. Physics Letters B 2017, arXiv:hep-ex/1611.03568]769, 520–542. [Google Scholar] [CrossRef]
- Oort, J.H. The force exerted by the stellar system in the direction perpendicular to the galactic plane and some related problems. Bulletin of the Astronomical Institutes of the Netherlands 1932, 6, 249. [Google Scholar]
- Alcock, C.; Allsman, R.A.; Alves, D.; et al. . EROS and MACHO Combined Limits on Planetary-Mass Dark Matter in the Galactic Halo. Astrophysical Journal Letters 1998, 499, L9–L12. [Google Scholar] [CrossRef]
- Scott, D.; White, M.; Cohn, J.D.; Pierpaoli, E. Cosmological Difficulties with Modified Newtonian Dynamics (or: La Fin du MOND?). arXiv e-prints 2001, pp. astro–ph/0104435, [arXiv:astro-ph/astro-ph/0104435]. [CrossRef]
| 1 | Consider two equal masses m retaining the same electric charge q (see Figure 1 in [9]. They experience an electrostatic repulsion and, at the same time, a gravity pull. Equilibrium or balance between the two forces occurs when the charge-to-mass ratio is q/m = = C/ where = F/m and G = 42 /. The definition of balance charge (b on foot for balance) is, ≡m and, in turn, ≡q/. The dimensionless charge, , is devoid of any subtlety. For example, the balance charge of the Galaxy is M = C where M = g = is an arbitrary mass. Yet, the balance charge of the is, = C where = g. |
| 2 | Gravity is only attractive while charges in electric fields may experience both attractive and repulsive forces. This work contemplates an attractive electric force. The astronomical evidence of a repulsive electrostatic forces in the Milky Way Galaxy and Magellanic Clouds are presented elsewhere in the forthcoming paper [36] : Concerning the missing masses and overabundant masses in Milky Way Galaxy and Magellanic Clouds. |
| 3 | Nature is simple but to be simple sometimes becomes cruel. According to some astrophysical textbooks, the dynamics of most materials in many cosmic regions is governed only by gravitational and magnetic forces. The prejudice is that electrostatic fields dissipate and cancel, due to the high conductivities of many astrophysical sites like stellar atmospheres or galactic centers; high conductivities comparable to those of copper or silver. The cruelty is that electric fields at any cosmic scales, added to gravity and magnetic forces, complicate the quantitative comprehension of any physical system. Therefore, perhaps, a healthy move for the brain cells of the human mind has been to negate or ignore electric fields at cosmic scales, but this move precluded a solution of the Dark Matter problem for 90 years. |
Figure 1.
Artistic portrait of low-energy cosmic rays extinguished in the solar wind. The positive electric charge deposited by cosmic rays extinguished in the solar wind is marked by red crosses. Solar wind stems from the corona and is propelled in the corona. Quiescent electron currents (represented by thick blue arrows) coming from the nearby circumstellar space migrate toward the region occupied by the solar wind where cosmic-ray extinction takes place. This current is justified and discussed elsewhere ( 11 ref. [2]). Green vectors of fanlike shape represent the electrostatic field at the base of the photosphere projected in an arbitrary plane. The ovoidal volume of the figure is arbitrary.
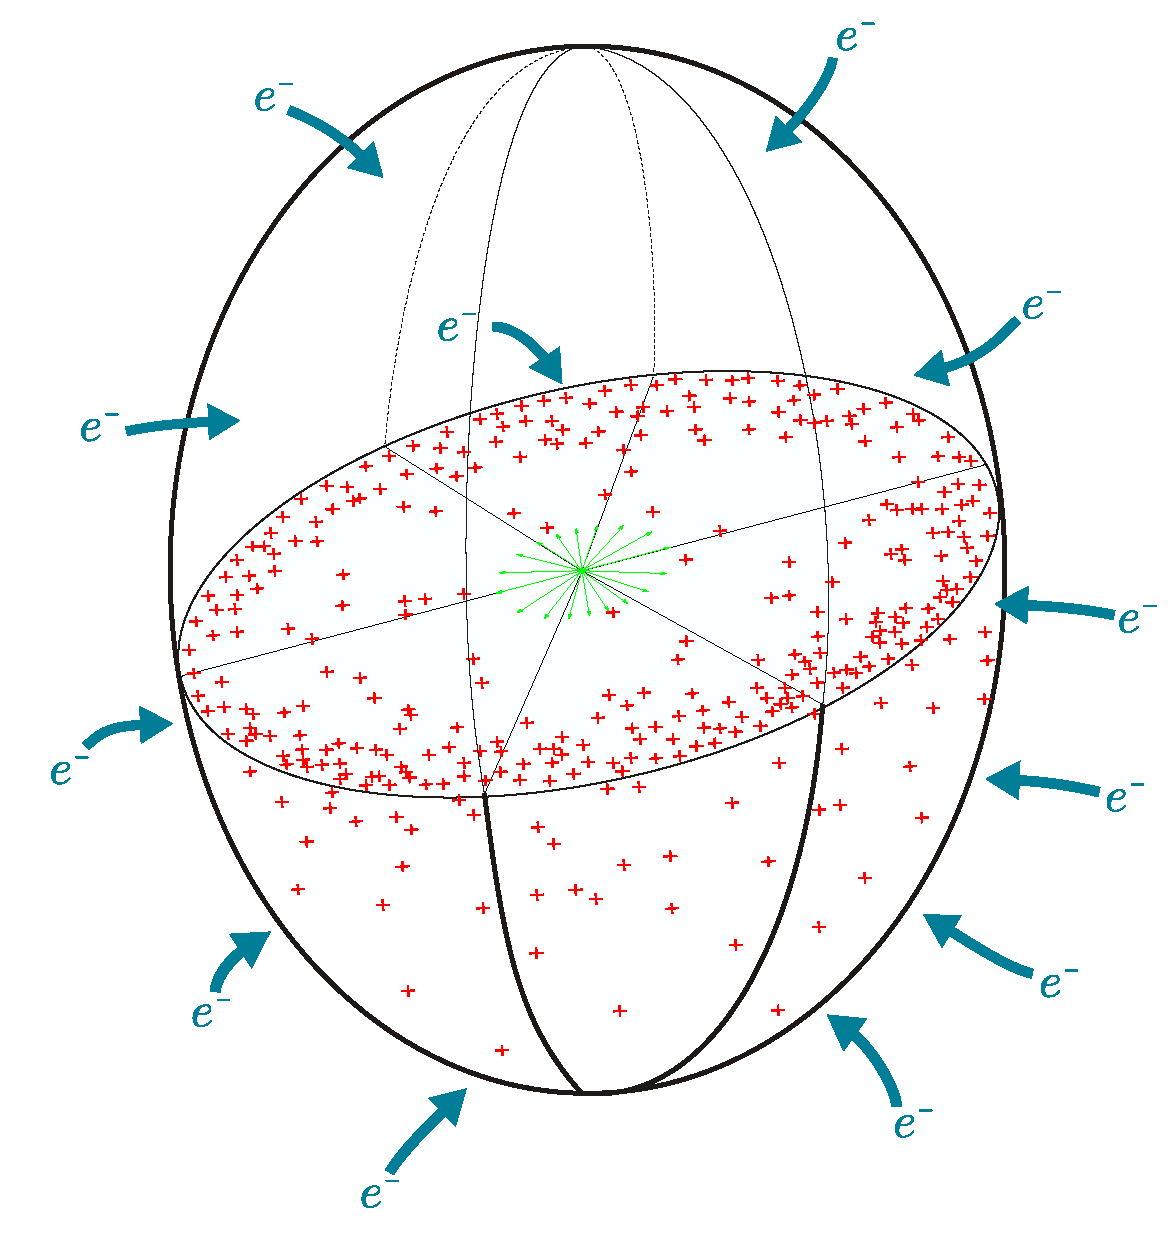
Figure 2.
Electric field intensity versus radial distance (blue curves) for the Milky Way Galaxy obtained with two concentric, highly squashed cylindrical charge distributions. The negative charge has a radius of 15 and elevation (normal direction to the Galactic midplane) of 125 reflecting the location of cosmic-ray sources embedded in the molecular and atomic clouds. The positive charge has the same radius of 15 and a larger elevation of 2 reflecting the vast spread of cosmic-ray nuclei due to their abnormal high energies (for comparison, = 1 and 3 are also shown). Negative charge is = - C and is equal to the positive charge , namely, = -.
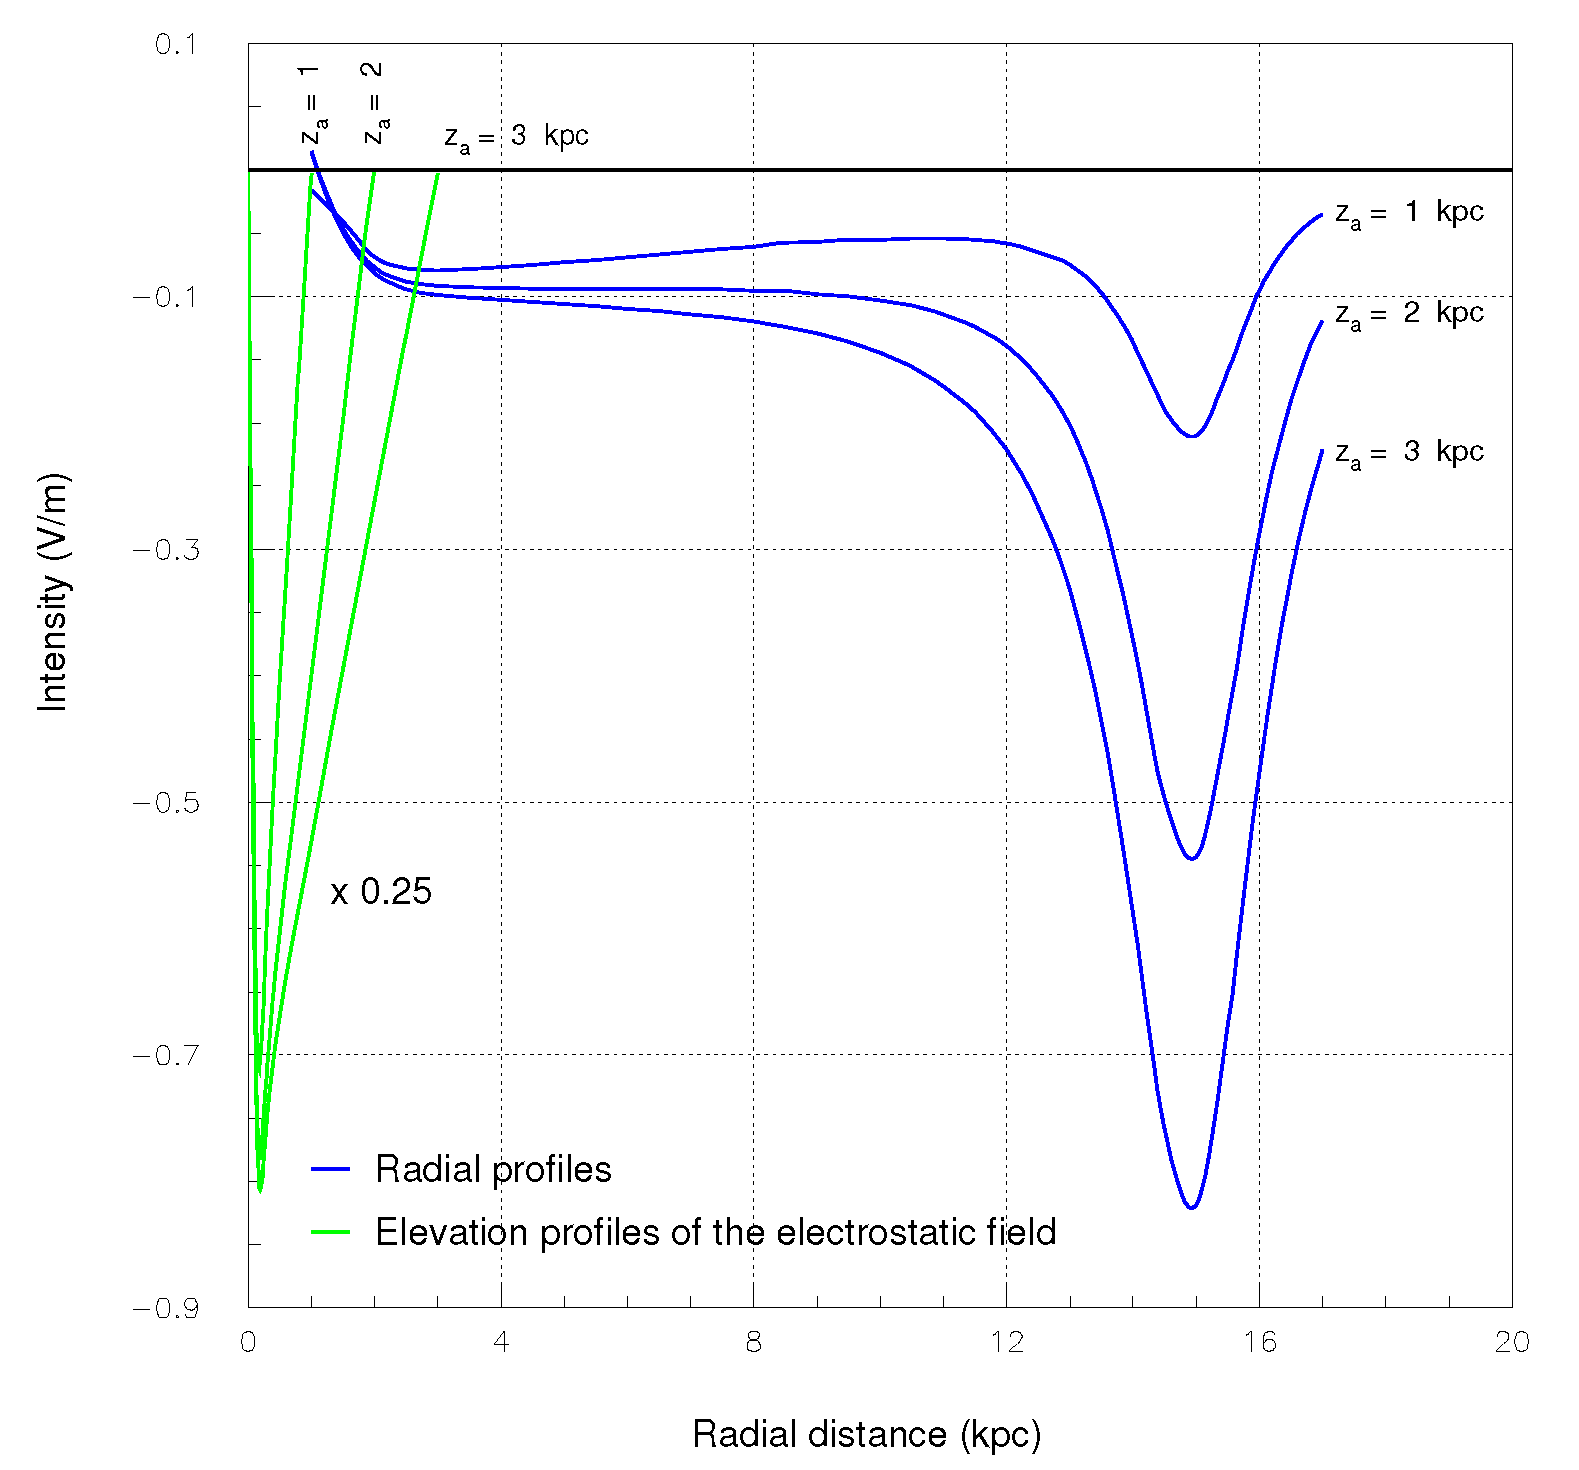
Figure 3.
Radial intensity of the Galactic electric field used in this work. The intensity ranges from null values around the Galactic center up to the maximum value of V/m reached at the nominal disk border of 15 [26,27]. Beyond the disk border the field rapidly decreases. The displayed intensity is computed with two cylindrical concentric charge distributions of C with two different Galactic elevations. The negative charge , mainly located in the cosmic ray sources, equals the positive charge , namely, = - = - C. and The different charge densities generate the Galactic electric field . Arguments to derive the Galactic field strength are concisely and easily available in [3].
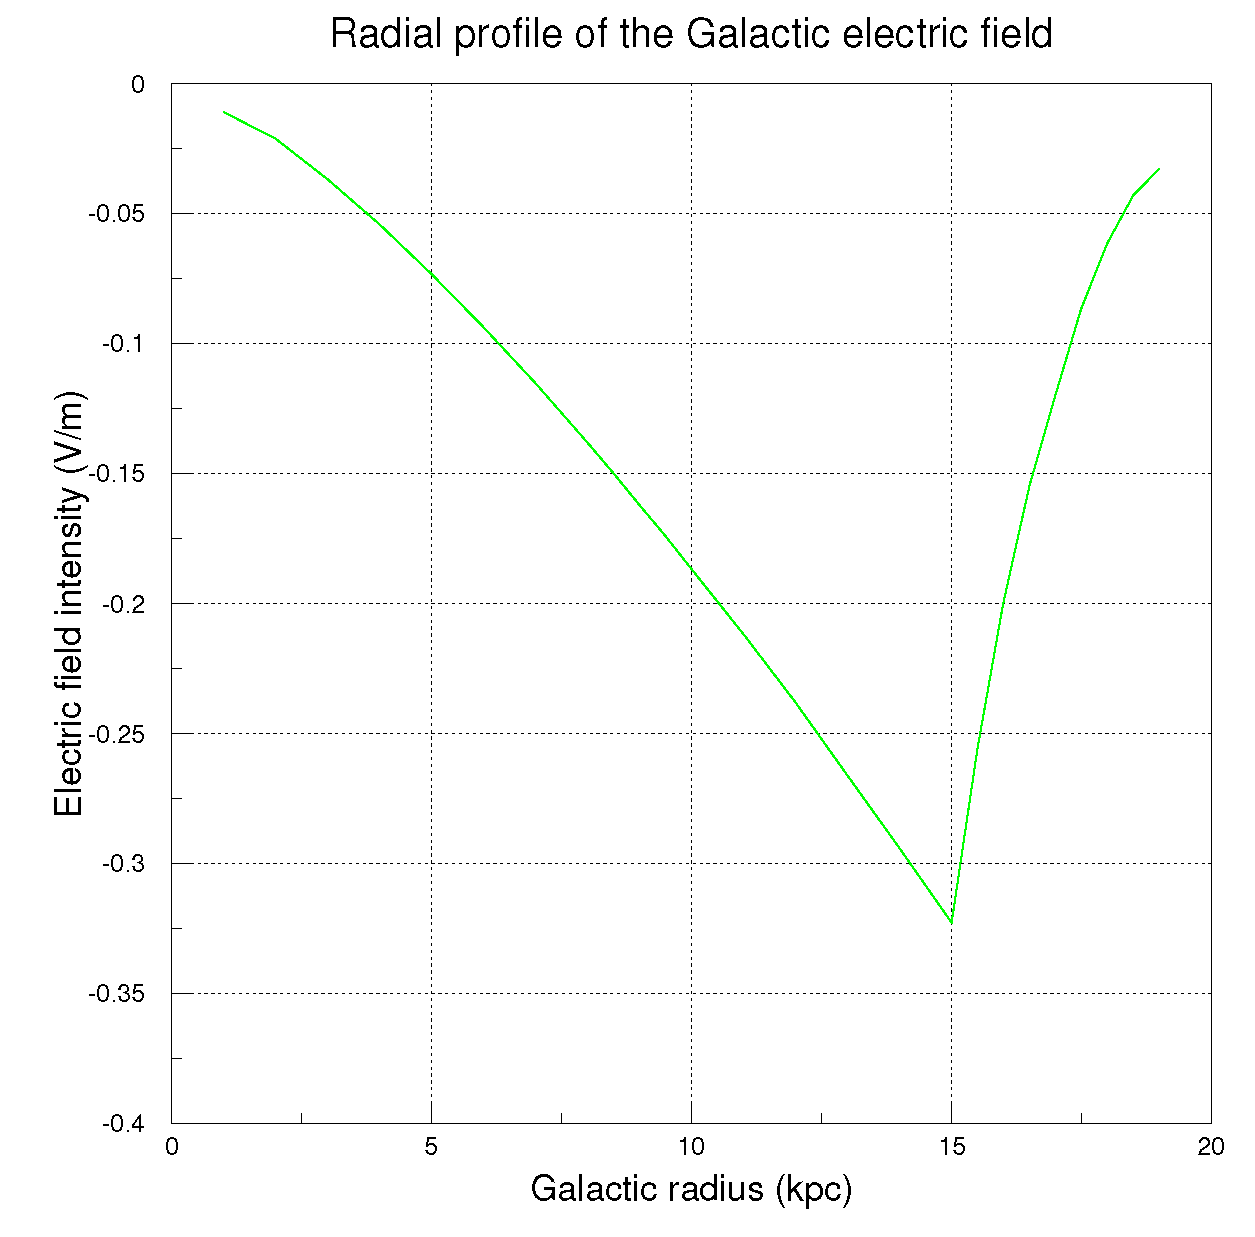
Figure 4.
Example of cumulative mass versus radius r for an exponential disk of characteristic length of according to Equation (5). The major fraction of the mass resides in the exponential disk predominantly formed by stars and, marginally, by gas. The spherical or axisymmetric stellar halo has a lower mass than the exponential disk (see Section 5 for the adopted masses).
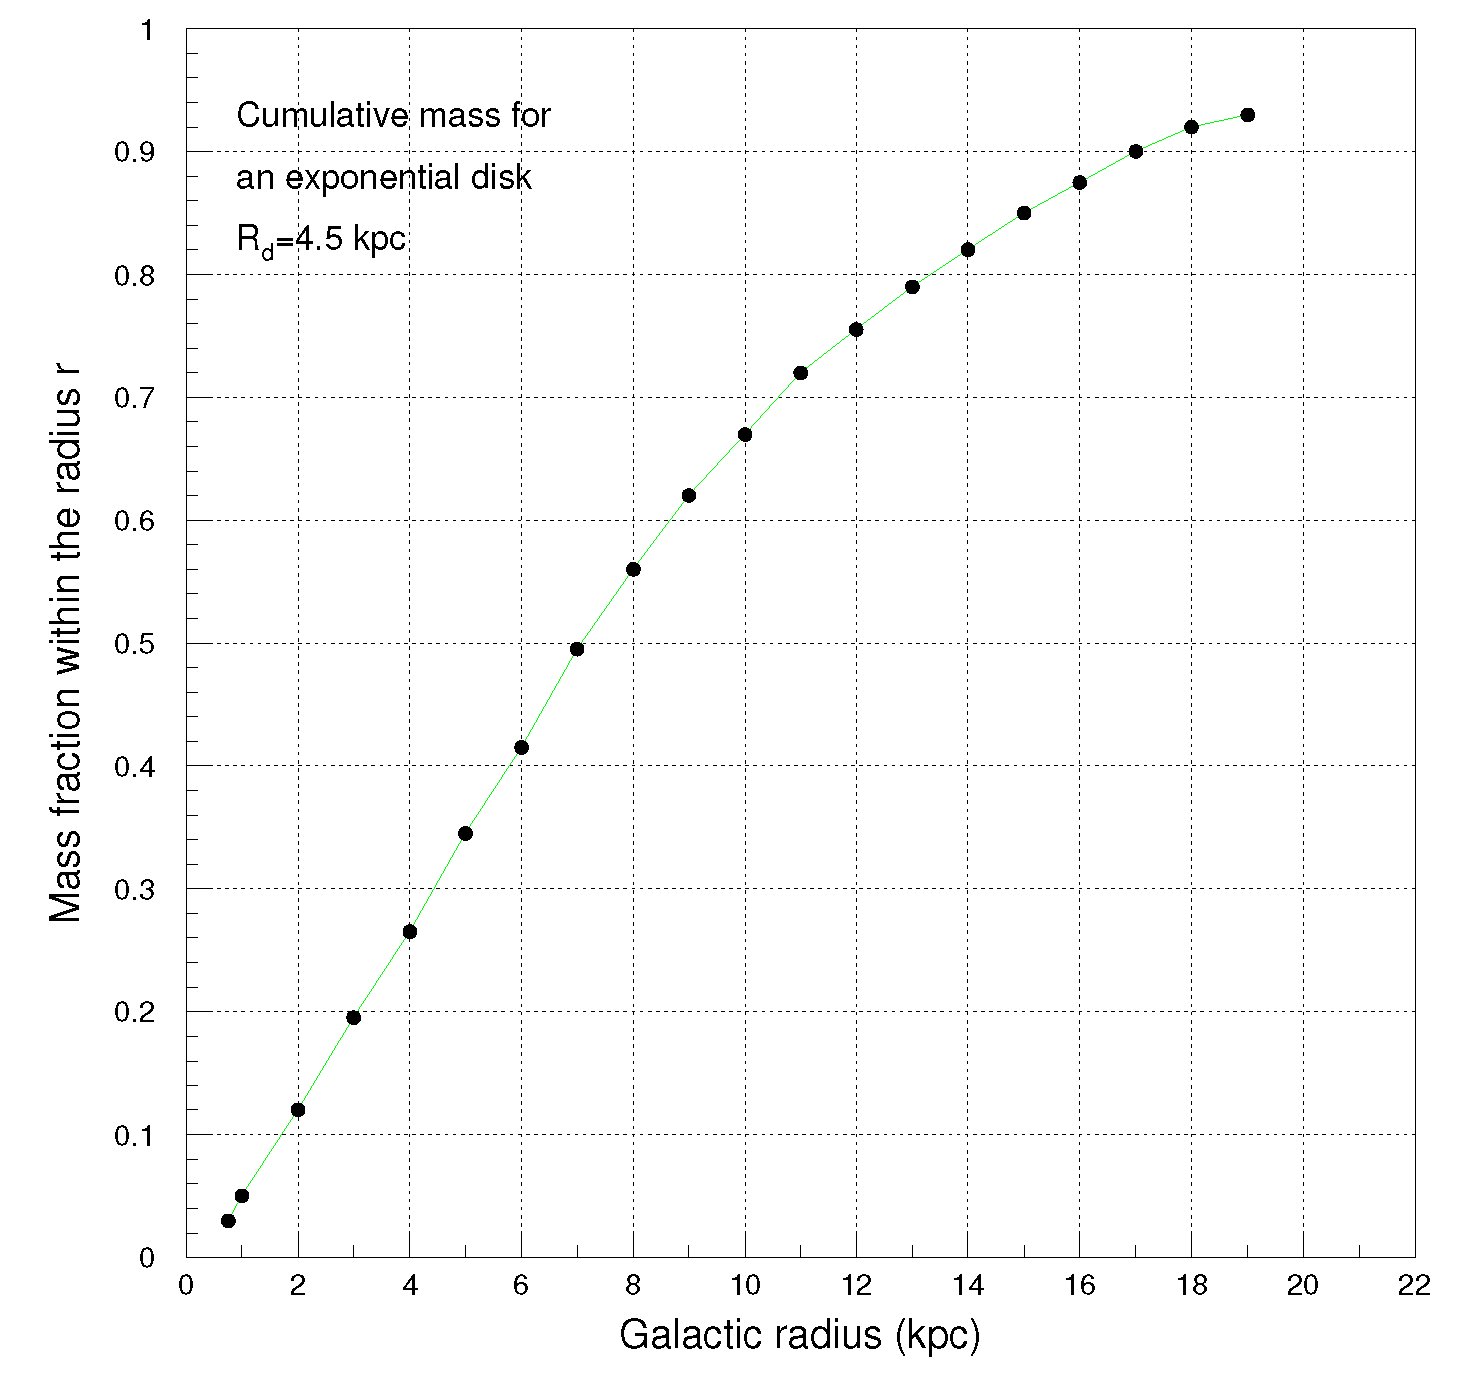
Figure 5.
Circular velocities of stars and clouds in the Milky Way Galaxy as a function of the radial distance r caused by gravity and electric forces according to Equation (2). Circular velocities (blue curves) are obtained with the electric field displayed in Figure 3, = 2.5, disk mass of , halo mass = , total Galactic mass of = [18] and two characteristic disk radii, = [18] and 4.5 . The black profiles are obtained only by gravity for = and , purposely omitting the electric field, to dissect its influence. The calculation takes into account the positive electric charge deposited by cosmic rays in the solar wind, q, via the constant parameter = i. e. the generic balancing charge of stars and clouds, ≡m and, in turn, ≡q/ (see footnote 1).
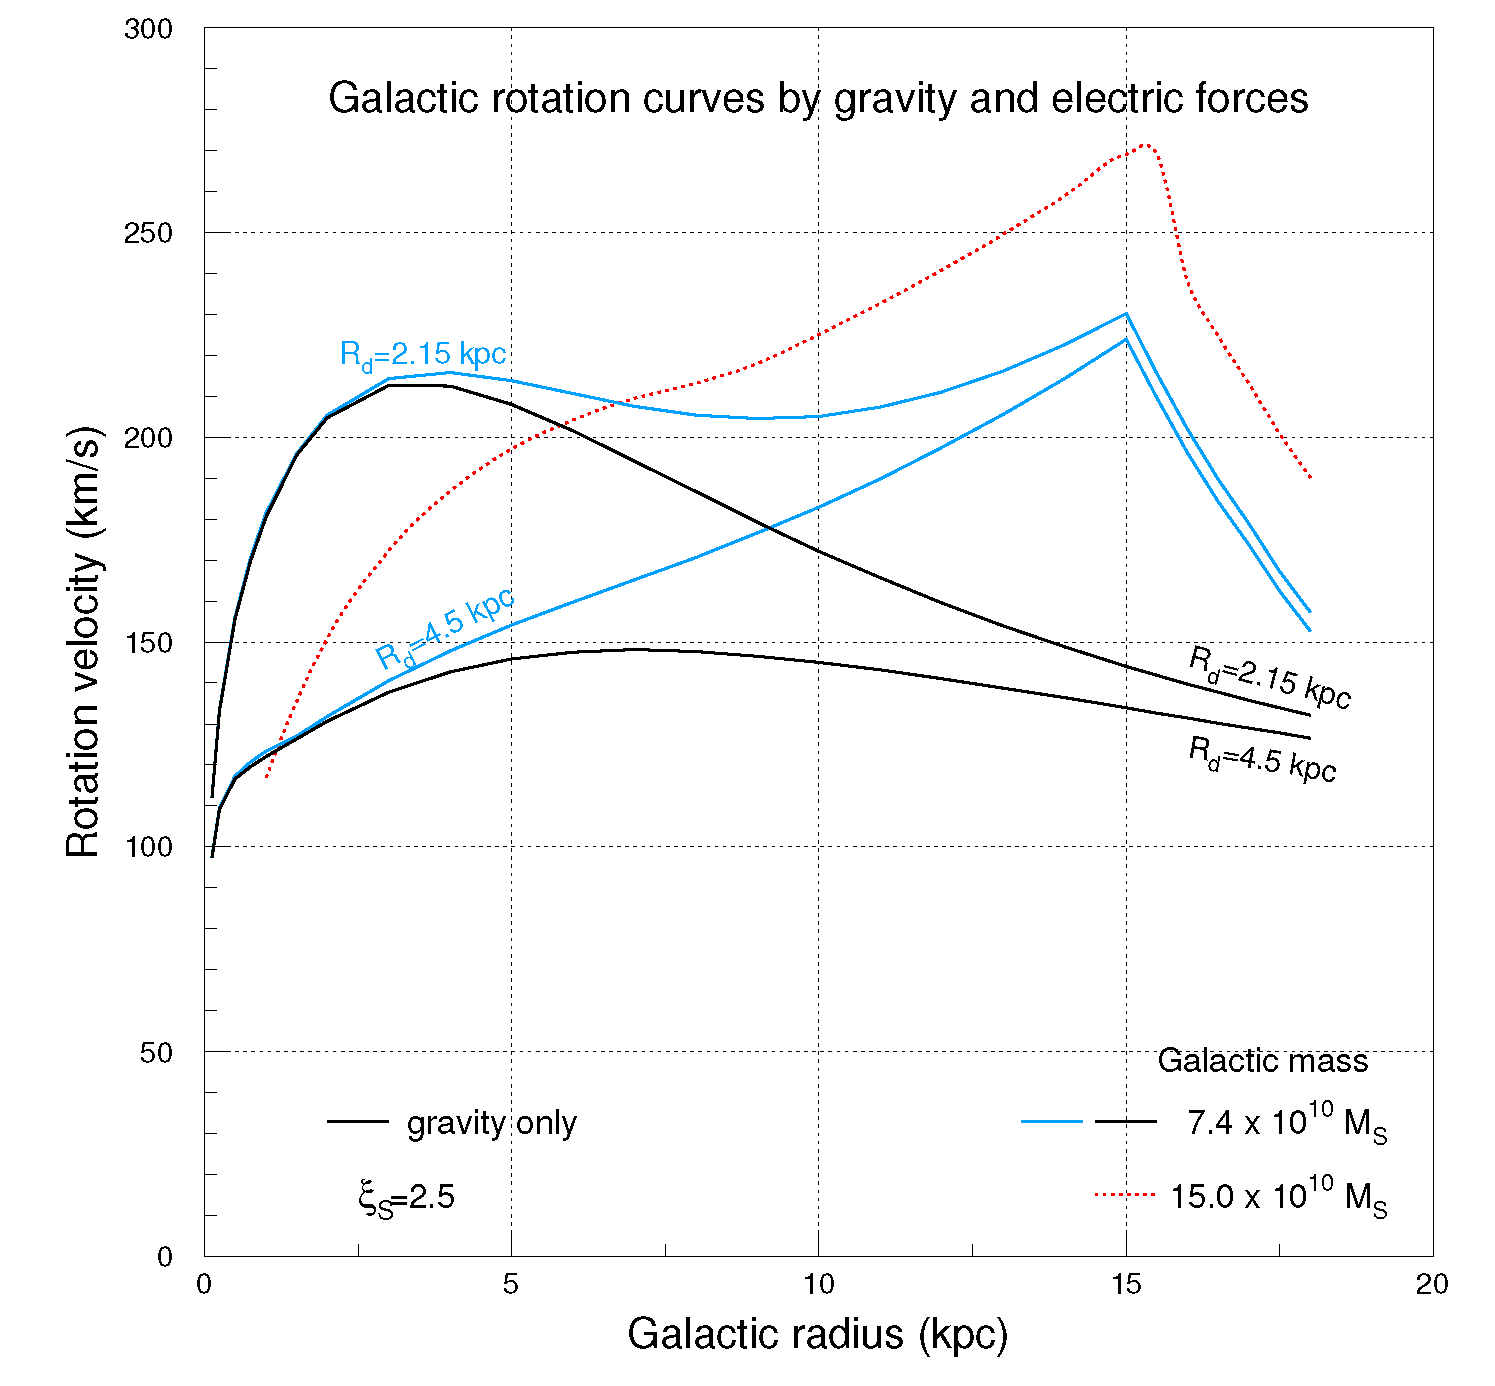
Figure 6.
Circular velocities of stars and clouds in the as a function of the radial distance r onto the Galactic midplane obtained with a mass of = , nearly double than that adopted in Figure 5 and a characteristic disk radius = . The calculation takes into account the positive electric charge deposited by cosmic rays in stellar winds via the parameter i. e. the balancing charge of the stars and clouds (see footnote 1 and ref. [8]). The figure highlights the dependence of the circular velocities (rotation curves) on the parameter = 1.5, 2.5 and 3. The black profile is obtained only by gravity ignoring the electric field. The outsize Galactic mass of in comparison with that of [18] charts the influential trend of gravity on the rotation curves (black curves in this figure and Figure 5).
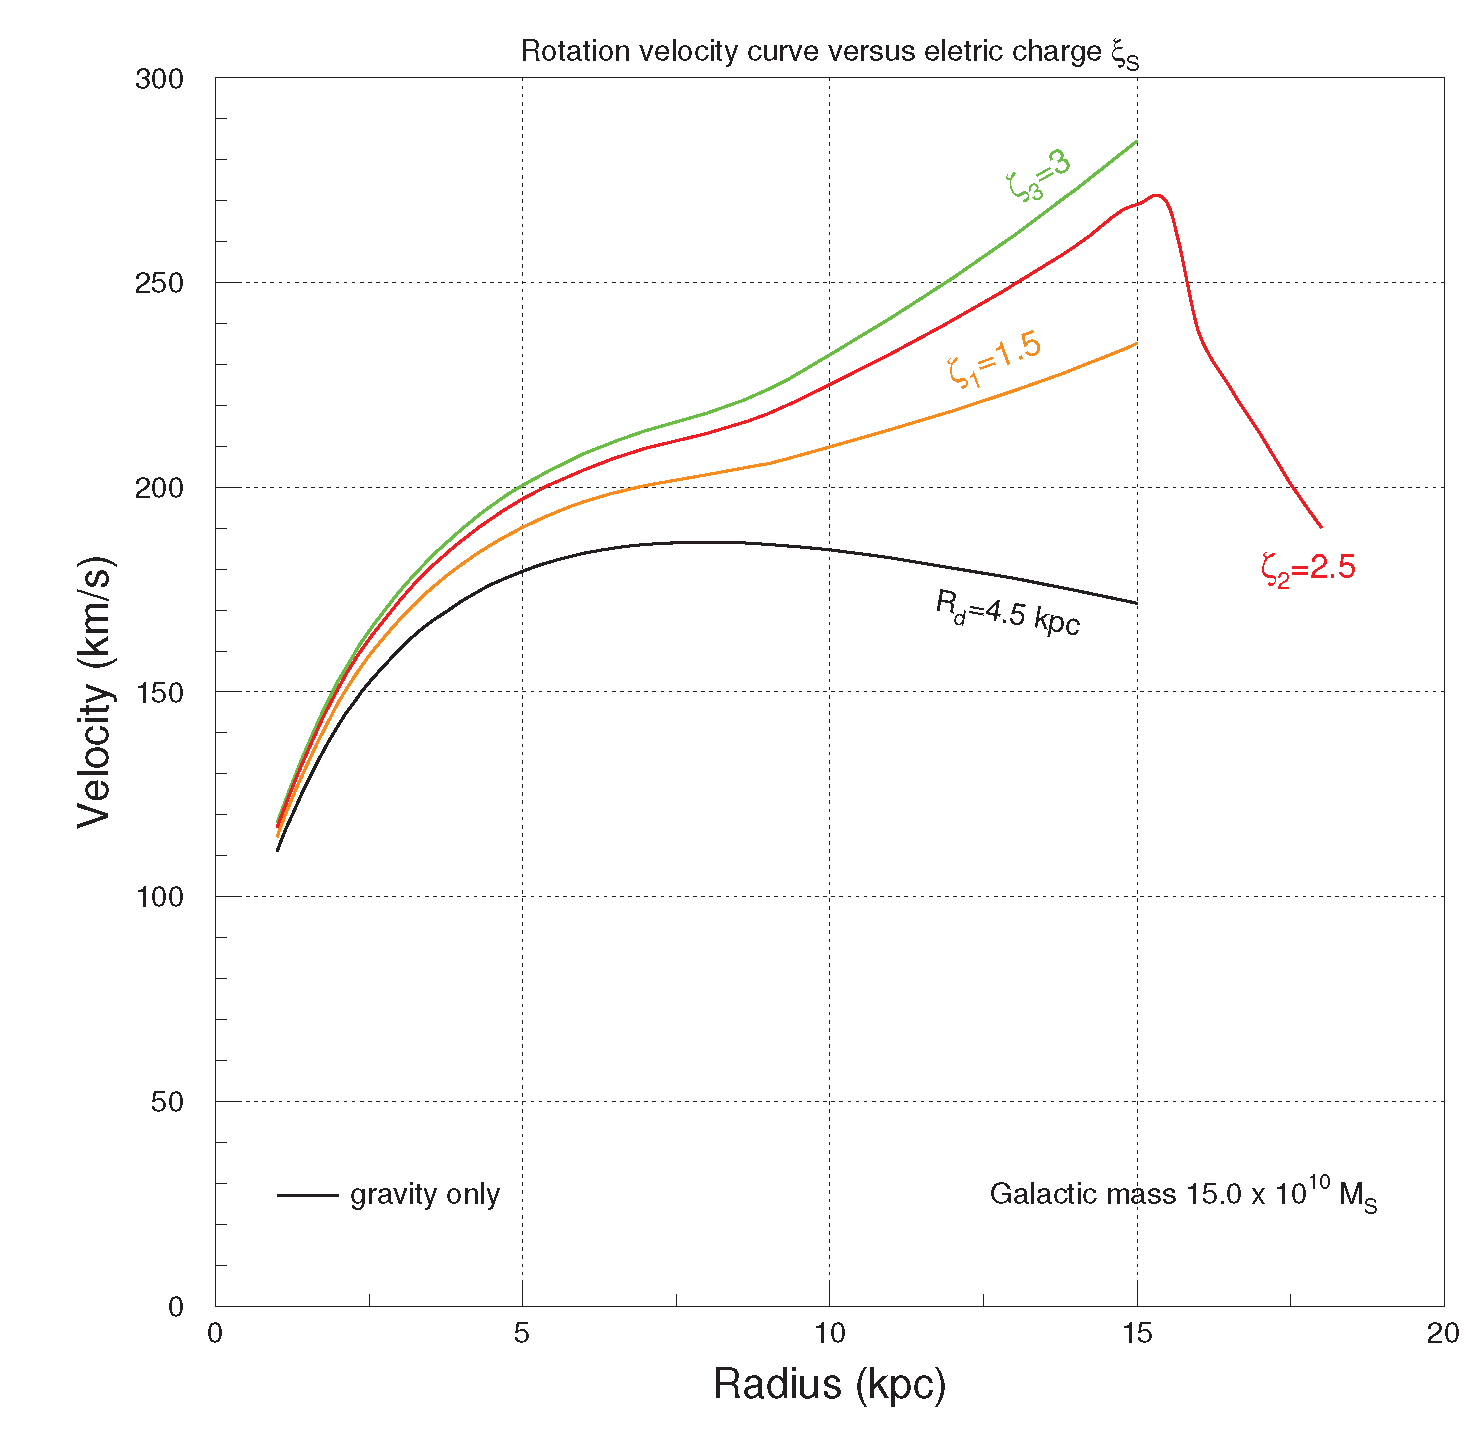
Figure 7.
Rotation curves of the Milky Way Galaxy from a classical compilation made in 1989 [20] taking advantage of diverse methods and frequently quoted in the literature. These data attest an increasing profile of the rotation curves beyond the radial distance of 8.5 .
Figure 7.
Rotation curves of the Milky Way Galaxy from a classical compilation made in 1989 [20] taking advantage of diverse methods and frequently quoted in the literature. These data attest an increasing profile of the rotation curves beyond the radial distance of 8.5 .
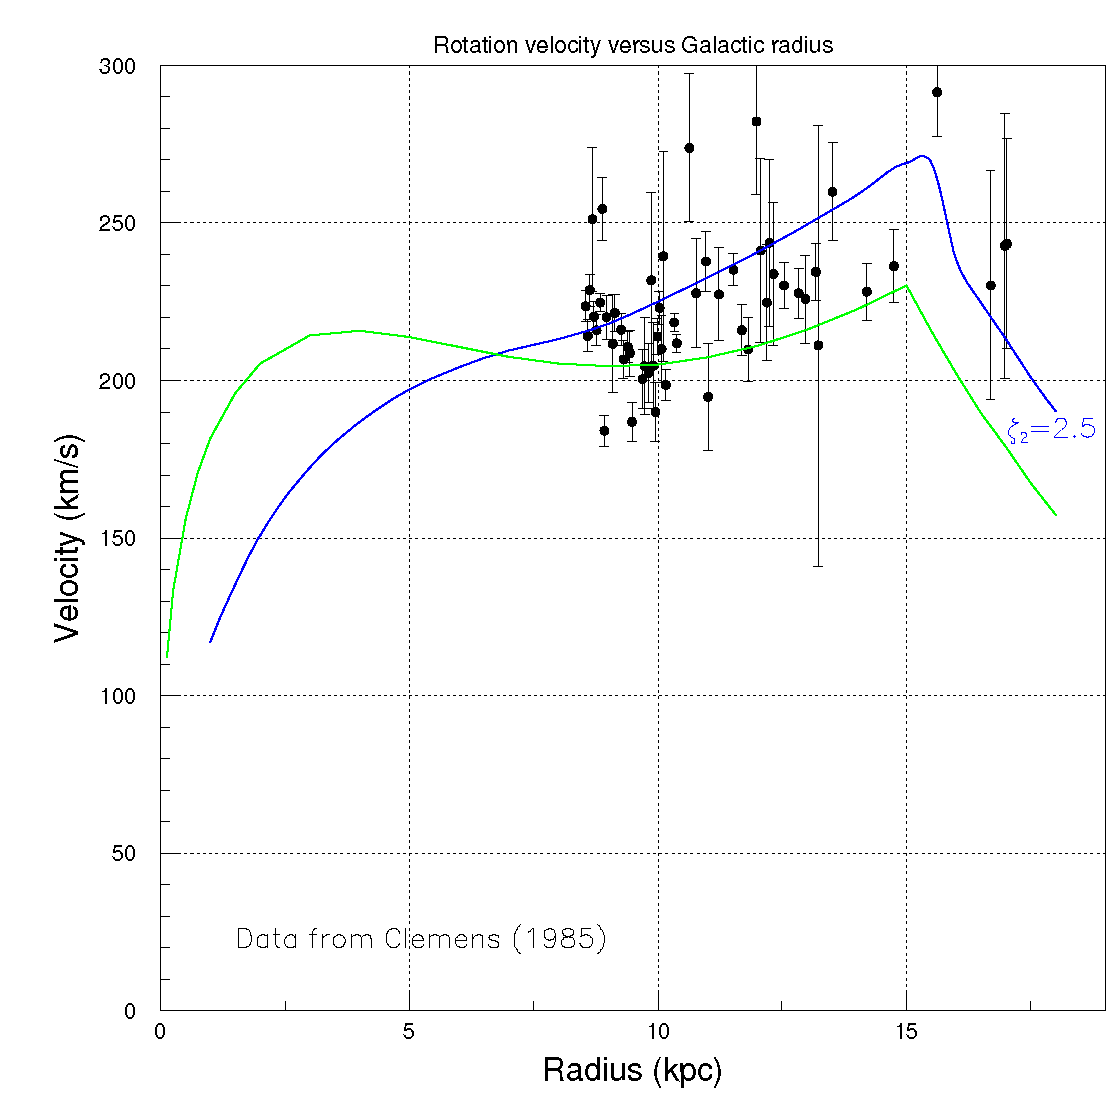
Figure 8.
Rotation curves of the Milky Way Galaxy beyond the solar circle set at a radius of ±. Cloud velocities are measured via CO emission in clouds and distances by photometry [22]. Beyond the solar circle up to the disk border, at 15 , rotation curves slightly increase with the radius.
Figure 8.
Rotation curves of the Milky Way Galaxy beyond the solar circle set at a radius of ±. Cloud velocities are measured via CO emission in clouds and distances by photometry [22]. Beyond the solar circle up to the disk border, at 15 , rotation curves slightly increase with the radius.
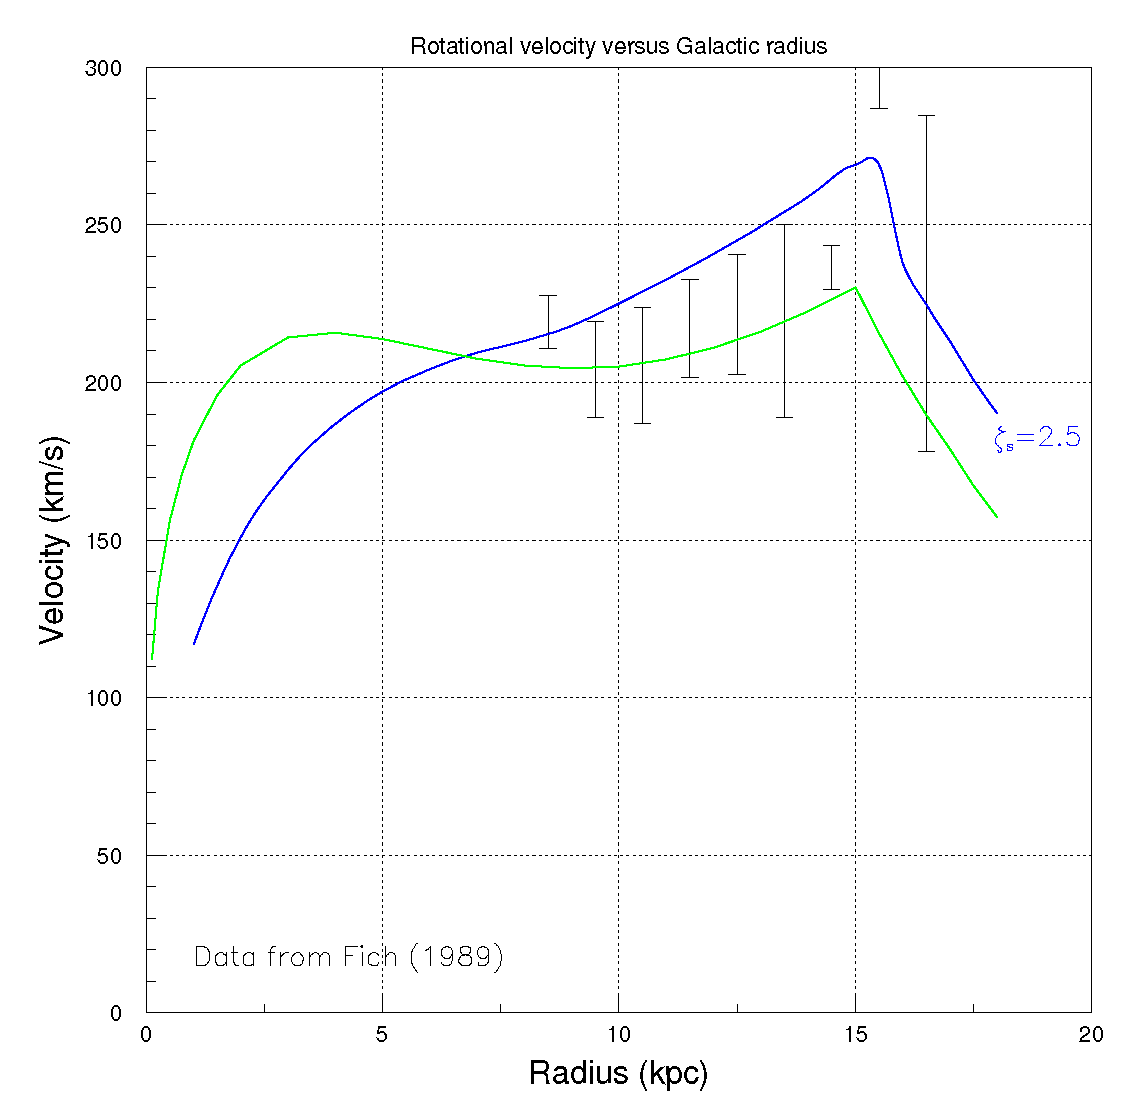
Figure 9.
Rotation curves of (red squares) based on the disk thickness layer measured via 21 cm HI emission [21] compared with calculations (blue and green curves in Figure 5) of this work derived from Equation (4). Rotation curves of planetary nebulae (open dots) [24] also have a definite rising trend from 8.5 up to 15 . The electrostatic field acting on charged stars and clouds is the novel agent proposed in this work to forge the rotation velocity curves. It cooperates with gravity giving flat or slightly increasing rotation velocity curves in the radial range ≤r≤ 15 as shown in Figure 5.
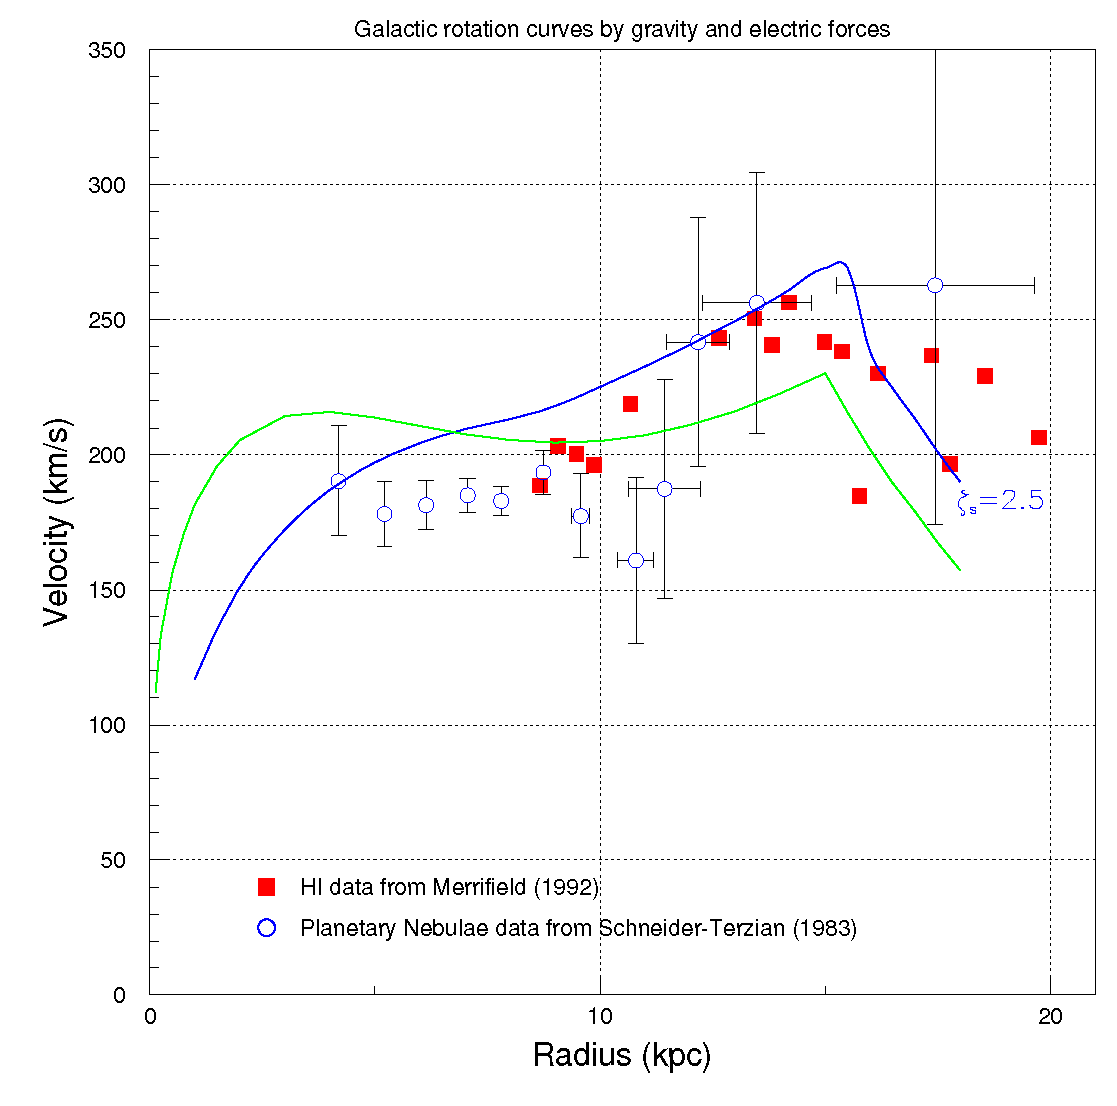
Figure 10.
Average rotation curves of the Milky Way Galaxy elaborated by others [29] which include all data until 2013. The data have been measured in the course of the last 40 years and lie in the radial interval ≤r≤ 18 . The reanalysis [29] adopts velocities of 244, 220 and 200 /s and Galactocentric distances of , and , respectively. Globally, increasing rotation curves are observed. The green and blue curves are those displayed in Figure 5 and Figure 6 derived from Equation (4).
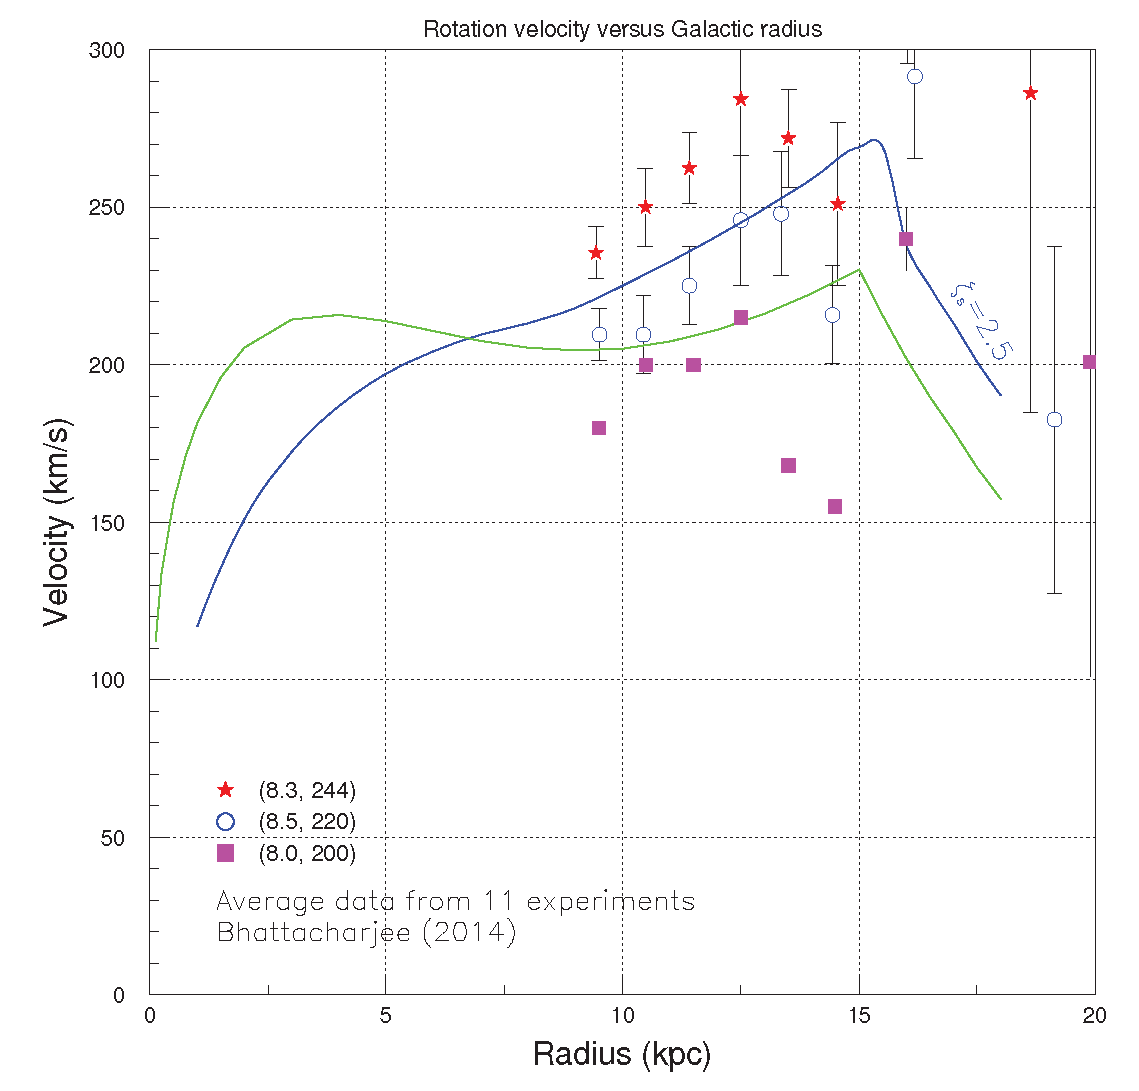
Figure 11.
Rotation velocity curves, v(r), obtained by Carbon stars of type N [26] in the radial range ≤r≤ 17 of the Milky Way Galaxy . Notice the large dispersion of the velocity for a given radius : for example, at the arbitrary radial distance r of 12 velocities jerks from 20 to 280 /s. The average values of v(r) in the same radial range are systematically and significantly below those of the classical compilation [20] shown in Figure 7.
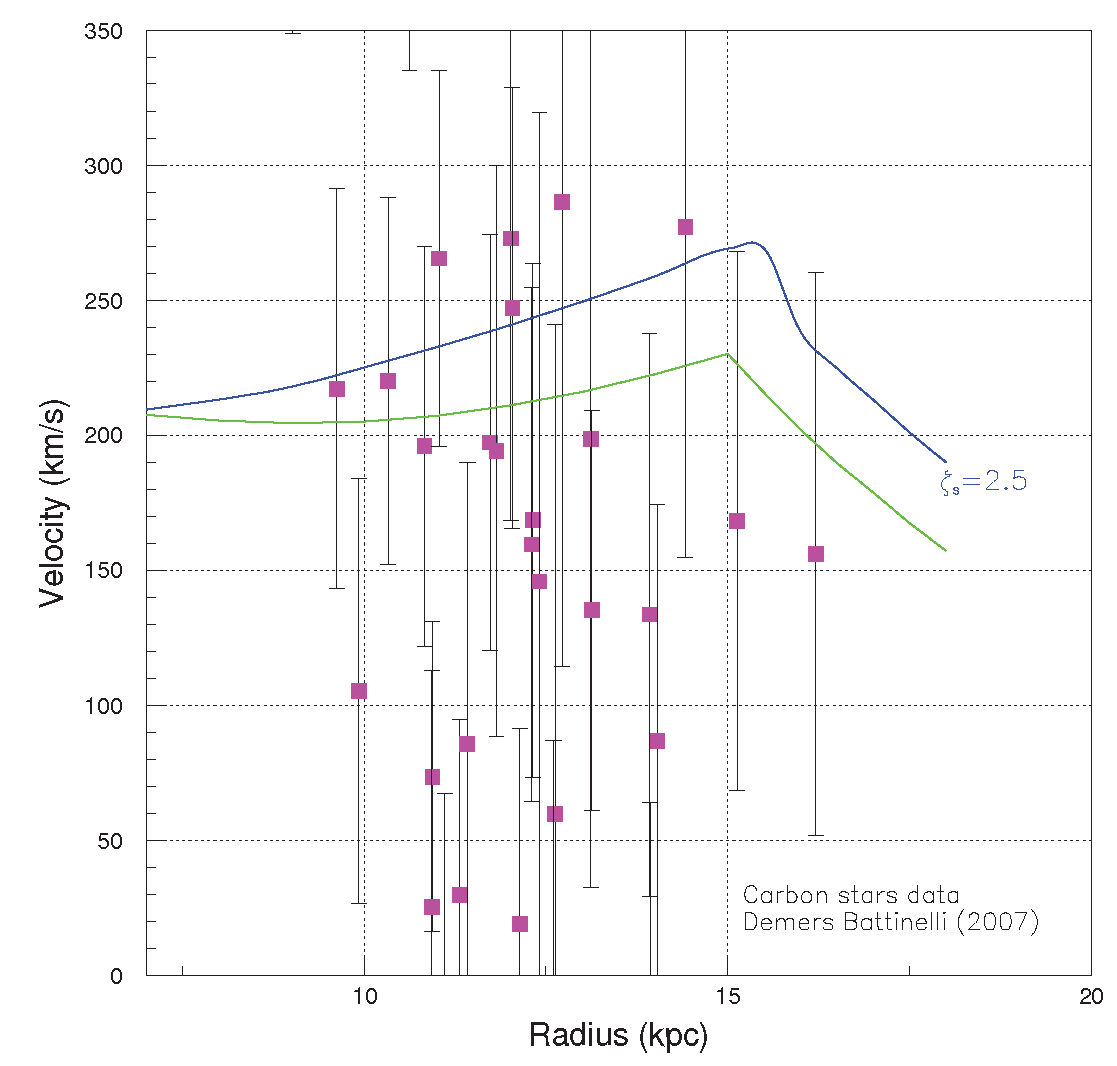
Figure 12.
Rotation velocity curves obtained from trigonometric parallaxes and proper motions of 23000 red giant stars [34] (red dots) and 16000 primary red clump giants together with 5700 halo K giants [35] (green squares). Red error bars for the 23000 red giant stars [34] are as small as the red dots. From the stated errors the evidence here is for discrepant measurements or, eventually, protocols of the two measurements are not equivalent.
Disclaimer/Publisher’s Note: The statements, opinions and data contained in all publications are solely those of the individual author(s) and contributor(s) and not of MDPI and/or the editor(s). MDPI and/or the editor(s) disclaim responsibility for any injury to people or property resulting from any ideas, methods, instructions or products referred to in the content. |
© 2025 by the authors. Licensee MDPI, Basel, Switzerland. This article is an open access article distributed under the terms and conditions of the Creative Commons Attribution (CC BY) license (http://creativecommons.org/licenses/by/4.0/).
Copyright: This open access article is published under a Creative Commons CC BY 4.0 license, which permit the free download, distribution, and reuse, provided that the author and preprint are cited in any reuse.


