
Submitted:
19 May 2025
Posted:
19 May 2025
You are already at the latest version
Preprints on COVID-19 and SARS-CoV-2
Abstract
The coronavirus pathogenesis pathway, which consists of severe acute respiratory syndrome (SARS) coronavirus infection and signaling pathways, including the interferon pathway, the transforming growth factor beta pathway, the mitogen-activated pathway kinase pathway, the apoptosis pathway, and the inflammation pathway, is activated upon coronaviral infection. An artificial intelligence approach based on machine learning was utilized to develop models with images of the coronavirus pathogenesis pathway to predict the activation states. Data on coronaviral infection held in a database were analyzed with Ingenuity Pathway Analysis (IPA), a network pathway analysis tool. Data related to SARS coronavirus 2 (SARS-CoV-2) were extracted from more than 100,000 analyses and datasets in the IPA database. A total of 27 analyses, including nine analyses of SARS-CoV-2-infected human-induced pluripotent stem cells (iPSCs) and iPSC-derived cardiomyocytes and fibroblasts, and a total of 22 analyses of SARS-CoV-2-infected lung adenocarcinoma (LUAD) were identified as being related to “human” and “SARS coronavirus 2” in the database. The coronavirus pathogenesis pathway was activated in SARS-CoV-2-infected iPSC-derived cells and LUAD cells. A prediction model was developed in Python using images of the coronavirus pathogenesis pathway under different conditions. The prediction model of activation states of the coronavirus pathogenesis pathway may aid in treatment identification.
Keywords:
artificial intelligence
; coronavirus
; coronaviral infection
; machine learning
; pathway analysis
; prediction model
; molecular network
; molecular pathway image
; network analysis
1. Introduction
The COVID-19 pandemic, caused by severe acute respiratory syndrome coronavirus 2 (SARS-CoV-2), has raised challenges in discovering new therapeutic agents and understanding the molecular mechanisms of emerging diseases. The coronavirus pathogenesis pathway illustrates how SARS coronavirus infection triggers cellular reactions leading to SARS coronavirus replication, adaptive immunity, innate immunity, apoptosis, lung fibrosis, acute respiratory distress syndrome (ARDS), and endothelial cell dysfunction [1,2,3]. In the coronavirus pathogenesis pathway, several signaling pathways, such as the mitogen-activated protein kinase (MAPK) pathway, the apoptosis pathway, the unfolded protein response, and the interferon (IFN) type I pathway are activated [3]. The coronavirus pathogenesis pathway defined with Ingenuity Pathway Analysis (IPA) includes various signaling pathways involving IFN type I, transforming growth factor (TGF) beta 1 (TGFβ1), the MAPK pathway, and nodes such as MAPK components (c-jun N-terminal kinase (JNK); extracellular signal-regulated kinase 1/2 (ERK1/2); p38MAPK) and interleukin 1B (IL1B), angiotensin II receptor type I (AGTR1), and angiotensin-converting enzyme 2 (ACE2) [4,5,6,7,8]. Previous studies demonstrated that SARS-CoV-2 infection causes pulmonary disease and cardiovascular diseases [9,10]. Cardiac side effects of the mRNA-based vaccines for SARS-CoV-2 infection or coronavirus disease 2019 (COVID-19) have been reported and are of great concern [11,12]. A study has demonstrated that mRNA-based vaccines induce specific dysfunctions in isolated adult rat cardiomyocytes [13]. While post-COVID-19 syndrome, defined as the persistence or new onset of symptoms three months after the infection that leads to a significant daily life impairment [14], has correlated to the daily life impairment caused by somatic symptom disorder [15], the mechanism of the post-COVID-19 syndrome is unknown. A study demonstrates that post-COVID-19 lung fibrosis shares immunological characteristics with idiopathic pulmonary fibrosis and suggests that SARS-CoV-2 infection activated biological pathways common with idiopathic pulmonary fibrosis [16]. It is crucial to know the mechanism of the diseases and predict the activation states of disease pathways for safer development of therapeutics or vaccines for the diseases.
In this study, we developed a model to predict the activation states of the coronavirus pathogenesis pathway. We aimed to create a model to predict changes in activation status based on gene expression in the coronavirus pathogenesis pathway using an artificial intelligence (AI) approach and machine learning. In our previous study, we found that the coronavirus pathogenesis pathway was activated in diffuse-type gastric cancer [17]. Diffuse-type gastric cancer is characterized by epithelial–mesenchymal transition (EMT), a cellular phenotypic transition associated with cancer metastasis and recurrence, for which the involvement of cell cycle regulation has been identified [18]. In this study, we also investigated the relationship between diffuse-type gastric cancer networks and SARS-CoV-2 analyses.
In the study presented herein, we previously conducted AI modeling on EMT and created a highly accurate prediction model of EMT regulation pathways using a commercially available, fully automated machine learning AI platform [19]. Considering the fact that this commercial AI platform is limited to licensed users, in the current study, we aimed to create a prediction model of coronavirus pathogenesis pathway activation with the publicly available programming language Python to facilitate data democratization.
2. Materials and Methods
2.1. Coronavirus Pathogenesis Pathway and the Activation Z-Score
The coronavirus pathogenesis pathway was analyzed using the Ingenuity Pathway Analysis (IPA) network pathway tool [17,20] (https://digitalinsights.qiagen.com/products-overview/discovery-insights-portfolio/analysis-and-visualization/qiagen-ipa/). The activation z-score of the coronavirus pathogenesis pathway was calculated in the Ingenuity Knowledge Base [20]. Briefly, the activation z-score indicates the relation in the gene expression pattern of the molecules in the dataset and the pattern that is expected based on the available literature on the coronavirus pathogenesis pathway (https://qiagen.my.salesforce-sites.com/KnowledgeBase/KnowledgeNavigatorPage?id=kA41i000000L5nQCAS&categoryName=IPA). The activation z-score is calculated in the IPA and defined for upstream regulator analysis as follows [20]:
where
All differentially expressed genes in a given dataset that are also present as nodes in the master network form a subset . Each gene in the dataset, D, can be either up- or downregulated, with the gene represented by the sign [20]. The causal analysis algorithms are based on a “master” network, which is derived from the Ingenuity Knowledge Base, and given by a directed multigraph , with nodes V representing mammalian genes, chemicals, protein families, complexes, microRNA species, and biological processes and edges reflecting observed cause–effect relationships [20]. Edges are also associated with weights , reflecting the confidence in the assigned direction of the effect [20]. Further details are provided in the work of Kämer et al. [20].
A network is a graphical representation of the molecular relationships between molecules. Molecules are represented as nodes, and the biological relationship between two nodes is represented as an edge (line). All edges are supported by at least one reference from the literature, from a textbook, or from canonical information stored in the QIAGEN Knowledge Base. The intensity of the node color indicates the degree of up-(red) or down-(green) regulation. Nodes are displayed using various shapes that represent the functional class of the gene product (https://qiagen.my.salesforce-sites.com/KnowledgeBase/KnowledgeNavigatorPage?id=kA41i000000L5pXCAS&categoryName=IPA ).
2.2. Network Analysis
As of 2021, 106 analyses and 106 datasets from more than 100,000 pieces of data were found to be related to SARS-CoV in the IPA database. We filtered the 106 analyses associated with “SARS coronavirus 2” with the term “human,” with a total of 49 analyses being identified. The 49 analyses consisted of 22 analyses of lung adenocarcinoma (LUAD) and 27 analyses of non-LUAD data. The gene expression data of the analyses are publicly available in Gene Expression Omnibus (GEO) as GEO Series (GSE) (https://www.ncbi.nlm.nih.gov/geo/). The data from the 22 analyses of LUAD included 13 analyses of LUAD infected with SARS-CoV-2 of amlodipine series (GSE154613) [21], one analysis of LUAD bronchial epithelial Calu-3 cells infected with SARS -CoV Urbani strain (GSE17400) [22], and eight analyses of LUAD cells infected with SARS-CoV-2 (GSE147507) (ACE2-transfected A549 cells) [23,24]. We analyzed eight analyses of GSE147507 [23,24] and the data on LUAD bronchial epithelial cells infected with SARS-CoV (GSE17400) [22]. The 27 analyses of non-LUAD data included nine analyses of induced pluripotent stem cell (iPSC)-derived cardiac cells (GSE156754) [9,25].
2.3. Analysis Match
SARS-CoV-2 analyses data and diffuse-type gastric cancer data were compared using the Analysis Match function in the IPA database (https://qiagen.my.salesforce-sites.com/KnowledgeBase/KnowledgeNavigatorPage?id=kA41i000000L5vUCAS&categoryName=IPA). Our previous finding showed a certain degree of correlation between diffuse-type gastric cancer data and the virus infection pathway [26]. The Analysis Match function identified the entities related to diffuse-type gastric cancer and SARS-CoV-2 datasets. The entities of the Analysis Math included upstream regulators (URs), master regulators in causal networks (CNs), and diseases and functions in downstream effects (DEs).
2.4. Activity Plot Analysis
The activity plot of the activation z-score of the coronavirus pathogenesis pathway in the IPA database identified more than 10,000 analyses as of 2021, of which 100 (50 activated and 50 inactivated) pathway maps of the coronavirus pathogenesis pathway were obtained and used as training data for machine learning.
2.5. Python Coding
We created a model to predict the activation state using Python (GitHub: https://github.com/Shihori/AI/blob/main/molNW_sec6_cnn_230529_12_11_23_ipynb_CPP_12_22_23_corona2.ipynb ). The Python code was created with reference to the textbook “Machine Learning in Python: Machine Learning of Life Science Data” [27]. The Python code for convolutional neural network modeling detailed in section six in the textbook was used to create the prediction model of the activation states of the coronavirus pathogenesis pathway [27]. The 100 images of the coronavirus pathogenesis pathway (50 activated and 50 inactivated images of the coronavirus pathogenesis pathway) obtained in the network pathway analysis with IPA were uploaded, among which 70, 20, and 10 images were used as training, validation, and test datasets in Google Colaboratory (binary classification). The Gradient-weighted Class Activation Mapping (Grad-CAM) technique was used to interpret the decision of the AI to distinguish the activation of the images by coloring the locus of the AI’s attention [27]. Subsequently, the model VGG16 for transfer learning was programmed in Python (GitHub: https://github.com/Shihori/AI/blob/main/molNW_sec6_cnn_230529_12_11_23_ipynb_CPP_12_22_23_corona2.ipynb ) [27].
2.6. Statistical Analysis
3. Results
3.1. Molecular Network Analysis of SARS-CoV-2
The LUAD data were compared and analyzed with IPA because, as of 2011, 22 LUAD analyses related to the terms “human” and “SARS coronavirus 2” have been identified when searched with this form of analysis, and lung fibrosis was included in the coronavirus pathogenesis pathway. The data from the 22 analyses included 13 analyses of GSE154613 (amlodipine series) [21], one analysis of GSE17400 (Calu-3 cells infected with SARS-CoV Urbani strain) [22], and eight analyses of GSE147507 (ACE2-transfected A549 cells) [23]. The activation z-score of the coronavirus pathogenesis pathway in eight analyses of SARS-CoV-2-infected A549 cells in 0.2 or 2 multiplicity of infection (MOI) (GSE147507) is shown in Table 1. The heatmap of activation states of canonical pathways of the eight analyses of SARS-CoV-2-infected A549 cells (GSE147507) as of 2024 is shown in Figure 1.
3.2. Coronavirus Pathogenesis Pathway in LUAD Samples Infected with SARS-CoV
The coronavirus pathogenesis pathway was overlaid with data from the LUAD samples infected with SARS-CoV (Figure 2). The coronavirus pathogenesis pathway was overlaid with gene expression data of LUAD bronchial epithelial cell (Calu-3 cell line) samples infected with SARS-CoV Urbani strain in 0.1 MOI compared to mock-infected Calu-3 cells (GSE17400) (as of 2024).
3.3. SARS-CoV-2 Analysis Matched with Diffuse-Type Gastric Cancer
Another dataset related to SARS-CoV-2 included data from iPSCs infected with SARS-CoV-2. The findings of previous studies revealed a certain degree of correlation between a network of diffuse-type gastric cancer and RNA viral infection [17,26]. To further investigate the regulation mechanism of SARS-CoV-2-related networks and diffuse-type gastric cancer, a series of SARS-CoV-2-related analyses were compared to the analyzed gene expression data of diffuse-type gastric cancer. The five analyses related to SARS-CoV-2 (iPSC-derived cardiomyocyte infected with SARS-CoV-2 0.001 MOI vs. mock, iPSC-derived cardiomyocyte infected with SARS-CoV-2 0.01 MOI vs. mock, iPSC-derived cardiomyocyte infected with SARS-CoV-2 0.1 MOI vs. mock, iPSC-derived cardiac fibroblast infected with SARS-CoV-2 0.006 MOI vs. mock, and iPSC infected with SARS-CoV-2 0.006 MOI vs. mock) (GSE156754 https://www.ncbi.nlm.nih.gov/geo/query/acc.cgi?acc=GSE156754) [9,25] were compared with the analysis result of gene expression data of diffuse-type gastric cancer using the Analysis Match function in IPA (as of 2022). The compared SARS-CoV-2 data comprised the RNA sequencing data of iPSCs or iPSC-derived cardiac cells infected with SARS-CoV-2 (GSE156754) in the IPA database. The upstream regulators (URs) identified in the analyses included TP53, let-7, CDKN2A, calcitriol, NUPR1, SMARCB1, MEF2D, decitabine, SPARC, and RB1 (Table 2). A similar activation z-score was observed in let-7 when the data of diffuse-type gastric cancer were compared to SARS-CoV-2 analyses in the IPA. The entity types identified included upstream regulators (URs), master regulators in causal networks (CNs), and diseases and functions in downstream effects (DEs) (Table 2).
3.4. Coronavirus Pathogenesis Pathway in Stem Cells
The coronavirus pathogenesis pathway was overlaid with the analysis of SARS-CoV-2-infected skin-derived iPSCs (GSE156754) [9,25] in the IPA database. The RNA sequencing data of iPSCs infected with 0.006 multiplicity of infection (MOI) of SARS-CoV-2 were compared to the data of iPSCs infected with mock (Figure 3). In the analysis, the expression of TP53, STAT3, JAK1, STAT2, EP300, ATP6AP1, DPP9, ZC3HAV1, and NUP98 was upregulated in iPSCs infected with SARS-CoV-2 compared to the mock infection (Figure 3).
3.5. Drugs That Interact with the Coronavirus Pathogenesis Pathway
3.6. Prediction Modeling of the Activation States of Coronavirus Pathogenesis Pathway (Python Modeling)
In our previous study, we established AI models related to epithelial–mesenchymal transition (EMT) using the DataRobot platform [19]. We generated a model using Python coding in this study (GitHub link). The Python code for convolutional neural network modeling was used to create the prediction model of the activation states of the coronavirus pathogenesis pathway. The data used to formulate the prediction model included 100 images (50 activated and 50 inactivated images) of the coronavirus pathogenesis pathway (binary classification) (Figure 4a). Among the 100 images, 70, 20, and 10 were used as training, validation, and test datasets. The Grad-CAM technique was used to interpret the AI’s decision, distinguishing the activation of the images by coloring the locus of the AI’s attention. Subsequently, the model VGG16 for transfer learning was programmed in Python (GitHub link). The transfer learning model in Python was found to have an accuracy of 65.0% (Figure 4b). The code is available through GitHub: https://github.com/Shihori/AI/blob/main/molNW_sec6_cnn_230529_12_11_23_ipynb_CPP_12_22_23_corona2.ipynb
4. Discussion
In the coronavirus pathogenesis pathway, the TGFβ1-SMAD3 pathway leading to lung fibrosis was activated during coronavirus infection. The NFκB, FOS, and JUN pathways were activated, leading to hypercytokinemia and T-cell dysfunction. The gene expression of IL6 and CXCL8 was elevated during coronavirus infection. Interferon (IFN) type I signaling, leading to adaptive immunity, is also involved in the coronavirus pathogenesis pathway.
A model to predict the activation states of the coronavirus pathogenesis pathway was generated using Python. The activation state of samples analyzed with IPA differs under several different conditions. We previously created the model using a commercially available, fully automated machine learning AI platform. Although Python coding successfully predicted some of the data images, its accuracy is far from that of the commercially available, fully automated machine learning platform. Additional refinement of the model is necessary in order to achieve higher accuracy. One of the factors responsible for the low accuracy of the current model may be the fact that the binary classification approach was used to train the model. A regression model involving the use of continuous values of activation z-score may improve the accuracy of the prediction model. The results of the Grad-CAM model may even aid in the identification of the specified locus of attention if the accuracy of the model is improved.
Previous studies have suggested that the molecular network of gastric cancer and the RNA virus infection network interact [17,26]. Upstream regulators identified in the comparison of the diffuse-type gastric cancer and SARS-CoV-2 data included TP53, let-7, SMARCB1, MEF2D, decitabine, and SPARC, among which let-7 was activated in both diffuse-type gastric cancer and SARS-CoV-2, whereas TP53, SMARCB1, MEF2D, decitabine, and SPARC were activated in diffuse-type gastric cancer and inactivated in SARS-CoV-2. Decitabine is a nucleoside metabolic inhibitor approved in the United States and indicated for the treatment of adult patients with myelodysplastic syndromes that targets DNA methyltransferase (DNMT) [28,29]. The difference between the activation states of diffuse-type gastric cancer and SARS-CoV-2 may provide clues for the treatment of coronaviral diseases. The activation state of let-7 was activated both in diffuse-type gastric cancer and SARS-CoV-2. The authors of a previous study found that a small molecule, C1632, inhibits SARS-CoV-2 replication by blocking the interaction between LIN28 and pri/pre-let-7 to promote the maturation of let-7 [30]. It has been established that let-7 directly inhibits IL-6 expression [31]. IL-6 levels are significantly elevated in COVID-19 patients [32]. These insights identified in the network analyses of SARS-CoV-2 and diffuse-type gastric cancer samples may aid in treatment identification.
5. Conclusions
In conclusion, we developed a model for predicting the activation state of the coronavirus pathogenesis pathway using a Python approach [33]. The accuracy of the model with transfer learning was 65.0%. The limitation of our study is that the accuracy of the prediction model needs to be improved. The newly developed model for predicting the activation state of the coronavirus pathogenesis pathway may aid in predicting the responsiveness of drugs to treat the disease. In the future, it will be necessary to study the relationship between the molecular network activation state and the pathological mechanism to find therapeutic approaches for the treatment of various diseases.
Author Contributions
Conceptualization, S.T.; methodology, S.T.; software, S.T.; validation, S.T., and A.Y.; formal analysis, S.T.; investigation, S.T.; resources, S.T.; data curation, S.T.; writing—original draft preparation, S.T.; writing—review and editing, S.T., S.Q., R.O., H.Y.T., A.Y., M.K., E.J.P., and H.C.; visualization, S.T.; supervision, S.T.; project administration, S.T.; funding acquisition, S.T., and R.O. All authors have read and agreed to the published version of the manuscript.
Funding
This research was funded by the Japan Agency for Medical Research and Development (AMED), grant numbers JP21mk0101216 (ST), JP22mk0101216 (ST), and JP23mk0101216 (ST), and the Japan Society for the Promotion of Science (JSPS) KAKENHI, grant number 21K12133 (ST, RO).
Institutional Review Board Statement
Not applicable.
Informed Consent Statement
Not applicable.
Data Availability Statement
Data analyzed in this study are publicly accessible in the GEO database (https://www.ncbi.nlm.nih.gov/geo/) with accession numbers GSE154613, GSE156754, GSE147507, and GSE17400. The Python code for creating the model in the study is available through the following link: https://github.com/Shihori/AI/blob/main/molNW_sec6_cnn_230529_12_11_23_ipynb_CPP_12_22_23.ipynb.
Acknowledgments
The authors would like to sincerely thank Dr. Hiroki Sasaki, Dr. Kazuhiko Aoyagi, and Dr. Hiroshi Yokozaki for supporting the research. The authors would like to acknowledge members of the National Institute of Health Sciences (NIHS).
Conflicts of Interest
The authors declare no conflicts of interest.
Abbreviations
The following abbreviations are used in this manuscript:
| SARS IPA SARS-CoV-2 iPSC LUAD ARDS MAPK IFN TGF TGFβ1 JNK ERK1/2 IL1B AGTR1 ACE2 COVID-19 AI EMT GEO GSE UR CN DE Grad-CAM MOI DNMT |
Severe acute respiratory syndrome Ingenuity Pathway Analysis SARS coronavirus 2 Induced pluripotent stem cell Lung adenocarcinoma Acute respiratory distress syndrome Mitogen-activated pathway kinase Interferon Transforming growth factor TGF beta 1 c-jun N-terminal kinase Extracellular signal-regulated kinase 1/2 Interleukin 1B Angiotensin II receptor type I Angiotensin-converting enzyme 2 Coronavirus disease 2019 Artificial intelligence Epithelial–mesenchymal transition Gene Expression Omnibus GEO Series Upstream regulator Master regulators in causal network Diseases and functions in downstream effect Gradient-weighted Class Activation Mapping Multiplicity of infection DNA methyltransferase |
References
- Quan, C.; Li, C.; Ma, H.; Li, Y.; Zhang, H. Immunopathogenesis of Coronavirus-Induced Acute Respiratory Distress Syndrome (ARDS): Potential Infection-Associated Hemophagocytic Lymphohistiocytosis. Clin Microbiol Rev 2020, 34. [Google Scholar] [CrossRef]
- Kosyreva, A.; Dzhalilova, D.; Lokhonina, A.; Vishnyakova, P.; Fatkhudinov, T. The Role of Macrophages in the Pathogenesis of SARS-CoV-2-Associated Acute Respiratory Distress Syndrome. Front Immunol 2021, 12, 682871. [Google Scholar] [CrossRef]
- Fung, T.S.; Liu, D.X. Human Coronavirus: Host-Pathogen Interaction. Annu Rev Microbiol 2019, 73, 529–557. [Google Scholar] [CrossRef]
- Bakadia, B.M.; He, F.; Souho, T.; Lamboni, L.; Ullah, M.W.; Boni, B.O.; Ahmed, A.A.Q.; Mukole, B.M.; Yang, G. Prevention and treatment of COVID-19: Focus on interferons, chloroquine/hydroxychloroquine, azithromycin, and vaccine. Biomed Pharmacother 2021, 133, 111008. [Google Scholar] [CrossRef]
- Hejenkowska, E.D.; Mitash, N.; Donovan, J.E.; Chandra, A.; Bertrand, C.; De Santi, C.; Greene, C.M.; Mu, F.; Swiatecka-Urban, A. TGF-β1 Inhibition of ACE2 Mediated by miRNA Uncovers Novel Mechanism of SARS-CoV-2 Pathogenesis. J Innate Immun 2023, 15, 629–646. [Google Scholar] [CrossRef]
- Kyriakopoulos, A.M.; Nigh, G.; McCullough, P.A.; Seneff, S. Mitogen Activated Protein Kinase (MAPK) Activation, p53, and Autophagy Inhibition Characterize the Severe Acute Respiratory Syndrome Coronavirus 2 (SARS-CoV-2) Spike Protein Induced Neurotoxicity. Cureus 2022, 14, e32361. [Google Scholar] [CrossRef]
- Lokau, J.; Garbers, Y.; Vicente, M.M.; Dittrich, A.; Meltendorf, S.; Lingel, H.; Münster-Kühnel, A.K.; Brunner-Weinzierl, M.; Garbers, C. Long-term increase in soluble interleukin-6 receptor levels in convalescents after mild COVID-19 infection. Front Immunol 2024, 15, 1488745. [Google Scholar] [CrossRef]
- Monteonofrio, L.; Florio, M.C.; AlGhatrif, M.; Lakatta, E.G.; Capogrossi, M.C. Aging- and gender-related modulation of RAAS: potential implications in COVID-19 disease. Vasc Biol 2021, 3, R1–r14. [Google Scholar] [CrossRef]
- Perez-Bermejo, J.A.; Kang, S.; Rockwood, S.J.; Simoneau, C.R.; Joy, D.A.; Silva, A.C.; Ramadoss, G.N.; Flanigan, W.R.; Fozouni, P.; Li, H.; et al. SARS-CoV-2 infection of human iPSC-derived cardiac cells reflects cytopathic features in hearts of patients with COVID-19. Sci Transl Med 2021, 13. [Google Scholar] [CrossRef]
- Zhou, F.; Yu, T.; Du, R.; Fan, G.; Liu, Y.; Liu, Z.; Xiang, J.; Wang, Y.; Song, B.; Gu, X.; et al. Clinical course and risk factors for mortality of adult inpatients with COVID-19 in Wuhan, China: a retrospective cohort study. Lancet 2020, 395, 1054–1062. [Google Scholar] [CrossRef]
- Caforio, A.L.P. Receipt of mRNA Vaccine against Covid-19 and Myocarditis. N Engl J Med 2021, 385, 2189–2190. [Google Scholar] [CrossRef] [PubMed]
- Tanabe, S. Relationship between COVID-19 vaccine and myocarditis. Adv Clin Med Res 2022, 3, 30. [Google Scholar] [CrossRef]
- Schreckenberg, R.; Woitasky, N.; Itani, N.; Czech, L.; Ferdinandy, P.; Schulz, R. Cardiac side effects of RNA-based SARS-CoV-2 vaccines: Hidden cardiotoxic effects of mRNA-1273 and BNT162b2 on ventricular myocyte function and structure. Br J Pharmacol 2024, 181, 345–361. [Google Scholar] [CrossRef] [PubMed]
- WHO. A clinical case definition of post COVID-19 condition by a Delphi consensus. Available online: https://www.who.int/publications/i/item/WHO-2019-nCoV-Post_COVID-19_condition-Clinical_case_definition-2021.1 (accessed on April 21).
- Schneider, A.; Hapfelmeier, A.; Greißel, A.; Limbach, M.; Schwarzl, G.; Ebert, F.; Huber, V.; Hayden, M.C. The implications of somatic symptom disorder on the impairment of daily life are greater in post-COVID syndrome than in asthma or COPD - results of a cross-sectional study in a rehabilitation clinic. Sci Rep 2025, 15, 11719. [Google Scholar] [CrossRef]
- Gangi, S.; Bergantini, L.; Paggi, I.; Spalletti, M.; Cameli, P.; Bargagli, E.; d’Alessandro, M. Regulatory T Cell Phenotype Related to Cytokine Expression Patterns in Post-COVID-19 Pulmonary Fibrosis and Idiopathic Pulmonary Fibrosis. Immun Inflamm Dis 2025, 13, e70123. [Google Scholar] [CrossRef]
- Tanabe, S.; Quader, S.; Ono, R.; Cabral, H.; Aoyagi, K.; Hirose, A.; Yokozaki, H.; Sasaki, H. Molecular network analysis of RNA viral infection pathway in diffuse- and intestinal-type gastric cancer. Fundamental Toxicological Sciences 2022, 9, 37–46. [Google Scholar] [CrossRef]
- Tanabe, S.; Quader, S.; Ono, R.; Cabral, H.; Aoyagi, K.; Hirose, A.; Yokozaki, H.; Sasaki, H. Cell Cycle Regulation and DNA Damage Response Networks in Diffuse- and Intestinal-Type Gastric Cancer. Cancers 2021, 13. [Google Scholar] [CrossRef]
- Tanabe, S.; Quader, S.; Ono, R.; Cabral, H.; Aoyagi, K.; Hirose, A.; Perkins, E.J.; Yokozaki, H.; Sasaki, H. Regulation of Epithelial–Mesenchymal Transition Pathway and Artificial Intelligence-Based Modeling for Pathway Activity Prediction. Onco 2023, 3, 13–25. [Google Scholar] [CrossRef]
- Krämer, A.; Green, J.; Pollard, J., Jr.; Tugendreich, S. Causal analysis approaches in Ingenuity Pathway Analysis. Bioinformatics 2014, 30, 523–530. [Google Scholar] [CrossRef]
- Hoagland, D.A.; Clarke, D.J.B.; Møller, R.; Han, Y.; Yang, L.; Wojciechowicz, M.L.; Lachmann, A.; Oguntuyo, K.Y.; Stevens, C.; Lee, B.; et al. Modulating the transcriptional landscape of SARS-CoV-2 as an effective method for developing antiviral compounds. bioRxiv, 2007. [Google Scholar] [CrossRef]
- Yoshikawa, T.; Hill, T.E.; Yoshikawa, N.; Popov, V.L.; Galindo, C.L.; Garner, H.R.; Peters, C.J.; Tseng, C.-T. Dynamic Innate Immune Responses of Human Bronchial Epithelial Cells to Severe Acute Respiratory Syndrome-Associated Coronavirus Infection. PLOS ONE 2010, 5, e8729. [Google Scholar] [CrossRef]
- Blanco-Melo, D.; Nilsson-Payant, B.E.; Liu, W.-C.; Uhl, S.; Hoagland, D.; Møller, R.; Jordan, T.X.; Oishi, K.; Panis, M.; Sachs, D.; et al. Imbalanced Host Response to SARS-CoV-2 Drives Development of COVID-19. Cell 2020, 181, 1036–1045.e1039. [Google Scholar] [CrossRef] [PubMed]
- Daamen, A.R.; Bachali, P.; Owen, K.A.; Kingsmore, K.M.; Hubbard, E.L.; Labonte, A.C.; Robl, R.; Shrotri, S.; Grammer, A.C.; Lipsky, P.E. Comprehensive transcriptomic analysis of COVID-19 blood, lung, and airway. Sci Rep 2021, 11, 7052. [Google Scholar] [CrossRef]
- Pérez-Bermejo, J.A.; Kang, S.; Rockwood, S.J.; Simoneau, C.R.; Joy, D.A.; Ramadoss, G.N.; Silva, A.C.; Flanigan, W.R.; Li, H.; Nakamura, K.; et al. SARS-CoV-2 infection of human iPSC-derived cardiac cells predicts novel cytopathic features in hearts of COVID-19 patients. bioRxiv 2020. [Google Scholar] [CrossRef]
- Tanabe, S.; Quader, S.; Cabral, H.; Perkins, E.J.; Yokozaki, H.; Sasaki, H. Master Regulators of Causal Networks in Intestinal- and Diffuse-Type Gastric Cancer and the Relation to the RNA Virus Infection Pathway. International Journal of Molecular Sciences 2024, 25. [Google Scholar] [CrossRef] [PubMed]
- Shimizu, H. Machine Learning in Python: Machine Learning of Life Science Data (Jikken Igaku Bessatsu Python De Jissen Seimeikagaku data no Kikaigakushu); Shimizu, H., Ed.; Yodosha: 2023.
- Dhillon, S. Decitabine/Cedazuridine: First Approval. Drugs 2020, 80, 1373–1378. [Google Scholar] [CrossRef]
- Yabushita, T.; Chinen, T.; Nishiyama, A.; Asada, S.; Shimura, R.; Isobe, T.; Yamamoto, K.; Sato, N.; Enomoto, Y.; Tanaka, Y.; et al. Mitotic perturbation is a key mechanism of action of decitabine in myeloid tumor treatment. Cell Reports 2023, 42, 113098. [Google Scholar] [CrossRef]
- Xie, C.; Chen, Y.; Luo, D.; Zhuang, Z.; Jin, H.; Zhou, H.; Li, X.; Lin, H.; Zheng, X.; Zhang, J.; et al. Therapeutic potential of C1632 by inhibition of SARS-CoV-2 replication and viral-induced inflammation through upregulating let-7. Signal Transduct Target Ther 2021, 6, 84. [Google Scholar] [CrossRef]
- Iliopoulos, D.; Hirsch, H.A.; Struhl, K. An epigenetic switch involving NF-kappaB, Lin28, Let-7 MicroRNA, and IL6 links inflammation to cell transformation. Cell 2009, 139, 693–706. [Google Scholar] [CrossRef]
- Coomes, E.A.; Haghbayan, H. Interleukin-6 in Covid-19: A systematic review and meta-analysis. Rev Med Virol 2020, 30, 1–9. [Google Scholar] [CrossRef]
- Tanabe, S.; Quader, S.; Ono, R.; Cabral, H.; Perkins, E.J. Artificial Intelligence-based modeling of coronavirus pathway activation. Proceedings of the 39th Annual Conference of the Japanese Society for Artificial Intel-ligence, 2025, Hybrid (Online/Osaka), Japan, May 28th, 2025.
Figure 1.
SARS coronavirus 2 data analysis. The identified canonical pathways of SARS-CoV-2-infected A549 cells (LUAD) (ACE2 transfection) (GSE147507) (eight analyses) in comparison analysis are shown. The coronavirus pathogenesis pathway is located at the bottom of the heatmap. Orange or blue coloring indicates activation or inactivation in the analysis. The analysis names are indicated in Table 1.
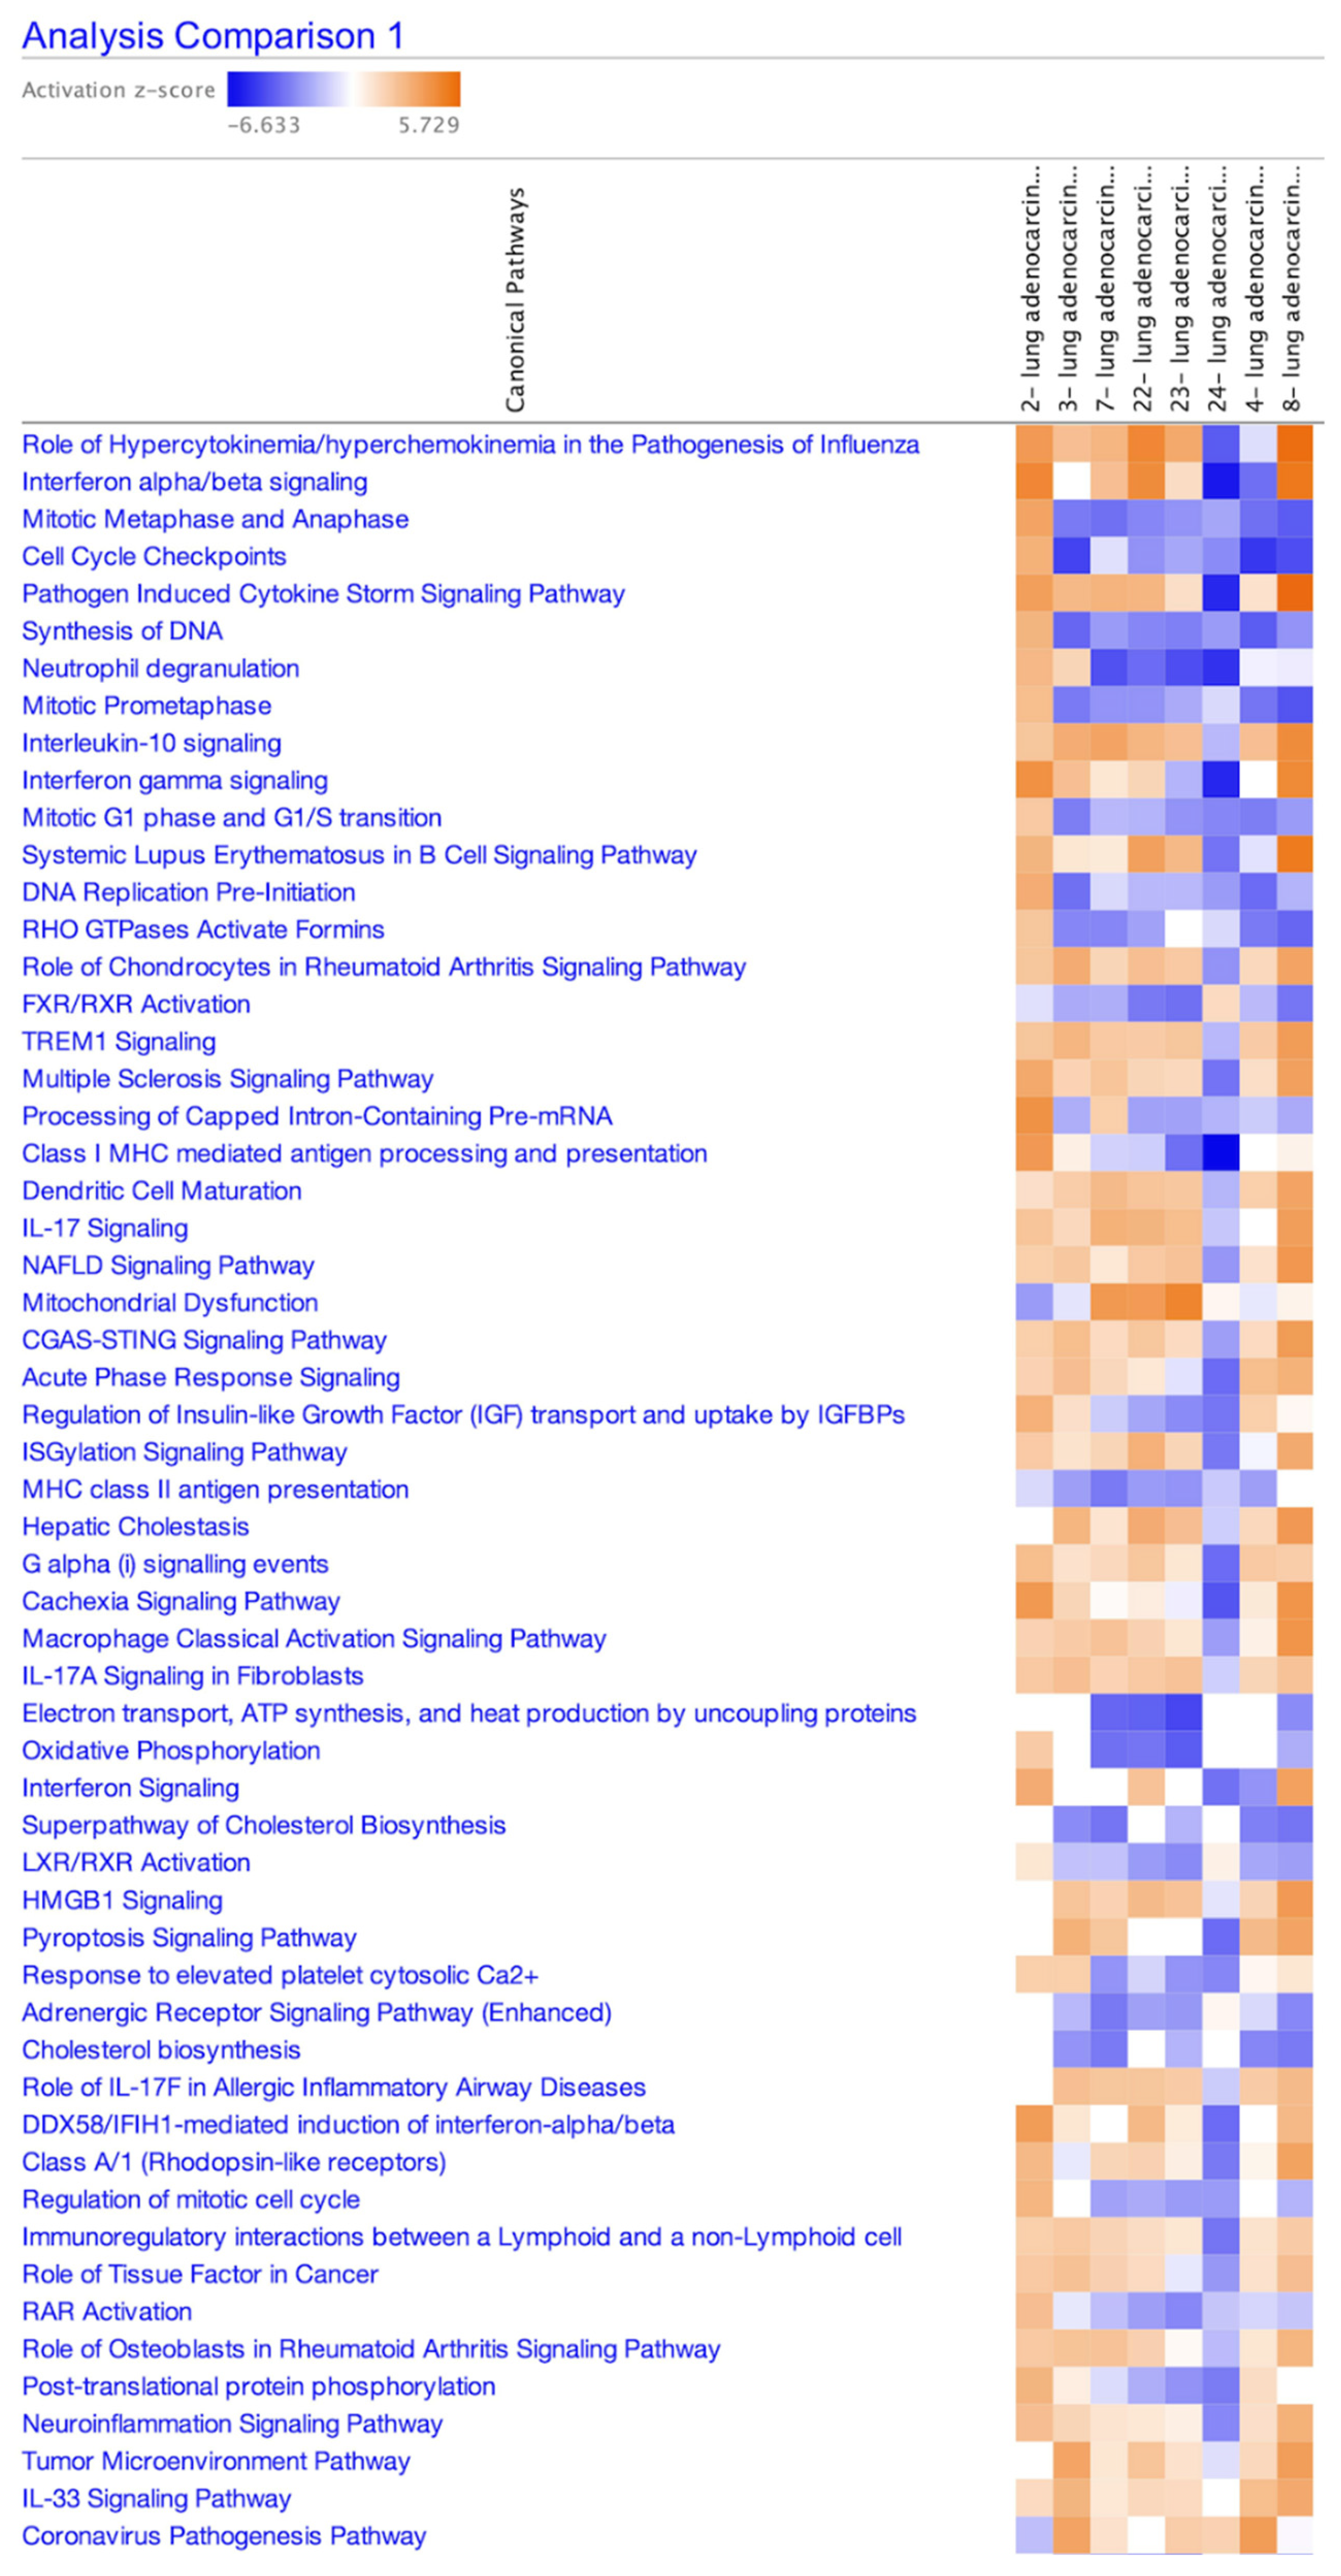
Figure 2.
Coronavirus pathogenesis pathway: (a) The coronavirus pathogenesis pathway was overlaid with LUAD (bronchial epithelium) infected with SARS-CoV (As of April 2024) (SARS-CoV data, GSE17400). (b) The prediction legend of the pathway is shown. Red or green coloring indicates upregulated or downregulated gene expression, respectively. Orange or blue coloring indicates predicted activation or inhibition, respectively. The intensity of the colors indicates the degree of up- or down-regulation. An orange or blue line indicates activation or inactivation, respectively. (c) The legend for the node shapes in the pathway is shown. (d) The legend for the relationship lines is also shown.
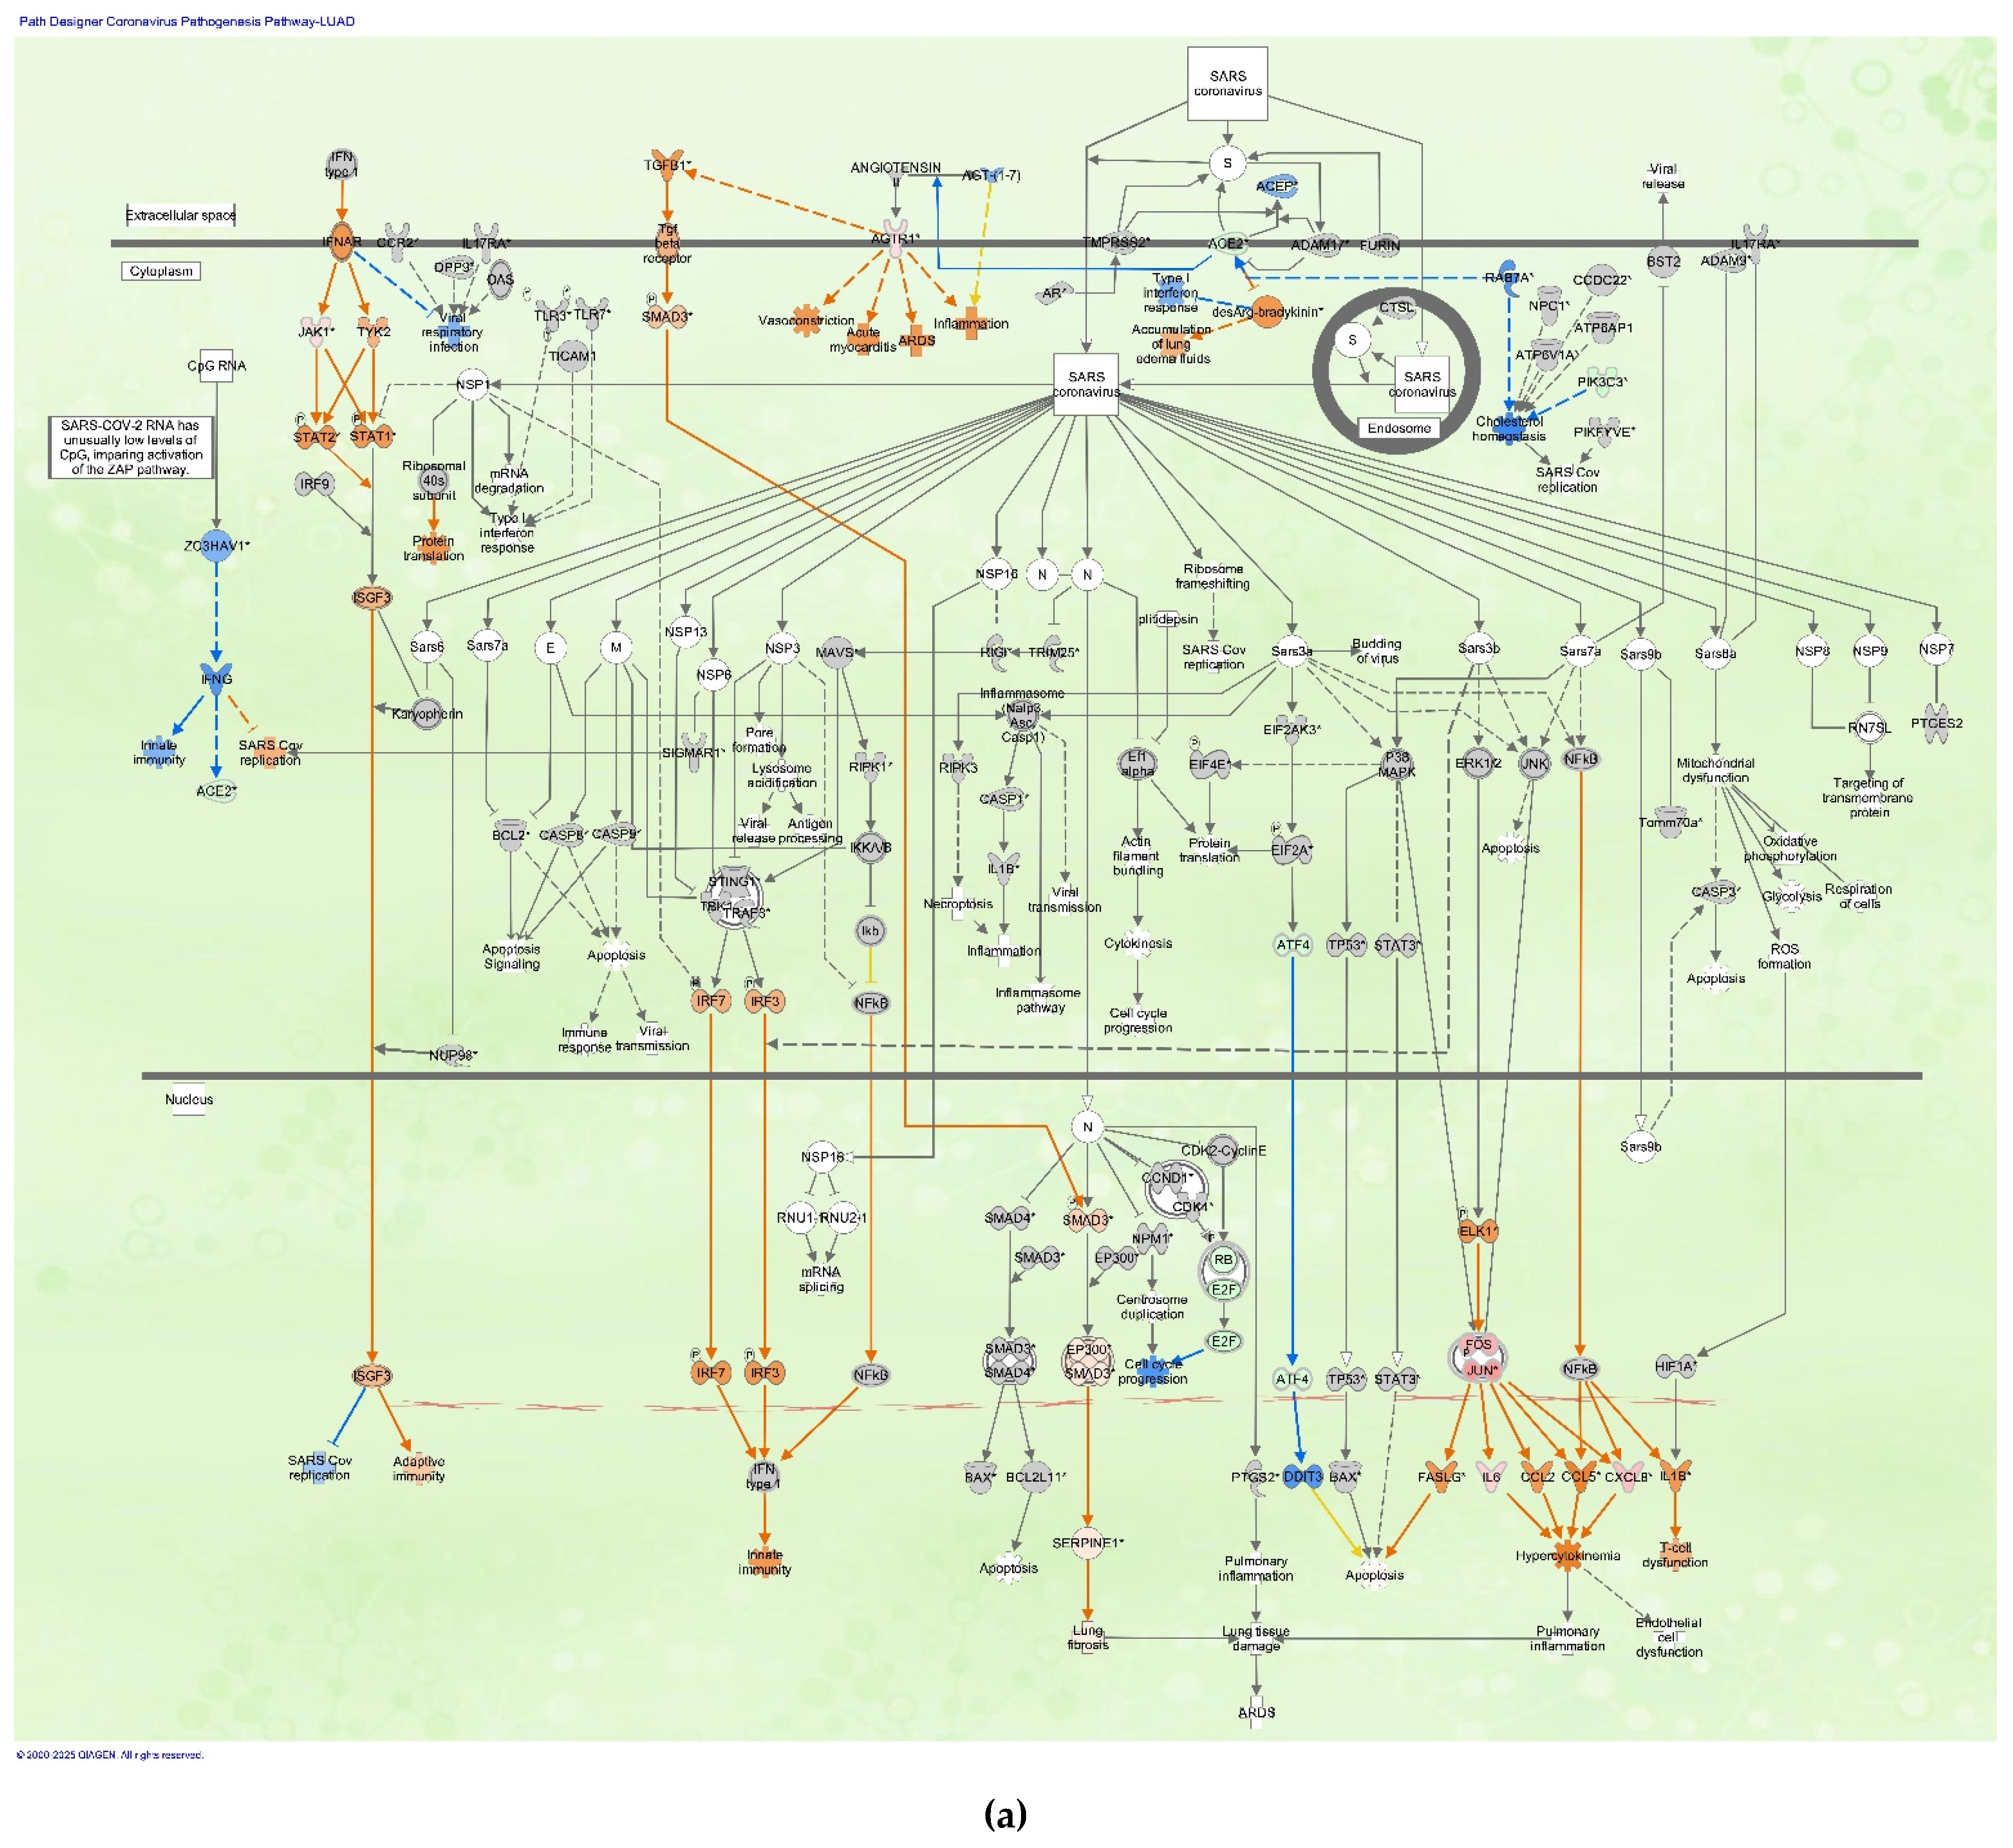
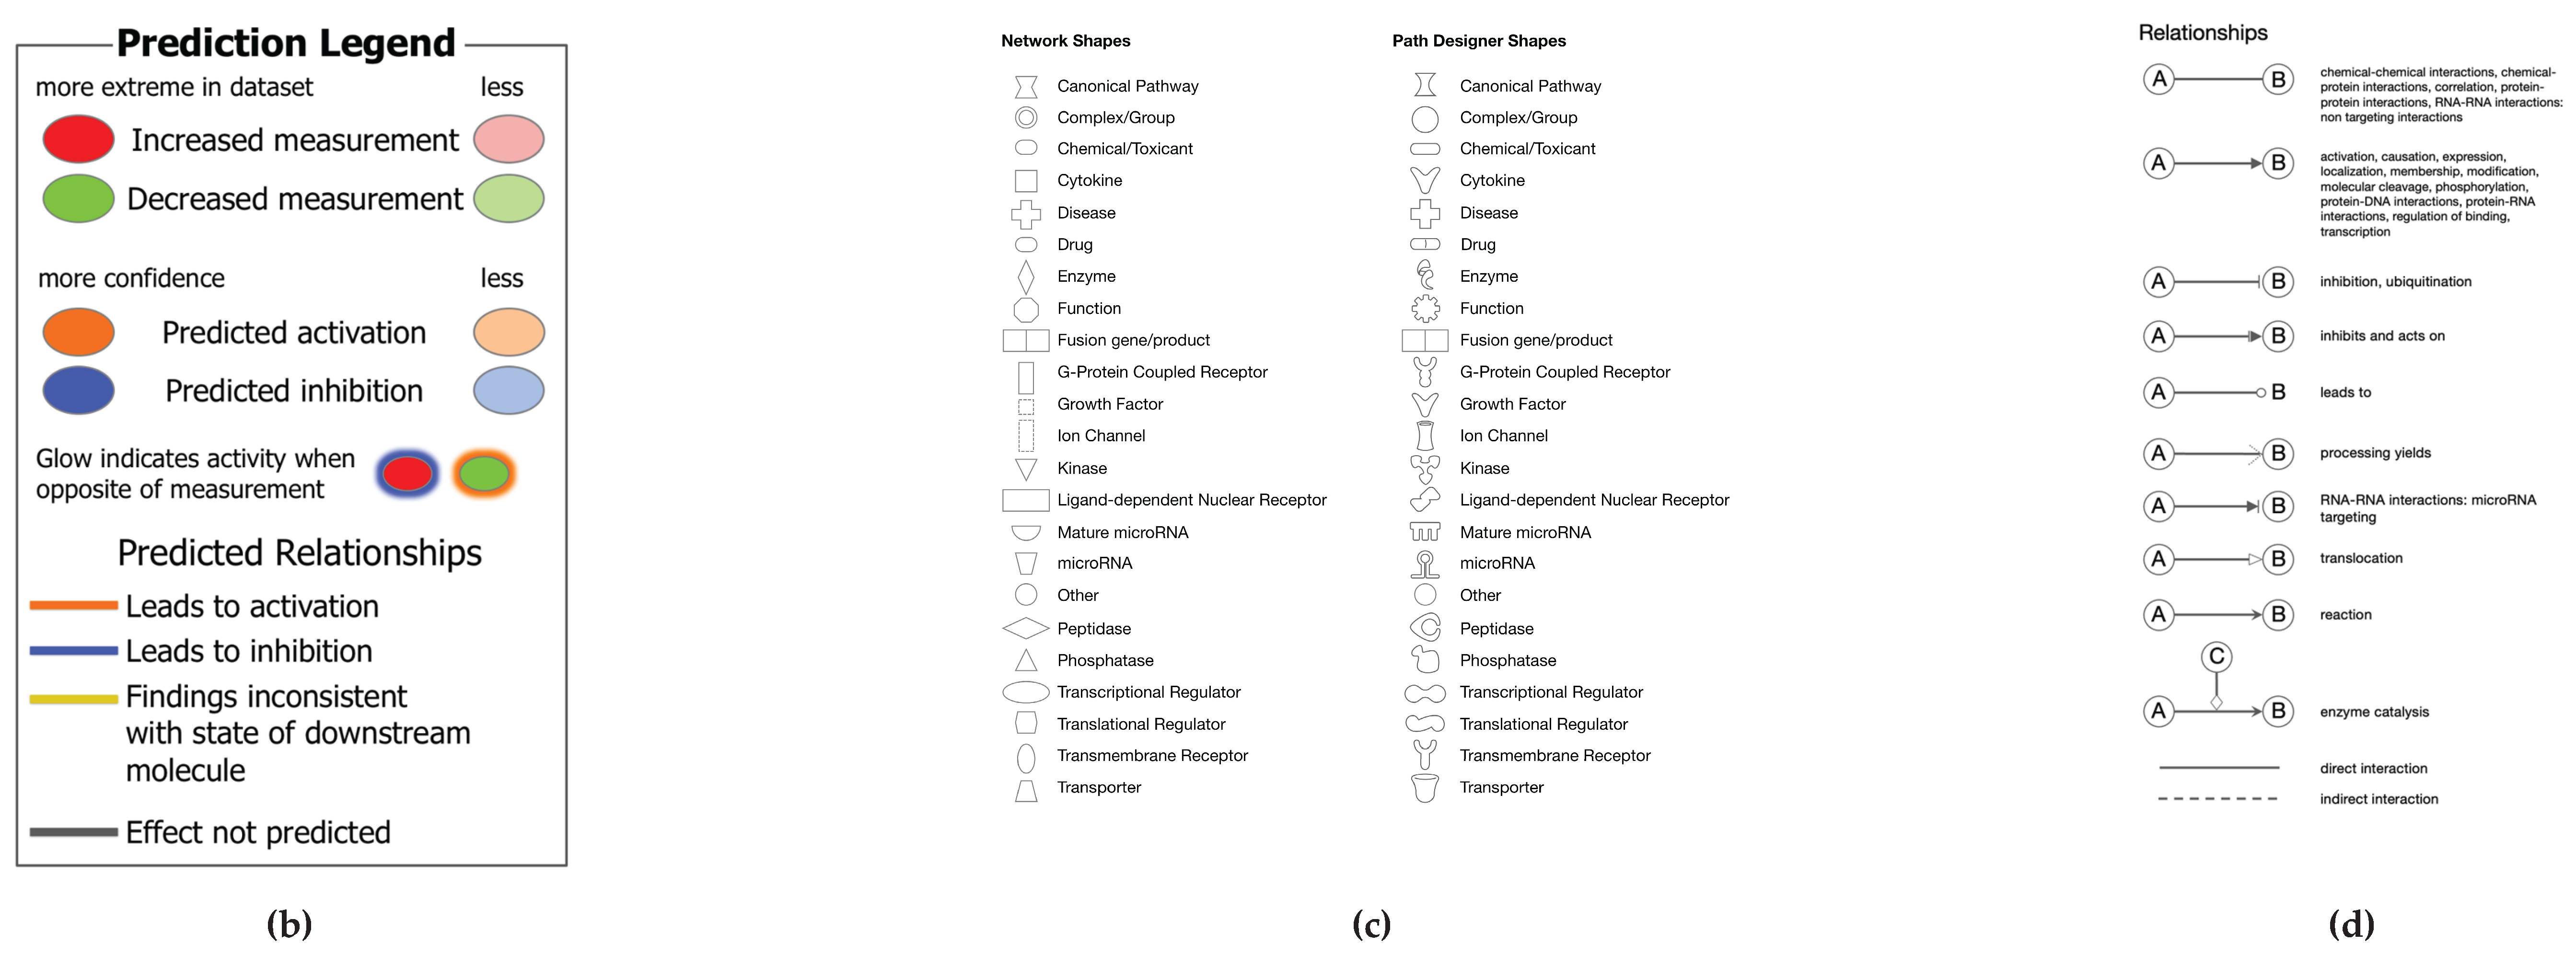
Figure 3.
Coronavirus pathogenesis pathway overlaid with gene expression data of iPSCs. The coronavirus pathogenesis pathway was overlaid with iPSCs infected with SARS-CoV-2. Expression log ratio of iPSCs infected with SARS-CoV-2 (0.006 MOI) to mock infection was colored in red (up-regulated) or green (down-regulated) (as of April 2024). Gene expression data (GSE156754) of iPSCs with mock infection and iPSCs infected with SARS-CoV-2 were compared in the IPA database.
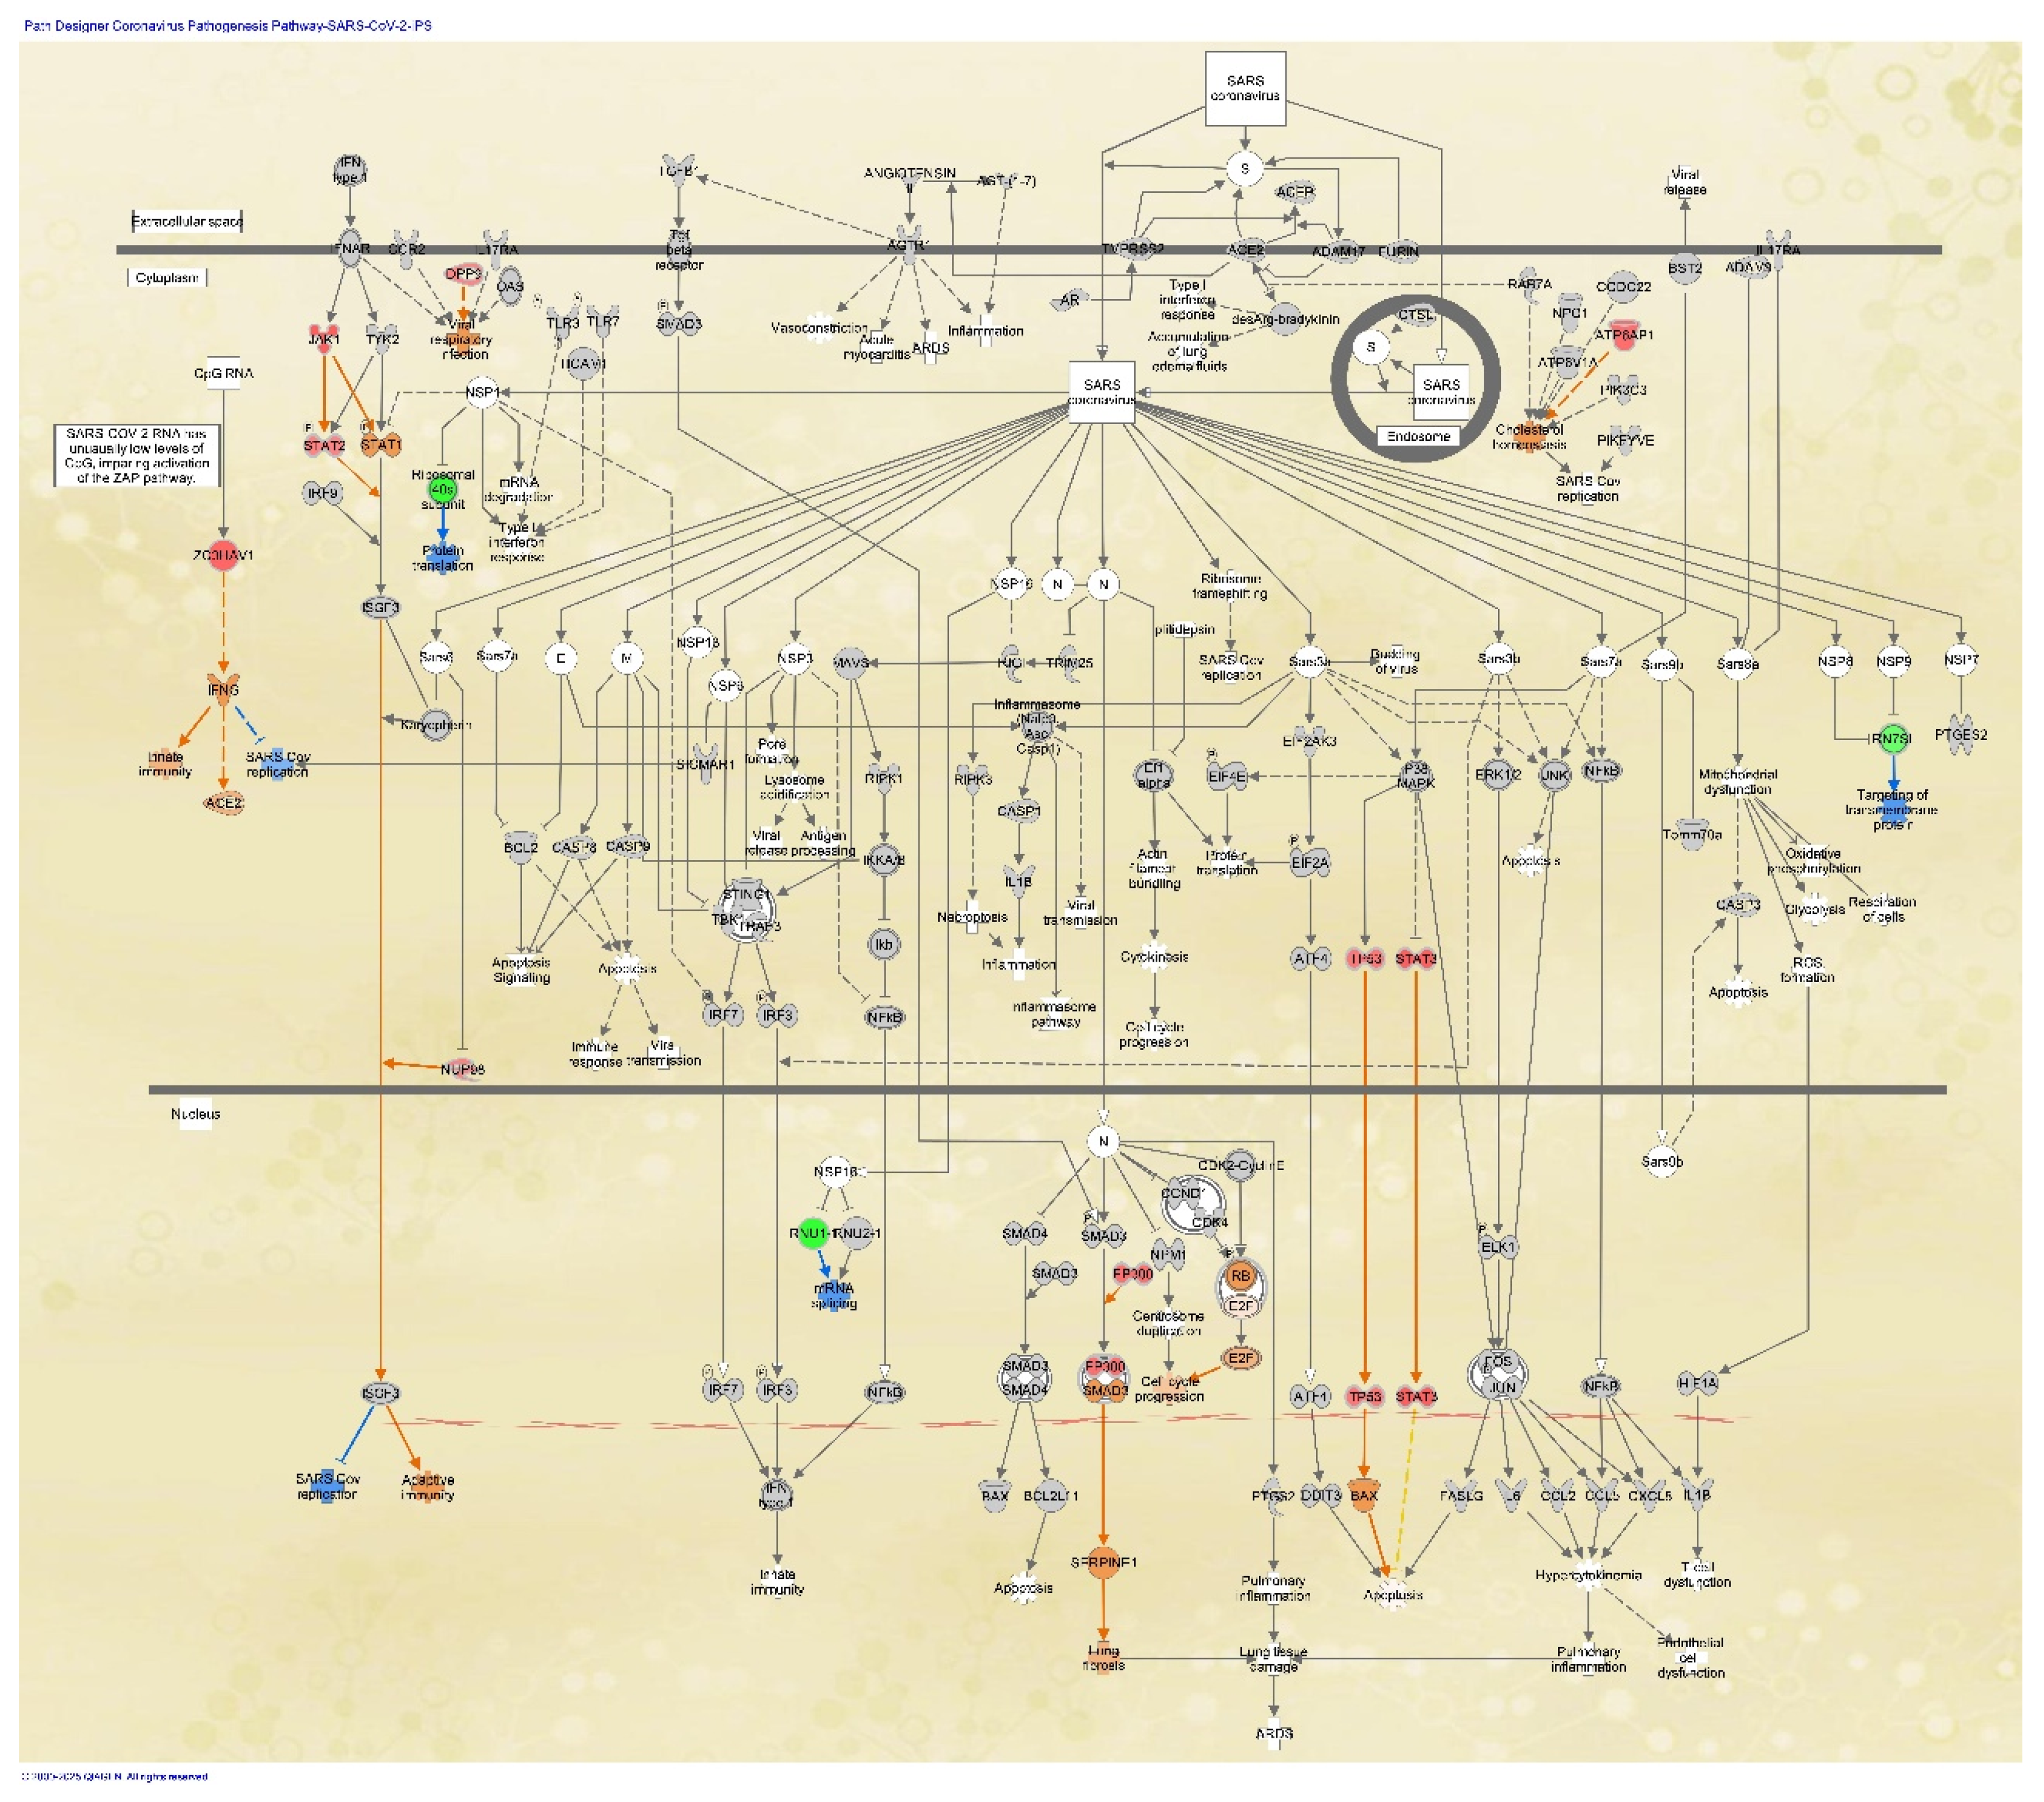
Figure 4.
Python modeling of the activation states of the coronavirus pathogenesis pathway. (a) Activity plot of 17,352 analyses for the coronavirus pathogenesis pathway is shown (as of 2021). The x-axis indicates the z-scores of the analyses. The higher score is more activated, while the lower score is less activated. Analyses with an absolute z-score of more than 4 are indicated in green. The 50 activated and 50 inactivated coronavirus pathogenesis pathway images were used to train the model. (b) The results of the prediction model for the activation states of the coronavirus pathogenesis pathway are shown. The model with transfer learning with Python was found to have an accuracy of 65.0%. In the graphs, “train,” “acc,” and “val” indicate “training,” “accuracy,” and “validation,” respectively. The corresponding code is available through GitHub: https://github.com/Shihori/AI/blob/main/molNW_sec6_cnn_230529_12_11_23_ipynb_CPP_12_22_23_corona2.ipynb.

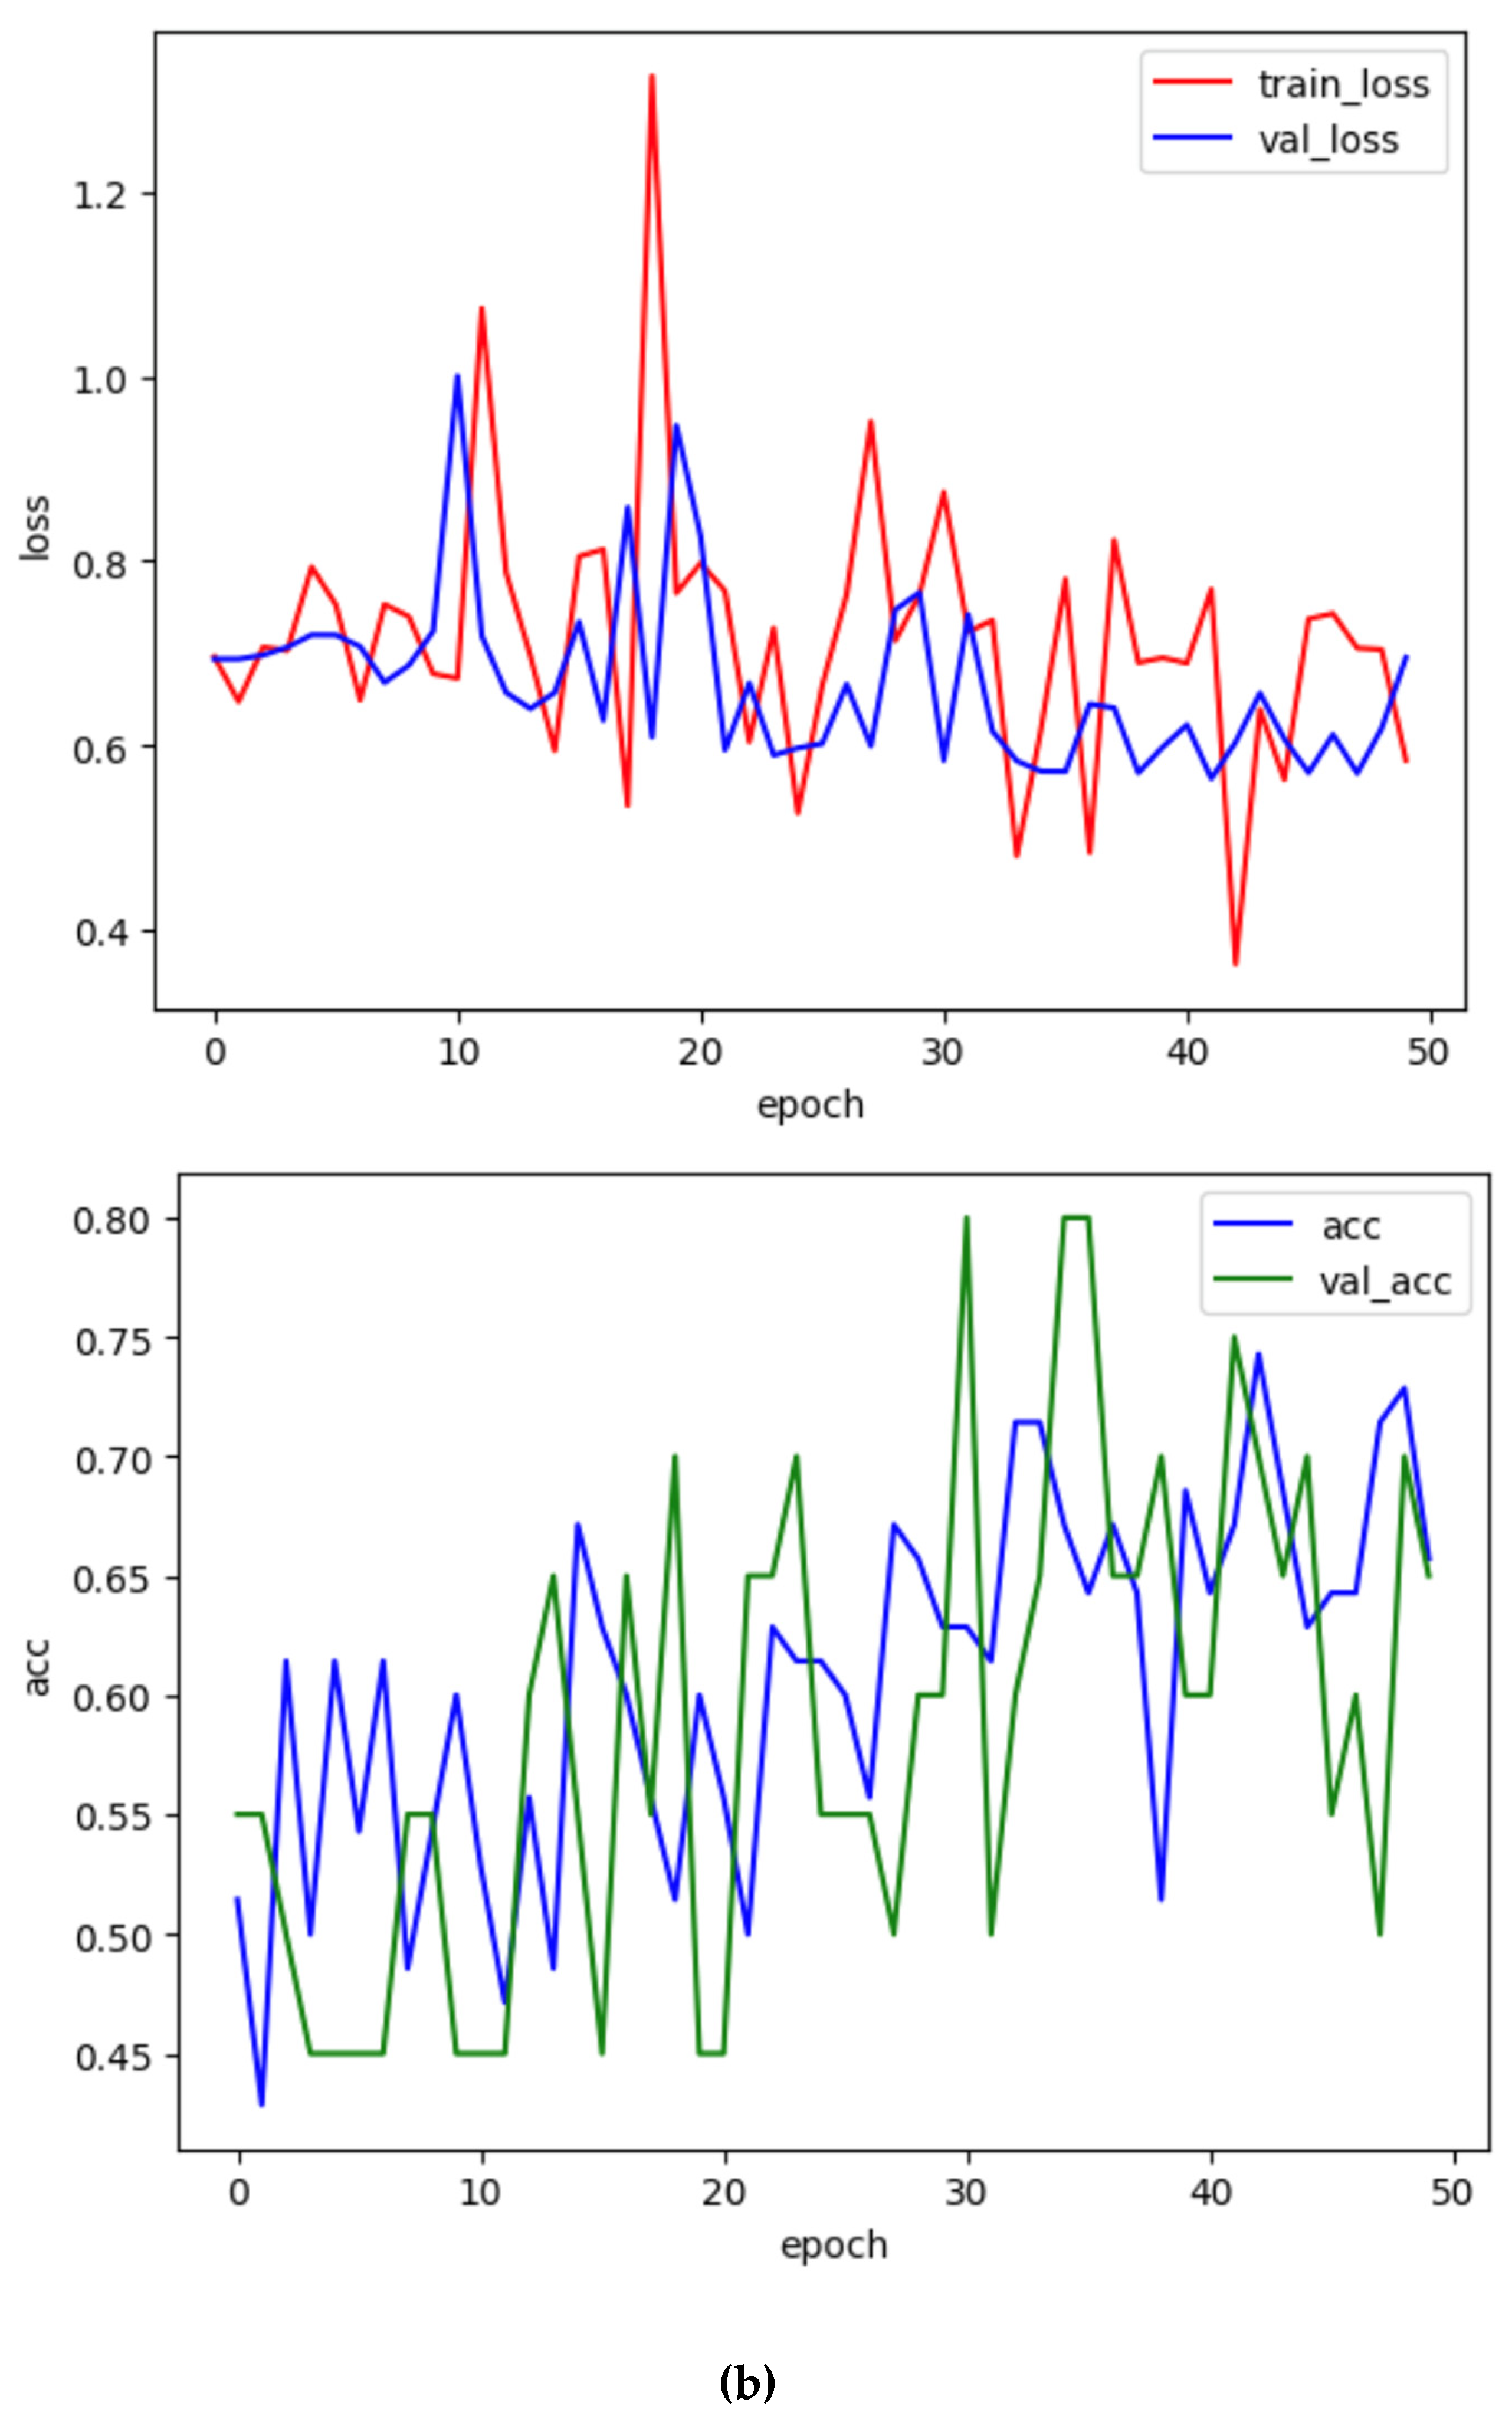

Table 1.
Activation states of the coronavirus pathogenesis pathway of SARS-CoV-2-infected A549 cells.
Table 1.
Activation states of the coronavirus pathogenesis pathway of SARS-CoV-2-infected A549 cells.
| Analysis name | Activation z-score of coronavirus pathogenesis pathway * | Comparison contrast |
|---|---|---|
| 2-lung adenocarcinoma (LUAD) alveoli 7103 | -1.706 | SARS-CoV-2-infected A549 cell line (MOI 0.2) vs. mock-infected A549 cell line |
| 3-lung adenocarcinoma (LUAD) alveoli 7109 | 3.464 | SARS-CoV-2-infected A549 cell line (MOI 2) vs. mock-infected A549 cell line |
| 7-lung adenocarcinoma (LUAD) alveoli 7113 | 1.147 | SARS-CoV-2-infected ACE2-transfected A549 cell line (MOI 0.2) vs. mock-infected ACE2-transfected A549 cell line |
| 22-lung adenocarcinoma (LUAD) alveoli DMSO 7106 | 0 | SARS-CoV-2-infected ACE2-transfected A549 cell line vs. mock-infected ACE2-transfected A549 cell line |
| 23-lung adenocarcinoma (LUAD) alveoli ruxolitinib 7107 | 1.941 | SARS-CoV-2-infected ACE2-transfected A549 cell line and ruxolitinib vs. mock-infected ACE2-transfected A549 cell line |
| 24-lung adenocarcinoma (LUAD) alveoli ruxolitinib 7108 | 1.732 | SARS-CoV-2-infected ACE2-transfected A549 cell line and ruxolitinib vs. SARS-CoV-2-infected ACE2-transfected A549 cell line |
| 4-lung adenocarcinoma (LUAD) alveoli 7110 | 3.742 | SARS-CoV-2-infected A549 cell line (MOI 2) vs. SARS-CoV-2 infected A549 cell line (MOI 0.2) |
| 8-lung adenocarcinoma (LUAD) bronchial epithelium 7114 | -0.2 | SARS-CoV-2-infected CALU3 cell line vs. mock-infected CALU-3 cell line |
* The activation z-score indicates the activation state of the pathway. A positive or negative score indicates activation or inactivation, respectively. Further details are provided in the Materials and Methods section.
Table 2.
SARS-CoV-2 analysis matched to diffuse-type gastric cancer and the activation z-score.
| Entity Type | Entity Name | Diffuse-type Gastric Cancer | iPSC-derived cardiomyocyte infected with SARS-CoV-2 0.001 MOI vs. mock | iPSC-derived cardiomyocyte infected with SARS-CoV-2 0.01 MOI vs. mock | iPSC-derived cardiomyocyte infected with SARS-CoV-2 0.1 MOI vs. mock | iPSC-derived cardiac fibroblast infected with SARS-CoV-2 0.006 MOI vs. mock | iPSC infected with SARS-CoV-2 0.006 MOI vs. mock |
|---|---|---|---|---|---|---|---|
| DE | Organismal death | 6.09939477 | 0 | 0 | 0 | 0 | -10.332512 |
| DE | Morbidity or mortality | 6.0991701 | 0 | 0 | 0 | 0 | -10.254265 |
| UR | TP53 | 5.25209454 | -2.9576275 | -3.8544245 | 0 | -4.0046362 | 3.36923989 |
| UR | let-7a-5p (and other miRNAs w/seed GAGGUAG) | 2.95701052 | 2.98384345 | 3.24713706 | 2.75140771 | 0 | -3.6818652 |
| UR | let-7 | 5.88141247 | 3.36872653 | 3.07534027 | 2.76863583 | -0.7453134 | -2.628098 |
| UR | CDKN2A | 5.00037308 | 0.34050945 | 0.51898468 | 1.34164079 | -3.2237322 | 2.97677657 |
| UR | calcitriol | 5.35668014 | 0 | 0 | 1.23787842 | -1.587867 | 1.9593573 |
| CN | NUPR1 | 6.68503217 | 0 | 0 | 0 | -6.0621778 | 0.33752637 |
| CN | l-asparaginase | 7.00201178 | 0 | 0 | 0 | -4.2 | 0 |
| UR | l-asparaginase | 6.92462738 | 0 | 0 | 2.23606798 | -4.1949137 | 0 |
| UR | NUPR1 | 6.68503217 | 0 | 0 | 2.49615088 | -6.0621778 | -0.386494 |
| UR | SMARCB1 | 2.84931818 | -1.8898224 | -1.1338934 | -2 | -1.407767 | 2.57658201 |
| UR | MEF2D | 2.38560366 | -2.5729119 | -2.3785413 | -1.9249444 | -2.236068 | 0 |
| UR | Decitabine | 3.08835855 | -3.4575395 | -2.2066886 | -1.5180635 | 0 | -0.2058335 |
| UR | SPARC | 3.28571429 | -1.3516756 | -1.7509621 | -1.9686483 | 0 | 0 |
| DE | Growth failure or short stature | 3.70765671 | 0 | 0 | 0 | 0 | -5.311879 |
| UR | RB1 | 3.36893187 | 0 | 0 | -1.8347785 | -1.3252763 | -2.7095152 |
| CN | Osimertinib | 5.93335075 | 0 | 0 | 1 | 0 | -2.4596748 |
Table 3.
Drugs that interact with the coronavirus pathogenesis pathway.
| Drug Name | Targets | Actions |
|---|---|---|
| Telmisartan | AGTR1, AGT-(1-7) | Antagonist |
| SM1-71 | EIF2AK3, MAPK1, MAPK3, PIK3C3, TGFBR1, TGFBR2 | Inhibitor |
| Imatinib/nilotinib/pegintron (nilotinib) | ABL1 | Inhibitor |
| Imatinib/nilotinib/pegintron (pegintron) | IFNAR1, IFNAR2 | Agonist |
| Acetaminophen/pentazocine (acetaminophen) | PTGS2 | Inhibitor |
| Acetaminophen/pentazocine (pentazocine) | SIGMAR1 | Agonist |
| Arsenic trioxide/cytarabine/methotrexate (arsenic trioxide) | CCND1 | Antagonist |
| NF-kappaB inhibitor | NFκB (complex) | Inhibitor |
Disclaimer/Publisher’s Note: The statements, opinions and data contained in all publications are solely those of the individual author(s) and contributor(s) and not of MDPI and/or the editor(s). MDPI and/or the editor(s) disclaim responsibility for any injury to people or property resulting from any ideas, methods, instructions or products referred to in the content. |
© 2025 by the authors. Licensee MDPI, Basel, Switzerland. This article is an open access article distributed under the terms and conditions of the Creative Commons Attribution (CC BY) license (http://creativecommons.org/licenses/by/4.0/).
Copyright: This open access article is published under a Creative Commons CC BY 4.0 license, which permit the free download, distribution, and reuse, provided that the author and preprint are cited in any reuse.


