
Submitted:
19 May 2025
Posted:
19 May 2025
You are already at the latest version
Abstract
The European honey bee (Apis mellifera) significantly contributes to Australian agriculture, especially in honey production and pollination of key crops. However, managed bee populations are declining due to pathogens, agrochemicals, poor forage, climate change, and habitat loss. Major threats include bacteria, fungi, mites, and pests. With the increasing demand for pollination and the movement of bee colonies, monitoring these threats is essential. It has been demonstrated that honey constitutes an easily accessible source of environmental DNA. Environmental DNA in honey comes from all organisms that either directly or indirectly aid in its production and those within the hive environments. In this study, we extracted eDNA from 135 honey samples and tested for the presence of DNA for seven key honey bee pathogens and parasites - Paenibacillus larvae, Melissococcus plutonius (bacterial pathogens), Nosema apis, Nosema ceranae, Ascosphaera apis (fungal pathogen), Aethina tumida, and Galleria mellonella (arthropod parasites) by using conventional singleplex and multiplex PCR assays. N. ceranae emerged as the most prevalent pathogen, present in 57% of the samples. This was followed by A. tumida (40%), G. mellonella (37%), P. larvae (21%), N. apis (19%), and M. plutonius (18%). A. apis was detected in a smaller proportion of the samples, with a prevalence of 5%. Additionally, 19% of the samples tested negative for all pathogens analysed. The data outlines essential information about the prevalence of significant arthropod, fungal, and bacterial pathogens affecting honey bees in Australia, which is crucial for protecting the nation's beekeeping industry.
Keywords:
Apis mellifera
; eDNA
; Honey
; Paenibacillus larvae
; Melissococcus plutonius
; health
; surveillance
1. Introduction
Australia is renowned for having one of the healthiest honey bee populations globally. This is largely due to its geographic isolation and strict biosecurity measures, which have kept many pests and pathogens away from the mainland [1]. However, beekeepers still need to remain vigilant for established pest and pathogenic diseases [2]. The outbreak of varroa mite in Newcastle, in June 2022 highlighted the urgent need for further research to understand better and improve our knowledge of the pathogen’s landscape affecting Australian honey bees [3].While microbial pathogens are indeed present in Australian apiaries, research on their widespread occurrence and transmission remains limited [4]. Understanding how these pathogens and parasites influence colony productivity and health requires extensive surveillance across various sites in Australia [5]. Identifying the presence of a pathogen affecting a hive can be completed by assessing hive substances, such as wax, pollen and honey. This is due to the potential transfer of pathogens and pathogen material during the production of hive substances following the acquisition of a pathogen while foraging.
In Australia, the agricultural sector heavily relies on insect pollination, particularly from the western honey bees, Apis mellifera [6] which is essential for pollinating a diverse array of crops and enhancing agricultural productivity and food security nationwide [7]. The benefits of crop pollination extend beyond agriculture exerting far-reaching impacts on the broader Australian community by facilitating pollination and positively influencing crop outcomes through their synergistic relationship with flowering plants [8]. Previous estimations indicate that the total value of paid and unpaid pollination services amounts to approximately AUD 1.2 billion annually in Australia [9]. The reliance on honeybees for optimal pollination extends to approximately two-thirds of horticultural crops in the country [10], particularly enhancing productivity and post-harvest storage qualities in fruits like apples, raspberries, and peaches [8,11,12].
These essential pollinators face significant threats from a range of bacterial, viral, and parasitic infections, which compromise their health and productivity. Environmental stressors such as exposure to harmful chemicals, inadequate nutrition and unsustainable agricultural practices also play a role [13]. Diseases such as American foulbrood (Paenibacillus larvae) and European foulbrood(Melissococcus plutonius) weaken the bees and harm brood health [14]. Infections caused by fungi, microsporidians, and arthropods contribute to colony collapse, affected by regional genetic variations and additional stressors [15,16].
Molecular methods, owing to their high sensitivity, accuracy, and capability for early pathogen detection, have been recommended by several researchers over microbial methods for detecting pathogens in environmental samples [17,18]. Polymerase chain reaction-based assays have been developed for the detection of honey bee pathogens from bees and other hive materials [19,20]. Conventional PCR is the most widely used method for detecting bacteria (Paenibacillus larvae, Melissococcus plutonius), fungi (Nosema spp., Ascosphaera apis), and arthropods (Aethina tumida and Galleria mellonella) from honey and other hive samples [21,22,23,24]. PCR is highly regarded for its consistent, specific, and precise identification of a multitude of pathogens, making it an essential tool for routine pathogen screening in surveillance operations [25]. Traditionally, adult bees have been the primary source of pathogen detection [26,27], the evolution of environmental DNA/RNA-based detection techniques presents a superior alternative to direct sampling from hosts [28]. This advancement has prompted numerous research initiatives employing PCR-based assays to detect bee pathogens and parasites directly from honey samples, offering a less invasive yet effective surveillance approach [29,30].
Monitoring disease in adult bees is challenging due to the resource-intensive requirements and costs associated with collecting data from individual bees. This method provides only a snapshot of disease prevalence at specific times, limiting the ability to track changes over time [31]. In contrast, hive materials such as honey provide a valuable source of environmental DNA (eDNA) for the detection of invasive organisms.
Honey eDNA has thus emerged as a practical method for monitoring honey bee pathogens and parasites [32,33]. Identifying the presence of a pathogen affecting a hive can be completed by assessing hive substances, such as wax, pollen, and honey. This is due to the potential transfer of pathogens and pathogen material during the production of hive substances following the acquisition of a pathogen while foraging. The genetic material left by organisms in the environment, known as environmental DNA (eDNA), is a persistent biomolecular marker that can be collected, extracted, and analyzed from various substrates, making it a powerful tool for detecting and monitoring both microbial and macrobial communities effectively [34,35]. Honey’s stable nature, characterized by low water content and acidic pH, preserves remnants of microorganisms, offering insight into historical records of colony pathogens[36]. Recognizing honey as a reservoir of exogenous DNA underscores the importance of monitoring and management of bee health, with the detection of pathogens from honey serving to prevent the spread of diseases among colonies.
In our study, we collected honey samples from diverse botanical and geographical regions spanning different states in Australia. These samples were utilized to isolate eDNA using the bead-beating-silica DNA extraction method and identified pathogens and parasites known to impact honey bee populations in Australia. We also examined the co-occurrence pattern of these pathogens in honey samples.
2. Materials and Methods
2.1. Acquisition of Commercial Honey Samples
Honey samples were gathered between 2022 and 2024 from diverse regions across Australia, including trade markets and directly from beekeepers, to ensure a comprehensive representation of honey sources. The sample comprised both poly-floral and mono-floral varieties, were obtained from different states: Victoria (27), New South Wales (29), Queensland (24), Northern Territory (1), Western Australia (22), South Australia (20* including 6 samples from kangaroo island), Tasmania (12)[37].
2.2. eDNA Extraction from Honey Samples
DNA was extracted from honey following an in-house extraction protocol, modified from Waiblinger H-U, et al., [38] with adjustments, incorporating both pre-treatment and a post-treatment phase as detailed by Soares et al., [39] and Rathinasamy et al., [40].
For the pre-treatment phase, 50 g of honey was evenly partitioned into four sterile 50 mL conical tubes, each containing 12.5 g of honey. Subsequently, 40 mL of ultrapure water was added to each tube and vortexed until completely homogenized. The samples underwent incubation at 40°C for 10 mins in a water bath with agitation, then centrifugation at 4700× g for 35 minutes. The resulting supernatant was discarded, and the pellets were resuspended in 5 mL of ultrapure water and combined with the same honey sample into a single conical tube. This suspension was then subjected to an additional centrifugation at 4700× g for 30 minutes. After centrifugation, the supernatant was removed, and the pellet was resuspended in approximately 500 µL of ultrapure water. Subsequently, the suspension was transferred to a 2 mL tube containing seven glass beads (approximately 5 mm in size) and vortexed for 2 minutes. The glass beads were removed, and the mixture underwent centrifugation at 11,000× g at 4°C for 10 minutes. The resulting pellet served as the starting material for DNA extraction.
To each pre-treated sample pellet, 860 µL of TNE (10 mM Tris-HCL, 150 mM NaCl, 2mM ethylenediaminetetraacetic acid, 1% (w/v) sodium dodecyl sulfate, pH 7.5) extraction buffer was added, which was pre-heated at 60°C. Additionally, 100 µL of 5 M guanidine hydrochloride (w/v) and 40 µL of proteinase K solution (20 mg/ml-1) were added and subsequently vortexed. Following a 3-hour incubation at 60°C in a Thermomixer Comfort (Eppendorf AG, Hamburg, Germany) with agitation at 900 rpm, the suspension underwent centrifugation for 15 minutes at 17,000×g at 4°C. The supernatant was collected for DNA purification.
2.3. eDNA Purification
The resulting extracted DNA was mixed with 2 volumes of 6M sodium iodide (NaI) and 100 µL of 100 mg/mL silica dioxide (SiO2), and binding occurred with gentle agitation on a rocker for 30 minutes. Subsequently, centrifugation was performed (10 minutes at 5000×g at 4° C), with the supernatant discarded and 500 µL of silica wash buffer (50% (v/v) ethanol, 10 mM Tris-HCl, 100 mM NaCl, 1 mM EDTA, pH 8) added to the pellet and resuspended via vortexing. The solution was centrifugated for 1 minute at 4700×g at 4°C, with this wash step repeated a further two times. Care was taken to remove all the supernatants. To elute the eDNA from the silica matrix, 50 µL of elution buffer (10 mM Tris-HCl, pH 8) was added and incubated at 70°C for 5 minutes. Following incubation, the sample was centrifugated for 5 minutes at 16,000×g, with the supernatant collected and stored at -20°C until further analysis. The concentration of DNA was measured using a Nanodrop Eight spectrophotometer and visualized by electrophoresis in a 2% (w/v) agarose gel in 1X TBE buffer (0.13 M Tris, 45 Mm Boric acid, 2.5 mM EDTA pH 7.6) containing 0.2 µg/mL ethidium bromide (Merck Life Science Pty Ltd., Melbourne, Australia).
2.4. PCR Analysis
Gene targets and primer sequences were selected based on validated and published studies, as outlined in Table 1. We assessed the presence of pathogens using both singleplex and multiplex PCR, with PCR conditions optimized for each pathogen according to their annealing temperature and amplicon size (Table 2). Positive DNA controls for each pathogen were generated by chemical synthesizing of each gene (Table 1) from Integrated DNA Technologies (IDT) and subsequently cloning them into the TOPO vector according to manufacturer instructions. Sensitivity was determined by serial dilution of synthetic plasmid from 10-1 ng/µl to 10-9 ng/µL concentration, and specificity was evaluated using genomic DNA of P. larvae, M. plutonius, A. apis, N. apis, N. ceranae, A. tumida, and G. mellonella.
PCR reactions were performed in a total volume of 25 µl, containing 1x GoTaq® Green Master Mix (Promega), 25ng of template DNA, and species-specific primer concentration. The primer concentrations were optimized as follows: 0.5 µM for A. mellifera, N. apis, N. ceranae, and G. mellonella; 0.4 µM for P. larvae and M. plutonius; 0.3 µM for A. tumida; and 0.1 µM for A. apis. The thermal cycling conditions were performed as described in Table 2. A negative control, devoid of template DNA, was included in each assay. Subsequently, the amplified DNA fragments were subjected to electrophoresis in a 2% (w/v) agarose gel in 1X TBE buffer containing 0.2µg/mL ethidium bromide. Three confirmed positive samples for each pathogen were sequenced to verify the correct target amplification.
2.5. Statistical Analysis
The diversity of pathogens detected in each honey sample was quantified and visualized using the ggplot2 package in R [41]. To assess the patterns of pathogen co-occurrence across the samples, we utilized the R package cooccur [42], which employs a probabilistic model to evaluate species co-occurrence [43]. This model includes combinatorial methods that calculate the probability of the observed frequency of co-occurrence being significantly greater (p_gt < 0.05) than expected, indicating a positive association (+ve) and with p_gt > 0.05 indicating negative association (-ve), or independent co-occurrence (p_lt > 0.05), which indicates no evidence of pathogen interaction and suggests no significant association. The effect size, which ranges from -0.02 to 0.08, indicates the strength of co-occurrence (+ve/-ve) between two pathogens present in a sample and is assessed using the probability matrix (p_gt and p_lt). In total, 21 species pairs were analyzed to determine the frequency of their co-occurrence across the samples and the nature of the association (+ve or -ve) between each pathogen pair.

Table 1.
PCR primers used in this study to amplify eDNA extracted from honey samples.
| Target species | Primer name1 | Accession No. | Primer sequence (5′-3′) | Amplified region | Product size (bp) | Reference |
| Singleplex PCR | ||||||
| Apis mellifera | AM Forward AM Reverse |
GGCAGAATAAGTGCATTG TTAATATGAATTAAGTGGGG |
suppl | C 85, M 1392 | [44] | |
| Nosema apis | Nose_apis_chen_F Nose_apis_chen_R |
U97150.1 |
CCATTGCCGGATAAGAGAGT CCACCAAAAACTCCCAAGAG |
SSUrRNA | 269 | [45] |
| Nosema ceranae | Nose_cera_chen_F Nose_cera_chen_R |
DQ486027.1 |
CGGATAAAAGAGTCCGTTACC TGAGCAGGGTTCTAGGGAT |
SSUrRNA | 250 | [45] |
| Aethina tumida | Atum-3F Atum-3R |
MF943248.1 |
CCCATTTCCATTATGTWYTATCTATAGG CTATTTAAAGTYAATCCTGTAATTAATGG |
COI | 97 | [46] |
| Galleria mellonella | GallMelCox1-F GallMelCox1-R |
KT750964.1 |
TGAACTTGGTAATCCTGGTTCT TATTATTAAGTCGGGGGAAAGC |
COI | 182 | [46] |
| Multiplex PCR | ||||||
|
Paenibacillus larvae Melissococcus plutonius Ascosphaera apis |
Han233PaeLarv16S_F Han233PaeLarv16S_R Mp_Arai187_F Mp_Arai187_R AscosFORa AscosREVa |
NZCP019687.1 AB778538.1 U68313.1 |
GTGTTTCCTTCGGGAGACG CTCTAGGTCGGCTACGCATC TGGTAGCTTAGGCGGAAAAC TGGAGCGATTAGAGTCGTTAGA TGTGTCTGTGCGGCTAGGTG GCTAGCCAGGGGGGAACTAA |
16S rRNA NapA 18S rRNA |
233 187 136 |
[47] |
1 The internal name of the forward and reverse primers. 2 The size of the amplified fragment may vary depending on the mitochondrial lineage C which is highly frequent in A.m. lingustica and M in A.m. mellifera (C or M).
Table 2.
Optimized PCR conditions for detection of pathogens.
| Target Species | Steps | Optimized Conditions | Time | Cycle |
| Multiplex PCR |
Initial Denaturation Annealing Extension Final Extension |
95°C 95°C 63°C 72°C 72°C |
2 min 1 min 1 min 1 min 5 min |
35x |
|
P. larvae M. plutonius A. apis | ||||
| Single plex PCR | ||||
|
N. apis N. ceranae |
Initial Denaturation Annealing Extension Final Extension |
95°C 94°C 58.6°C 68°C 72°C |
2 min 15 sec 30 sec 1 min 7 min |
35x |
| A. tumida | Initial Denaturation Annealing Extension Final Extension |
95°C 98°C 54°C 72°C 72°C |
3 min 20 sec 30 sec 1 min 7 min |
35x |
| G. mellonella | Initial Denaturation Annealing Extension Final Extension |
95°C 98°C 61°C 72°C 72°C |
3 min 1 min 1 min 1 min 1 min |
35x |
3. Results
3.1. Assessment of Extracted DNA
Before attempting to analyze for the presence or absence of honey bee pathogens, we optimized PCR for the amplification of various pathogens using either single- or multiplex PCR. The revalidation of each primer set was completed to ensure high sensitivity and specificity. Sensitivity is determined at the lowest detectable limit (10-5 ng/µL), with no cross-reactivity observed when testing genomic DNA from P. larvae, M. plutonius, A. apis, N. apis, N. ceranae, A. tumida, and G. mellonella (Supplementary Fig. S1).
To verify the successful extraction and purification of eDNA from all honey samples, the presence of the Apis mellifera mtDNA was determined by PCR. The amplification resulted in fragments of 85 base pair (bp), specific to A. mellifera C lineage prevalent in A. m. lingustica and 139 bp specific to the M lineage, characteristic of A. m. mellifera (Figure 1). Successful PCR amplification was achieved for all tested honey samples (Supplementary Figure S2), indicating the successful extraction and purification of eDNA from the honey.
Every honey sample underwent PCR analysis to detect various common pathogens and pests that affect honey bees (Supplementary Figure S3). Specifically, samples 107 and 108 were positive for N. apis, while all samples except 104 tested positive for N. ceranae (Figure 1A). In the multiplex PCR targeting bacterial pathogens P. larvae, M. plutonius, and fungal pathogen A. apis, sample 107 amplified all three pathogens, whereas sample 108 tested positive for P. larvae and M. plutonius (Figure 1A). No amplification was detected in samples 104, 105, 106, 109, and 110 (Figure 1A). Furthermore, samples 125-131 indicated the presence of the arthropod pests A. tumida and G. mellonella (Figure 1B). All samples tested positive for A. tumida except samples 126 and 130, which tested positive for G. mellonella (Figure 1B).
3.2. Prevalence Pattern Across Different Australian States
Analysis of 135 honey samples collected from various locations in Australia revealed N. ceranae emerged as the most prevalent pathogen, present in 57% of the samples. This was followed by A. tumida (40%), G. mellonella (37%), P. larvae (21%), N. apis (19%), and M. plutonius (18%). A. apis was detected in a smaller proportion of the samples, with a prevalence of 5%. Additionally, 25 samples (19%) tested negative for all pathogens analysed (Figure 2). The most recent national survey of honey bee pathogens and pests, last conducted in 2014, reveals a significant shift in pathogen levels and their distribution throughout Australia over the following seven years. The detailed geographical distribution of bacterial, fungal pathogens, and arthropod parasites throughout Australia over the two years is summarized in Table 3.
Regional variations in pathogen prevalence were evident across different Australian states. Specifically, American foulbrood (AFB) and European foulbrood (EFB) were identified in Victoria (VIC), New South Wales (NSW), Queensland (QLD), and Tasmania (TAS) (Table 3). Notably, Victoria exhibited a high prevalence, with 33% of the sample testing positive for AFB and 37% for EFB. In NSW and QLD, there was no significant difference in the prevalence of AFB (28% and 21%, respectively) and EFB (14% and 13%, respectively). Tasmania had a prevalence of 25% for both AFB and EFB. In contrast, Western Australia only harbours AFB (14%) and is free from EFB, while South Australia exclusively hosts EFB (29%), with AFB absent. Similarly, EFB was absent in Western Australia (WA) and Kangaroo Island (KI) (Table 3).
The primary fungal disease impacting honey bees, A. apis (commonly referred to as chalkbrood), was detected at low levels in Victoria (4%) and New South Wales (7%), with no significant presence in Queensland, Northern Territory, Western Australia, and South Australia (Table 4). In contrast, Tasmania exhibited a relatively high incidence of A. apis at 33% (Table 4).
Nosema ceranae was frequently found across all states, with a particularly high prevalence in VIC (70%), followed by SA (64%), TAS (50%) and WA (45%). Remarkably, even a single sample from NT tested positive for N. ceranae (Table 4). There was no significant variance in prevalence between NSW (59%) and QLD (58%). N. apis was identified in TAS (58%), WA (23%), VIC (19%), SA (14%), and NSW (10%), but it was not detected in QLD or NT (Table 4). Additionally, 16% of the samples had mixed infections with both N. ceranae and N. apis (Table 4).
The invertebrate pests of honey bees, A. tumida and G. mellonella, were present in honey samples from all states except KI (Table 5). A. tumida showed a high prevalence in QLD (71%). SA (57%), VIC (56%), TAS (33%), and NSW (31%), while WA had a significantly lower prevalence at 5%. On the other hand, G. mellonella was most prevalent in TAS (84%) followed by SA (57%), WA (45%), VIC (44%), QLD (25%) and NSW (10%). Notably, in SA, 57% of the samples tested positive for both A. tumida and G. mellonella (Table 5).
3.3. Pathogen Prevalence on Kangaroo Island
Kangaroo Island is a distinct region due to its island status and strict movement restrictions, which help preserve the pure bred honey bees, preventing crossbreeding. Six samples were collected from the commercial beekeepers on KI and subjected to testing for bacterial, fungal pathogens, and arthropod parasites. The results were significant, as all samples tested negative for the three brood diseases (P. larvae, M. plutonius, and A. apis), as well as the pests A. tumida and G. mellonella. The only honey bee pathogens recorded on KI are the fungal pathogens N. apis and N. ceranae, with 50% and 17% of samples testing positive, respectively (Table 4).
3.4. Trends in Concurrent Infections
This study uncovered a diverse array of honey bee pathogens and pests present in individual honey samples, highlighting a significant incidence of co-infection within the bee population. The analysis revealed that 30% (40/135) of the samples contained a single type of pathogen, while 20% (27/135) displayed two distinct pathogens. Co-infections involving 3 and 4 pathogens were identified in 13% (18/135) and 10% (13/135) of the samples, respectively. Furthermore, 6% (8/135) contained 5 different types of pathogens, with less than 4% (6/135) having 6 types of infection. Notably, none of the samples tested positive for all seven types of pathogens analyzed (Figure 4A).
The probabilistic co-occurrence model revealed several significant positive associations (Figure 4B). Among these, positive co-occurrences were observed between P. larvae and M. plutonius (p_gt = 0.00001, p_lt =1, effect size = 0.06666 ). Notably, M. plutonius exhibited strong to moderate positive co-occurrence with all studied pathogens, including moderate association between A. apis (p_gt = 0.00198, p_lt = 0.99989, effect size = 0.02814), N. apis (p_gt = 0.02280, p_lt = 0.99389, effect size = 0.03111), N. ceranae (p_gt = 0.02776, p_lt = 0.99171, effect size = 0.03481), and a strong positive association with A. tumida (p_gt = 0.00082, p_lt = 0.99985, effect size = 0.05481), and G. mellonella (p_gt = 0.00017, p_lt = 0.99997, effect size = 0.06148). Additionally, A. apis displayed weak positive co-occurrence with N. apis (p_gt = 0.02949, p_lt = 0.99639, effect size = 0.01925) and G. mellonella (p_gt = 0.00931, p_lt = 0.99938, effect size = 0.02592), while N. apis showed moderate positive association with N. ceranae (p_gt = 0.00752, p_lt = 0.99812, effect size = 0.04444) and G. mellonella (p_gt = 0.01889, p_lt = 0.99403, effect size = 0.03851). N. ceranae had a strong positive association with A. tumida (p_gt = 0.00120, p_lt = 0.99966, effect size = 0.06666) and a moderate positive association with G. mellonella (p_gt = 0.00407, p_lt = 0.99873, effect size = 0.05777). A strong positive co-occurrence was also observed between the two arthropod pests (p_gt = 0.00058, p_lt = 0.99985, effect size = 0.06962).
Among the 21 pathogen pairs examined, 13 pairs exhibited positive associations, ranging from weak to strong, and tended to co-occur more frequently than expected (Supplementary Table S2). In contrast, eight pathogen pairs showed no statistically significant positive or negative association, suggesting no evidence of pathogen interaction. For instance, the interaction between P. larvae and N. ceranae is characterized by a weak negative association (p_gt = 0.67507, p_lt = 0.48867, effect size = -0.00444), indicating that the two pathogens are likely independent of each other. Similarly, N. apis and A. tumida exhibited a weak negative association (p_gt = 0.28640, p_lt = 0.84380, effect size = -0.01333). Additionally, P. larvae showed no positive or negative association with A. apis (p_gt = 0.15581, p_lt = 0.96632, effect size = 0.01111), N. apis (p_gt = 0.06581, p_lt = 0.97716, effect size = 0.02518), A. tumida (p_gt = 0.28489, p_lt = 0.84055, effect size = 0.01333) or G. mellonella ( p_gt = 0.15120, p_lt = 0.92831, effect size = 0.02074). Similarly, A. apis did not exhibit significant co-occurrence with N. ceranae ( p_gt = 0.67771, p_lt =0.62275, effect size = 0.00074) or with A. tumida ( p_gt = 0.28532, p_lt = 0.90959, effect size = 0.00888) showing that these pathogen pairs occur independently of each other with no strong evidence of interaction.
4. Discussion
Honey serves as an ideal source of environmental DNA because foraging honey bees collect and transfer environmental microorganisms and contaminants to the hive, depositing them in the honeycomb and honey [30,33]. This eDNA reveals the presence of various organisms, including bee pathogens and parasites, making honey a valuable non-invasive tool for monitoring colony health and detecting invasive species [21,48]. Many studies have developed PCR-based diagnostic assays to detect key honey bee pathogens and pests in honey samples, including Paenibacillus larvae, Melissococcus plutonius [49,50], and Ascosphaera apis [47]. Giersch et al., identified Nosema apis and Nosema ceranae in adult bees and honey samples from Australia (2007–2008) using PCR, Restriction fragment length polymorphism (RFLP), and microscopy [51]. Later, Granato et al., employed PCR to detect N. apis and N. ceranae spores in honey, providing a reliable method to track infections in bee colonies, even without visible clinical symptoms [52]. Expanding on this approach, Ribani et al. developed a DNA-based assay to detect traces of Aethina tumida and Galleria mellonella in Italian honey samples [46] supporting honey as a source of eDNA to analyse and detect hive-associated organisms. Further investigation by Ribani et al., and Aditya et al., [18,21,46] used eDNA in honey to detect specific pathogens and found it to be an effective method for the global monitoring of pathogens.
Our data highlights the presence of key honey bee pathogens in honey samples collected across Australia, with Victoria, New South Wales, and Tasmania showing the highest prevalence of pathogens and parasites compared to other states. The most widely distributed and frequently detected pathogens include microsporidian N. ceranae, the arthropod pest A. tumida, and G. mellonella. The bacterium P. larvae, M. plutonius, and microsporidian N. apis were detected at low prevalence, with A. apis detected at low frequency. These findings provide novel trends in pathogen prevalence and distribution and identify key disease hotspots in Australia. The presence of these pathogens in honey samples may indicate residual DNA from past infections or ongoing infections [53].
Nosemosis, caused by the microsporidian fungal pathogens N. apis and N. ceranae, is a globally distributed honey bee disease [54]. N. ceranae was initially believed to be restricted to Asian honey bees (Apis ceranae) when first detected in Beijing, China, in the 1990s [55]. However, A. mellifera was previously believed to be susceptible only to N. apis. This view changed when N. ceranae was identified in A. mellifera during a study in Spain, using isolates from various regions worldwide [56,57]. The host shift of N. ceranae from A. ceranae to A. mellifera has occurred on a global scale, raising questions about the factors driving this transition, but likely due to the movement of infected honey bees through commercial trade [58,59,60,61]. The high prevalence of N. ceranae compared to N. apis in Australian honey samples is part of a broader trend observed in other countries. This result aligns with surveys that report a high prevalence of N. ceranae in Canada [62], in the United States [63], Florida [64], Mexico [65], Northern and Central Italy [66,67], Scotland [68], New Zealand [69,70,71] and Indonesia [18]. N. ceranae was isolated from diseased A. mellifera in Taiwan, where it is considered a non-native species [72]. However, studies in Germany [73] and Sweden [74] reported a higher occurrence of N. apis compared to N. ceranae, likely due to climatic factors. Experimental Studies indicate N. ceranae exhibits reduced germination and infectivity at low temperatures, while N. apis remain viable even under freezing conditions [75]. This differential temperature tolerance likely contributes to the higher prevalence of N. apis in colder regions, whereas N. ceranae flourishes in warmer areas [76].
The analysis conducted seven years ago on 151 adult bee samples in Australia revealed that 139 of the samples tested positive for either N. apis or N. ceranae, with an equal proportion of both pathogens. Interestingly, there is a gradual decline in the prevalence of N. apis among the samples tested in this study, indicating a shift in pathogen dynamics over time. Giersch et al., [51] detected N. apis in bee samples across various Australian states, while N. ceranae was found in all states except Western Australia and Tasmania. In contrast, our study observed N. ceranae in all sampled states, but N. apis was not detected in Queensland. This higher prevalence of N. ceranae compared to N. apis in this study may be attributed to Australia’s warmer temperatures, which favor N. ceranae, making it a more competitive pathogen over time. The occurrence of co-infection was more frequent in tested honey samples for N. apis and N. ceranae than single-species infections, with N. ceranae exhibiting dominance over N. apis. Similar findings of mixed infections have been reported in Europe, North America, and Asia [77]. The ability of N. ceranae to thrive in warmer conditions, its rapid reproduction rate, and significantly higher mortality in honey bees suggest its competitive advantage over N. apis [60]. N. ceranae is widespread across all states in Australia, which have diverse climate conditions ranging from tropical in the north to temperate in the south. Further investigation is required to substantiate the correlation between climate and the prevalence of Nosema spp.
Chalkbrood was detected in 5% of the analyzed honey samples, restricted to Victoria and New South Wales. Although A. apis was first reported in Queensland, no traces were found in honey samples from this region. Robert et al., [2] identified chalkbrood mummies in 66% of hives across Australia, primarily along the eastern coast, with a single case recorded in Western Australia. However, our study did not identify A. apis in honey samples from this state. Globally, chalkbrood is widely distributed and reported in key beekeeping regions, including Central America, North America, Mexico, Chile, Japan, China, Turkey, Africa, and the Philippines [78,79]. The spores of A. apis, N. apis, and N. ceranae remain viable for over 15 years in infected apiaries, stored honey, hive materials, and beekeeping equipment, serving as a persistent source of infection [80,81]. Determining whether the detected genetic material or isolated DNA comes from viable spores or non-viable residue or is transmitted by exchanging contaminated honey and hive components between colonies is important.
American Foulbrood and European Foulbrood are serious bacterial diseases caused by Paenibacillus larvae and Melissococcus plutonius, are widespread, highly contagious and can lead to significant losses in honey bee colonies [82]. Both AFB and EFB are globally distributed honey bee diseases. AFB is present in all beekeeping countries and is classified by the World Organization for Animal Health (WOAH) as a highly dangerous infectious disease in animals. First identified in North America [83,84] and its causative agent, P. larvae, produces resilient, long-lived spores in large quantities, which are essential for infection. Once the colony is infected, recovery is not possible [85]. Whereas EFB has long been recognized in Europe and North America, more recently, it has also been detected in Africa, South America, India, Japan, and Australia [86].
The prevalence of AFB and EFB varies across regions due to differences in sampling methods, colony health, and environmental factors. In Australia, Robert et al., [2] reported AFB at 9% and EFB at 5% in 2015. However, this study found a higher nationwide prevalence, with 21% for AFB and 18% for EFB. This difference is likely due to the presence of spores in honey samples, which may persist for an extended period, compared to samples collected directly from hives exhibiting clinical symptoms of AFB and EFB. These results remain consistent over time, with WA, NT, and KI continuing to be free from EFB. In Indonesia, P. larvae was not detected, whereas M. plutonius was identified for the first time from honey samples collected from Java [18]. Ribani et al., [21] reported a high prevalence of EFB (87%) and AFB (49%) in Italian honey samples processed between 2004 and 2018. Similarly, P. larvae, spores were detected in 40% of the analyzed samples in Italy, indicating a long-term persistence of the disease [87]. In the U.S, EFB (19.2%) was more common in symptomatic colonies than AFB (8.6%), despite the resilience and ease of spread of P. larvae spores. The higher prevalence of EFB is likely due to its tendency to infect already stressed colonies [88]. Given the long-term viability of P. larvae spores (up to 15 years), the risk of disease spread through honey exchange remains a major concern, necessitating ongoing surveillance and strict biosecurity measures [85].
Arthropod pests A. tumida and G. mellonella are among the most damaging threats to honey bees, particularly when they spread beyond their native habitats [89]. A. tumida, originally native to Sub-Saharan Africa, and G. mellonella, once limited to A. ceranae, have also expanded their presence worldwide [90]. The larvae stage of both pests harm the colony, with A. tumida causing hive destruction and honey fermentation [91], whereas wax moth larvae consume wax combs, honey, and the cast skin of bee larvae [92]. A. tumida and G. mellonella are widely distributed in all continents except Antarctica [93,94,95]. The small Hive Beetle (SHB) was first detected in the U.S. [96] and later in Australia [97]; thereafter, it spread to all parts of the world. In South Africa, 69% of apiaries tested positive for SHB and wax moth infestation between 2010 and 2011 [98]. In Nigeria, apiaries are experiencing a concerning infestation rate of 21% for SHB and 5% for wax moths [99]. The comparison of SHB and wax moth prevalence in adult bee samples from 2015-2017 [2] with current honey samples in Australia reveals a significant trend. In the earlier study, SHB was detected to have a high incidence in Queensland but was absent in South Australia, Western Australia, Tasmania, and Kangaroo Island. At the same time, wax moth was present across all states. The honey eDNA analysis in our study detected both SHB and wax moths in all states except Kangaroo Island, with SHB still being more prevalent in Queensland. This suggests that the range of SHB may be expanding, which could have significant implications for pest management, while the distribution of wax moths remains extensive [100,101].
The investigation of pathogen co-infection in bee hives is limited, with few studies addressing the co-occurrence pattern of various honey bee pathogens and pests. Our data reveals a strong to modrate positive co-occurrence of M. plutonius with all the tested pests and pathogens, consistent with findings by Deutsch, Kaitlin R., et al., [64] which linked M. plutonius to A. apis and N. ceranae. Aglagane et al.,[102] reported higher prevalence levels of N. ceranae and M. plutonius in migratory beehives compared to stationary colonies. M. plutonius remains viable in honey, beeswax, and pollen for years without any clinical symptoms [103,104] and often kills honey bee larvae, leading to a decreased adult honey bee population and weakening the colony strength and productivity, exposing the bees to other pest and pathogen attacks [23,105]. A strong positive association between both bacterial diseases has been reported by Sturtevant et al., [106], indicating the presence of both bacterial species in the honey bee colonies. One possible explanation for this strong positive co-occurrence is that the presence of AFB can affect overall health and immune defense, creating an environment where EFB can easily take hold [106,107].
A study in 32 Kenyan apiaries revealed a significant positive correlation between the abundance of A. tumida and N. ceranae using the Spearman correlation coefficient (P = 0.01507) [108] . Our study, using the probabilistic model (R package cooccur), also demonstrated a positive correlation between A. tumida and N. ceranae with a p_gt = 0.00120, which is below the established significant threshold of 0.05, and an effect size = 0.06666, supporting the strength of association. This suggests a synergistic relationship; as the number of A. tumida increases, the prevalence of Nosema infection also tends to rise. This evidence suggests the potential role of A. tumida in the biological transmission of N. ceranae, as hive beetles can carry spores from infected bee feaces [109]. Extensive research has been conducted on the co-infection of Nosema apis and Nosema ceranae in honey bee colonies, demonstrating correlations with seasonal variation and asymmetrical coexistence [45,110,111]. Our study corroborates these findings, confirming a strong positive association between the two Nosema species.
The trends in pathogen co-occurrence observed in this study highlight notable patterns among different pests and pathogens. However, these patterns do not confirm that these pathogens directly cause infections or facilitate each other’s spread, indicating a knowledge gap in understanding the co-occurrence of honey bee pathogens and pests. This data provides an interesting foundation for further exploration in future studies.
5. Conclusions
For the first time, a detailed pathogen prevalence survey using honey from different states of Australia revealed that N. ceranae is the most prevalent pathogen, followed by A. tumida, G. mellonella, P. larvae, N. apis, M. plutonius, and A. apis. In particular, detecting nosemosis in Kangaroo Island indicates the need to address emerging threats to honey bee populations. Our data on the current prevalence of arthropod, fungal, and bacterial pathogens in honey bees can contribute to safeguarding Australia’s beekeeping industry.
Supplementary Materials
The following supporting information can be downloaded at: www.mdpi.com/xxx/s1, Figure S1: title; Table S1: title; Video S1: title.
Author Contributions
Conceptualization, T.B; methodology, G.B.; validation, G.B.., G.Z. and T.B.; formal analysis, G.B.; resources, G.Z. and T.B..;; writing—original draft preparation, G.B.; writing—review and editing, G.B., G.Z., and T.B..; visualization, X.X.; supervision, G.Z. and T.B. project administration, T.B..; All authors have read and agreed to the published version of the manuscript.
Funding
This research received no external funding.
Data Availability Statement
The original contributions presented in this study are included in the article/supplementary material. Further inquiries can be directed to the corresponding author(s).
Acknowledgments
G.B. is supported by Shah Rukh Khan scholarship.
Conflicts of Interest
The authors declare no conflicts of interest.
References
- Hagan, T. 2022. Evolution and ecology of invasive honey bees.PhD thesis, The University of Sydney, Sydney, 10th July 2023.The University of Sydney, Library. Available online: https://hdl.handle.net/2123/31486 (accessed on 18 April 2024).
- Roberts, J.; Anderson D.; Durr P. Upgrading knowledge on pathogens (particularly viruses) of Australian honey bees. Rural Industries Research & Development Corporation (RIRDC) Canberra. 2015.
- Chapman, N.C.; Colin, T.; Cook, J.; da Silva, C.R.; Gloag, R.; Hogendoorn, K.; et al. The final frontier: ecological and evolutionary dynamics of a global parasite invasion. Biol. Lett. 2023, 19,20220589.
- Brettell, L.E.; Riegler, M.; O’brien, C.; Cook, J.M. Occurrence of honey bee-associated pathogens in Varroa-free pollinator communities. J. Invertebr. Pathol. 2020, 171, 107344.
- Borba, R.S.; Hoover, S.E.; Currie, R.W.; Giovenazzo, P.; Guarna, M.M.; Foster, L.J.; et al. Phenomic analysis of the honey bee pathogen-web and its dynamics on colony productivity, health and social immunity behaviors.PLoS ONE 2022, 17, e0263273.
- Cunningham, S.A.; FitzGibbon, F.; Heard, T.A. The future of pollinators for Australian agriculture. Aust. J. Agric. Res. 2002, 53, 893-900.
- Khalifa , S.A.; Elshafiey, E.H.; Shetaia, A.A.; El-Wahed, A.A.A.; Algethami, A.F.; Musharraf, S.G.; et al. Overview of bee pollination and its economic value for crop production. Insects 2021,12, 688.
- Rogers, S.R.; Tarpy, D.R.; Burrack, H.J. Bee species diversity enhances productivity and stability in a perennial crop. PLoS ONE 2014, 9, e97307.
- Gibbs, D.M.; Muirhead, I.F.; The Economic Value and Environmental Impact of the Australian Beekeeping Industry. A Report Prepared for the Australian Beekeeping Industry; Australian Beekeeping Industry: Canberra, Australia, 1998. Available online: https://honeybee.org.au/doc/Muirhead.doc (accessed on 18 April 2024).
- Tierney, S.M.; Bernauer, O.M.; King, L.; Spooner-Hart, R.; Cook, J.M. Bee pollination services and the burden of biogeography.Proc. R. Soc. B Biol. Sci. 2023, 290, 20230747.
- Allen, G. Honey bee health and pollination under protected and contained environments. Hort Innovation, 2022. Available online: https://www.horticulture.com.au (accessed on 18 April 2024).
- Howpage, D. Pollination biology of kiwifruit: influence of honey bees, Apis mellifera L, pollen parents and pistil structure. PhD thesis, University of Western Sydney, Hawkesbury, Australia, 1999.Available online: https://scholar.google.com/scholar (accessed on 18 April 2024).
- Parveen, N.; Miglani, R.; Kumar, A.; Dewali, S.; Kumar, K.; Sharma, N.; et al. Honey bee pathogenesis posing threat to its global population: A short review.Proc. Indian Natl. Sci. Acad. 2022, 88, 11–32.
- Milbrath, M. Honey bee bacterial diseases. Honey Bee Medicine for the Veterinary Practitioner. 2021,277-293.
- Büchler, R.; Costa, C.; Hatjina, F,.; Andonov, S.; Meixner, M.D.; Conte, Y.L.; et al. The influence of genetic origin and its interaction with environmental effects on the survival of Apis mellifera L. colonies in Europe. J. Apic. Res. 2014, 53, 205-214.
- Hedtke, S.M.; Blitzer, E.J.; Montgomery, G.A.; Danforth, B.N. Introduction of non-native pollinators can lead to trans-continental movement of bee-associated fungi. PLoS ONE 2015, 10, e0130560.
- Salkova, D.; Shumkova, R.; Balkanska, R.; Palova, N.; Neov, B.; Radoslavov, G.; et al. Molecular detection of Nosema spp. in honey in Bulgaria. Vet. Sci. 2021, 9, 10.
- Aditya, Ira.; Purwanto, H. Molecular detection of the pathogen of Apis mellifera (Hymenoptera: Apidae) in honey in Indonesia. Biodiversitas J. Biol. Divers. 2023, 24.
- Ward, L.; Brown, M.; Neumann, P.; Wilkins, S.; Pettis, J.; Boonham, N. A DNA method for screening hive debris for the presence of small hive beetle (Aethina tumida). Apidologie. 2007, 38, 272-280.
- Ryba, S.; Titera, D.; Haklova, M.; Stopka, P. A PCR method of detecting American foulbrood (Paenibacillus larvae) in winter beehive wax debris. Vet. Microbiol. 2009, 139, 193-196.
- Ribani , A.; Utzeri, V.J.; Taurisano, V.; Fontanesi, L. Honey as a source of environmental DNA for the detection and monitoring of honey bee pathogens and parasites. Vet. Sci. 2020, 7, 113.
- Bakonyi , T.; Derakhshifar, I.; Grabensteiner, E.; Nowotny, N. Development and evaluation of PCR assays for the detection of Paenibacillus larvae in honey samples: Comparison with isolation and biochemical characterization. Appl. Environ. Microbiol. 2003, 69, 1504-1510.
- Forsgren, E. European foulbrood in honey bees. J. Invertebr. Pathol. 2010, 103, S5-S9.
- Aziz, M.A.; Alam, S. Diseases of Honeybee (Apis mellifera). In Melittology—New Advances; IntechOpen: London, UK, 2024.
- Dong, J.; Olano, J.P.; McBride, J.W.; Walker, D.H. Emerging pathogens: challenges and successes of molecular diagnostics. J. Mol. Diagn. 2008, 10, 185–197.
- Ongus, J.R.; Fombong, A.T.; Irungu, J.; Masiga, D.; Raina, S. Prevalence of common honey bee pathogens at selected apiaries in Kenya, 2013/2014. Int. J. Trop. Insect Sci. 2018, 38, 58-70.
- Hamiduzzaman, M.M.; Guzman-Novoa, E.; Goodwin, P.H. A multiplex PCR assay to diagnose and quantify Nosema infections in honey bees (Apis mellifera). J. Invertebr. Pathol. 2010, 105,151-155.
- Bass, D.; Christison, K.W.; Stentiford, G.D.; Cook, L.S.; Hartikainen, H. Environmental DNA/RNA for pathogen and parasite detection, surveillance, and ecology. Trends Parasitol. 2023, 39, 285-304.
- D’Alessandro, B.; Antúnez, K.; Piccini, C.; Zunino, P. DNA extraction and PCR detection of Paenibacillus larvae spores from naturally contaminated honey and bees using spore-decoating and freeze-thawing techniques. World J. Microbiol. Biotech. 2007, 23, 593–597.
- Revainera, P.D.; Quintana, S.; de Landa, G.F.; Iza, C.G.; Olivera, E.; Fuentes, G.; et al. Molecular detection of bee pathogens in honey. J. Insects Food Feed, 2020, 6, 467-474.
- Traynor, K.S.; Pettis, J.S.; Tarpy, D.R.; Mullin, C.A.; Frazier, J.L.; Frazier, M.; et al. In-hive Pesticide Exposome: Assessing risks to migratory honey bees from in-hive pesticide contamination in the Eastern United States. Sci. Rep. 2016, 6, 33207.
- Bovo, S.; Ribani, A.; Utzeri, V.J.; Schiavo, G.; Bertolini, F.; Fontanesi, L. Shotgun metagenomics of honey DNA: Evaluation of a methodological approach to describe a multi-kingdom honey bee derived environmental DNA signature. PLoS One, 2018, 13, e0205575.
- Soares, S.; Rodrigues, F.; Delerue-Matos, C. Towards DNA-based methods analysis for honey: an update. Molecules, 2023, 28, 2106.
- Call, D.R.; Borucki, M.K.; Loge, F.J. Detection of bacterial pathogens in environmental samples using DNA microarrays. J. Microbiol. Methods 2003, 53, 235–243.
- Bohmann, K.; Evans, A.; Gilbert, M.T.P.; Carvalho, G.R.; Creer, S.; Knapp, M.; et al. Environmental DNA for wildlife biology and biodiversity monitoring.Trends Ecol. Evol. 2014, 29,358-367.
- Silva, M.S.; Rabadzhiev, Y.; Eller, M.R.; Iliev, I.; Ivanova, I.; Santana, W.C. Microorganisms in honey. Honey analysis. IntechOpen 2017, 500, 233-257.
- Crooks, S. Australian Honeybee Industry Survey 2006-07. Rural Industries Research and Development Corporation. Canberra Australia Publication. 2008, 08-170.
- Waiblinger , H.-U.; Ohmenhaeuser, M,.; Meissner, S.; Schillinger, M.; Pietsch, K.; Goerlich, O.; et al. In-house and interlaboratory validation of a method for the extraction of DNA from pollen in honey. J. Verbraucherschutz Und Leb. 2012, 7, 243-254.
- Soares, S.; Amaral, J.S.; Oliveira, M.B.P.; Mafra, I. Improving DNA isolation from honey for the botanical origin identification. Food Control, 2015,48,130-136.
- Rathinasamy,V.; Hosking, C.; Tran, L.; Kelley, J.; Williamson, G.; Swan, J.; et al. Development of a multiplex quantitative PCR assay for detection and quantification of DNA from Fasciola hepatica and the intermediate snail host, Austropeplea tomentosa, in water samples. Vet. Parasitol. 2018,259,17-24.
- Wickham, H. ggplot2. Wiley interdiscip. Rev. comput. stat. 2011,3,180-185.
- Griffith, D.M.; Veech, J.A.; Marsh, C.J.; Cooccur: probabilistic species co-occurrence analysis in R. J. Stat. Softw. 2016,69,1-17.
- Veech, J.A. A probabilistic model for analysing species co-occurrence. Glob. Ecol. Biogeogr. 2013,22,252-260.
- Utzeri , V.J.; Ribani, A.; Fontanesi, L. Authentication of honey based on a DNA method to differentiate Apis mellifera subspecies: Application to Sicilian honey bee (A. m. siciliana) and Iberian honey bee (A. m. iberiensis) honeys. Food Control. 2018, 91, 294-301.
- Chen, Y.; Evans, J.; Zhou, L.; Boncristiani, H.; Kimura, K.; Xiao, T.; et al. Asymmetrical coexistence of Nosema ceranae and Nosema apis in honey bees. J. Invertebr. Pathol. 2009, 101, 204-209.
- Ribani A, A.; Taurisano, V.; Utzeri, V.J.; Fontanesi, L. Honey Environmental DNA Can Be Used to Detect and Monitor Honey Bee Pests: Development of Methods Useful to Identify Aethina tumida and Galleria mellonella Infestations. Vet. Sci. 2022, 9, 213-213.
- Garrido-Bailón, E.; Higes, M.; Martínez-Salvador, A.; Antúnez, K.; Botías, C.; Meana, A.; et al. The prevalence of the honeybee brood pathogens Ascosphaera apis, Paenibacillus larvae and Melissococcus plutonius in Spanish apiaries determined with a new multiplex PCR assay. Microb. biotechnol. 2013, 6, 731-739.
- Bovo, S.; Utzeri, V.J.; Ribani, A.; Cabbri, R.; Fontanesi, L. Shotgun sequencing of honey DNA can describe honey bee derived environmental signatures and the honey bee hologenome complexity. Sci. Rep. 2020,10,9279.
- Lauro, F.M.; Favaretto, M.; Covolo, L.; Rassu, M.; Bertoloni, G. Rapid detection of Paenibacillus larvae from honey and hive samples with a novel nested PCR protocol. Int. J. Food Microbiol. 2003, 81, 195–201.
- McKee, B.; Djordjevic, S.; Goodman, R.; Hornitzky, M. The detection of Melissococcus pluton in honey bees (Apis mellifera) and their products using a hemi-nested PCR. Apidologie 2003, 34, 19–27.
- Giersch, T.; Berg, T.; Galea, F.; Hornitzky, M. Nosema ceranae infects honey bees (Apis mellifera) and contaminates honey in Australia. Apidologie 2009, 40, 117–123.
- Granato, A.; Caldon, M.; Colamonico, R.; Boscarato, M.; Falcaro, C.; Stocco, N.; et al. 2009. Presented in Proceedings 41st Apimondia International Apicultural Congress, p. 163. Montpellier, France.
- Gisder, S.; Horchler, S.; Pieper, F.; Schüler, V.; Šima, P.; Genersch, E. Rapid Gastrointestinal Passage May Protect Bombus terrestris from ecoming a True Host for Nosema ceranae. Appl. Environ. Microbiol. 2020, 86, e00629-20.
- Holt, H.L.; Grozinger, C.M. Approaches and challenges to managing Nosema (Microspora: Nosematidae) parasites in honey bee (Hymenoptera: Apidae) colonies. J. Econ. Entomol. 2016, 109, 1487–1503.
- Friess, I.; Feng, F.; Da Silva, A.; Slemenda, S.B.; Pieniazek, N.J. Nosema ceranae n. sp. (Microspora, Nosematidae), morphological and molecular characterization of a microsporidian parasite of the Asian honey bee Apis cerana (Hymenoptera, Apidae). Eur. J. Protistol. 1996, 32, 356–365.
- Higes, M.; Martín, R.; Meana, A. Nosema ceranae, a new microsporidian parasite in honeybees in Europe. J. Invertebr. Pathol. 2006,92,93-95.
- Klee, J.; Besana, A.M.; Genersch, E.; Gisder, S.; Nanetti, A.; Tam, D.Q.; Chinh, T.X.; Puerta, F.; Ruz, J.M.; Kryger, P.; et al. Widespread dispersal of the microsporidian Nosema ceranae, an emergent pathogen of the western honey bee, Apis mellifera. J. Invertebr. Pathol. 2007, 96, 1–10.
- Fries, I. Nosema ceranae in European honey bees (Apis mellifera). J. Invertebr. Pathol. 2010,103,S73-S79.
- Gisder , S.; Schüler, V.; Horchler, L.L.; Groth, D.; Genersch, E. Long-Term Temporal Trends of Nosema spp. Infection Prevalence in Northeast Germany: Continuous Spread of Nosema ceranae, an Emerging Pathogen of Honey Bees (Apis mellifera), but No General Replacement of Nosema apis. Front. Cell. Infect. Microbiol. 2017, 7, 301.
- Martín-Hernández , R.; Bartolome, C.; Chejanovsky, N.; Le Conte, Y.; Dalmon, A.; Dussaubat, C.; Dussaubat, C.; Meana, A.; Pinto, M.; Soroker, V.; et al. Nosema ceranae in Apis mellifera: A 12 Years Post-Detection Perspective: Nosema ceranae in Apis mellifera. Environ. Microbiol. 2018, 20, 1302–1329.
- Goblirsch, M. Nosema ceranae disease of the honey bee (Apis mellifera). Apidologie 2018, 49, 131–150.
- Emsen, B.; Guzman-Novoa, E.; Hamiduzzaman, M.M.; Eccles, L.; Lacey, B.; Ruiz-Pérez, R.A.; Nasr, M. Higher prevalence and levels of Nosema ceranae than Nosema apis infections in Canadian honey bee colonies. Parasitol. Res. 2016, 115, 175–181.
- Chen, Y.P.; Evans, J.D.; Smith, I.B.; Pettis, J.S. Nosema ceranae is a long-present and widespread microsporidean infection of the European honey bee (Apis mellifera) in the United States. J. Invertebr. Pathol. 2008, 97, 186–188.
- Deutsch, K.R.; Graham, J.R.; Boncristiani, H.F.; Bustamante, T.; Mortensen, A.N.; Schmehl, D.R.; et al. Widespread distribution of honey bee-associated pathogens in native bees and wasps: trends in pathogen prevalence and co-occurrence. J. Invertebr. Pathol. 2023,200,107973.
- Guerrero-Molina, C.; Correa-Benítez, A.; Hamiduzzaman, M.M.; Guzman-Novoa, E. Nosema ceranae is an old resident of honey bee (Apis mellifera) colonies in Mexico, causing infection levels of one million spores per bee or higher during summer and fall. J. Invertebr. Pathol. 2016, 141, 38–40.
- Papini, R.; Mancianti, F.; Canovai, R.; Cosci, F.; Rocchigiani, G.; Benelli, G.; Canale, A. Prevalence of the microsporidian Nosema ceranae in honeybee (Apis mellifera) apiaries in Central Italy. Saudi J. Biol. Sci. 2017, 24, 979–982.
- Cilia, G.; Flaminio, S.; Zavatta, L.; Ranalli, R.; Quaranta, M.; Bortolotti, L.; et al. Occurrence of honey bee (Apis mellifera L.) pathogens in wild pollinators in northern Italy. Front. Cell. Infect. Microbiol. 2022,12,907489.
- Bollan, K.A.; Hothersall, J.D.; Moffat, C.; Durkacz, J.; Saranzewa, N.; Wright, G.A.; Raine, N.E.; Highet, F.; Connolly, C.N. The microsporidian parasites Nosema ceranae and Nosema apis are widespread in honeybee (Apis mellifera) colonies across Scotland. Parasitol. Res. 2013, 112, 751–759.
- Murray, Z.L.; Lester, P.J. Confirmation of Nosema ceranae in New Zealand and a phylogenetic comparison of Nosema spp. strains.J. Apic. Res. 2015,54,101-104.
- Frazer, J.L.; Tham, K-M.; Reid, M.; van Andel, M.; McFadden, A.M.; Forsgren, E.; et al. First detection of Nosema ceranae in New Zealand honey bees.J. Apic. Res. 2022,54,358-365.
- Waters, T.L. The distribution and population dynamics of the honey bee pathogens Crithidia mellificae and Lotmaria passim in New Zealand.PhD thesis, Te Herenga Waka-Victoria University of Wellington,1t January 2018. Available online: https://openaccess.wgtn.ac.nz/(accessed on 23rd November 2021).
- Huang, W-F.; Jiang, J-H.; Chen, Y-W.; Wang, C-H. A Nosema ceranae isolate from the honeybee Apis mellifera. Apidologie. 2007,38,30-37.
- Gisder, S.; Hedtke, K.; Möckel, N.; Frielitz, M-C.; Linde, A.; Genersch, E. Five-year cohort study of Nosema spp. in Germany: does climate shape virulence and assertiveness of Nosema ceranae?. Appl. Environ. Microbiol. 2010,76,3032-3038.
- Forsgren, E.; Fries, I. Comparative virulence of Nosema ceranae and Nosema apis in individual European honey bees. Vet. Parasitol. 2010, 170, 212–217.
- Fenoy, S.; Rueda, C.; Higes, M.; Martín-Hernández, R.; Del Aguila, C. High-level resistance of Nosema ceranae, a parasite of the honeybee, to temperature and desiccation.Appl. Environ. Microbiol . 2009,75,6886-6889.
- Chen, Y-W.; Chung, W-P.; Wang, C-H.; Solter, L.F.; Huang, W-F. Nosema ceranae infection intensity highly correlates with temperature.J. Invertebr. Pathol. 2012,111,264-267.
- Cristian, M.A.; Dezmirean, D.S.; Mărghitaş la.; Moritz, R.F. Nosema apis and N. ceranae in Western honeybee (Apis mellifera)–geographical distribution and current methods of diagnosis. Bull. UASVM Anim. Sci. Biotechnol. 2011,68,1-2.
- Castagnino, G.L.B.; Mateos, A.; Meana, A.; Montejo, L.; Zamorano Iturralde, L.V.; Cutuli De Simón, M.T. Etiology, Symptoms and Prevention of Chalkbrood Disease: A Literature Review. Rev. Bras. De Saude E Prod. Anim. 2020, 21, e210332020.
- Wilson, W.T.; Nunamaker, R.A.; Maki, D. The occurrence of brood diseases and absence of the Varroa mite in honey bees from Mexico. Am. Bee J. 1984, 124, 51–53.
- Aronstein, K.A.; Murray, K.D. Chalkbrood disease in honey bees. J. invertebr. pathol. 2010,103,S20-S29.
- Paşca, C.; Mărghitaş, L.A.; Șonea, C.; Bobiş, O.; Buzura-Matei, I.A.; Dezmirean, D.S. A Review of Nosema cerane and Nosema apis: Characterization and Impact for Beekeeping. Bul. Univ. Agric. Sci. Vet. Med. Cluj-Napoca Anim. Sci. Biotechnol. 2019, 76, 77–87.
- Forsgren, E.; Locke, B.; Sircoulomb, F.; Schäfer, M.O. Bacterial Diseases in Honeybees. Curr. Clin. Microbiol. Rep. 2018, 5, 18–25.
- White, G.F. The Bacteria of the Apiary: With Special Reference to Bee Diseases; Technical Series; USDA, Bureau of Entomology: Washington, DC, USA, 1906; Volume 14, pp. 1–50GF.
- Ratnieks, F.L. American foulbrood: the spread and control of an important disease of the honey bee. Bee World. 1992,73,177-191.
- Lindström, A.; Korpela, S.; Fries, I. The distribution of PaeniBacillus larvae spores in adult bees and honey and larval mortality, following the addition of American foulbrood diseased brood or spore-contaminated honey in honey bee (Apis mellifera) colonies. J. Invertebr. Pathol. 2008, 99, 82–86.
- Otten, C. A general overview on AFB and EFB pathogen, way of infection, multiplication, clinical symptoms and outbreak. Apiacta 2003, 38, 106–113.
- Ricchiuti , L.; Rossi, F.; Del Matto, I.; Iannitto, G.; Del Riccio, A.L.; Petrone, D.; Ruberto, G.; Cersini, A.; Di Domenico, M.; Cammà, C. A study in the Abruzzo region on the presence of Paenibacillus larvae spores in honeys indicated underestimation of American foulbrood prevalence in Italy. J. Apic. Res. 2019, 58, 416–419.
- Alburaki, M.; Abban, S.K.; Evans, J.D.; Chen, Y.P. Occurrence and distribution of two bacterial brood diseases (American and European foulbrood) in US honey bee colonies and resistance to antibiotics from 2015 to 2022. J. Apic. Res. 2024,1-10.
- Neumann, P.; Elzen, P.J. The biology of the small hive beetle (Aethina tumida, Coleoptera: Nitidulidae): Gaps in our knowledge of an invasive species. Apidologie. 2004,35,229-247.
- Neumann, P.; Ellis, J.D. The small hive beetle (Aethina tumida Murray, Coleoptera: Nitidulidae): Distribution, biology and control of an invasive species. J. Apic. Res. 2008, 47, 180–183.
- Ellis, J.D.; Hepburn, H.R. An ecological digest of the small hive beetle (Aethina tumida), a symbiont in honey bee colonies (Apis mellifera). Insectes Sociaux 2006, 53, 8–19.
- Ellis, J.; Graham, J.; Mortensen, A. Standard methods for wax moth research. J. Apic. Res. 2013, 52, 1–17.
- Hosni, E.M.; Al-Khalaf, A.A.; Nasser, M.G.; Abou-Shaara, H.F.; Radwan, M.H. Modeling the Potential Global Distribution of Honeybee Pest, Galleria mellonella under Changing Climate. Insects 2022, 13, 484.
- Al Toufailia, H.; Alves, D.A.; De Bená, D.C.; Bento, J.M.S.; Iwanicki, N.S.A.; Cline, A.R.; Ellis, J.D.; Ratnieks, F.L.W. First record of small hive beetle, Aethina tumida Murray, in South America. J. Apic. Res. 2017, 56, 76–80.
- Lundie , A.E. The Small Hive Beetle Aethina Tumida; Department of Agriculture Forestry, Government Printer: Pretoria, South Africa, 1940.
- Thomas, M. Florida pest alert-the small hive beetle. Am. Bee J.1998,138: 565.
- Somerville, D. Study of the small hive beetle in the USA: a report for the Rural Industries Research and Development Corporation. Rural Industries Research and Development Corporation. NSW Agriculture, Goulburn, Australia.2003.
- Strauss, U.; Human, H.; Gauthier, L.; Crewe, R.M.; Dietemann, V.; Pirk, C.W.W. Seasonal prevalence of pathogens and parasites in the savannah honeybee (Apis mellifera scutellata). J. Invertebr. Pathol. 2013, 114, 45–52.
- Lawal, A.; Oyerinde, A.; Asala, S.; Anjorin, T. The incidence and management of pest affecting honeybees in Nigeria. Global Journal of Bio-science and Biotechnology. 2020,9,40-44.
- Jamal , Z.A.; Abou-Shaara, H.F.; Qamer, S.; Alhumaidi Alotaibi, M.; Ali Khan, K.; Fiaz Khan, M.; Amjad Bashir, M.; Hannan, A.; AL-Kahtani, S.N.; Taha, E.-K.A.; et al. Future Expansion of Small Hive Beetles, Aethina Tumida, towards North Africa and South Europe Based on Temperature Factors Using Maximum Entropy Algorithm. J. King Saud Univ. Sci. 2021, 33, 101242.
- Bernier, M.; Fournier, V.; Giovenazzo, P. Pupal Development of Aethina tumida (Coleoptera: Nitidulidae) in Thermo-Hygrometric Soil Conditions Encountered in Temperate Climates. J. Econ. Entomol. 2014, 107, 531–537.
- Aglagane, A.; Carra, E.; Ravaioli, V.; Er-Rguibi, O.; Santo, E.; Mouden, E.H.E.; et al. Molecular examination of nosemosis and foulbrood pathogens in honey bee populations from southeastern Morocco. Apidologie. 2023,54:42.
- de León-Door, A.P.; Pérez-Ordóñez, G.; Romo-Chacón, A.; Rios-Velasco, C.; Órnelas-Paz, J.D.J.; Zamudio-Flores, P.B.; Acosta-Muñiz, C.H. Pathogenesis, epidemiology and variants of Melissococcus plutonius (ex White), the causal agent of European foulbrood. J. Apic. Sci. 2020, 64, 173–188.
- Forsgren, E.; Lundhagen, A.C.; Imdorf, A.; Fries, I. Distribution of Melissococcus plutonius in honeybee colonies with and without symptoms of European foulbrood. Microbiol. Ecol. 2005,50,369-374.
- Asif Aziz, M.; Alam, S. Diseases of honeybee (Apis Mellifera). In Melittology—New Advances; IntechOpen: London, UK, 2024.
- Sturtevant, A.P. Mixed infection in the brood diseases of bees. J. Econ. Entomol. 1921,14,127-134.
- Stephan, J.G.; de Miranda, J.R.; Forsgren, E. American foulbrood in a honeybee colony: Spore-symptom relationship and feedbacks between disease and colony development. BMC Ecol. 2020, 20, 16.
- Ongus, J.R.; Irungu, J.; Raina, S. Correlation between Pest Abundance and Prevalence of Honeybee Pathogens at Selected Apiaries in Kenya, 2013/2014. J. Environ. Earth Sci. 2017,7, 2225-0948. 109. Schäfer, M.O.; Ritter, W.; Pettis.;Neumann, P. Small hive beetles, Aethina tumida, are vectors of Paenibacillus larvae. Apidologie. 2010;41:14-20.
- Özkırım , A.; Schiesser, A.; Keskin, N. Dynamics of Nosema apis and Nosema ceranae co-infection seasonally in honey bee (Apis mellifera L.) colonies. J. Apic. Sci. 2019, 63, 41–48.
- Milbrath , M.O.; van Tran, T.; Huang, W.F.; Solter, L.F.; Tarpy, D.R.; Lawrence, F.; Huang, Z.Y. Comparative virulence and competition between Nosema apis and Nosema ceranae in honey bees (Apis mellifera). J. Invertebr. Pathol. 2015, 125, 9–15.
- Martín-Hernández, R.; Botías, C.; Bailón, E.G.; Martínez-Salvador, A.; Prieto, L.; Meana, A.; Higes, M. Microsporidia infecting Apis mellifera: Coexistence or competition. Is Nosema ceranae replacing Nosema apis?. Environ. Microbiol. 2012, 14, 2127–2138.
Figure 1.
Representative agarose gel electrophoresis of PCR products amplified from honey eDNA by specific primer pairs for honey bee pathogens and pests. (A) PCR products amplified for the Apis mellifera, Paenibacillus larvae, Melissococcus plutonius, Ascosphaera apis, Nosema apis, and Nosema ceranae from honey samples 104 to 110, with the corresponding size shown in brackets. (B) PCR products amplified for the Apis mellifera, Aethina tumida, and Galleria mellonella from honey samples 125 to 131 with the corresponding size shown in brackets. The lanes included a 100-base pair (bp) DNA ladder (L), a synthetic plasmid containing the gene target of the test pathogen or pest as a positive control (+ve), and nuclease-free water as no template control (NTC).
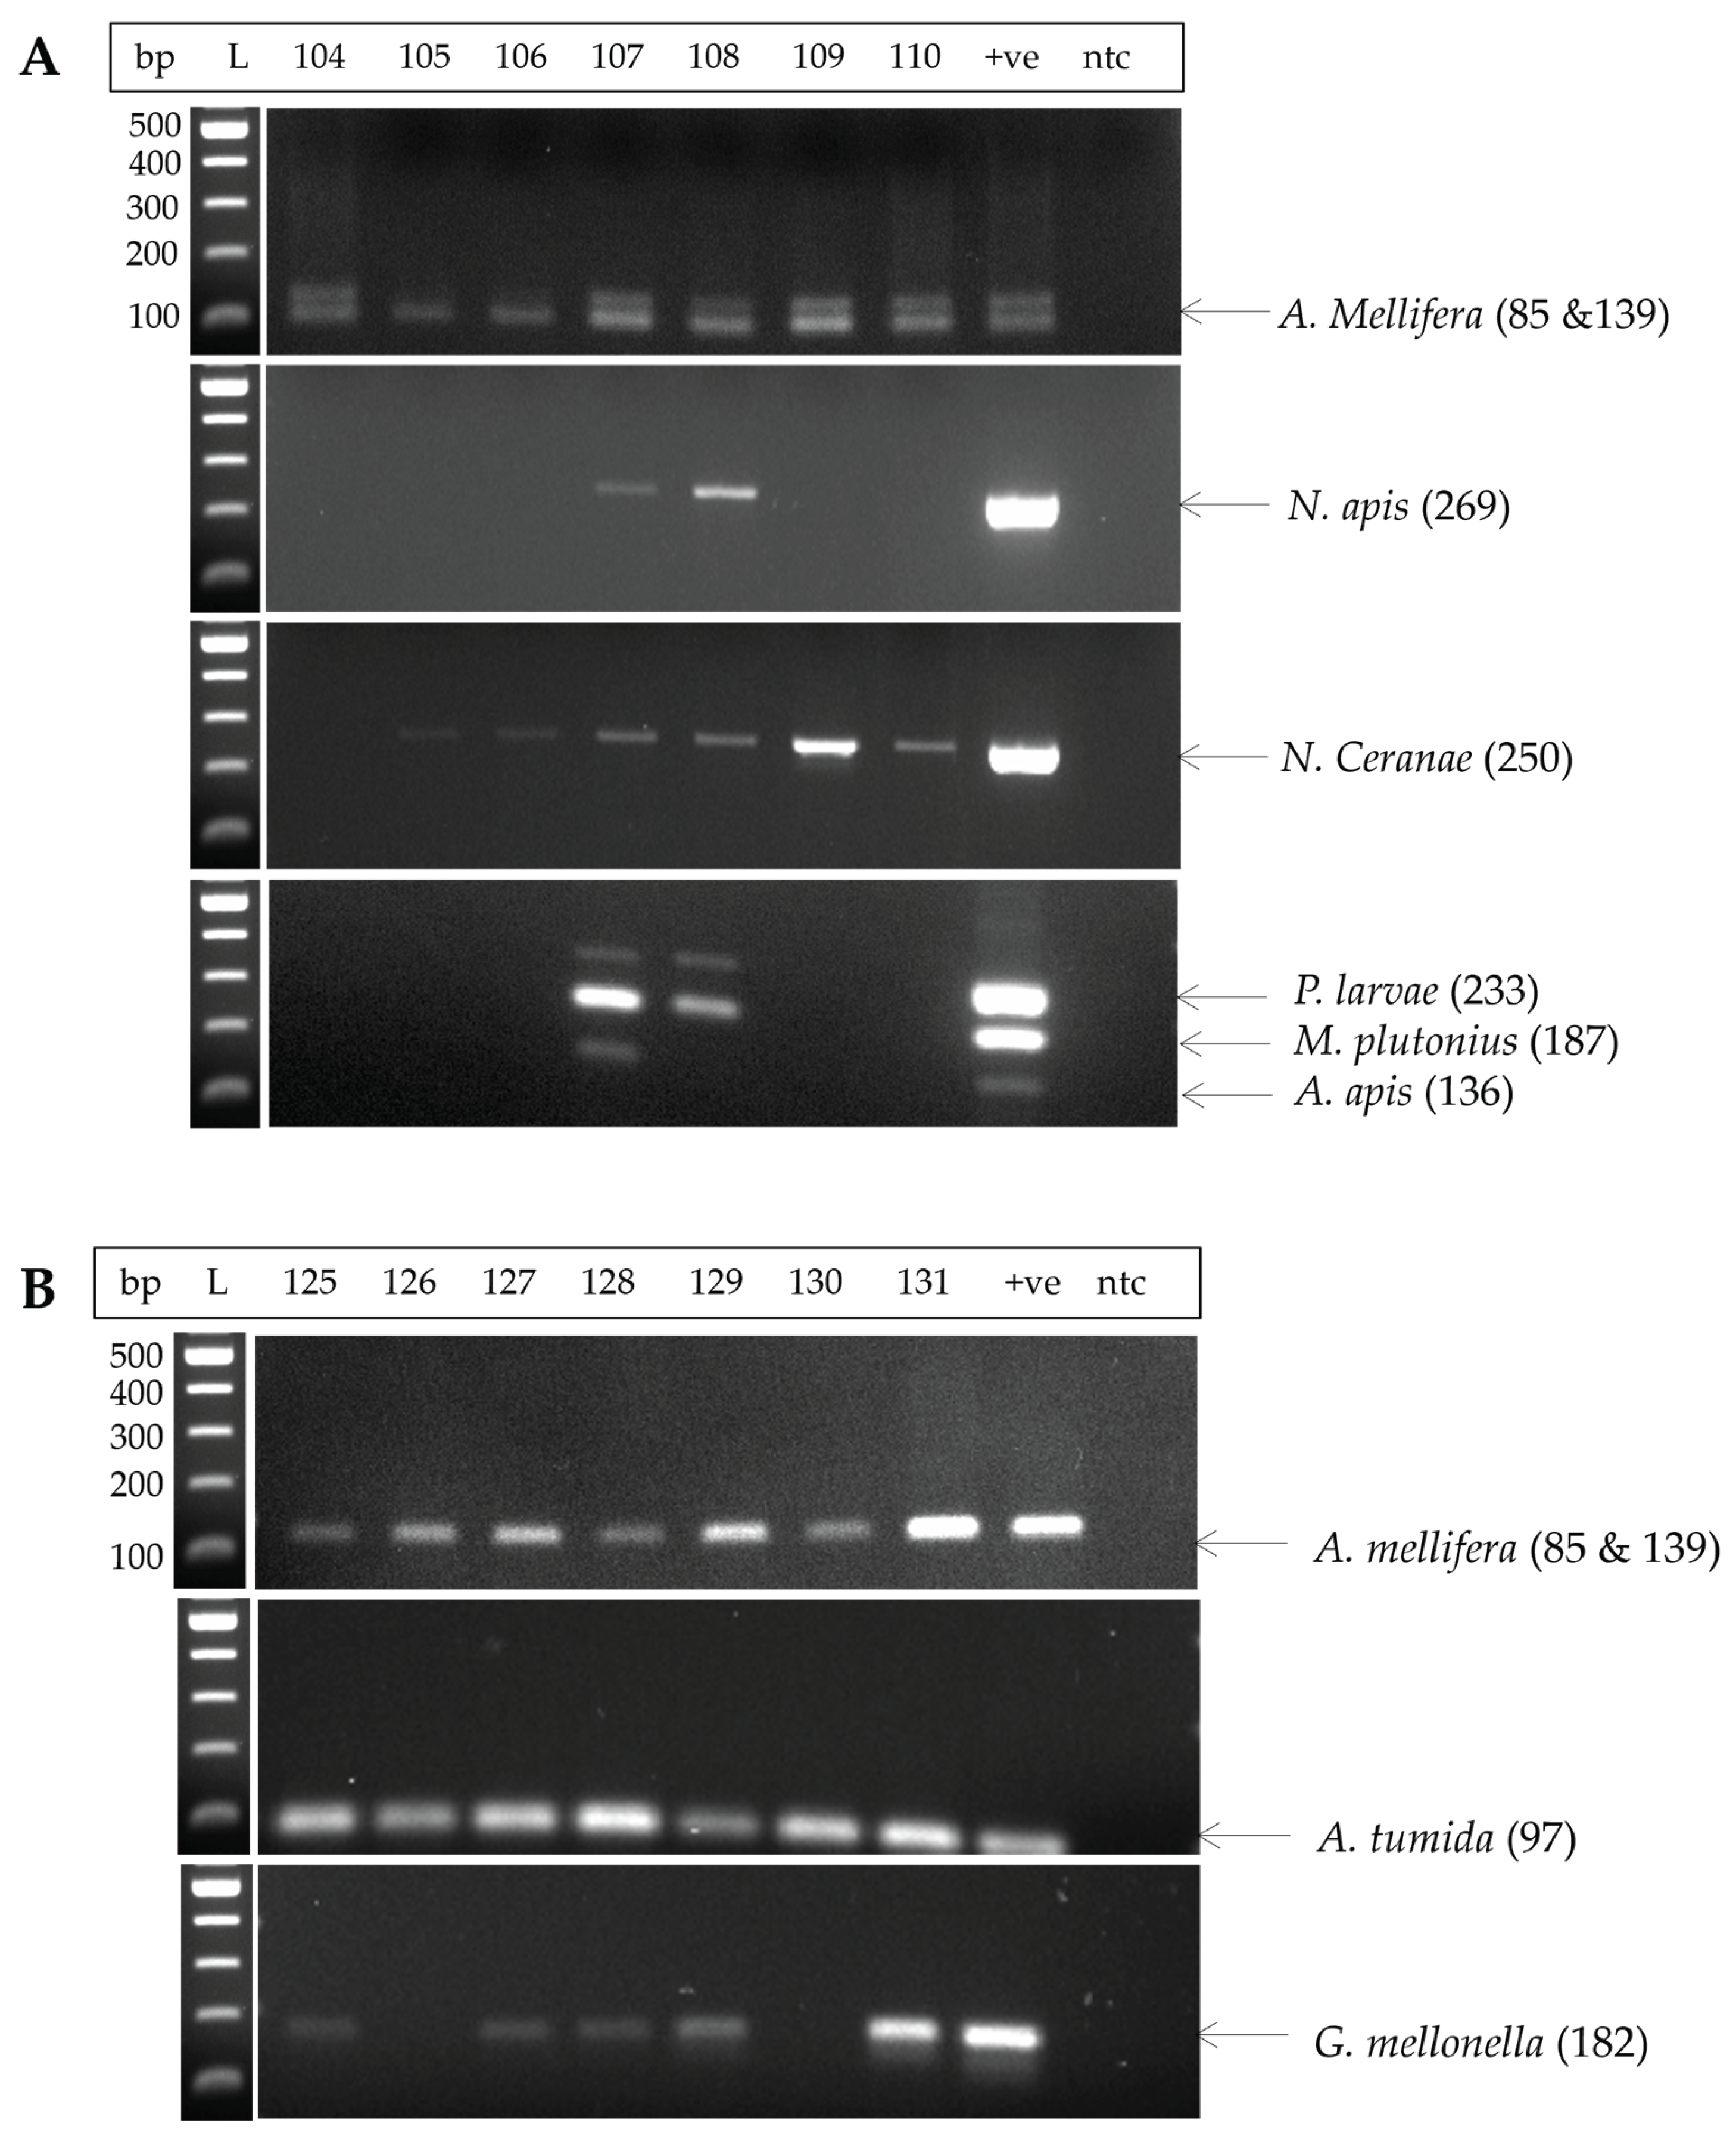
Figure 2.
Honey bee pathogen and pest prevalence surveyed in 2013-2015 [2] and this study (2022-2024).
Figure 2.
Honey bee pathogen and pest prevalence surveyed in 2013-2015 [2] and this study (2022-2024).
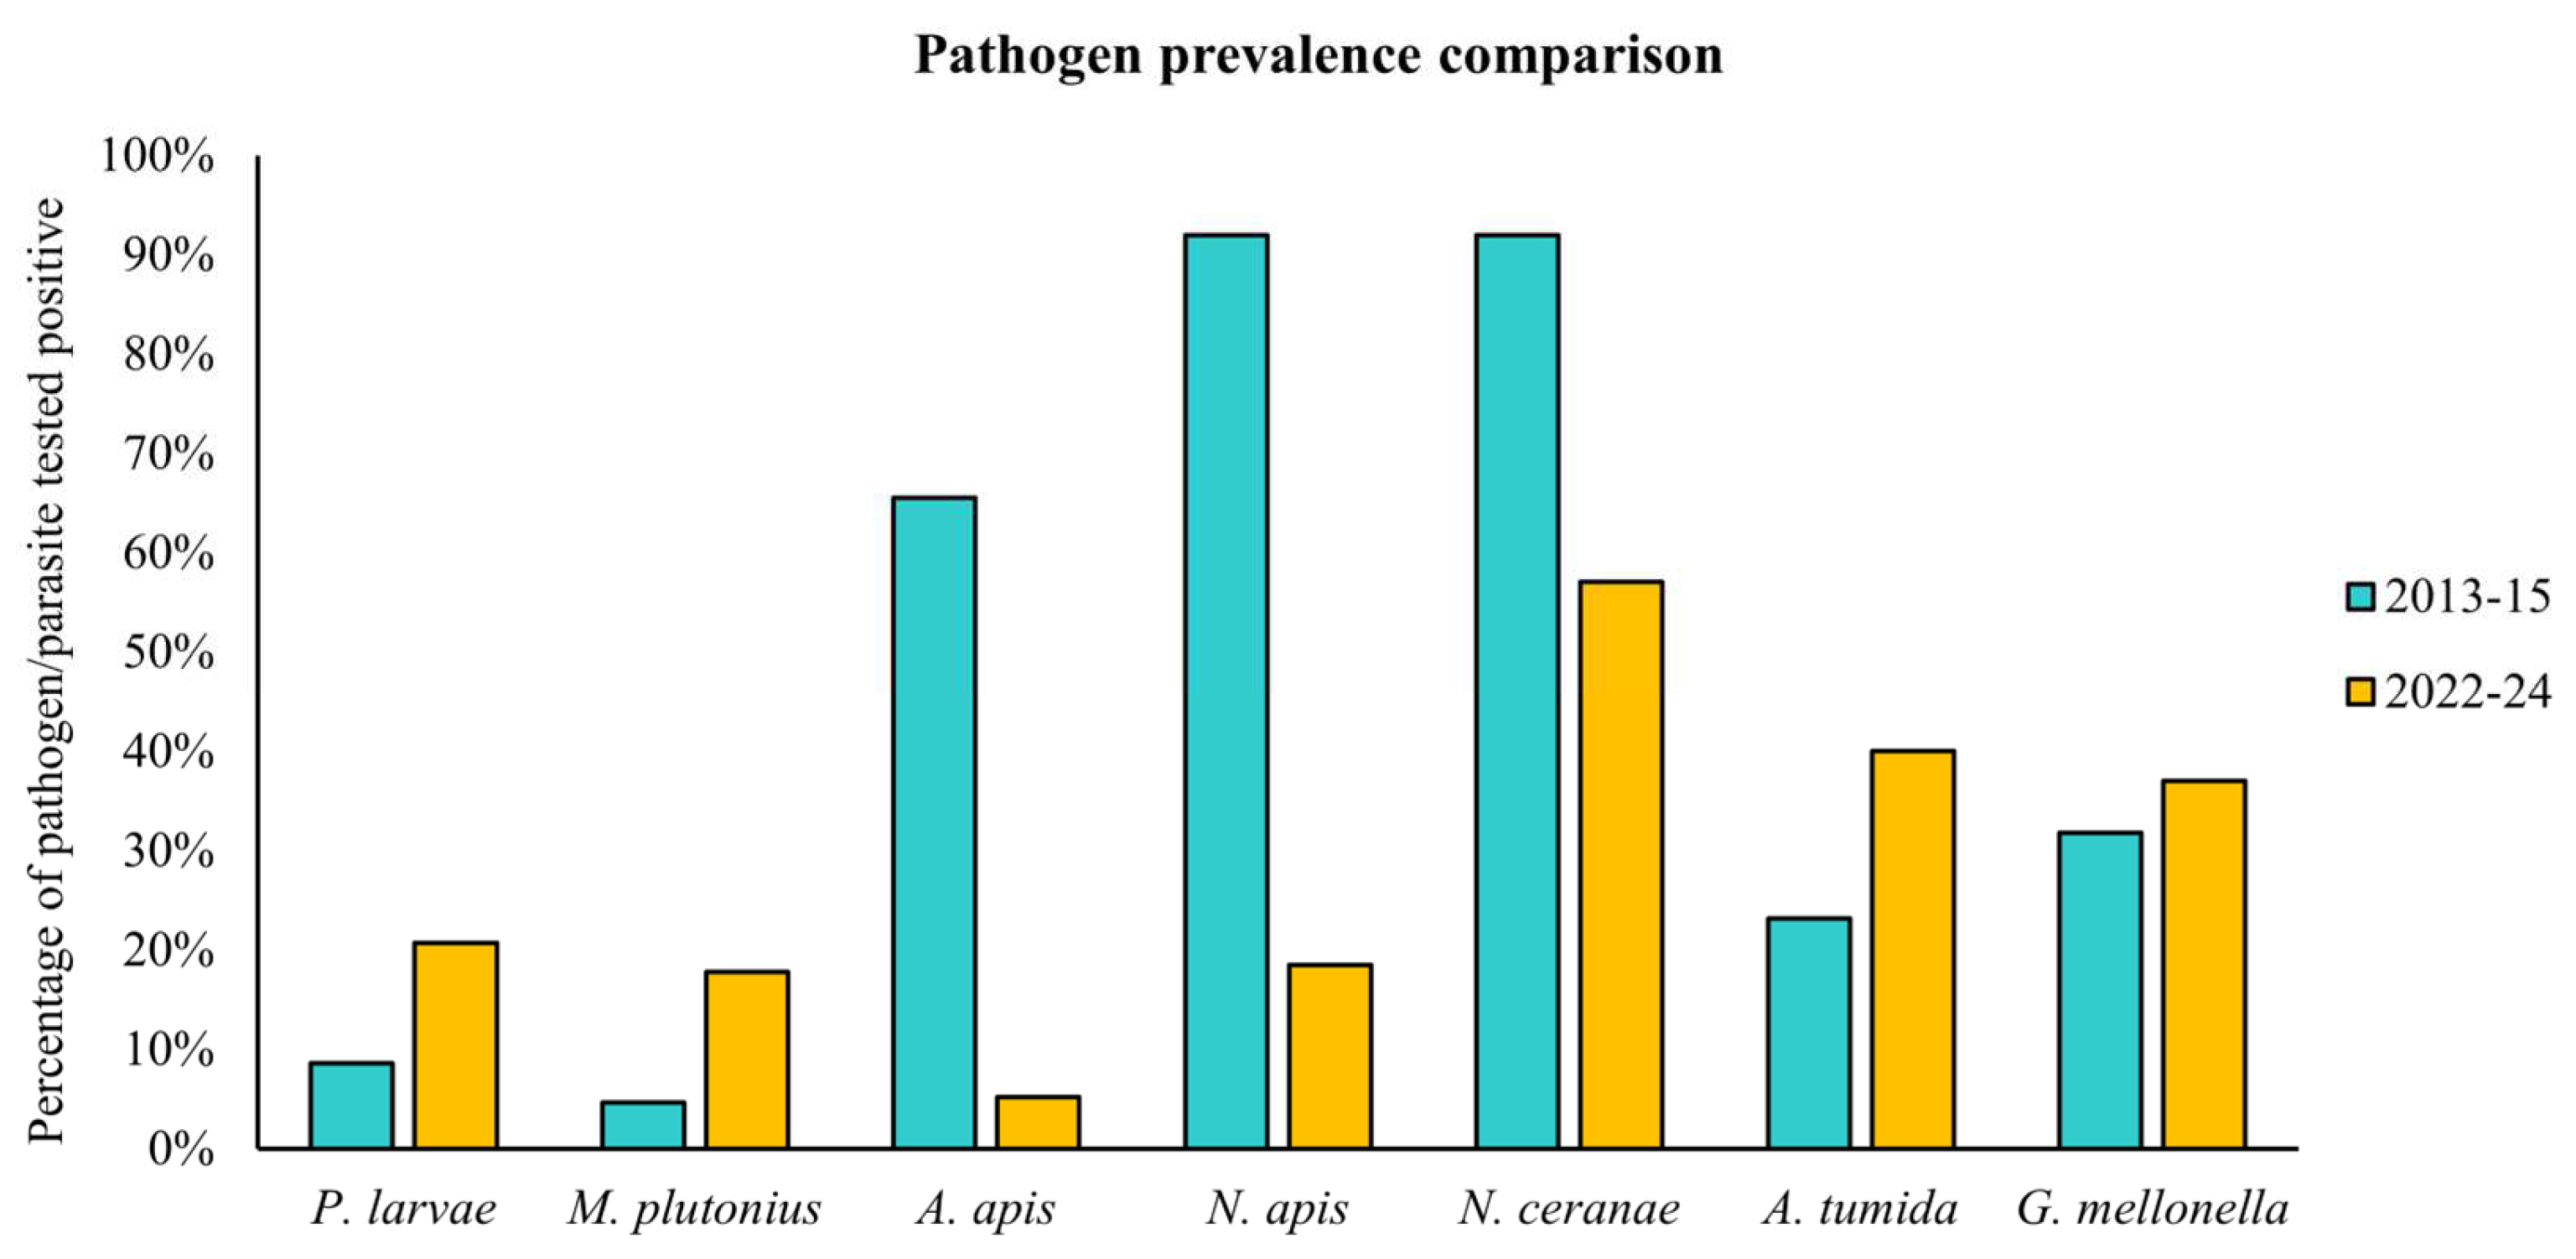
Figure 4.
Distribution and co-occurrence of pathogens in a honey sample. A) The bar graph shows the distribution of tested pathogens across various honey samples. Each bar represents the number of pathogens detected in the analyzed honey samples, enabling the comparison of pathogen frequency among the samples. B) Heat map illustrating co-occurrence of pathogen pairs. The color gradient reflects the strength of co-occurrence association among the pathogens (-0.02 to 0.08); a darker red signifies a stronger positive co-occurrence, while a darker blue indicates a strong negative co-occurrence association. This association is evaluated using effect-size metrics (Supplementary Table S3). * Indicates that pathogens tend to co-occur more frequently than expected, showing a statistically significant positive association (p_gt < 0.05), with the strength of the association varying from weak to strong depending on the effect size. The heat map is represented by a mirrored imaging pattern (13 pairs).
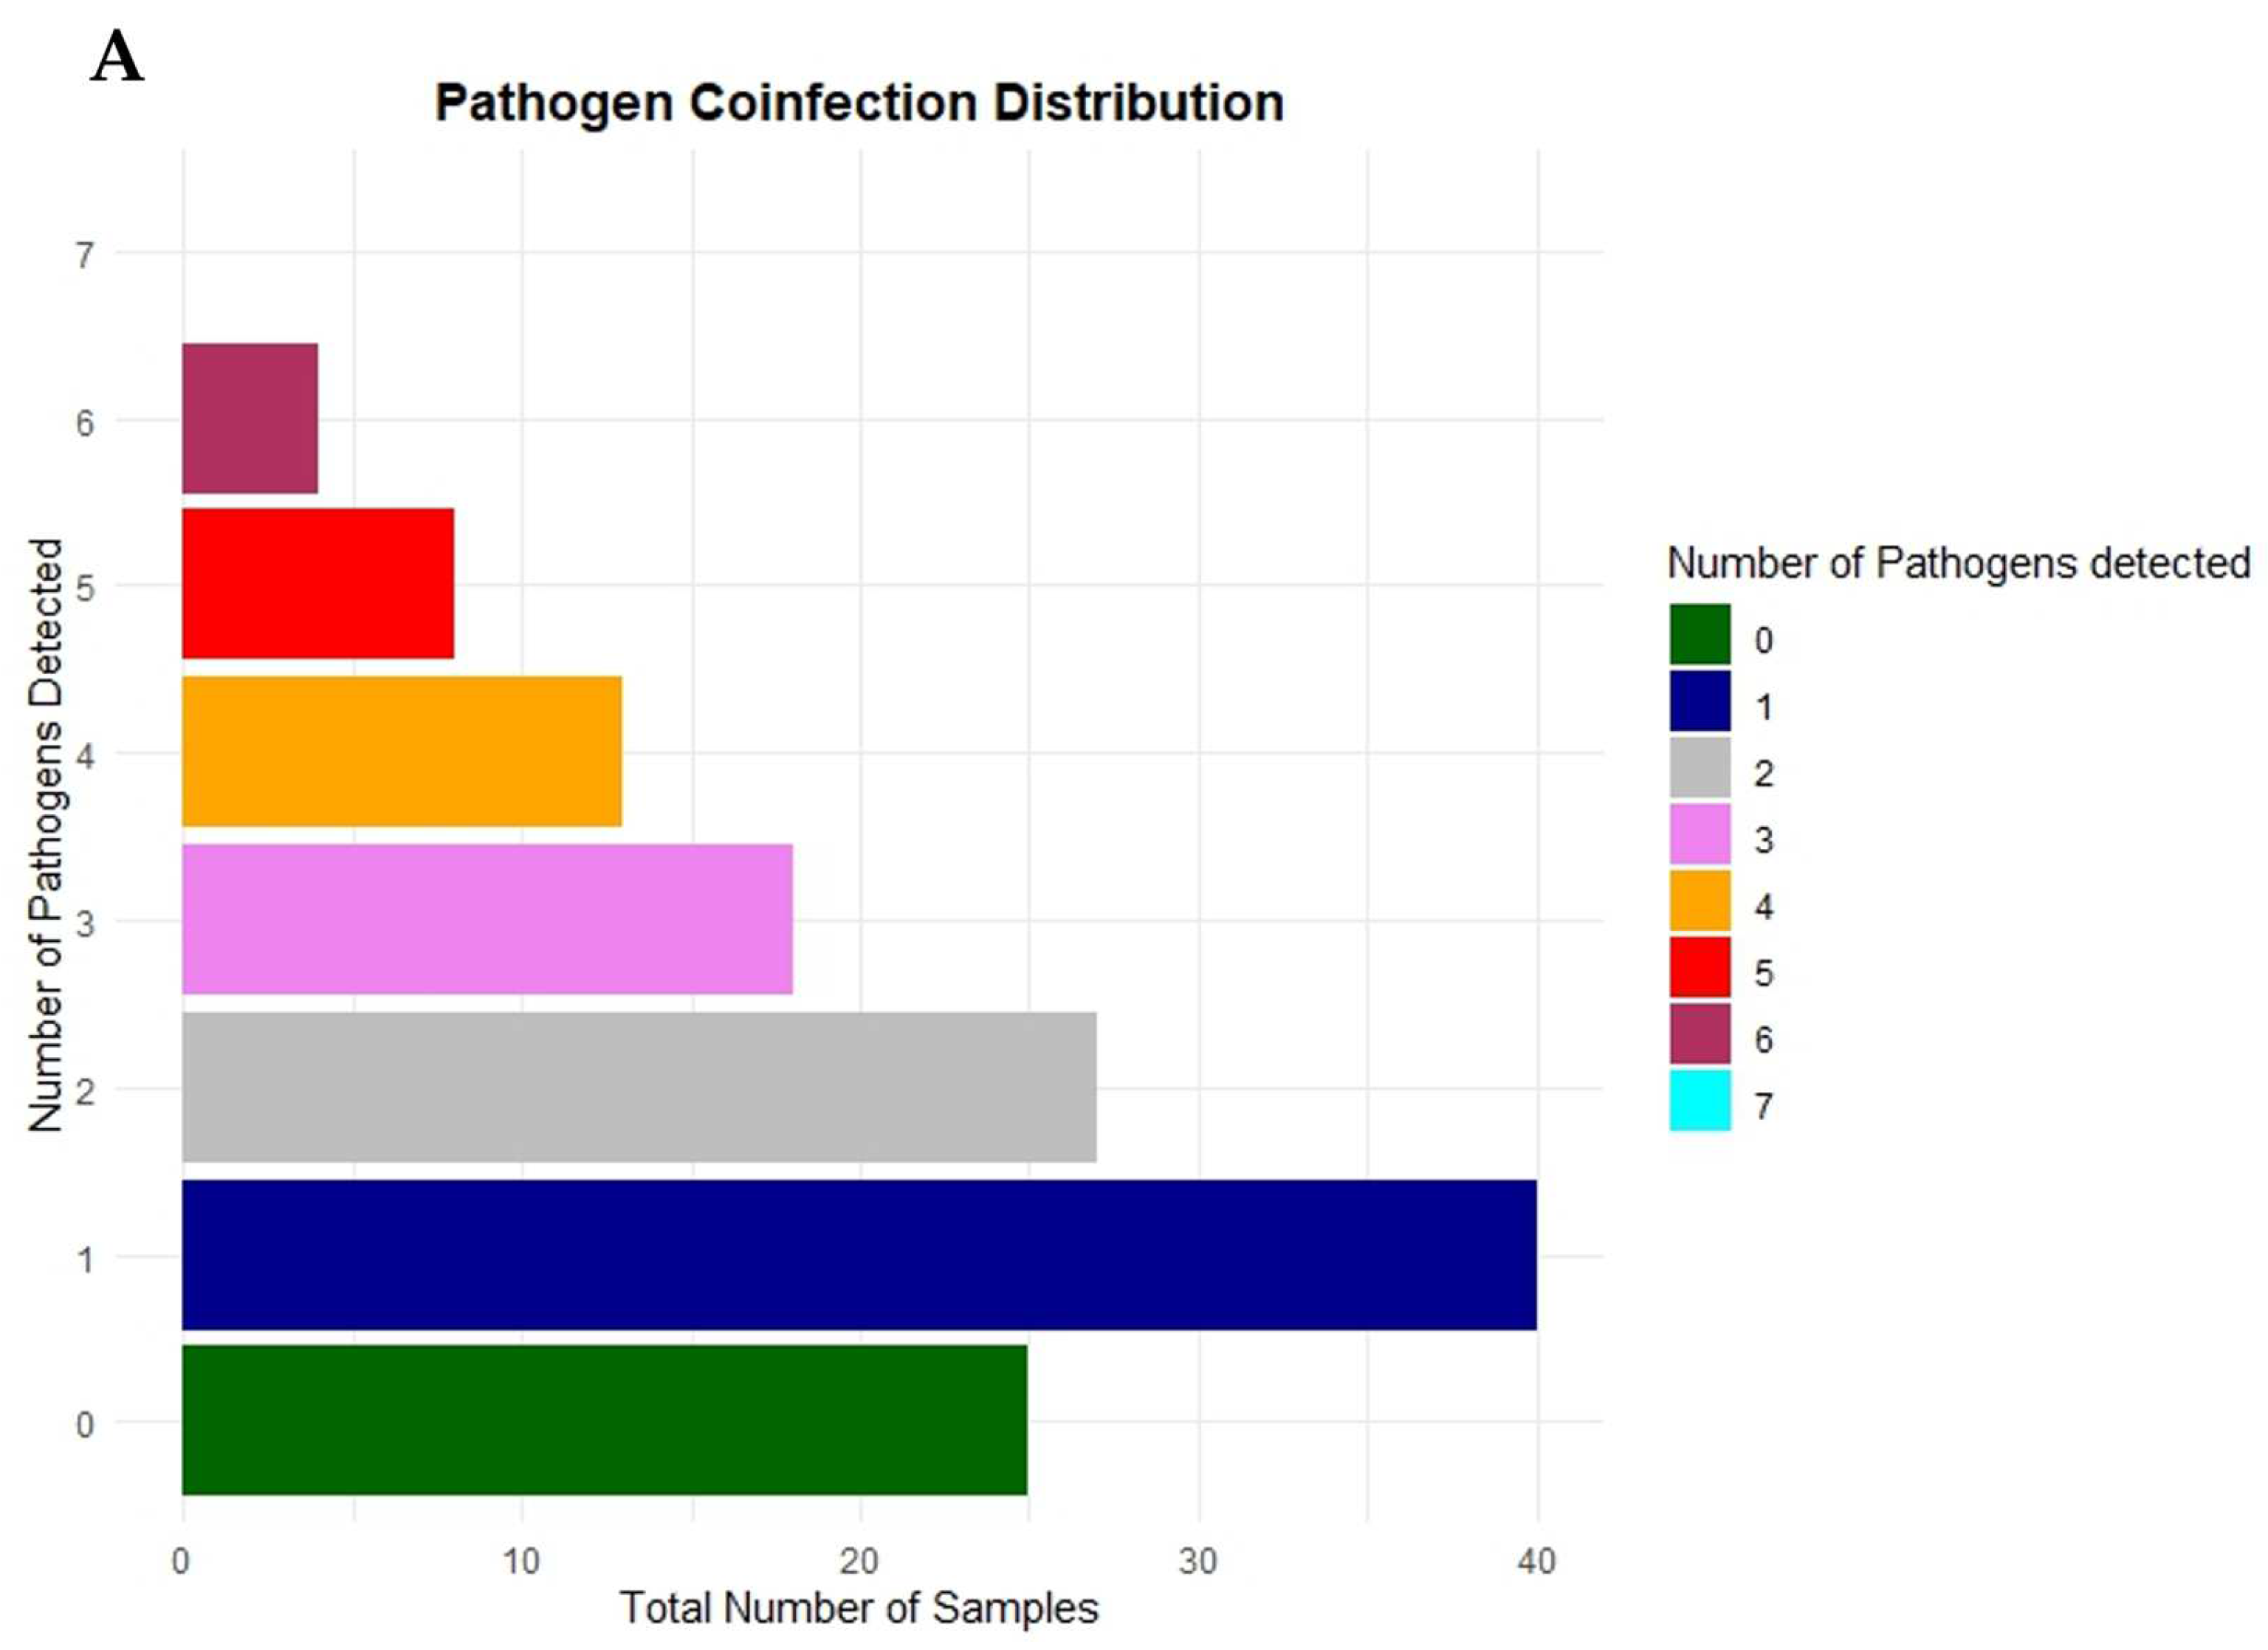
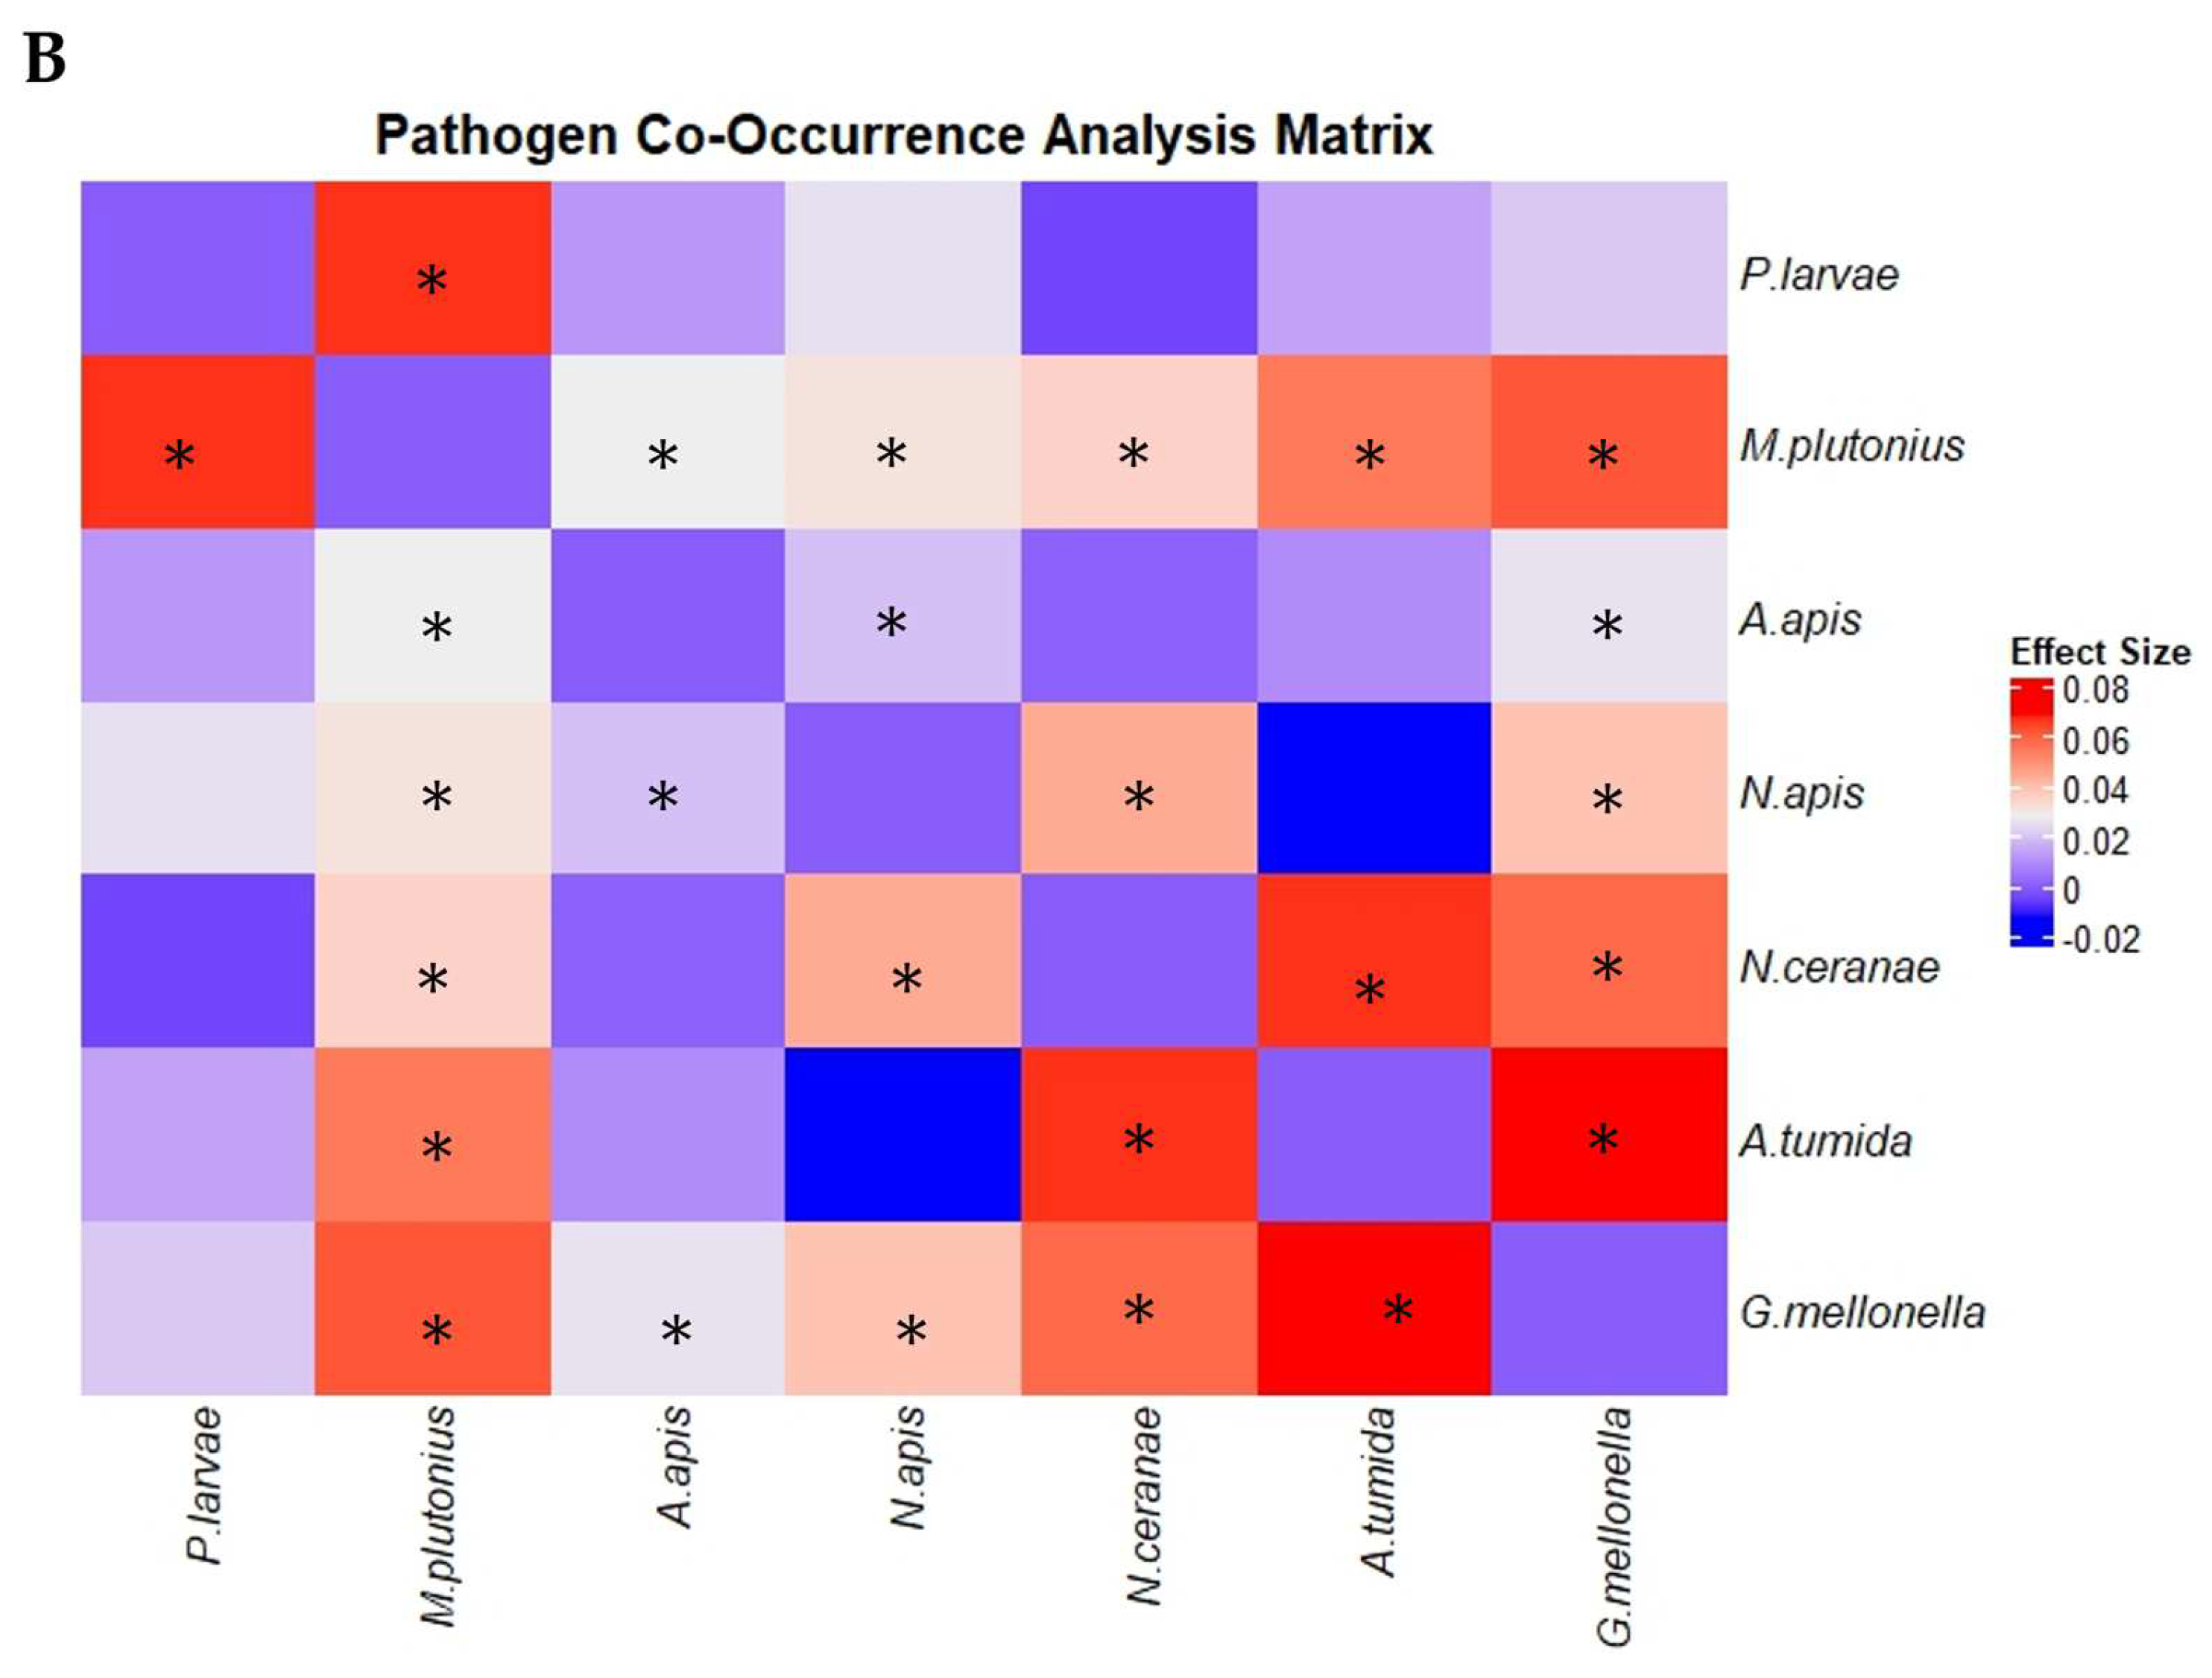
Table 3.
Distribution of bacterial pathogens P. larvae and M. plutonius across different states in Australia.
Table 3.
Distribution of bacterial pathogens P. larvae and M. plutonius across different states in Australia.
| State | No. of samples | Samples positive for P. larvae | % of positive samples | Samples positive for M. plutonius | % of positive samples |
| Victoria | 27 | 9 | 33% | 10 | 37% |
| New South Wales | 29 | 8 | 28% | 4 | 14% |
| Queensland | 24 | 5 | 21% | 3 | 13% |
| Northern Territory | 1 | 0 | 0% | 0 | 0% |
| West Australia | 22 | 3 | 14% | 0 | 0% |
| South Australia | 14 | 0 | 0% | 4 | 29% |
| Kangaroo Island* | 6 | 0 | 0% | 0 | 0% |
| Tasmania | 12 | 3 | 25% | 3 | 25% |
| Total | 135 | 28 | 21% | 24 | 18% |
* Although Kangaroo Island is part of South Australia, data is shown for KI due to its unique honey bee population.
Table 4.
Distribution of fungal pathogens of honey bees across different states in Australia.
| State | No. of samples | Samples positive for A. apis | % of positive samples | Samples positive for N. apis | % of positive samples | Samples positive for N. ceranae | % of positive samples |
| Victoria | 27 | 1 | 4% | 5 | 19% | 19 | 70% |
| New South Wales | 29 | 2 | 7% | 3 | 10% | 17 | 59% |
| Queensland | 24 | 0 | 0% | 0 | 0% | 14 | 58% |
| NorthernTerritory | 1 | 0 | 0% | 0 | 0% | 1 | 100% |
| West Australia | 22 | 0 | 0% | 5 | 23% | 10 | 45% |
| South Australia | 14 | 0 | 0% | 2 | 14% | 9 | 64% |
| Kangaroo Island* | 6 | 0 | 0% | 3 | 50% | 1 | 17% |
| Tasmania | 12 | 4 | 33% | 7 | 58% | 6 | 50% |
| Total | 135 | 7 | 5.% | 25 | 19% | 77 | 57% |
* Although Kangaroo Island is part of South Australia, data is shown for KI due to its unique honey bee population.
Table 5.
Distribution of pests A. tumida and G. mellonella of honey bee hives across different states in Australia.
Table 5.
Distribution of pests A. tumida and G. mellonella of honey bee hives across different states in Australia.
| State | No. of samples | Samples positive for A. tumida | % of positive samples | Samples positive for G. mellonella | % of positive samples |
| Victoria | 27 | 15 | 56% | 12 | 44% |
| New South Wales | 29 | 9 | 31% | 3 | 10% |
| Queensland | 24 | 17 | 71% | 6 | 25% |
| Northern Territory | 1 | 0 | 0% | 0 | 0% |
| West Australia | 22 | 1 | 5% | 10 | 45% |
| South Australia | 14 | 8 | 57% | 8 | 57% |
| Kangaroo Island* | 6 | 0 | 0% | 0 | 0% |
| Tasmania | 12 | 4 | 33% | 10 | 83% |
| Total | 135 | 54 | 40% | 49 | 37% |
* Although Kangaroo Island is part of South Australia, data is shown for KI due to its unique honey bee population.
Disclaimer/Publisher’s Note: The statements, opinions and data contained in all publications are solely those of the individual author(s) and contributor(s) and not of MDPI and/or the editor(s). MDPI and/or the editor(s) disclaim responsibility for any injury to people or property resulting from any ideas, methods, instructions or products referred to in the content. |
© 2025 by the authors. Licensee MDPI, Basel, Switzerland. This article is an open access article distributed under the terms and conditions of the Creative Commons Attribution (CC BY) license (http://creativecommons.org/licenses/by/4.0/).
Copyright: This open access article is published under a Creative Commons CC BY 4.0 license, which permit the free download, distribution, and reuse, provided that the author and preprint are cited in any reuse.


