
Submitted:
02 September 2025
Posted:
03 September 2025
You are already at the latest version
Abstract
The investigation of alternatives for the management of breast cancer (BC), has led to the study of extracts of plant origin and their compounds, within these, the extracts of oregano variants and carvacrol (Cv) have shown promising results, however, the Mexican oregano (L. graveolens) infusion (MoI) has not been studied, so the aims of this work are; to characterize the plant used, and to compare against Cv, the impact on the metabolism and cytotoxicity of BC cell lines. Within the characterization of the plant, moisture, ash, protein, available carbohydrates, ethereal extraction and dietary fiber were determined, additionally, for the MoI characterization antioxidant capacity analysis; ABTS, DPPH, phenols, flavonoids and Ferric reducing antioxidant power (FRAP) were carried, as well as Fourier-transform infrared spectroscopy (FTIR) and high performance liquid chromatography (HPLC) to evaluate the composition of the extract, for anticancer activity 3-(4,5-dimethylthiazol-2-yl)-2,5-diphenyltetrazolium bromide assays (MTT) and lactate dehydrogenase (LDH) were performed. The results demonstrated that MoI possesses potent antioxidant activity and antiproliferative effect against BC cell lines, with lower cytotoxicity on non-cancer cells compared to Cv. However, both the infusion and Cv caused a reduction in cell metabolism, with Cv having the most acute effect. Thus, the present investigation provides evidence on the efficacy of these alternative treatments in BC cell lines, including aggressive subtypes such as triple negative (TN).
Keywords:
Mexican oregano
; anticancer agents
; alternative treatments
; breast cancer triple negative
; antioxidant capacity
; plant extracts
; isolated compounds
1. Introduction
Cancer is a broad term encompassing a group of diseases characterized by uncontrolled growth and proliferation of abnormal cells, resulting from genetic or epigenetic alterations that disrupt cell cycle regulation. These malignant cells can invade adjacent tissues and organs and, in advanced stages, metastasize to distant sites through the bloodstream or lymphatic system. BC originates in mammary tissues and primarily affects the lobules, responsible for milk production, the ducts that transport milk to the nipple, or the connective tissue that provides structural support. Most cases arise in the ducts or lobules and have the potential to spread via blood and lymphatic vessels. According to the Global Cancer Observatory, BC accounted for 2,296,840 cases worldwide in 2022, representing 11.5% of all cancer diagnoses. It was also the leading cause of cancer-related mortality among women, with 666,103 deaths (15.4%). These statistics underscore its significant global burden [1,2,3].
In 2000, Perou et al. proposed a molecular classification of BC based on the expression of three key receptors critical for conventional treatment efficacy: estrogen receptor (ER), progesterone receptor (PR), and human epidermal growth factor receptor 2 (HER2). This classification defines four molecular subtypes with distinct therapeutic responses: Luminal A (ER+ and PR+/-), Luminal B (ER+, PR+/- and HER2+), HER2-enriched (HER2+), and TN (ER-, PR- and HER2-) [4]. Among these, TN is clinically recognized as the most aggressive subtype due to its poor response to conventional therapies, leading to lower overall survival and disease-free survival rates [4,5,6].
Natural products have played a fundamental role in traditional medicine throughout history. Since the World Health Organization endorsed the use of complementary therapies in 2004, interest in herbal medicine and the development of phytochemical-based anticancer agents has grown significantly. Bioactive compounds derived from plants have gained recognition for their potential in cancer treatment [7,8,9]. Cv is a monoterpenoid phenol synthesized via the mevalonate pathway from acetyl-coenzyme A, which has attracted attention for its anticancer properties. It one of the predominant compounds in oregano extracts [10,11,12]. Lippia graveolens, commonly known as Mexican oregano, is used as condiment of many traditional Mexican dishes as well as raw material to produce cosmetics, drugs, and liquors. Oregano variants have been reported to have antioxidant potential and anti-inflammatory activity; these properties are attributed to their phytochemical profile, mainly to its phenolic compounds [13,14].
However, limited evidence exists regarding the composition, antioxidant capacity, and anticancer potential of aqueous extracts from oregano variants, leaving a gap in knowledge about the bioactivity of MoI. Therefore, the aims of this study was, first, to characterize an endemic species of Mexican oregano (Lippia graveolens) from Totatiche, Jalisco, Mexico, as well as to evaluate the antioxidant capacity of the MoI prepared with this plant sample with different tests (ABTS, DPPH, total phenols, total flavonoids and FRAP) and second, to compare the anticancer effects of Cv and the MoI at the level of cell metabolism and cytotoxicity against BC cell lines, luminal A (MCF-7), HER2-enriched (HCC-1954) and TN (MDA-MB-231), also, these tests were performed on HaCaT cells (immortalized keratinocytes that do not express oncogenes) to evaluate the effects of both treatments on non-cancerous cells.
2. Materials and Methods
2.1. Chemical and Reagents
Cv ≥98% purity (499-75-2) and dimethyl sulfoxide (DMSO, D8418), was purchased from Sigma Aldrich (St Louis, MO, USA). Dulbecco’s Modified Eagle Medium (DMEM, 11966025) Roswell Park Memorial Institute (RPMI-1640, 11875119), phosphate buffered saline (PBS, 10010023), fetal bovine serum (FBS,16140071), penicillin/ streptomycin (15140122), MTT (6494), and trypsin (25300054) were purchased from Thermo Fisher ScientificTM (Waltham, MA, USA). All solvents and chemicals were of an analytical grade.
2.2. Cell Lines and Culture Conditions
Cell lines were purchased from American Type Culture Collection (ATCC; Manassas, VA, USA). Human keratinocyte transformed and immortalized HaCaT cells and TN BC MDA-MB-231 cells were maintained in RPMI-1640, luminal A MCF-7 and HER2 HCC-1954 BC cell lines were maintained in DMEM, both mediums were supplemented with 10% FBS and 1% of penicillin/ streptomycin. The cell cultures were kept in incubation under physiological conditions (37 °C, 95% humidity and 5% CO2 saturation).
2.3. Plant Material
The oregano used in this study is an endemic species from the region of Totatiche, Jalisco, Mexico.
2.4. Bromatological Analysis of L. graveolens
The chemical composition of the dried leaves of L. graveolens was determined by measuring moisture, ash, protein, fat, available carbohydrates, dietary fiber and energy content, in duplicate, following the Normas Oficiales Mexicanas and the methods of the Association of Official Analytical Chemists (AOAC). Moisture content, calcination residue and dietary fiber were determined by conventional gravimetric methods, using 5 g of sample for the first two determinations and 10 g for the dietary fiber analysis [15,16,17]. Crude protein content was determined by the modified Kjeldahl method, using 0.5 g of sample [18]. Crude fat content was evaluated from 1 and 2 g of sample by the Soxhlet extraction method [19]. Reducing carbohydrates were determined from 10 and 15 g of sample using the volumetric method with Fehling's solution according to NOM-086-SSA1-1994 [20]. Energy content (kcal) was calculated according to the AOAC method of analysis for nutrition labeling, using general factors [21].
2.5. Aqueous Extraction of Mexican Oregano (Lippia graveolens Kunth)
To prepare the extract, 3 mL of injectable water was heated to boiling. After removing from heat, 69 mg of ground oregano leaves were added. The mixture was covered with aluminum foil to prevent loss of volatiles and left at room temperature for 10 min. It was then filtered through a 0.22 µm syringe filter and stored in a microtube for analysis.. Based on the weight/volume of the infusion (69 mg/3 mL), all the tests performed in this work refer to it as mg/ mL.
2.6. Preparation of Cv Solution
Cv isolate was mixed with DMSO (<0.05% final concentration) and culture medium to obtain a 1000µM solution.
2.7. Antioxidant Activity Protocols (DPPH and ABTS) in MoI
In brief, a total of 225 μL of ABTS (2,2´-azinobis-3-ethylbenzothiazoline-6-sulfonic acid) solution was placed in each microplate well, and an initial reading was taken at 734 nm, which served as the initial absorbance datum. Subsequently, 75 μL of 1:1000 diluted MoI (with deionized water) was added, and the microplate was incubated for 5 minutes with stirring. After which, the absorbance was measured at 734 nm. A Trolox (6-hydroxy-2,5,7,8-tetramethylchroman-2-carboxylic acid) standard curve was performed to express the results as mMEQ Trolox per gram of dried sample.
For the DPPH (1,1diphenyl-2-picrylhydrazyl) method, 150 µL of the 1:1000 diluted MoI (with deionized water) was placed in a 96-well plate, and 150µL of 1010 µM methanolic solution of DPPH was added and allowed to react in the dark at room temperature for 30 minutes. A Trolox standard curve was performed to express the results as mMEQ Trolox per gram of dried sample. The absorbance was measured at 517 nm (BioTek-SynergyHTX, Winooski, VE, USA).
2.8. Determination of Total Phenolic Content in MoI
This was performed using the Folin–Ciocalteu reaction. Total phenolic content of MoI was determined by the Folin–Ciocalteu method. 200 μL of distilled water were mixed with 250 μL of Folin-Ciocalteu solution (1 N) and 50 μL of MoI (1:10) or different concentrations (20–180 g/mL) of gallic acid (used as standard) were tested. Further, after incubation for 5 minutes at room temperature, 500 µL of sodium carbonate solution (15% Na2CO3) was added and the solution was mixed thoroughly and incubated for 15 minutes in the dark at 45ºC. 200 μL of each reaction were measured at 760 nm (BioTek-SynergyHTX, Winooski, VE, USA). All results were expressed as milligram of Gallic Acid Equivalent per gram of dried sample (mgGAE/g).
2.9. Determination of Total Flavonoids in MoI
Briefly, 100 µL of MoI was mixed with 200 µL of 1M potassium acetate, 200 µL of aluminum chloride solution (10% AlCl₃) and 500 µL of 80% ethanol. The mixture was shaken vigorously and incubated for 40 minutes at room temperature. The absorbance was measured at a wavelength of 415 nm (BioTek-SynergyHTX, Winooski, VE, USA). A calibration curve was performed with quercetin as standard. The result was expressed as mg Eq quercetin/g dry weight of oregano.
2.10. FRAP in MoI
40 μL of MoI or standard was mixed with 250 μL of FRAP reagent (25 mL 300 mM sodium acetate, 1.6% acetic acid; 2.5 mL TPTZ (2, 4, 6-tri (2-pyridyl)-s-triazine), 40 mM hydrochloric acid). 240 μL of distilled water was used as blank and FeSO₄ as standard for the calibration curve. The absorbance was determined at 593 nm (BioTek-SynergyHTX, Winooski, VE, USA). Results were expressed as millimoles of Fe2+.
To prepare the MoI, 1 g of dried oregano leaves was heated in 100 mL of distilled water at 60°C for 10 minutes with continuous stirring. After cooling to room temperature, the mixture was centrifuged at 10,000 rpm for 15 minutes. The supernatant was carefully poured through Whatman No. 1 filter paper into a clean glass container to remove any solid residues. The filtered extract was stored at 4°C for further use.
To obtain a concentrated extract, the filtered solution was transferred into a round-bottom flask connected to a rotary evaporator. The flask was immersed in a 40–50°C water bath, and a gradual vacuum was applied. The rotation speed was set to approximately 100 rpm to enhance evaporation. Once most of the solvent had evaporated, the concentrated extract was collected and further dried in a desiccator until a solid or semi-solid form was obtained. The final dried extract was stored in a sealed container at 4°C for analysis.
2.11. FTIR Measurement
The MoI was centrifuged at 10,000 rpm for 15 minutes. The supernatant was carefully filtered through Whatman No. 1 filter paper into a clean glass container to remove any solid residues. To obtain a concentrated extract, the filtered solution was transferred to a round-bottom flask connected to a rotary evaporator. The flask was immersed in a water bath maintained at 40–50°C, and a gradual vacuum was applied. The rotation speed was set to approximately 100 rpm to facilitate solvent evaporation. Once most of the solvent had evaporated, the concentrated extract was collected and further dried in a desiccator until a solid or semi-solid form was achieved. The final dried extract was stored in a sealed container at 4°C for analysis. The MoI was analyzed using FTIR spectroscopy within the 4000–400 cm⁻¹ range, utilizing a PerkinElmer 400 FTIR spectrometer (Waltham, MA, USA). A background spectrum was recorded prior to measurement to eliminate environmental interference. For analysis, a small amount (1–2 mg) of the extract was placed on the sample holder of the ATR (Attenuated Total Reflectance) crystal, forming a thin film. The instrument performed 32 scans, which were averaged to generate the final spectrum. The results were displayed as Transmittance vs. Wavenumber (cm⁻¹) for functional group identification.
2.12. HPLC Analysis of MoI
HPLC was performed to identify and quantify the major compounds in Mo including carvacrol, thymol, pinocembrin, and galangin, using two chromatographic methods. Carvacrol and thymol were analyzed with an Agilent 1120 Compact HPLC system and UV detection at 274 nm. Separation was performed on a Phenomenex Luna C18 column (250 × 4.6 mm, 5 µm) using a mobile phase of water with 0.05% trifluoroacetic acid (A) and acetonitrile (B). The gradient was 90:10 (A:B) at 0 min, 70:30 at 3 min, 30:70 at 20 min, and 70:30 at 25 min. Flow rate was 0.7 mL/min, oven temperature 40 °C, and injection volume 10 µL. Pinocembrin and galangin were were analyzed with a Thermo Scientific Dionex ICS-50000 HPLC-DAD system, quantified using detection at 245, 270, 290, and 515 nm. A Gemini C18 column (250 × 4.6 mm, 5 µm) was used with a mobile phase of 0.5% formic acid in water (A) and acetonitrile (B). The gradient was: 2–12% B (0–15 min), 12% B (15–23 min), 12–40% B (23–46 min), 40–90% B (46–71 min), and 90% B (71–75 min), at 1.0 mL/min. Samples (15 µL) were filtered (0.22 µm) and diluted 1:1 in methanol–water (50:50) with 0.5% formic acid. Calibration curves were prepared using ≥98% purity standards of carvacrol, thymol, pinocembrin, and galangin. Data was processed with EZChrom Elite software.
Thymol and carvacrol were quantified using external calibration curves with the equations y = 0.006 x – 52.1066 (R² = 0.9912) and y = 0.0064 x – 0.0724 (R² = 0.9943), respectively. Pinocembrin and galangin were also confirmed and quantified using standard curves with equations y = 0.2137 x + 0.365 (R² = 0.9915) and y = 2.8792 x – 0.798 (R² = 0.980). The strong correlation coefficients across all models support reliable quantification and confirm the presence of these bioactive flavonoids in the extract.
2.13. MoI Time Response Curve
Since there are no previous reports on the use of MoI on cancer cells, we evaluated the effect at the metabolic level of different doses of the infusion for 24, 48 and 72 hours in MDMA-MB-231 cells to establish an exposure time for further testing, because for Cv treatment we started from the background of Arunasree et al. in MDA-MB-231 cells [16]. Briefly, 1.5 × 10⁴ cells/well were seeded in 96 well-plates, after 24 hours of incubation MoI was added in different concentrations, untreated groups received culture medium, and cells were incubated for the corresponding time (24, 48 or 72 hours). Next, MTT (5 mg/mL in PBS) was added, and cells were incubated for 4 hours to allow formazan production, these crystals were dissolved using a solution prepared with sodium dodecyl sulfate (Thermo Fisher, 28312) and dimethylformamide (Sigma-Aldrich, 227056) at pH 4.6, followed by a final incubation of 18–24 hours. Absorbance was measured at 570 nm (BioTek-800TS, Winooski, VE, USA), with untreated cells considered as 100% formazan production.
2.14. Evaluation of Cell Metabolism (MTT Assay)
Cells were seeded in 96-well plates at a density of 1.5 × 10⁴ cells/well. After 24 hours of incubation increasing concentrations of MoI or Cv solution were added, while untreated groups received culture medium. Cells were incubated 24 hours with Cv and 48 hours with MoI. Subsequently, MTT (5 mg/mL in PBS) was added, and cells were incubated for 4 hours. Formazan crystals were dissolved using a solution prepared with sodium dodecyl sulfate (Thermo Fisher, 28312) and dimethylformamide (Sigma-Aldrich, 227056) at pH 4.6, followed by a final incubation of 18–24 hours. Absorbance was measured at 570 nm (BioTek-800TS, Winooski, VE, USA), with untreated cells considered as 100% formazan production. A dose-response curve was generated for each cell line under both treatments independently, and half maximal inhibitory concentration (IC50) values were determined using the four-parameter logistic model (J. A. Nelder and R. W. M. Wedderburn, Journal of the Royal Statistical Society, 1972). The IC50 values obtained were subsequently used for the cytotoxicity assay.
2.15. Cytotoxicity Assay (LDH in Supernatant)
Cytotoxicity was assessed using the CyQUANT™ LDH Cytotoxicity Assay Kit (Invitrogen, C20300), following the manufacturer’s instructions. Briefly, 1.5 × 10⁴ cells were seeded in a 96-well plate and treated with MoI, Cv, or ultrapure water (for the spontaneous LDH activity control) in a final volume of 100 µL. Cells were incubated for 24 hours in the Cv group and 48 hours in the MoI group. Subsequently, 10 µL of 10X Lysis Buffer was added to the maximum LDH control group and incubated for 45 minutes. Then, 50 µL of supernatant from each well was transferred to a new 96-well plate, followed by the addition and mixing of 50 µL of Reaction Mixture. After 30 minutes of incubation at room temperature, 50 µL of Stop Solution was added and mixed. Finally, absorbance was measured at 490 nm with correction at 690 nm (BioTek-SynergyHTX, Winooski, VE, USA). Cytotoxicity was calculated using the following formula:
2.16. Statistical Analysis
Results were expressed as means ± SD, T-student, ANOVA and Dunnet as post-hoc test was performed using R version 4.4.3, and a p value of <0.05 was considered statistically significant.
3. Results
3.1. Bromatological Analysis of L. graveolens
Table 1 shows the results obtained from the bromatological analysis of the L. graveolens sample.
3.2. Antioxidant Capability of MoI
MoI showed significant antioxidant capacity, the data shows in Table 2.
3.3. FTIR Measurement
Figure 1 shows the FTIR spectrum of MoI.
3.4. High-Performance Liquid Chromatography (HPLC) Analysis of MoI
3.5. MoI Dose Response Curve
Treatment with MoI for 24 hours does not modify the metabolic activity of MDA-MB-231 cells. Instead, the infusion significantly decreases formazan production after 48 hours (0.08 mg/mL, 83.09% ± 5.17%; 0.09 mg/mL, 88.20% ± 1.81%; and 0.1 mg/mL, 82.66% ± 5.68%) and this effect is similar at 72 hours (0.08 mg/mL, 86.23% ± 3.48%; 0.09 mg/mL, 90.65% ± 1.31% and 0.10 mg/mL, 89.88% ± 2.63%). These results are shown in Figure 4.
3.6. Cell Metabolism Assay
Treatment of HaCaT cells with MoI for 48 hours resulted in a significant reduction in formazan production starting at 0.10 mg/mL (84.51% ± 4.50%), following a dose-dependent trend (0.15 mg/mL, 78.58% ± 6.06%; 0.20 mg/mL, 36.65% ± 6.38%; 0.30 mg/mL, 9.50% ± 3.82%). In a similar manner, MoI treatment of MCF-7 cells also led to a significant decrease in formazan production from the 0.10 mg/mL dose (34.67% ± 6.31%), exhibiting a dose-dependent effect (0.15 mg/mL, 15.49% ± 3.91%; 0.20 mg/mL, 15.90% ± 4.02%; 0.30 mg/mL, 13.70% ± 3.91%). Moreover, in HCC-1954 cells, MoI significantly decreased formazan production after 48 hours, starting from the second dose (85.90% ± 4.10%), in a dose-dependent manner (0.15 mg/mL, 74.56% ± 3.59%; 0.20 mg/mL, 47.60% ± 6.92%; 0.30 mg/mL, 48.48% ± 5.91%). Finally, treatment of MDA-MB-231 cells with MoI for 48 hours also resulted in a significant reduction in formazan production from the second dose onwards (74.71% ± 5.36%), following a dose-dependent pattern (0.15 mg/mL, 73.66% ± 8.59%; 0.20 mg/mL, 49.67% ± 6.01%; 0.30 mg/mL, 41.56% ± 5.89%). These results are shown in Figure 5.
Treatment of HaCaT cells with Cv for 24 hours resulted in a significant reduction in formazan production from the first dose (54.49% ± 6.42%), exhibiting a dose-dependent response (100 µM, 44.70% ± 4.83%; 200 µM, 25.45% ± 3.59%; 300 µM, 22.61% ± 4.15%; 500 µM, 26.85% ± 4.05%). Similarly, MCF-7 cells demonstrated a significant decrease in formazan production starting at the initial dose (81.00% ± 5.86%), following a dose-dependent pattern (100 µM, 81.13% ± 6.04%; 200 µM, 60.85% ± 4.94%; 300 µM, 32.54% ± 3.37%; 500 µM, 27.55% ± 2.77%). In HCC-1954 cells, Cv treatment for 24 hours significantly reduced formazan production from the first dose onward (85.18% ± 5.59%), with a clear dose-dependent effect (100 µM, 57.04% ± 7.61%; 200 µM, 40.95% ± 3.04%; 300 µM, 40.46% ± 2.68%; 500 µM, 40.76% ± 3.23%). Likewise, MDA-MB-231 cells treated under the same conditions exhibited a significant reduction from the first dose (85.76% ± 4.14%), maintaining a dose-dependent trend (100 µM, 80.21% ± 4.17%; 200 µM, 44.52% ± 4.62%; 300 µM, 25.78% ± 4.51%; 500 µM, 25.15% ± 3.25%). These results are shown in Figure 6.
3.7. IC50 Calculation
The IC50 values calculated for each cell line under each treatment are presented in Table 3.
3.8. Cytotoxicity of MoI and Cv (IC50)
As shown in Figure 7 the IC50 Cv concentrations induced approximately 50% cytotoxicity, with values of 49.85% ± 6.53% in MDA-MB-231 cells, 51.26% ± 9.42% in HCC-1954 cells, 53.84% ± 8.59% in MCF-7 cells, and 57.66% ± 10.05% in HaCaT cells. In contrast, the IC50 concentrations of MoI resulted in a lower cytotoxicity of approximately 15%, with specific values of 11.68% ± 1.97% in MDA-MB-231 cells, 21.94% ± 3.25% in HCC-1954 cells, 15.43% ± 0.15% in MCF-7 cells, and 12.07% ± 2.08% in HaCaT cells.
4. Discussion
Both oregano extracts and Cv have been extensively studied due to their diverse biological activities, which postulates them as potential therapeutic agents for the management of different diseases, including cancer. Among their properties, their antioxidant activity stands out, as well as their antiproliferative and cytotoxic effects, characteristics that make them promising options for oncological treatment [22,23,24].
The bromatological analysis performed on the plant sample used in this study can be compared with the data reported by the U.S. Department of Agriculture (USDA) for dried oregano. Compared to this reference, our sample presented 12.3 % less moisture, 15.3 % less ash, 24 % less protein, 2.3 % less lipids, but an increase of 51.9 % in available carbohydrates and 70.1 % in total sugars, with a reduction of 9.1 % in dietary fiber. These differences can be attributed to several factors, such as soil type and fertility, pH, growing conditions (temperature, light, humidity), irrigation regime, fertilization, pest control, harvest timing and drying methods. Each of these factors significantly influences the chemical composition of the plant sample and, consequently, its biological activity [25].
Regarding the antioxidant capacity of L. graveolens, it has been demonstrated that both the plant matrix and its extracts are rich in antioxidant compounds, which confers a high capacity to neutralize free radicals [23,26]. The results obtained in the present study support this claim, since it was observed that MoI exhibited potent total antioxidant activity in ABTS and DPPH radical neutralization assays, as well as in the quantification of total phenols, total flavonoids and FRAP. Similar results have been reported in the literature. Mahomoodally et al. (2018) evaluated the antioxidant capacity of aqueous and methanolic extracts of Origanum onites (Greek oregano), finding that the aqueous extract presented a higher antioxidant capacity compared to the methanolic one, which was attributed to a higher concentration of phenolic compounds [27]. In contrast, Simirgiotis et al. (2020) analyzed a lipid extract of Origanum vulgare (oregano species native to the mediterranean), finding a lower amount of phenolic compounds and, consequently, a lower antioxidant capacity against ABTS and DPPH radicals [28]. Similarly, Kogiannou et al. (2013) compared the antioxidant capacity of 6 herbal infusions of plants originating from Greece, including a species of oregano, where they observed that this infusion had the best antioxidant capacity in all the techniques they used (total phenols, total flavonoids, DPPH and FRAP), compared to other plants with recognized antioxidant capacity such as chalk marjoram, pink savory, mountain tea, pennyroyal and chamomile [29]. These findings reinforce the evidence that extracts from oregano variants, especially in infusion form, have a high antioxidant potential. The antioxidant potential of MoI could be related to its anticancer activity, since there is a correlation between the amount and type of phenolic compounds and their cytotoxicity. It has been proposed that certain functional groups, such as carbonyls and free hydroxyls, facilitate the formation of ortho-diphenolic radicals (two hydroxyl groups attached to a benzene ring in adjacent positions), which could chelate transition metals involved in redox processes, thus affecting the viability of cancer cells [30,31]. This suggests the need to continue investigating their role in the management of chronic degenerative diseases, such as BC.
About the compounds present in MoI the FTIR spectrum analysis exhibited characteristic vibrational bands that align with the presence of key phytochemical constituents known for their biological activity. The broad O–H stretching band at ~3369 cm⁻¹ is indicative of phenolic hydroxyl groups, which are typically found in flavonoids and phenolic acids such as rosmarinic acid and thymol [32]. Strong bands at 2960, 2925, and 2867 cm⁻¹ correspond to asymmetric and symmetric C–H stretching of aliphatic chains, associated with terpenoids like carvacrol and p-cymene [33]. A prominent absorption near 1641 cm⁻¹ reflects the presence of C=C aromatic or conjugated C=O groups, often present in caffeic and ferulic acids [34]. In the region of 1519–1459 cm⁻¹, aromatic skeletal vibrations are observed, typically assigned to flavonoids, carvacrol, and thymol derivatives [32]. Bands between 1364–1290 cm⁻¹ correspond to C–O stretching in phenolic ethers and alcohols, while the range of 1235–1040 cm⁻¹ confirms the presence of C–O–C stretching from glycosidic and ester bonds, reinforcing the detection of flavonoid glycosides and phenolic esters [35]. The absorptions at ~1088–1033 cm⁻¹ are assigned to C–O bonds from polysaccharides and sugar-linked flavonoids [32]. Additional bands around ~947 and ~808 cm⁻¹ are characteristic of out-of-plane aromatic C–H bending vibrations, confirming substituted aromatic structures typical of essential oil components [33]. These spectral features strongly correlate with the antioxidant and antiproliferative effects observed in the biological assays, confirming that MoI contains multiple bioactive constituents with therapeutic relevance.
HPLC profiling of MoI revealed thymol and carvacrol as the predominant non-polar constituents, eluting at 18.63 and 19.20 minutes, respectively. Quantitative analysis showed a markedly higher concentration of thymol (51.48 mg/mL) compared to carvacrol (0.0607 mg/mL), suggesting a thymol-dominant chemotype in the analyzed sample. A series of early-eluting peaks (0–10 minutes) likely correspond to hydrophilic phenolic acids and flavonoid glycosides, which contribute to the complex chemical matrix of the infusion and may enhance its antioxidant activity through synergistic interactions.
In the flavonoid region, galangin and pinocembrin were clearly resolved at 50.683 and 49.960 minutes. Galangin was quantified as the major flavonoid (126.0 ± 1.3 µg/mL or 5,484.0 ± 17.4 µg/g dry leaf), while pinocembrin was present at significantly lower levels (1.001 ± 0.801 µg/mL or 33.055 ± 1.023 µg/g). These results are consistent with the strong antioxidant capacity of the infusion observed in ABTS, DPPH, and FRAP assays. Moreover, the chemical profile provides a mechanistic basis for the infusion’s biological activity, including the observed reduction in metabolic viability of breast cancer cell lines. Evidence regarding thymol has been reported by Anvarbatcha et al. and Vahitha et al., who demonstrated cytotoxicity against MDA-MB-231 and MCF-7 cell lines, respectively. Anvarbatcha et al. observed that thymol exhibits higher toxicity toward cancer cells compared to normal cells, and induces cell-cycle arrest at the G₀/G₁ phase. This finding is consistent with the results of Vahitha et al., who reported downregulation of Cyclin D1, elucidating the molecular mechanism underlying the observed cell-cycle arrest. Both studies confirm thymol’s ability to induce apoptosis: Anvarbatcha et al. documented an increase in p53 expression, downregulation of Bcl-xL, and activation of caspases-9 and -3, whereas Vahitha et al. observed a reduction in PCNA expression. Additionally, Anvarbatcha et al. reported an increase in reactive oxygen species, proposing this mechanism as responsible for both cell-cycle arrest and apoptosis induction [36,37].
Regarding galangin, treatment has been shown to induce apoptosis via the intrinsic pathway, inhibit the PI3K/Akt signaling cascade (critical for proliferation, survival, and metastasis), and exhibit heightened efficacy against triple-negative breast cancer cells [38,39,40]. Treatment with pinocembrin in MCF-7 and MDA-MB-231 cells provokes G₂/M-phase cell-cycle arrest and induces apoptosis through activation of caspases-3 and -9, with upregulation of BAX and downregulation of Bcl-2. Analogous to galangin, pinocembrin also downregulates the PI3K/Akt pathway, resulting in decreased cellular migration and invasion. Moreover, it exhibits relative selectivity for cancer cells, as treatment of nonmalignant mammary epithelial cells manifested reduced toxicity [41].
Collectively, the presence of these anticancer bioactives in the infusion matrix underscores the concept that the diversity of phytochemicals within a complex extract may confer enhanced therapeutic benefits for breast cancer management.
On the other hand, treatment with Cv showed a differential impact on the metabolic activity of the different cell lines used in this study. It was observed that the MDA-MB-231 cell line (TN BC) was more susceptible to treatment compared to the HCC-1954 (HER2+) and MCF-7 (luminal A) lines, with IC50 values of 121 µM, 123 µM and 211 µM, respectively. However, the control cell line (HaCaT) presented higher susceptibility to Cv, with an IC50 of 91 µM, highlighting the importance of including non-cancer cell models to assess treatment specificity. These findings are consistent with previous studies. Elshafie et al. (2017) evaluated the metabolic activity of a hepatocellular carcinoma cell line (HepG2) treated with the Origanum vulgare lead compounds (Cv, thymol, and citral). To evaluate this activity, they performed MTT assays and found that Cv was the compound with the highest potential to reduce metabolic activity, with an IC50 of 48 mg/L. Furthermore, they observed that the metabolic activity of the control line (HEK293; non-cancerous human kidney cells) was considerably higher (38%) than that exhibited by HepG2 cells (12%). These findings support the idea that Cv, besides being the most abundant compound in oregano variants, also exhibits a remarkable cytotoxic potential against cancer cells, even becoming the most effective compound among those present in the plant against the HepG2 line [22]. Both previous research and the results of this study agree that the ability of Cv to decrease cell viability in cancer cells is significant in both hepatocellular carcinoma cells and aggressive BC subtypes. Further support for the cytotoxic potential of Cv against cancer cells was provided by Elbe et al. in 2020, who subjected ovarian cancer cells (Skov-3) to different doses of thymol and Cv. The results, analyzed by MTT assays, revealed that both compounds exhibit a potent effect and that this occurs in a dose-dependent manner, with IC50 values of 316.08 µM for thymol and 322.50 µM for Cv after 24 hours of treatment. Although the authors reported that thymol showed a higher cytotoxic potential than Cv in this cell line, both compounds are considered interesting options for the development of adjuvant cancer treatments [42]. These results contrast with those presented by Elshafie et al. in 2017, who found that Cv exhibited greater cytotoxic potential compared to other major Origanum vulgare compounds, including thymol [22]. The differences may be attributed to the different cell lines used in each study. Despite this, Cv demonstrated significantly high cytotoxic potential, supported by the results presented in the present study, which evidences its efficacy in reducing the metabolic activity of different cancer cell lines, including BC, and consequently supports the importance of continuing its study to assess the possibility of its use in the management of neoplastic diseases.
Concerning MoI, it was found that as the aggressiveness of the molecular subtype of the cell line increases, so does the dose required to reach IC-50. Furthermore, the control cell line (HaCaT) required the same infusion dose as the triple-negative BC cells, suggesting that MoI has a less aggressive effect on non-cancerous cells compared to the isolated Cv compound. These findings are consistent with that reported by Tuncer et al. in 2013. In their study, they treated three BC cell lines (MCF-7, MDA-MB-468 and MDA-MB-231), using an aqueous extract of Origanum acutidens (Turkish oregano) and assessed the impact on metabolic activity using MTT assays as in our research, treatment efficacy is presented in a dose-dependent manner and together, these reports and our results support that oregano extracts represents a good alternative treatment against BC cell lines, including the most aggressive subtypes [43]. Furthermore, in 2018, Makrane et al. investigated the effect of infusion of a Moroccan species of oregano in HT-29 colon cancer cells and MDA-MB-231 BC cells and evaluated its impact on metabolic activity by WST1 assay, finding that the treatment reduced metabolic activity in a dose-dependent manner in both cell lines. They observed that triple-negative BC cells were more susceptible to treatment, with an IC50 ranging from 30.90 to 87.09 µg/mL, while in HT-29 cells this range ranged from 50.11 to 158.48 µg/mL [44]. These results are relevant to our study, as we also employed an infusion as a treatment in a TN BC cell line, providing a close reference to contrast our results. Based on this study and our findings, we can conclude that oregano extracts, including MoI, significantly reduce the metabolic activity of BC cell lines, even in the TN subtype, and that this effect occurs in a dose-dependent manner.
The results obtained in this study indicate that Cv exhibits greater cytotoxicity compared to MoI (~50 % and ~15 %, respectively), which suggests that while infusion may reduce cellular metabolism, the isolated Cv compound exhibits greater cytotoxicity. Despite the limited availability of studies on oregano cytotoxicity, the existing evidence concurs that its extracts, regardless of extraction method, possess activity against BC cells, including the most aggressive subtypes.
5. Conclusions
This work provides novel information on MoI, both its composition and antioxidant capacity, as well as its impact on metabolic activity and cytotoxicity in BC cells of the different molecular subtypes, thus establishing the basis for further studies to delve into the molecular mechanisms involved in the biological effects described here, such as modifications in the production of pro- and anti-inflammatory cytokines associated with the development and progression of the disease or alterations in the expression and function of key enzymes for redox balance, such as catalase, superoxide dismutase and glutathione peroxidase, since the development of alternative treatments based on extracts of natural origin, such as MoI, are emerging as a promising field for the management of cancers with poor prognosis such as TN BC.
Author Contributions
Conceptualization, B.R.R., T.G.I. and M.M.G.; methodology, B.R.R., T.G.I., M.M.G, G.C.R, E.V.M., J.G.L., T.G.C., P.S.H., A.M.S., R.L.R. and I.B.L; investigation, B.R.R., T.G.I., M.M.G. and G.C.R.; writing—original draft preparation, B.R.R., and T.G.I., writing—review and editing, B.R.R., T.G.I., M.M.G, G.C.R, E.V.M., J.G.L., T.G.C., P.S.H., A.M.S., R.L.R. and I.B.L; supervision, T.G.I. and M.M.G.; funding acquisition, T.G.I. All authors have read and agreed to the published version of the manuscript.
Funding
The author(s) declare financial support was received for the research, authorship, and/or publication of this article. The study was supported by Fondo de Proyectos de Impulso a la Investigación (PIN 2022-III), and PRO-SNI 2022-2024 to the Universidad de Guadalajara.
Institutional Review Board Statement
Not applicable.
Informed Consent Statement
Not applicable.
Data Availability Statement
Not applicable.
Acknowledgments
We would like to express our gratitude to CONAHCYT for awarding B.E.R.R (CVU number: 1182751) a doctoral scholarship through the National Postgraduate Program (Sistema Nacional de Posgrados SNP-CONAHCYT). Additionally, we extend our thanks to Doctorado en Ciencias en Biología Molecular en Medicina (DCBMM) from Centro Universitario de Ciencias de la Salud, Universidad de Guadalajara.
Conflicts of Interest
The authors declare no conflicts of interest.
Abbreviations
The following abbreviations are used in this manuscript:
| BC | Breast cancer |
| Cv | Carvacrol |
| MoI | Mexican oregano infusion |
| FRAP | Ferric reducing antioxidant power |
| FTIR | Fourier-transform infrared spectroscopy |
| MTT | 3-(4,5-dimethylthiazol-2-yl)-2,5-diphenyltetrazolium bromide |
| LDH | Lactate dehydrogenase |
| TN | Triple negative |
| ER | Estrogen receptor |
| PR | Progesterone receptor |
| HER2 | Human epidermal growth factor receptor 2 |
| HER2+ | HER2-enriched |
| HPLC | High-performance liquid chromatography |
| DMSO | Dimethyl sulfoxide |
| DMEM | Dulbecco’s Modified Eagle Medium |
| RPMI | Roswell Park Memorial Institute |
| PBS | Phosphate buffered saline |
| FBS | Fetal bovine serum |
| ATCC | American Type Culture Collection |
| IC50 | Half maximal inhibitory concentration |
| USDA | U.S. Department of Agriculture |
References
- World Health Organization Cancer. https://www.who.int/health-topics/cancer#tab=tab_1. Accessed 5 Mar 2025.
- Cilibrasi C, Papanastasopoulos P, Samuels M, Giamas G (2021) Reconstituting Immune Surveillance in Breast Cancer: Molecular Pathophysiology and Current Immunotherapy Strategies. Int J Mol Sci 22:12015. [CrossRef]
- Global Cancer Observatory Breast cancer. https://gco.iarc.fr/today/data/factsheets/cancers/20-Breast-fact-sheet.pdf. Accessed 9 Apr 2025.
- Perou CM, Sørile T, Eisen MB, et al (2000) Molecular portraits of human breast tumours. Nature 406:747–752. [CrossRef]
- Tsang JYS, Tse GM (2019) Molecular Classification of Breast Cancer. Adv Anat Pathol 27:.
- Nolan E, Lindeman GJ, Visvader JE (2023) Deciphering breast cancer: from biology to the clinic. Cell 186:1708–1728. [CrossRef]
- Amin ARMR, Kucuk O, Khuri FR, Shin DM (2009) Perspectives for cancer prevention with natural compounds. Journal of Clinical Oncology 27:2712–2725. [CrossRef]
- Fitzmaurice C, Dicker D, Pain A, Hamavid H, Moradi-Lakeh M MM (2015) The Global Burden of Cancer 2013. JAMA Oncol 1:505–527. [CrossRef]
- Dias DA, Urban S, Roessner U (2012) A Historical overview of natural products in drug discovery. Metabolites 2:303–336. [CrossRef]
- Arigesavan K, Sudhandiran G (2015) Carvacrol exhibits anti-oxidant and anti-inflammatory effects against 1, 2-dimethyl hydrazine plus dextran sodium sulfate induced inflammation associated carcinogenicity in the colon of Fischer 344 rats. Biochem Biophys Res Commun 461:314–320. [CrossRef]
- Lim W, Ham J, Bazer FW, Song G (2019) Carvacrol induces mitochondria-mediated apoptosis via disruption of calcium homeostasis in human choriocarcinoma cells. J Cell Physiol 234:1803–1815. [CrossRef]
- Khan F, Khan I, Farooqui A, Ansari IA (2017) Carvacrol Induces Reactive Oxygen Species (ROS)-mediated Apoptosis Along with Cell Cycle Arrest at G0/G1 in Human Prostate Cancer Cells. Nutr Cancer 69:1075–1087. [CrossRef]
- Martínez-Natarén DA, Parra-Tabla V, Dzib G, et al (2012) Essential oil yield variation within and among wild populations of mexican oregano (lippia graveolens h.b.k.-verbenaceae), and its relation to climatic and edaphic conditions. Journal of Essential Oil-Bearing Plants 15:589–601. [CrossRef]
- Nieto-Ramírez MI, Feregrino-Pérez AA, Aguirre Becerra H, et al (2023) Response of Phenolic Compounds in Lippia graveolens Kunth Irrigated with Aquaculture Wastewater and Steiner Solution. International Journal of Plant Biology 14:483–492. [CrossRef]
- Dirección General de Normas Norma Mexicana NMX-F-083-1986. Alimentos–Determinación de humedad en productos alimenticios; Declaratoria de vigencia publicada en el Diario Oficial de la Federación el 14 de julio de 1986; Normas Mexicanas: Ciudad de México, México, 1986.
- Association of Official Analytical Chemists (AOAC) (1923) Official Methods 923.03. Ash for Flour. . 7:132–132.
- DOF - Diario Oficial de la Federación NORMA Oficial Mexicana NOM-086-SSA1-1994, Bienes y servicios. Alimentos y bebidas no alcohólicas con modificaciones en su composición. Especificaciones nutrimentales. https://dof.gob.mx/nota_detalle.php?codigo=4890075&fecha=26/06/1996#gsc.tab=0. Accessed 7 Jun 2025.
- Association of Official Analytical Chemists (AOAC) (2006) Oficial Methods 928.08. Nitrogen in Meat—Kjeldahl Method. 18.
- AOC AOAC 2003.06-2006, Crude Fat in Feeds,Cereal Grains,and Forages. http://www.aoacofficialmethod.org/index.php?main_page=product_info&cPath=1&products_id=1552. Accessed 16 Nov 2023.
- Diario Oficial de la Federación NORMA Oficial Mexicana NOM-086-SSA1-1994, Bienes y servicios. Alimentos y bebidas no alcohólicas con modificaciones en su composición. Especificaciones nutrimentales. https://dof.gob.mx/nota_detalle.php?codigo=4890075&fecha=26/06/1996#gsc.tab=0. Accessed 16 Nov 2023.
- AOAC International (1993) Method of Analysis for Nutrition Labeling (General Factors: Protein × 4, CHO × 4, and Fat × 9).
- Elshafie HS, Armentano MF, Carmosino M, et al (2017) Cytotoxic activity of origanum vulgare L. on Hepatocellular carcinoma cell line HepG2 and evaluation of its biological activity. Molecules 22:. [CrossRef]
- Oniga I, Pus C, Silaghi-Dumitrescu R, et al (2018) Origanum vulgare ssp. vulgare: Chemical composition and biological studies. Molecules 23:. [CrossRef]
- Sharifi-Rad M, Varoni EM, Iriti M, et al (2018) Carvacrol and human health: A comprehensive review. Phytotherapy Research 32:1675–1687. [CrossRef]
- USDA Spices, oregano, dried. In: 2019. https://fdc.nal.usda.gov/fdc-app.html#/food-details/171328/nutrients. Accessed 20 Mar 2025.
- Zhang XL, Guo YS, Wang CH, et al (2014) Phenolic compounds from Origanum vulgare and their antioxidant and antiviral activities. Food Chem 152:300–306. [CrossRef]
- Mahomoodally MF, Zengin G, Aladag MO, et al (2019) HPLC-MS/MS chemical characterization and biological properties of Origanum onites extracts: a recent insight. Int J Environ Health Res 29:607–621. [CrossRef]
- Simirgiotis MJ, Burton D, Parra F, et al (2020) Antioxidant and antibacterial capacities of origanum vulgare l. Essential oil from the arid andean region of chile and its chemical characterization by gc-ms. Metabolites 10:1–12. [CrossRef]
- Kogiannou DAA, Kalogeropoulos N, Kefalas P, et al (2013) Herbal infusions; their phenolic profile, antioxidant and anti-inflammatory effects in HT29 and PC3 cells. Food and Chemical Toxicology 61:152–159. [CrossRef]
- Rice-Evans CA, Miller NJ, Paganga G (1996) Structure-antioxidant activity relationships of flavonoids and phenolic acids. Free Radic Biol Med 20:933–956. [CrossRef]
- Berdowska I, Zieliński B, Fecka I, et al (2013) Cytotoxic impact of phenolics from Lamiaceae species on human breast cancer cells. Food Chem 141:1313–1321. [CrossRef]
- Marin-Tinoco RI, Ortega-Ramírez AT, Esteban-Mendez M, et al (2023) Antioxidant and Antibacterial Activity of Mexican Oregano Essential Oil, Extracted from Plants Occurring Naturally in Semiarid Areas and Cultivated in the Field and Greenhouse in Northern Mexico. Molecules 2023, Vol 28, Page 6547 28:6547. [CrossRef]
- Bautista-Hernández I, Aguilar CN, Martínez-ávila GCG, et al (2021) Mexican Oregano (Lippia graveolens Kunth) as Source of Bioactive Compounds: A Review. Molecules 2021, Vol 26, Page 5156 26:5156. [CrossRef]
- Bernal-Millán MDJ, Gutiérrez-Grijalva EP, Contreras-Angulo L, et al (2022) Spray-Dried Microencapsulation of Oregano (Lippia graveolens) Polyphenols with Maltodextrin Enhances Their Stability during In Vitro Digestion. J Chem 2022:8740141. [CrossRef]
- Cortés-Chitala MDC, Flores-Martínez H, Orozco-ávila I, et al (2021) Identification and Quantification of Phenolic Compounds from Mexican Oregano (Lippia graveolens HBK) Hydroethanolic Extracts and Evaluation of Its Antioxidant Capacity. Molecules 2021, Vol 26, Page 702 26:702. [CrossRef]
- Anvarbatcha R, Kunnathodi F, Islam M (2023) Induction of G0/G1 phase cell cycle arrest and apoptosis by thymol through ROS generation and caspase-9/-3 activation in breast and colorectal cancer cell lines. J Cancer Res Ther 19:1915–1924. [CrossRef]
- Vahitha V, Lali G, Prasad S, et al (2024) Unveiling the therapeutic potential of thymol from Nigella sativa L. seed: selective anticancer action against human breast cancer cells (MCF-7) through down-regulation of Cyclin D1 and proliferative cell nuclear antigen (PCNA) expressions. Mol Biol Rep 51:. [CrossRef]
- Song W, Yan C yang, Zhou Q qian, Zhen L lin (2017) Galangin potentiates human breast cancer to apoptosis induced by TRAIL through activating AMPK. Biomedicine and Pharmacotherapy 89:845–856. [CrossRef]
- Liu D, You P, Luo Y, et al (2018) Galangin Induces Apoptosis in MCF-7 Human Breast Cancer Cells Through Mitochondrial Pathway and Phosphatidylinositol 3-Kinase/Akt Inhibition. Pharmacology 102:58–66. [CrossRef]
- Sinnarkar S, Suryawanshi P, Dilip A, et al (2024) Galangin promotes apoptosis by upregulating the pro-apoptotic gene BAX in triple-negative breast cancer. J Egypt Natl Canc Inst 36:. [CrossRef]
- Zhu X, Li R, Wang C, et al (2021) Pinocembrin Inhibits the Proliferation and Metastasis of Breast Cancer via Suppression of the PI3K/AKT Signaling Pathway. Front Oncol 11:. [CrossRef]
- Elbe H, Yigitturk G, Cavusoglu T, et al (2020) Comparison of ultrastructural changes and the anticarcinogenic effects of thymol and carvacrol on ovarian cancer cells: which is more effective? Ultrastruct Pathol 44:193–202. [CrossRef]
- Tuncer E, Unver-Saraydin S, Tepe B, et al (2013) Antitumor effects of Origanum acutidens extracts on human breast cancer. Journal of BUON 18:77–85.
- Makrane H, El Messaoudi M, Melhaoui A, et al (2018) Cytotoxicity of the Aqueous Extract and Organic Fractions from Origanum majorana on Human Breast Cell Line MDA-MB-231 and Human Colon Cell Line HT-29. Adv Pharmacol Sci 2018:. [CrossRef]
Figure 1.
FTIR spectrum of Lippia graveolens infusion showing bands for phenols (~3369 cm⁻¹), terpenes (~2925–2960 cm⁻¹), aromatics (~1641 cm⁻¹), and glycosides (~1040 cm⁻¹), indicating the presence of bioactive compounds.
Figure 1.
FTIR spectrum of Lippia graveolens infusion showing bands for phenols (~3369 cm⁻¹), terpenes (~2925–2960 cm⁻¹), aromatics (~1641 cm⁻¹), and glycosides (~1040 cm⁻¹), indicating the presence of bioactive compounds.
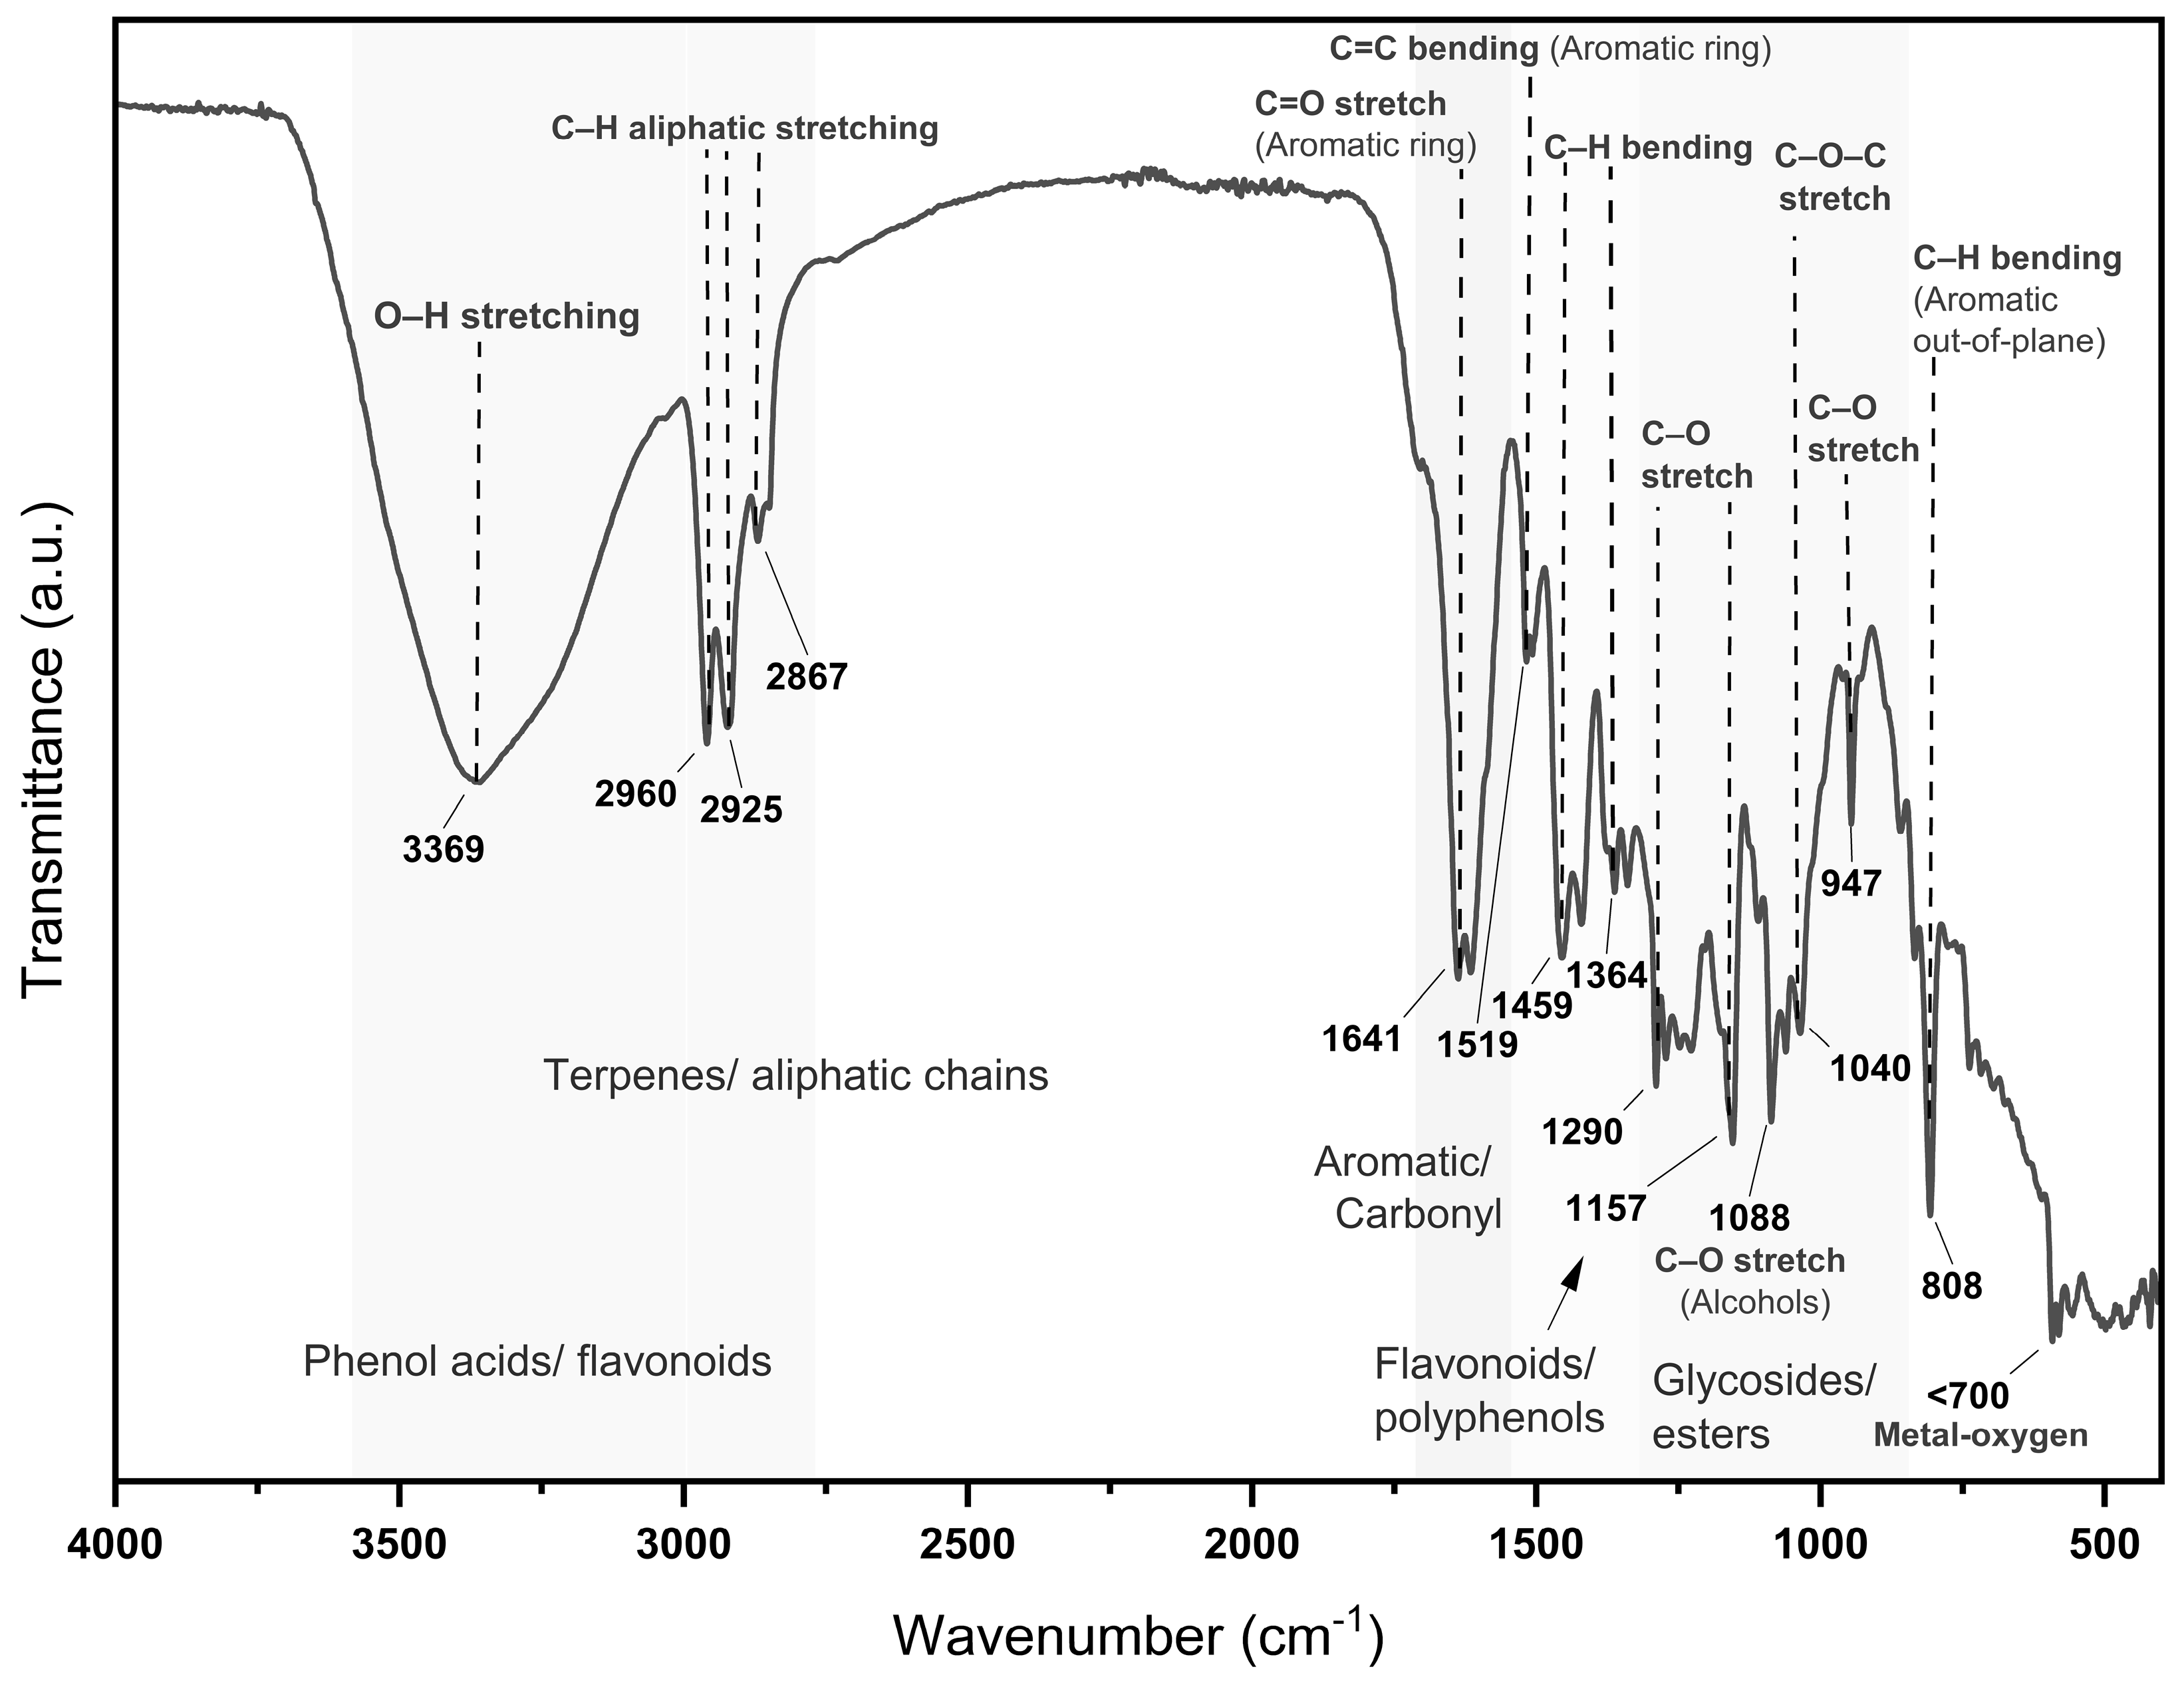
Figure 2.
HPLC chromatogram of Mexican oregano (Lippia graveolens Kunth) extract at 274 nm showing major peaks for carvacrol (18.63 min) and thymol (19.20 min), along with various minor phenolic compounds.
Figure 2.
HPLC chromatogram of Mexican oregano (Lippia graveolens Kunth) extract at 274 nm showing major peaks for carvacrol (18.63 min) and thymol (19.20 min), along with various minor phenolic compounds.

Figure 3.
HPLC chromatogram of aqueous oregano leaf extract recorded at 290 nm. Pinocembrin (49.96 min) and galangin (50.68 min) were identified based on retention time and UV spectra.
Figure 3.
HPLC chromatogram of aqueous oregano leaf extract recorded at 290 nm. Pinocembrin (49.96 min) and galangin (50.68 min) were identified based on retention time and UV spectra.
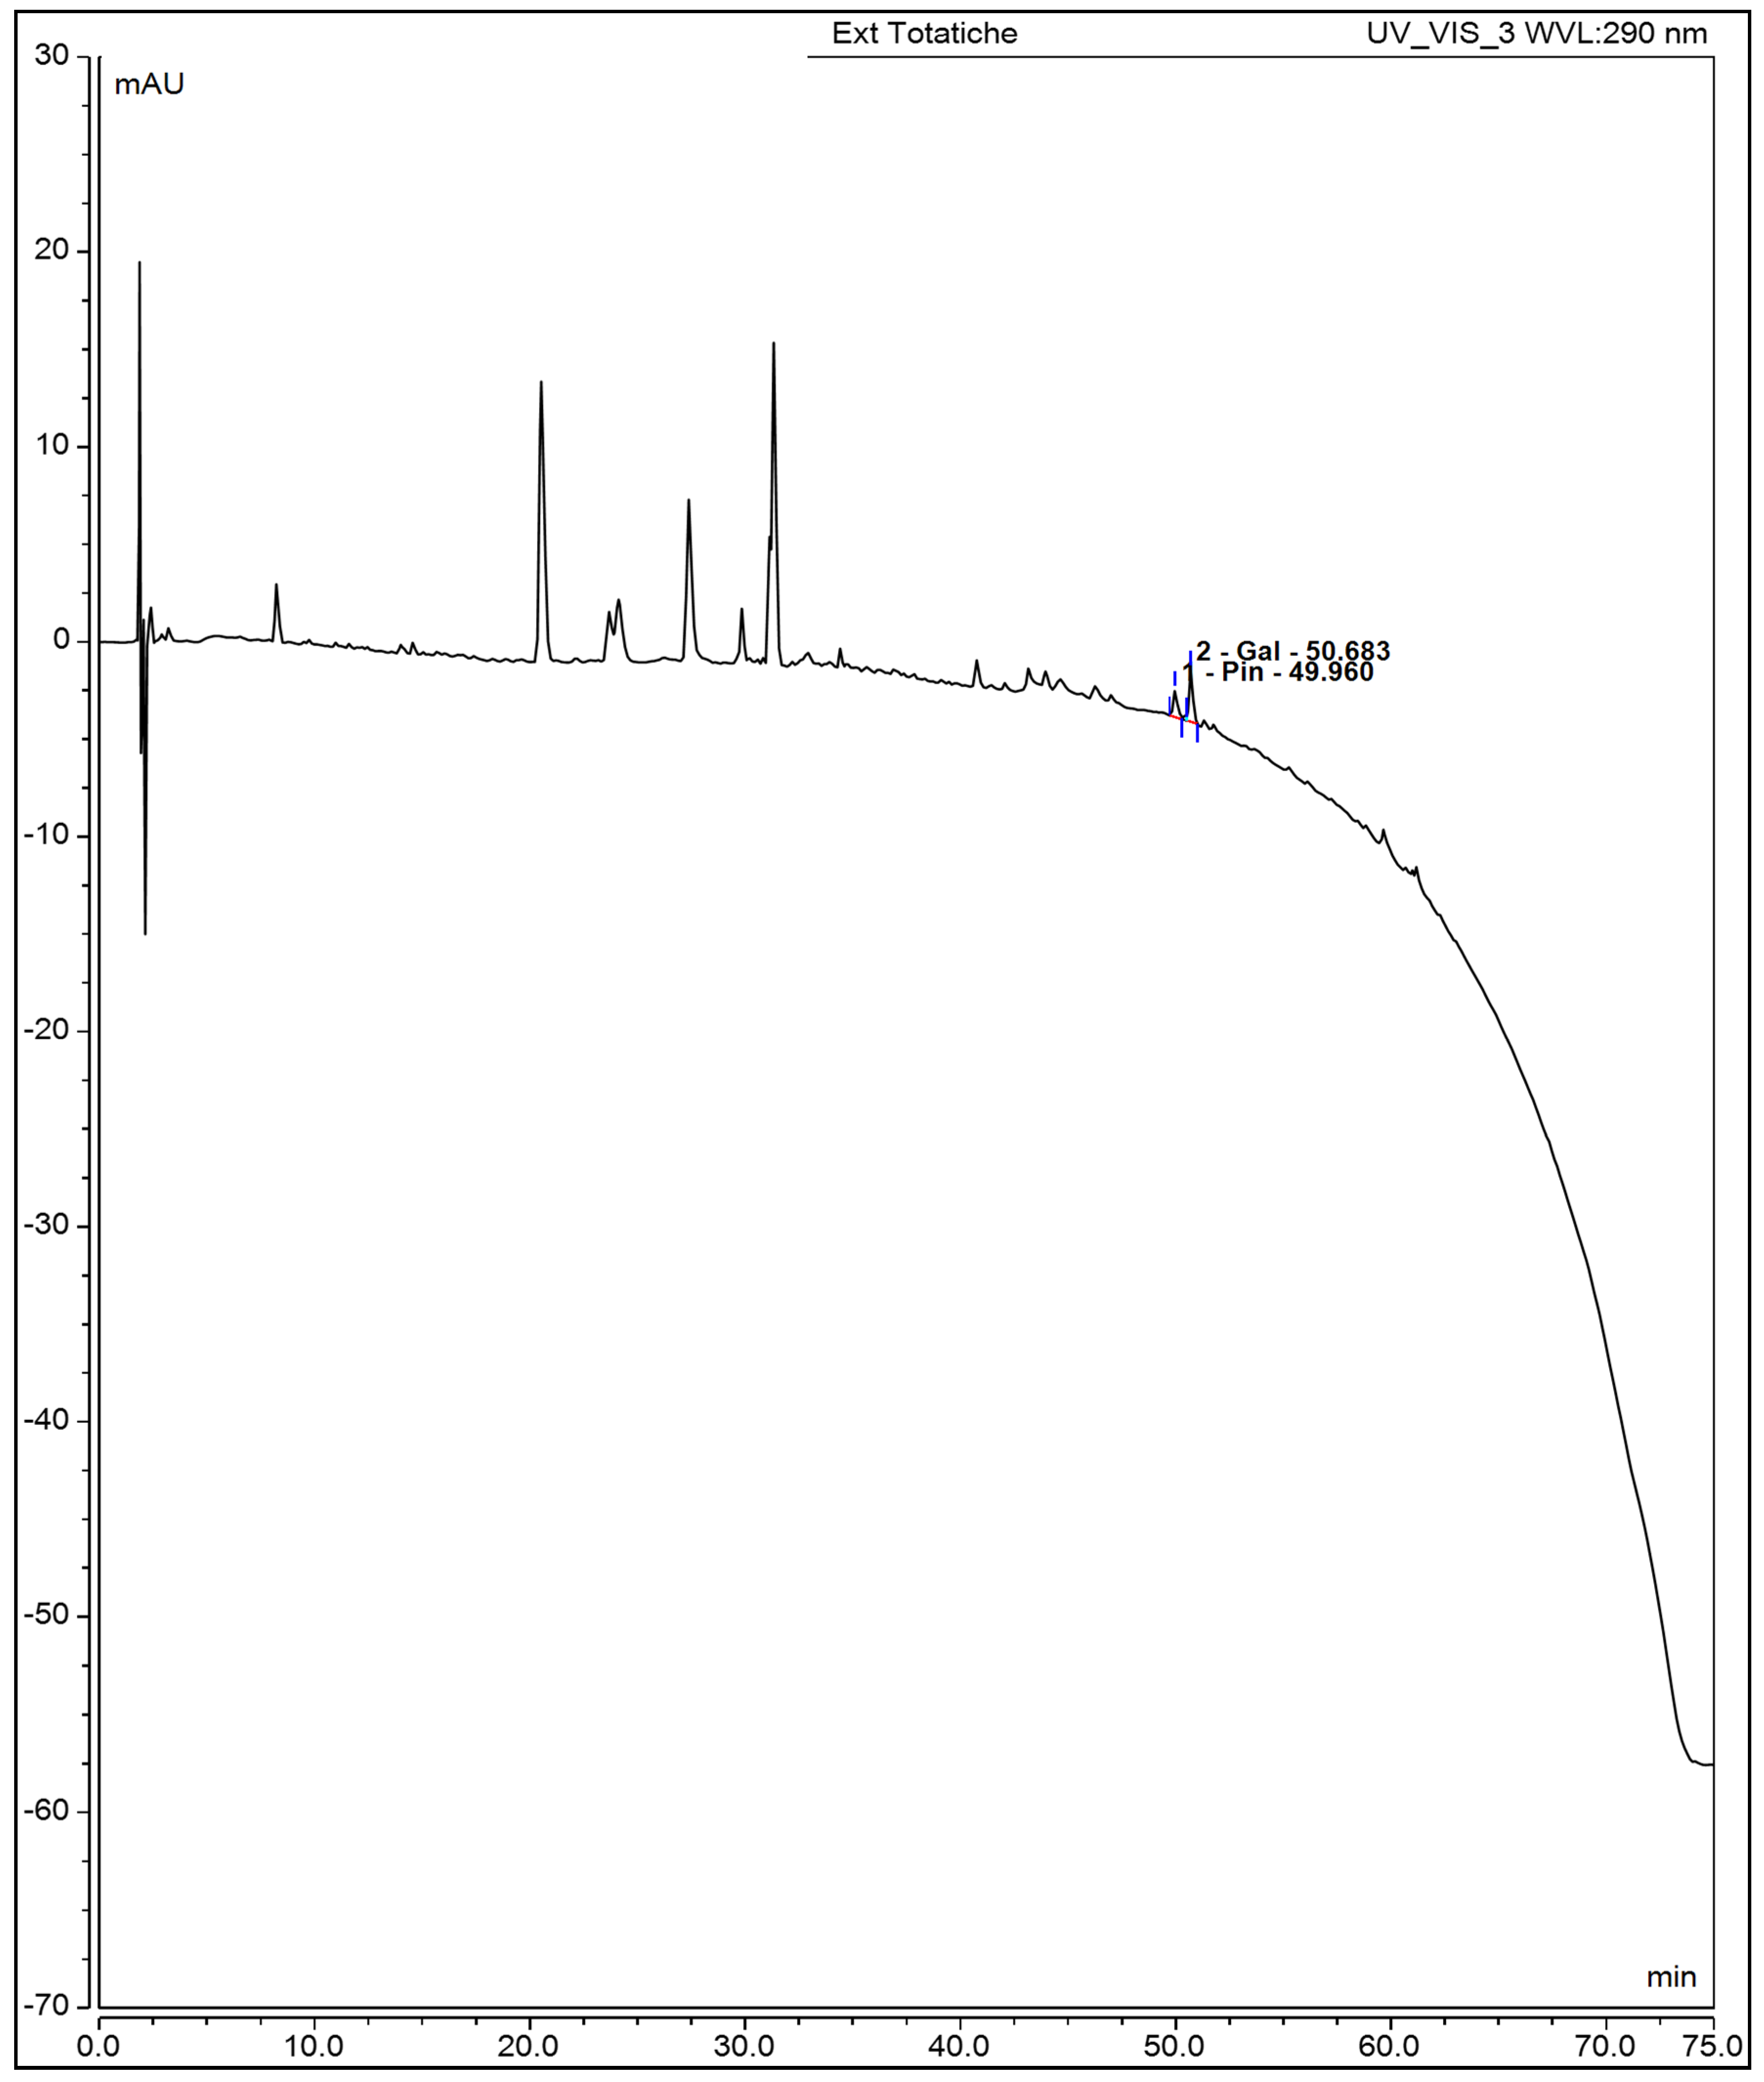
Figure 4.
Comparison of formazan production in MDA-MB-231 cells after exposure to MoI for 24, 48 and 72 hours, etoposide (0.18mg/mL) was used as cell death-control, the determination was performed by MTT assay, the percentage was calculated in comparison to the untreated group taking it as 100% formazan production. Results are expressed as mean ± standard deviation of three independent experiments performed in triplicate. Analysis of variance between groups was performed using ANOVA and Dunnett's post-hoc test (* = p<0.05; *** = p<0.001, compared with control). .
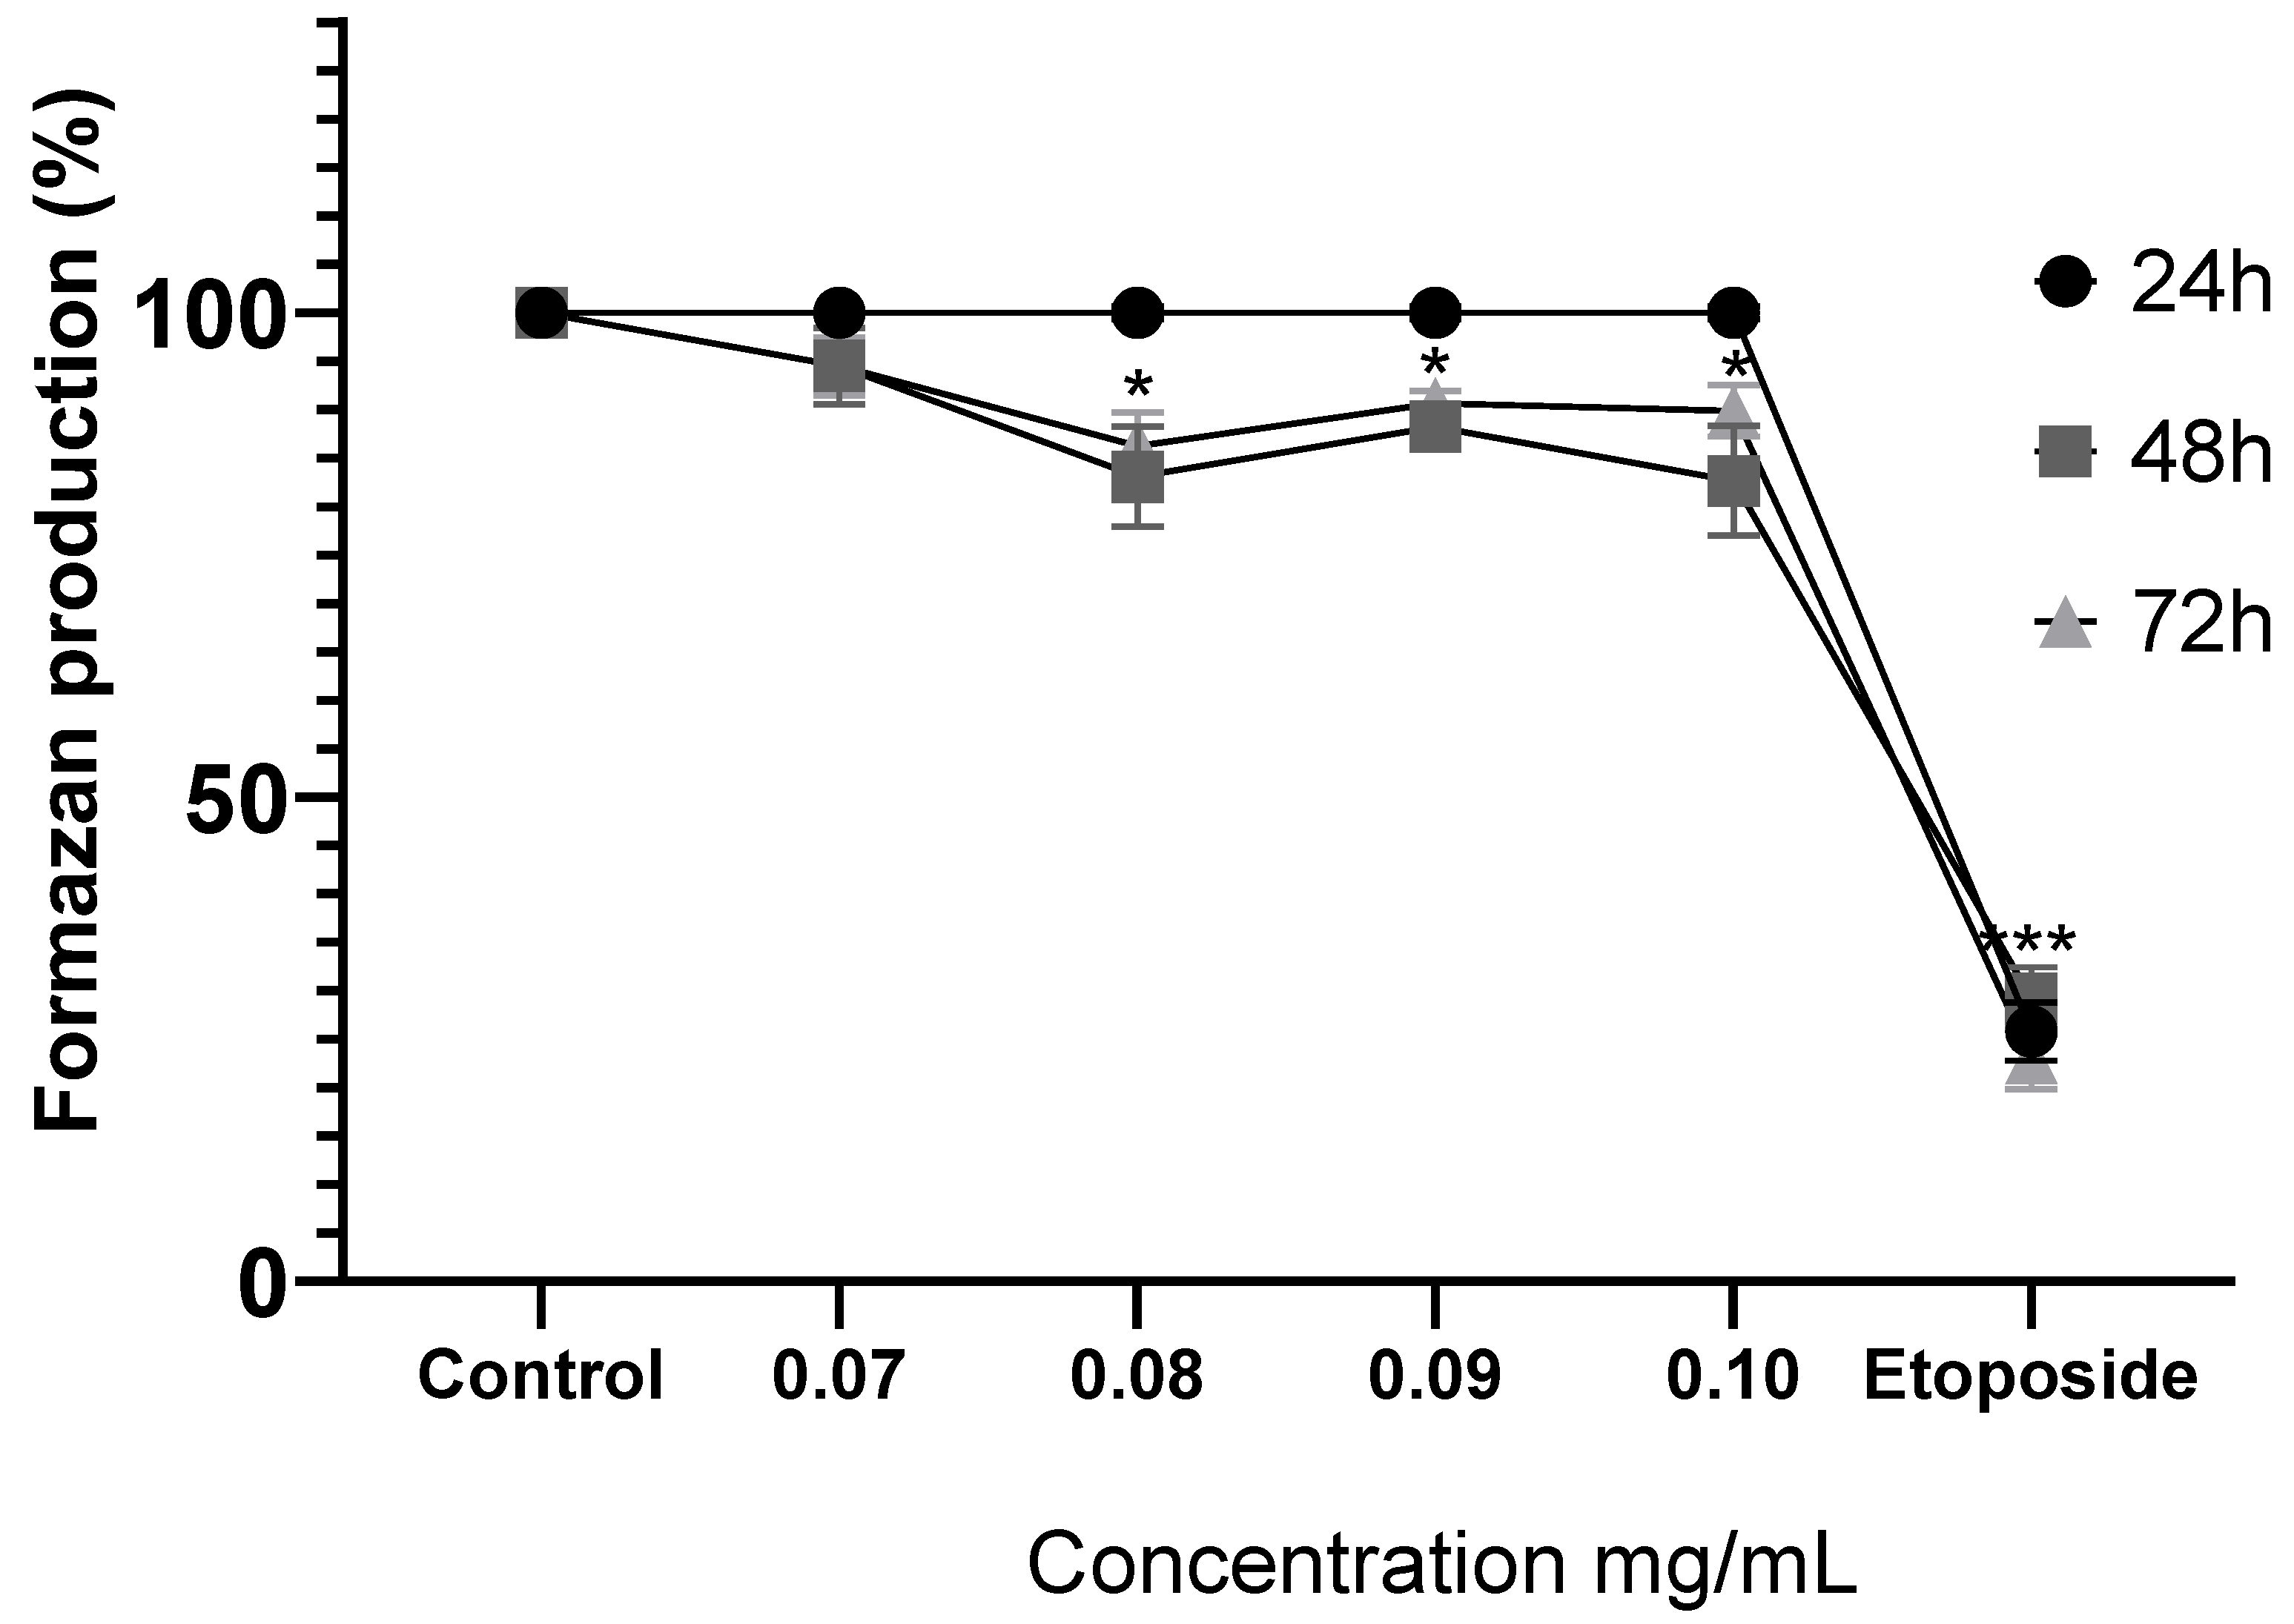
Figure 5.
Percentage of formazan produced after treatment with MoI for 48 hours, etoposide (0.18mg/mL) was used as cell death-control, the determination was performed by MTT assay, the percentage was calculated in comparison to the untreated group taking it as 100% formazan production. Results are expressed as mean ± standard deviation of three independent experiments performed in triplicate. Analysis of variance between groups was performed using ANOVA and Dunnett's post-hoc test (*** = p<0.001, compared with control). .
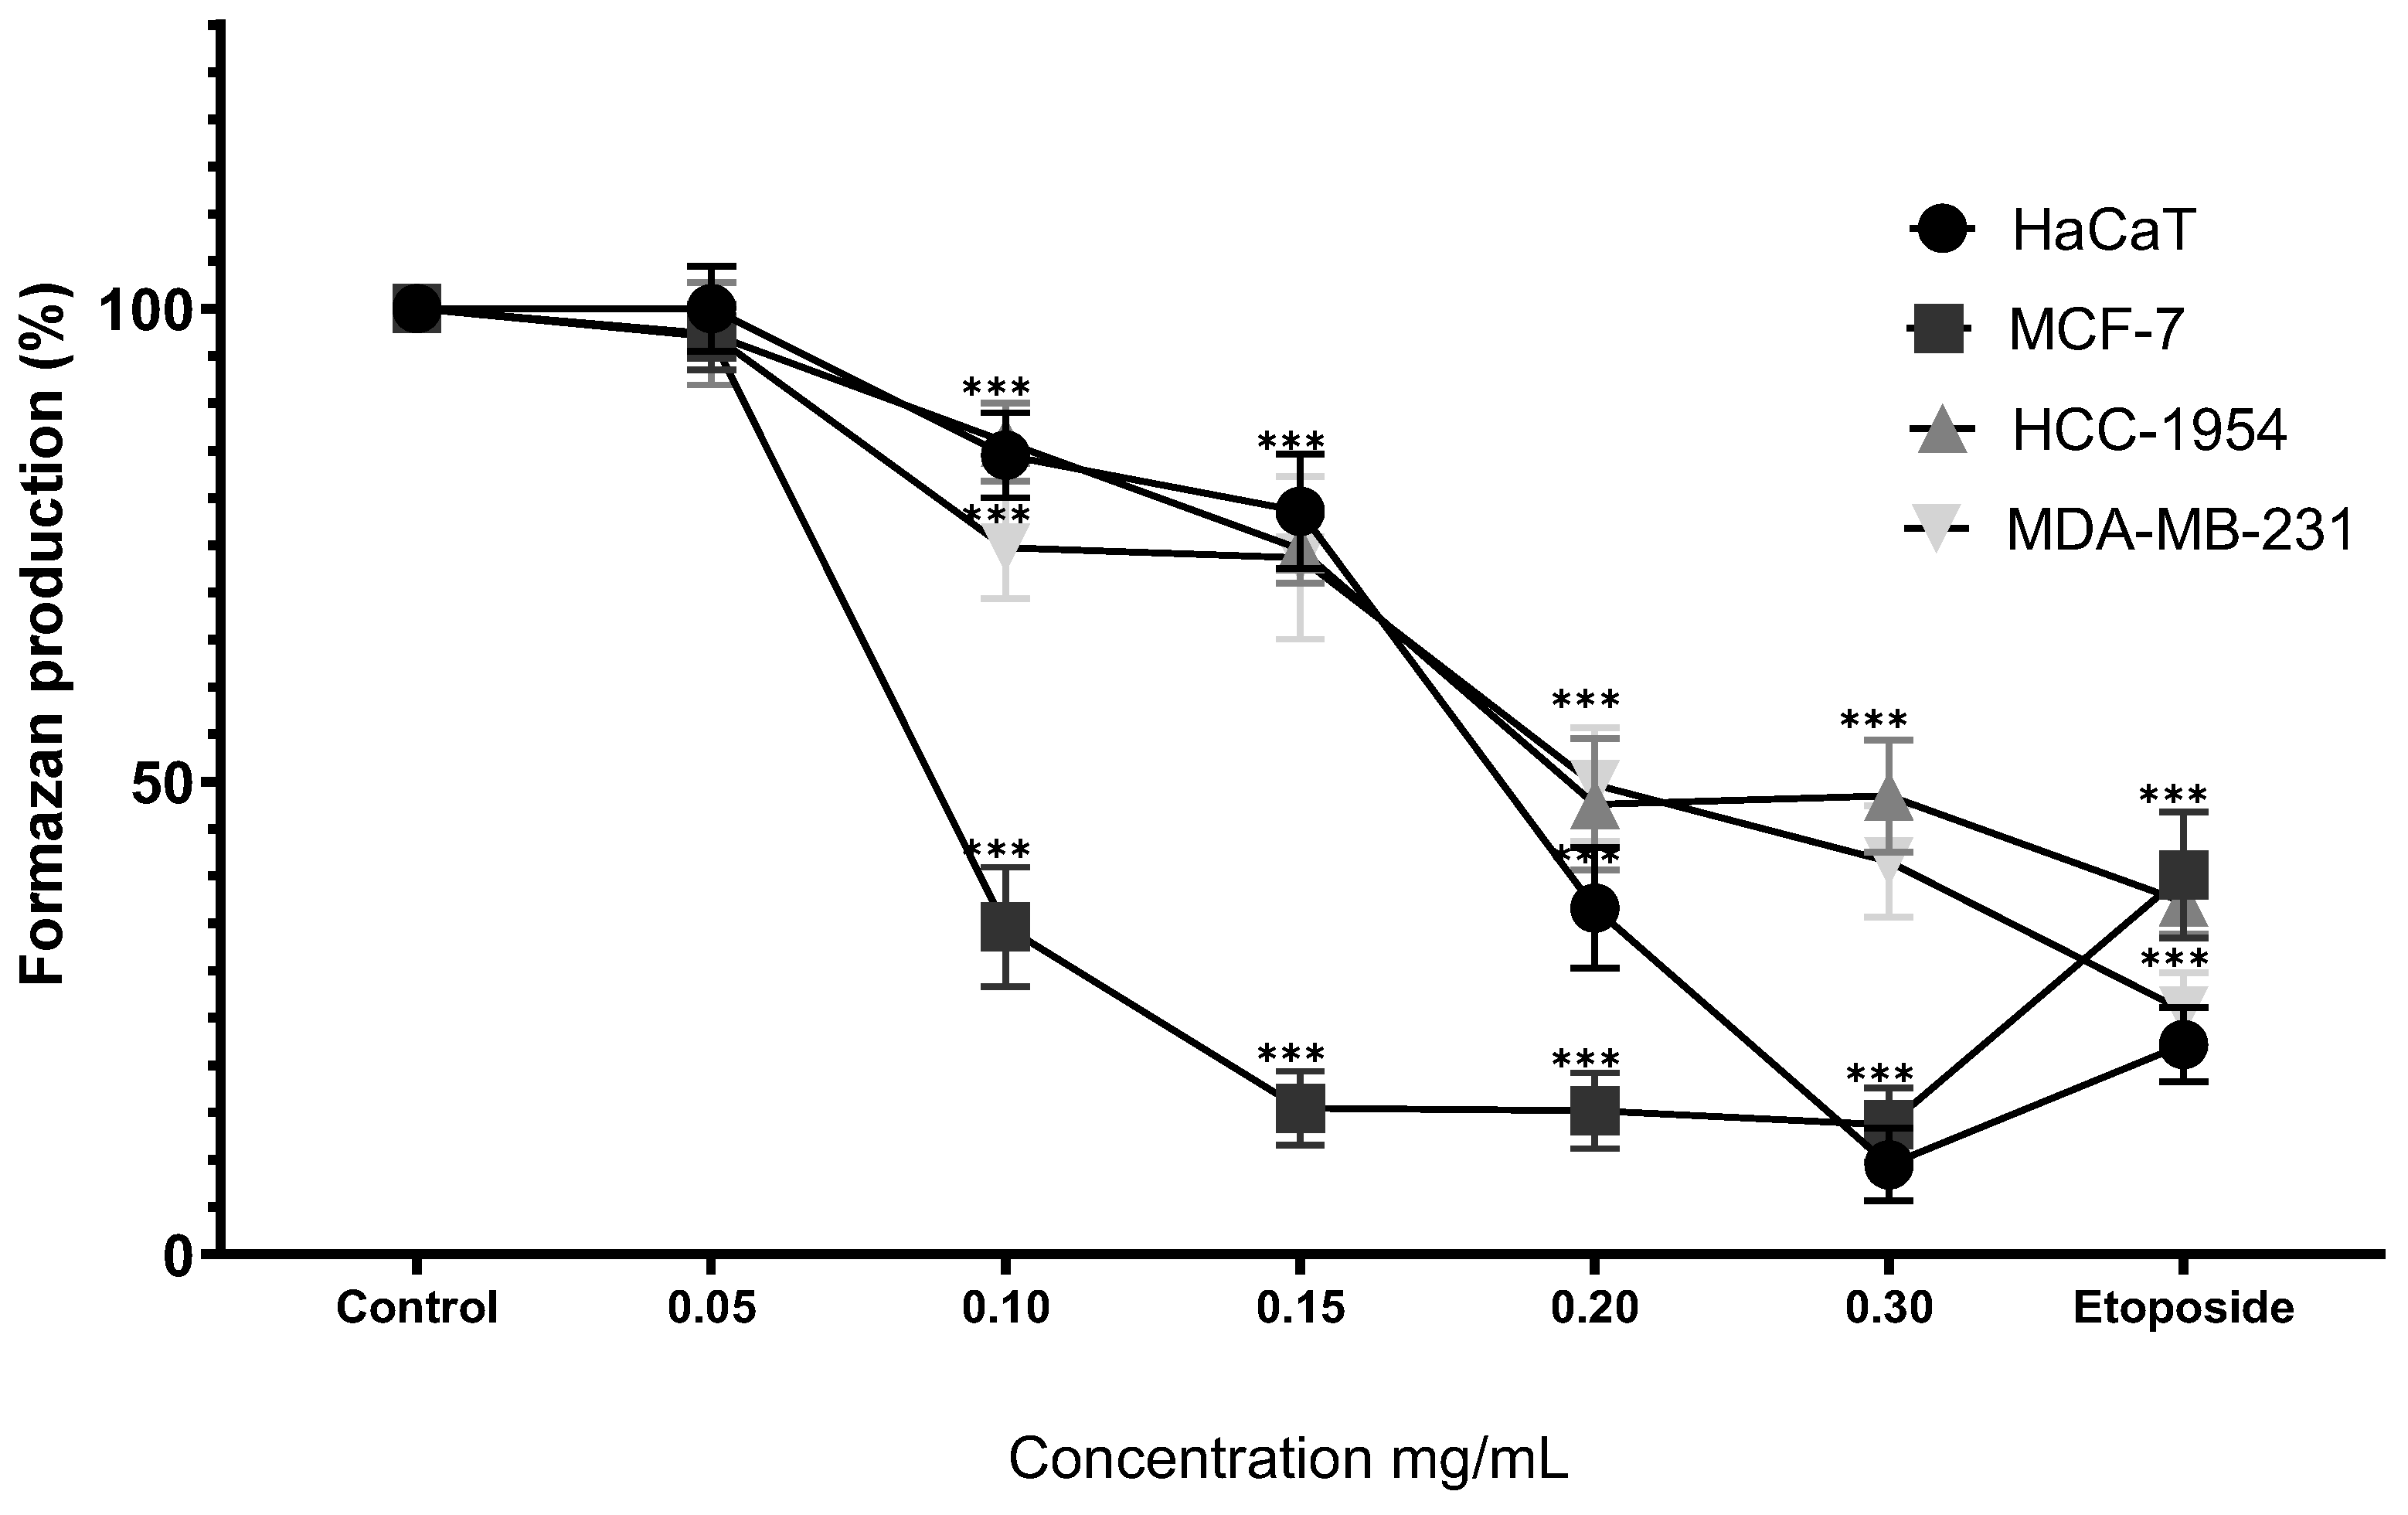
Figure 6.
Percentage of formazan produced after treatment with Cv for 24 hours, etoposide (0.18mg/mL) was used as cell death-control, the determination was performed by MTT assay, the percentage was calculated in comparison to the untreated group taking it as 100% formazan production. Results are expressed as mean ± standard deviation of three independent experiments performed in triplicate. Analysis of variance between groups was performed using ANOVA and Dunnett's post-hoc test (*** = p<0.001, compared with control). .
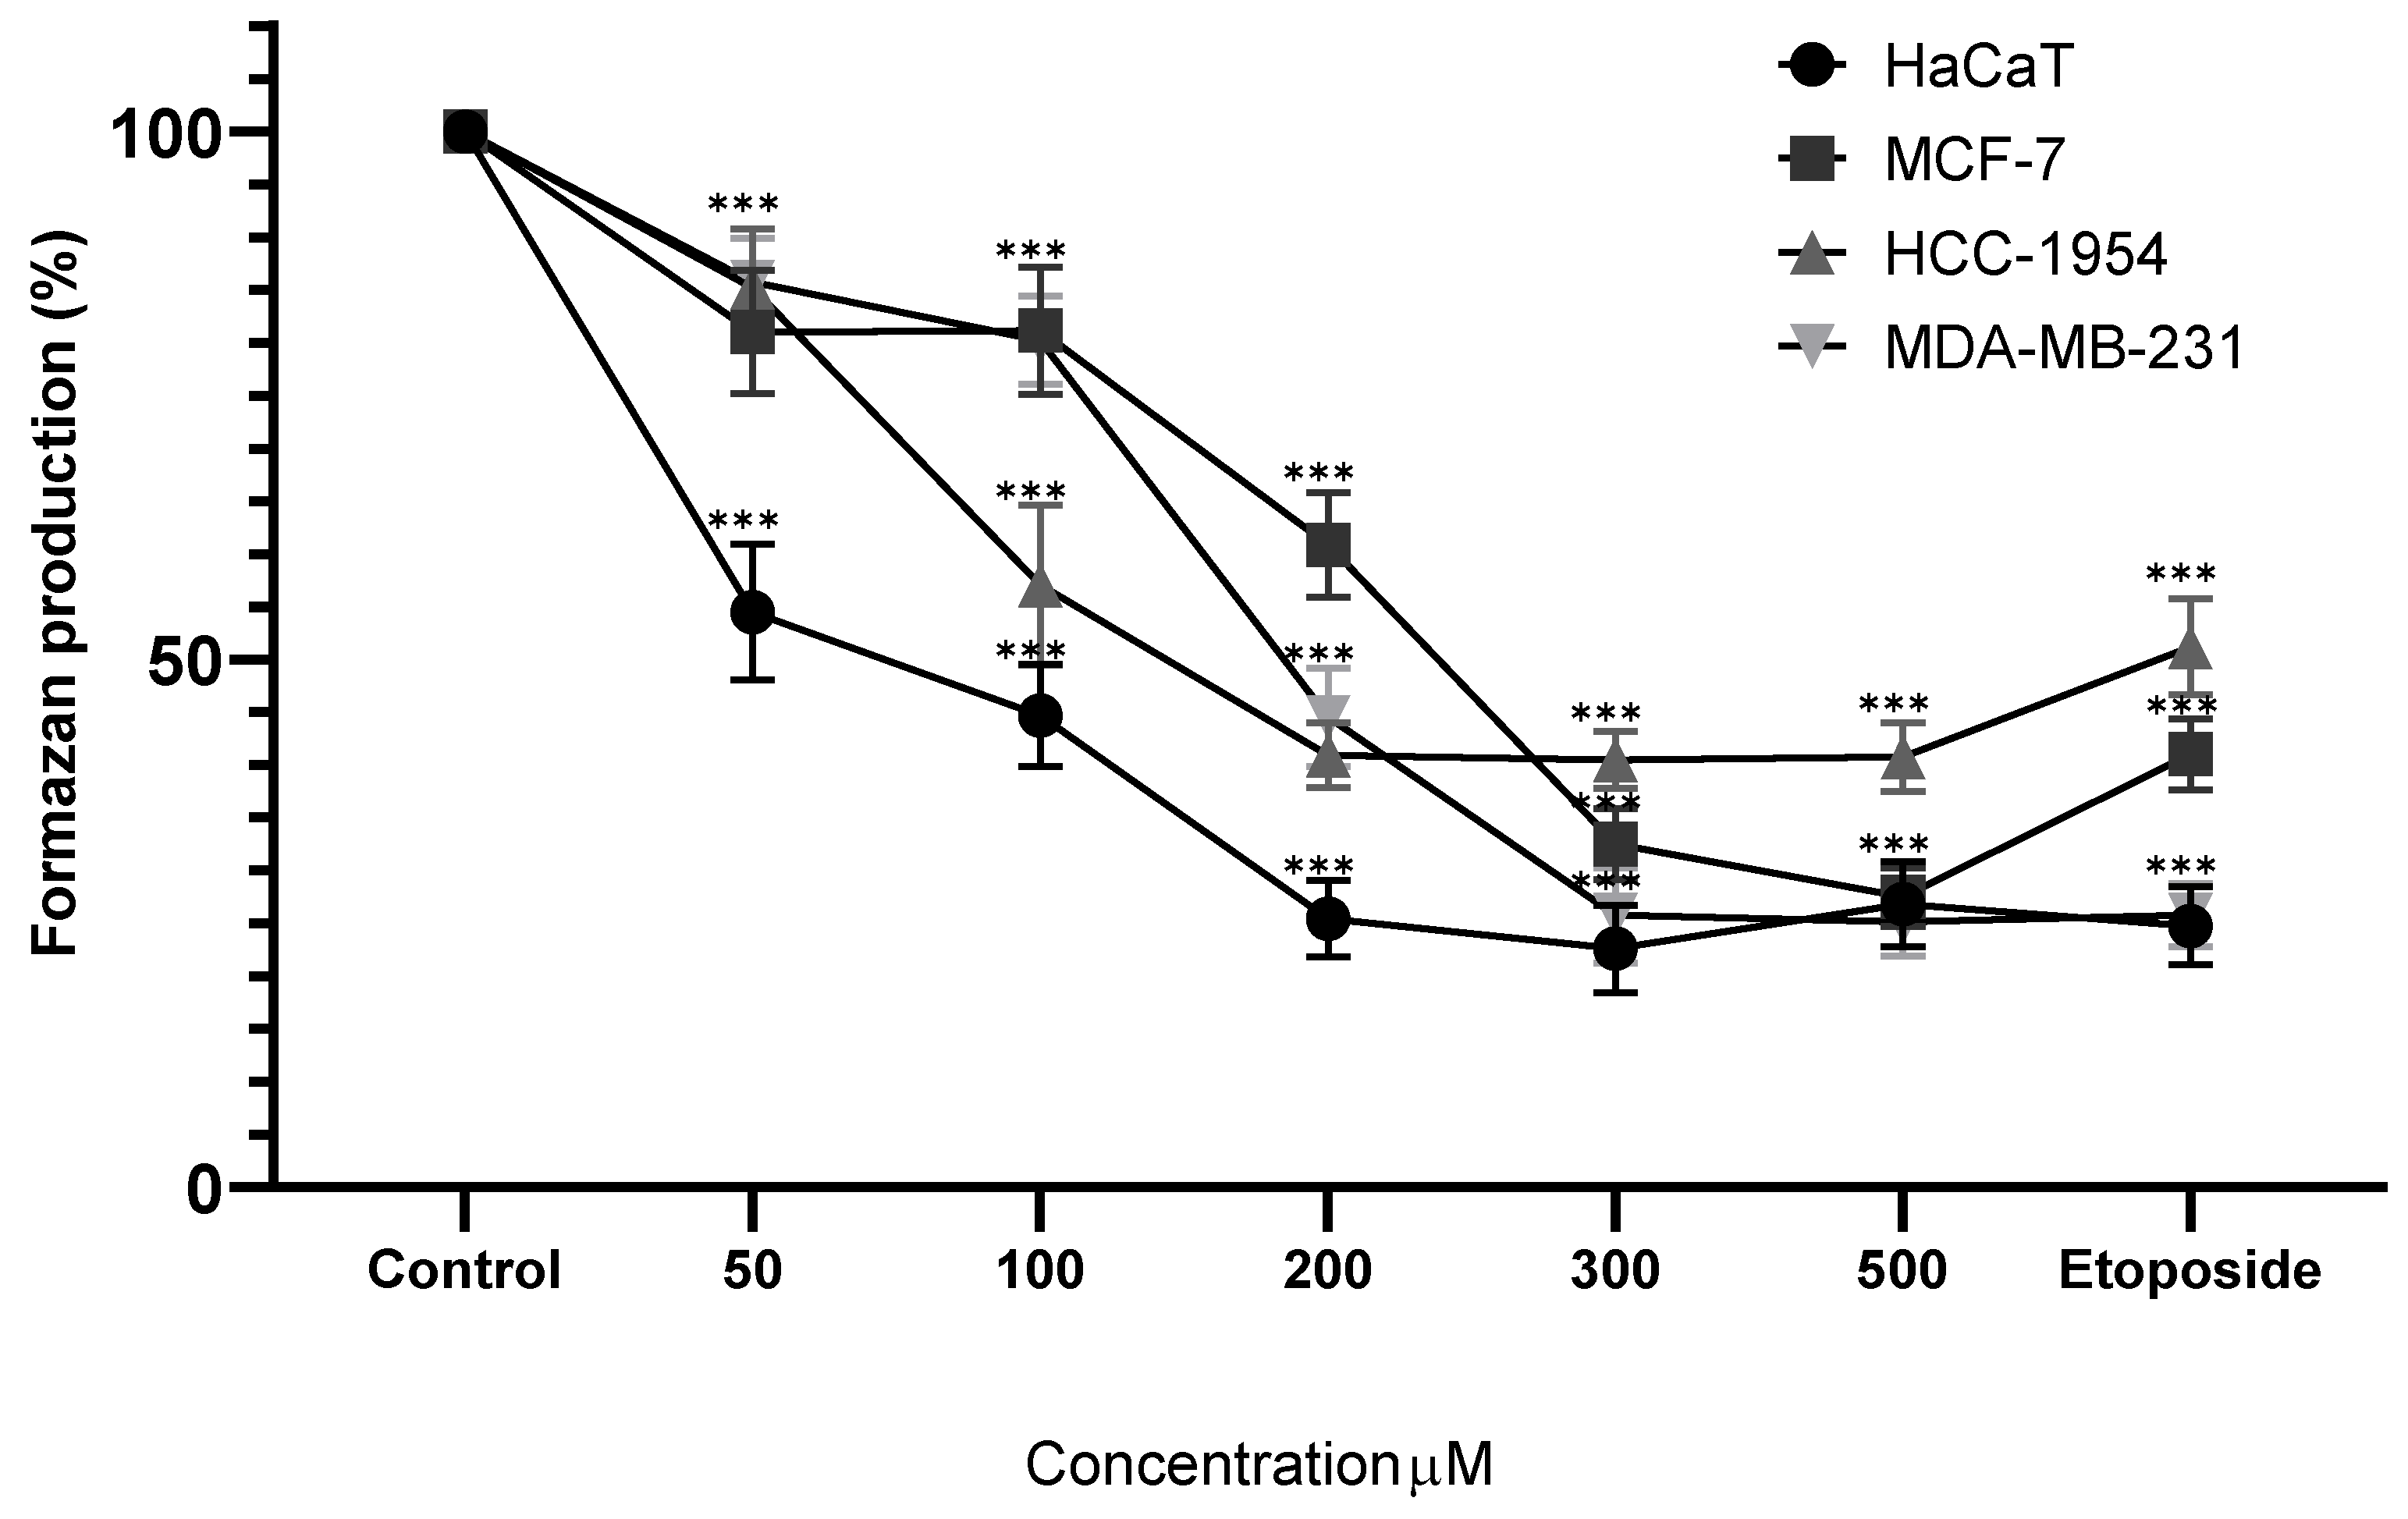
Figure 7.
Cytotoxicity of MoI and Cv was assessed by quantifying LDH release in the supernatant of treated cells. Cells were exposed to the IC50 of both treatments. A control group treated with the lysis buffer included in the kit was used to define 100% cytotoxicity. Results are expressed as mean ± standard deviation of three independent experiments performed in triplicate. Mean comparisons between groups were conducted using Student’s t-test (*** = p < 0.001).
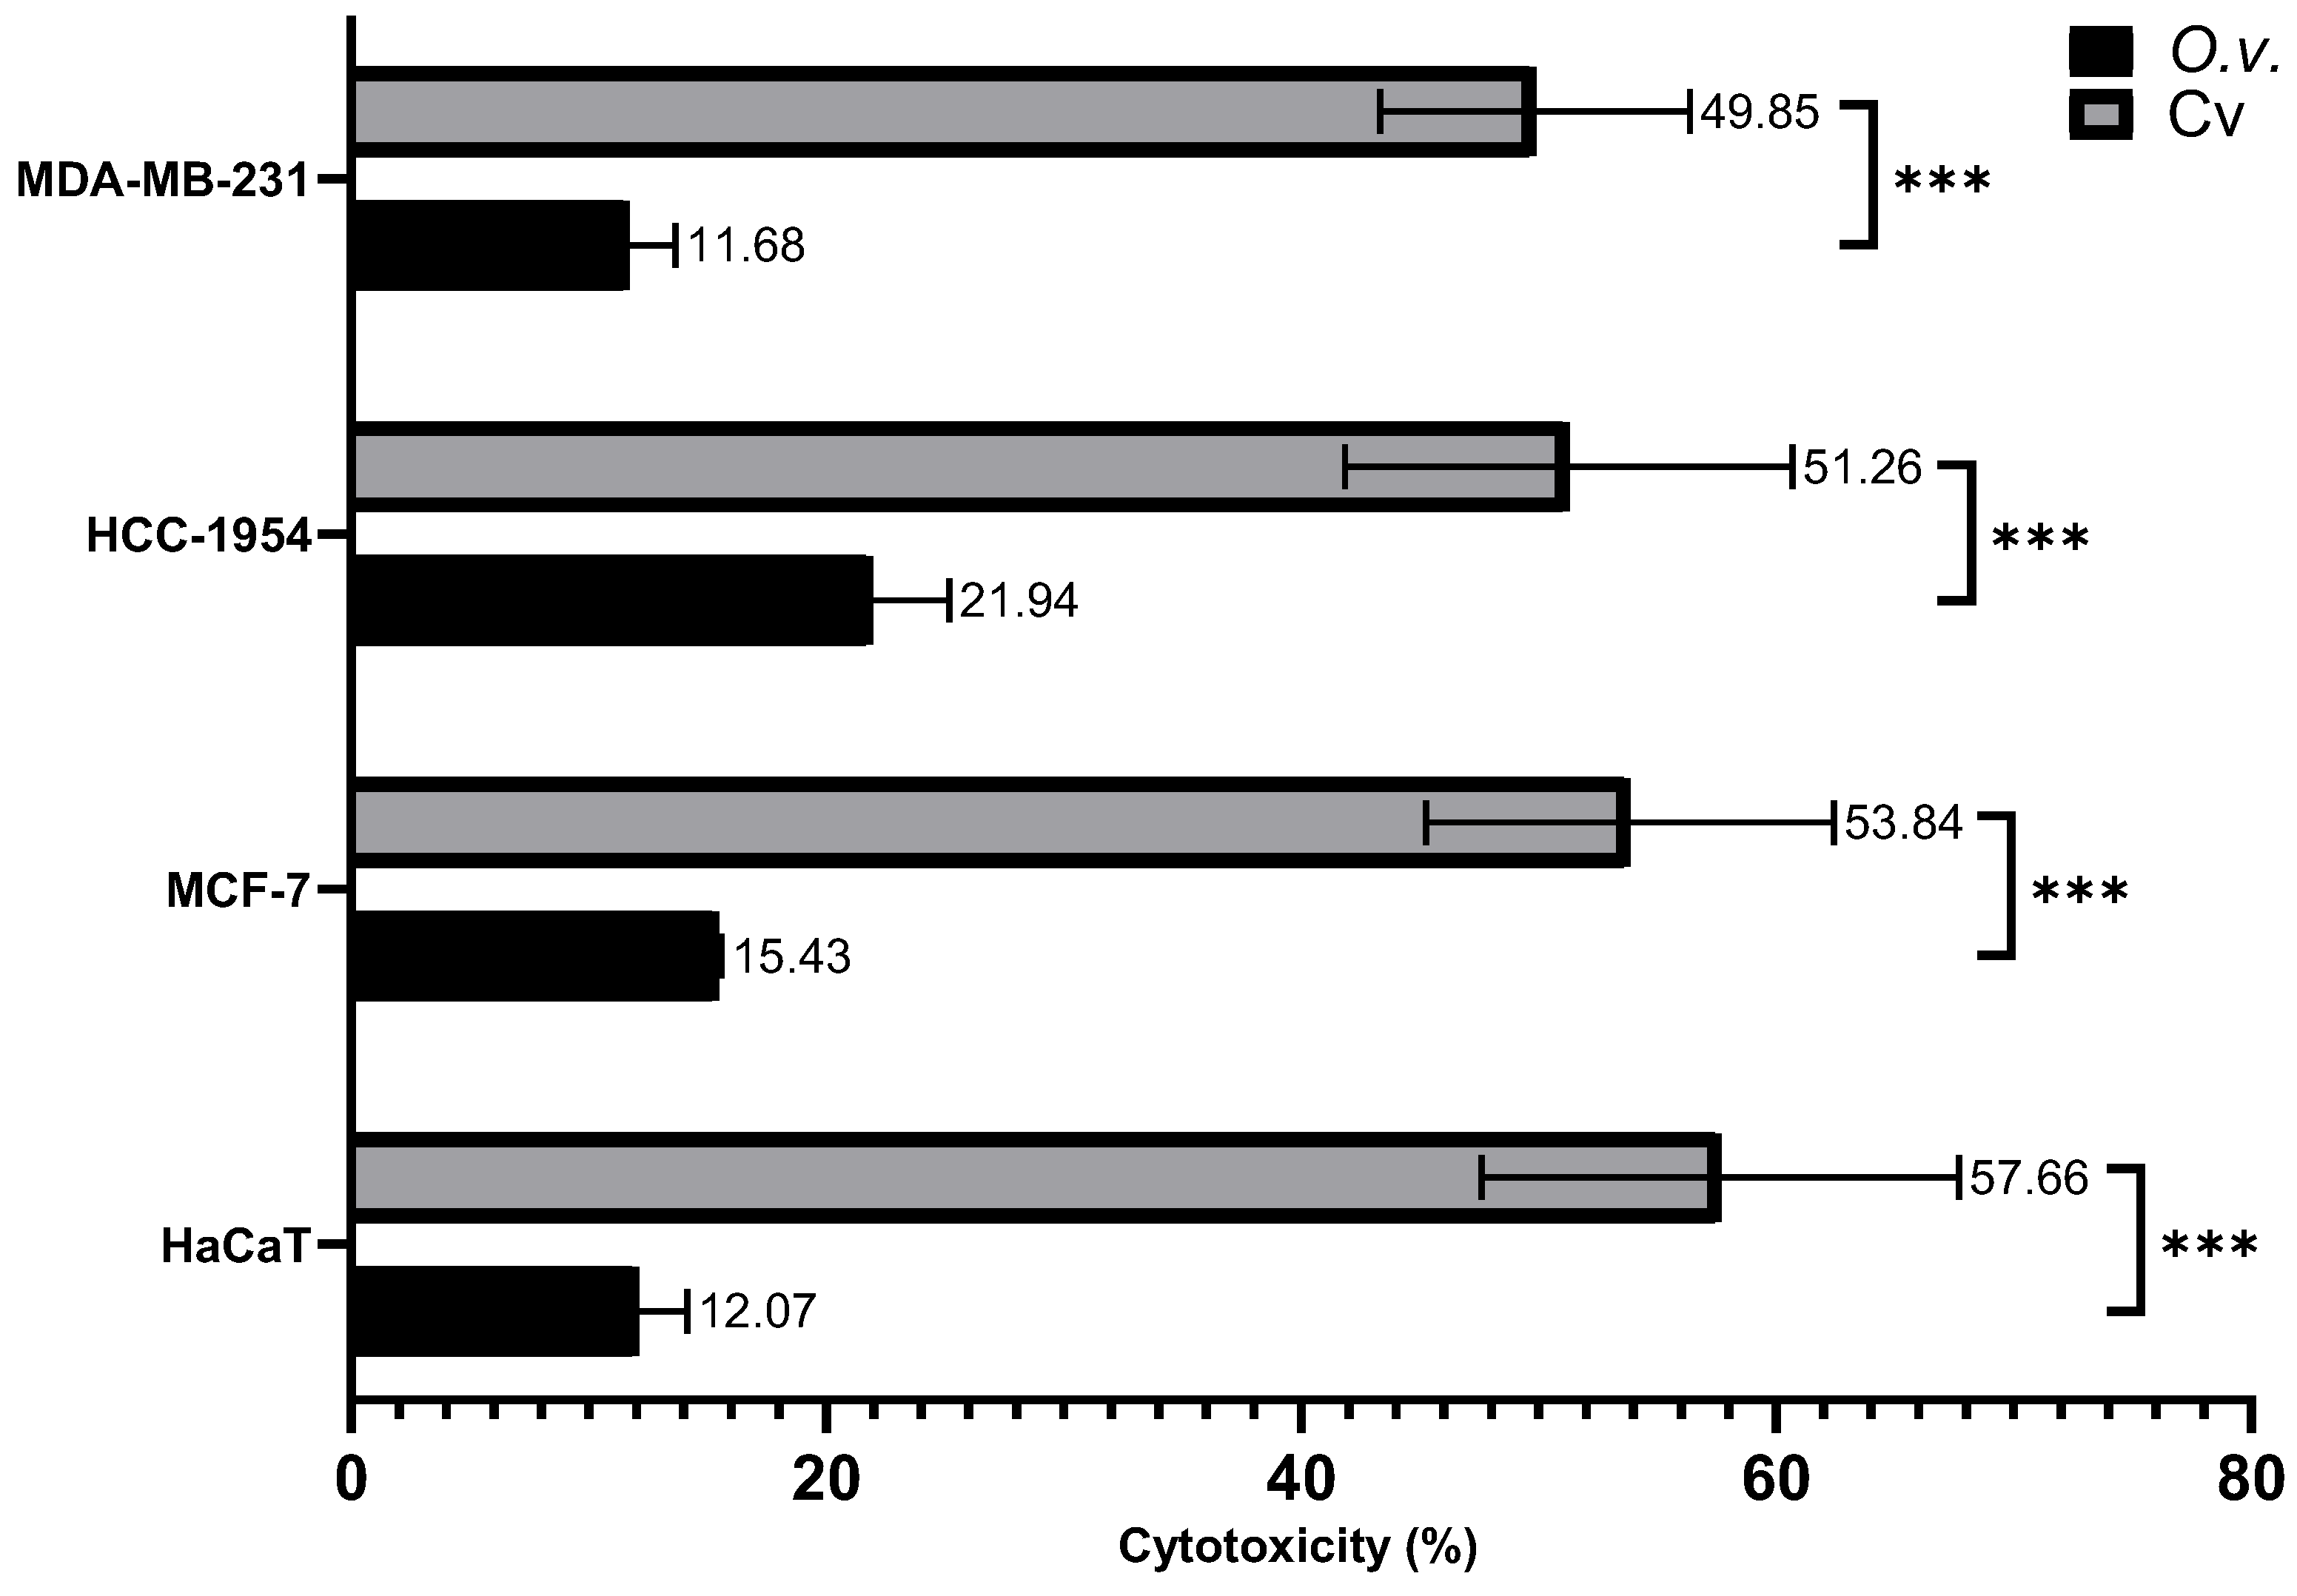

Table 1.
Bromatological analysis of the L. graveolens.
| Nutritional content | Per 100g |
| Energy content | 209.6 Kcal (876.9 KJ) |
| Moisture | 7.8% |
| Ash | 6.6% |
| Protein | 6.8g |
| Total fat | 4.2g |
| Available carbohydrates | 36g |
| Dietary fiber | 38.6g |
Table 2.
Total phenolic and flavonoids content and antioxidant capacity (DPPH, ABTS and FRAP) of MoI.
Table 2.
Total phenolic and flavonoids content and antioxidant capacity (DPPH, ABTS and FRAP) of MoI.
| ABTS | DPPH | Total phenolics | Total flavonoids | FRAP |
| 42.837 ± 0.175 mMEQ Trolox/ g | 66.303 ± 0.228 mMEQ Trolox/ g | 27.765 ± 1.095 mgGAE/g |
22.343 ± 0.096 mg Eq quercetin/g | 109.85 ± 0.51 mMEQ FeSO4/ g |
Table 3.
IC50 of MoI and Cv in each cell line.
| Cell line | MoI IC50 | Cv IC50 |
| HaCaT | 0.18mg/mL | 110µM |
| MCF-7 | 0.08mg/mL | 211µM |
| HCC-1954 | 0.15mg/mL | 123µM |
| MDA-MB-231 | 0.17mg/mL | 121µM |
Disclaimer/Publisher’s Note: The statements, opinions and data contained in all publications are solely those of the individual author(s) and contributor(s) and not of MDPI and/or the editor(s). MDPI and/or the editor(s) disclaim responsibility for any injury to people or property resulting from any ideas, methods, instructions or products referred to in the content. |
© 2025 by the authors. Licensee MDPI, Basel, Switzerland. This article is an open access article distributed under the terms and conditions of the Creative Commons Attribution (CC BY) license (http://creativecommons.org/licenses/by/4.0/).
Copyright: This open access article is published under a Creative Commons CC BY 4.0 license, which permit the free download, distribution, and reuse, provided that the author and preprint are cited in any reuse.


