Submitted:
16 May 2025
Posted:
19 May 2025
You are already at the latest version
Abstract
This study analyzes the dynamics of entrepreneurial activity in the mountain construction sector in Europe, focusing on the years 2021 and 2022, with extrapolation for 2025. Using a quantitative approach, the research adopts a mixed research design that includes both longitudinal and cross-sectional elements. Data were collected from official European sources, primarily Eurostat, and analyzed using advanced statistical techniques, including descriptive statistics, t-tests, ANOVA, regression, and factor analysis. The aim of the research is to provide a comprehensive understanding of trends, survival rates, business fluctuations, and employment patterns in mountain construction enterprises. During the analyzed period, the mountain entrepreneurship sector in construction across Europe recorded a moderate increase in the average of most financial and operational indicators (notably a general upward trend, high dispersion, positively skewed distributions, and performance polarization), despite persistently high levels of variation and marked positive skewness, indicating a concentration of performance among a limited number of entities. The results suggest a stable and moderately growing sector, characterized by small-sized enterprises with a steady survival rate and limited expansion. The study provides valuable insights for the formulation of policies aimed at supporting the long-term sustainable development of this sector.
Keywords:
construction sector
; European series
; mountain entrepreneurship
Introduction and Literature Review
The mountain construction sector is essential for the development of Europe’s mountainous regions, having a significant impact on local economies and creating jobs in hard-to-reach areas. Entrepreneurship in this field is often marked by specific challenges, including difficult geographical and climatic conditions, but also by opportunities for sustainable development and innovation. Previous studies have emphasized the importance of this sector, especially in the context of regional economies that heavily depend on tourism and other seasonal industries.
In the research on mountain entrepreneurship, the literature has highlighted that small and medium-sized enterprises (SMEs) dominate this sector, being responsible for a large share of economic activity. Moreover, mountain enterprises are characterized by a low survival rate, influenced by specific economic and environmental factors as well as demand fluctuations. The success of enterprises in the mountain construction sector largely depends on their adaptability to regional conditions and their ability to meet market demands through smaller-scale projects and limited resources.
Findings from previous studies suggest that despite these challenges, the mountain construction sector is continuously expanding, albeit at a moderate pace. This can be attributed to a constant demand for local infrastructure and the limited expansion of businesses focused on maintaining a high level of sustainability and stability. Thus, research indicates that enterprises in this sector are often involved in small and medium-scale infrastructure projects, which explains the prevalence of small firms and their relatively low impact on the labor market in mountainous regions.
Several studies have shown that the success of mountain entrepreneurship depends on factors such as access to financing, innovation in the use of local resources, and the management skills of entrepreneurs. For example, in the Alpine region, where the mountain construction sector is relatively well developed, entrepreneurs tend to focus on using environmentally friendly materials and building structures that meet the specific needs of mountain regions.
In addition to economic and environmental factors, prior research underlines the importance of understanding how employment patterns and capital flows influence the sustainability of businesses in this sector. Policies supporting mountain entrepreneurship should focus on encouraging innovation and continuous human capital development to ensure long-term success.
The construction sector plays a crucial role in the economic development of Europe’s mountainous regions, significantly impacting job creation and the stimulation of local economic activity. In recent years, research has highlighted the importance of entrepreneurship in this sector, emphasizing how entrepreneurial initiatives can lead to sustainable and innovative development in mountain areas. (Tăut & Brejea, 2020)
Rey (1995) underscores the importance of integrating mountain education into the sustainable economic development of Romania’s mountain regions. He argues that investment in mountain education can generate a sustainable, ecological economy and promote a culture of authentic economic patriotism. In his view, one form of entrepreneurship involves creating mobile mountain university caravans that offer practical courses in mountain economy directly in farmers’ households, tailored to the needs and realities of rural mountain communities. This approach could contribute to revitalizing the mountain economy and preserving the area’s cultural traditions. Thus, Rey considers mountain education essential for developing a sustainable mountain economy and for conserving the traditional values of mountain communities (Rey, 1985; arhiepiscopiasucevei.ro).
Numerous authors have emphasized the importance of entrepreneurship through various forms and types of development, highlighting the role of innovation in this sector (Gann & Salter, 2000).
In their studies, Ruddock & Ruddock (2009) and Goh Loosemore (2017) investigate the relationship between innovation and entrepreneurship in the construction industry, emphasizing how entrepreneurs can drive progress in the sector.
The book Enterprise and Small Business: Principles, Practice and Policy offers a solid foundation for understanding entrepreneurship in various sectors, including construction, and provides a theoretical framework for analyzing the sector through an entrepreneurial lens (Carter & Jones-Evans, 2006).
Another article (Miocevic, 2025) analyzes the role of entrepreneurship in the construction industry, with a special focus on the opportunities and challenges faced by entrepreneurs in this sector.
Vassallo’s (2016) study explores how digitalization and emerging technologies impact entrepreneurship, highlighting their influence on competitiveness and innovation.
Several studies conducted by Edum-Fotwe et al. (1994, 1995, 2009) focus on cost control in construction, offering insights into how entrepreneurs can navigate economic and financial challenges in the construction sector.
A study by Ivașciuc and Ispas (2023) analyzes the motivations, skills, and opportunities of young entrepreneurs involved in sustainable tourism in Romania’s Carpathians. The research shows that intrinsic motivations—such as the desire to contribute to environmental conservation and to promote local traditions—are predominant among young entrepreneurs. Additionally, managerial skills and knowledge of alternative energy sources play a crucial role in implementing sustainable business practices. The study emphasizes the importance of cooperation between entrepreneurs and local communities to harness natural and cultural resources for the sustainable development of mountain tourism.
Covaci and Covaci (2025) provide a detailed analysis of sustainable entrepreneurship in European mountain regions, using statistical methods, neural networks, and fractal analyses. Their study highlights the essential role of industrial and service sectors in supporting the regional economy. Moreover, their research underscores the need for greater structural coherence within communities and the importance of territorial marketing strategies that emphasize shared cultural and linguistic identities.
In another study, Ioniță et al. (2020) examine sustainable entrepreneurial ecosystems in transitional economies, focusing on two urban regions in Romania: Bucharest and Cluj-Napoca. The research highlights the importance of educational institutions and support networks in developing sustainable entrepreneurship. The study also points out differences in entrepreneurs’ perceptions of local entrepreneurial ecosystems and the need to adapt development strategies to regional specificities.
These studies emphasize the complexity and diversity of factors influencing entrepreneurial development in the construction sector of Europe’s mountainous regions. To support the sustainable development of this sector, it is essential to implement public policies that encourage innovation, collaboration among different economic actors, and investments in the professional training of young entrepreneurs. At the same time, leveraging local resources and promoting cultural identity can contribute to increasing the attractiveness of mountain regions and strengthening local economies.
The specialized literature highlights that the mountain construction sector in Europe, although facing specific challenges, shows stable dynamics and moderate growth, dominated by small and medium-sized enterprises focusing on small and medium-sized projects. Moreover, studies suggest that success in this sector depends on the ability of enterprises to adapt to local conditions, implement sustainable technologies, and maintain effective management practices.
Methodology
This section presents the detailed methodological approach used in conducting the research, with the aim of providing a clear and reproducible description of the scientific process followed. The methodology focuses on explaining the research design, data collection methods, and analysis techniques used to address the research questions.
The research is quantitative in nature and is based on the use of numerical data and statistical analyses to explore various aspects of mountain entrepreneurship in the construction sector in Europe. Accordingly, the analysis focuses on obtaining objective information that can be measured and quantified. The research strategy applied in this context includes a meta-analysis of data extracted from official and recognized European sources, namely Eurostat. The focus is on specific indicators of the mountain entrepreneurship sector in construction, taking into account a complex set of variables (tables and figures).
The research design is mixed, incorporating both longitudinal and cross-sectional components. The longitudinal research covers a two-year period (2021 and 2022), aiming to identify trends and changes in this sector over the medium term. The analysis also aims to be extended over a longer period, considering the dynamic nature of the mountain sector. On the other hand, the cross-sectional research focuses on analyzing 28 specific indicators that reflect the diversity and complexity of the phenomenon of mountain entrepreneurship in construction. These indicators were selected based on their relevance to the field of study and the availability of statistical data for analysis.
To analyze the collected data, quantitative statistical methods were used, allowing for the derivation of objective and well-founded conclusions. Among the statistical analysis techniques applied were descriptive statistics (such as mean and standard deviation) and advanced statistical tests, including the t-test, ANOVA, regression, and factor analysis. These tests were used to identify significant relationships between variables and to explore the influence of different factors on indicators of mountain entrepreneurship in construction. SPSS and Excel software were used to conduct the statistical analyses, enabling efficient and precise data processing and visualization.
An important aspect of the research was the validation and reliability of the models used. To ensure consistency and accuracy of results, the models were calibrated through internal consistency tests. These tests were conducted using multiple error-checking methods and several iterations of the same data sources. Data triangulation was another method used to verify results, by employing different dynamic datasets from the same sources, which contributed to increasing the validity of the conclusions drawn.
Within the SPSS analysis, each indicator underwent a rigorous evaluation process to determine its significance within the European mountain construction system. The indicators were analyzed in terms of their temporal evolution, as well as the diversity and influence of economic, social, and environmental factors. In this context, the research aims not only to provide a detailed overview of mountain entrepreneurship in construction, but also to offer useful recommendations for the long-term development of this sector, considering its specific characteristics.
Thus, the methodology used in this research provides a solid foundation for data analysis and for obtaining valuable conclusions that can guide future policies and strategies in the field of mountain entrepreneurship in construction.
The statistical indicators analyzed in the research exhibit specific characteristics that derive from the unique features of this sector. Each indicator reflects not only economic developments but also the geographic and environmental conditions that influence mountain entrepreneurship in construction. The data resulting from the statistical analysis were simulated under the methodological conditions described above. Each statistical indicator analyzed in SPSS was interpreted from multiple perspectives, having various meanings within the overall statistical analysis system. Therefore, the analysis was carried out by taking into account the specific context of mountain entrepreneurship in construction, as well as external variables that may influence these indicators.
The indicators’ definitions can be accessed via Eurostat or at the following link: [https://doi.org/10.5281/zenodo.14713867]. The analyzed dataset includes information for countries such as Sweden, Bulgaria, Czech Republic, Portugal, Italy, France, Greece, Slovenia, Austria, Slovakia, Romania, Spain, Poland, Germany, and Croatia. Data collection was carried out using Eurostat sources and subsequently processed by the authors using Excel and SPSS software.
Results
The data in the table and figures reflect the evolution of entrepreneurial activity and its impact on employment and economic development in this sector (tables in figures).
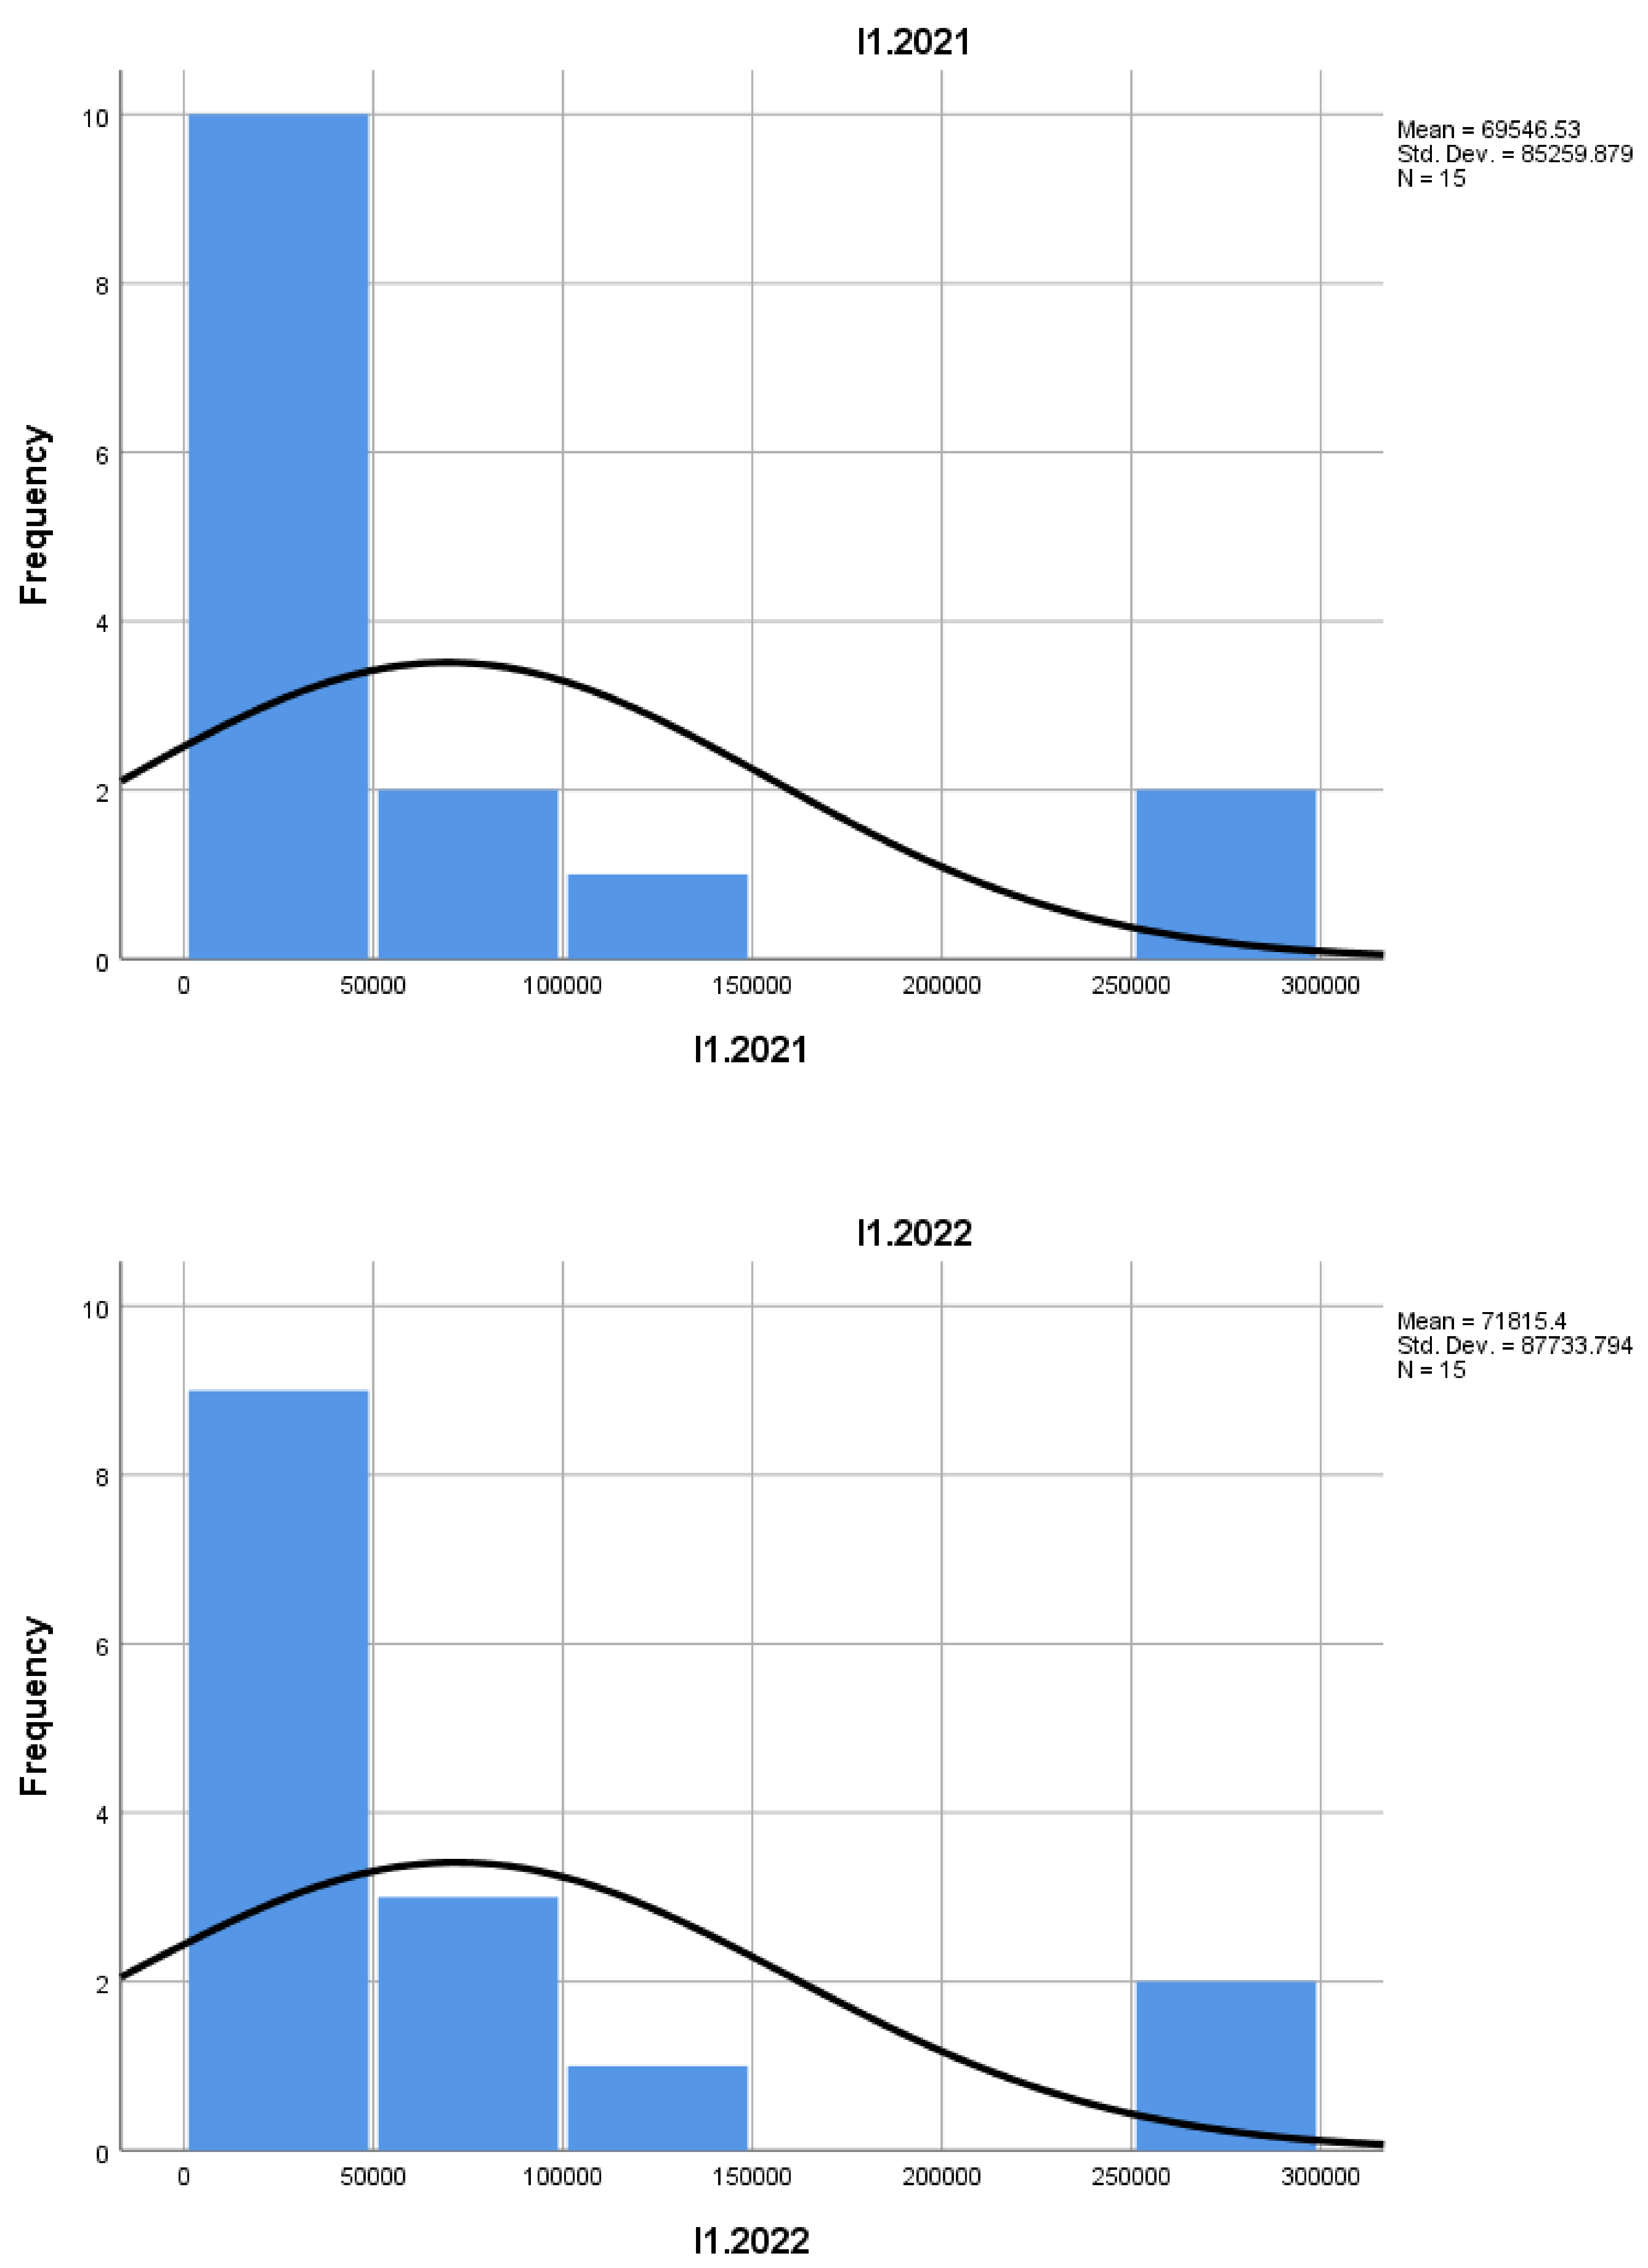
Indicator I1 shows the evolution of the number of enterprises in the mountain construction sector. Between 2021 and 2022, there is a slight increase in the average number of enterprises, from 69,546.53 in 2021 to 71,815.40 in 2022. This suggests a moderate expansion of the sector, which may indicate increased demand for construction services in mountain areas.
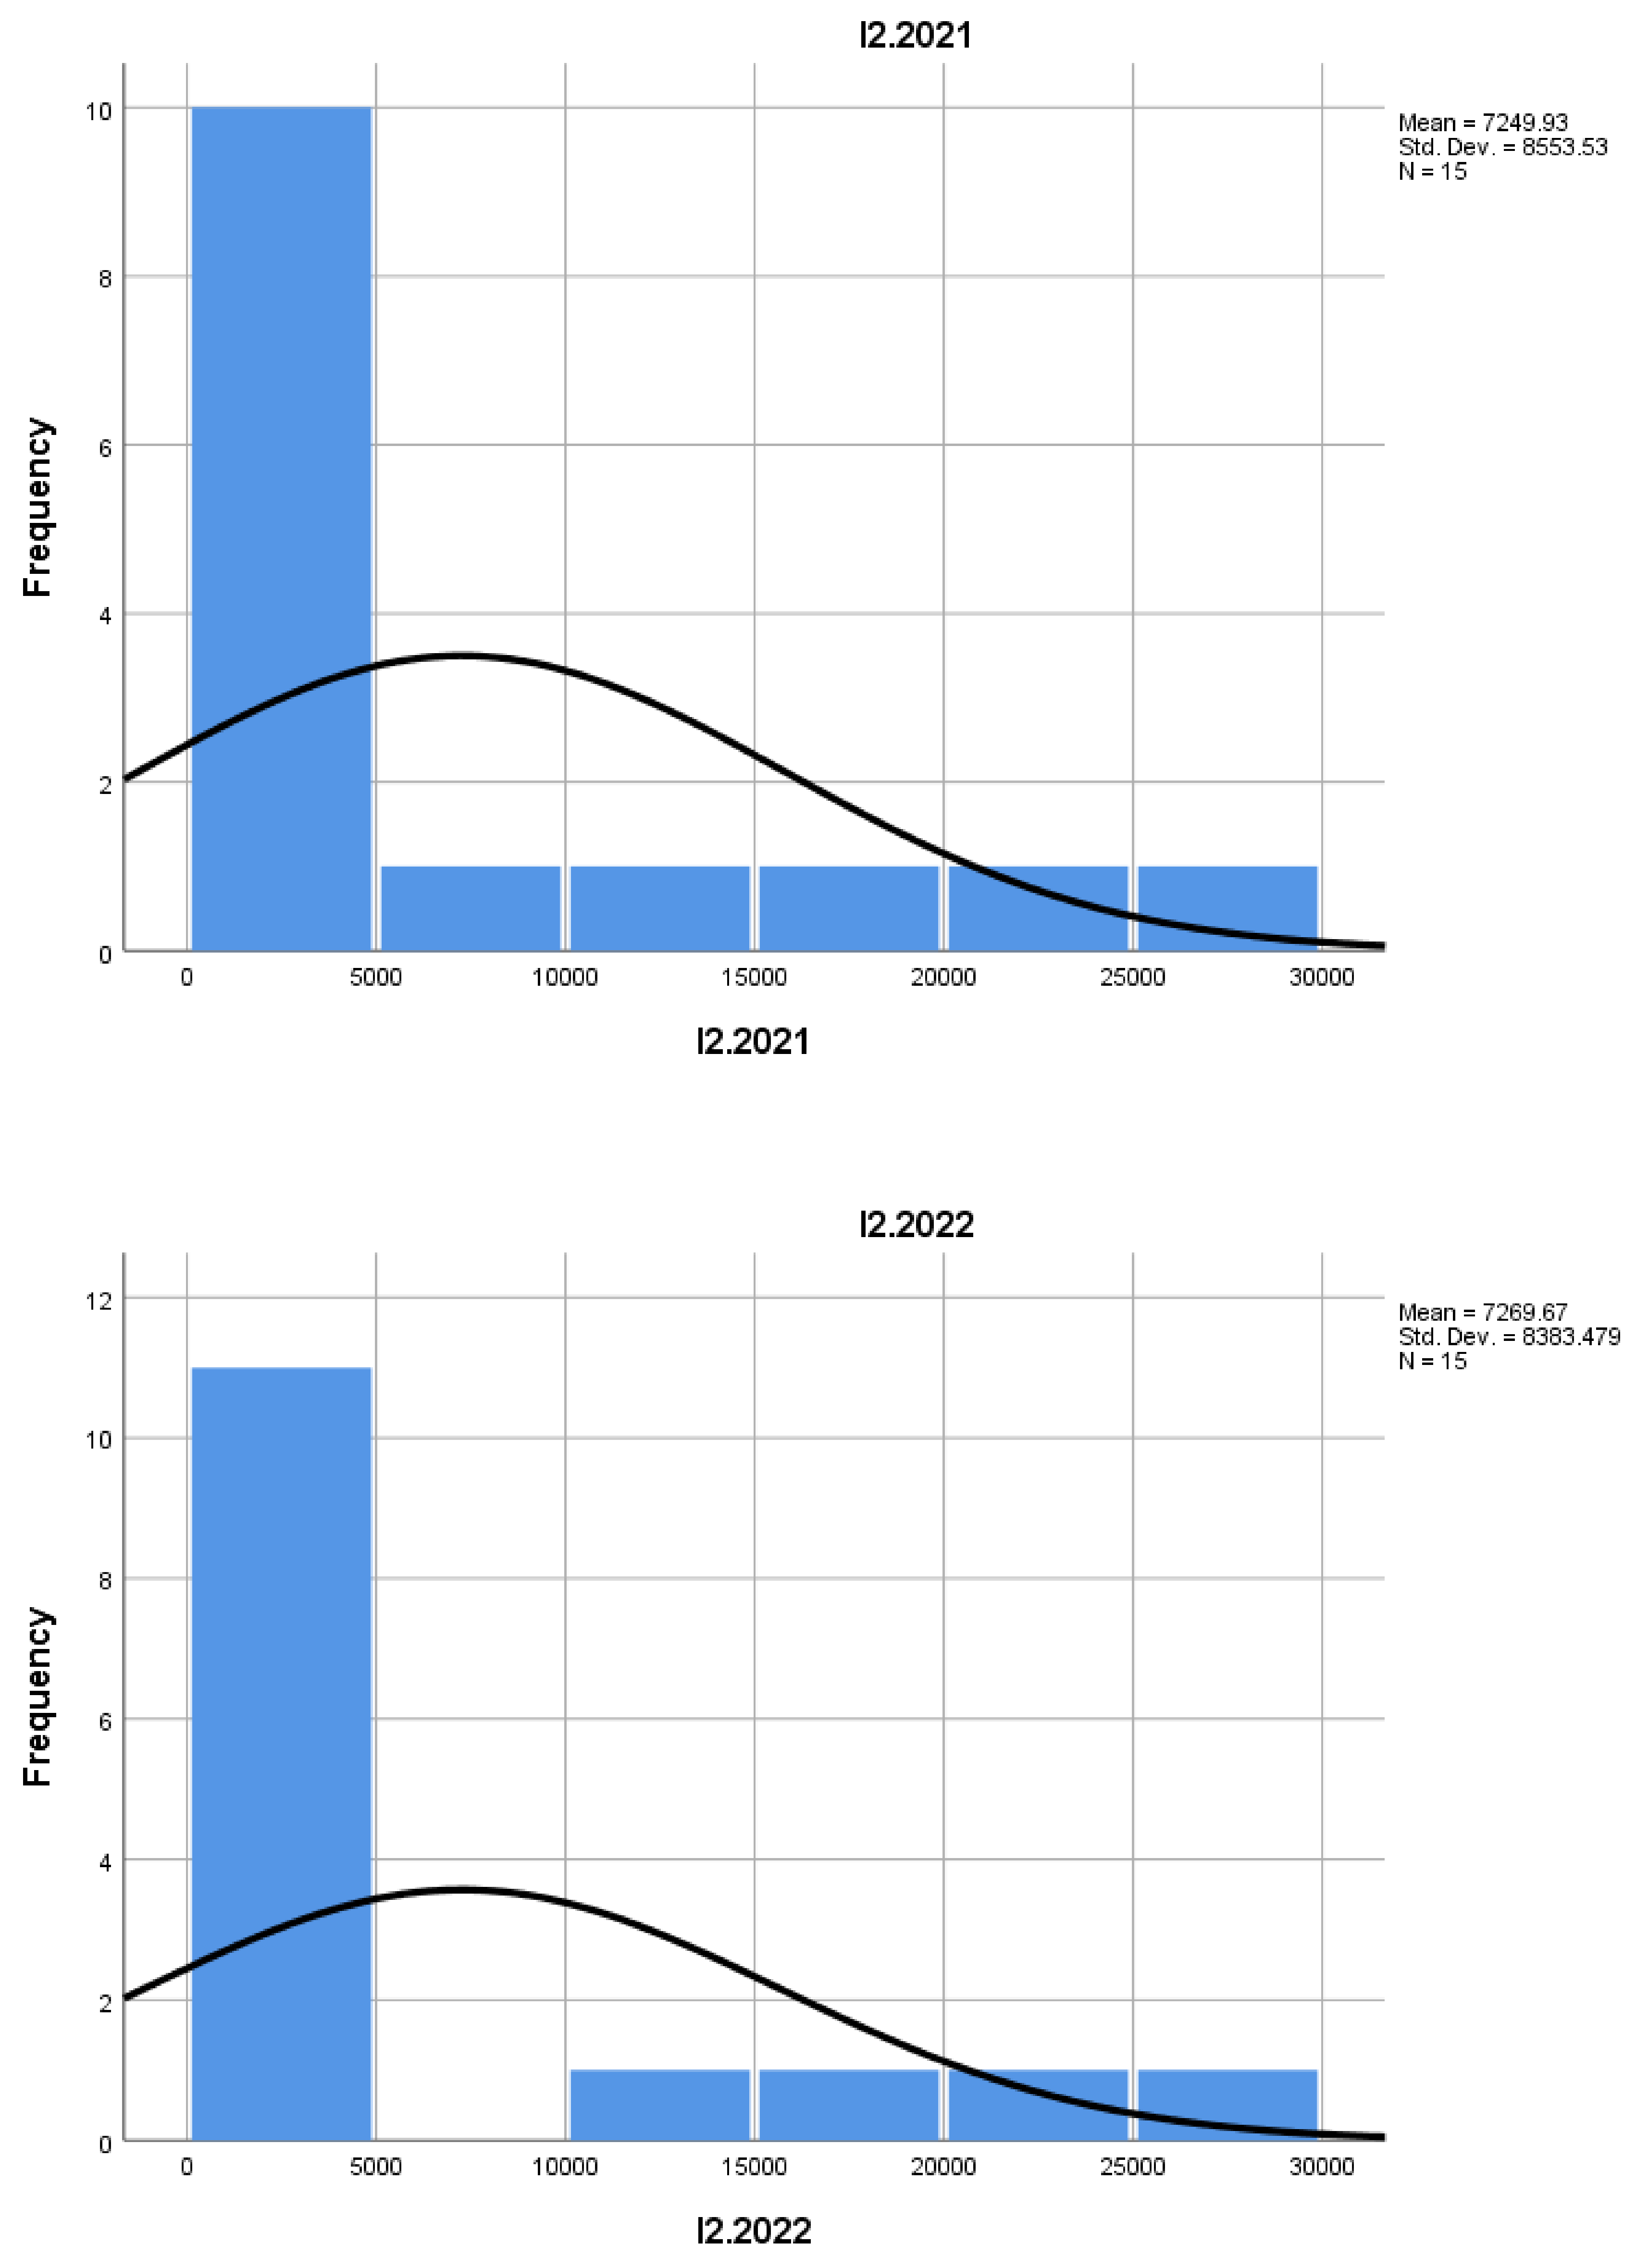
Indicator I2, concerning the birth of enterprises, reflects the number of new economic entities that have emerged. The average value of this indicator remains fairly constant (around 7,250), indicating stable entrepreneurial activity in the mountain sector, with no significant fluctuations during this period.
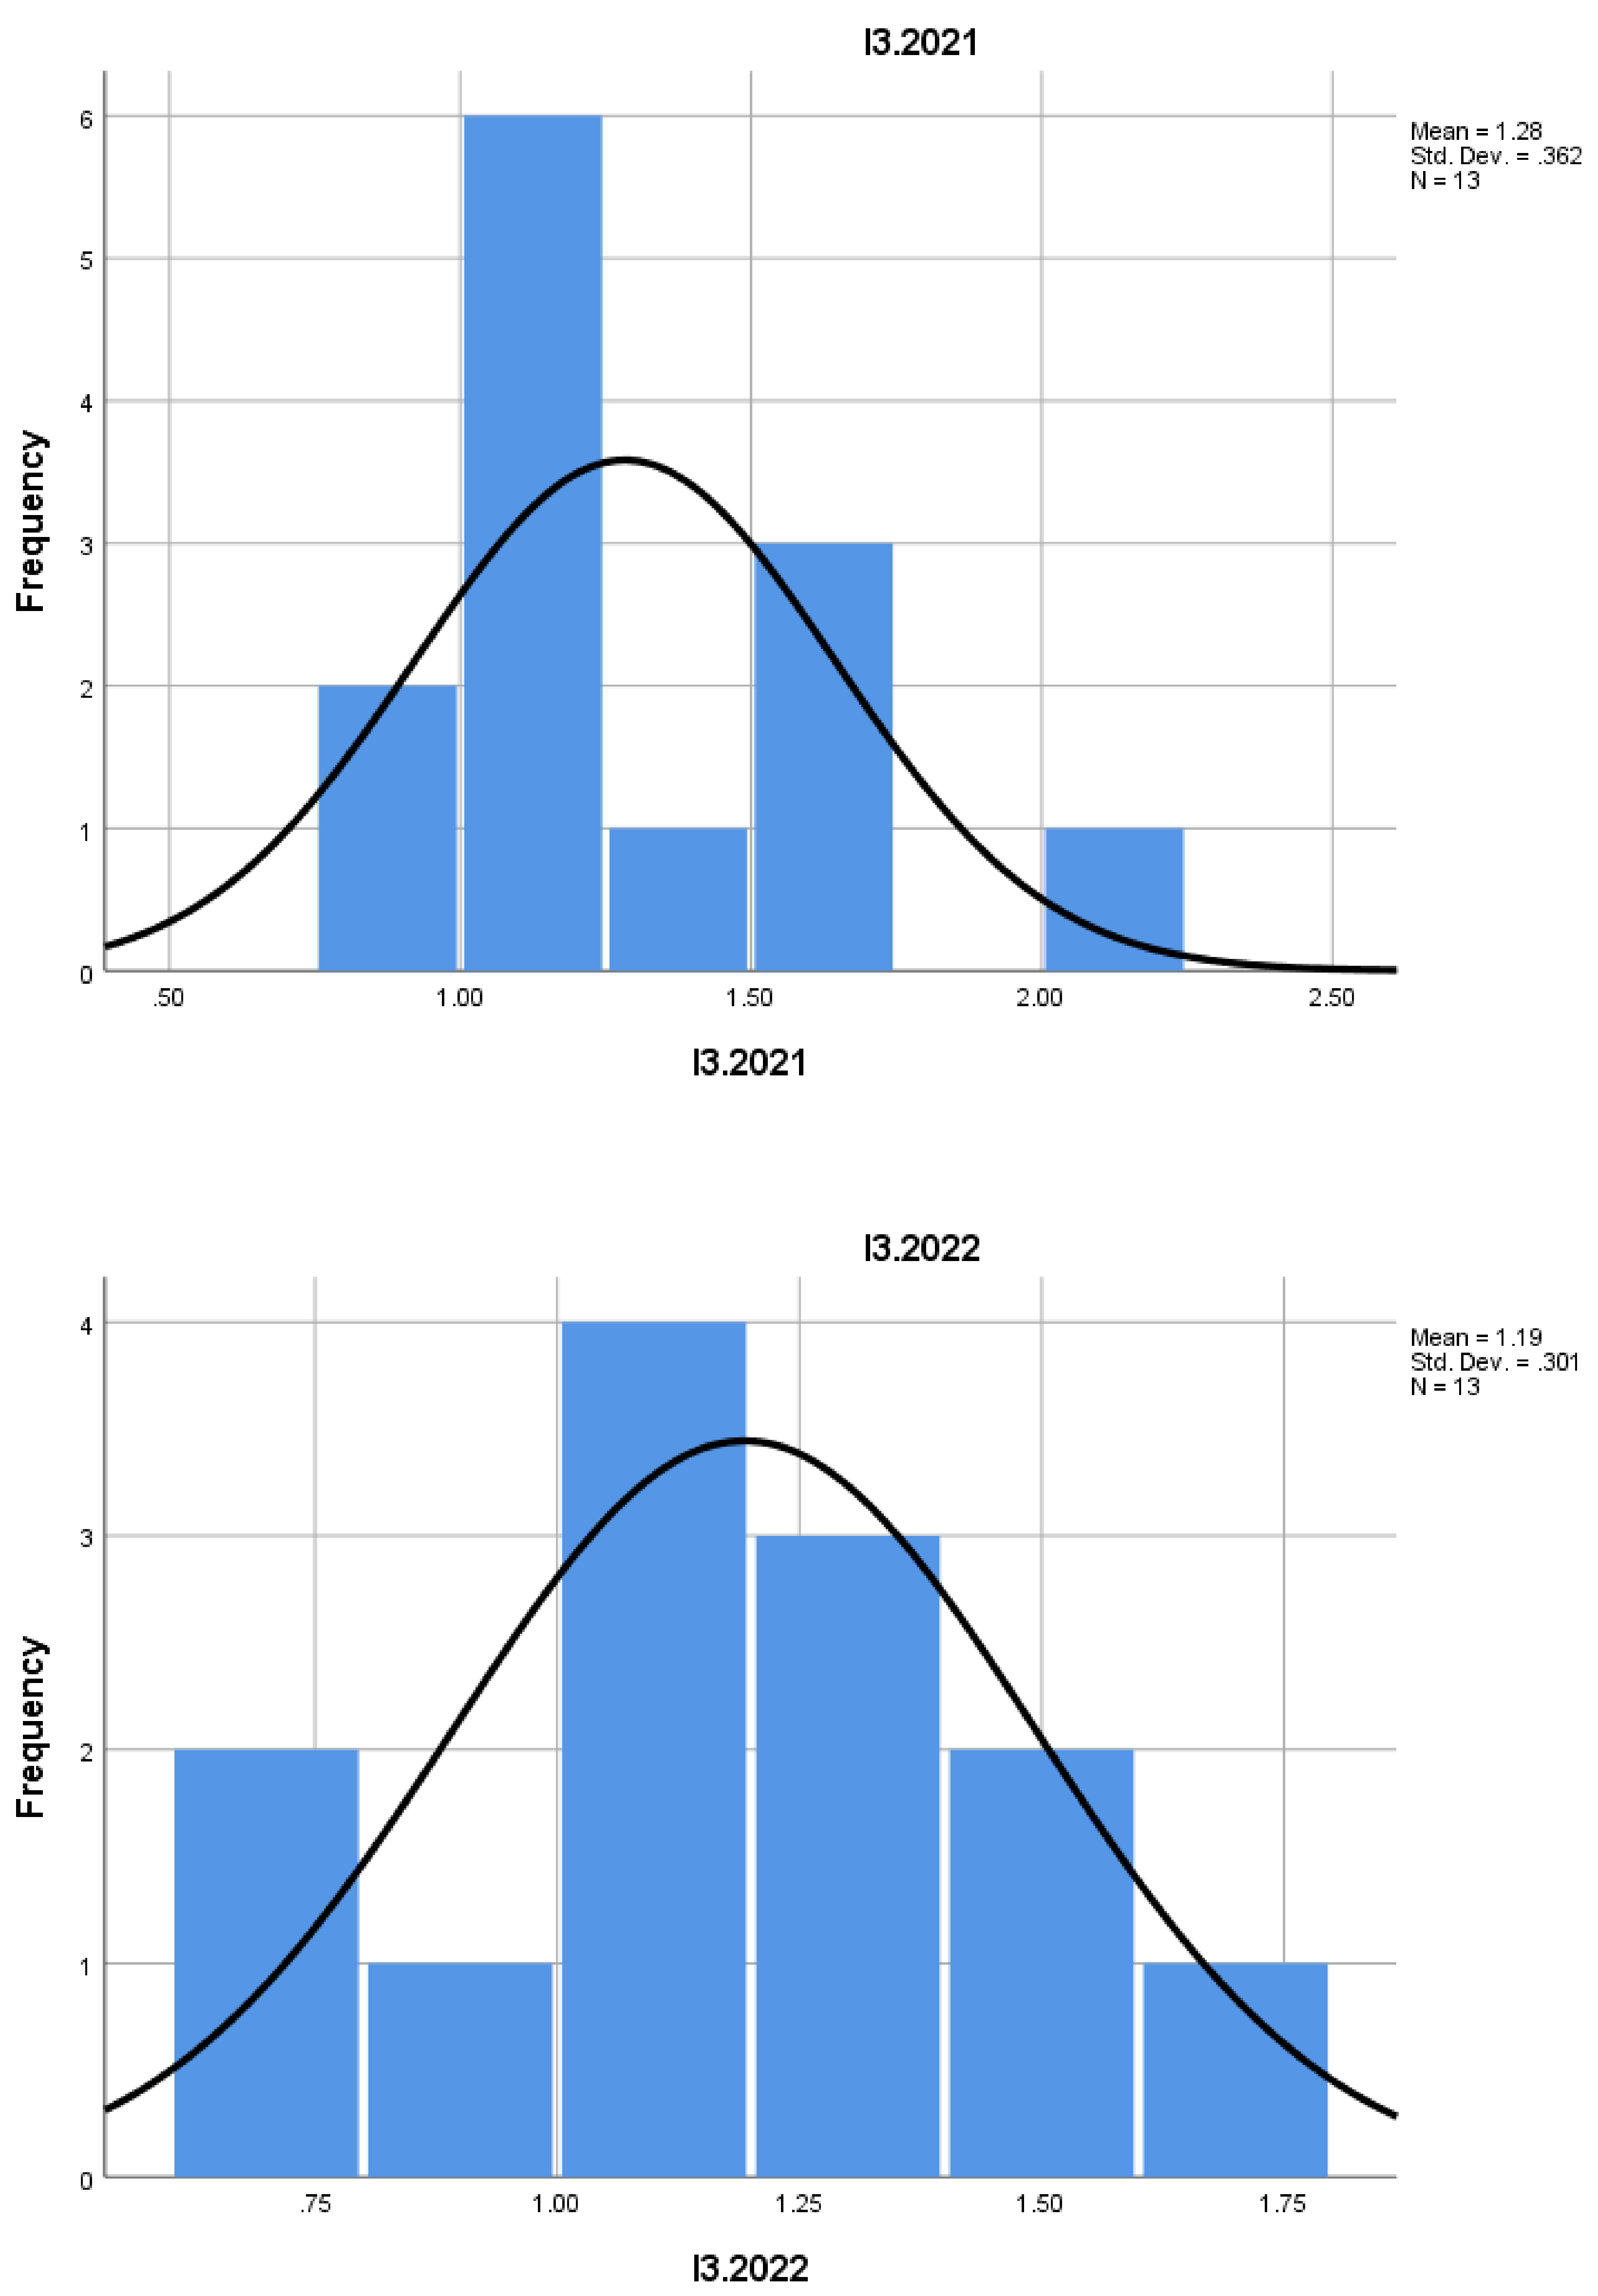
I3, measured by the number of employees, indicates that new businesses in mountain construction are, on average, small. The average is approximately 1.28 in 2021 and 1.19 in 2022, signaling a trend of increasing employment in new enterprises, but still on a small scale. This may indicate a focus on small to medium-sized projects.
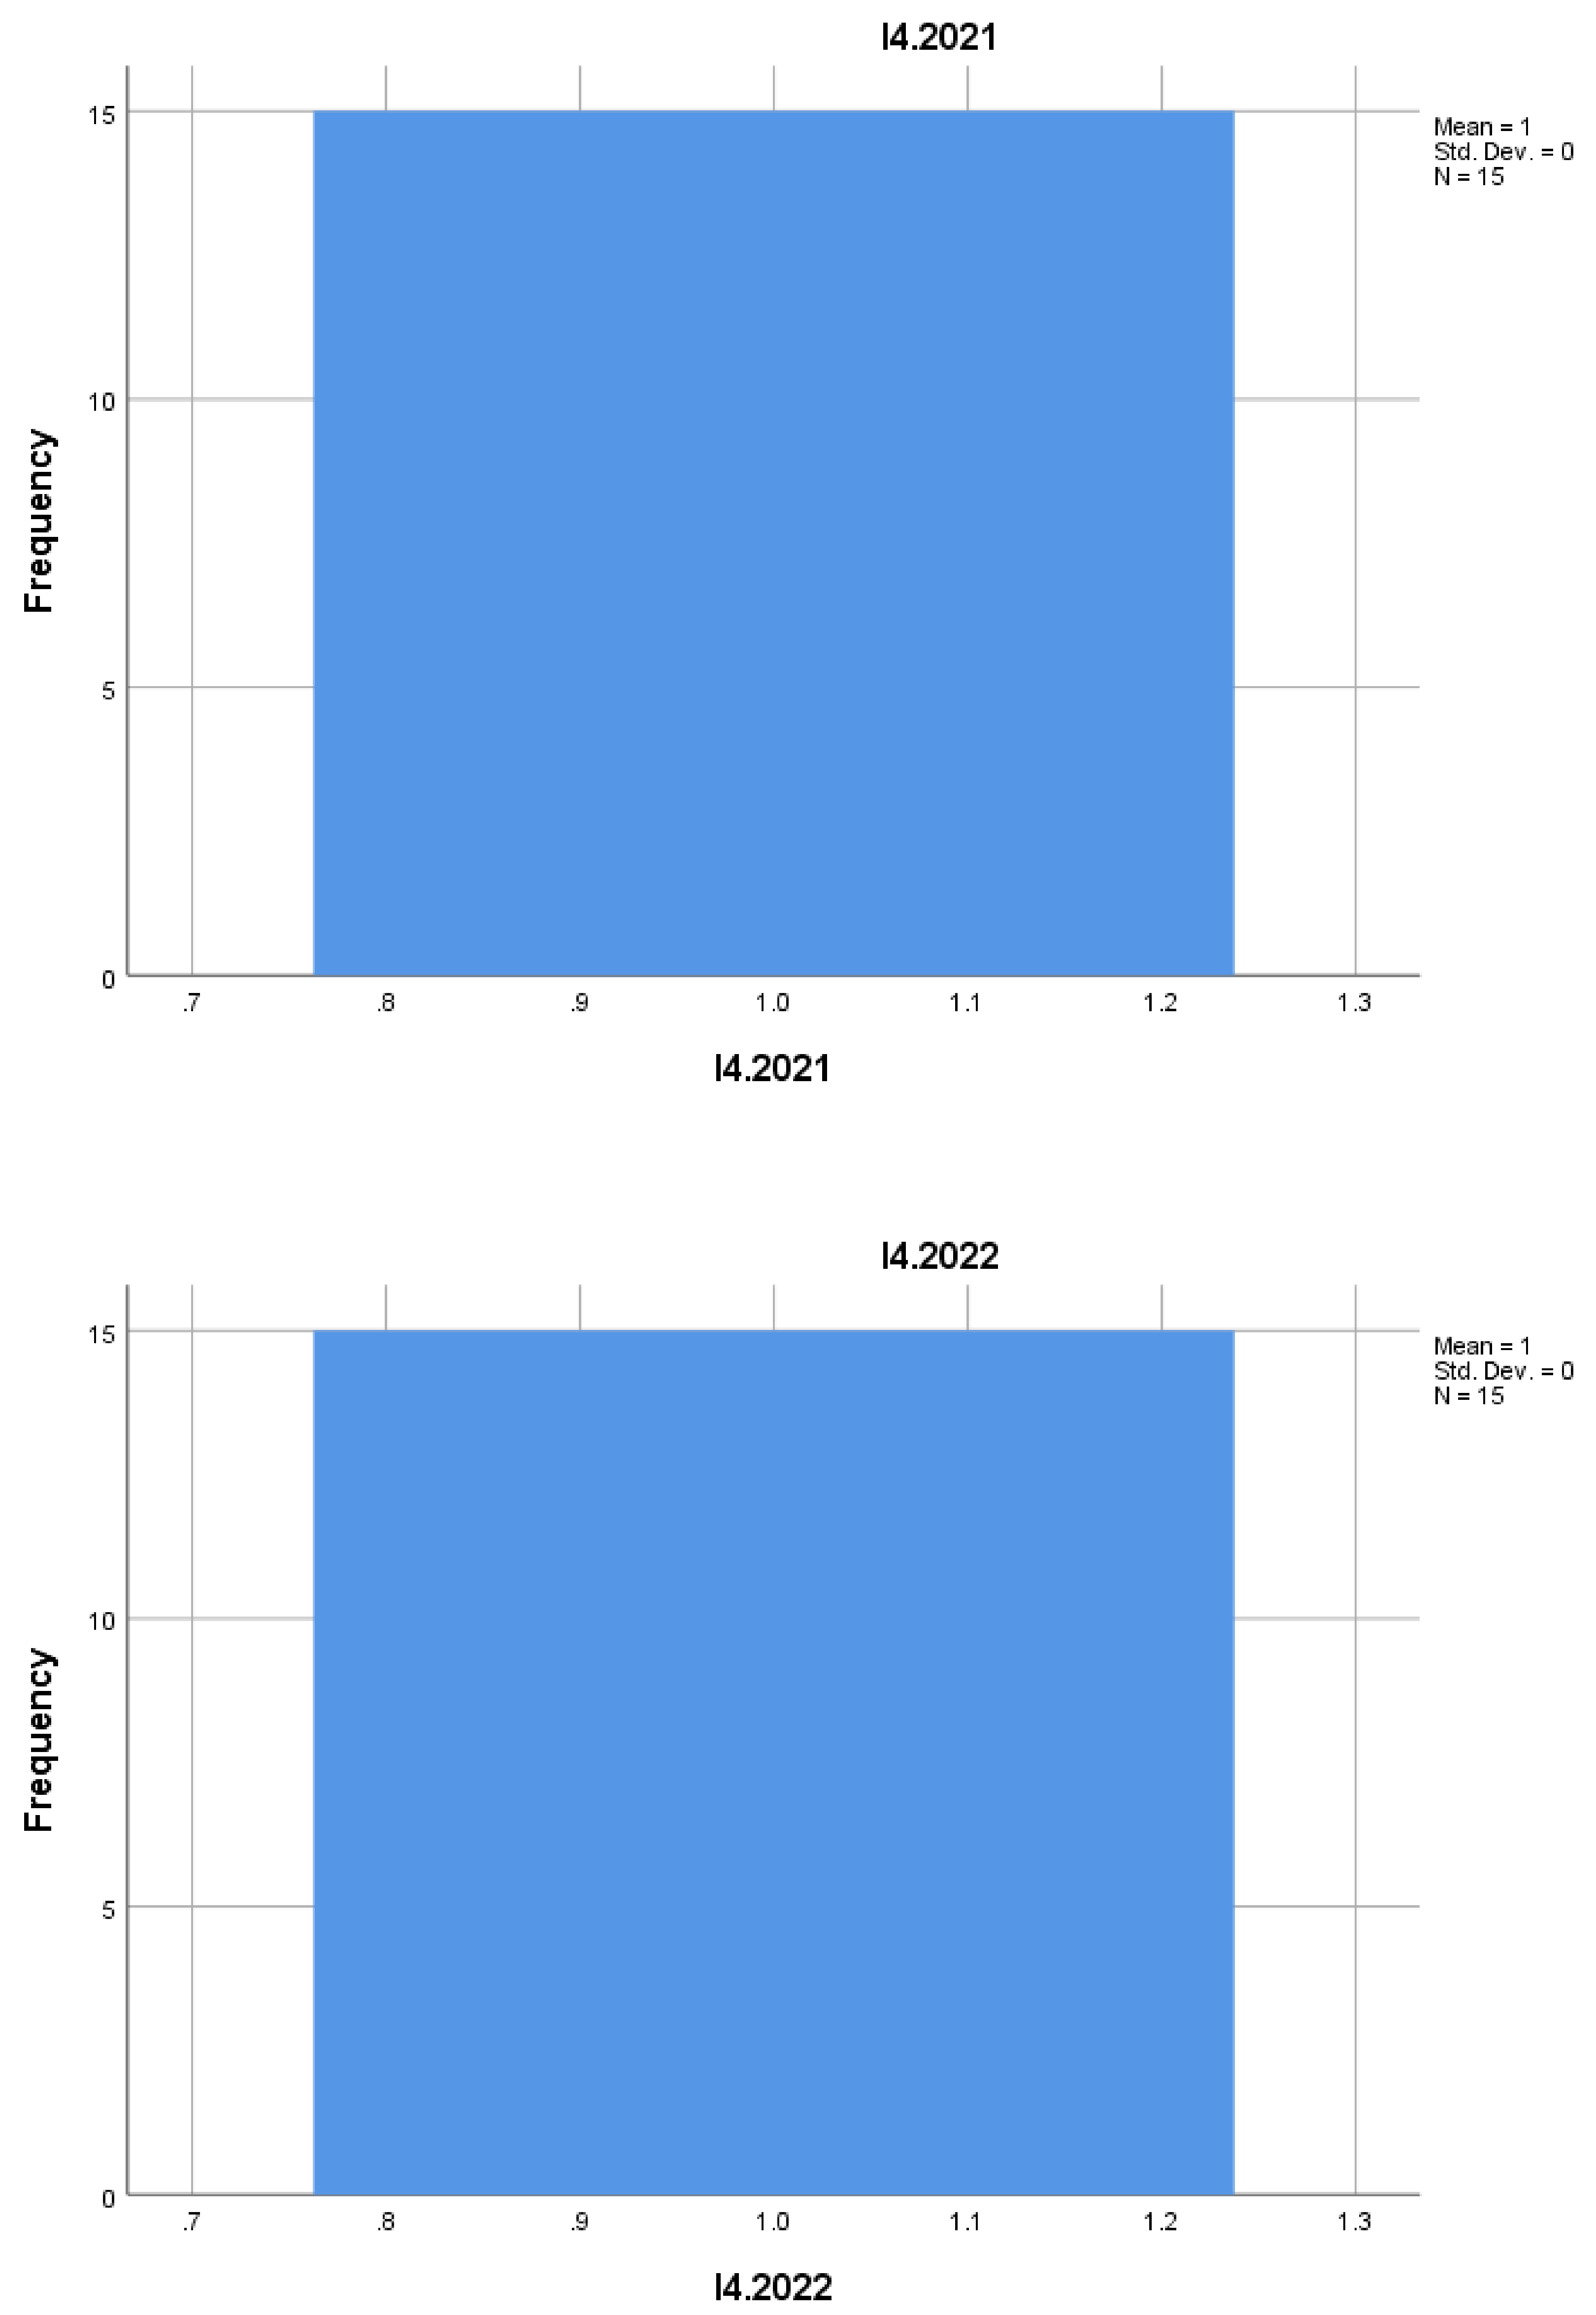
Indicator I4 shows the number of jobs lost due to the disappearance of enterprises. The average of this indicator is very low, suggesting a low rate of business closure and, consequently, a stable environment in the mountain construction sector.
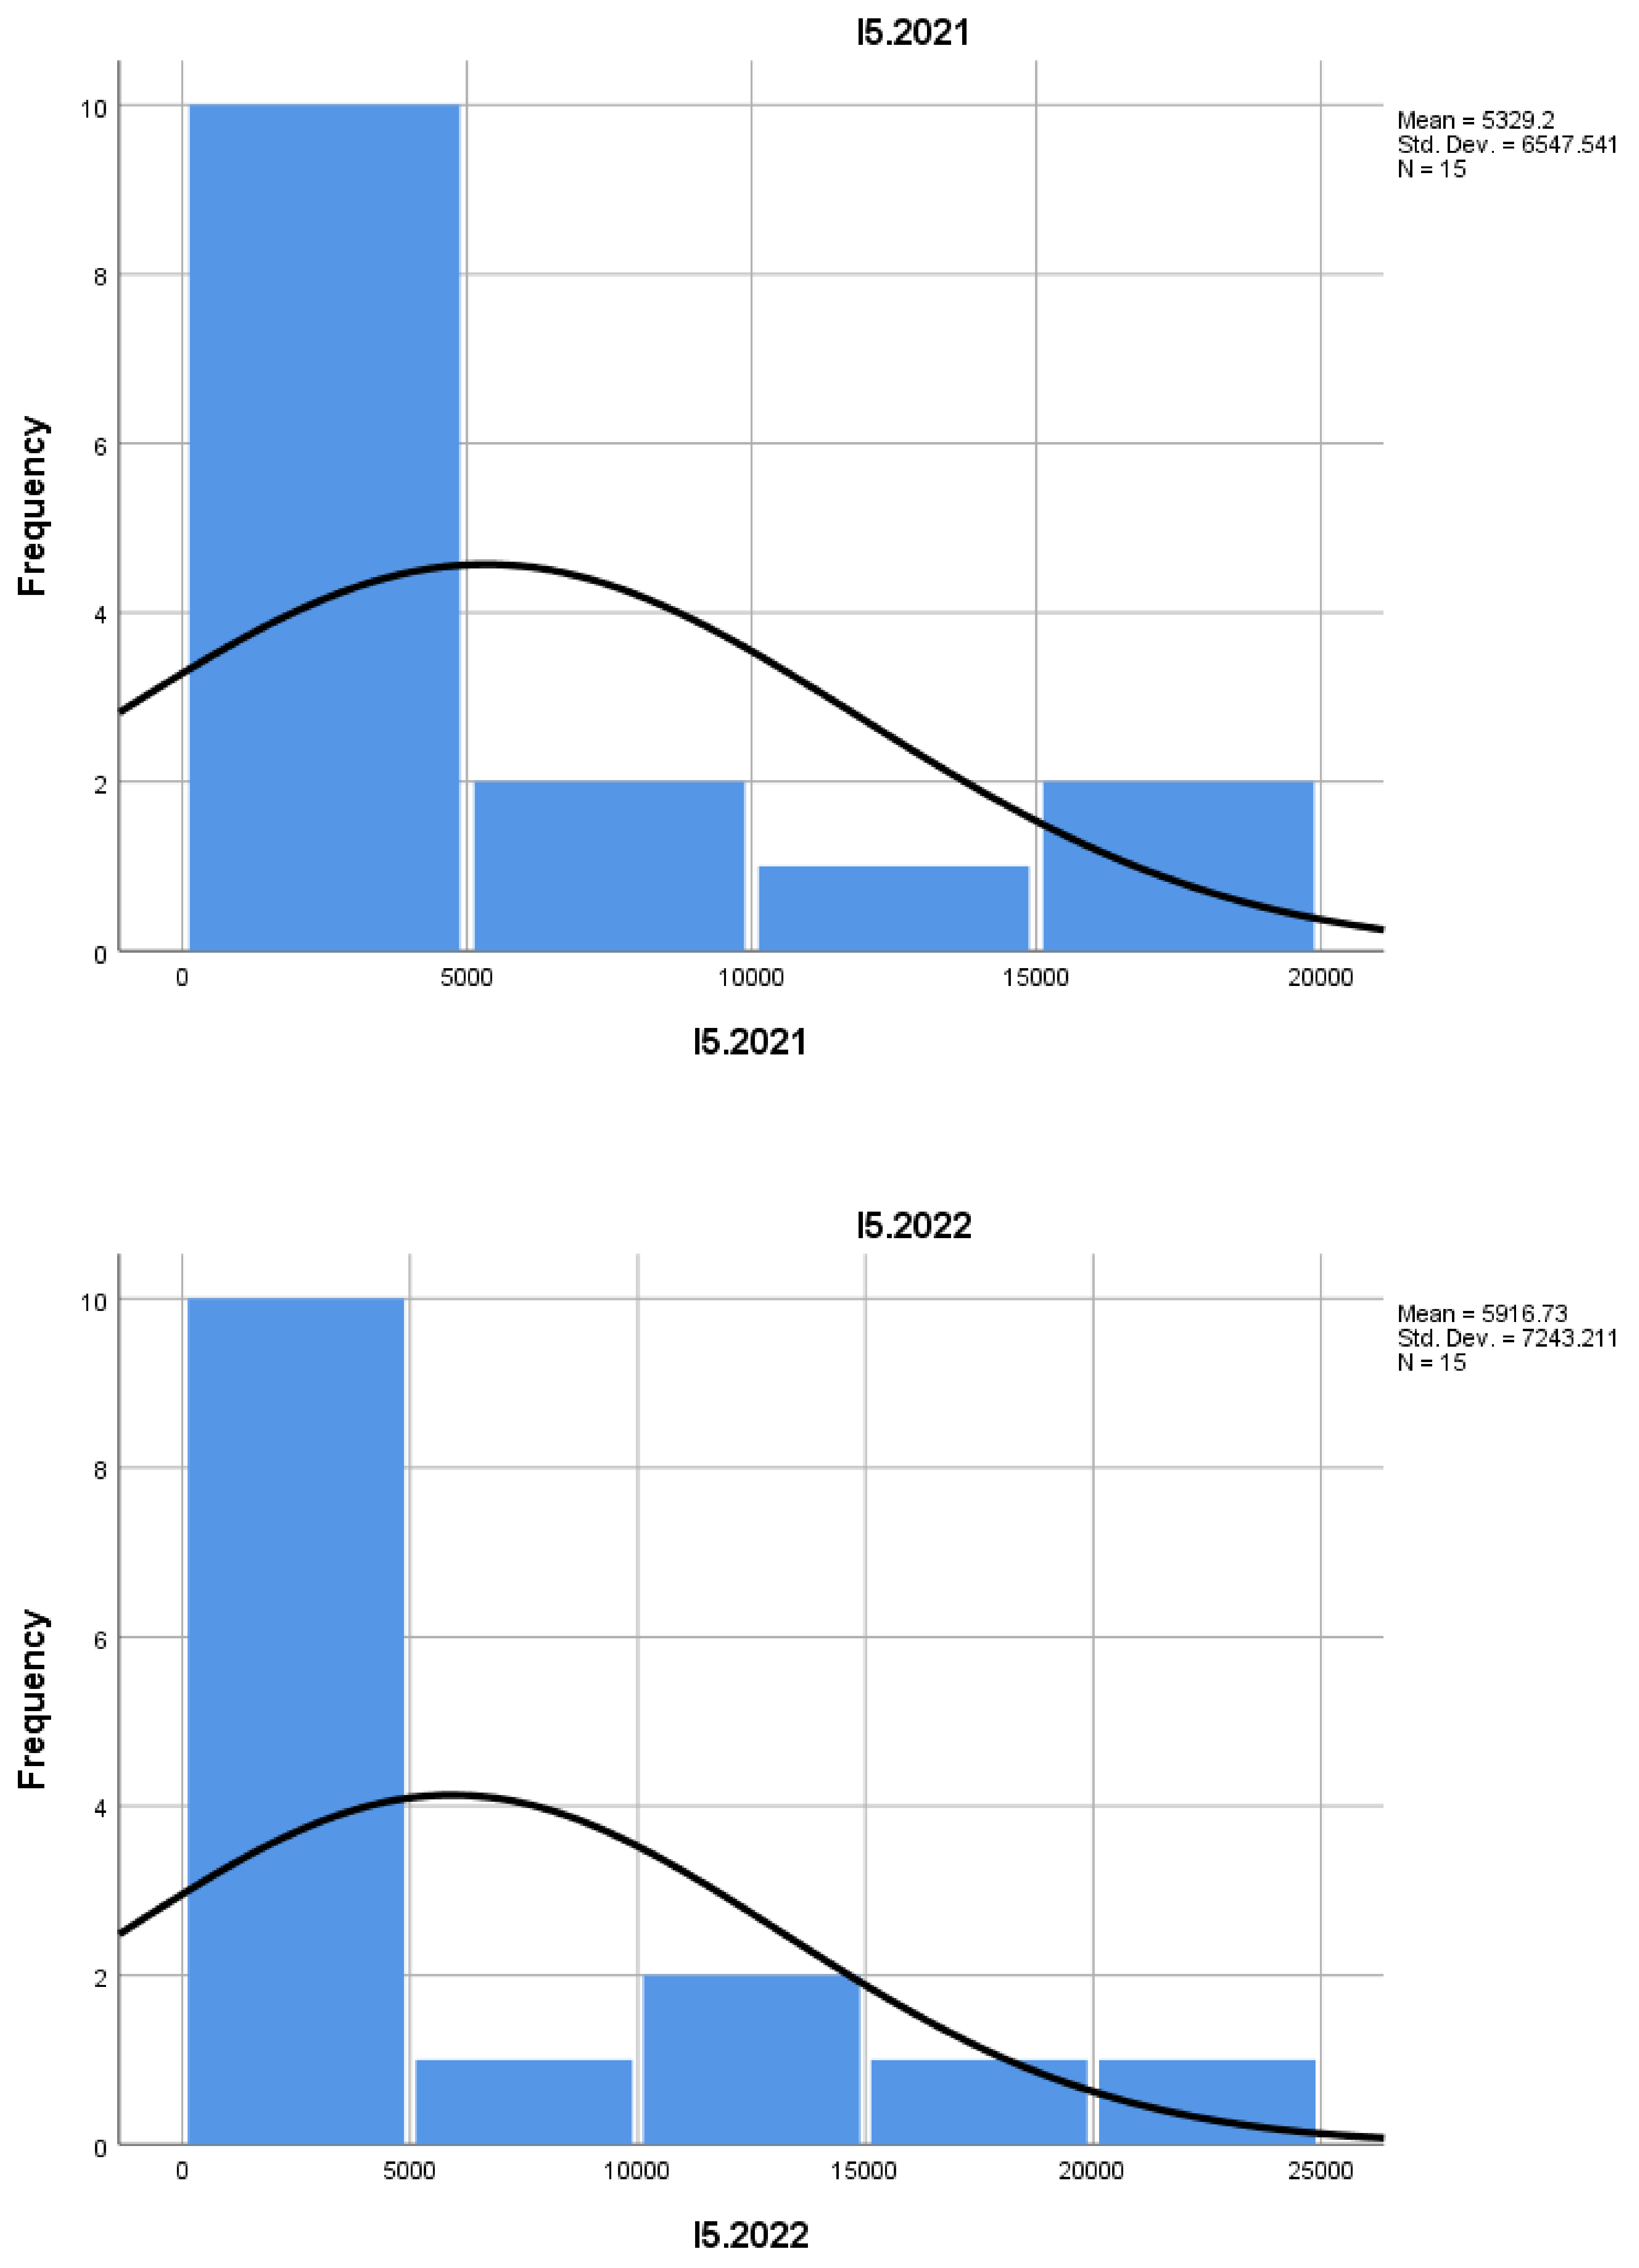
I5 during this period is significantly lower than the number of newly established ones, which suggests a trend of stability and growth in the mountain entrepreneurial sector, although in 2022 it is slightly higher than in 2021.
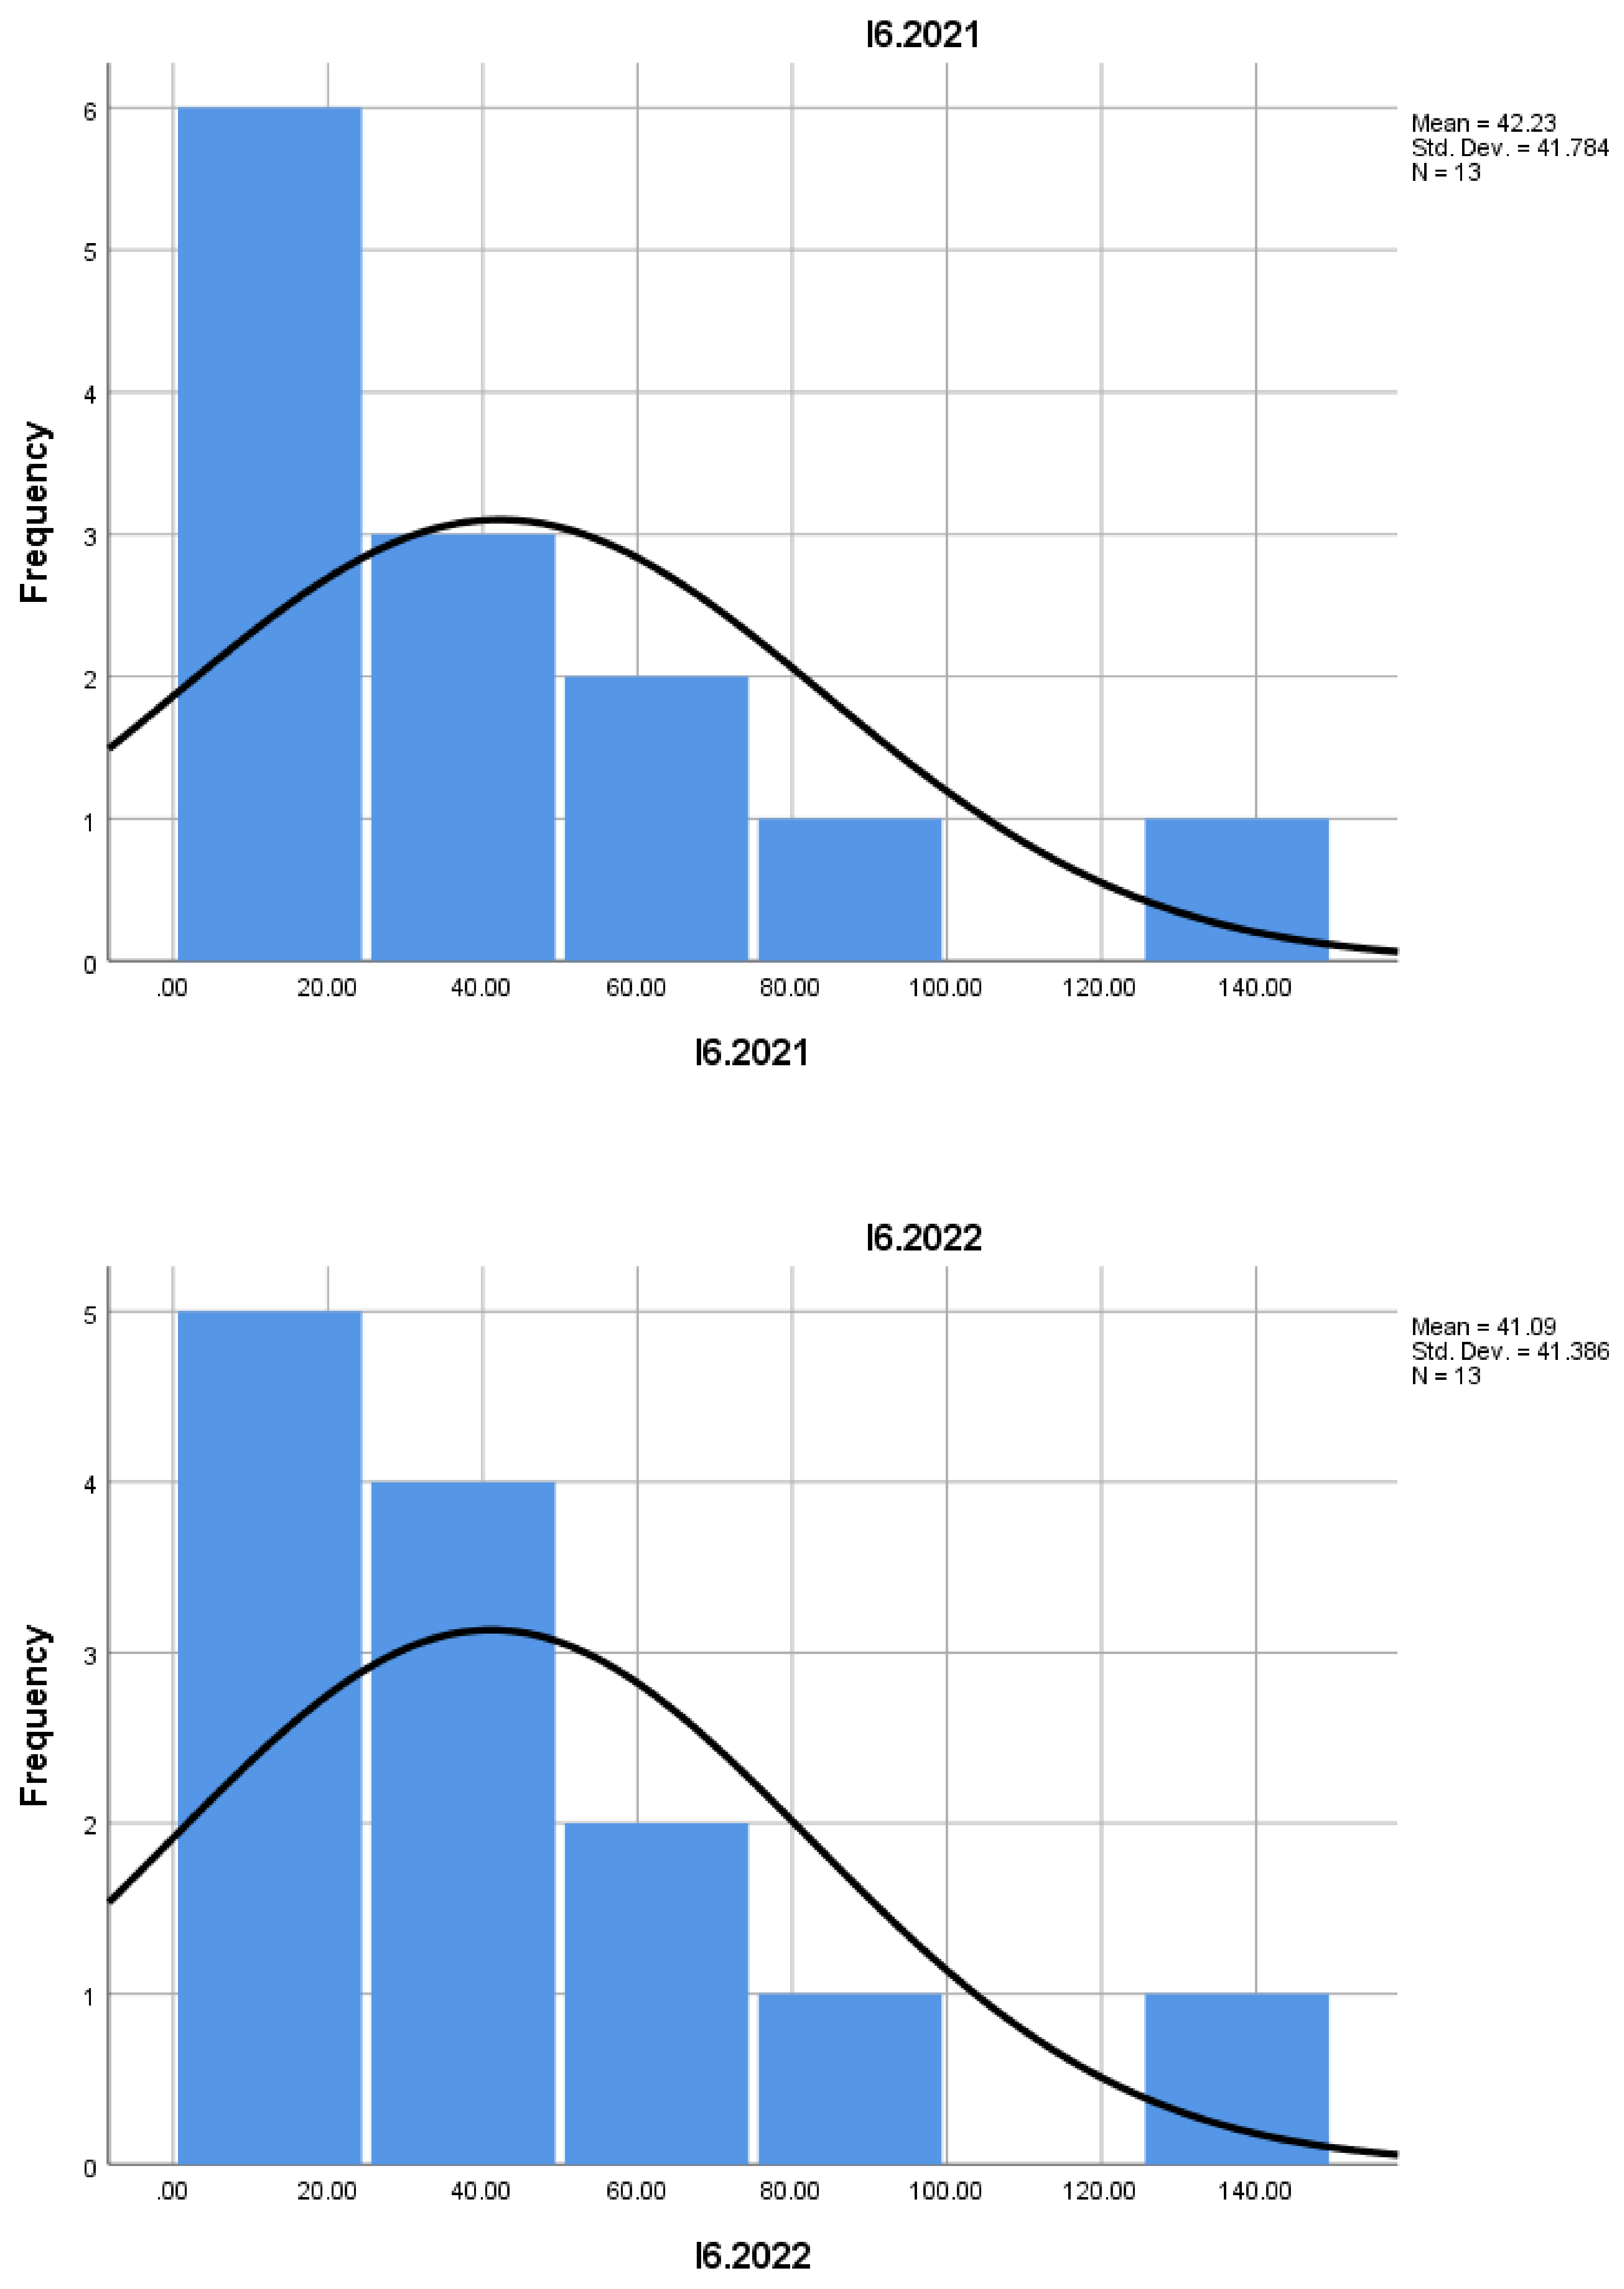
I6 have, on average, a size of 1 employee per enterprise. This indicator suggests increased confidence and sustainability among new businesses that have managed to remain active in the mountain construction sector.
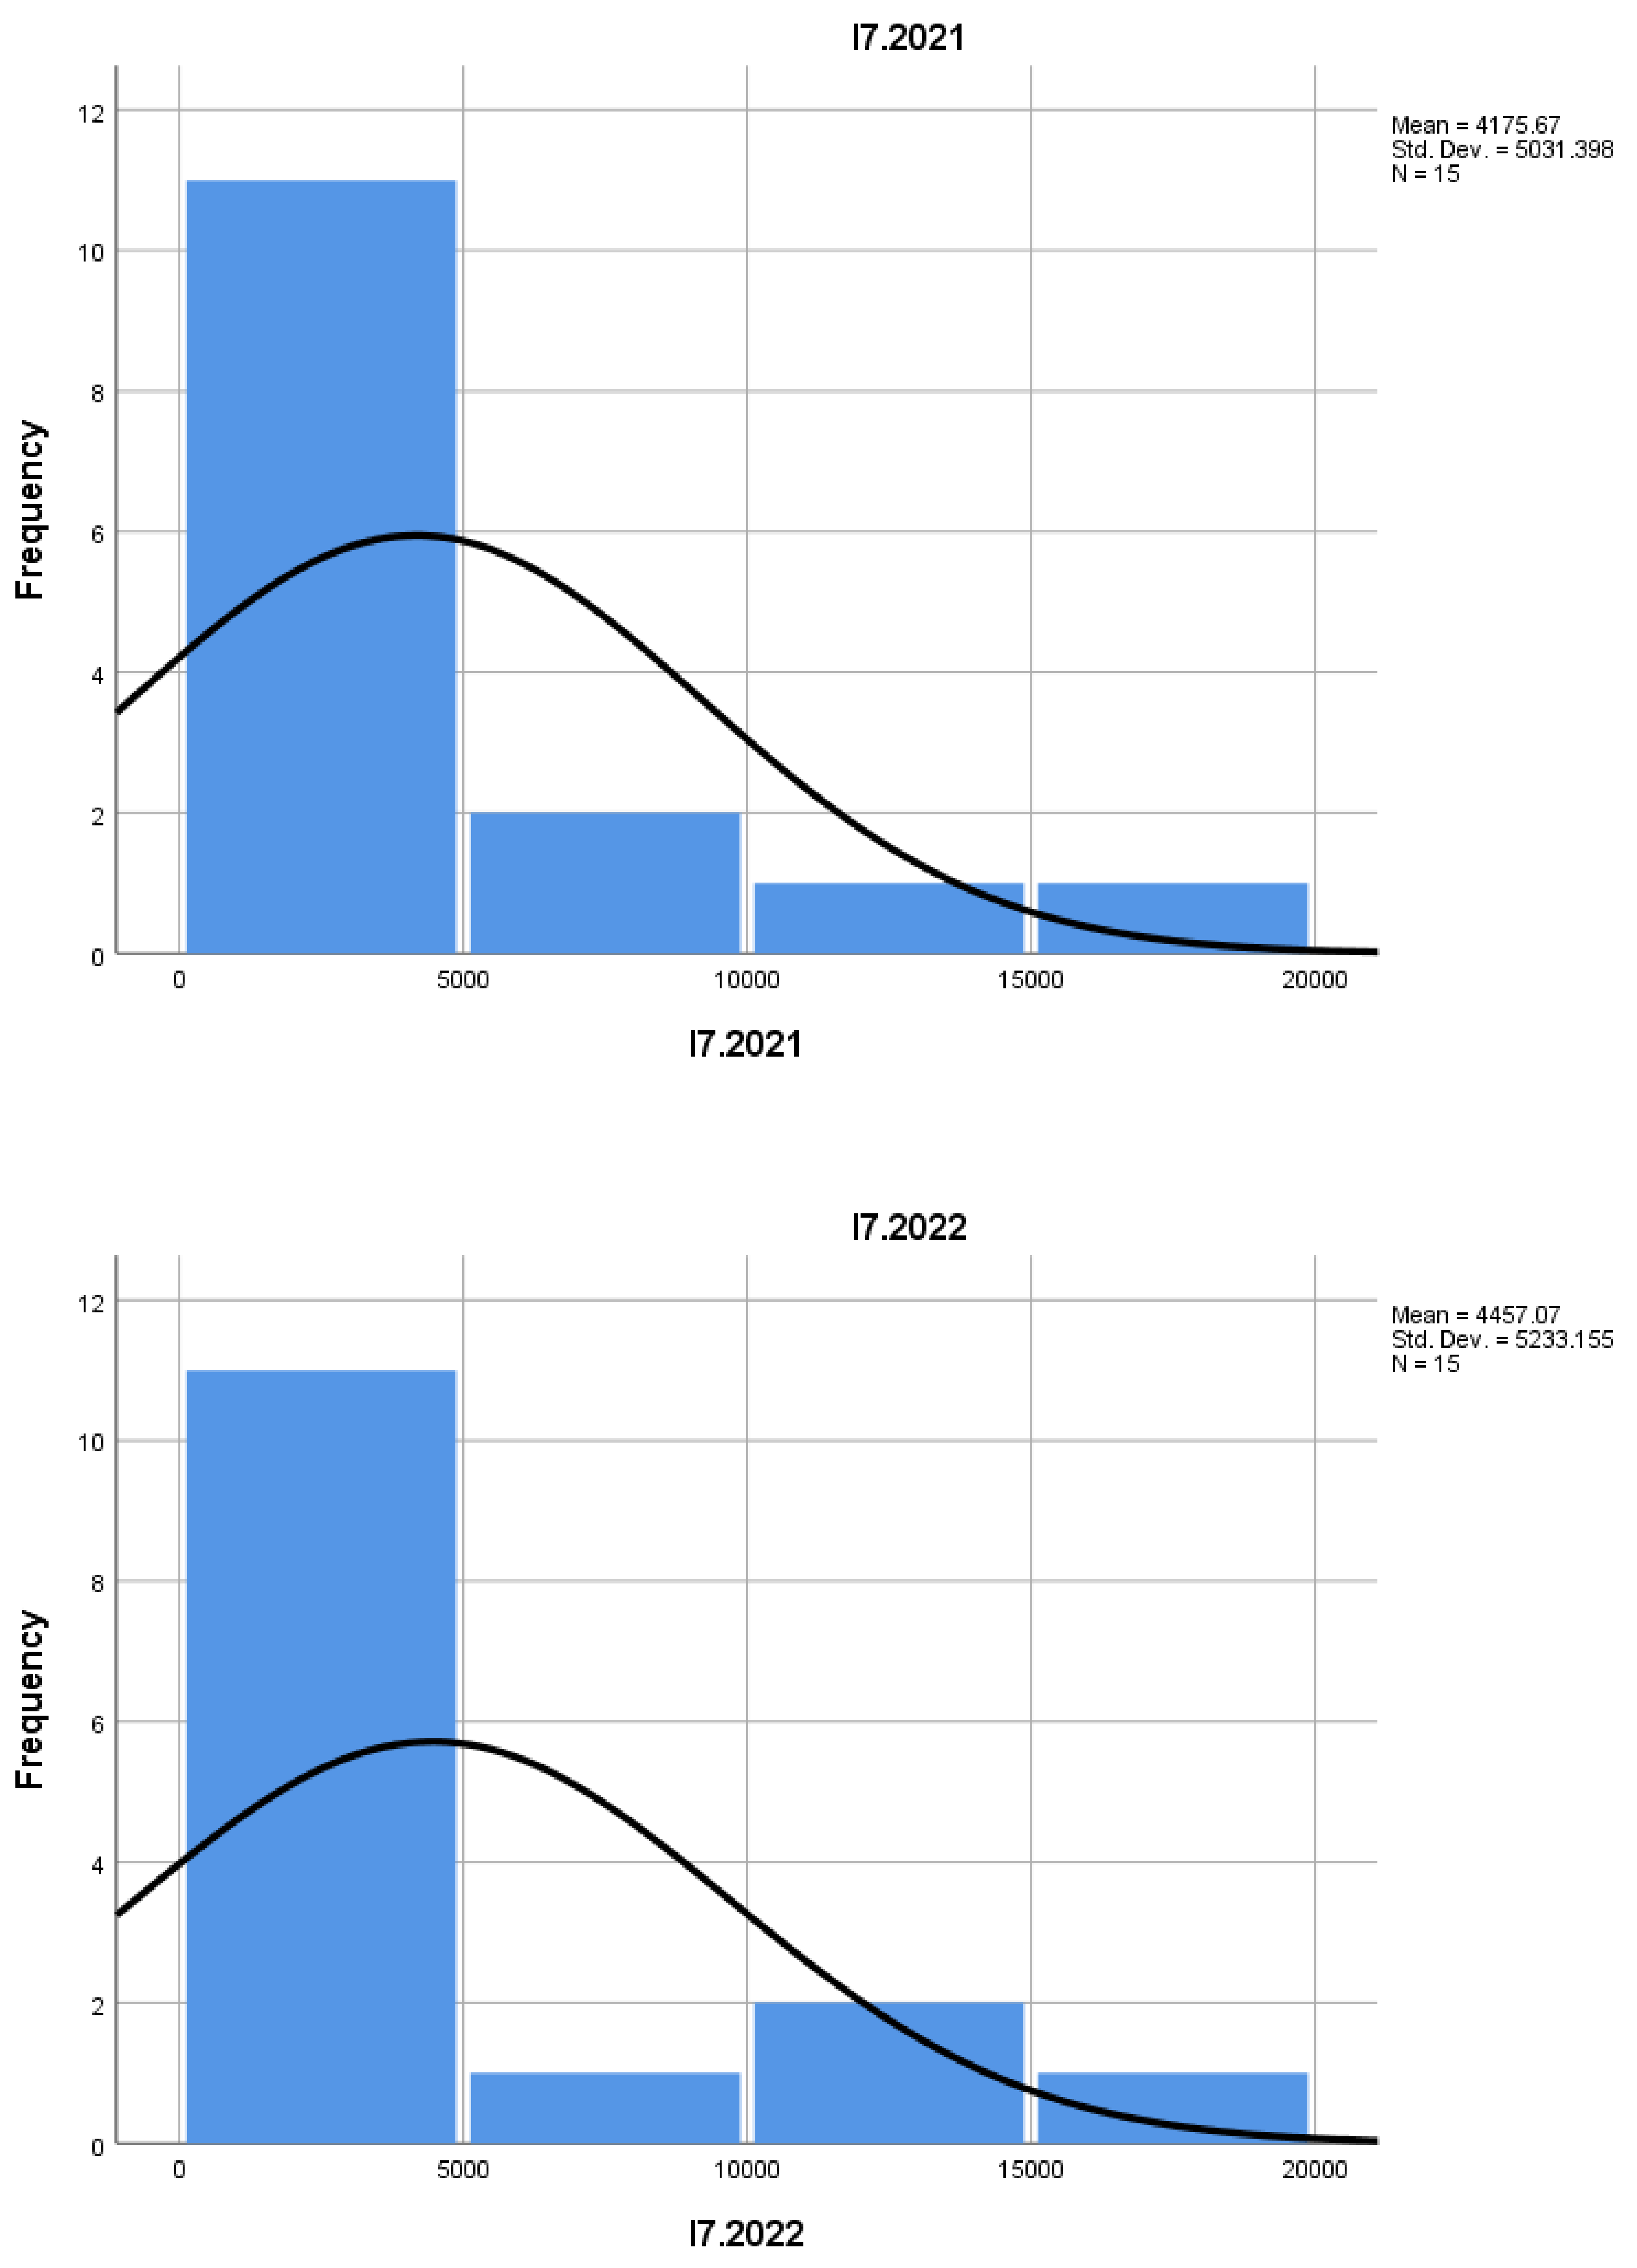
Indicator I7, which shows the number of enterprises that have managed to survive for at least three years, remains constant during the analyzed period. There is a positive trend regarding the stability of mountain enterprises, suggesting efficiency in business management and adaptability to the specific economic conditions of mountain areas.
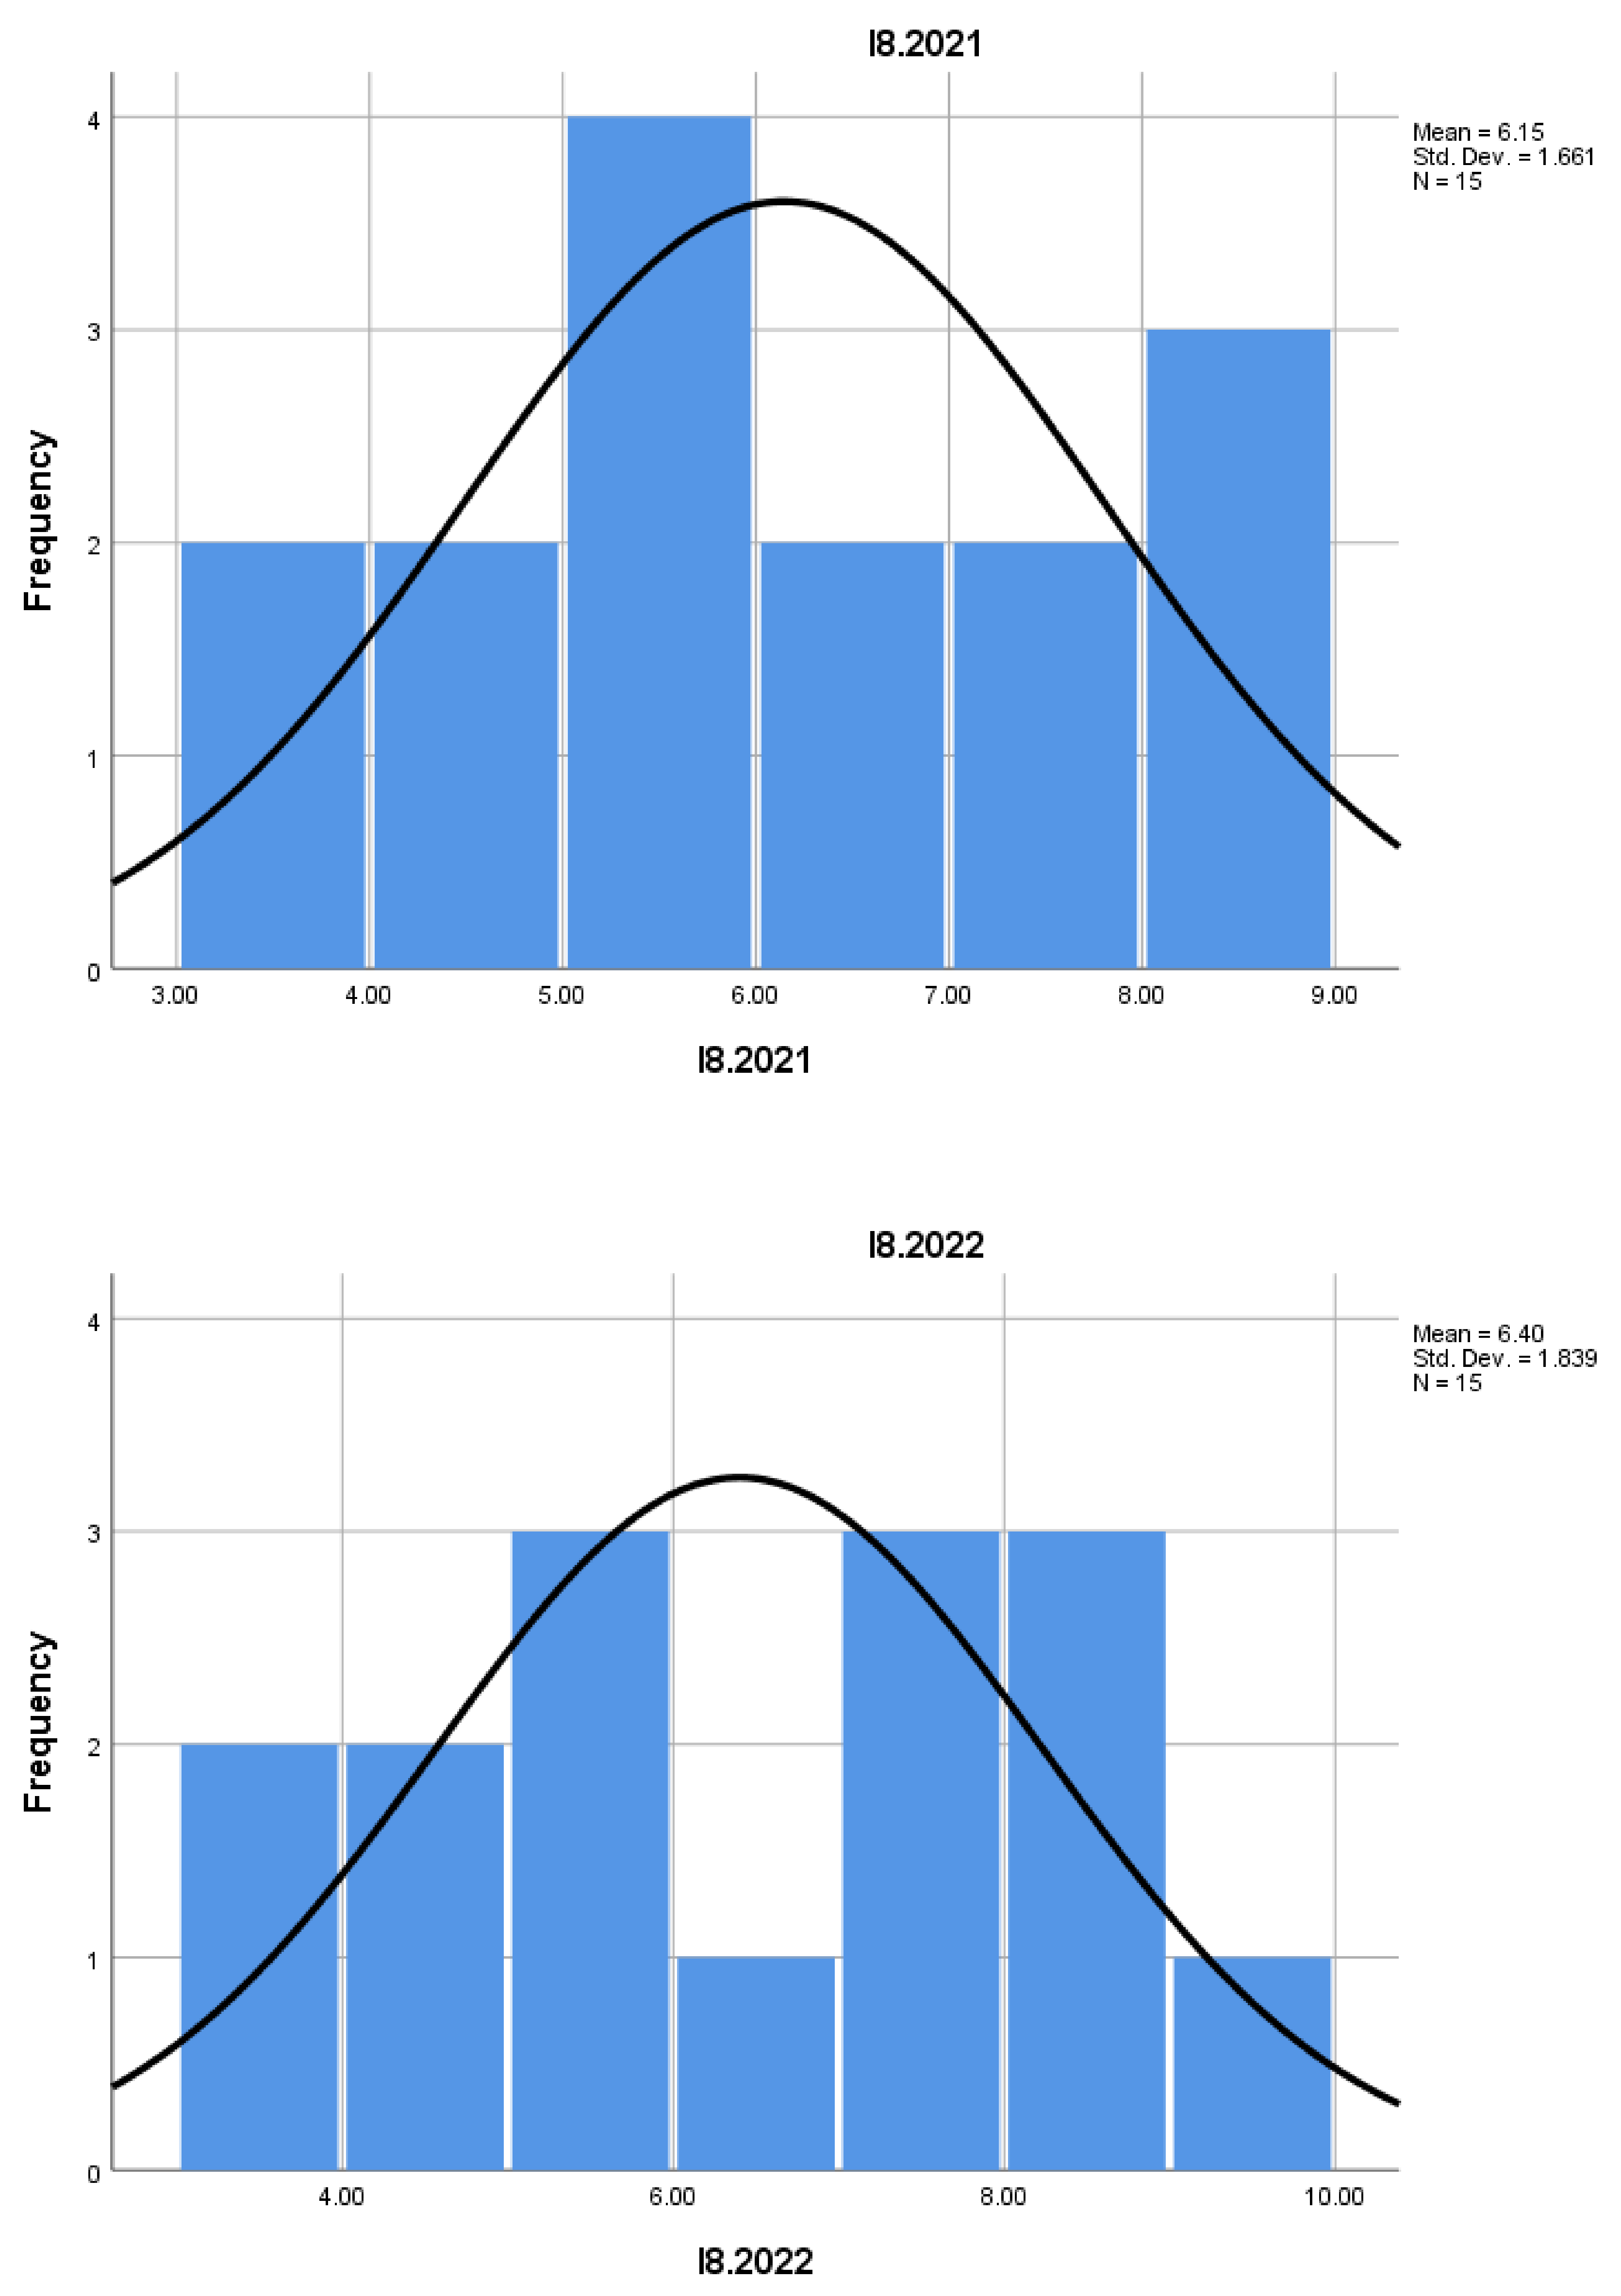
I8 is an important indicator suggesting medium-term business success. The share of enterprises that survive for three years is relatively constant and modest, which may reflect a decent success rate in the mountain entrepreneurship domain.
I9 remains relatively constant during the 2021–2022 period, suggesting a stable business environment for mountain enterprises. The three-year business survival rate is a positive measure of adaptability and sustainability in this sector.
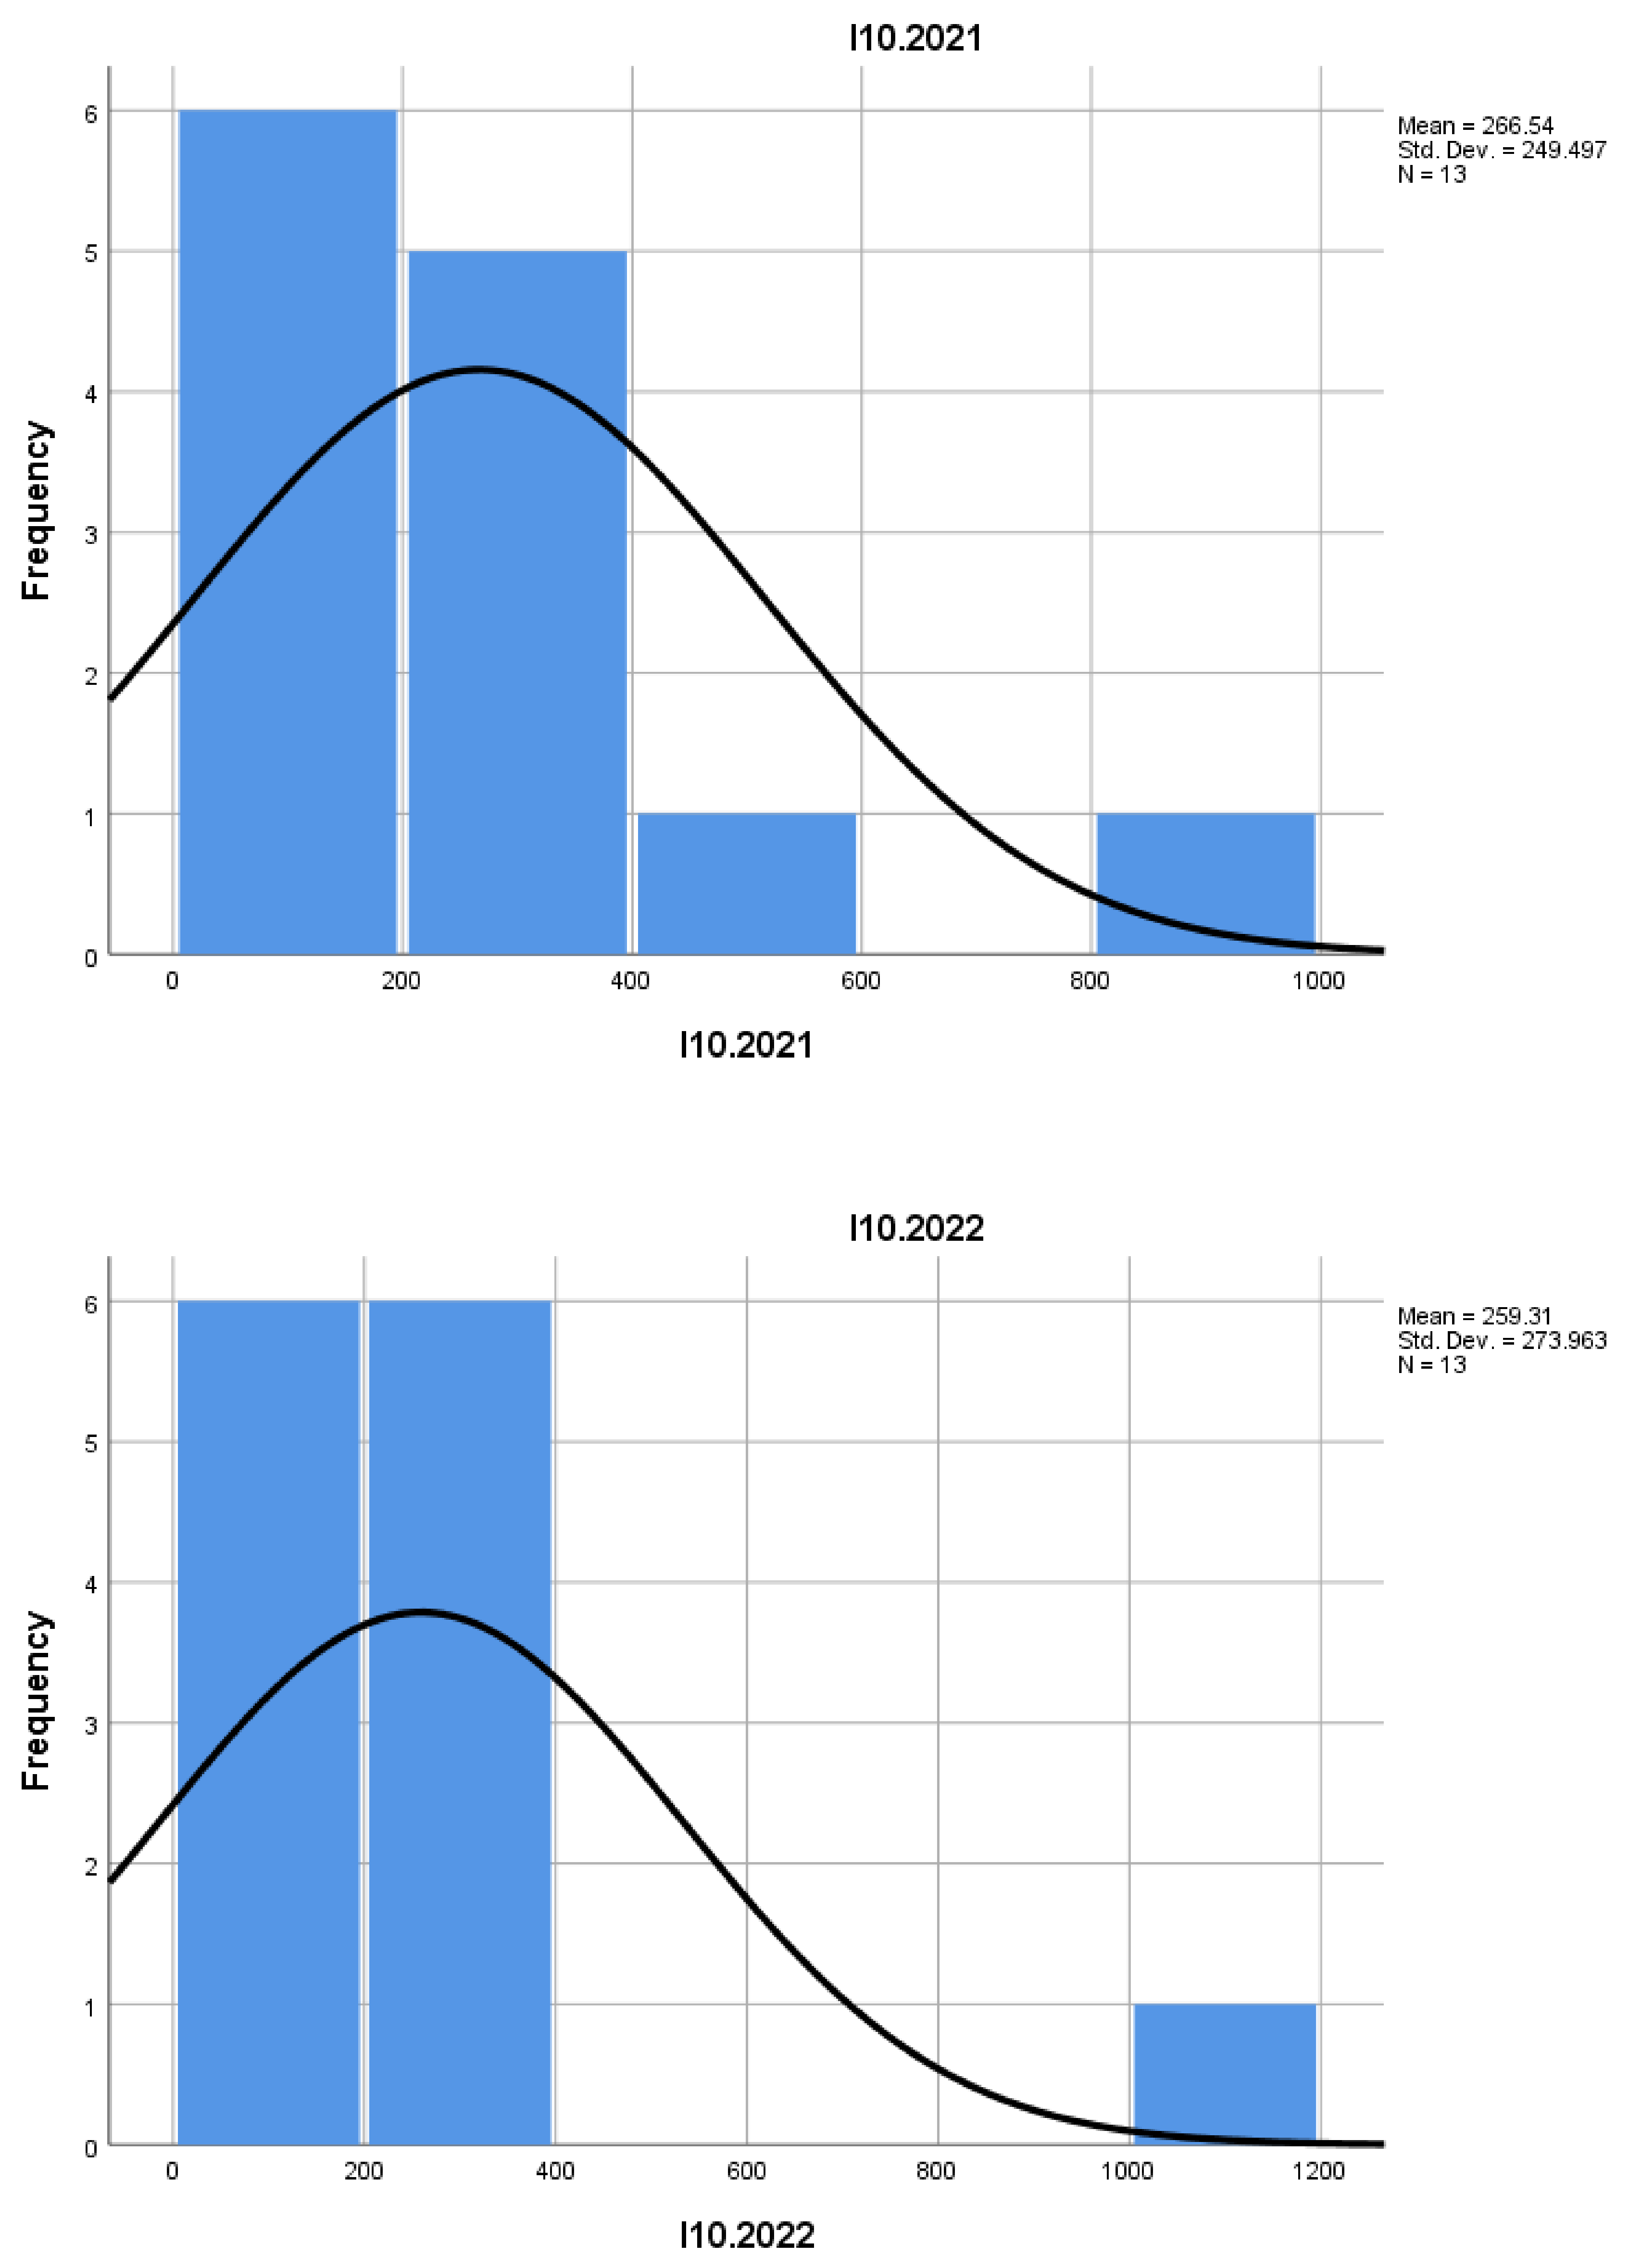
I10, in terms of both employment and turnover, is significantly lower than in other categories. This may reflect a lower need for rapid expansion in this specific sector. It is important for understanding the dynamics of rapid business growth. In the mountain construction sector, this number is significantly lower, suggesting that the sector is more characterized by stable, smaller enterprises that do not follow a rapid growth model. This may reflect the smaller and more localized nature of mountain construction projects, where rapid growth is not necessarily a priority.
Indicator I11 provides the percentage of high-growth enterprises compared to active enterprises with at least 10 employees. If this share is small, as the trend in this sector suggests, it may indicate that most enterprises are not in a phase of rapid expansion. The mountain construction sector may be more focused on stability and sustainability rather than accelerated growth.
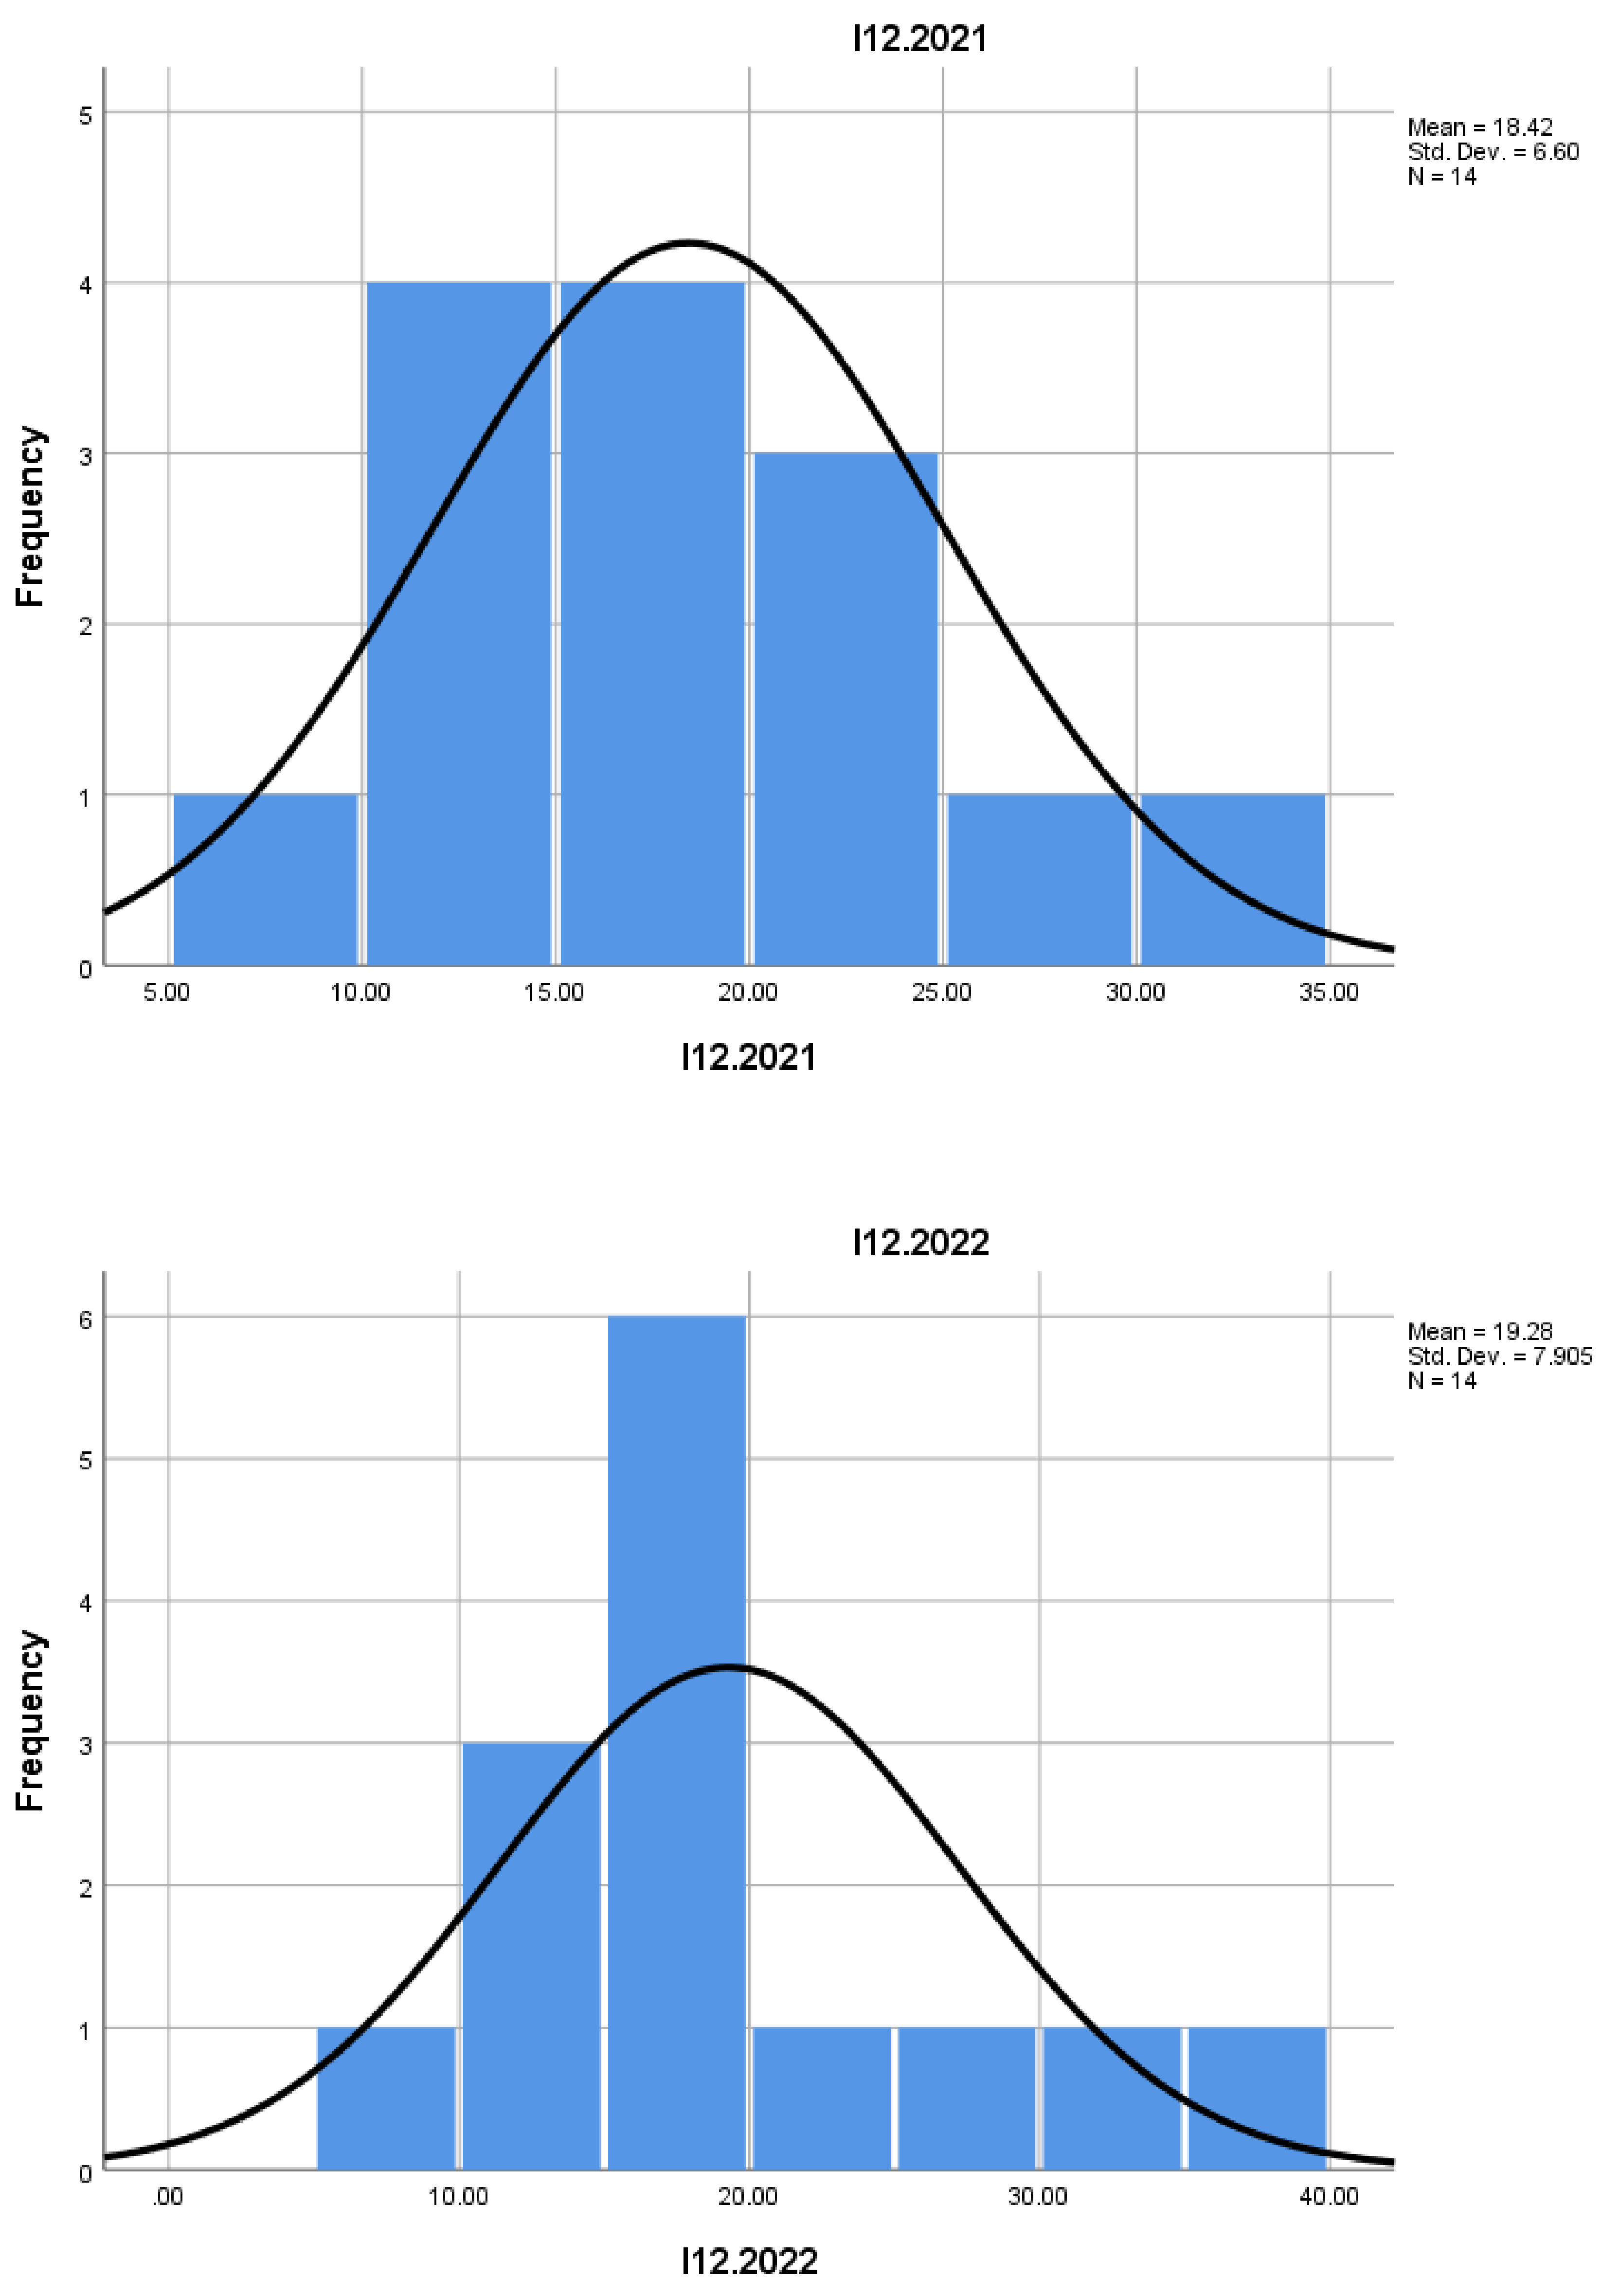
Indicator I12 measures business volatility, i.e., the rate of business births and closures. A higher turnover rate suggests a more unstable sector, while a lower rate can indicate a more stable sector. In the case of mountain construction, a low turnover rate suggests that the sector is relatively stable, with a balance between the businesses that are founded and those that close.
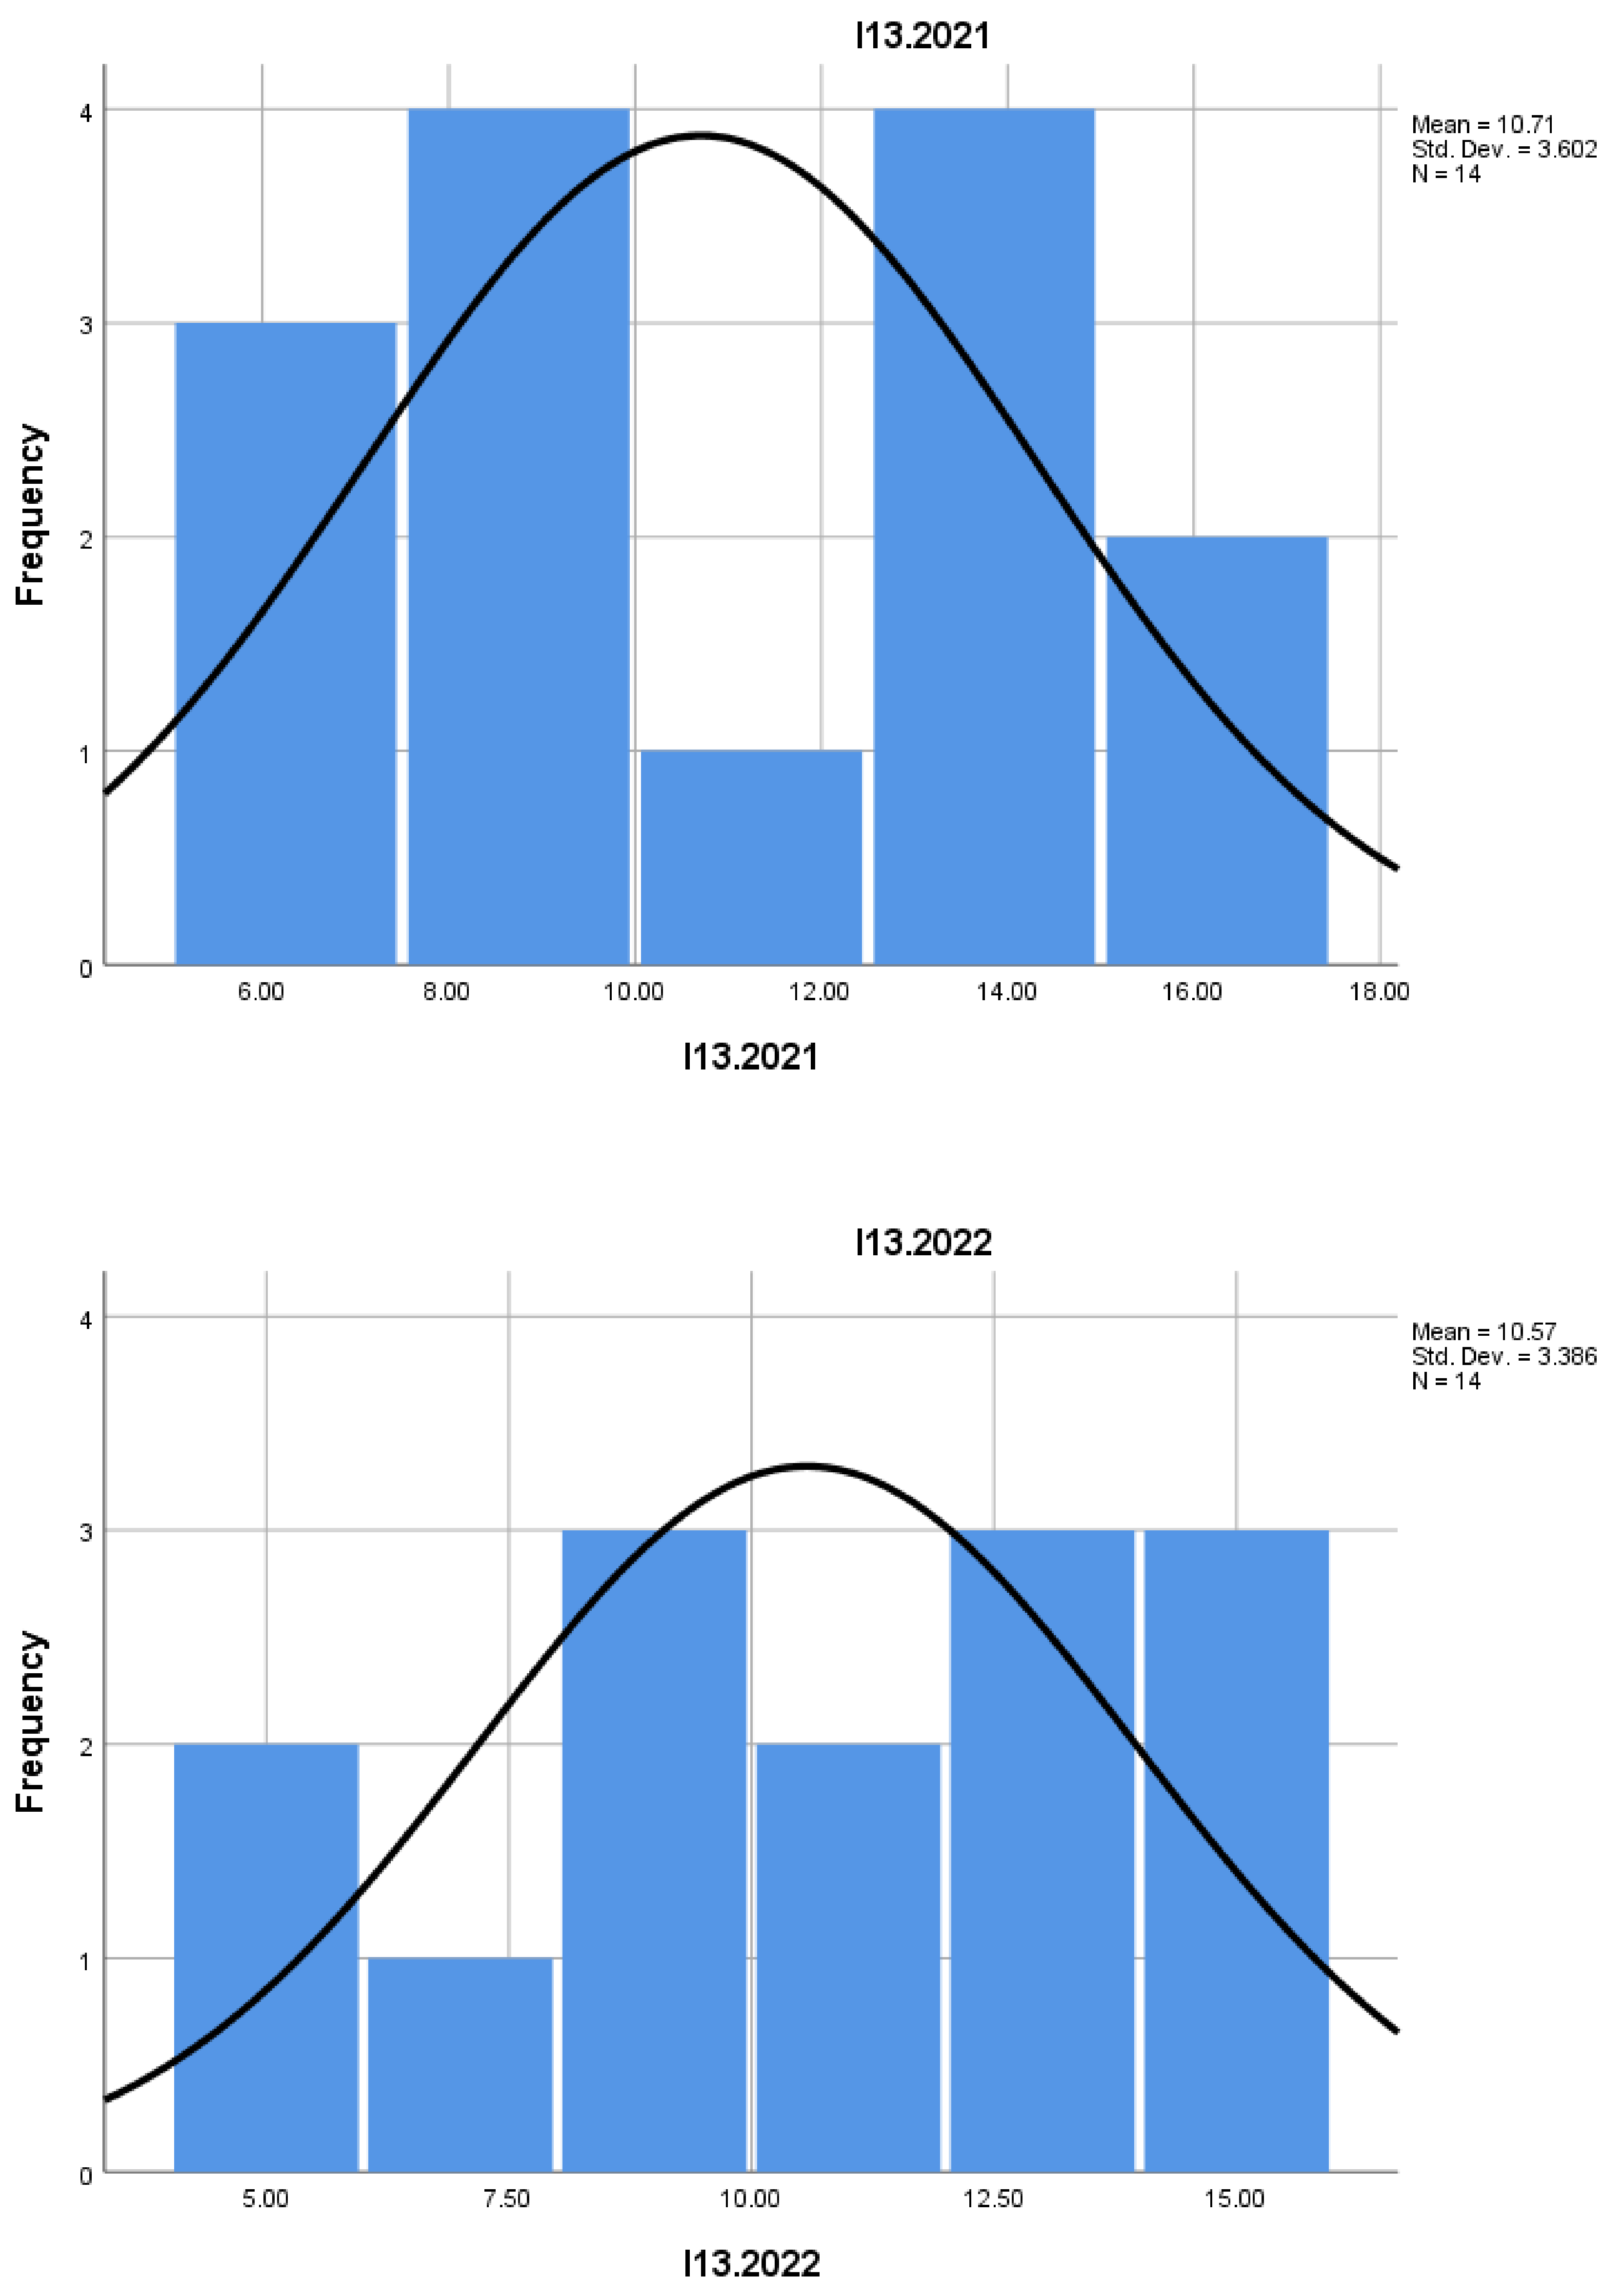
Indicator I13 reflects the number of new enterprises relative to active enterprises. A higher birth rate could signal growth in new initiatives within the sector; however, the average value suggests stable levels of business formation. This may also indicate a steady demand for new businesses in mountain construction, but not one characterized by very rapid expansion.
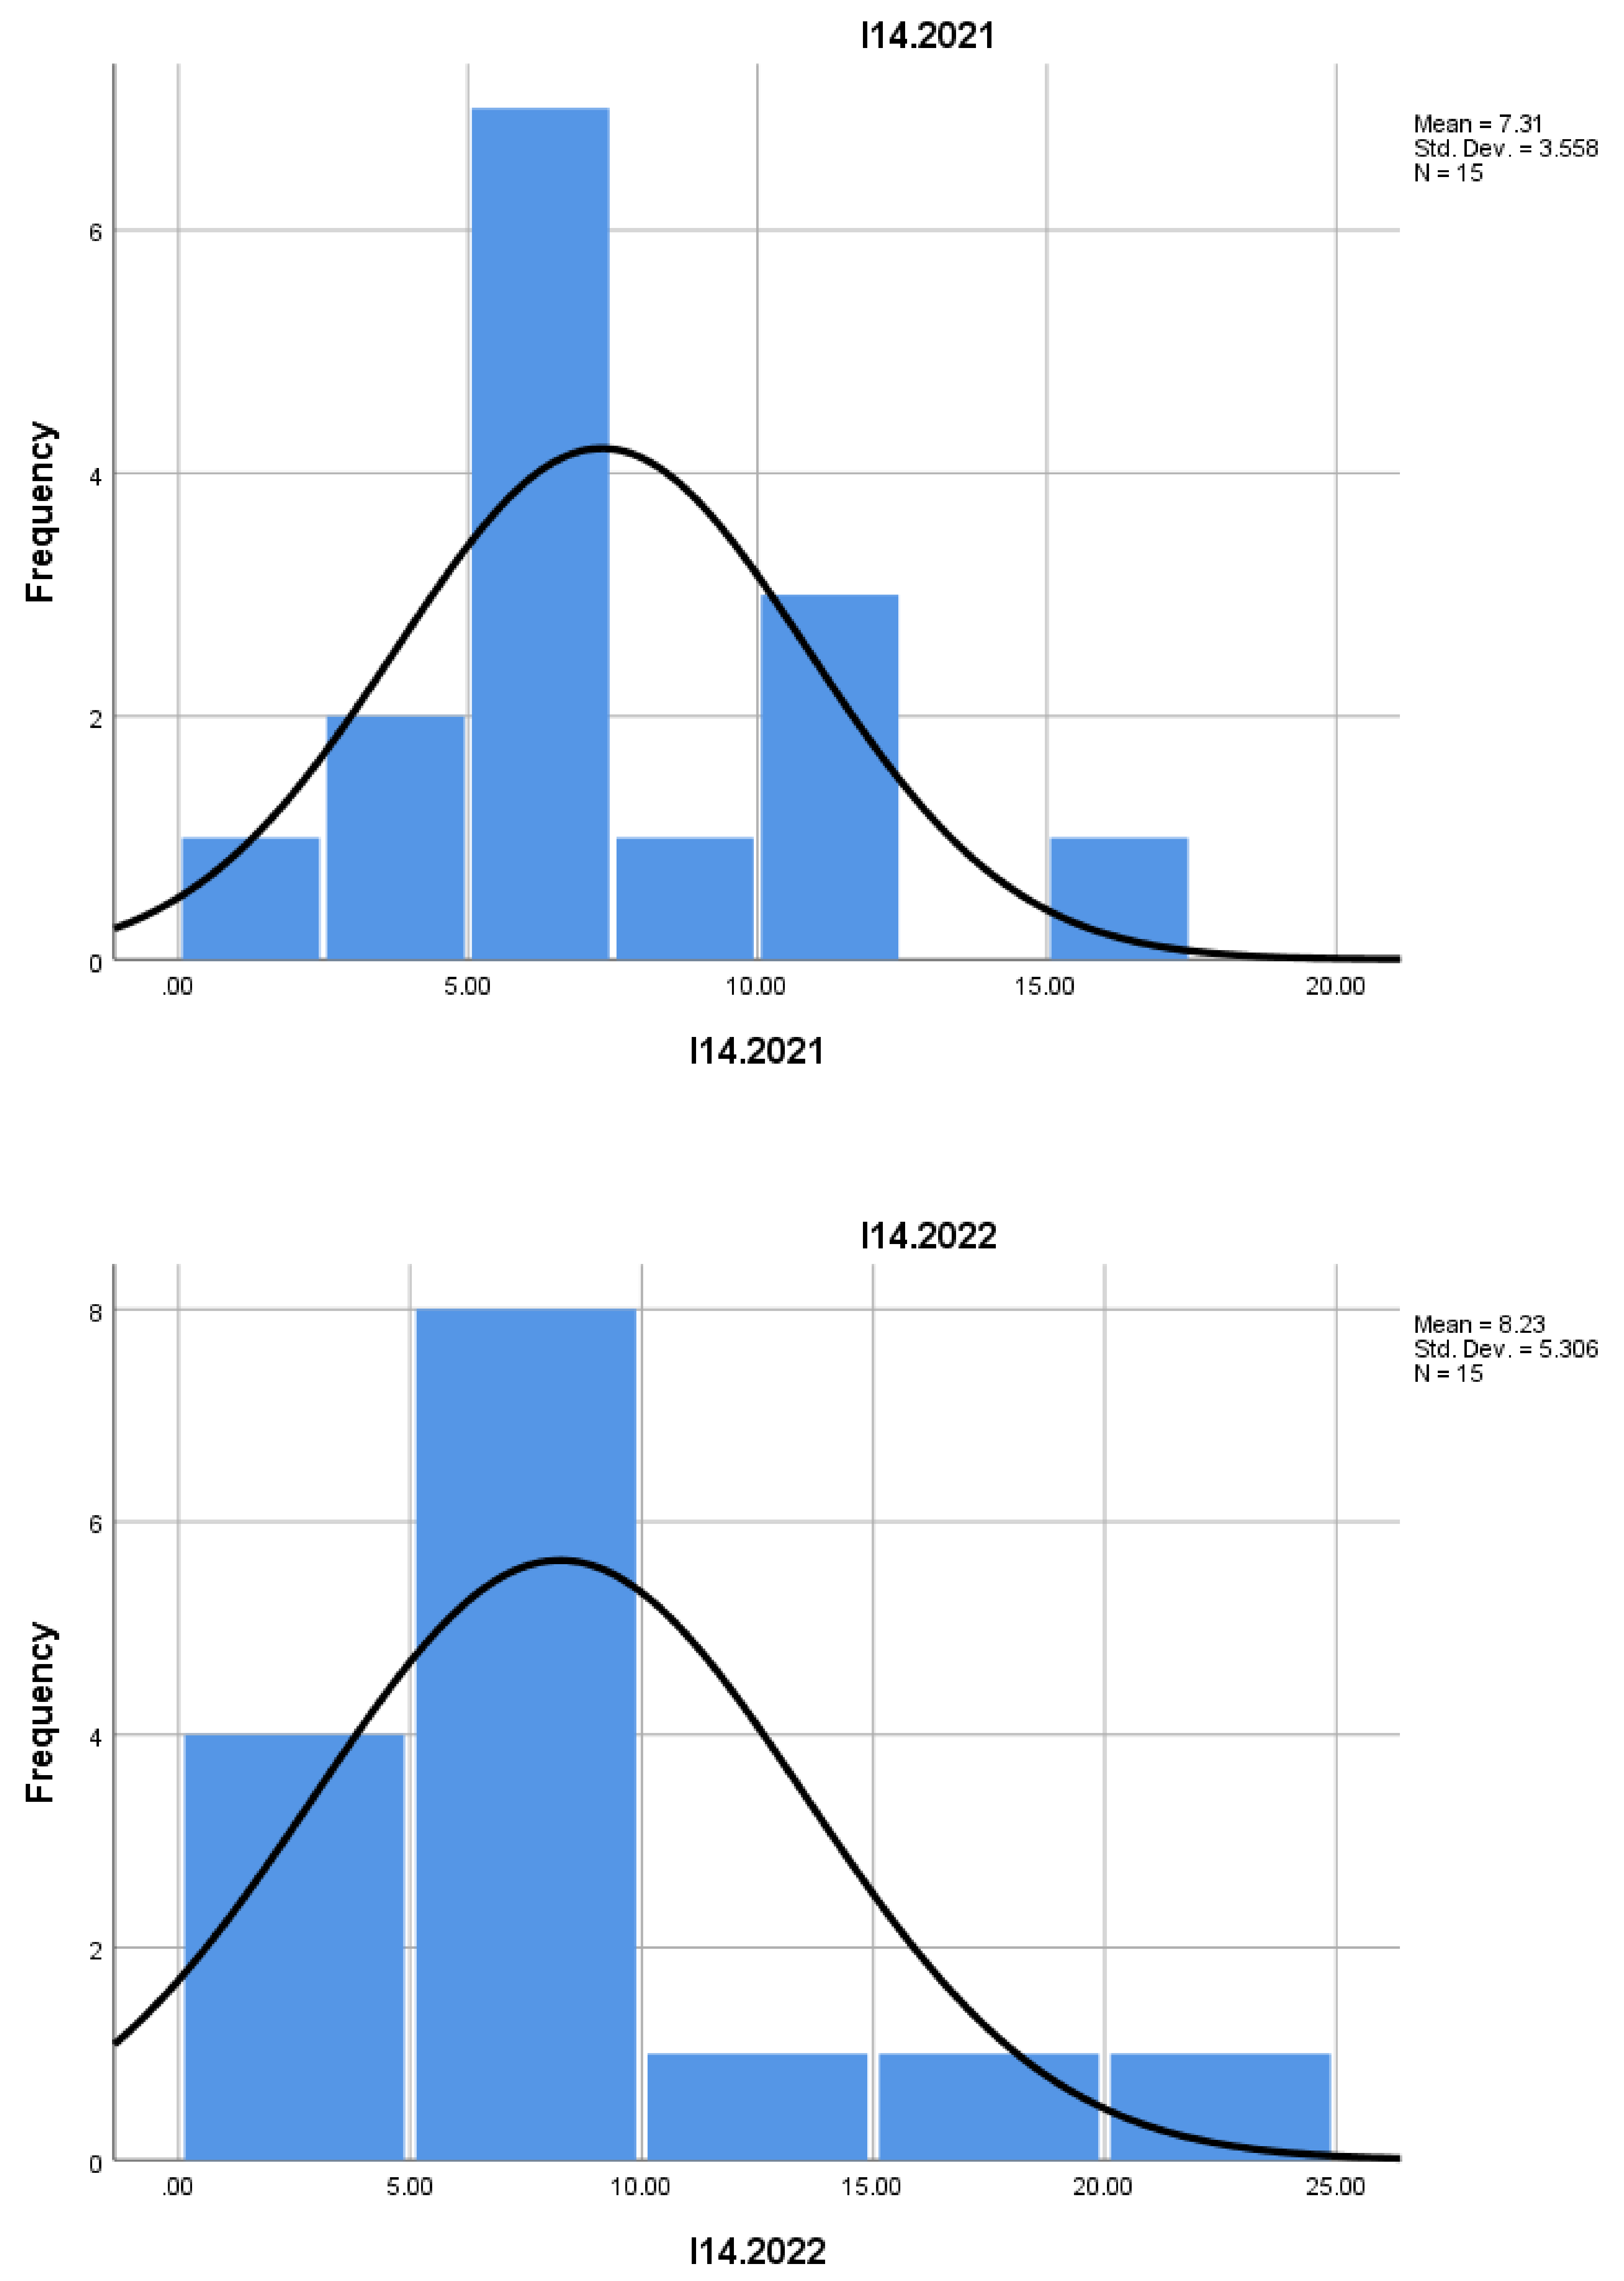
I14 reflects the number of enterprises that close, relative to active enterprises. A low death rate suggests a robust sector in which most enterprises remain stable in the long term. The constant rate in 2021–2022 suggests economic efficiency and adaptability to market demands in mountainous areas, where business closures are not a predominant feature.
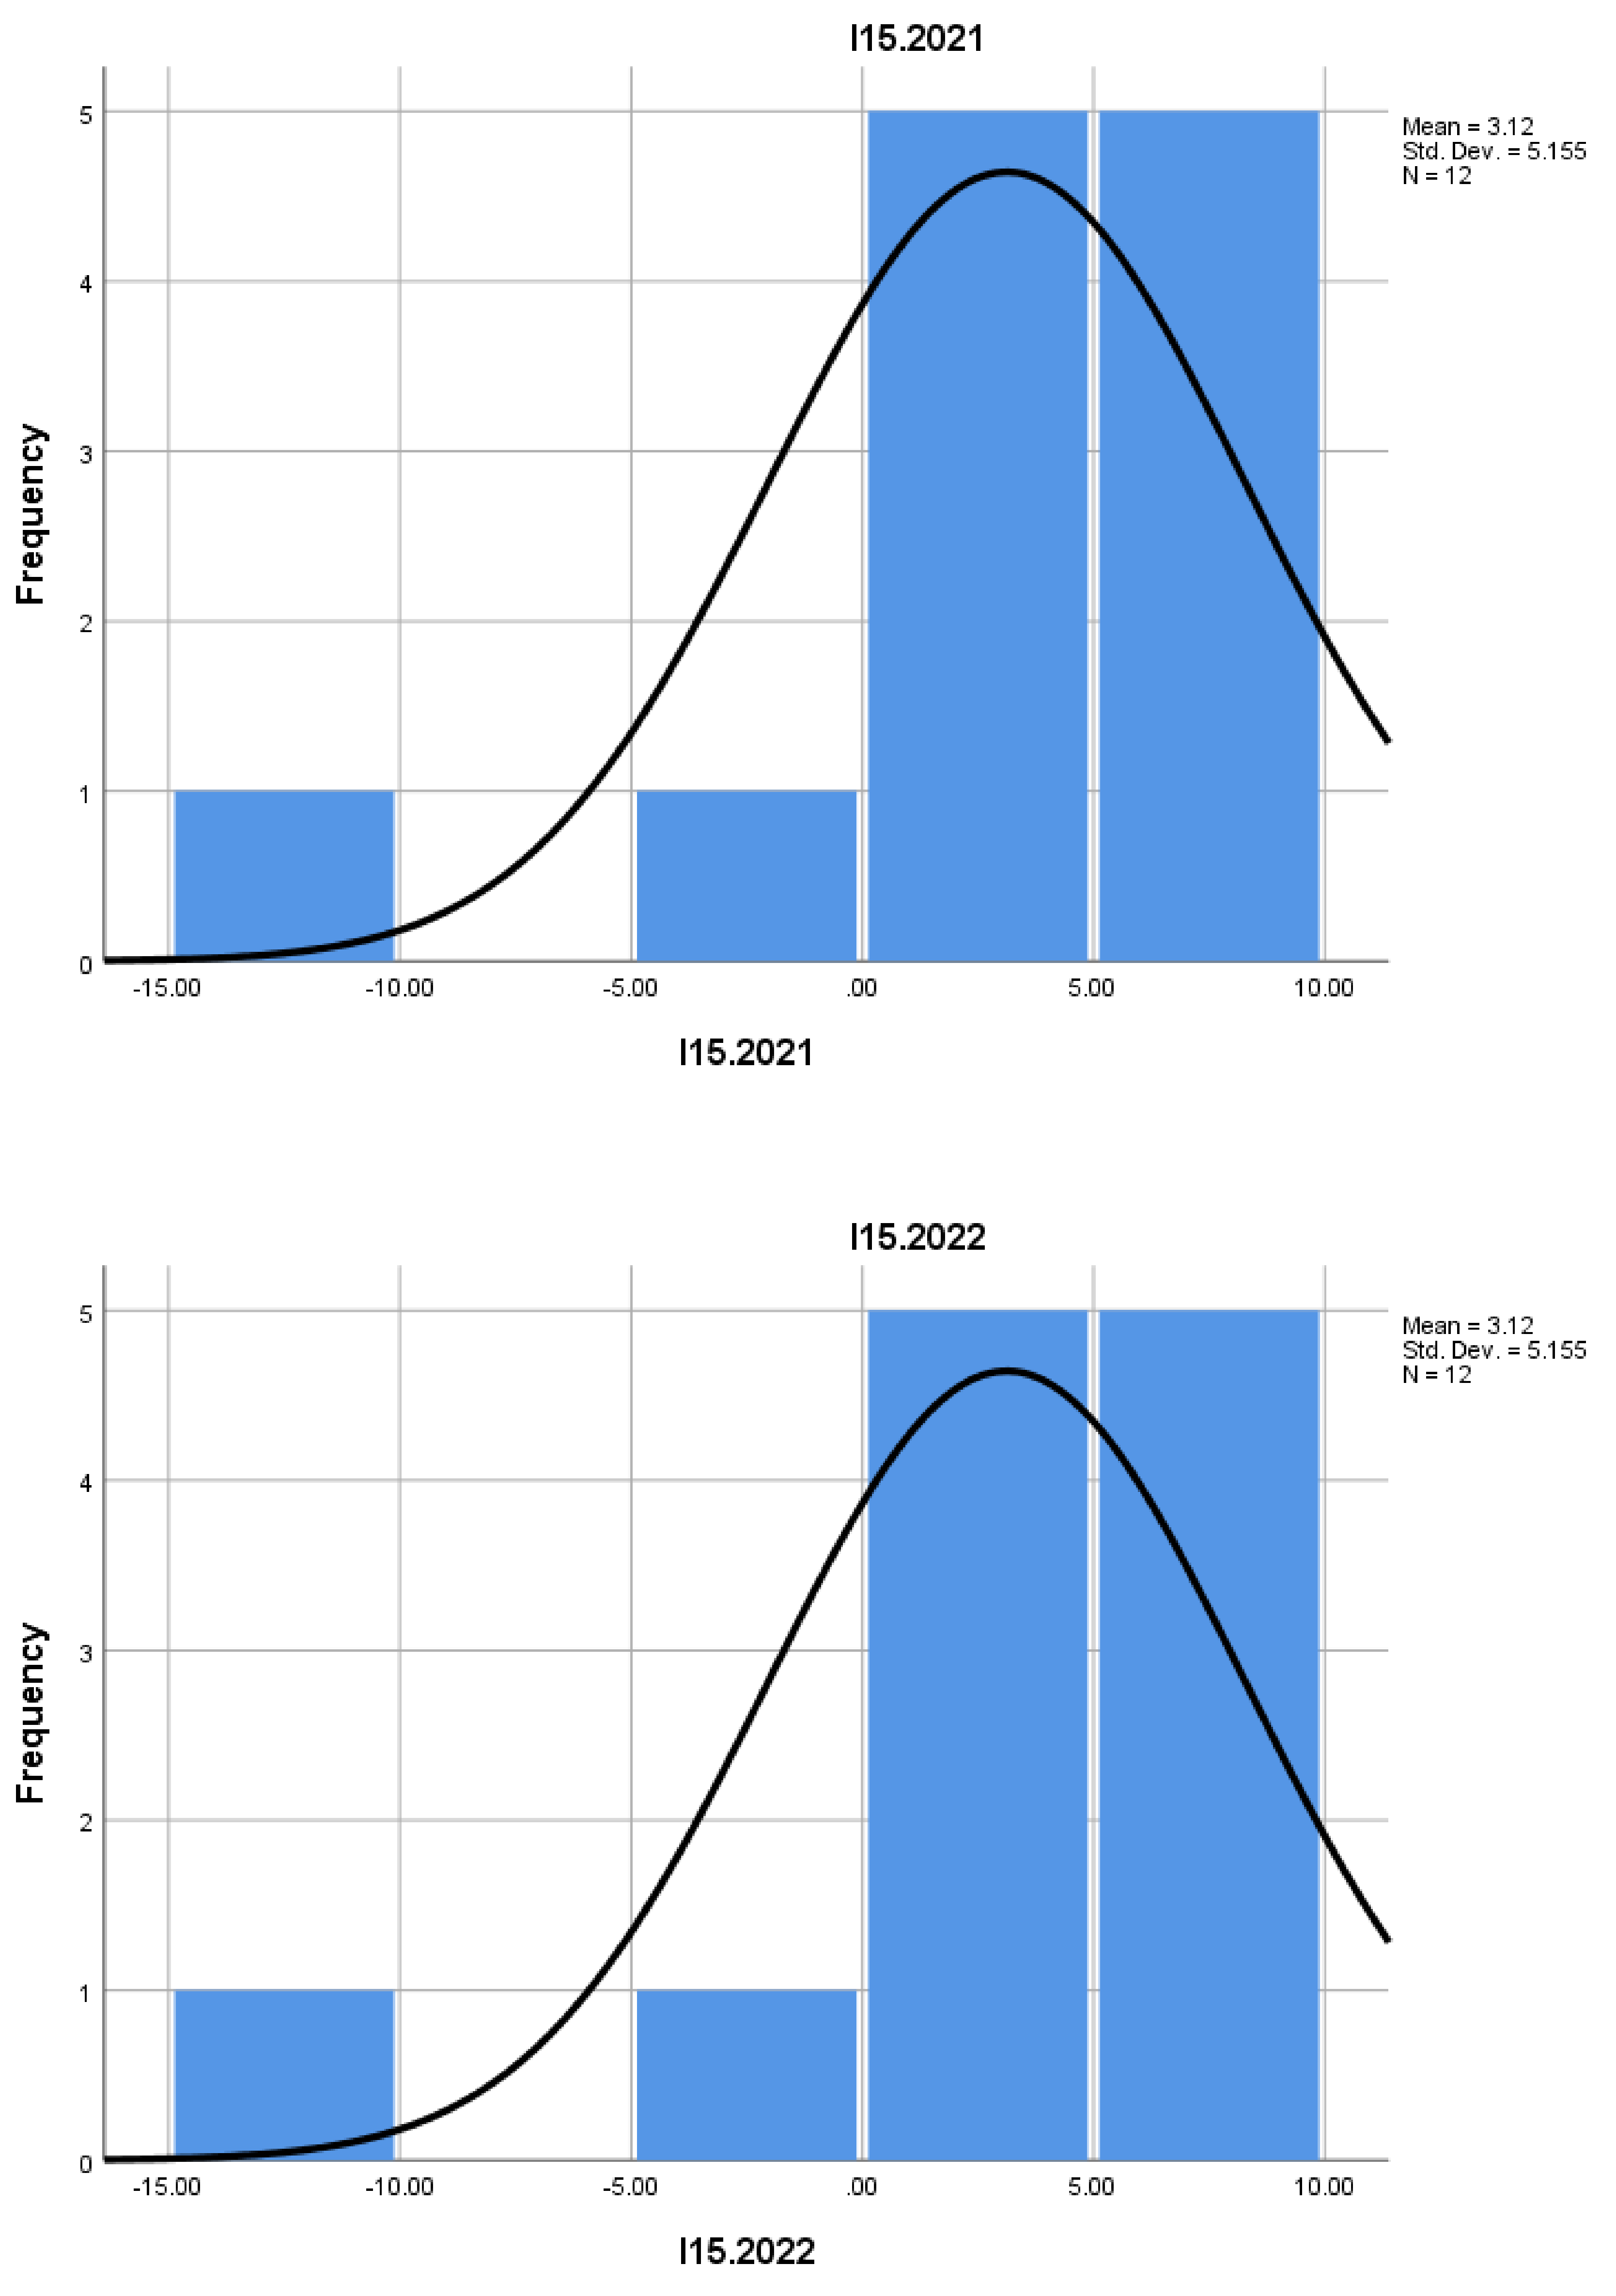
Indicator I15 shows the net growth in the number of businesses, comparing the number of new enterprises with those that closed. If the value is positive, it means the sector is experiencing net expansion. In this case, the trend suggests slight net growth, which may indicate a favorable economic environment for entrepreneurship in the mountain construction sector.
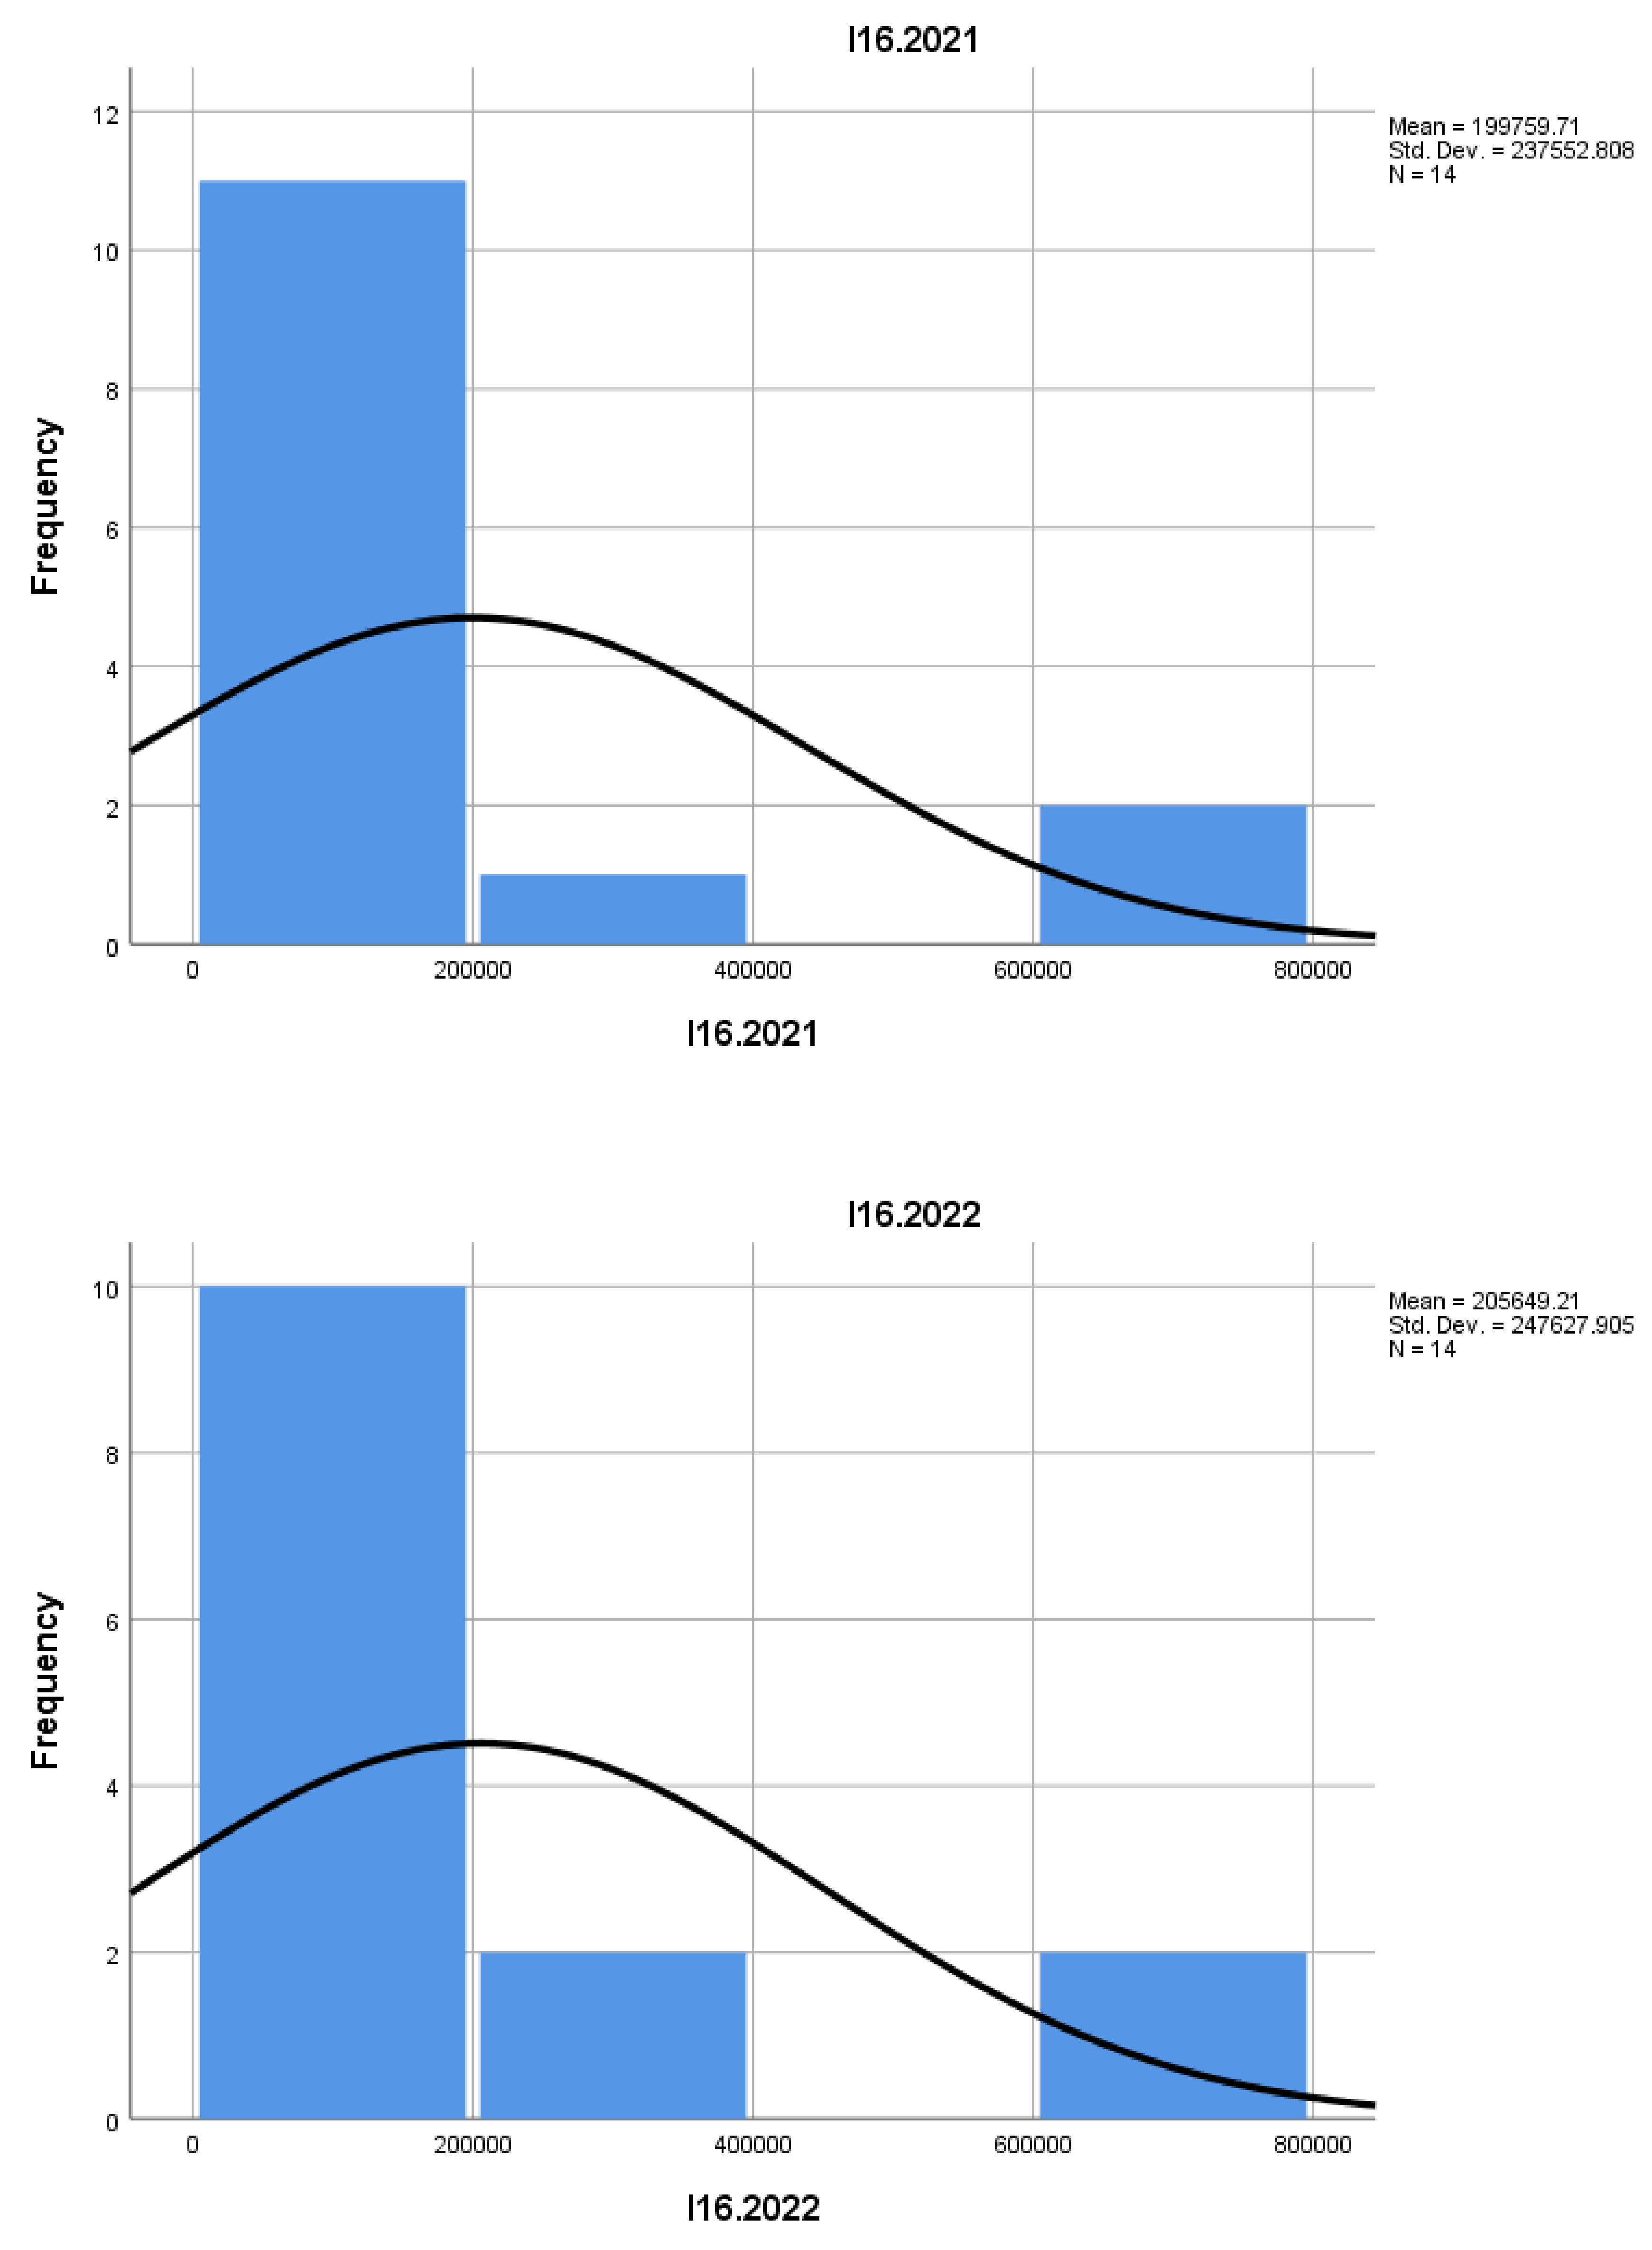
Indicator I16 reflects the total number of employees in the mountain construction sector. The observed trends suggest relative stability in employment levels in this sector. The moderate growth of this indicator may reflect a constant demand for mountain construction services, but not one that leads to significant labor force expansion.
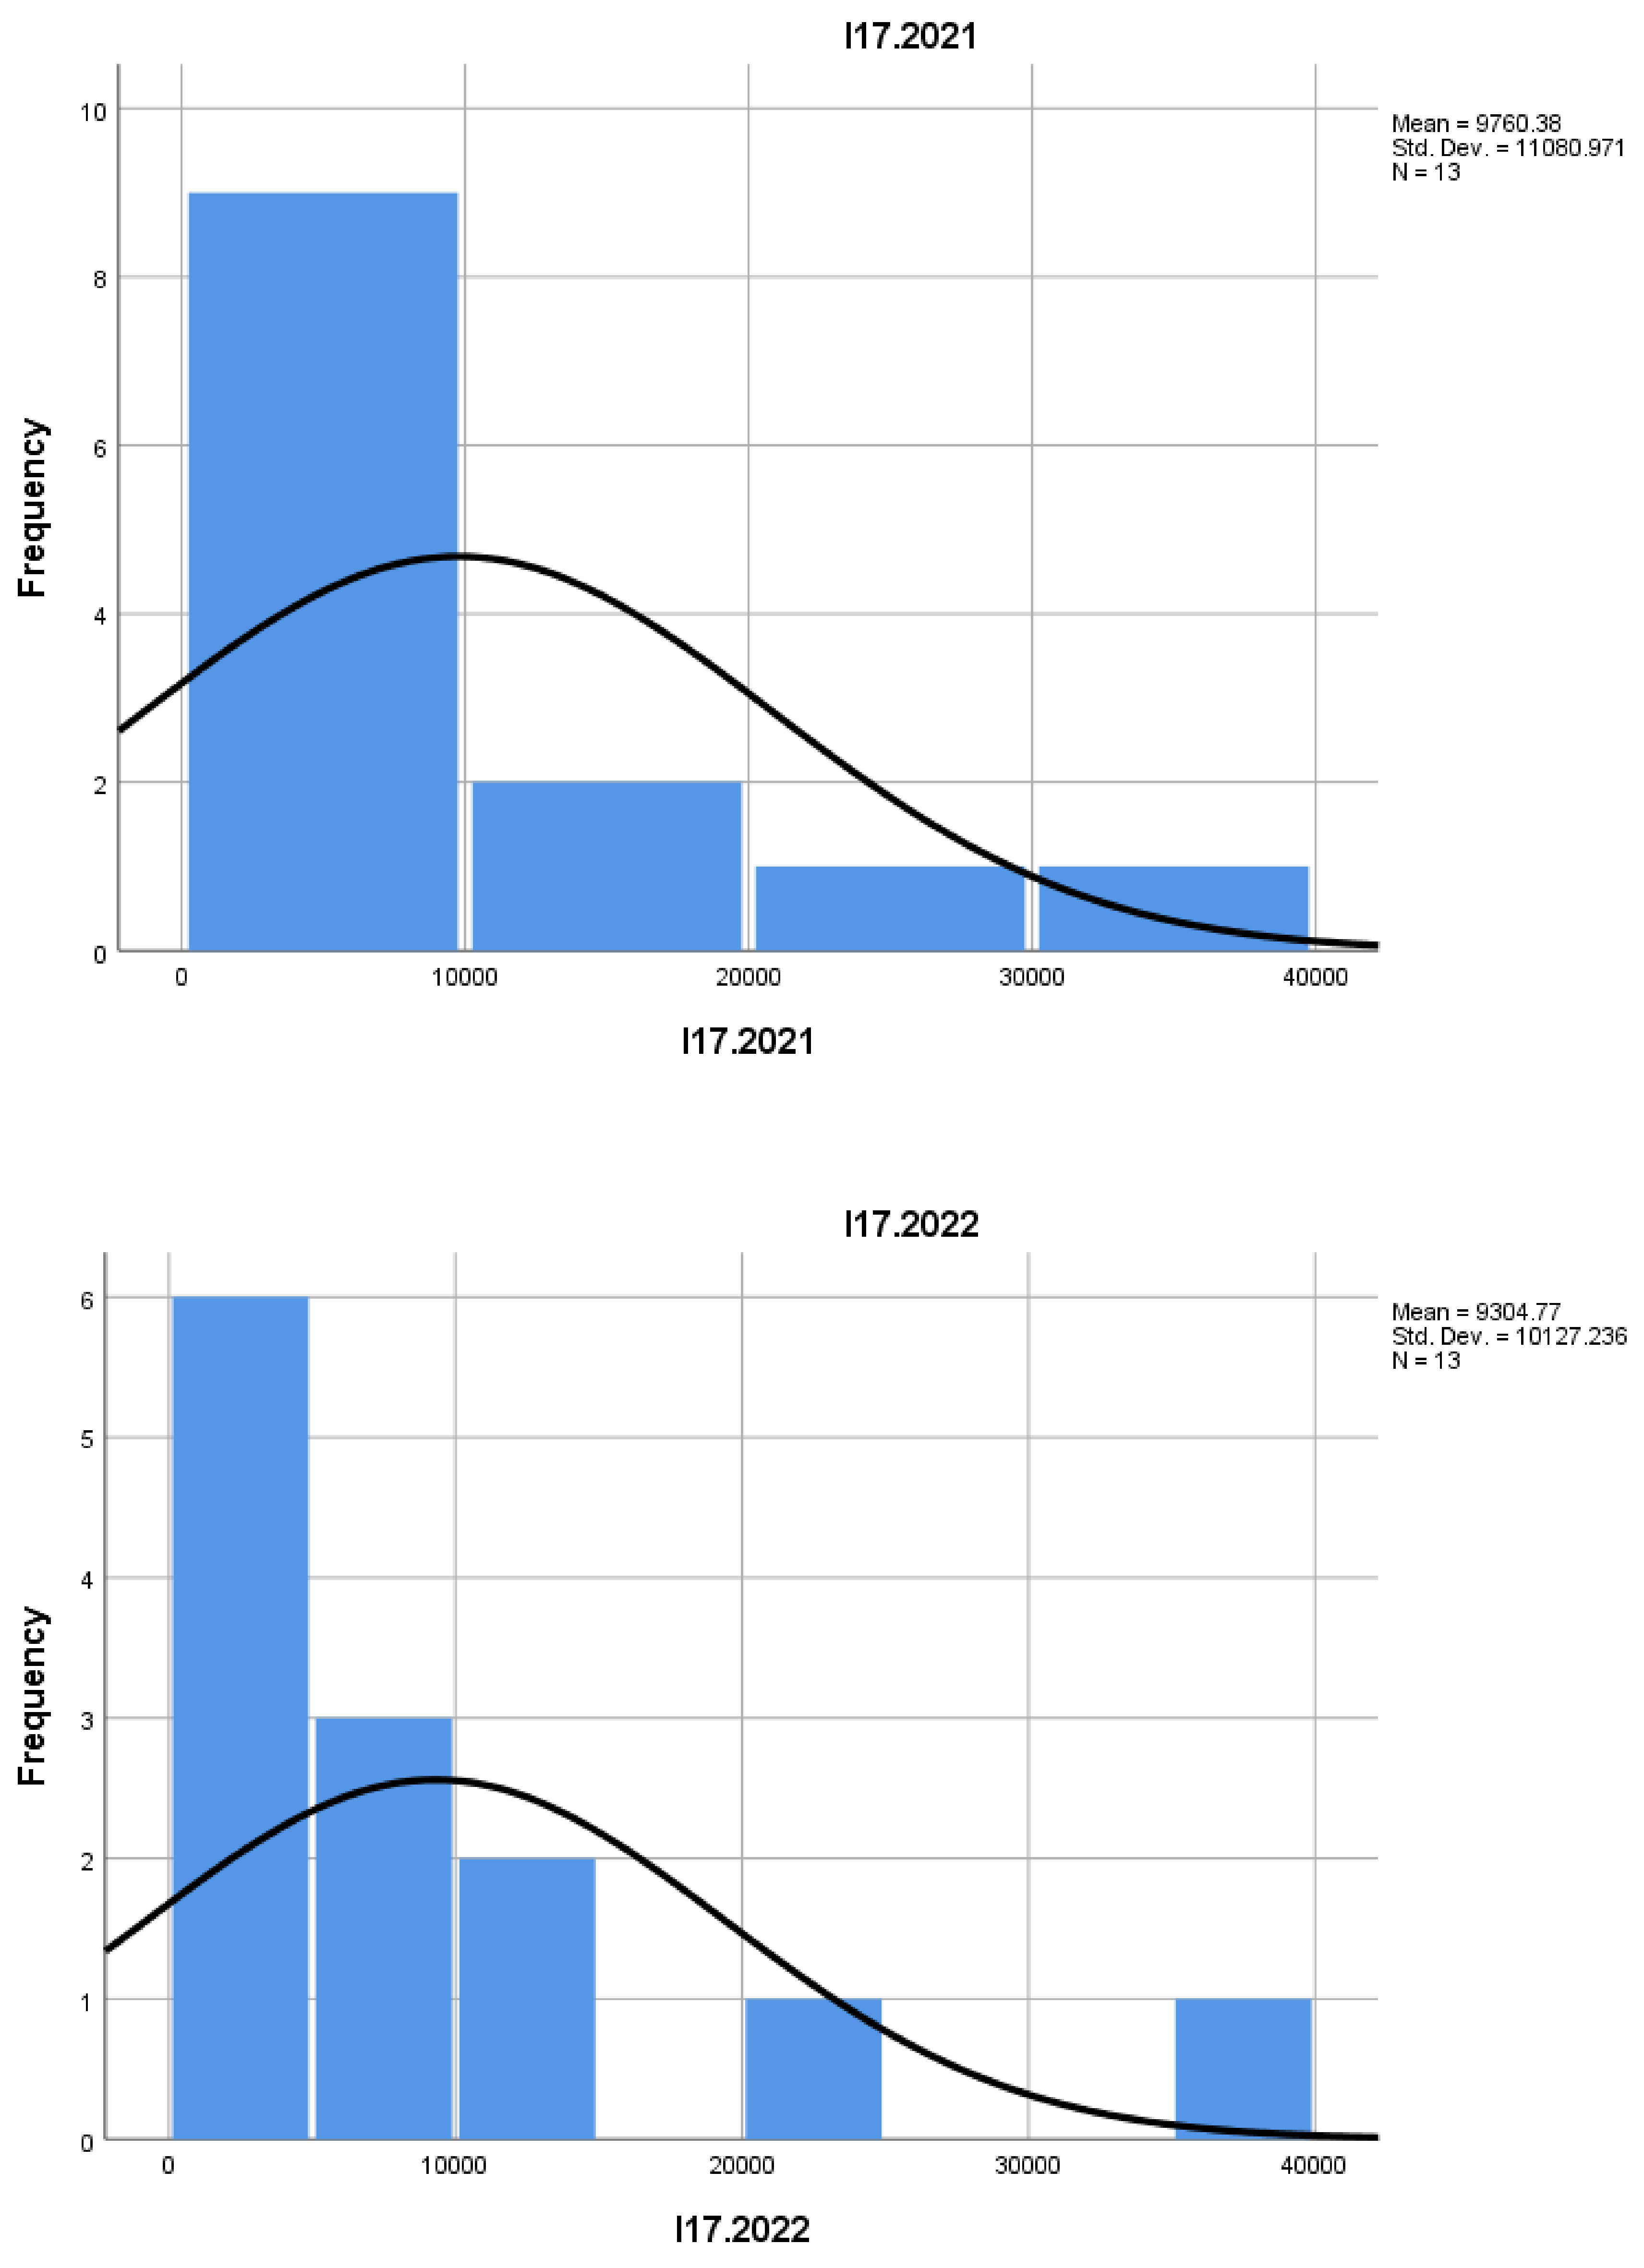
I17 shows the number of employees in newly established enterprises. The average value of this indicator suggests that new enterprises in mountain construction have a relatively small number of employees, consistent with the smaller scale of businesses in this sector.
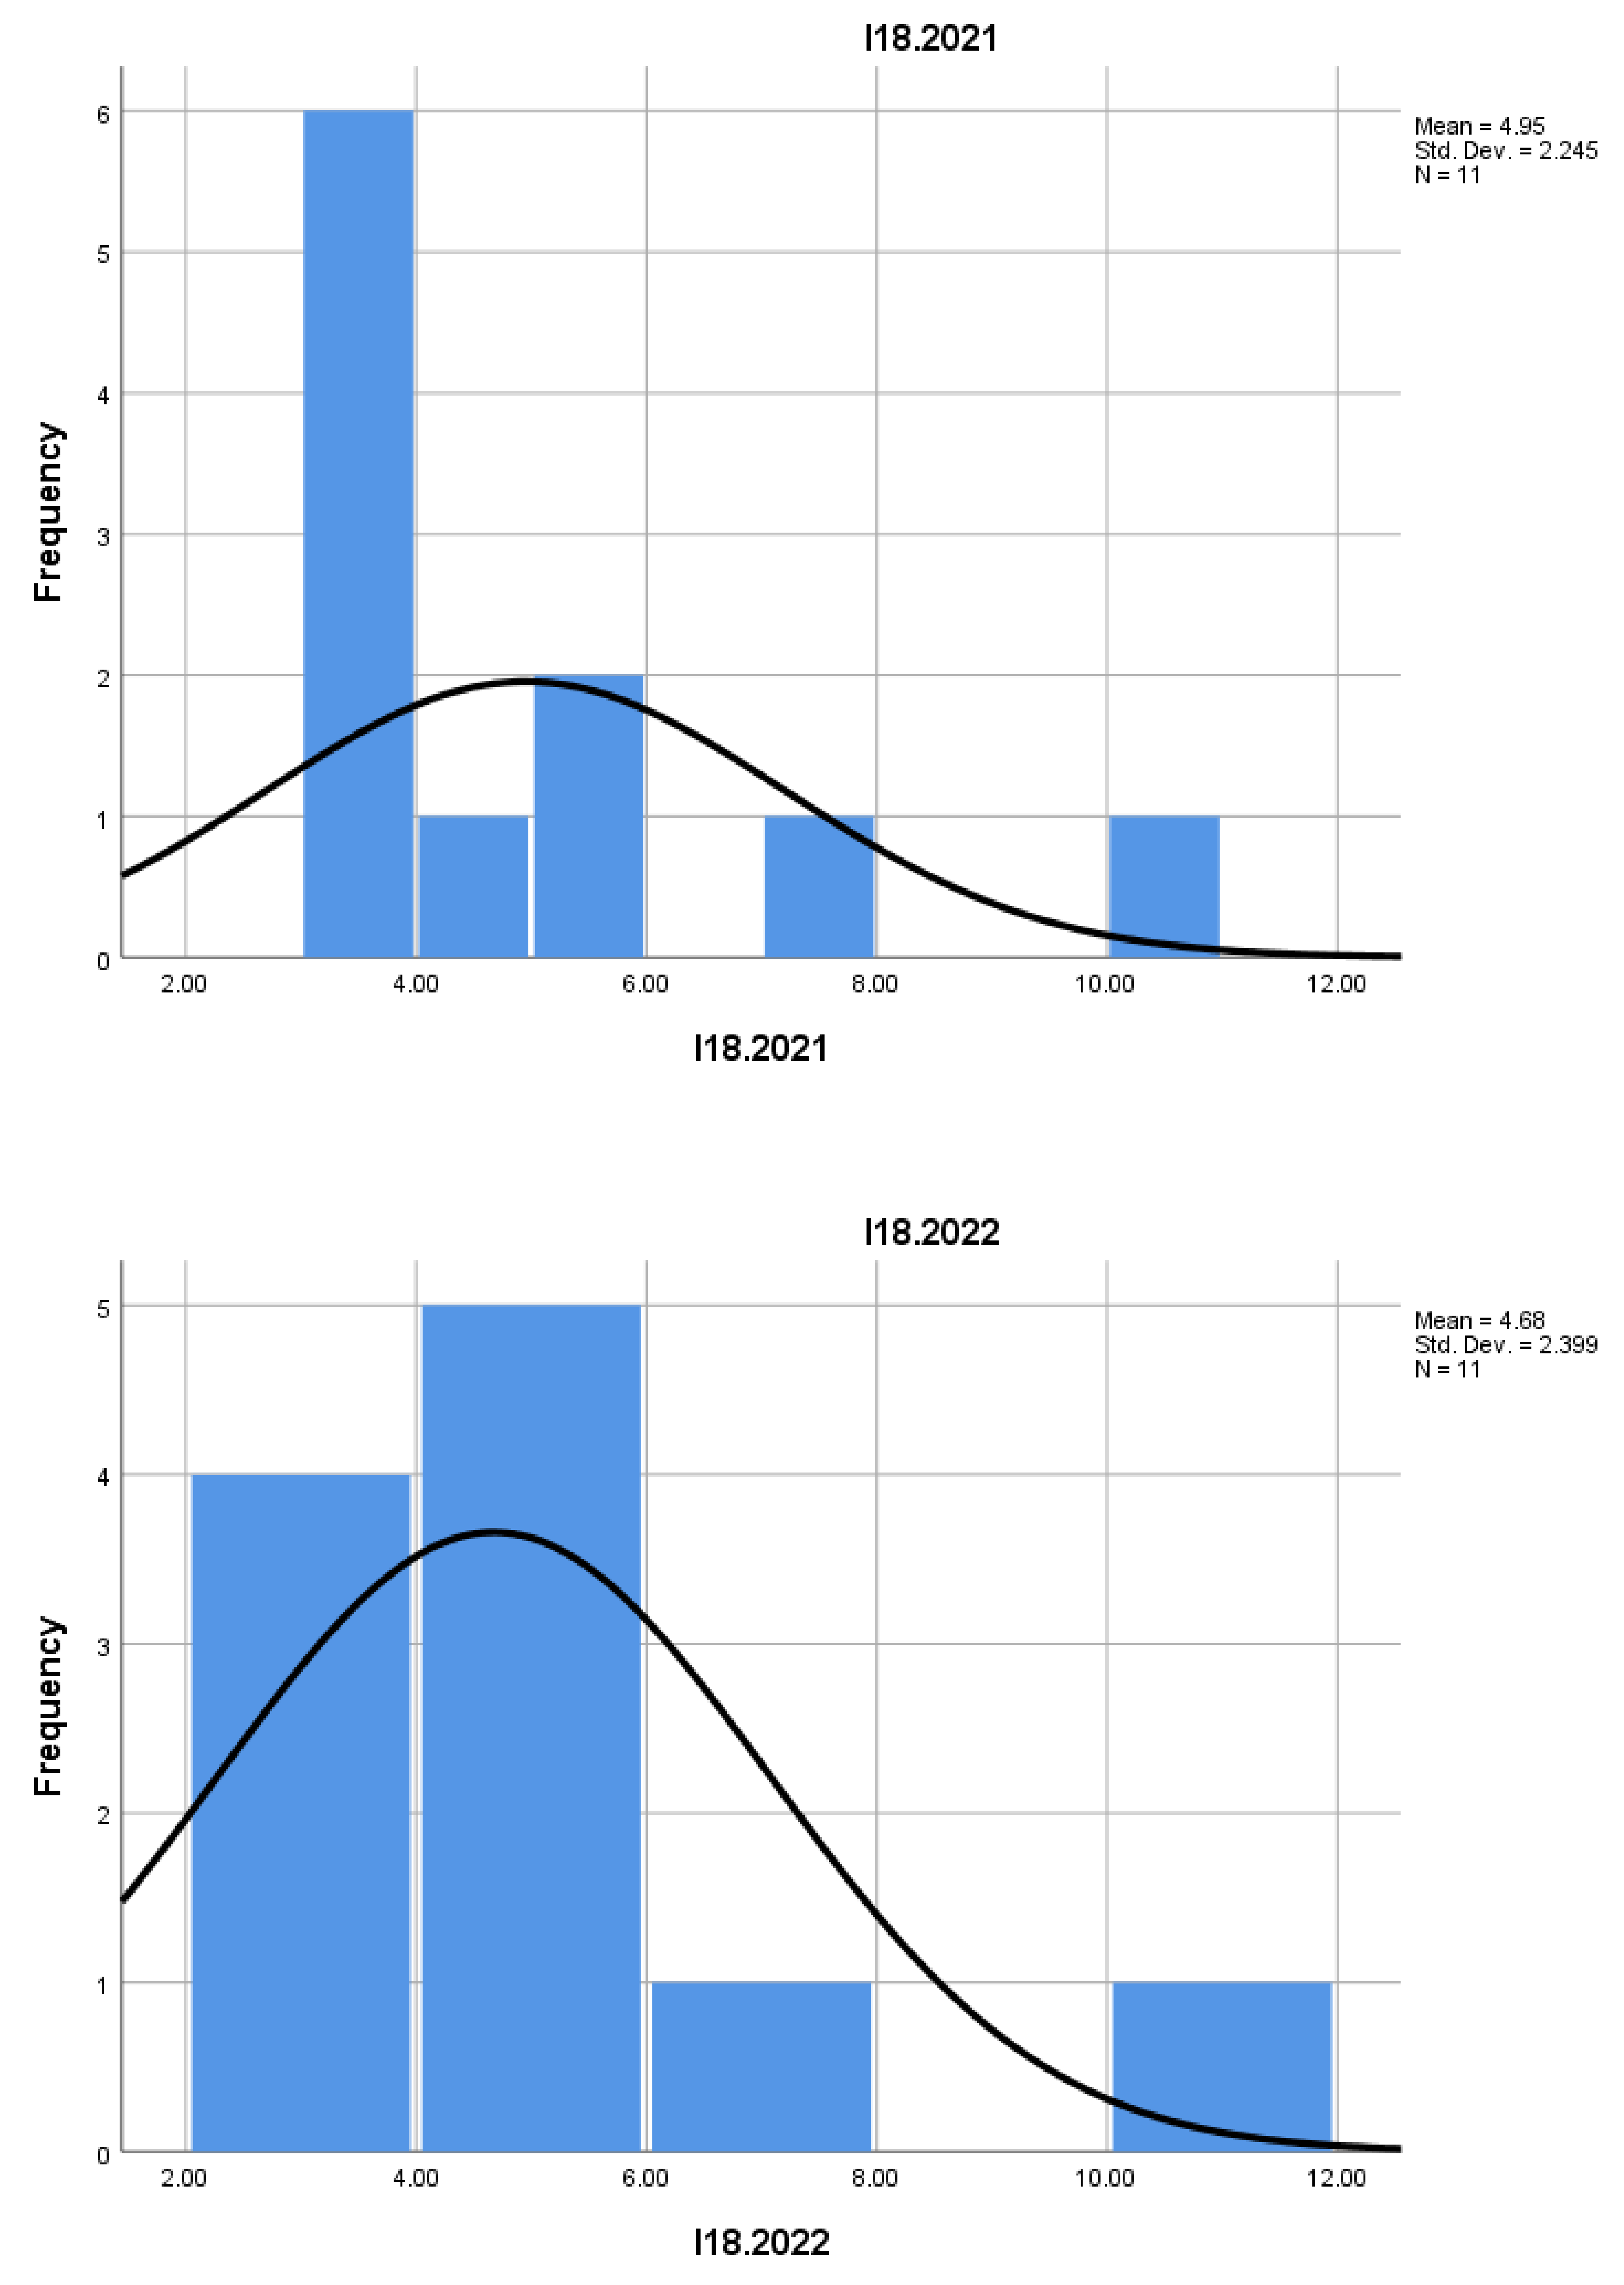
Indicator I18 shows the proportion of employees in new enterprises relative to the entire population of active employees. This indicator suggests that new enterprises in mountain construction employ a relatively small share of the total active workforce, which may be characteristic of a sector dominated by small businesses with slow expansion.
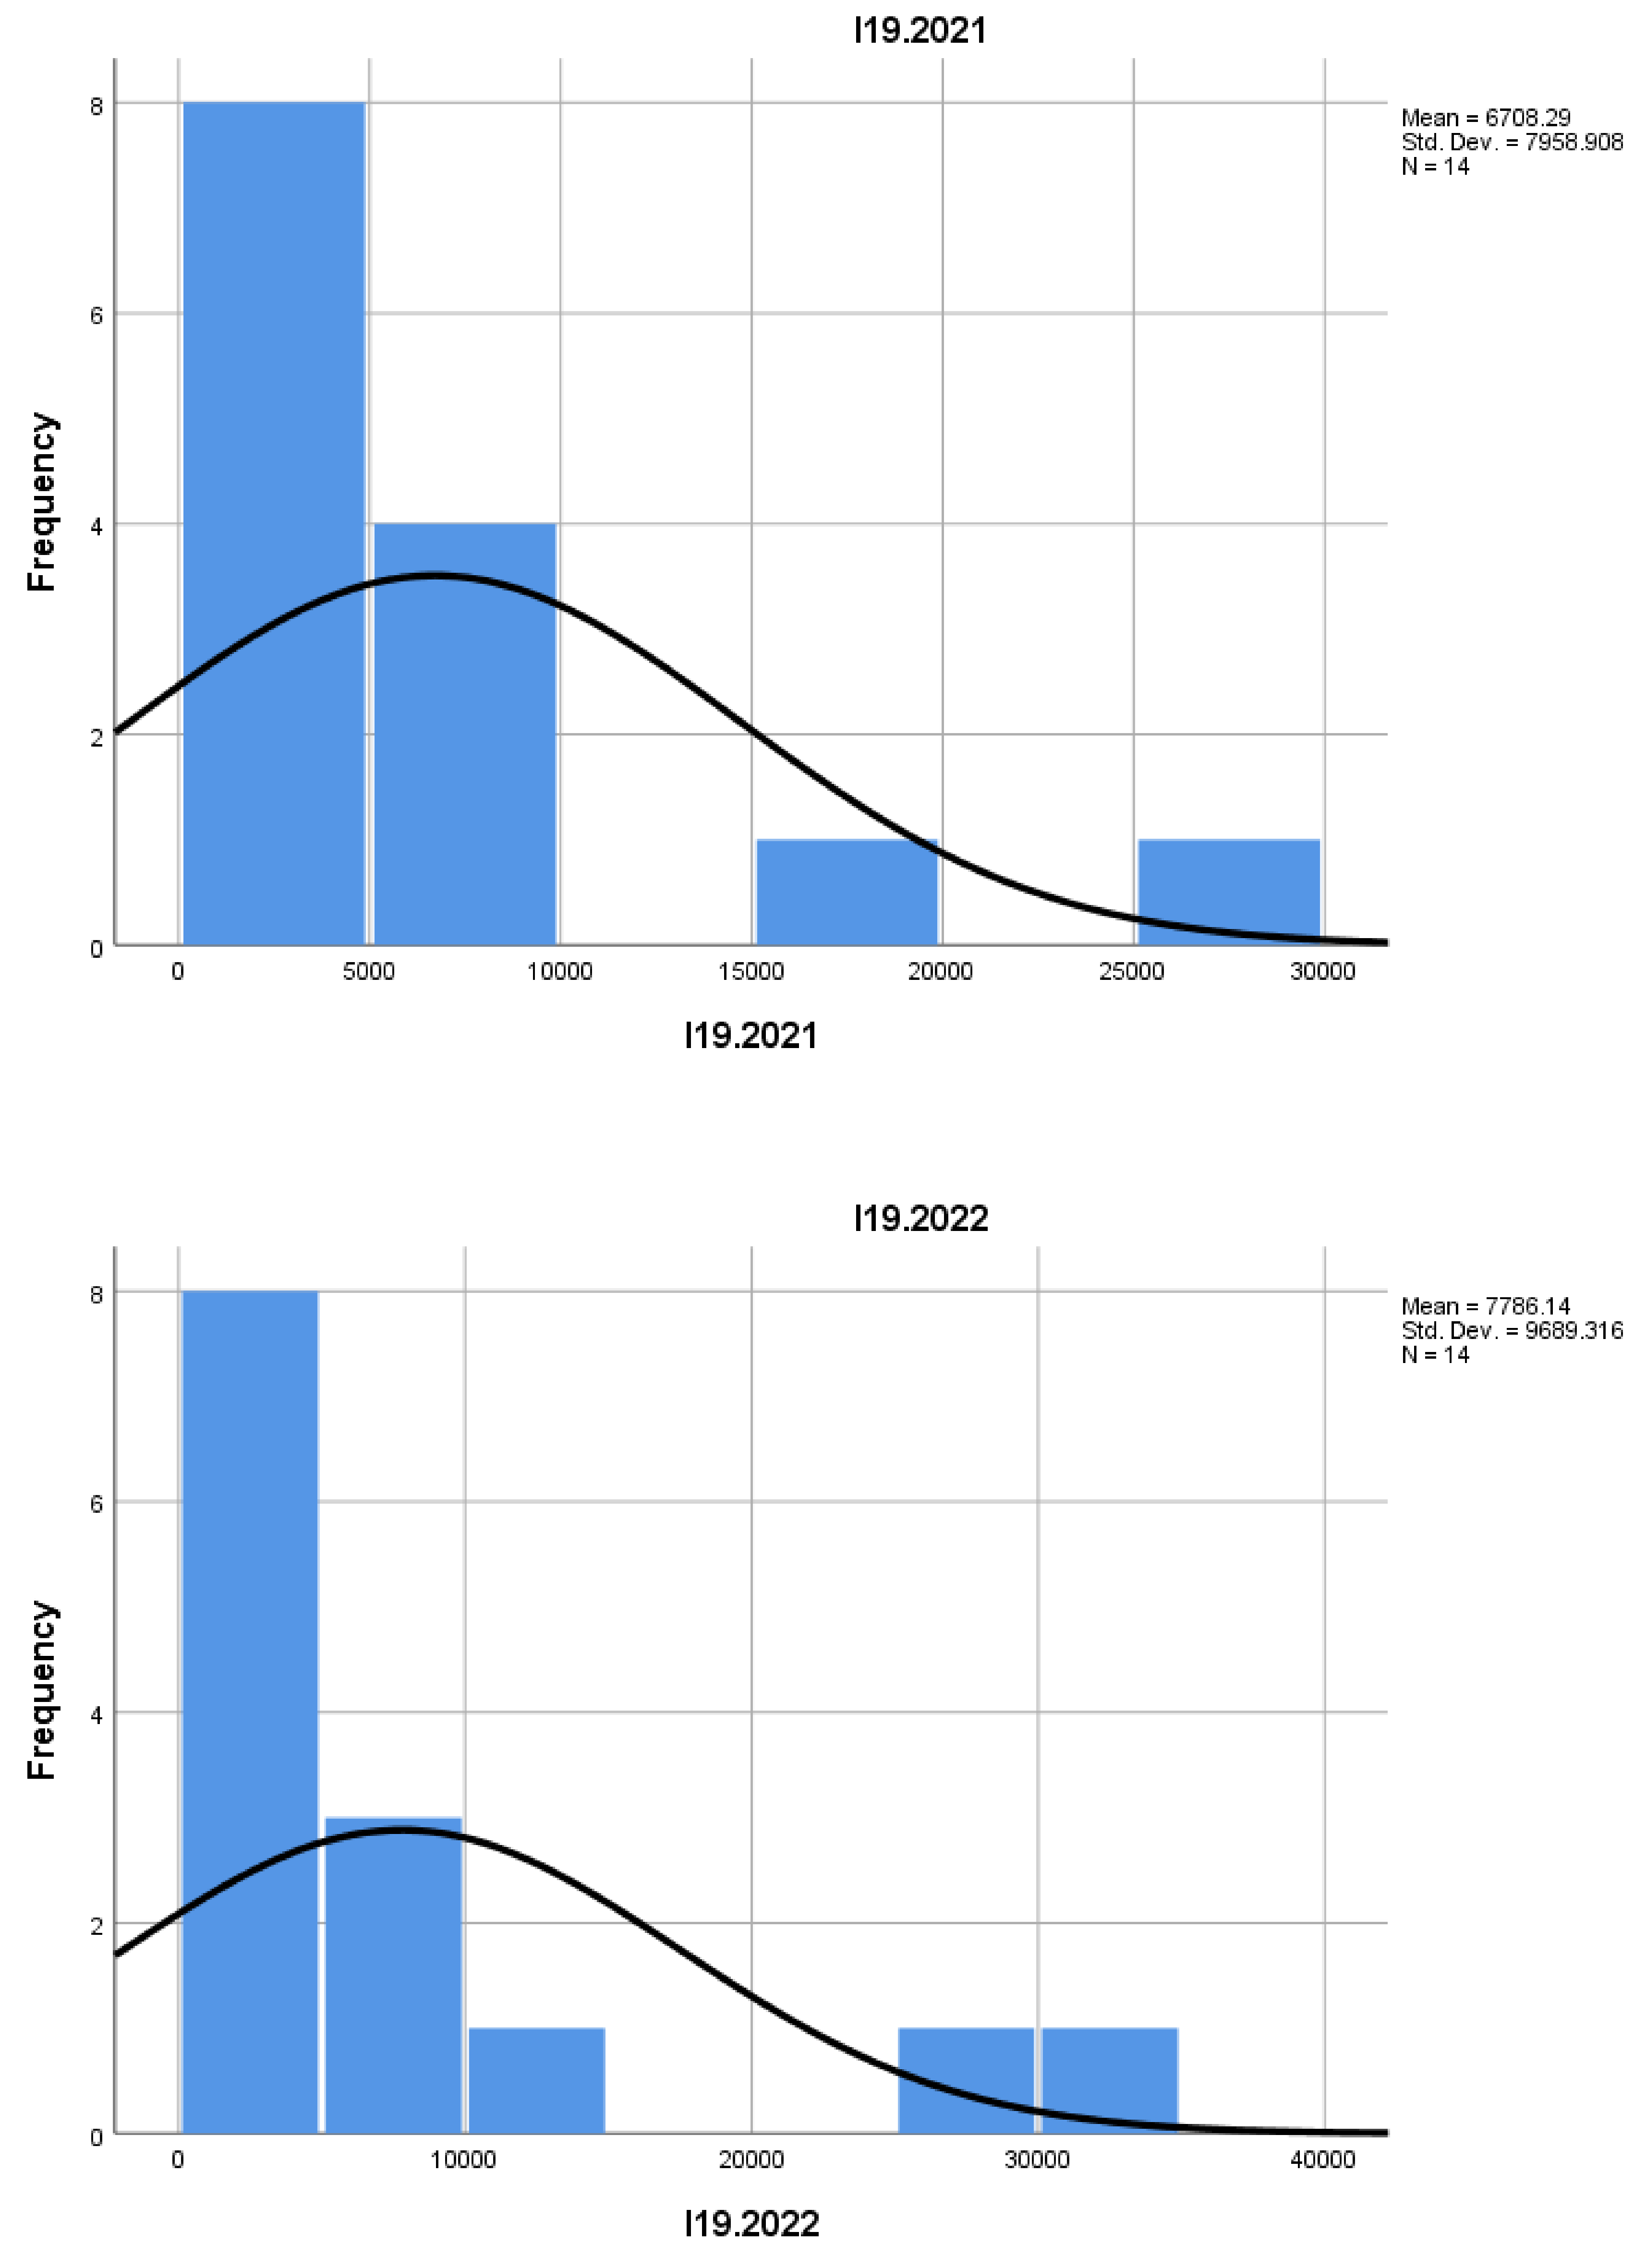
I19 reflects job losses caused by business closures. Although this indicator is smaller compared to others, it still indicates that business closures have some impact on employment, though this impact is limited in the mountain construction sector.
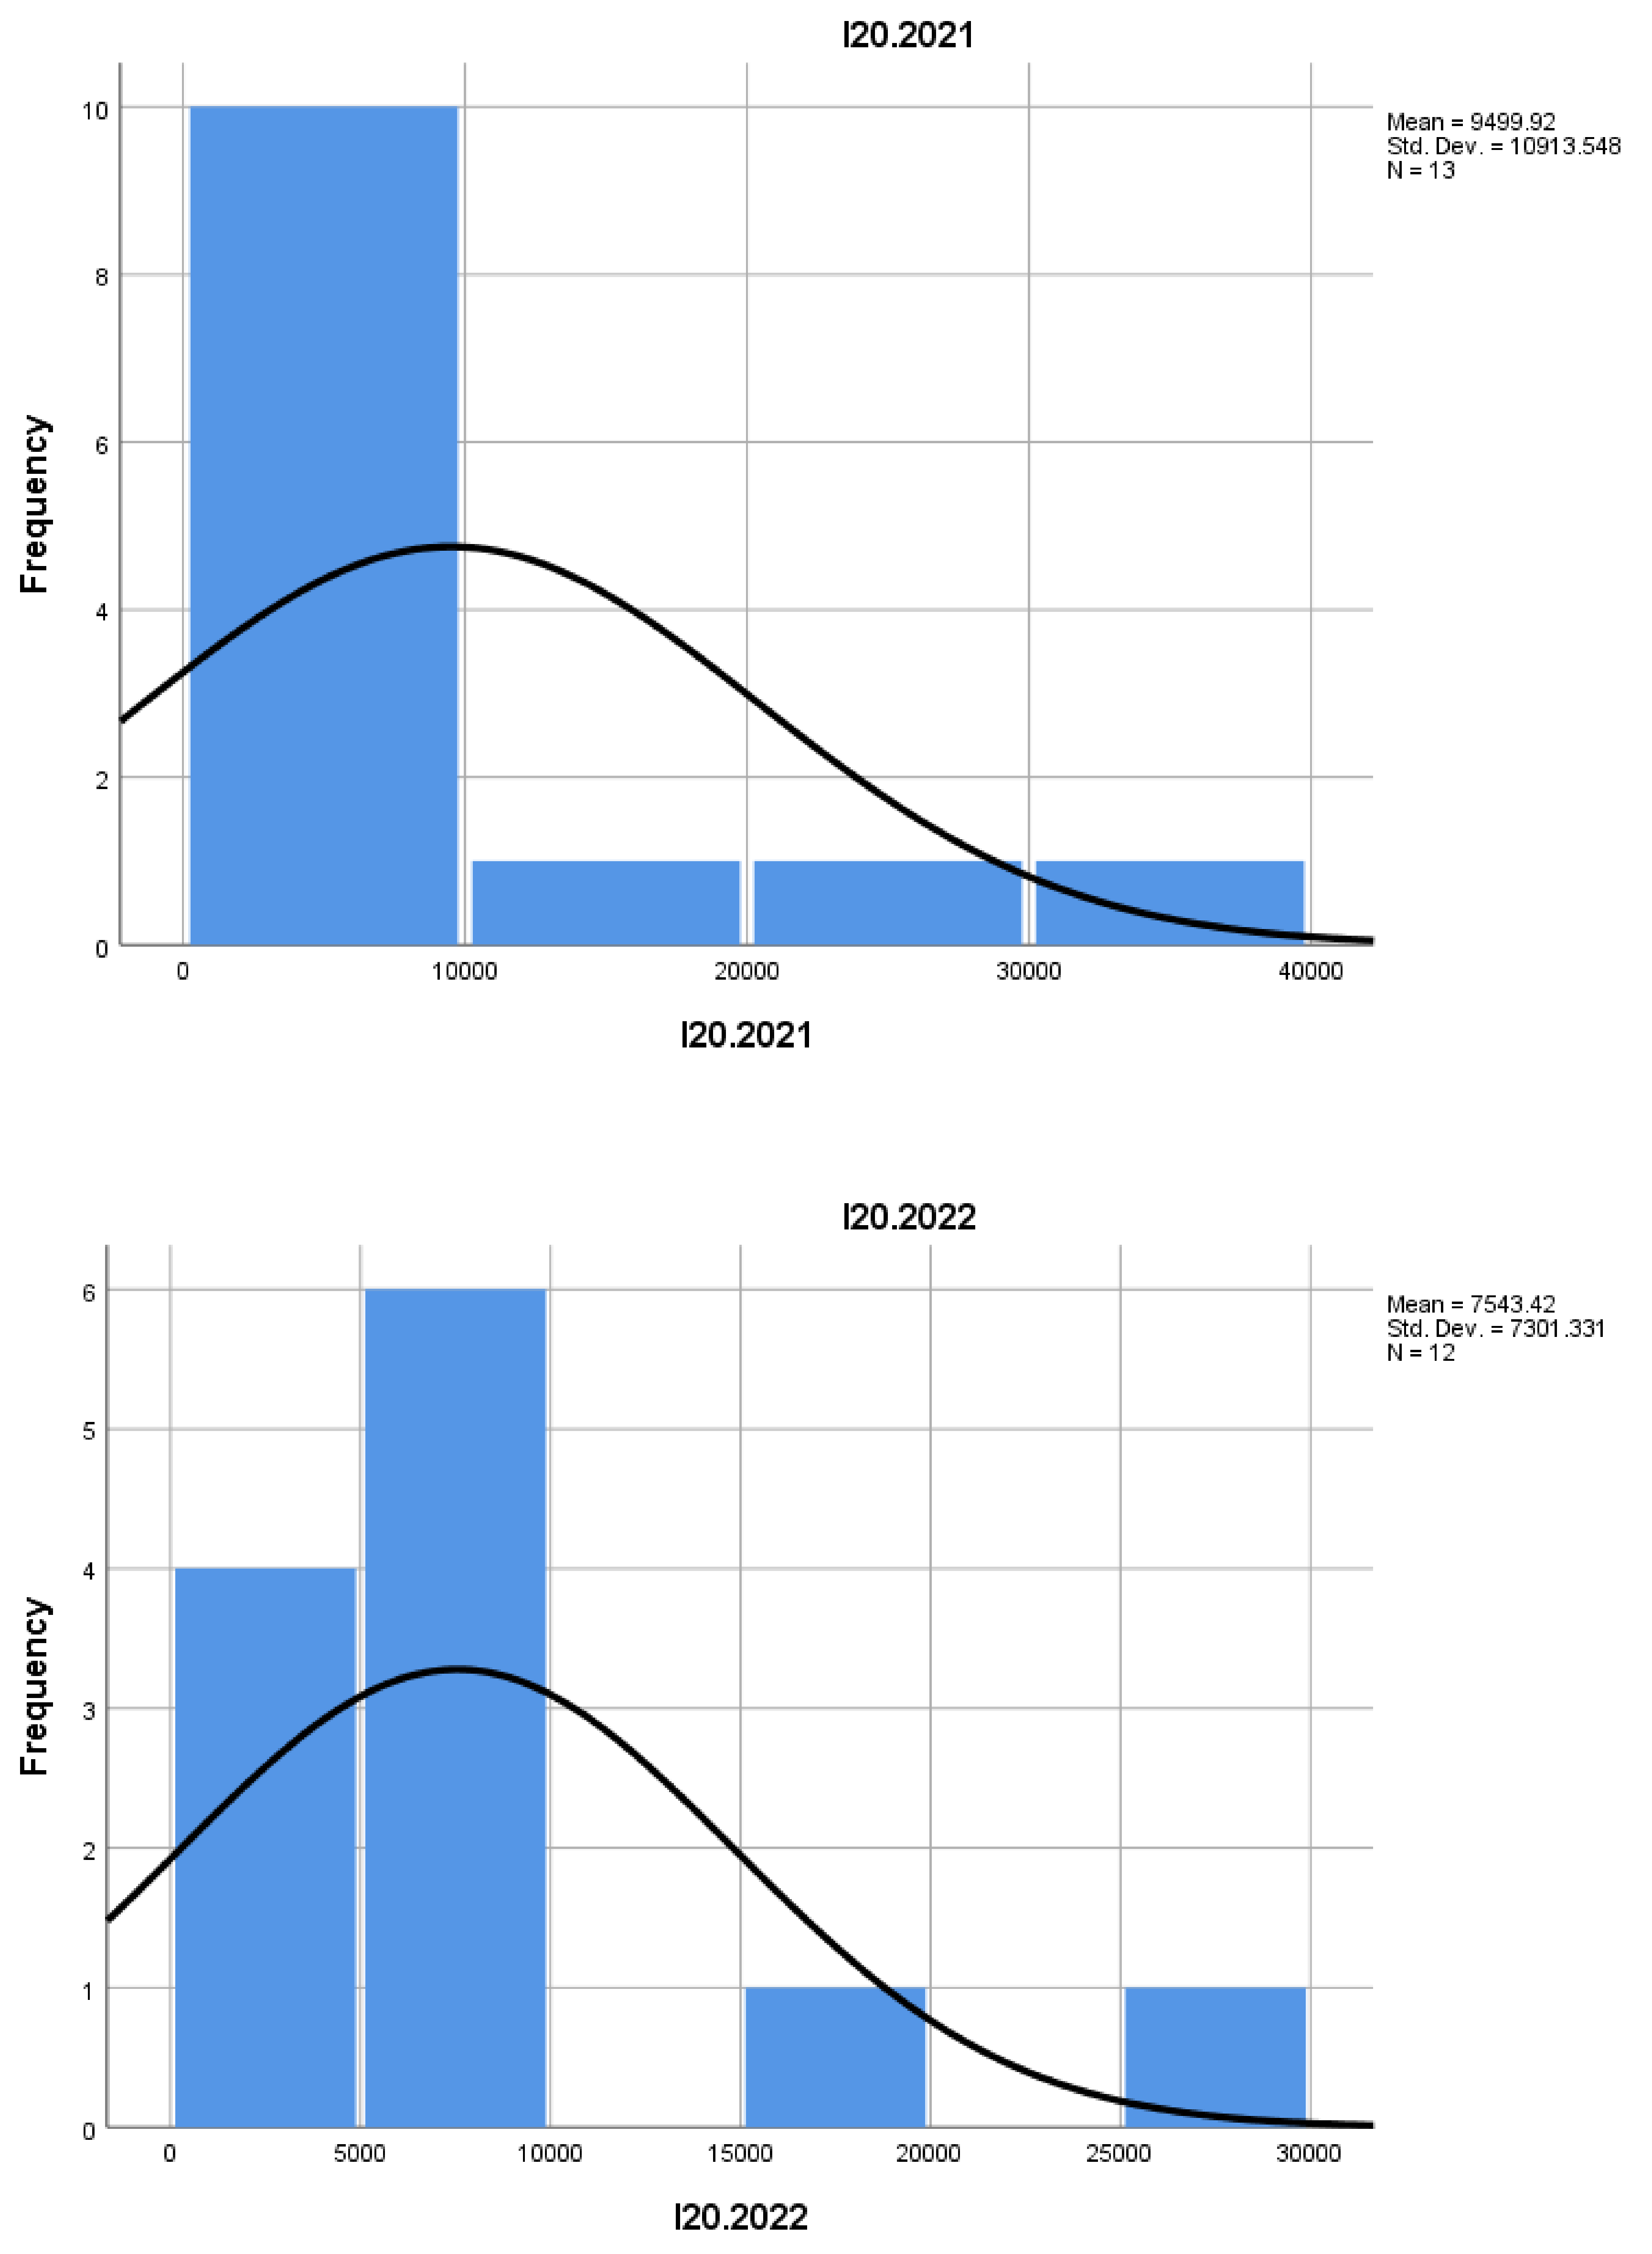
Indicator I20 shows the number of jobs in enterprises that have survived for at least 3 years, suggesting that these businesses are more established and contribute significantly to employment in the mountain construction sector.
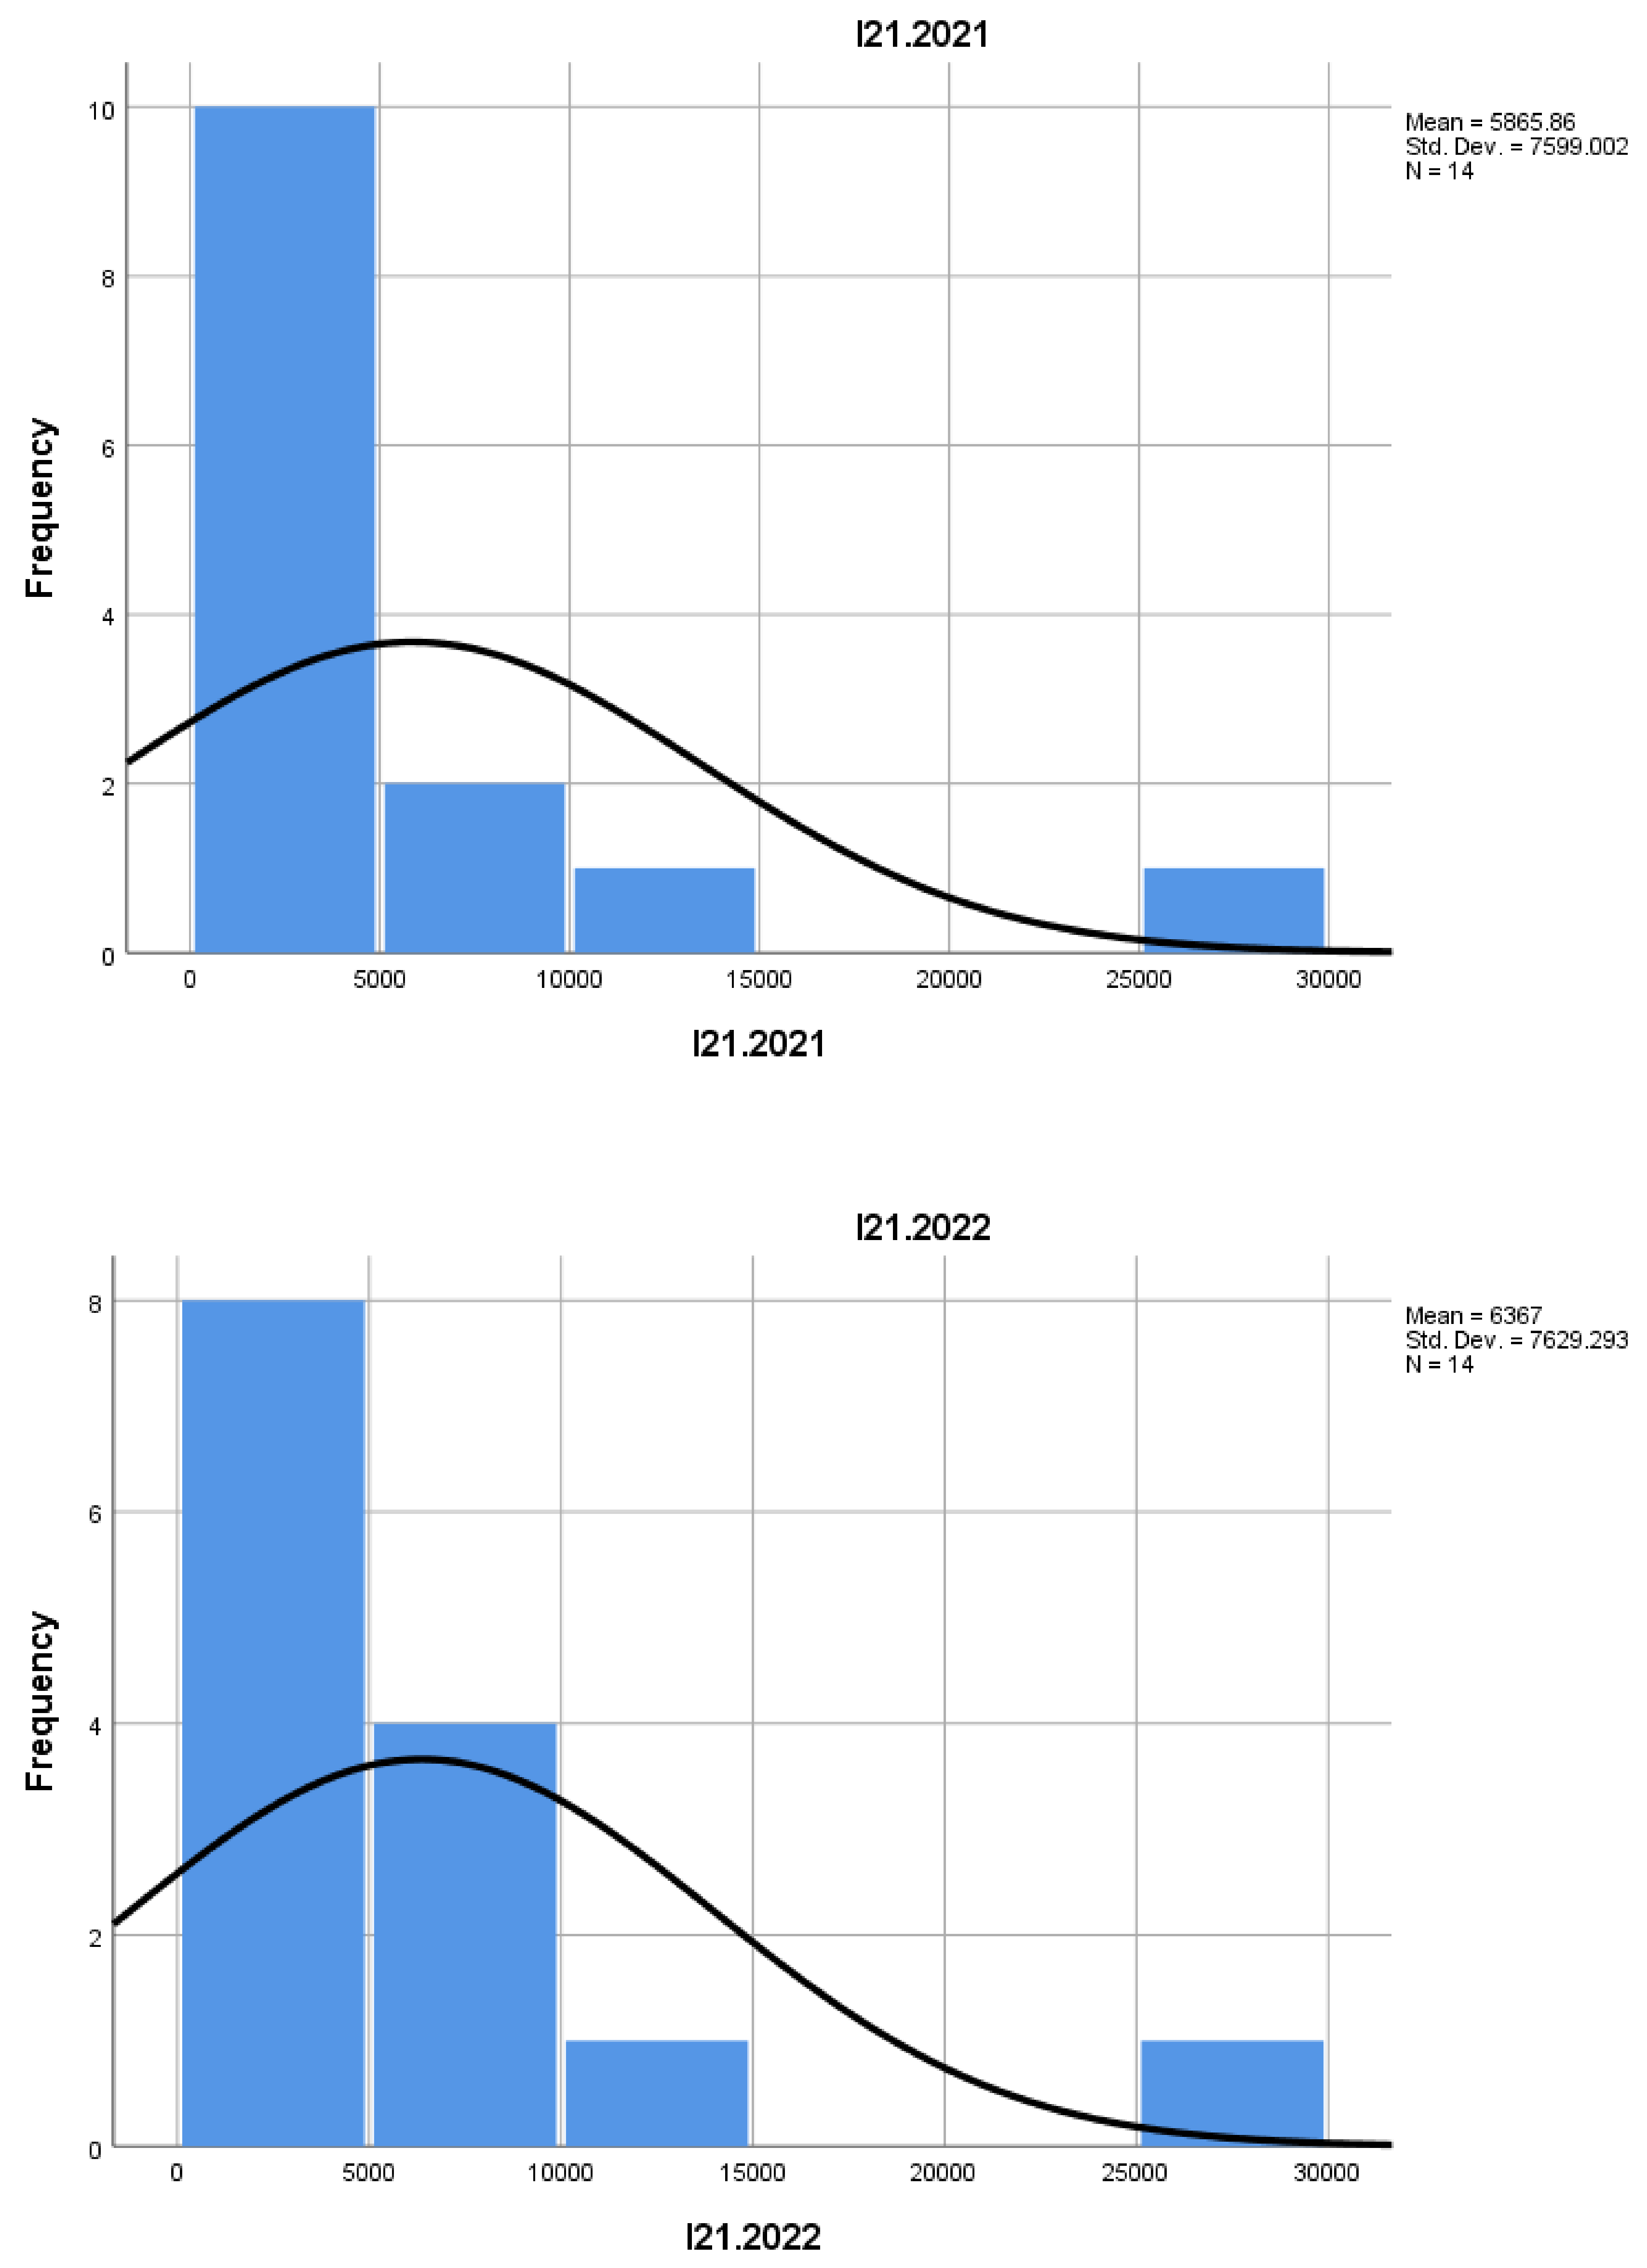
Indicator I21 measures the number of employees in enterprises that have survived for at least 3 years, but specifically in their year of establishment. It can be used to evaluate the initial capacity of these businesses to attract a workforce.
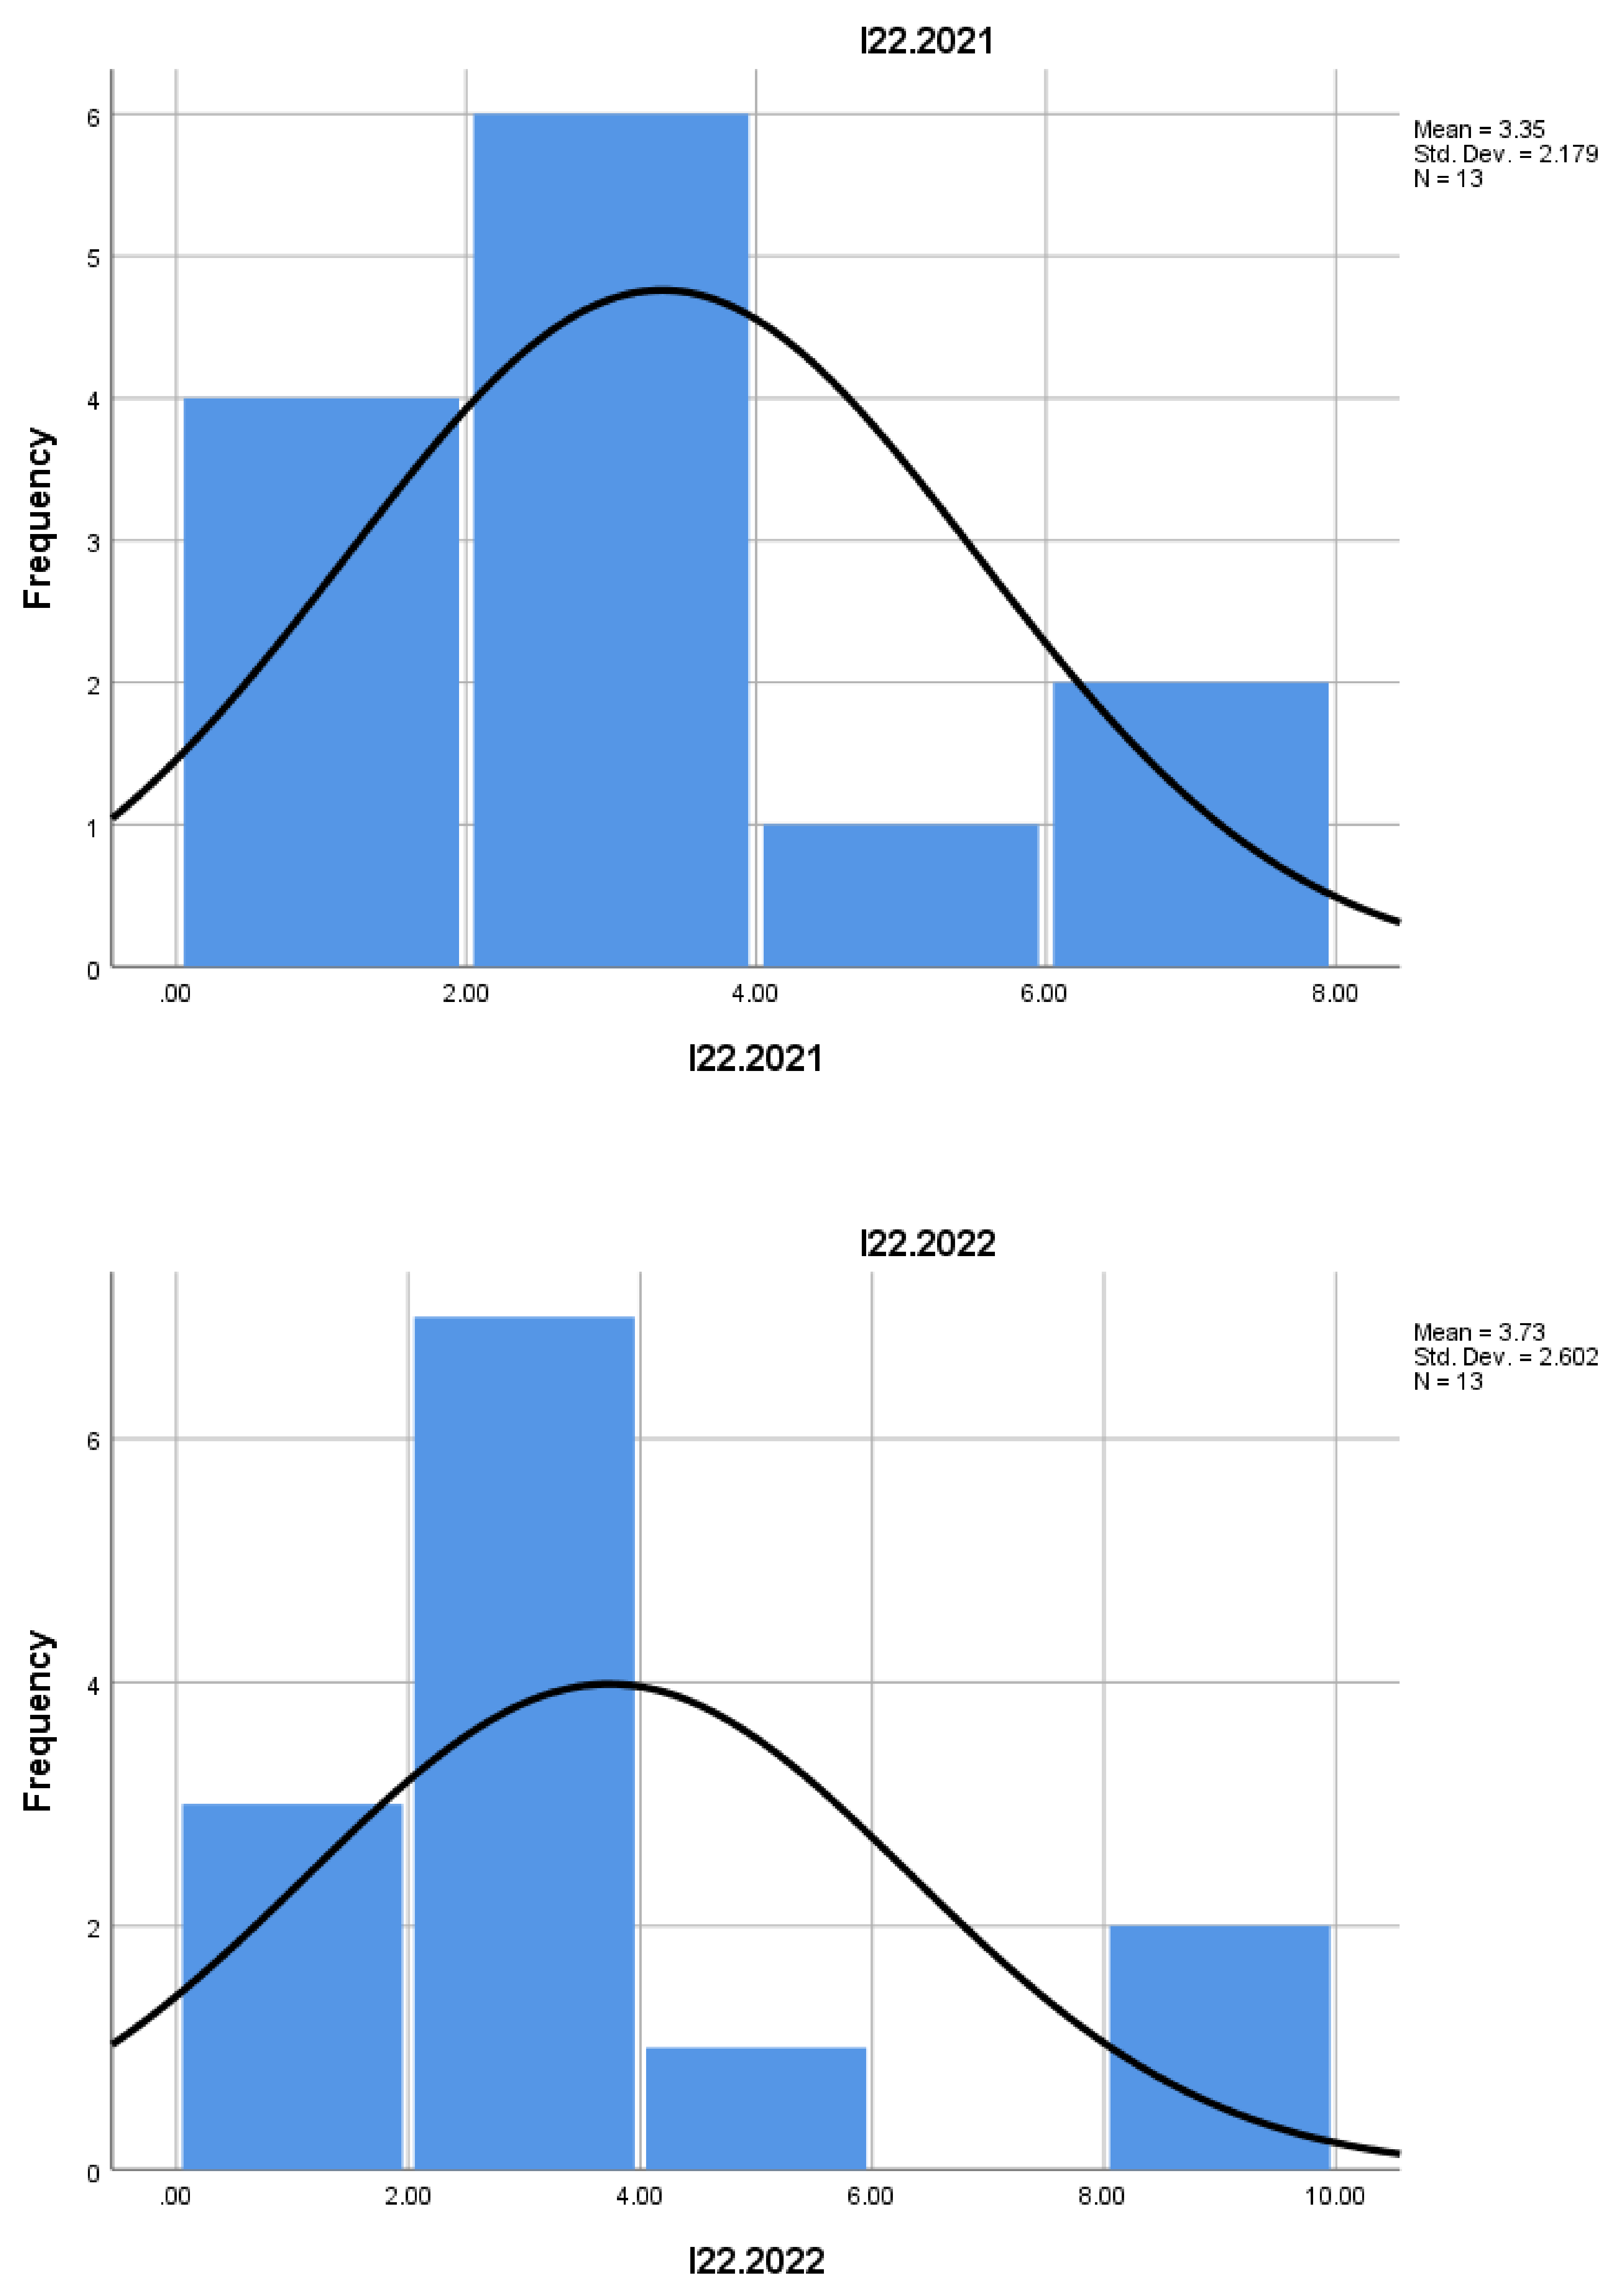
Indicator I22 reflects the share of employees in businesses that have closed, compared to the total number of active employees. A small value suggests a limited impact of business closures on the labor market in mountain construction.
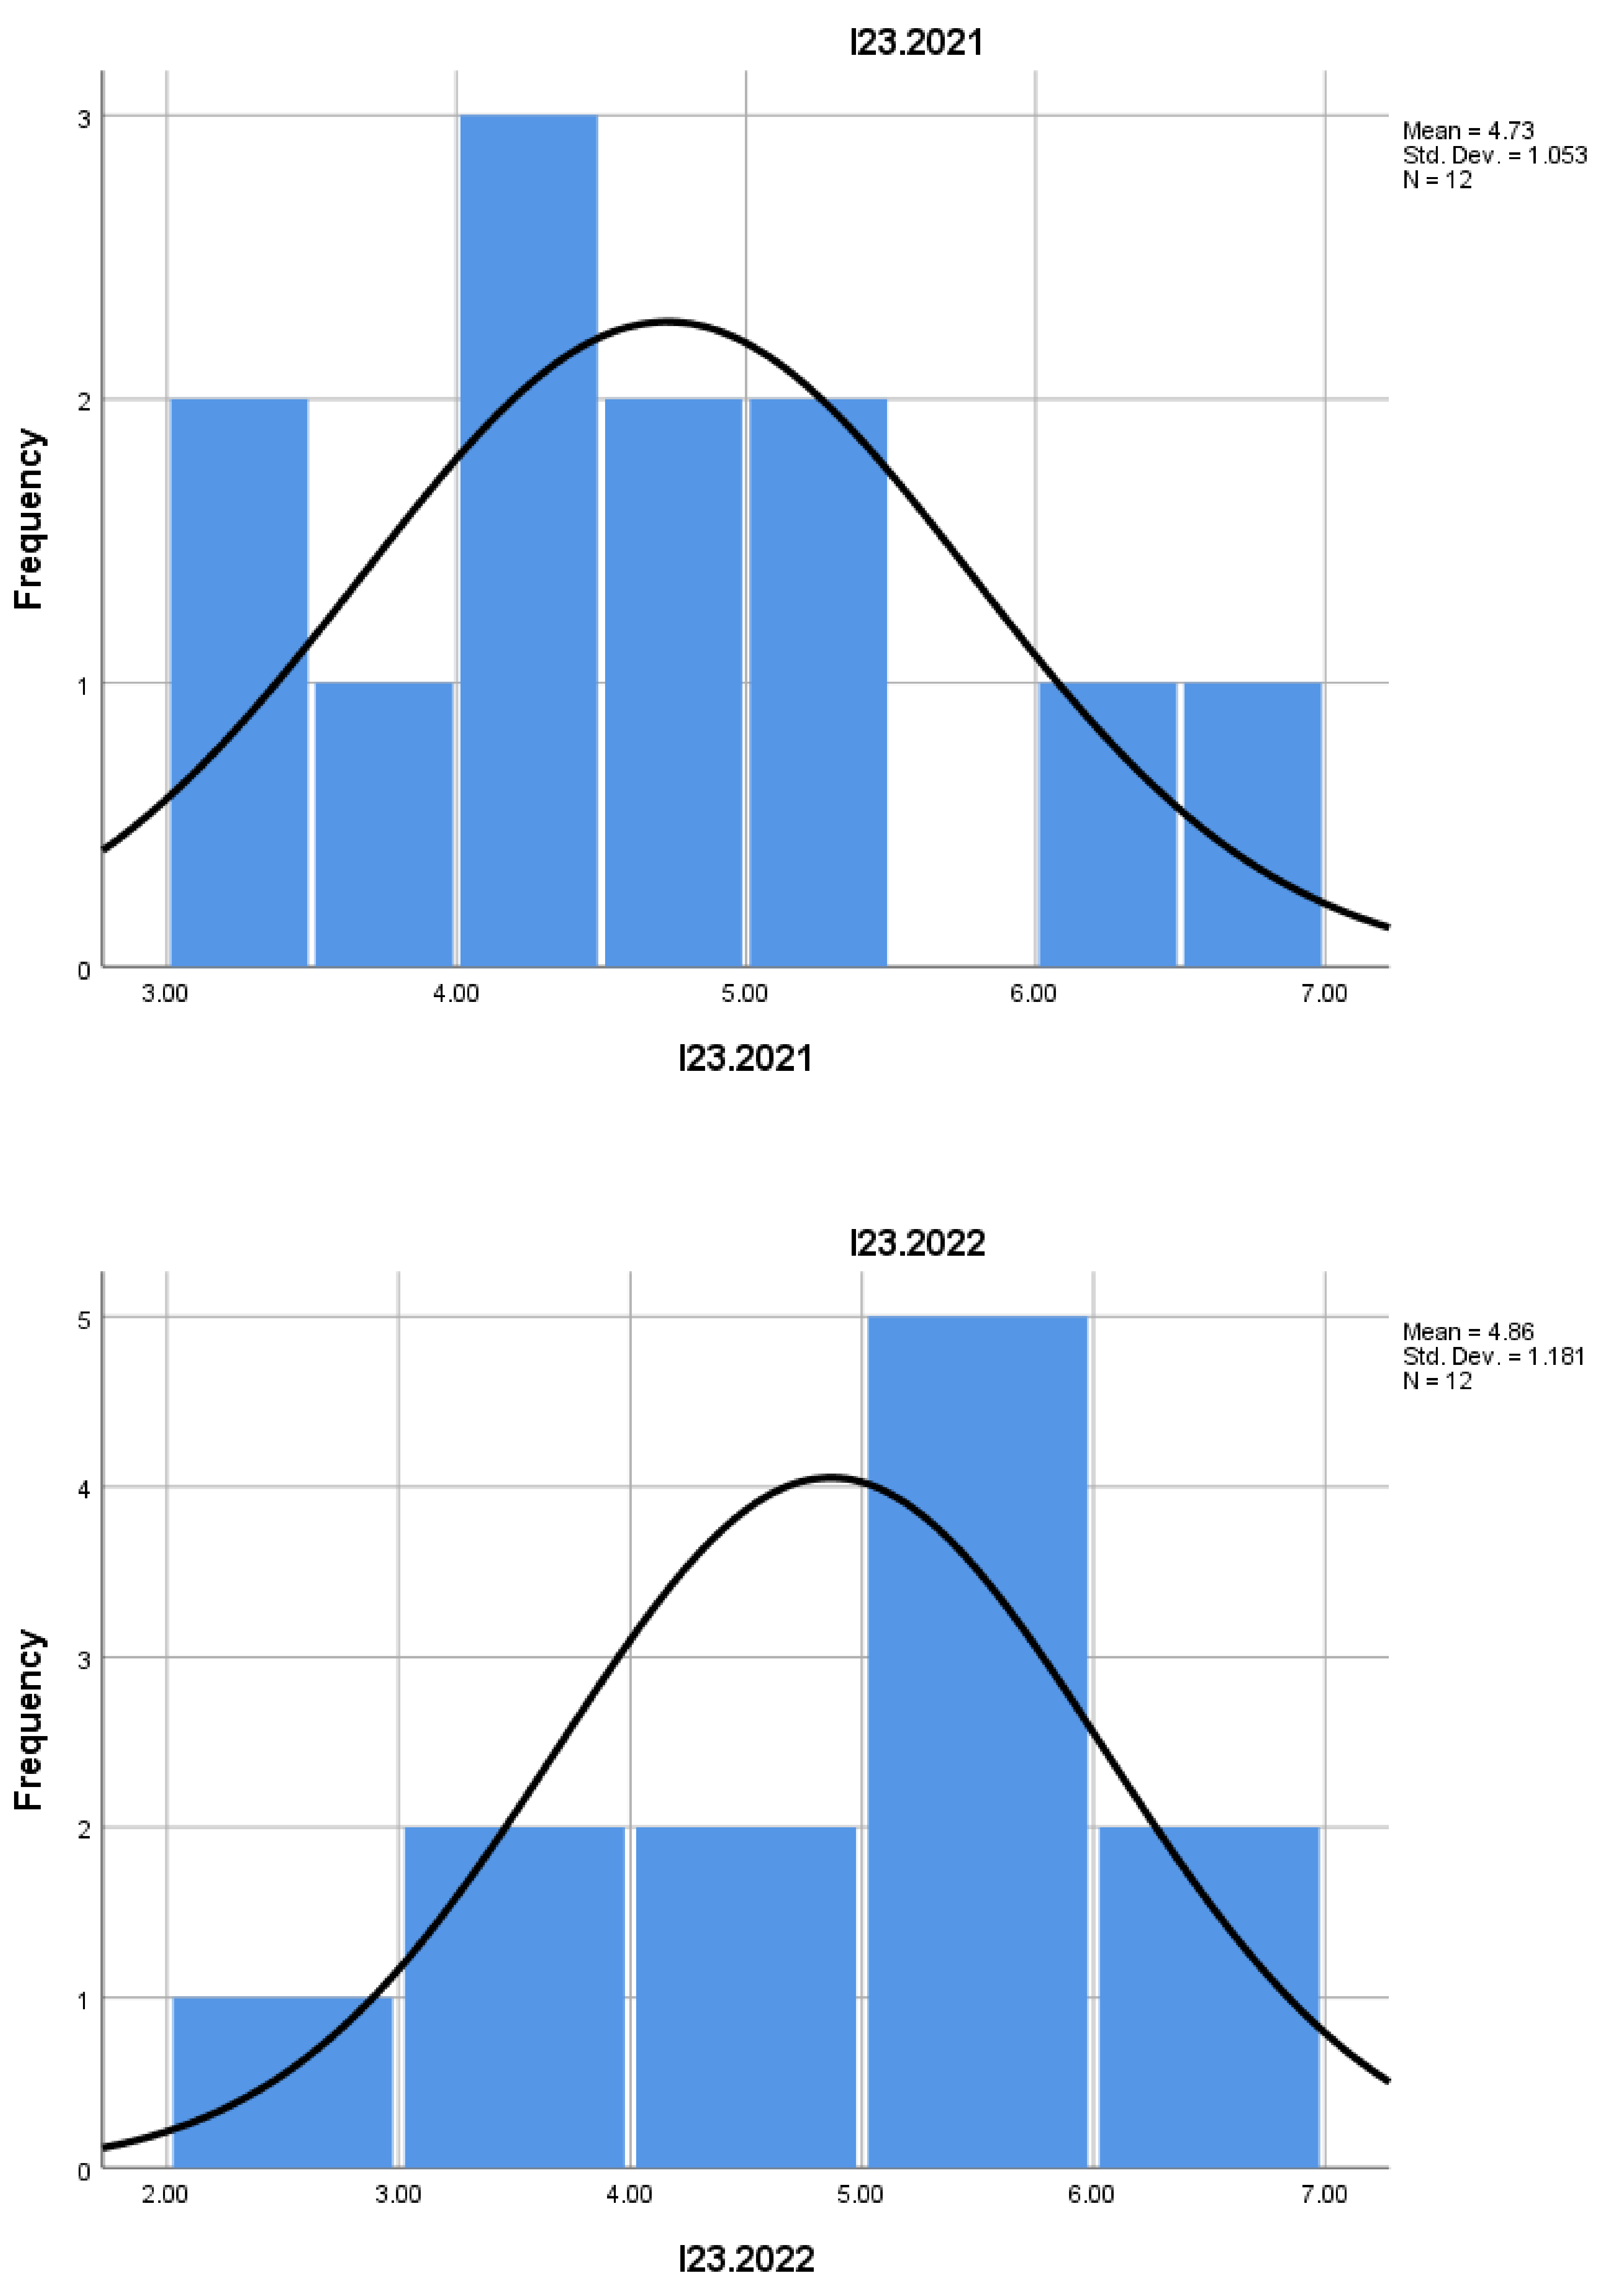
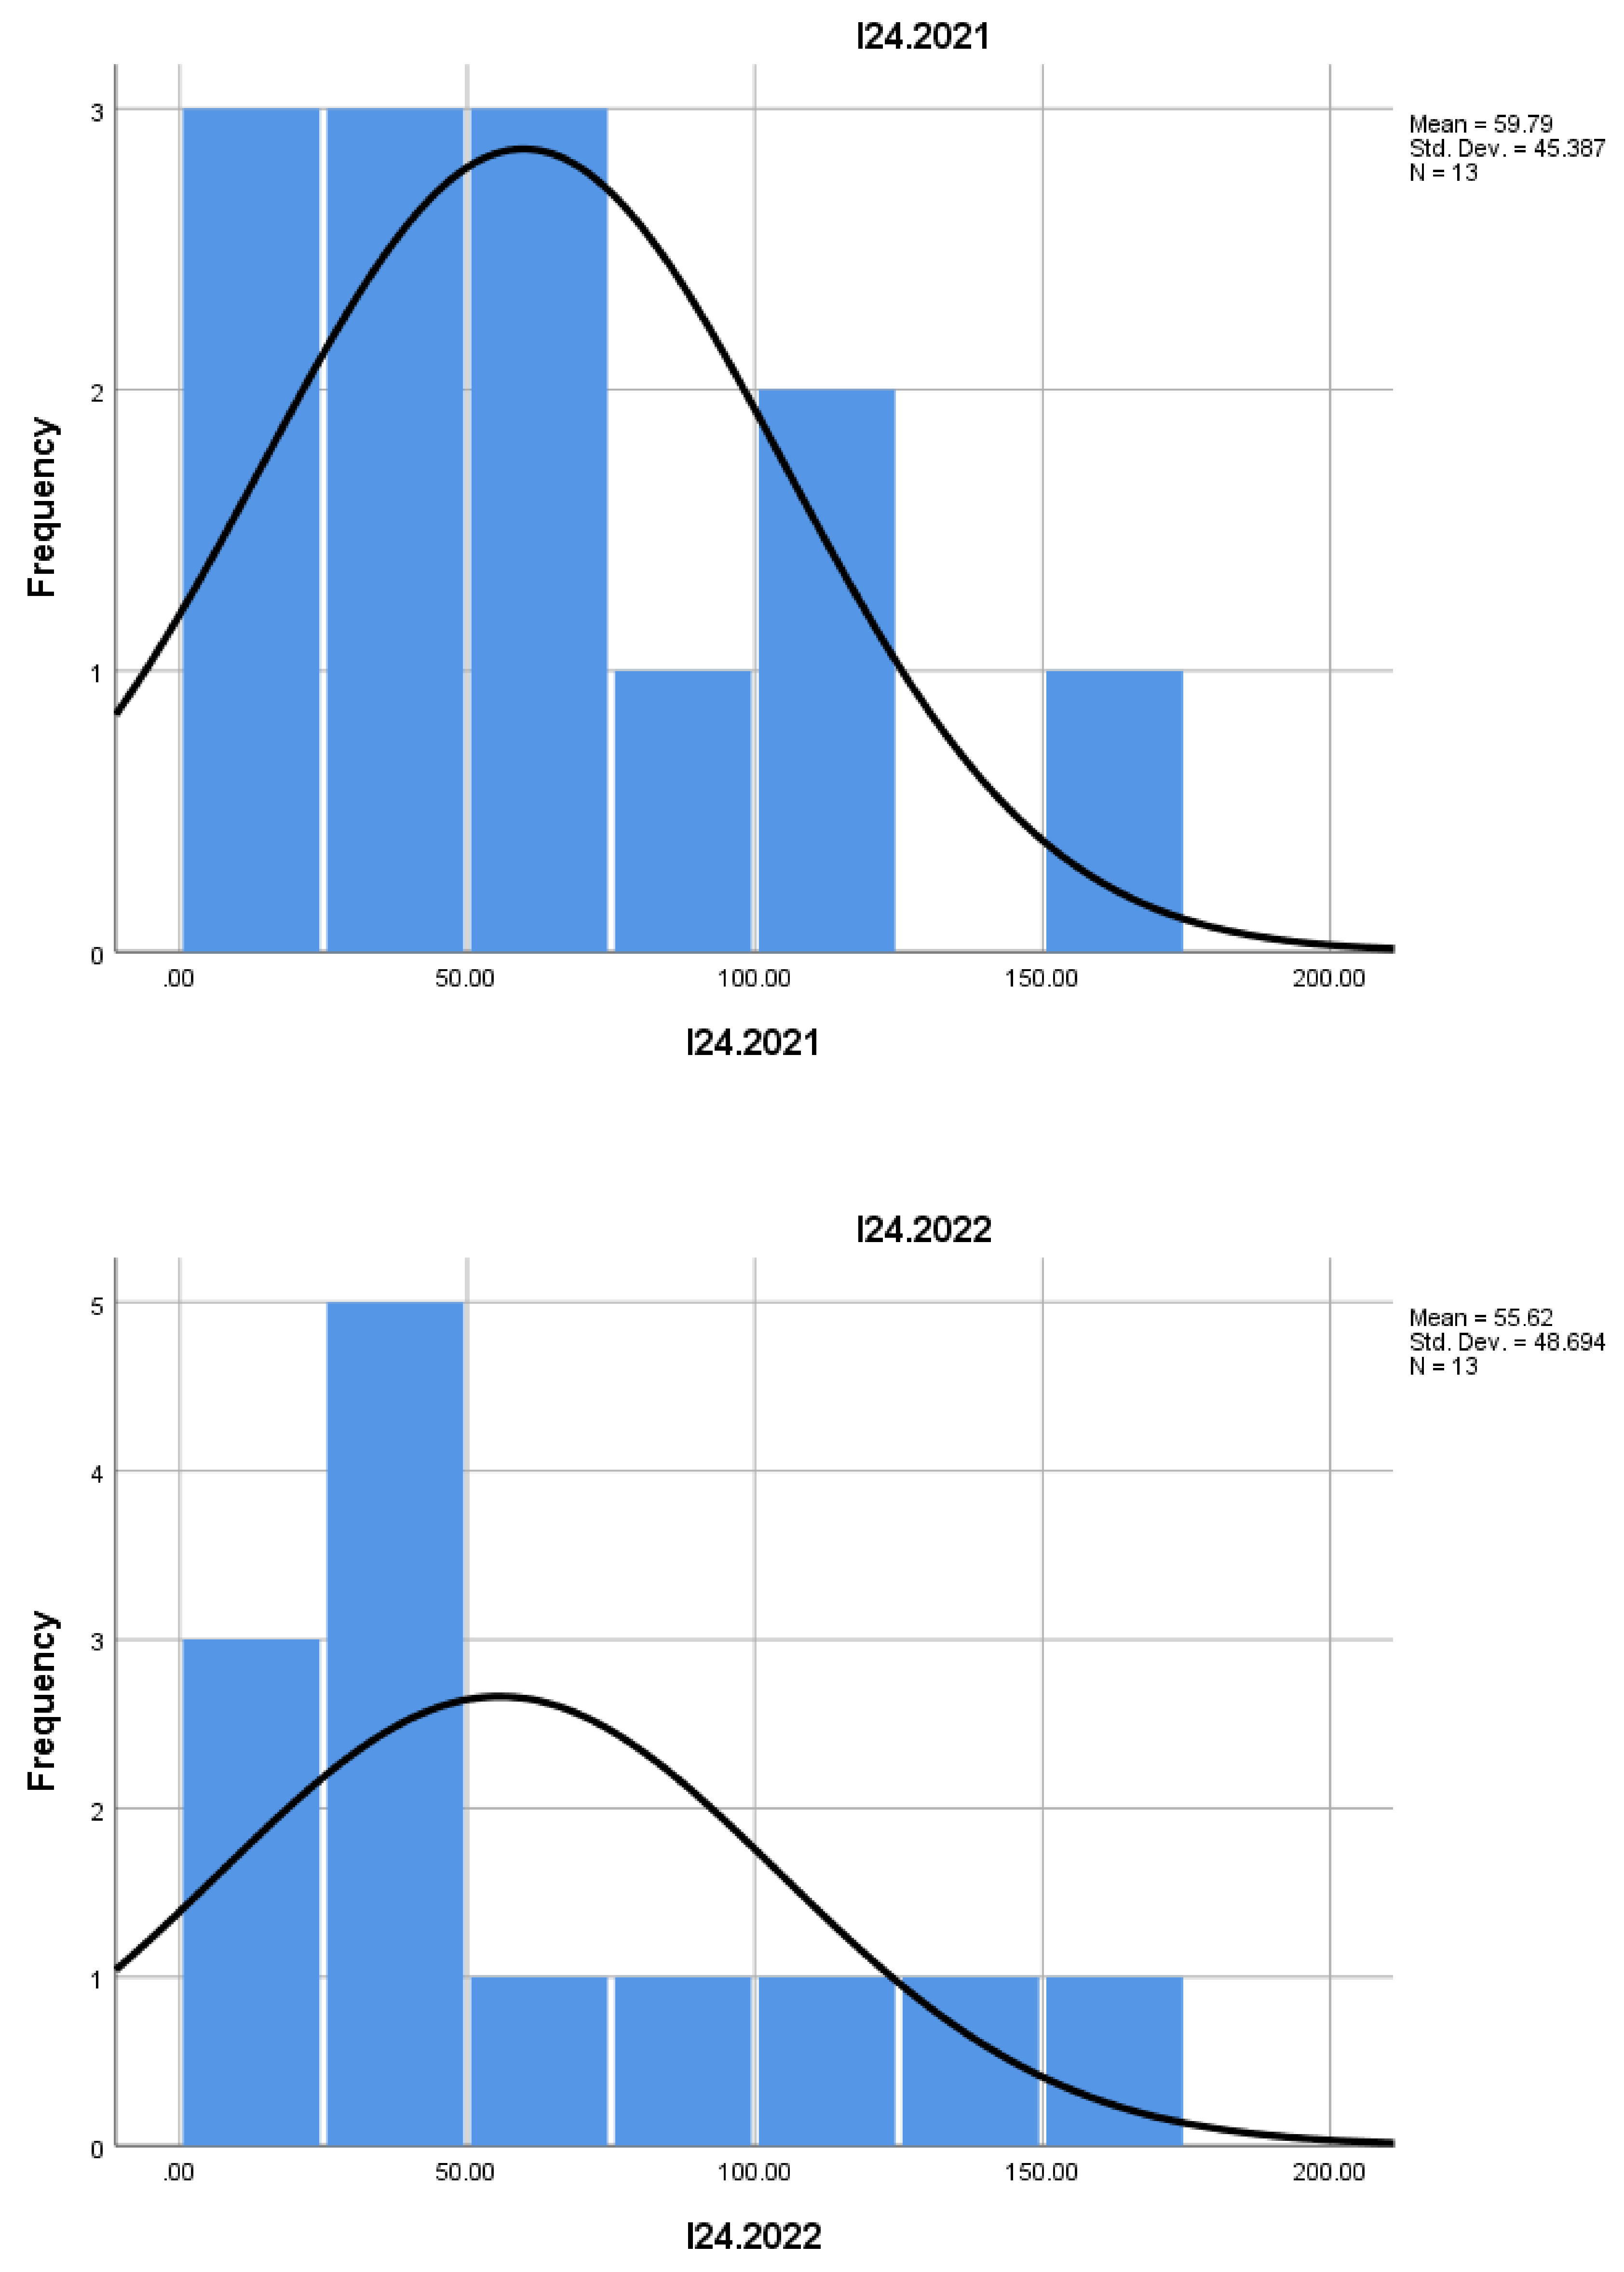
Indicator I23 shows the share of employees in 3-year-old (surviving) enterprises, indicating workforce stabilization within these businesses. In this sector, this indicator is a sign of medium-term business health.
I24 reflects the evolution of the number of employees in enterprises that have survived 3 years. A positive rate suggests that these businesses are capable of increasing their workforce as they stabilize and become more profitable.
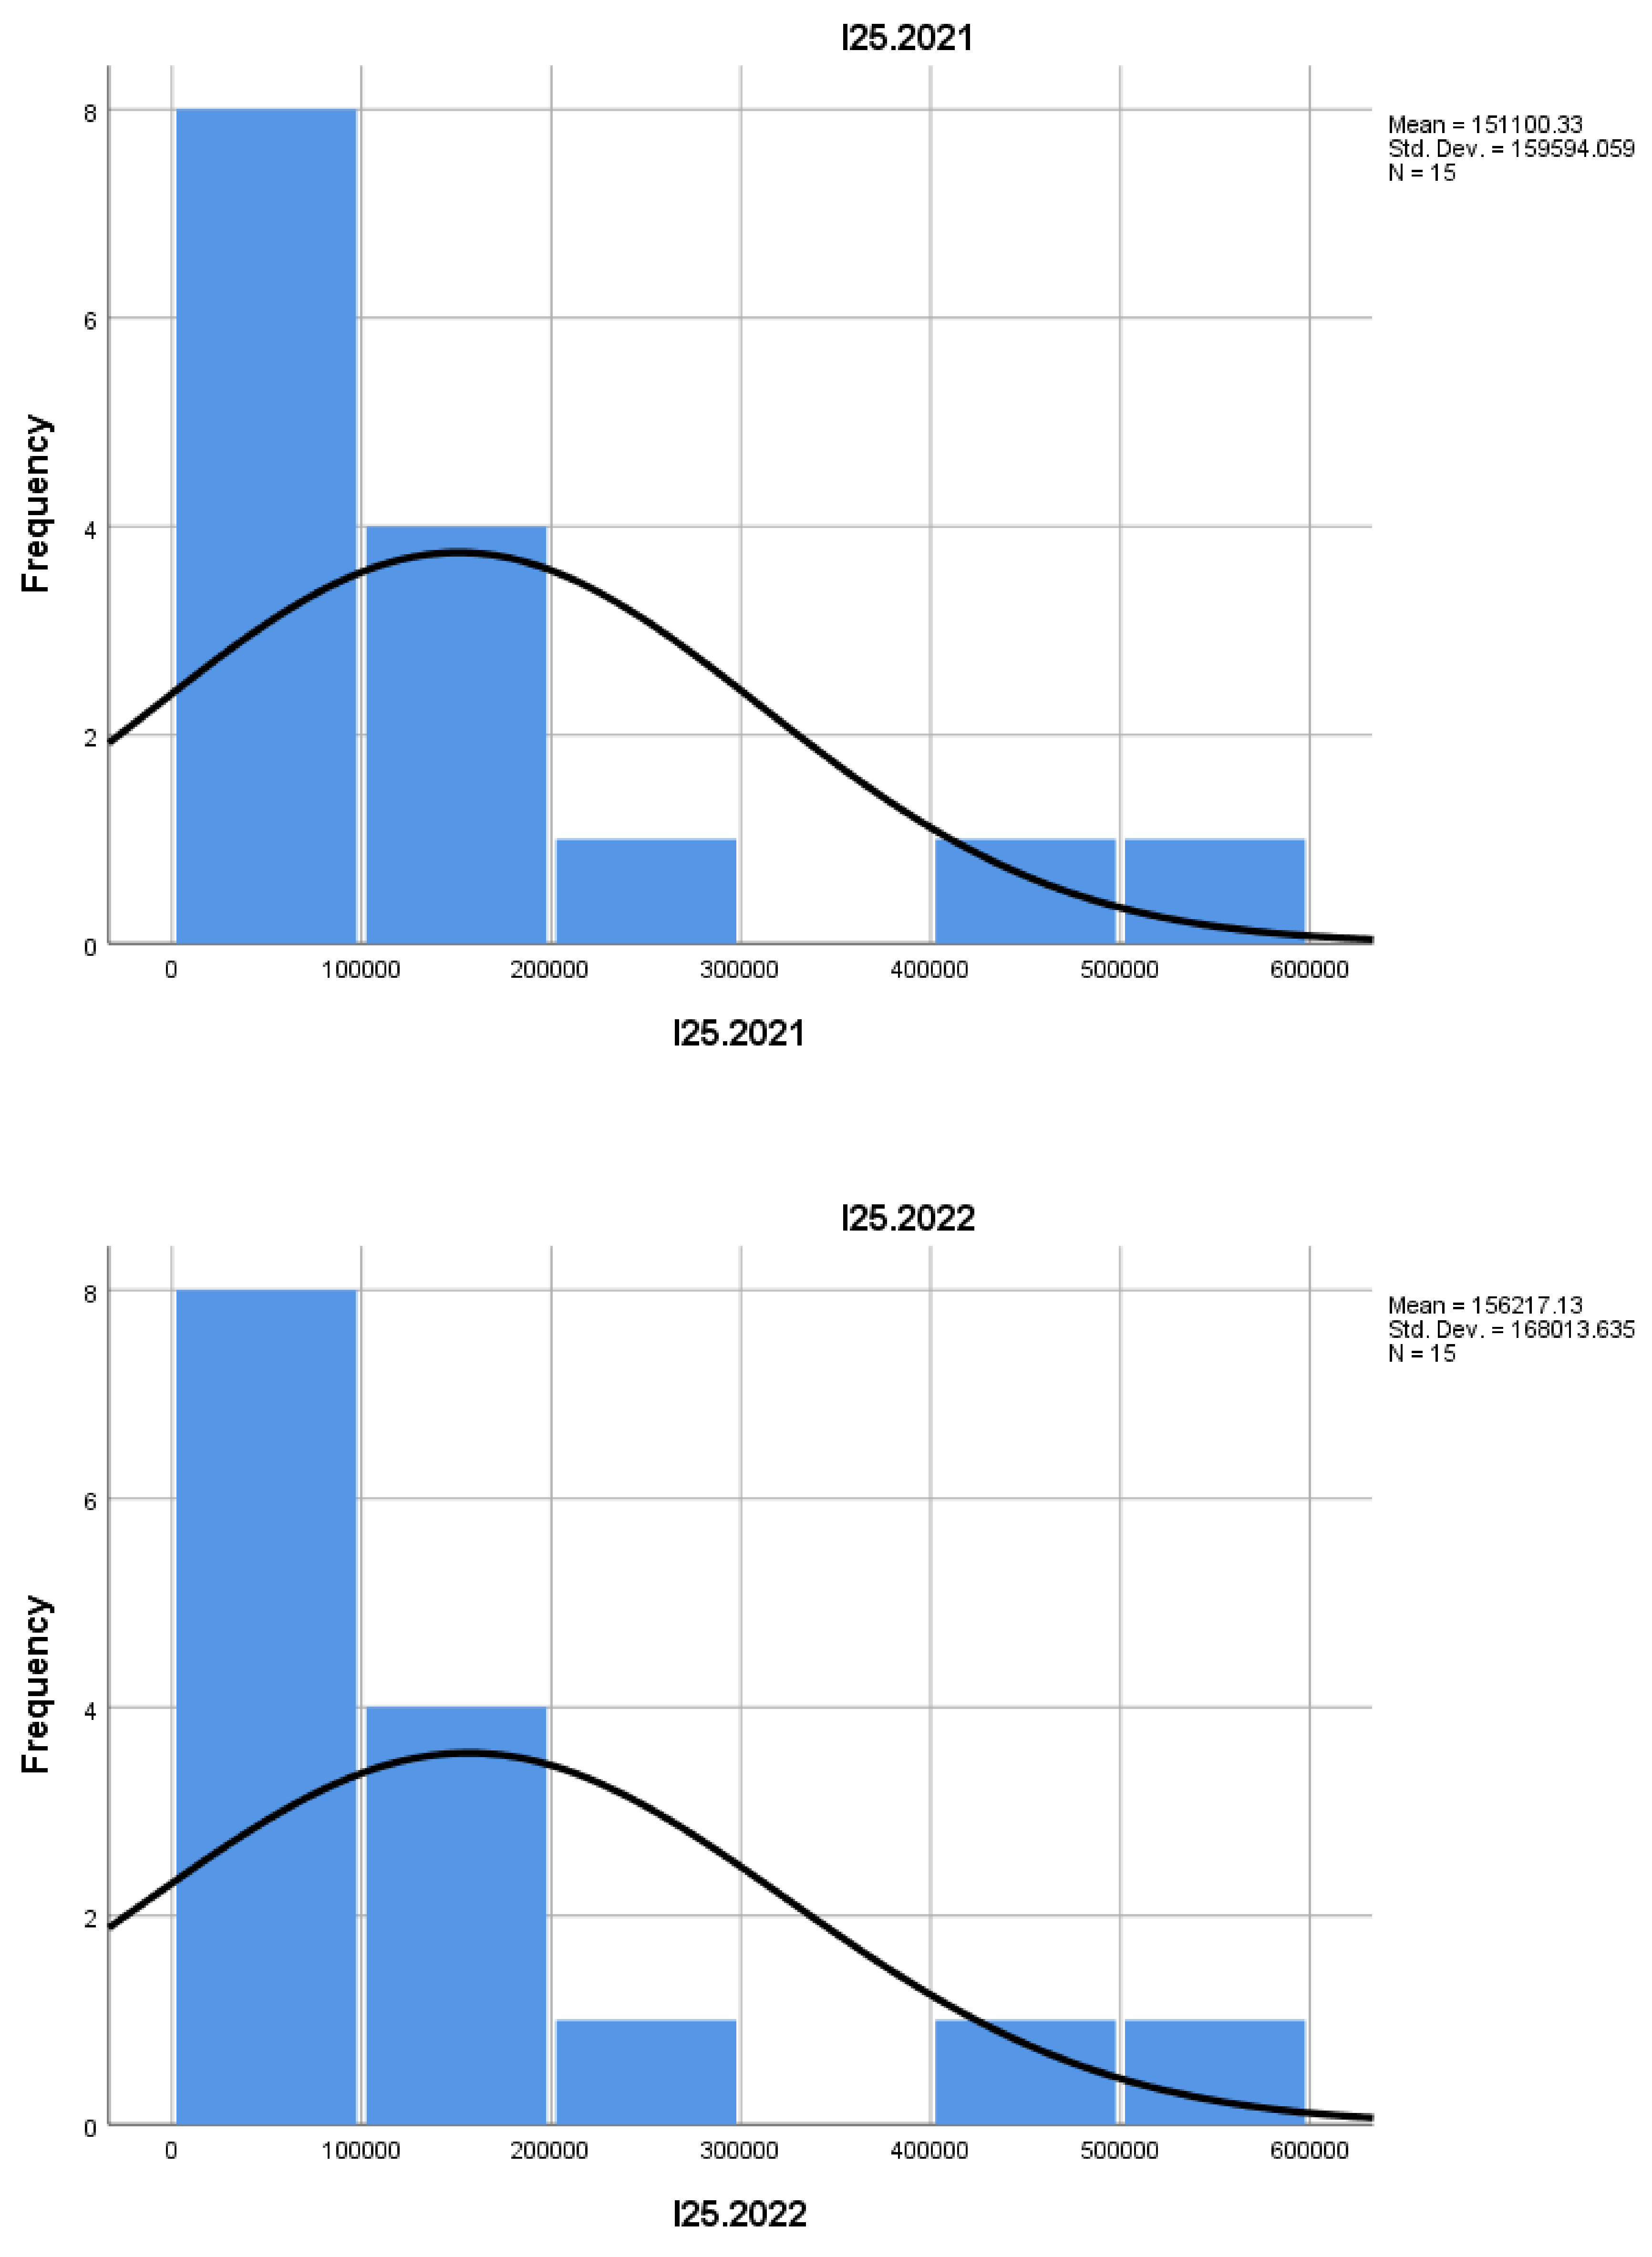
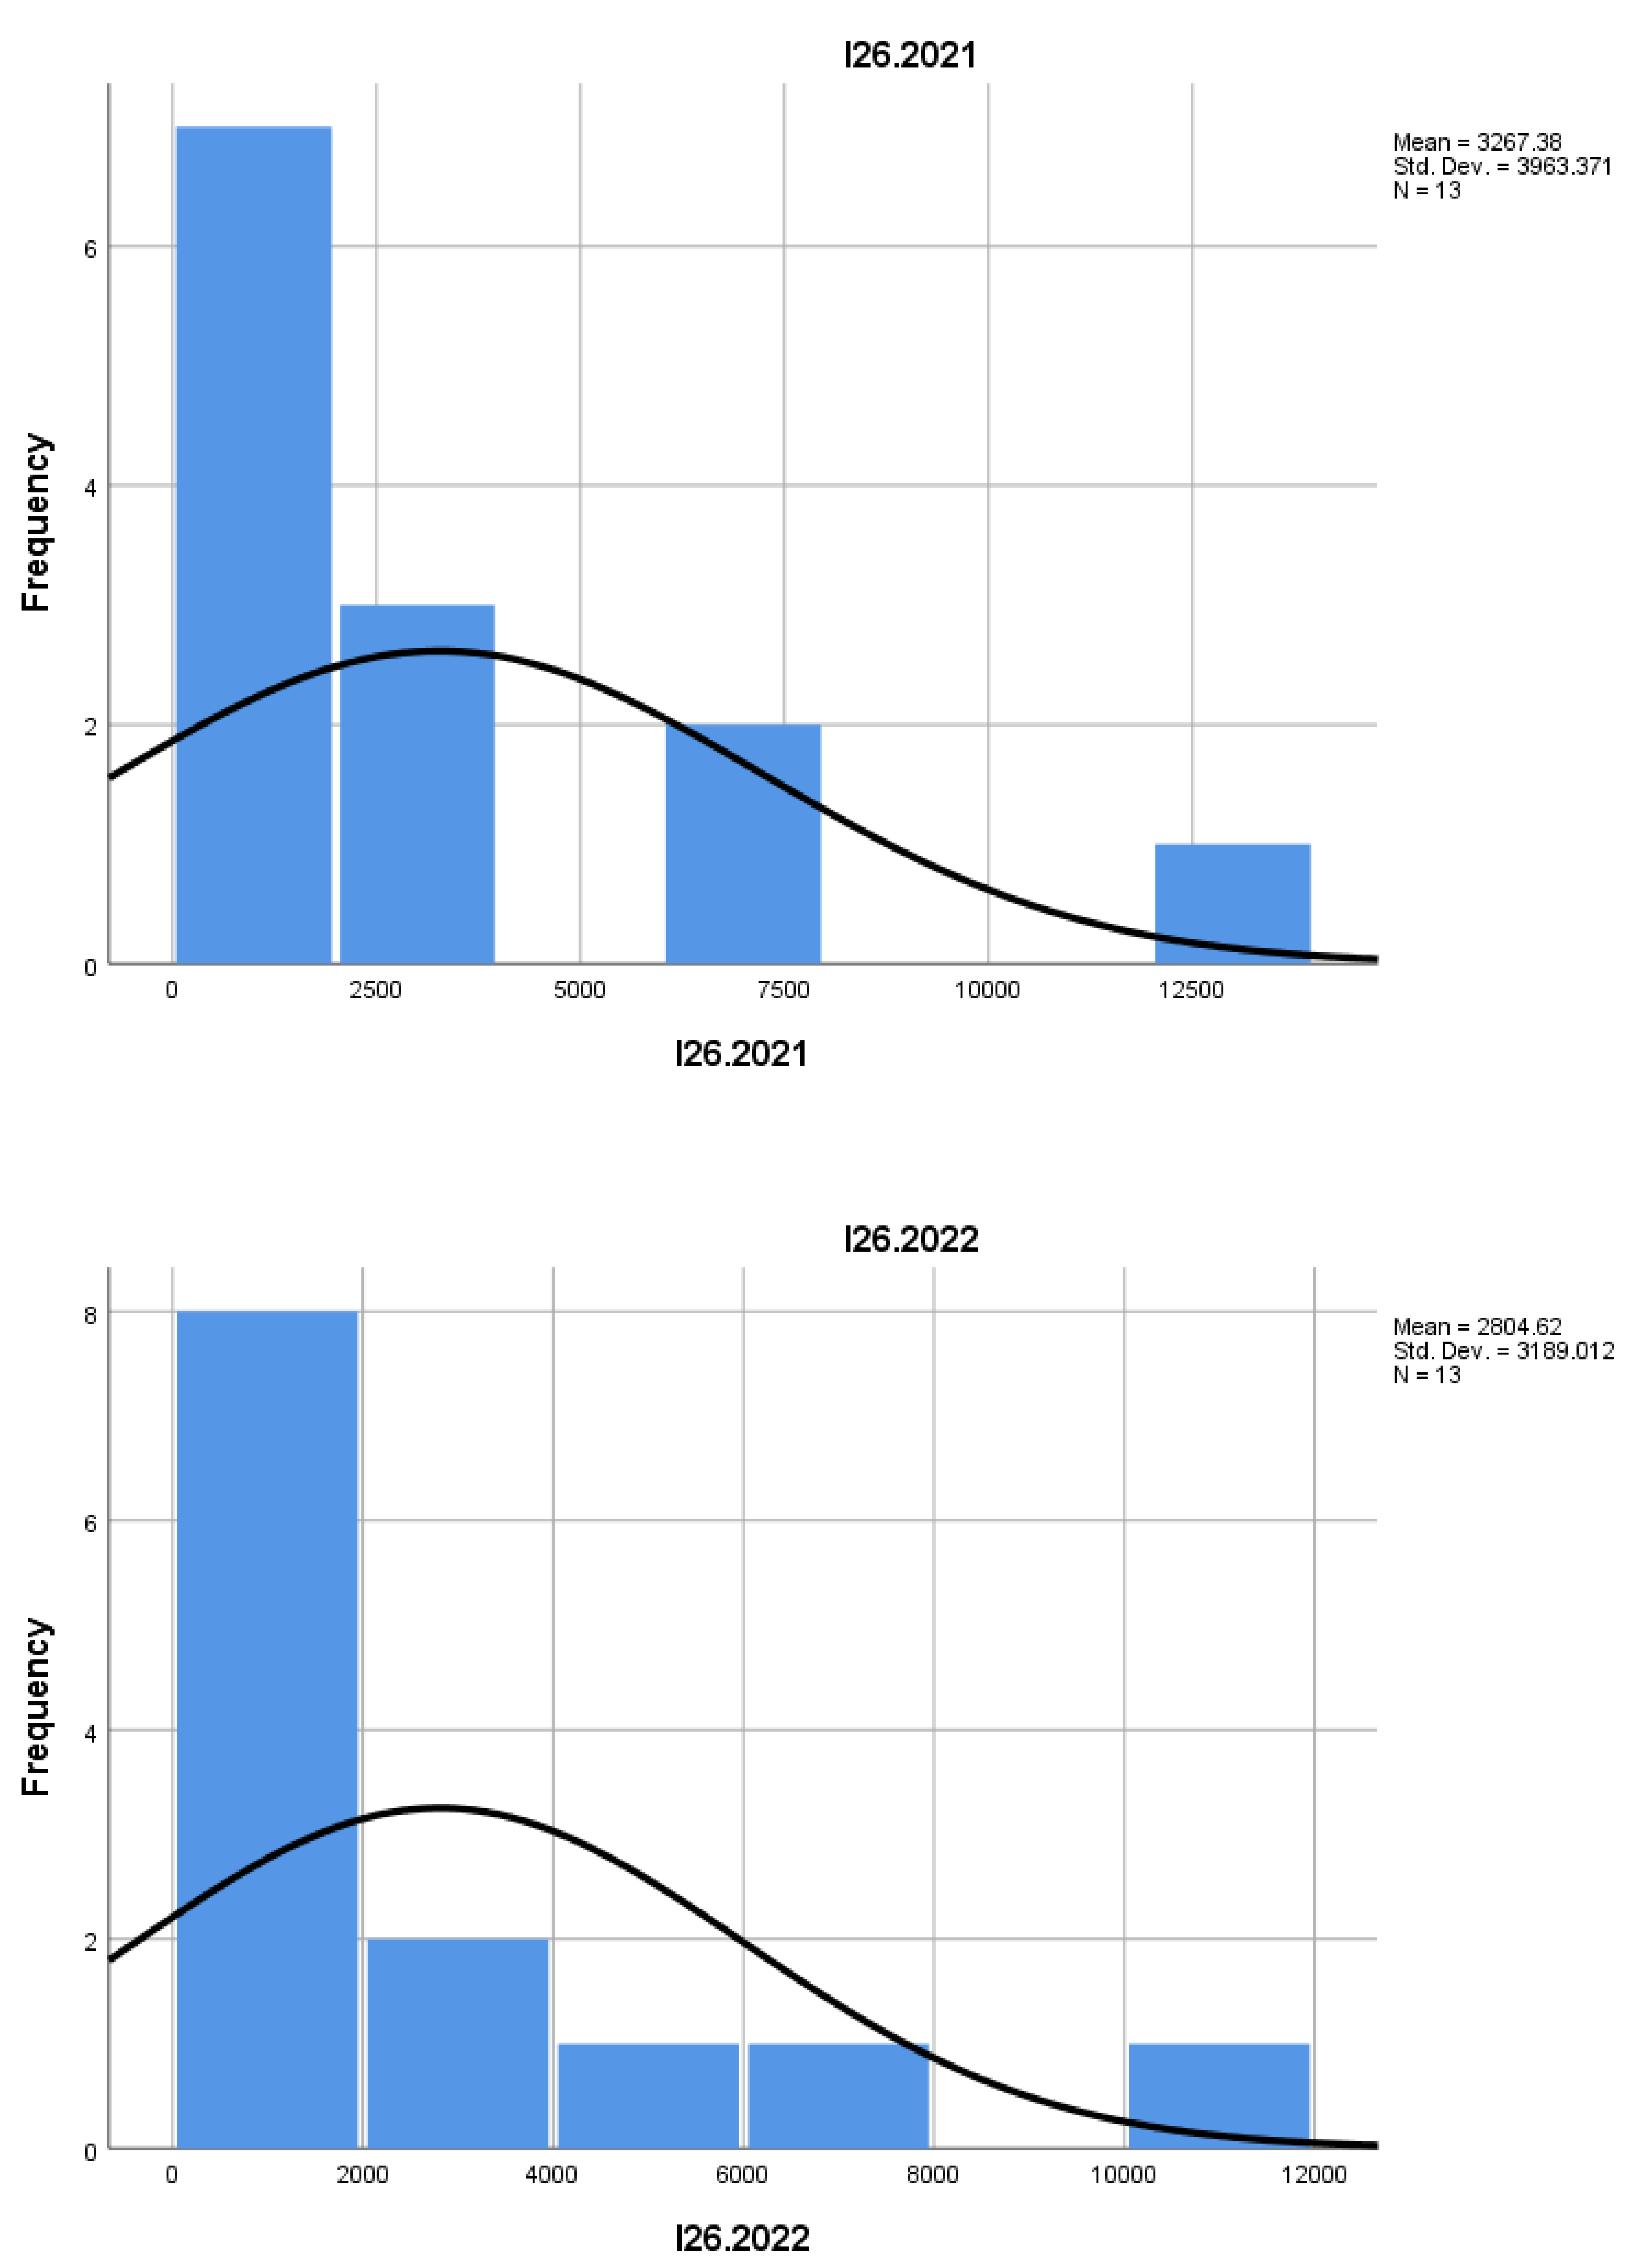
I25 is a general indicator of the labor force in the mountain construction sector. Its trends are fairly constant, suggesting a stable labor market in the sector.
Indicator I26 reflects the number of employees in newly born enterprises and suggests that these businesses, although small, contribute significantly to employment in the sector.
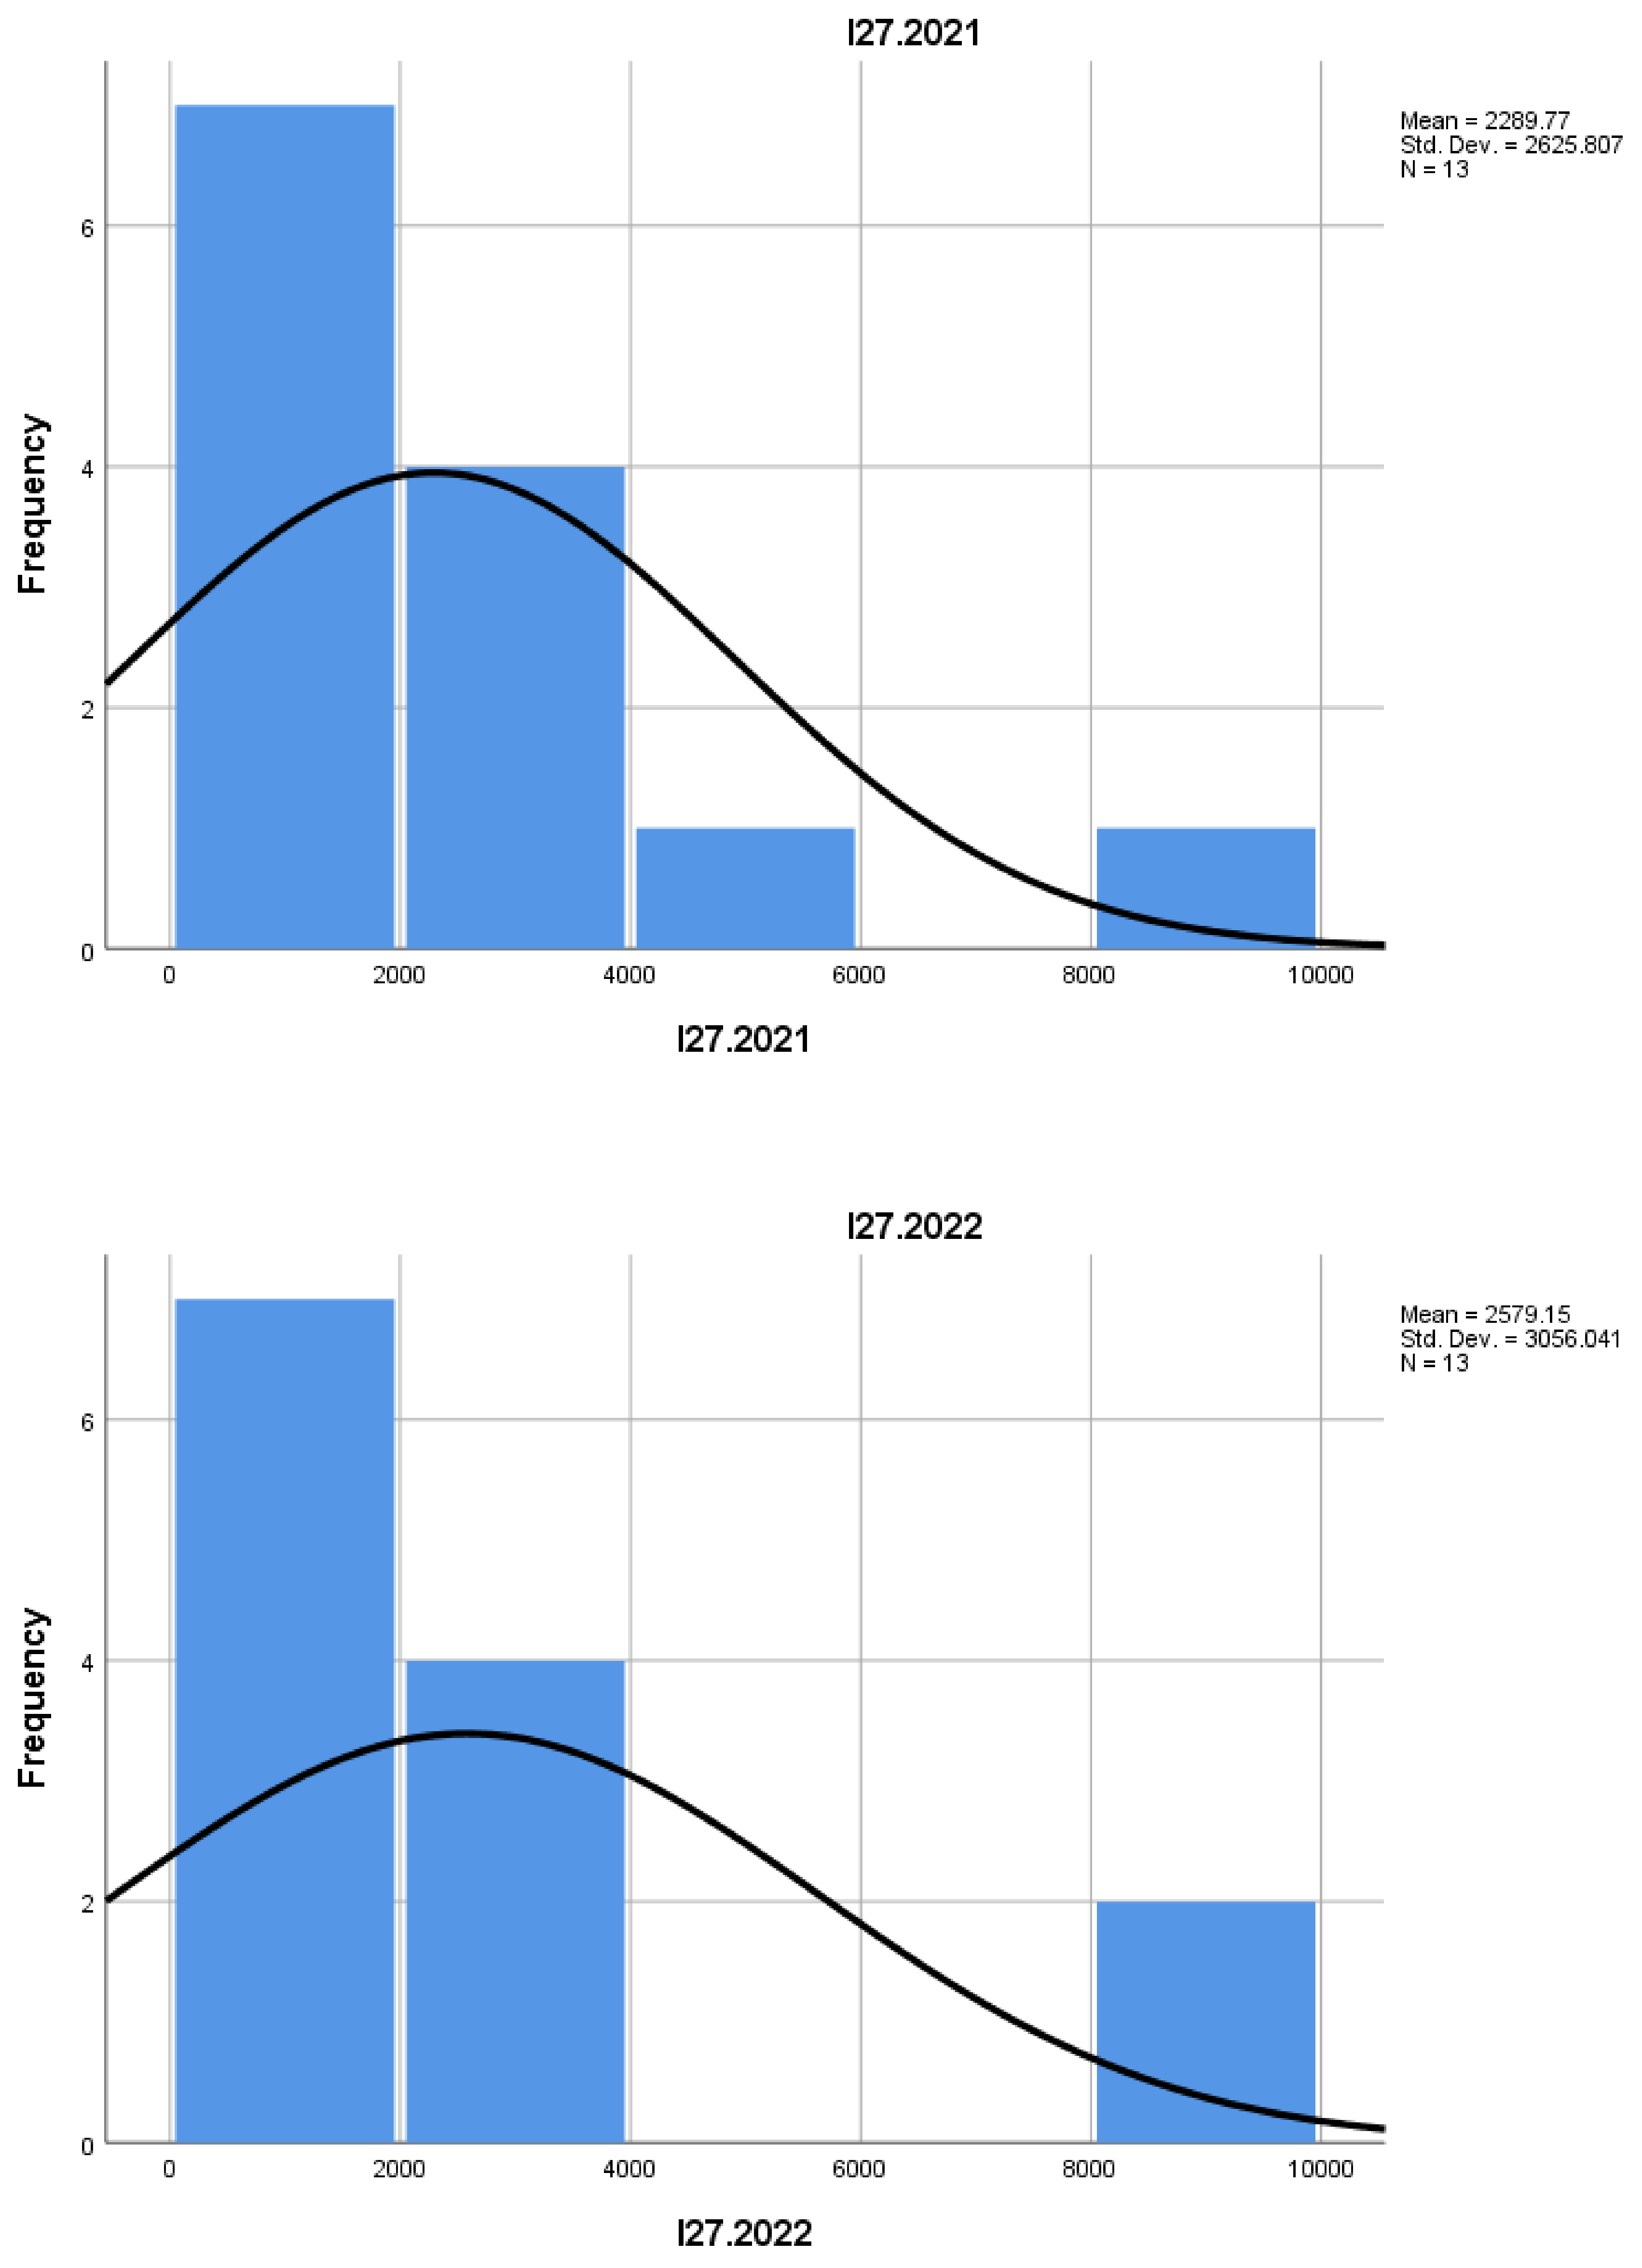
I27 measures job losses caused by business closures. It is lower compared to other indicators, suggesting that although there is an impact, it is not very severe.
Indicator I28 shows the share of paid employees in newly established enterprises, suggesting their level of formalization. A higher indicator may signal a tendency to comply with wage regulations in this sector.
The analysis of the indicators shows that the mountain construction sector is stable and relatively sustainable in the long term. Growth is moderate, and most enterprises are small and not focused on rapid expansion. At the same time, medium-term business survival trends are favorable, and the employment growth rate remains constant. Additionally, the sector appears to be characterized by a balance between newly established and closing enterprises, suggesting a healthy and competitive market.
By analyzing the indicators in the mountain entrepreneurship sector in construction, a general trend of stability can be observed, with moderate growth in the number of enterprises and a relatively constant survival rate. Furthermore, the size of new and surviving businesses suggests that most are small but tend to stabilize in the medium term. Growth and mortality indicators are relatively balanced, and the impact on employment remains steady, which may indicate a robust and sustainable mountain economy in the long run.
Conclusion
This research highlights several key aspects of the mountain entrepreneurship sector in construction across Europe. The sector shows moderate growth, with a slight increase in the number of businesses and employees between 2021 and 2022. The expansion is steady, reflecting a balanced demand for construction services in mountain areas. Growth is largely driven by small enterprises, which focus on small- to medium-scale projects.
The three-year business survival rate remains relatively constant, indicating a level of stability and sustainability in the sector. New enterprises, though small, demonstrate potential for longevity and adaptability to the specific economic conditions of mountain regions.
The business turnover rate, reflected by the rate of births and closures, is low, suggesting that the sector is relatively stable. Although the number of business closures in 2022 was slightly higher than in 2021, this difference does not significantly affect the overall stability of the sector.
Employment data remains steady, with a stable number of jobs created, especially within enterprises that have survived for at least three years. However, the share of newly born enterprises in relation to the total employee population is relatively small, indicating that the sector does not rely heavily on new businesses for job creation.
The sector does not have a high proportion of high-growth businesses. The number of rapidly expanding enterprises is low, which aligns with the sector’s emphasis on stable and sustainable operations rather than rapid expansion.
The findings suggest the need for policies that support the stability and gradual growth of small businesses in the mountain construction sector. Developing strategies aimed at promoting business sustainability, encouraging innovation, and supporting job creation in mountain regions would be beneficial for ensuring the long-term health of the sector.
In conclusion, the mountain entrepreneurship sector in construction in Europe is characterized by a stable and sustainable business environment, with a predominance of small enterprises. The sector demonstrates resilience in the face of economic and environmental challenges and represents a valuable component of regional economies. Future research could explore the potential of technological innovations and sustainable practices to further support the development of this sector.

Table 1.
Analysis of Statistical Indicators of the Mountain Entrepreneurship Sector in Construction in Europe.
Table 1.
Analysis of Statistical Indicators of the Mountain Entrepreneurship Sector in Construction in Europe.
| I1.2021 | I1.2022 | I2.2021 | I2.2022 | I3.2021 | I3.2022 | I4.2021 | I4.2022 | I5.2021 | I5.2022 | I6.2021 | I6.2022 | I7.2021 | I7.2022 | |||||||||||||||||||||||||||||||||||||||
| N Valid | 15 | 15 | 15 | 15 | 13 | 13 | 15 | 15 | 15 | 15 | 13 | 13 | 15 | 15 | ||||||||||||||||||||||||||||||||||||||
| N Missing | 0 | 0 | 0 | 0 | 2 | 2 | 0 | 0 | 0 | 0 | 2 | 2 | 0 | 0 | ||||||||||||||||||||||||||||||||||||||
| Mean | 69546.53 | 71815.40 | 7249.93 | 7269.67 | 1.2831 | 1.1931 | 1.00 | 1.00 | 5329.20 | 5916.73 | 42.2323 | 41.0885 | 4175.67 | 4457.07 | ||||||||||||||||||||||||||||||||||||||
| Std. Error of Mean | 22014.006 | 22652.768 | 2208.512 | 2164.605 | 0.10035 | 0.08352 | 0.000 | 0.000 | 1690.568 | 1870.189 | 11.58892 | 11.47842 | 1299.101 | 1351.195 | ||||||||||||||||||||||||||||||||||||||
| Median | 34462.00 | 34638.00 | 3787.00 | 3924.00 | 1.1800 | 1.1800 | 1.00 | 1.00 | 2276.00 | 2397.00 | 27.0000 | 27.0000 | 2387.00 | 2436.00 | ||||||||||||||||||||||||||||||||||||||
| Mode | 2506a | 2230a | 175a | 157a | 1.03 | .69a | 1 | 1 | 90a | 84a | 1.41a | 1.27a | 134a | 113a | ||||||||||||||||||||||||||||||||||||||
| Std. Deviation | 85259.879 | 87733.794 | 8553.530 | 8383.479 | 0.36181 | 0.30115 | 0.000 | 0.000 | 6547.541 | 7243.211 | 41.78444 | 41.38602 | 5031.398 | 5233.155 | ||||||||||||||||||||||||||||||||||||||
| Skewness | 1.802 | 1.770 | 1.423 | 1.368 | 0.900 | 0.043 | 1.424 | 1.442 | 1.423 | 1.409 | 1.849 | 1.660 | ||||||||||||||||||||||||||||||||||||||||
| Std. Error of Skewness | 0.580 | 0.580 | 0.580 | 0.580 | 0.616 | 0.616 | 0.580 | 0.580 | 0.580 | 0.580 | 0.616 | 0.616 | 0.580 | 0.580 | ||||||||||||||||||||||||||||||||||||||
| Kurtosis | 2.188 | 2.049 | 0.598 | 0.449 | 0.273 | -0.433 | 0.696 | 0.933 | 2.014 | 1.837 | 3.215 | 2.110 | ||||||||||||||||||||||||||||||||||||||||
| Std. Error of Kurtosis | 1.121 | 1.121 | 1.121 | 1.121 | 1.191 | 1.191 | 1.121 | 1.121 | 1.121 | 1.121 | 1.191 | 1.191 | 1.121 | 1.121 | ||||||||||||||||||||||||||||||||||||||
| Range | 265461 | 271606 | 25673 | 25387 | 1.28 | 1.04 | 0 | 0 | 19593 | 22679 | 144.59 | 141.55 | 17929 | 17950 | ||||||||||||||||||||||||||||||||||||||
| Minimum | 2506 | 2230 | 175 | 157 | 0.79 | 0.69 | 1 | 1 | 90 | 84 | 1.41 | 1.27 | 134 | 113 | ||||||||||||||||||||||||||||||||||||||
| Maximum | 267967 | 273836 | 25848 | 25544 | 2.07 | 1.73 | 1 | 1 | 19683 | 22763 | 146.00 | 142.82 | 18063 | 18063 | ||||||||||||||||||||||||||||||||||||||
| Sum | 1043198 | 1077231 | 108749 | 109045 | 16.68 | 15.51 | 15 | 15 | 79938 | 88751 | 549.02 | 534.15 | 62635 | 66856 | ||||||||||||||||||||||||||||||||||||||
| Percentiles 25 | 17677.00 | 18826.00 | 1705.00 | 1811.00 | 1.0300 | 0.9900 | 1.00 | 1.00 | 836.00 | 835.00 | 7.1500 | 7.2500 | 954.00 | 1027.00 | ||||||||||||||||||||||||||||||||||||||
| Percentiles 50 | 34462.00 | 34638.00 | 3787.00 | 3924.00 | 1.1800 | 1.1800 | 1.00 | 1.00 | 2276.00 | 2397.00 | 27.0000 | 27.0000 | 2387.00 | 2436.00 | ||||||||||||||||||||||||||||||||||||||
| Percentiles 75 | 80614.00 | 87947.00 | 11528.00 | 13308.00 | 1.5800 | 1.4300 | 1.00 | 1.00 | 8130.00 | 11256.00 | 63.9200 | 63.8900 | 6797.00 | 7238.00 | ||||||||||||||||||||||||||||||||||||||
| a. Multiple modes exist. The smallest value is shown | ||||||||||||||||||||||||||||||||||||||||||||||||||||
| I8.2021 | I8.2022 | I10.2021 | I10.2022 | I12.2021 | I12.2022 | I13.2021 | I13.2022 | I14.2021 | I14.2022 | I15.2021 | I15.2022 | I16.2021 | I16.2022 | |||||||||||||||||||||||||||||||||||||||
| N Valid | 15 | 15 | 13 | 13 | 14 | 14 | 14 | 14 | 15 | 15 | 12 | 12 | 14 | 14 | ||||||||||||||||||||||||||||||||||||||
| N Missing | 0 | 0 | 2 | 2 | 1 | 1 | 1 | 1 | 0 | 0 | 3 | 3 | 1 | 1 | ||||||||||||||||||||||||||||||||||||||
| Mean | 6.1453 | 6.3993 | 266.54 | 259.31 | 18.4236 | 19.2779 | 10.7050 | 10.5700 | 7.3120 | 8.2347 | 3.1225 | 3.1225 | 199759.71 | 205649.21 | ||||||||||||||||||||||||||||||||||||||
| Std. Error of Mean | 0.42882 | 0.47492 | 69.198 | 75.984 | 1.76385 | 2.11277 | 0.96264 | 0.90491 | 0.91870 | 1.36989 | 1.48806 | 1.48806 | 63488.658 | 66181.341 | ||||||||||||||||||||||||||||||||||||||
| Median | 5.4800 | 6.7400 | 253.00 | 209.00 | 17.9800 | 18.3050 | 10.2600 | 10.4950 | 6.9600 | 7.0900 | 4.0300 | 4.0300 | 114779.50 | 118861.00 | ||||||||||||||||||||||||||||||||||||||
| Mode | 3.76a | 3.64a | 11a | 358 | 8.87a | 9.70a | 9.65 | 5.23a | 1.61a | 1.61a | -11.01a | -11.01a | 5416a | 5174a | ||||||||||||||||||||||||||||||||||||||
| Std. Deviation | 1.66082 | 1.83936 | 249.497 | 273.963 | 6.59972 | 7.90527 | 3.60186 | 3.38588 | 3.55810 | 5.30558 | 5.15478 | 5.15478 | 237552.808 | 247627.905 | ||||||||||||||||||||||||||||||||||||||
| Skewness | 0.165 | -0.072 | 1.967 | 2.406 | 0.500 | 0.944 | -0.098 | -0.213 | 0.895 | 1.541 | -2.035 | -2.035 | 2.036 | 2.042 | ||||||||||||||||||||||||||||||||||||||
| Std. Error of Skewness | 0.580 | 0.580 | 0.616 | 0.616 | 0.597 | 0.597 | 0.597 | 0.597 | 0.580 | 0.580 | 0.637 | 0.637 | 0.597 | 0.597 | ||||||||||||||||||||||||||||||||||||||
| Kurtosis | -1.125 | -1.356 | 5.067 | 7.061 | -0.020 | 0.510 | -1.259 | -1.268 | 1.795 | 2.589 | 5.294 | 5.294 | 3.117 | 3.082 | ||||||||||||||||||||||||||||||||||||||
| Std. Error of Kurtosis | 1.121 | 1.121 | 1.191 | 1.191 | 1.154 | 1.154 | 1.154 | 1.154 | 1.121 | 1.121 | 1.232 | 1.232 | 1.154 | 1.154 | ||||||||||||||||||||||||||||||||||||||
| Range | 5.19 | 5.75 | 958 | 1062 | 23.50 | 27.28 | 10.90 | 9.90 | 14.63 | 20.63 | 20.11 | 20.11 | 768780 | 781048 | ||||||||||||||||||||||||||||||||||||||
| Minimum | 3.76 | 3.64 | 11 | 12 | 8.87 | 9.70 | 5.23 | 5.23 | 1.61 | 1.61 | -11.01 | -11.01 | 5416 | 5174 | ||||||||||||||||||||||||||||||||||||||
| Maximum | 8.95 | 9.39 | 969 | 1074 | 32.37 | 36.98 | 16.13 | 15.13 | 16.24 | 22.24 | 9.10 | 9.10 | 774196 | 786222 | ||||||||||||||||||||||||||||||||||||||
| Sum | 92.18 | 95.99 | 3465 | 3371 | 257.93 | 269.89 | 149.87 | 147.98 | 109.68 | 123.52 | 37.47 | 37.47 | 2796636 | 2879089 | ||||||||||||||||||||||||||||||||||||||
| Percentiles 25 | 4.9500 | 4.8400 | 88.50 | 83.00 | 13.8750 | 13.2775 | 7.5425 | 7.9850 | 5.2800 | 4.2900 | 2.3000 | 2.3000 | 76408.50 | 76794.25 | ||||||||||||||||||||||||||||||||||||||
| Percentiles 50 | 5.4800 | 6.7400 | 253.00 | 209.00 | 17.9800 | 18.3050 | 10.2600 | 10.4950 | 6.9600 | 7.0900 | 4.0300 | 4.0300 | 114779.50 | 118861.00 | ||||||||||||||||||||||||||||||||||||||
| Percentiles 75 | 7.3000 | 8.0900 | 348.50 | 341.00 | 24.0150 | 23.3325 | 13.9850 | 13.7700 | 10.0000 | 9.2900 | 6.3300 | 6.3300 | 203616.00 | 208005.00 | ||||||||||||||||||||||||||||||||||||||
| a. Multiple modes exist. The smallest value is shown | ||||||||||||||||||||||||||||||||||||||||||||||||||||
| I17.2021 | I17.2022 | I18.2021 | I18.2022 | I19.2021 | I19.2022 | I20.2021 | I20.2022 | I21.2021 | I21.2022 | I22.2021 | I22.2022 | I23.2021 | I23.2022 | |||||||||||||||||||||||||||||||||||||||
| N Valid | 13 | 13 | 11 | 11 | 14 | 14 | 13 | 12 | 14 | 14 | 13 | 13 | 12 | 12 | ||||||||||||||||||||||||||||||||||||||
| N Missing | 2 | 2 | 4 | 4 | 1 | 1 | 2 | 3 | 1 | 1 | 2 | 2 | 3 | 3 | ||||||||||||||||||||||||||||||||||||||
| Mean | 9760.38 | 9304.77 | 4.9500 | 4.6755 | 6708.29 | 7786.14 | 9499.92 | 7543.42 | 5865.86 | 6367.00 | 3.3523 | 3.7338 | 4.7275 | 4.8650 | ||||||||||||||||||||||||||||||||||||||
| Std. Error of Mean | 3073.308 | 2808.790 | 0.67682 | 0.72330 | 2127.108 | 2589.579 | 3026.874 | 2107.713 | 2030.919 | 2039.014 | 0.60423 | 0.72173 | 0.30406 | 0.34093 | ||||||||||||||||||||||||||||||||||||||
| Median | 5579.00 | 5579.00 | 3.8800 | 4.1500 | 4200.00 | 4078.00 | 6129.00 | 5642.00 | 3393.00 | 4029.00 | 2.7800 | 3.4900 | 4.6450 | 5.0550 | ||||||||||||||||||||||||||||||||||||||
| Mode | 181a | 109a | 3.25a | 2.11a | 80a | 113a | 189a | 144a | 163a | 130a | .79a | 3.49 | 3.44a | 2.78a | ||||||||||||||||||||||||||||||||||||||
| Std. Deviation | 11080.971 | 10127.236 | 2.24475 | 2.39892 | 7958.908 | 9689.316 | 10913.548 | 7301.331 | 7599.002 | 7629.293 | 2.17857 | 2.60223 | 1.05329 | 1.18101 | ||||||||||||||||||||||||||||||||||||||
| Skewness | 1.927 | 1.723 | 1.612 | 1.959 | 1.978 | 1.827 | 2.033 | 1.955 | 2.723 | 2.509 | 1.096 | 1.331 | 0.646 | -0.374 | ||||||||||||||||||||||||||||||||||||||
| Std. Error of Skewness | 0.616 | 0.616 | 0.661 | 0.661 | 0.597 | 0.597 | 0.616 | 0.637 | 0.597 | 0.597 | 0.616 | 0.616 | 0.637 | 0.637 | ||||||||||||||||||||||||||||||||||||||
| Kurtosis | 3.797 | 2.672 | 1.911 | 4.246 | 3.688 | 2.465 | 4.031 | 4.241 | 8.298 | 7.214 | 0.409 | 1.069 | 0.064 | -0.421 | ||||||||||||||||||||||||||||||||||||||
| Std. Error of Kurtosis | 1.191 | 1.191 | 1.279 | 1.279 | 1.154 | 1.154 | 1.191 | 1.232 | 1.154 | 1.154 | 1.191 | 1.191 | 1.232 | 1.232 | ||||||||||||||||||||||||||||||||||||||
| Range | 39326 | 34973 | 6.89 | 8.71 | 28077 | 30931 | 38745 | 26729 | 29608 | 29641 | 7.03 | 8.37 | 3.43 | 3.88 | ||||||||||||||||||||||||||||||||||||||
| Minimum | 181 | 109 | 3.25 | 2.11 | 80 | 113 | 189 | 144 | 163 | 130 | 0.79 | 0.79 | 3.44 | 2.78 | ||||||||||||||||||||||||||||||||||||||
| Maximum | 39507 | 35082 | 10.14 | 10.82 | 28157 | 31044 | 38934 | 26873 | 29771 | 29771 | 7.82 | 9.16 | 6.87 | 6.66 | ||||||||||||||||||||||||||||||||||||||
| Sum | 126885 | 120962 | 54.45 | 51.43 | 93916 | 109006 | 123499 | 90521 | 82122 | 89138 | 43.58 | 48.54 | 56.73 | 58.38 | ||||||||||||||||||||||||||||||||||||||
| Percentiles 25 | 2735.50 | 2750.00 | 3.3500 | 3.2500 | 1042.25 | 1042.25 | 2974.00 | 3010.25 | 1760.75 | 1786.00 | 1.6450 | 1.9950 | 3.7075 | 3.7850 | ||||||||||||||||||||||||||||||||||||||
| Percentiles 50 | 5579.00 | 5579.00 | 3.8800 | 4.1500 | 4200.00 | 4078.00 | 6129.00 | 5642.00 | 3393.00 | 4029.00 | 2.7800 | 3.4900 | 4.6450 | 5.0550 | ||||||||||||||||||||||||||||||||||||||
| Percentiles 75 | 13558.00 | 13848.00 | 5.9200 | 4.7500 | 8424.25 | 9803.50 | 11423.50 | 8550.00 | 7586.00 | 8039.75 | 4.3850 | 4.5400 | 5.3300 | 5.5425 | ||||||||||||||||||||||||||||||||||||||
| a. Multiple modes exist. The smallest value is shown | ||||||||||||||||||||||||||||||||||||||||||||||||||||
| I24.2021 | I24.2022 | I25.2021 | I25.2022 | I26.2021 | I26.2022 | I27.2021 | I27.2022 | I28.2021 | I28.2022 | |||||||||||||||||||||||||||||||||||||||||||
| N Valid | 13 | 13 | 15 | 15 | 13 | 13 | 13 | 13 | 13 | 13 | ||||||||||||||||||||||||||||||||||||||||||
| N Missing | 2 | 2 | 0 | 0 | 2 | 2 | 2 | 2 | 2 | 2 | ||||||||||||||||||||||||||||||||||||||||||
| Mean | 59.7915 | 55.6169 | 151100.33 | 156217.13 | 3267.38 | 2804.62 | 2289.77 | 2579.15 | 38.0292 | 34.2331 | ||||||||||||||||||||||||||||||||||||||||||
| Std. Error of Mean | 12.58798 | 13.50525 | 41207.009 | 43380.934 | 1099.241 | 884.473 | 728.268 | 847.593 | 6.28313 | 6.14950 | ||||||||||||||||||||||||||||||||||||||||||
| Median | 55.4800 | 30.7800 | 91933.00 | 90503.00 | 1409.00 | 1258.00 | 1445.00 | 1786.00 | 33.1400 | 28.6100 | ||||||||||||||||||||||||||||||||||||||||||
| Mode | 8.09a | 7.18a | 4098a | 4068a | 100a | 27a | 11a | 63a | 4.56a | 3.03a | ||||||||||||||||||||||||||||||||||||||||||
| Std. Deviation | 45.38659 | 48.69387 | 159594.059 | 168013.635 | 3963.371 | 3189.012 | 2625.807 | 3056.041 | 22.65414 | 22.17233 | ||||||||||||||||||||||||||||||||||||||||||
| Skewness | 1.035 | 1.192 | 1.677 | 1.668 | 1.682 | 1.380 | 1.723 | 1.611 | 0.255 | 0.631 | ||||||||||||||||||||||||||||||||||||||||||
| Std. Error of Skewness | 0.616 | 0.616 | 0.580 | 0.580 | 0.616 | 0.616 | 0.616 | 0.616 | 0.616 | 0.616 | ||||||||||||||||||||||||||||||||||||||||||
| Kurtosis | 0.776 | 0.545 | 2.269 | 2.046 | 2.504 | 0.934 | 3.211 | 1.712 | -0.752 | -0.008 | ||||||||||||||||||||||||||||||||||||||||||
| Std. Error of Kurtosis | 1.191 | 1.191 | 1.121 | 1.121 | 1.191 | 1.191 | 1.191 | 1.191 | 1.191 | 1.191 | ||||||||||||||||||||||||||||||||||||||||||
| Range | 155.94 | 156.85 | 552537 | 562040 | 13277 | 10010 | 9171 | 9023 | 75.27 | 76.95 | ||||||||||||||||||||||||||||||||||||||||||
| Minimum | 8.09 | 7.18 | 4098 | 4068 | 100 | 27 | 11 | 63 | 4.56 | 3.03 | ||||||||||||||||||||||||||||||||||||||||||
| Maximum | 164.03 | 164.03 | 556635 | 566108 | 13377 | 10037 | 9182 | 9086 | 79.83 | 79.98 | ||||||||||||||||||||||||||||||||||||||||||
| Sum | 777.29 | 723.02 | 2266505 | 2343257 | 42476 | 36460 | 29767 | 33529 | 494.38 | 445.03 | ||||||||||||||||||||||||||||||||||||||||||
| Percentiles 25 | 23.3650 | 21.7900 | 48611.00 | 48128.00 | 586.00 | 558.00 | 369.50 | 335.00 | 22.7250 | 21.3150 | ||||||||||||||||||||||||||||||||||||||||||
| Percentiles 50 | 55.4800 | 30.7800 | 91933.00 | 90503.00 | 1409.00 | 1258.00 | 1445.00 | 1786.00 | 33.1400 | 28.6100 | ||||||||||||||||||||||||||||||||||||||||||
| Percentiles 75 | 93.6050 | 90.5050 | 188481.00 | 188481.00 | 5431.00 | 4632.00 | 3024.00 | 3024.00 | 58.3250 | 54.0150 | ||||||||||||||||||||||||||||||||||||||||||
| a. Multiple modes exist. The smallest value is shown | ||||||||||||||||||||||||||||||||||||||||||||||||||||
Figure 1.
Mountain Entrepreneurship Elements in the Construction Sector for Eurostat Business Demographics Indicators (I21-I28).
Figure 1.
Mountain Entrepreneurship Elements in the Construction Sector for Eurostat Business Demographics Indicators (I21-I28).
References
- Carter, S., & Jones-Evans, D. (Eds.). (2006). Enterprise and small business: Principles, practice and policy. Pearson Education.
- Covaci, B., & Covaci, M. (2025). Sustainable European mountain entrepreneurship through statistical, neural network, and fractal analyzes—A review. Preprints. Available online: https://www.preprints.org/manuscript/202501.0660/v1.
- Edum-Fotwe, F.T. (1995). A framework for improving the strategic management of construction contractors (Doctoral dissertation, © Francis Tekyi Edum-Fotwe).
- Edum-Fotwe, F. T., & Price, A. D. (2009). A social ontology for appraising sustainability of construction projects and developments. International Journal of Project Management, 27(4), 313–322.
- Edum-Fotwe, F. T., Price, A., & Thorpe, T. (1994). Strategic management for construction contractors. Loughborough University Conference Contribution. Available online: https://hdl.handle.net/2134/26191.
- Eurostat (2025). Business demography and high growth enterprises by NACE Rev. 2 activity and other typologies [urt_bd_hgn__custom_15325082].
- Giuliani, F., & Scudellari, J. (2017). Cable transport systems as a sustainable mobility option in urban and mountain areas. Procedia Engineering, 198, 66–77. [CrossRef]
- . [CrossRef]
- Gann, D. M., & Salter, A. J. (2000). Innovation in project-based, service-enhanced firms: The construction of complex products and systems. Research Policy, 29(7–8), 955–972.
- Goh, E., & Loosemore, M. (2017). The impacts of industrialization on construction subcontractors: A resource based view. Construction Management and Economics, 35(5), 288–304.
- Grigore, A. M., & Dragan, I. M. (2020). Towards sustainable entrepreneurial ecosystems in a transitional economy: An analysis of two Romanian city-regions through the lens of entrepreneurs. Sustainability, 12(15), 6061.
- Ivasciuc, I.-S., & Ispas, A. (2023). Exploring the motivations, abilities and opportunities of young entrepreneurs to engage in sustainable tourism business in the mountain area. Sustainability, 15(3), 1956. [CrossRef]
- Miocevic, D., Maricic, M., Arslanagic-Kalajdzic, M., & Dedic, G. (2025). Emotional intelligence and relational energy in cooperative arrangements in construction projects: Complements or substitutes? Construction Management and Economics, 1–16.
- Rey, R. (1995). Calitatea vieții în zona montană. Calitatea Vieții, 6(3–4), 269–280.
- Ruddock, L., & Ruddock, S. (2009). Reassessing productivity in the construction sector to reflect hidden innovation and the knowledge economy. Construction Management and Economics, 27(9), 871–879.
- Tăut, F., Brejea, R., & Roșca, S. (2020). Environmental Influences on Pastures Favourability in Bihor County. Geogr. Napoc, 14, 7-15.
- Valica, M. (2022). Cine investește în educația montană, culege în economie. Available online: https://www.arhiepiscopiasucevei.ro/cine-investeste-in-educatia-montana-culege-in-economie.
- Vassallo, W. (Ed.). (2016). Crowdfunding for sustainable entrepreneurship and innovation. IGI Global.
Disclaimer/Publisher’s Note: The statements, opinions and data contained in all publications are solely those of the individual author(s) and contributor(s) and not of MDPI and/or the editor(s). MDPI and/or the editor(s) disclaim responsibility for any injury to people or property resulting from any ideas, methods, instructions or products referred to in the content. |
© 2025 by the authors. Licensee MDPI, Basel, Switzerland. This article is an open access article distributed under the terms and conditions of the Creative Commons Attribution (CC BY) license (http://creativecommons.org/licenses/by/4.0/).
Copyright: This open access article is published under a Creative Commons CC BY 4.0 license, which permit the free download, distribution, and reuse, provided that the author and preprint are cited in any reuse.


