
Submitted:
15 May 2025
Posted:
16 May 2025
You are already at the latest version
Abstract
Background: In burn injuries, wound healing effectiveness is complex and influenced significantly by the local biochemical environment and the physicochemical properties of topical preparations. pH lesions modulation can influence protection barrier integrity, inflammatory responses, and microbial colonization. Their antioxidant, antimicrobial, and anti-inflammatory properties, of the topical formulations enriched with plant extracts have demonstrated promising results. Objective: The aim of the study was to develop and characterize topical oleogel and hydrogel formulations containing ethanolic and hydroalcoholic extracts of medicinal plants (Boswellia serrata, Ocimum basilicum, Sambucus nigra, and Galium verum), and to evaluate the impact of their physicochemical properties, rheological behavior, in contrast with the wound pH modulation, and healing efficacy in an experimental burn model. Methods: Second-degree burns were induced uniformly on Wistar rats using the vali-dated RAPID-3D device. All formulations were applied daily for 21 days, and wound healing was assessed through several measurements specific to the wound surface, skin temperature, pH, and, last but not least, histological analyses. Formulations' physicochemical and rheological properties, including pH, viscosity, and spreadability, were also analyzed and systematically characterized. Results: Oleogel formulations demonstrated superior wound healing performance compared to hydrogels. Formulations containing Boswellia serrata and Ocimum basilicum extracts significantly reduced wound size, inflammation, and melanin production by days 9 and 21 (p < 0.05). The beneficial outcomes correlated strongly with formulation acidity (pH <6), high viscosity, and enhanced thixotropic behavior, indicating improved adherence and sustained bioactive compound release. Histological evaluations confirmed enhanced epithelialization and reduced inflammation. Conclusions: Particularly Boswellia serrata and Ocimum basilicum in oleogel formulations in ethanolic solvent effectively modulated wound pH, enhanced topical adherence, and improved burn wound healing. These findings highlight their potential clinical application and justify further clinical investigations.
Keywords:
wound-healing properties
; burn wound treatment
; rheological properties
; physicochemical characterization
; plant extracts
; hydrogel
; oleogel
; pH
; temperature
; experimental rat burn model
1. Introduction
Optimal wound healing, mainly caused by burns, represents a multifactorial and complex process influenced by the local biochemical environment and the physicochemical properties of the topical preparations [1,2]. The stratum corneum in healthy skin has an acidic pH (4.1- 5.8) for maintaining structural integrity and preventing infections [5]. One of the critical factors that plays an important role in the trend of pH is directly influencing the skin barrier function, microbial colonization, and enzymatic activity necessary for tissue regeneration [3]. Burn lesions elevated pH values could disrupt this barrier, increasing microbial invasion and prolonging the inflammatory process [4].
Designing topical formulations to regulate wounds pH attracts the attention of researchers for their ability to recreate the physiologically acidic environment, facilitating the repair of the epidermal barrier and reducing inflammation [5]. Formulations based on plants’ active compounds represent a promising alternative, as their antioxidant, antimicrobial, and anti-inflammatory properties can synergistically accelerate skin regeneration [6].
In addition, local temperature variation is an important parameter in assessing wound status, as abnormal fluctuations could be indicating the presence of inflammation, infection, or ischemia. Temperature monitoring can be important as much as type of pH wound be used as an effective indirect sign for assessing the progress of wound healing [7].
Selectively, Sambucus nigra, Boswellia serrata, Galium verum, and Ocimum basilicum contain phenolic and flavonoid compounds recognized for their therapeutic potential to stimulate collagen synthesis, reduce oxidative stress, and modulate the inflammatory process [8,9]. Oleogel and hydrogel formulations loaded with the active components of plants extracts, optimized physicochemical and rheological characteristics could represent an effective solution to improve the personalized treatment of post-burn wounds [10].
The present study aimed to develop and characterize oleogels and hydrogels containing ethanolic and hydroalcoholic extracts of Boswellia serrata, Ocimum basilicum, Galium verum, and Sambucus nigra (flowers and bark-branch), and to evaluate their influence on the physicochemical, rheological properties and their ability to regulate skin pH in the context of experimental burn healing [11].
Also, this study investigates the influence of pH and temperature of plant-enriched hydrogel and oleogel formulations that have an effective inflammation-reducing potential and accelerate wound healing due to the use of RAPID-3D (Rat Printed Induction Device - 3D), previously validated at “Pius Brânzeu” Training and Experimental Surgery Center, and designed to consistently reproduce uniform second-degree burns by controlled exposure to boiling water in Wistar rats.
We hypothesized that pH unadjusted with pH stabilizers of topical oleogel or hydrogel formulations enriched with specific plant extracts (Boswellia serrata, Ocimum basilicum, Sambucus nigra flower (flos), Sambucus nigra bark (cortex), Galium verum, and a combined extract of these four) and also a reduced temperature would significantly improve the healing outcomes of second-degree burns compared to untreated burns and vehicle-only formulations, when used in a Wistar rat scald wound model.
Primary outcome measure was wound contraction rate. By assessing one of key wound-healing parameters such as pH, temperature of the skin and histological changes, this study aims to provide scientific validation for these plant-based biocompatible nonadjusted pH gel formulations as novel burn therapies.
2. Materials and Methods
2.1. Plant Materials and Extraction
Boswellia serrata (BS), Ocimum basilicum (OB), flowers and bark of Sambucus nigra (SNF, SNB) and Galium verum (GV) were extracted in ethanolic and hydroalcoholic solvent for this study.
Harvesting and preparation of plant material (Sambucus nigra bark)
Young bark branches of Sambucus nigra were harvested during May–June, from the rural area of Lelești, located in southern Romania, from an isolated region from direct sources of industrial or urban pollution, using individual, healthy plant specimens. The harvesting was carried out by sectioning the branches located at a height of approximately 50-60 cm from the ground, selecting branches aged 1 year, with a diameter of approximately 2 cm, and an average length of 2 meters.
The bark of the branches was removed by scraping, using a sterilized blade, to prevent plant material contamination. Subsequently, the obtained bark was stored in airtight “zipper” type bags and placed in suitable containers for slow drying.
This procedure ensures the preservation of the bioactive properties of the plant material and the avoidance of further degradation or microbiological contamination.
Plant material was obtained from certified commercial sources and from wild plants, controlled dried (22 ± 2 °C; humidity 50 ± 10%) and finely ground as mentioned in detail in previous study by Rosca et al. 2025 [12].
Extracts preparations supposed 90 g of each plant material were extracted with 900 ml absolute ethanol (99.5%) or 70% ethanol, under stirring at 60°C for 2.5 hours, followed by homogenization for 48 hours, sonication at 40°C for 1 hour and refrigeration at -4°C for 3 days. An exception was the bark of Sambucus nigra (SNB), which was initially extracted with 900 ml chloroform, then following the same steps described above, after which the extract obtained was mixed with absolute ethanol. All mixtures were filtered, and the solvent was removed under vacuum using a rotary evaporator. The dried extracts were stored at room temperature in airtight containers.
All other materials used were of analytical grade and were used as received.
2.2. Phytochemical Profile of Extracts
The extracts were analyzed by HPLC to identify the active compounds rosmarinic acid, caftaric acid, gentisic acid, chlorogenic acid, caffeic acid, p-coumaric acid, ferulic acid and sinapic acid, hyperoside, isoquercitrin, rutin, myricetin, fisetin, quercitrin, quercetol, luteolin, kaempferol, apigenin, resveratrol, gallic acid, beta-resorcylic and epicatechin in several herbal extracts. Polyphenols were separated on a reverse phase Zorbax Eclipse Plus C18 column (3.0x100mm x 3.5 µ). The LC-MS method enabled the screening and quantification of all extracts for 20 polyphenols, described by Ghiulai et al. 2020 [13] The mobile phase consisted of a mixture of 0.1% acetic acid and methanol, used in gradient elution as follows: initially 5% methanol for the first 5 minutes (linear elution), gradually increasing to 42% methanol by minute 38, maintained at 42% methanol until minute 41, and returning to 5% methanol until minute 42.
The flow rate was set at 1 mL/min, achieving complete elution of all components within approximately 40 minutes. An injection volume of 10 µL was used, and the column temperature was maintained at 40ºC. Compound screening was performed using both UV and MS detectors. UV detection was conducted at wavelengths of 330 nm and 370 nm, while MS detection utilized electrospray ionization (ESI) in single ion monitoring mode (SIM) simultaneously for all 20 targeted compounds. All mass spectra were recorded in negative ion mode, previously established as the optimal ionization mode for these compounds [14]. Throughout the experiments, the capillary voltage was maintained at 3500 V, the drying gas flow rate was set at 12 L/min with a temperature of 350°C, nebulizer pressure was maintained at 55 psig, and the fragmentor voltage was set at 70 V. For the quantitative determination of polyphenols in samples, calibration curves exhibiting good linearity were prepared using the external standard method over a concentration range of 0.05–2 µg/mL, with six calibration points for each compound. The mass spectrometer was calibrated externally using the ESI Tuning Mix standard from Agilent (Santa Clara, CA, USA).
2.3. Materials Used in the Formulations
Sunflower and olive fruit oils were purchased from Azelis Romania SRL (Bucharest, Romania). Isopropyl myristate, diethylene glycol monoethyl ether purched from Sigma Aldrich (Germany) and Thermo Fisher Scientific (Germany), and glycerol dibeenate (Compritol 888 ATO) was a sample gift donated by Gattefossé Pharmaceuticals (Saint-Priest, France), also 407 poloxamer and glycerol were from Sigma-Aldrich-Chemie (Steinheim, Germany).
2.4. Determination of Partition Coefficient LogP and Skin Permeability Potential
The evaluation of LogP and skin permeability potential was performed by high-performance liquid chromatography (HPLC). The experiments were conducted on a 6120 LC-MS analytical system from Agilent (Santa Clara, CA, USA) consisting of 1260 Infinity HPLC equipped with G1322A degasser, G1311B quaternary pump, G1316A column thermostat, G1365C MWD detector, G7129A autosampler coupled with a Quadrupolar (Q) mass spectrometer equipped with electrospray ionization source (ESI). OpenLAB CDS ChemStation Workstation software was used to control the instrument, acquisition and processing the data. Also, followed by in silico analysis using the SwissADME platform [15].
2.5. Physicochemical and Rheological Characterizationation Methods
The formulations were evaluated macroscopically (appearance, color, odor, opacity), by measuring pH (Seven Excellence™ S400-KIT, Mettler Toledo) and by analyzing rheological behavior (viscosity, thixotropy) using the HAAKE RheoStress 1 rheometer (Thermo Fisher Scientific). All experimental preparations were stored overnight at 4 °C and protected from light, before submitted to physicochemical tests.

Table 1.
Detailed description of oleogel and hydrogel formulations containing ethanolic extracts.
| Formulation | Extraction method | Extract & Concentration (w/w) | Gel components | In vivo Unique Name |
Description |
|---|---|---|---|---|---|
| OG | ETOH99.5 | OB 5% |
Sunflower oil 80% Glyceryl dibehenate 15% |
OG_OB_ETOH99.5 | Oleogel with basil extract in absolute ethanol, based on glyceryl dibehenate and sunflower oil |
| OG | ETOH99.5 | BS 5% |
Sunflower oil 80% Glyceryl dibehenate 15% |
OG_BS_ETOH99.5 | Oleogel with frankincense extract in absolute ethanol, based on glyceryl dibehenate and sunflower oil |
| OG | ETOH99.5 | SNF 5% |
Olive oil 80% Glyceryl dibehenate 15% |
OG_SNF_ETOH99.5 | Oleogel with elderflower extract in absolute ethanol, based on glyceryl dibehenate and olive oil |
| OG | ETOH99.5 | SNB 5% |
Sunflower oil 80% Glyceryl dibehenate 15% |
OG_SNB_ETOH99.5 | Oleogel with elder bark extract in absolute ethanol, based on glyceryl dibehenate and sunflower oil |
| OG | ETOH99.5 | GV 5% |
Olive oil 80% Glyceryl dibehenate 15% |
OG_GV_ETOH99.5 | Oleogel with Galium verum extract in absolute ethanol, based on glyceryl dibehenate and olive oil |
| OG | ETOH70 | OB 5% |
Isopropyl myristate 80% Glyceryl dibehenate 15% |
OG_OB_ETOH70 | Oleogel with basil extract in 70% ethanol, based on glyceryl dibehenate and isopropyl myristate |
| OG | ETOH70 | BS 5% |
Sunflower oil 80% Glyceryl dibehenate 15% |
OG_BS_ETOH70 | Oleogel with frankincense extract in 70% ethanol, based on glyceryl dibehenate and sunflower oil |
| OG | ETOH70 | SNF 5% |
Diethylene glycol monoethyl ether 80% Glyceryl dibehenate 15% |
OG_SNF_ETOH70 | Oleogel with elderflower extract in 70% ethanol, based on glyceryl dibehenate and diethylene glycol monoethyl ether |
| OG | ETOH99.5 | BS_OB_SNF_GV 1.25:1.25:1.25:1.25% |
Sunflower oil 20% Olive oil 20% Isopropyl myristate 20% Diethylene glycol monoethyl ether 20% Glyceryl dibehenate 15% |
OG_BS_OB_SNF_GV_ETOH99.5 | Oleogel with 4 plant extracts in absolute ethanol |
| OG | ETOH70 | BS_OB_SNF_GV 1.25:1.25:1.25:1.25% |
Sunflower oil 20% Olive oil 20% Isopropyl myristate 20% Diethylene glycol monoethyl ether 20% Glyceryl dibehenate 15% |
OG_BS_OB_SNF_GV_ETOH70 | Oleogel with 4 plant extracts in 70% ethanol |
| HG | ETOH99.5 | OB 5% |
Purified water 60% Poloxamer 407 25% Glycerol 10% |
HG_OB_ETOH99.5 | Hydrogel with basil extract in absolute ethanol |
| HG | ETOH99.5 | BS 5% |
Purified water 60% Poloxamer 407 25% Glycerol 10% |
HG_BS_ETOH99.5 | Hydrogel with frankincense extract in absolute ethanol |
| HG | ETOH99.5 | SNF 5% |
Purified water 60% Poloxamer 407 25% Glycerol 10% |
HG_SNF_ETOH99.5 | Hydrogel with elderflower extract in absolute ethanol |
| HG | ETOH99.5 | GV 5% |
Purified water 60% Poloxamer 407 25% Glycerol 10% |
HG_GV_ETOH99.5 | Hydrogel with Galium verum extract in absolute ethanol |
| HG | ETOH70 | OB 5% |
Purified water 60% Poloxamer 407 25% Glycerol 10% |
HG_OB_ETOH70 | Hydrogel with basil extract in 70% ethanol |
| HG | ETOH70 | BS 5% |
Purified water 60% Poloxamer 407 25% Glycerol 10% |
HG_BS_ETOH70 | Hydrogel with frankincense extract in 70% ethanol |
| HG | ETOH70 | SNF 5% |
Purified water 60% Poloxamer 407 25% Glycerol 10% |
HG_SNF_ETOH70 | Hydrogel with elderflower extract in 70% ethanol |
| HG | ETOH99.5 | SNB 5% |
Purified water 60% Poloxamer 407 25% Glycerol 10% |
HG_SNB_ETOH99.5 |
Hydrogel with elder bark extract extract in absolute ethanol |
| HG | ETOH70 | BS_OB_SNF_GV 1.25:1.25:1.25:1.25% |
Purified water 60% Poloxamer 407 25% Glycerol 10% |
HG_BS_OB_SNF_GV_ETOH70 | Hydrogel with 4 plant extracts in 70% ethanol |
| HG | ETOH99.5 | BS_OB_SNF_GV 1.25:1.25:1.25:1.25% |
Purified water 60% Poloxamer 407 25% Glycerol 10% |
HG_BS_OB_SNF_GV_ETOH99.5 | Hydrogel with 4 plant extracts in absolute ethanol |
| Pre-burn | N/A | Baseline | N/A | Pre-burn_baseline | Control for the healthy skin |
| Untreated_ Burn | N/A | Untreated_Burn | N/A | Untreated_burn_control | Control for the untreated burn |
| OG | N/A | OG_base |
Sunflower oil 21.5% Olive oil 21.5% Isopropyl myristate 21.5% Diethylene glycol monoethyl ether 21.5% Glyceryl dibehenate 15% |
OG_base |
Control oleogel (without bioactive component) |
| HG | N/A | HG_base |
Purified water 65% Poloxamer 407 25% Glycerol 10% |
HG_base | Control hydrogel (without bioactive component), based on poloxamer 407 and glycerol, purified water |
2.6. Statistical Analysis
The data obtained (pH and burn surface area) were analyzed using appropriate statistical tests: Pearson correlation coefficient, Mann-Whitney U test and Kruskal-Wallis test, setting the statistical significance threshold at p < 0.05.
2.7. Methodology for Physicochemical and Rheological Characterization
2.7.1. Determination of Macroscopic Properties and pH
Macroscopic evaluation of the experimental preparations was performed by visual examination of their organoleptic properties (physical appearance, color and homogeneity) with additional standardization of color using the Pantone Matching System [16,17], aspect [18,19] and detailed odor description based on sensory evaluation methods described by Lawless et al. [20,21,22,23].
The consistency of the gel formulations was evaluated by its two related parameters, namely penetration degree and spreadability, which were measured by pharmacopoeial penetrometric method and respectively parallel-plate method. The penetrometric and spreadability tests were carried out using a penetrometer (PNR 12, Petrolab, Speyer, Germany) equipped with a microcone and suitable container, and respectively del Pozo Ojeda-SuñéArbussá extensometer, based on the procedures described in the literature [24,25].
All rheological measurements were performed at 25 ± 2 °C, in triplicate.
2.7.2. Rheological Measurements
To determine the flow behavior and viscosity of experimental gels, a HAAKE RheoStress 1 rheometer (Thermo Fisher Scientific, Karlsruhe, Germany) with temperature device controller (TCP/P Peltier /Plate) was used. Viscosimetry tests were carried out at rotational mode and 23 °C, on a cone-plate geometry of 35 mm diameter, 2°cone angle and a 0.105 mm gap size for oleogels, and a plate-plate geometry of 60 mm diameter and a 1.000 mm gap size for hydrogels. The rheograms and viscosity curves were recorded under controlled rate by gradually increasing the share rate over a range of 0.05-100 1/s during 120 s (ramp-up period), 10 s at 100 1/s (constant shear rate period), and then down from the maximum to the minimum value of this range in another 120 s (ramp-down period). HAAKE RheoWin software version 4.3 (Thermo Fisher Scientific, Karlsruhe, Germany) was used to collect and analyze the rheological data.
2.7.3. pH Analysis: Formulations and Burn Wounds
The pH values of experimental formulations and of a 10% DEGEE aqueous solution was measured in triplicate at 25 °C, using a calibrated Seven Excellence™ S400-KIT pH-meter (Mettler Toledo, Columbus, OH, USA) and according to the compendial potentiometric procedure [26]. 1 g from each gel was dispersed in 20 mL purified water in a glass vial by stirring for 15 min, then the obtained dispersion was filtered, and the pH of the filtrate was determined. Results were expressed as mean ± SD.
2.8. Animal Study and Clinical Parameters
2.8.1. In Vivo Study and Experimental Protocol
The study was conducted on 30 female Wistar rats, which were adapted to laboratory conditions for one week. Uniform second-degree burns were induced using the RAPID-3D device, applying hot water (98-99°C) for 8 seconds on defined areas of the skin. The topical formulations were applied daily for 21 days, and wound healing was monitored and evaluated histologically.
All procedures adhered strictly to the ARRIVE guidelines [27] and were approved by the Ethics Committee of Victor Babes University of Medicine and Pharmacy, Timisoara (approval no. 17/11.03.2022).
2.8.2. Anesthesia, Preoperative Preparation and Pain Management
Prior to inducing burns, the rats were subjected to a 12-hour fasting period, during which they had free access to water. Light sedation was achieved using 2% isoflurane while the rats were positioned on a heating pad. Anesthesia was administered via an intraperitoneal injection of a ketamine (100 mg/ml) and xylazine (20 mg/ml) mixture, dosed at 90 mg/kg for ketamine and 10 mg/kg for xylazine. The effectiveness of the anesthesia was verified by pinching one of the limbs. Anesthesia intensity was monitored by assessing righting and pedal withdrawal reflexes at 7-, 10-, and 15-minutes post-induction, with the absence of limb and head reflexes allowing for continued procedures. The hair on the animals’ backs was trimmed to a size of 10 cm by 8 cm, starting below the neck and extending down to the iliac bone while also going laterally to the anterior costal margins. To remove any remaining hair, depilatory cream (Veet, Reckitt GmbH, Germany) was applied to the trimmed area. The area was then disinfected with a povidone-iodine solution and rinsed with sterile water. Basic vital signs were monitored by placing a pulse oximeter on the rat’s tail, connected to a multi-parameter monitor (BM 5, BIO-NET, Germany). After burn induction, post-procedure analgesia was provided via subcutaneous butorphanol (0.01–0.05 mg/kg) every 12 hours. An Elisabeth cervical collar was placed after scald induction, along with cutting and filing the nails to avoid scratching.
The rat was placed post-burn induction on a heated plate (CMA/150 Temperature Controller, CMA/Microdialysis) with real-time intrarectal monitoring, and the plate temperature was maintained at 36.5 ºC to avoid postanesthetic hypothermia and hair loss. Subsequently, they were placed on clean bedding and monitored until they fully recovered from anesthesia. The Parkland formula calculated crystalloid fluid requirements for burn resuscitation in the first 24 hours, which were administered intraperitoneally. Post-anesthetic hypersalivation was checked every 30 minutes using a sterile 5 mL syringe and a 24 G (19 mm) catheter. Throughout the experiment follow-up, the animals were provided free access to water and solid rat chow (ad libitum). Strict aseptic procedures were followed to prevent the transmission of infections, and the animals were routinely monitored for any signs of distress. Humane euthanasia was performed 21 days after the induction of the scald wounds, under full anesthesia, using 0.3 ml/kg of T61 (MSD Animal Health, Intervet International B.V., Netherlands). The experimental animals were disposed of as medical waste.
2.8.3. Burn Induction and Wound Standardization
Burn wounds were uniformly induced using our previously described RAPID-3D device, a validated 3D-printed apparatus designed to provide controlled and reproducible scald burns. Burns were induced by pouring 40 ml of boiling water (98-99°C) for 8 seconds onto defined skin areas in the left and right thoraco-dorsal region of the rats. This produced eight consistent second-degree burns, consisting of four symmetrical rectan-gular scald wounds on each hemi-thorax area, each measuring 20x10 mm and spaced 10 mm apart. The Meeh formula was used (TBSA = kW²/3, where k in kg) to accurately calculate the total body surface area (TBSA), revealing a consistent burn of 4% TBSA across all experimental animals.
In the rat subgroups, an untreated burn area served as control. An additional unburned skin area served as normal skin control. The rats were organized into three sub-groups of ten animals each, ensuring each formulation was applied consistently across the cohort.
2.8.4. Treatment Application and Dressing Protocol
Rats were divided into 3 subgroups of eight rats each. Each subgroup received a different combination of topical treatment using the previ-ously prepared plant extract creams, as depicted in Figure 7, with either an oleogel or a hydrogel matrix. Each burn site was treated with 0.2 g of the assigned hydrogel or oleogel formulation and applied using a sterile microspatula. In each experimental subgroup, scald wounds were left untreated and served as self-control for the wound healing. Scald wounds treated with blank oleogels and hydrogels, which were devoid of plant extracts, were used as baseline controls. A healthy shaved skin area towards the rat’s tail, which was not burned, served as healthy skin baseline control. Wounds were then covered with a semi-occlusive dressing, which was changed daily. Before reapplication, residual cream was gently removed with a sterile swab moistened with 0.9% saline, followed by a meticulous drying process with sterile gauze, ensuring the wound is in the best possible condition for the next application. Throughout the experiment duration, the topical formulations were kept refrigerated at 4ºC.
2.8.5. Statistical Analysis
Descriptive statistics (mean, standard deviation, median, range) were calculated for pH and burn surface area measurements. Pearson correlation coefficients were calculated to assess linear relationships between continuous variables, specifically average treatment pH (Days 1-21) or initial skin pH (Day 0) versus burn surface area at Day 21. To compare Day 21 burn surface area between burns categorized by average treatment pH (Acidic <6 vs. 1 Basic >7), the non-parametric Mann-Whitney U test was employed. For day-by-day analysis, wound pH was categorized (Acidic <6, Neutral 6.0-7.0, Basic >7.0) at each timepoint (Days 1, 4, 9, 14, 21) and burn surface area on the corresponding day was compared across these three categories using the non-parametric Kruskal-Wallis test. A p-value less than 0.05 was considered statistically significant for all tests.
3. Results
3.1. Quantitative Phytochemical Profile of Extracts
Phytochemical quantitative analysis highlighted the most quantitative presence of the most relevant bioactive compounds in extracts: rutin (46.41 µg/g in ET-OH 99.5% of Sambucus nigra flowers), chlorogenic acid (18.68 µg/g in Sambucus nigra bark), rosmarinic acid (20.37 µg/g in ET-OH 99.5% of Ocimum basilicum and 3.47 µg/g in ET-OH 99.5% of Galium verum), and isoquercitrin (7.99 µg/g in Sambucus nigra flowers). Boswellia serrata (frankincense) extracts were characterized by notable amounts of quercitrin, epicatechin, and p-coumaric acid, known for their significant anti-inflammatory properties (see Figure 18). Other identified phenolics include hyperoside, caffeic acid, and quercitrin, contributing further to the overall bioactive effects. The calculated LogP partition coefficient in silico indicates optimal permeability of most compounds through the skin, favorable for topical application.
In Figure 1 is presented the quantitative analysis of phenolic compounds identified by HPLC in ethanolic (ET-OH 99.5) and hydroalcoholic (ET-OH 70%) extracts obtained from Sambucus nigra flowers (SN), Ocimum basilicum (OB), Galium verum (GV), and Sambucus nigra branch (SNB). Data is expressed in µg/g vegetal product and plotted on a logarithmic scale to emphasize differences across compounds and extracts. Major bioactive compounds such as rutin, chlorogenic acid, rosmarinic acid, and isoquercitrin exhibit the highest concentrations.
The calculated LogP values of the analyzed compounds were interpreted based on standard reference points, where values ranging from approximately -0.5 to 5 typically indicate favorable lipophilicity for efficient permeation through biological membranes (Lipinski et al., 2001) [28]. Permeability potential for skin penetration was assessed using the “500 Dalton rule,” stating that compounds with molecular weights below 500 Da generally exhibit higher skin permeability, whereas those above this threshold typically show lower permeability potential (Bos & Meinardi, 2000) [29].
Table 2.
Molecular Weight, Permeability Potential, and Log Po/w Values of Selected Bioactive Compounds.
Table 2.
Molecular Weight, Permeability Potential, and Log Po/w Values of Selected Bioactive Compounds.
| No. | Compound Name | Molecular Weight (g/mol) | Permeability Potential [28] | Log Po/w |
|---|---|---|---|---|
| 1 | Caftaric acid | 311 | High | -0.29 |
| 2 | Gentisic acid | 153 | High | 0.74 |
| 3 | Chlorogenic acid | 353 | High | -0.43 |
| 4 | Caffeic acid | 179 | High | 0.93 |
| 5 | P-coumaric acid | 163 | High | 1.26 |
| 6 | Ferulic acid | 193 | High | 1.36 |
| 7 | Sinapic acid | 223 | High | 1.31 |
| 8 | Hyperoside | 463 | High | -0.38 |
| 9 | Isoquercitrin | 463 | High | -0.48 |
| 10 | Rutin | 609 | Low | -1.51 |
| 11 | Rosmarinic acid | 359 | High | 5.15 |
| 12 | Quercitrin | 447 | High | -0.05 |
| 13 | Quercetol | 301 | High | 1.23 |
| 14 | Luteolin | 285 | High | 1.73 |
| 15 | Kaempferol | 285 | High | 1.58 |
| 16 | Apigenin | 269 | High | 2.11 |
| 17 | Gaelic acid | 169 | High | 0.21 |
| 18 | Epicatechin | 289 | High | 0.83 |
| 19 | Beta-Resorcylic | 153 | High | 0.77 |
| 20 | Rosveratrol | 227 | High | 2.48 |
3.2. Physicochemical and Rheological Properties
3.2.1. Determination of Macroscopic Properties and pH
3.2.2. Standardized Macroscopic Evaluation of Topical Formulations
Figure 2.
Presentation of the characteristics of hydrogel color, transparency and opacity.
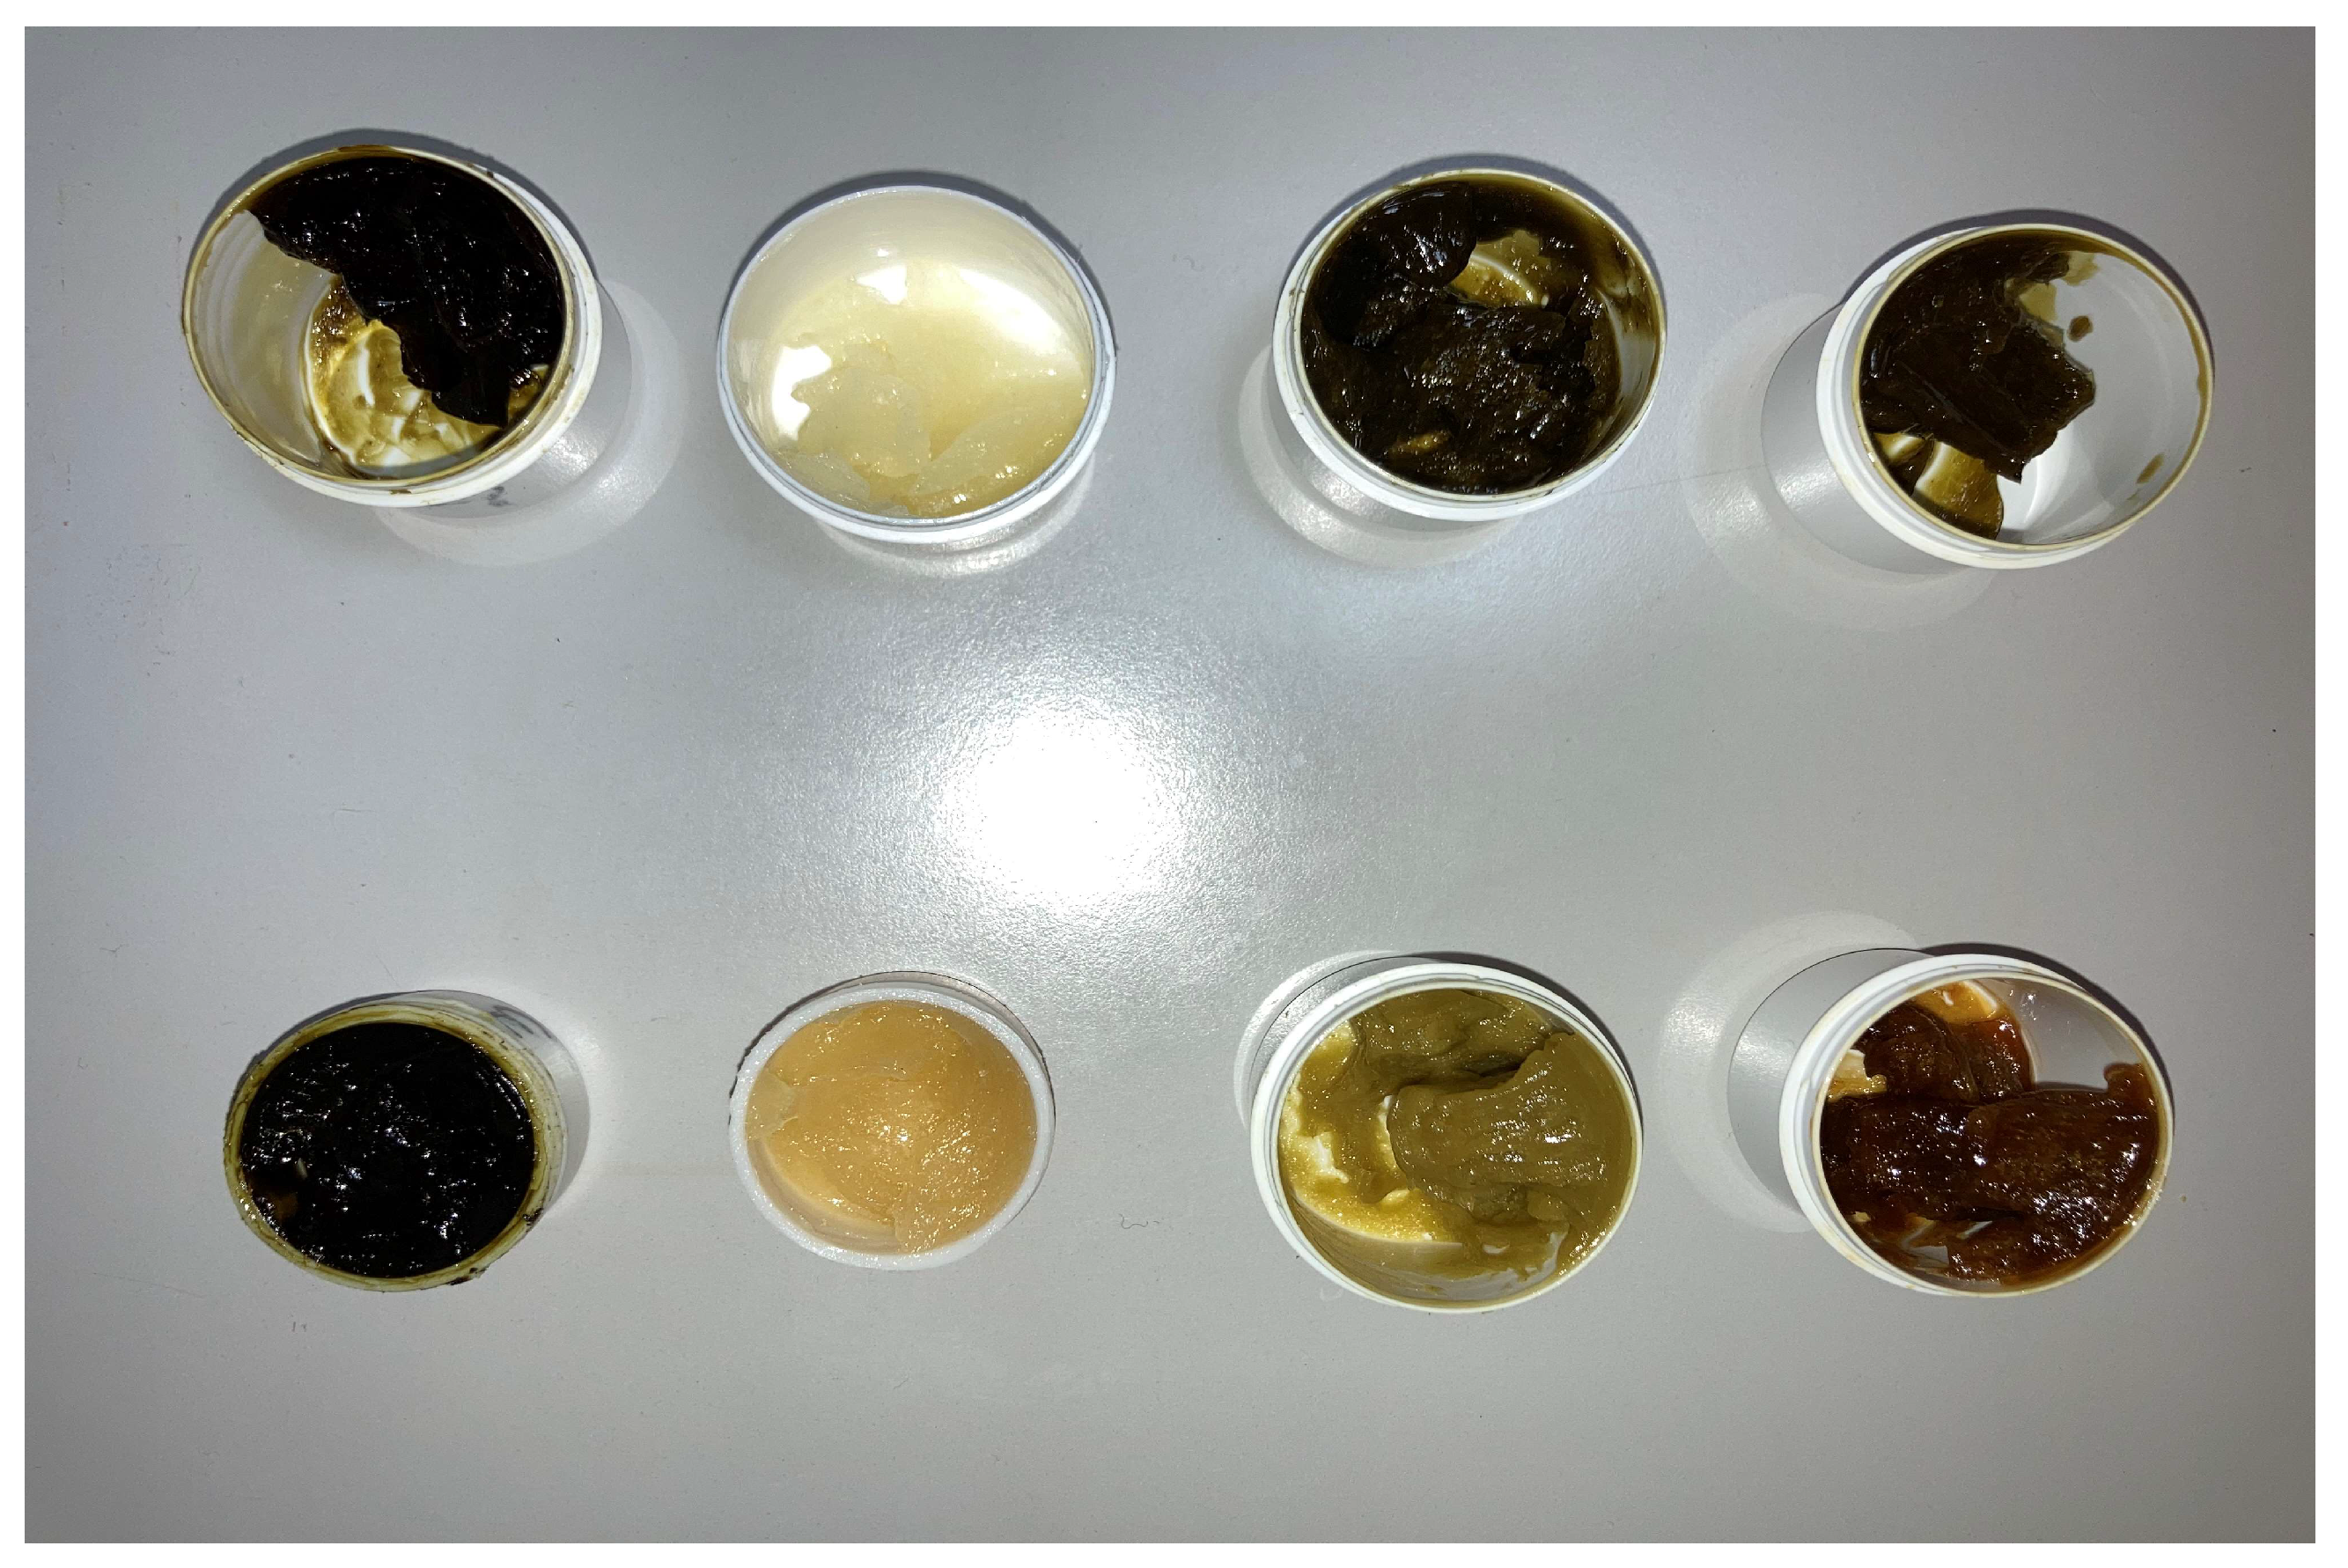
Figure 3 present a comparative graph of mean pH values (± standard deviation) for the experimental oleogel and hydrogel formulations. The values indicate that most of the formulations containing natural extract presented a more acidic pH compared to the corresponding topical control formulations, with the exception of OG1 (Boswellia serrata 70% ethanol), which presented neutral to slightly basic values. Diethylene glycol monoethyl ether (DEGEE)-based formulation recorded the lowest pH value (moderately acidic).
Dashed red line is the neutral pH value (pH=7), thus facilitating a simple classification of the formulations as acidic, neutral or basic. All tested formulations presented pH values within the dermatologically acceptable range (4.5–8), suggesting adequate skin compatibility and a low risk of irritation.
3.3. Physicochemical Characterization
In the oleogels series, control formulations based on glyceryl dibehenate and various oily phases (sunflower oil, olive oil, isopropyl myristate, and diethylene glycol monoethyl ether - DEGEE) presented as soft, oily, white to yellowish-white, slightly to opaque, homogenous soft gels, with an odor characteristic of the liquid component of the composition.
When absolute ethanol or 70% ethanol plant extract was incorporated into the oleogel vehicle, the vegetal extract imprinted its characteristic color and smell. Similarly, in the poloxamer 407-based hydrogels series, the plant extract imprinted its specific color and smell to the control hydrogel, which was clear, colorless, and odorless. The measured pH values for all studied gels are depicted in Figure 3. Among the blank oleogel formulations, systems containing sunflower oil, olive oil, and isopropyl myristate showed pH values between 6.41±0.078 and 7.25±0.136, indicating slightly acidic (Blank OG SFO and Blank OG IPM) and neutral (Blank OG OO) preparations. The pH of the oleogel based on DEGEE was lower (4.34±0.251), indicating moderate acidity. This low pH value is attributed to DEGEE, a polar protic solvent. The pH of a 10% DEGEE aqueous solution measured within this study was 4.39±0.028.
In sunflower oil-based oleogels, formulations OG2, OG3, and OG8 containing frankincense extract, basil extract, or elderberry bark extract in absolute ethanol showed moderately to slightly acidic pH values lower than the control oleogel, while formulation OG1 with frankincense extract in 70% ethanol presented a neutral pH slightly higher than the plain oleogel (Figure 3). Likewise, based on olive oil (OG6, OG7), IPM (OG4), and DEGEE (OG5) oleogels loaded with extracts exhibited lower pH values (between 4.58±0.005 and 4.86±0.144) compared to corresponding plain oleogels (Figure 3). For poloxamer 407-based hydrogels, formulations which containing hydroalchoholic extract of frankincense (HG-PL 1) or absolute ethanol extract of frankincense (HG-PL 2) exhibited insignificantly different pH values (6.22±0.075 and 6.23±0.033) compared to the blank hydrogel (6.43±0.125). In contrast, HG-PL 3 and HG-PL 4 containing basil extract in absolute ethanol or 70% ethanol showed significantly lower pH values (5.22±0.043 and 4.54±0.073 respectively). Also, a lower pH values compared to the control hydrogel were observed for formulations HG-PL 5, HG-PL 7, and HG-PL 8 containing elderflower extract in 70% ethanol or absolute ethanol, and elderberry bark extract in absolute ethanol (4.93±0.018, 4.95±0.004, and 4.61±0.005 respectively). Absolute ethanol extract of lady’s bedstraw also significantly decreased the hydrogel pH from 6.43±0.125 to 4.54±0.047 (Figure 3).
3.4. Rheological Characterization
Rheological measurements (Figure 4, Figure 5, Figure 6, Figure 7 and Figure 8, Table 6) demonstrated that all plant extract-loaded gels exhibited pseudoplastic (shear-thinning) behavior, characterized by rapid viscosity reduction upon increasing shear rate.
The plant extract-loaded formulations had significantly higher initial viscosity and thixotropy than control gels, indicating enhanced applicability, improved persistence, and controlled bioactive compound release. Detailed rheological profiles, including viscosity and thixotropy data, are clearly presented in Figure 4, Figure 5, Figure 6, Figure 7 and Figure 8 and Table 6.
Rheological characterization of the sunflower oil-based oleogel (Blank-OG-SFO) as a control formulation for topical application.
The figure illustrates the brand a curve for the sample as “Blank-OG-SFO,” and the graph shows the importance of shear stress (τ, expressed in Pa) and dynamic viscosity (η, expressed in Pas) in terms of shear rate (γ, expressed in 1/s). Thus, in Figure 1, a rapid decrease in viscosity is observed with increasing shear rate, indicating a pseudoplastic rheological behavior (shear-thinning). In parallel, the shear stress gradually increases with increasing shear rate. These characteristics suggest that the analyzed sample is a viscoelastic formulation suitable for topical or cosmetic applications that require good application and surface area.
The formulations OG 1 and OG 2 show considerably higher initial values of shear stress (τ in Pa) and dynamic viscosity (η in Pas) compared to the control formulation (Blank-OG-SFO). The two samples, the formulation OG 1 (frankincense extract in 70% ethanol) shows the highest initial values, suggesting a higher viscosity and initial tension, which gives it a firmer consistency and a more adherent and persistent application on the skin surface compared to OG 2.
Both formulations demonstrate a clear pseudoplastic rheological behavior, characterized by a sharp decrease in viscosity as the shear rate increases (“shear-thinning”). The pseudoplastic behavior is more pronounced in the case of the OG 1 sample, suggesting that it has a more pronounced internal structure and a greater capacity to recover and maintain its shape after application, being suitable for applications requiring high skin protection, prolonged persistence, and a possible slow and sustained release of the active compounds.
In contrast, the OG 2 formulation (incense extract in 99.5% ethanol), although it has a high initial viscosity compared to the control (Blank-OG-SFO), is lower than those of the OG 1 sample. This makes OG 2 easier to distribute and has a lower persistence on the skin surface than OG 1, being more suitable for applications where faster absorption and easier distribution of the active substances are required.
Compared to the control formulation (Blank-OG-SFO), the two current samples (OG 3 and OG 8) show opposite rheological behaviors, with significant differences in the initial values of shear stress (τ) and dynamic viscosity (η).
The formulation OG 3 (basil extract in 99.5% ethanol) shows much lower initial values of stress and viscosity than the control Blank-OG-SFO, indicating a more fluid consistency, with much easier application and rapid distribution on the skin surface. This formulation is ideal for applications where rapid absorption and a light feeling on application are preferred.
In contrast, the formulation OG 8 (elder bark extract in 99.5% ethanol) demonstrates the highest initial tension and viscosity values among all the previously analyzed formulations (Blank-OG-SFO, OG 1, OG 2 and OG 3). The extremely high initial viscosity of OG 8 suggests an intensely adherent formulation capable of ensuring long-term persistence and controlled release of active compounds, which is ideal for therapeutic applications requiring prolonged and protective effects on the skin.
Compared to the control formulation (Blank-OG-OO), the formulations OG 6 and OG 7 demonstrate higher initial values of shear stress (τ in Pa) and dynamic viscosity (η in Pas). In particular, the formulation OG 6 (Gallium verum extract in ethanol 99.5%) presents the highest initial values, indicating a very viscous and intensely adherent consistency, which suggests its potential to ensure long-term persistence and a controlled and slow release of active substances at the skin level.
The formulation OG 7 (elderflower extract in ethanol 99.5%) has lower initial viscosity and tension values than OG 6 but higher than the control (Blank-OG-OO). The intermediate rheological profile makes it suitable for applications that require a balance between adhesion, persistence and ease of distribution on the skin.
Comparing the control formulations, those based on isopropyl myristate and DEGEE were more viscous than those based on vegetable oils (sunflower oil or olive oil), whereas their degree of thixotropy varied into a relatively narrow domain (5845-8019 Pa/s), except the DEGEE based oleogel presenting a considerably higher thixotropy (54860 Pa/s) (Table 2). In the group of sunflower oil-based oleogels, the formulations with frankincense extract (OG 1 and OG 2) presented similar viscosity values, being 2 times more viscous than the plain formulation, but differed in thixotropy, since the thixotropic character of OG 1 was slightly more pronounced than those of OG 2 and of plain oleogel (Table 2). Also, the oleogel loaded with absolute ethanol extract of elderberry bark (OG 8) showed a 1,5-fold higher viscosity and 1,7-fold higher thixotropy than control formulation. Instead, the oleogel containing basil extract in absolute ethanol produced the lowest viscosity and thixotropy values in this group of oleogels (Table 2). The oleogels loaded with lady’s bedstraw or elderflower extract in absolute ethanol (OG 6, respectively OG 7 formulations) were 2,5 to 3 times more viscous and thixotropic than the corresponding plain oleogel. However, when 70% ethanolic extract of basil was loaded in IPM-based oleogel, a slightly decrease in viscosity and 2.3 times increase in thixotropy were observed. Similarly, the 70% ethanolic extract of elderflower decreased slightly the viscosity of DEGEE-based oleogel but decreased drastically its thixotropy (7 folds) (Table 2).
On the other hand, the viscosity values of all studied poloxamer-based hydrogels were approximately an order of magnitude higher than those of the oleogels (Table 2). In the group of hydrogels, the formulations containing 70% ethanolic extracts of basil and respectively elderflower (HG-PL 4 and HG-PL 5) showed the lowest viscosity, followed closely by the formulations with absolute ethanol extracts of elderberry bark and lady’s bedstraw (HG-PL 8 and HG-PL 6). However, when extracts of frankincense, basil or elderflower in absolute ethanol were loaded into the poloxamer-based hydrogel, systems similar in viscosity with control hydrogel were obtained. The hydrogel containing frankincense extract in 70% ethanol was the most viscous among all experimental hydrophilic gels.
Additionally, the rheograms of these gels presented hysteresis loops, revealing their thixotropic behavior. Incorporation of ethanolic extracts in poloxamer-based hydrogel increased significantly the thixotropy value, except the extract of elderberry bark for which no influence on this parameter was observed. Compared to blank hydrogel, there was a 1.5-3-fold increase in thixotropy values of HG-PL 6, HG-PL 7, HG-PL 3 and HG-PL 4 hydrogel formulations, while in case of HG-PL 5, HG-PL 2 and HG-PL 1 formulations the increase was greater (7.8-9.5 times)
According to Figure 9, above (Blank HG-PL) shows the rheological profile of a Poloxamer 407-based control hydrogel. The formulation demonstrates extremely high initial values for shear stress (τ in Pa) and dynamic viscosity (η in Pas), indicating a very pronounced viscous consistency. The observed rheological behavior is typically pseudoplastic (“shear thinning”), reflected by a slight decrease in viscosity with increasing shear rate, which can provide significant persistence in the skin and is suitable for topical applications requiring stability over time, high adhesion and a slow and controlled release of active substances.
Figure 10, proves that the first two hydrogels analyzed (HG-PL 1 and HG-PL 2) present higher initial values for both shear stress (τ in Pa) and dynamic viscosity (η in Pas) compared to the Blank HG-PL.
In particular, the hydrogel HG-PL 1 (frankincense extract in 70% ethanol) demonstrates the highest initial viscosity and shear stress values, indicating a highly viscous, strongly adherent, and stable formulation. This makes the hydrogel HG-PL 1 ideal for applications requiring high persistence, stability, and controlled, slow release of active compounds on the skin surface.
Although the hydrogel HG-PL 2 (incense extract in 99.5% ethanol) shows lower viscosity and initial tension values than HG-PL 1, it is still more viscous than the control (Blank HG-PL). Thus, this formulation can ensure good adhesion and applicability and is suitable for topical applications that balance adhesion and easy distribution.
Figure 11.
Comparative flow and viscosity profiles of the hydrogels HG-PL 3 (basil extract in 99.5% ethanol) and HG-PL 4 (basil extract in 70% ethanol) compared to the control hydrogel (Blank HG-PL).
Figure 11.
Comparative flow and viscosity profiles of the hydrogels HG-PL 3 (basil extract in 99.5% ethanol) and HG-PL 4 (basil extract in 70% ethanol) compared to the control hydrogel (Blank HG-PL).
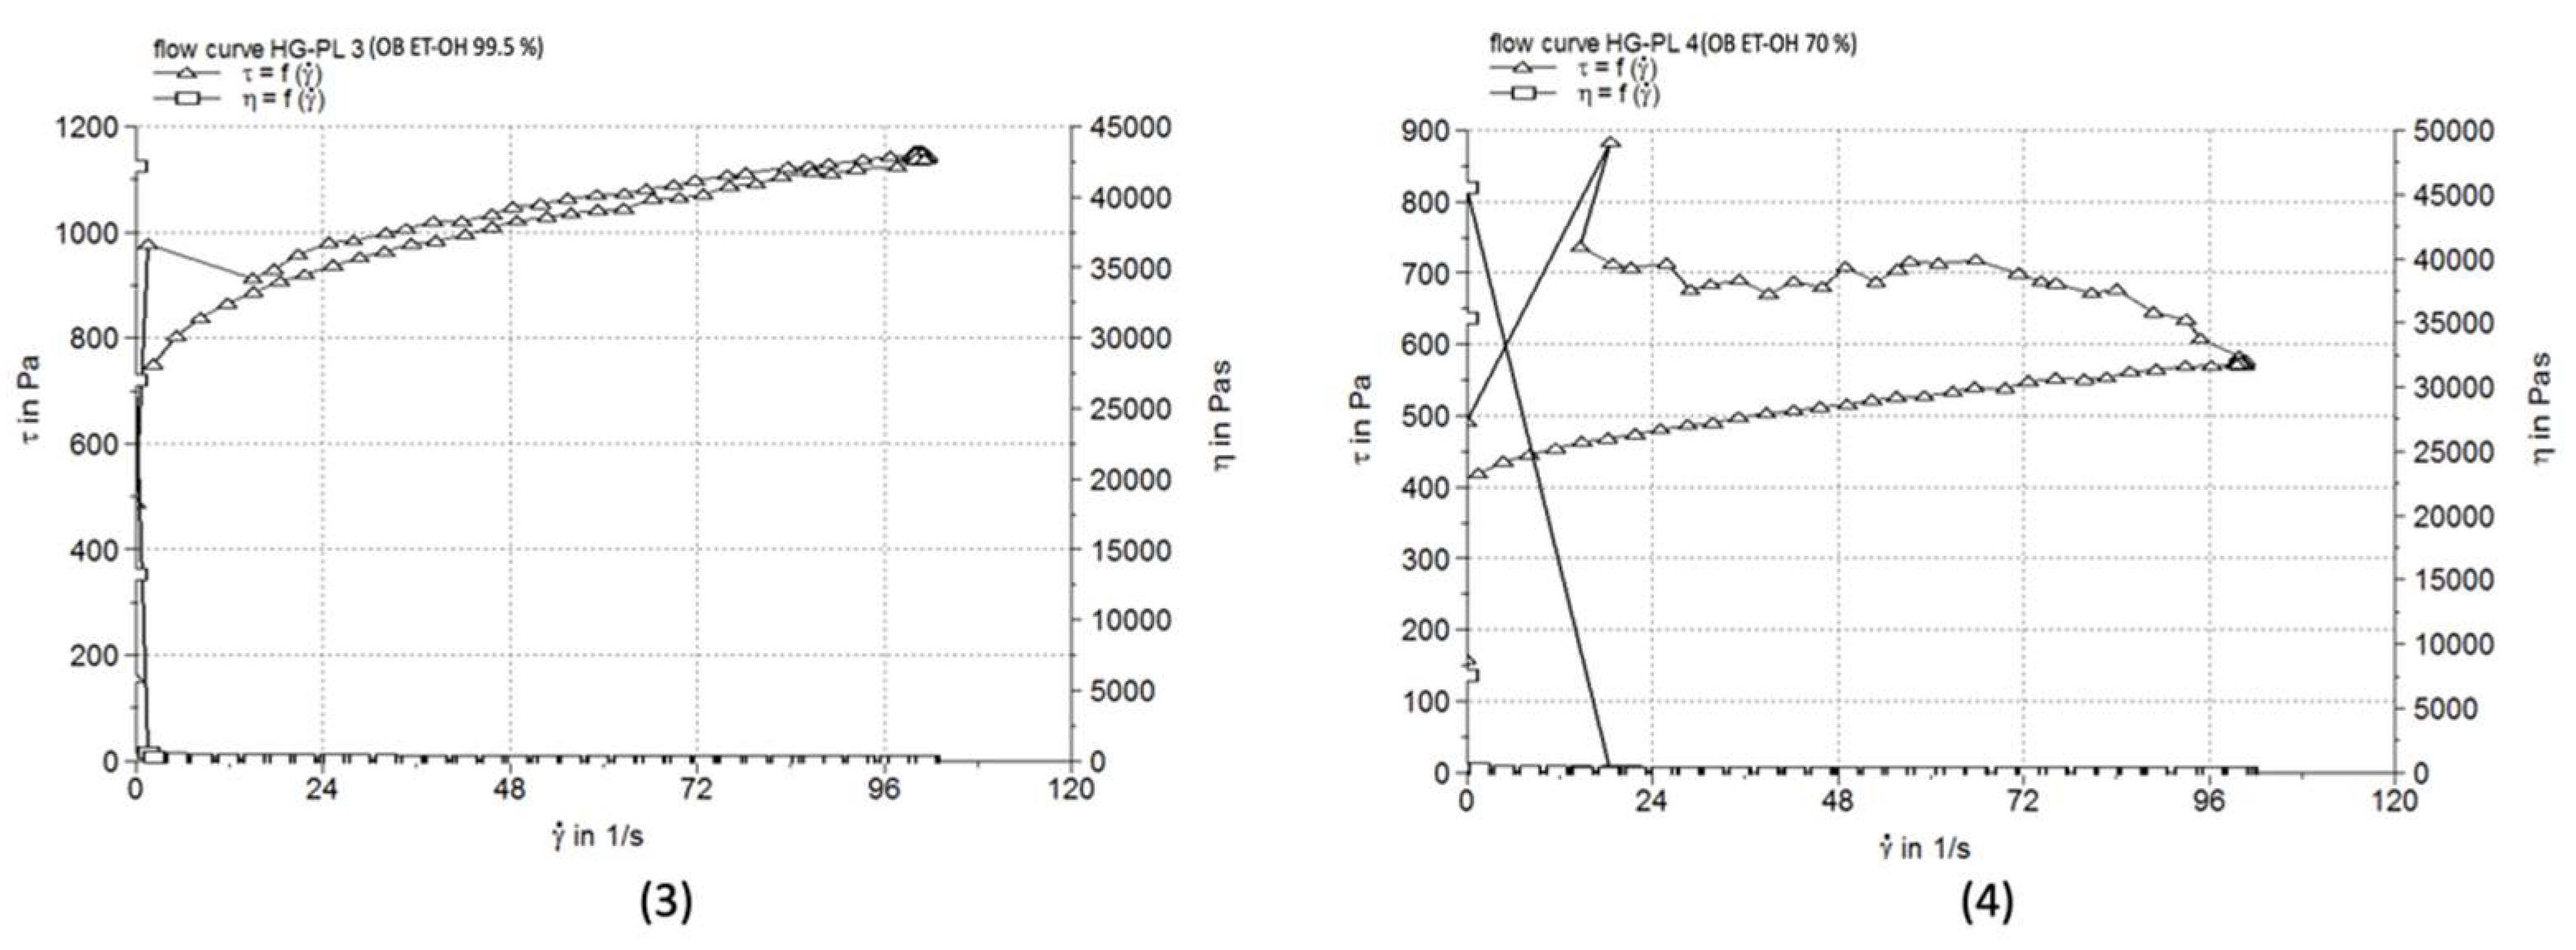
The formulations (HG-PL 3 and HG-PL 4) show relatively close initial values, but still slightly lower in terms of shear stress (τ in Pa) and dynamic viscosity (η in Pas). Compared to the control hydrogel (Blank HG-PL). The formulation HG-PL 3 (basil extract in 99.5% ethanol) presents initial values of viscosity and stress close to the control hydrogel, suggesting that this formulation maintains a high consistency, suitable for applications requiring good adhesion and persistence on the skin.
In contrast, the formulation HG-PL 4(basil extract in 70% ethanol) shows noticeably lower initial values, demonstrating a lower viscosity and a more fluid behavior. This characteristic suggests that HG-PL 4 would be more suitable for topical applications where rapid distribution and easy absorption are important.
Figure 12.
Comparative analysis of the rheological profiles for Poloxamer 407-based hydrogels loaded with 70% ethanol extracts of Lady’s bedstraw (HG-PL 5) and 99.5% ethanol extracts of elderflower (HG-PL 6), compared to the control hydrogel.
Figure 12.
Comparative analysis of the rheological profiles for Poloxamer 407-based hydrogels loaded with 70% ethanol extracts of Lady’s bedstraw (HG-PL 5) and 99.5% ethanol extracts of elderflower (HG-PL 6), compared to the control hydrogel.
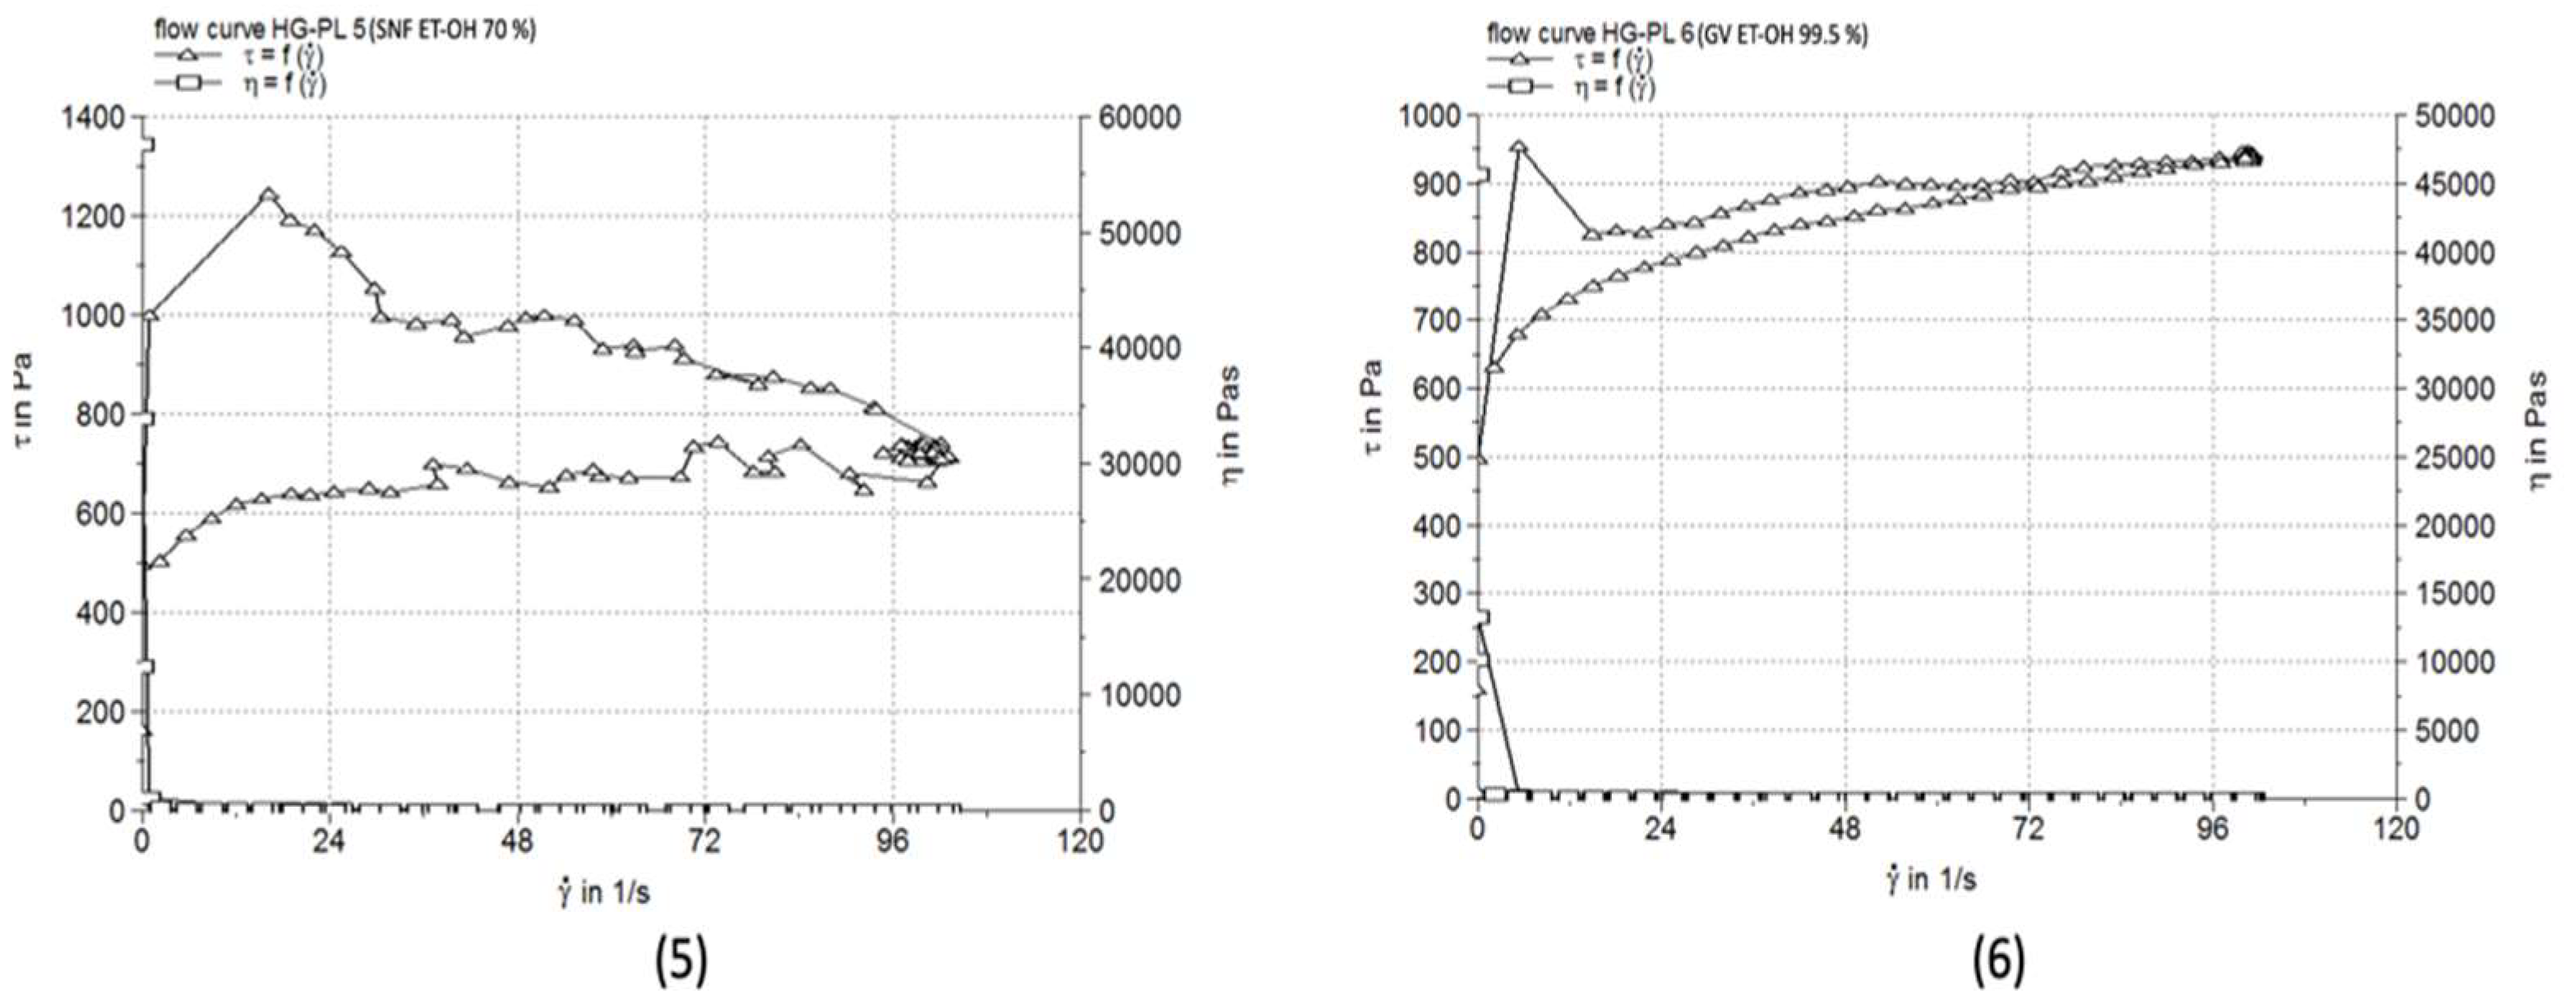
The Lady’s bedstraw 70% ethanol hydrogel extract (HG-PL 5) demonstrates higher initial values of shear stress (τ in Pa) and dynamic viscosity (η in Pas), indicating a significantly more viscous formulation, with improved adhesion and stability compared to the control formulation (Blank HG-PL). These properties make the HG-PL 5 hydrogel suitable for applications requiring long-term persistence and slow and controlled release of active principles.
In contrast, the hydrogel HG-PL 6 (elderflower extract, ethanol 99.5%) has lower initial viscosity and tension values, close to the control’s, suggesting a more fluid consistency and easier applicability. This formulation is ideal for topical applications where faster absorption and comfortable distribution on the skin are preferred.
Figure 13.
Comparative analysis of rheological profiles for Poloxamer 407-based hydrogels loaded with elder bark-branch extracts in 99.5% ethanol (HG-PL 8) and elder flowers in 99.5% ethanol (HG-PL 7), compared to the control hydrogel (Blank HG-PL).
Figure 13.
Comparative analysis of rheological profiles for Poloxamer 407-based hydrogels loaded with elder bark-branch extracts in 99.5% ethanol (HG-PL 8) and elder flowers in 99.5% ethanol (HG-PL 7), compared to the control hydrogel (Blank HG-PL).
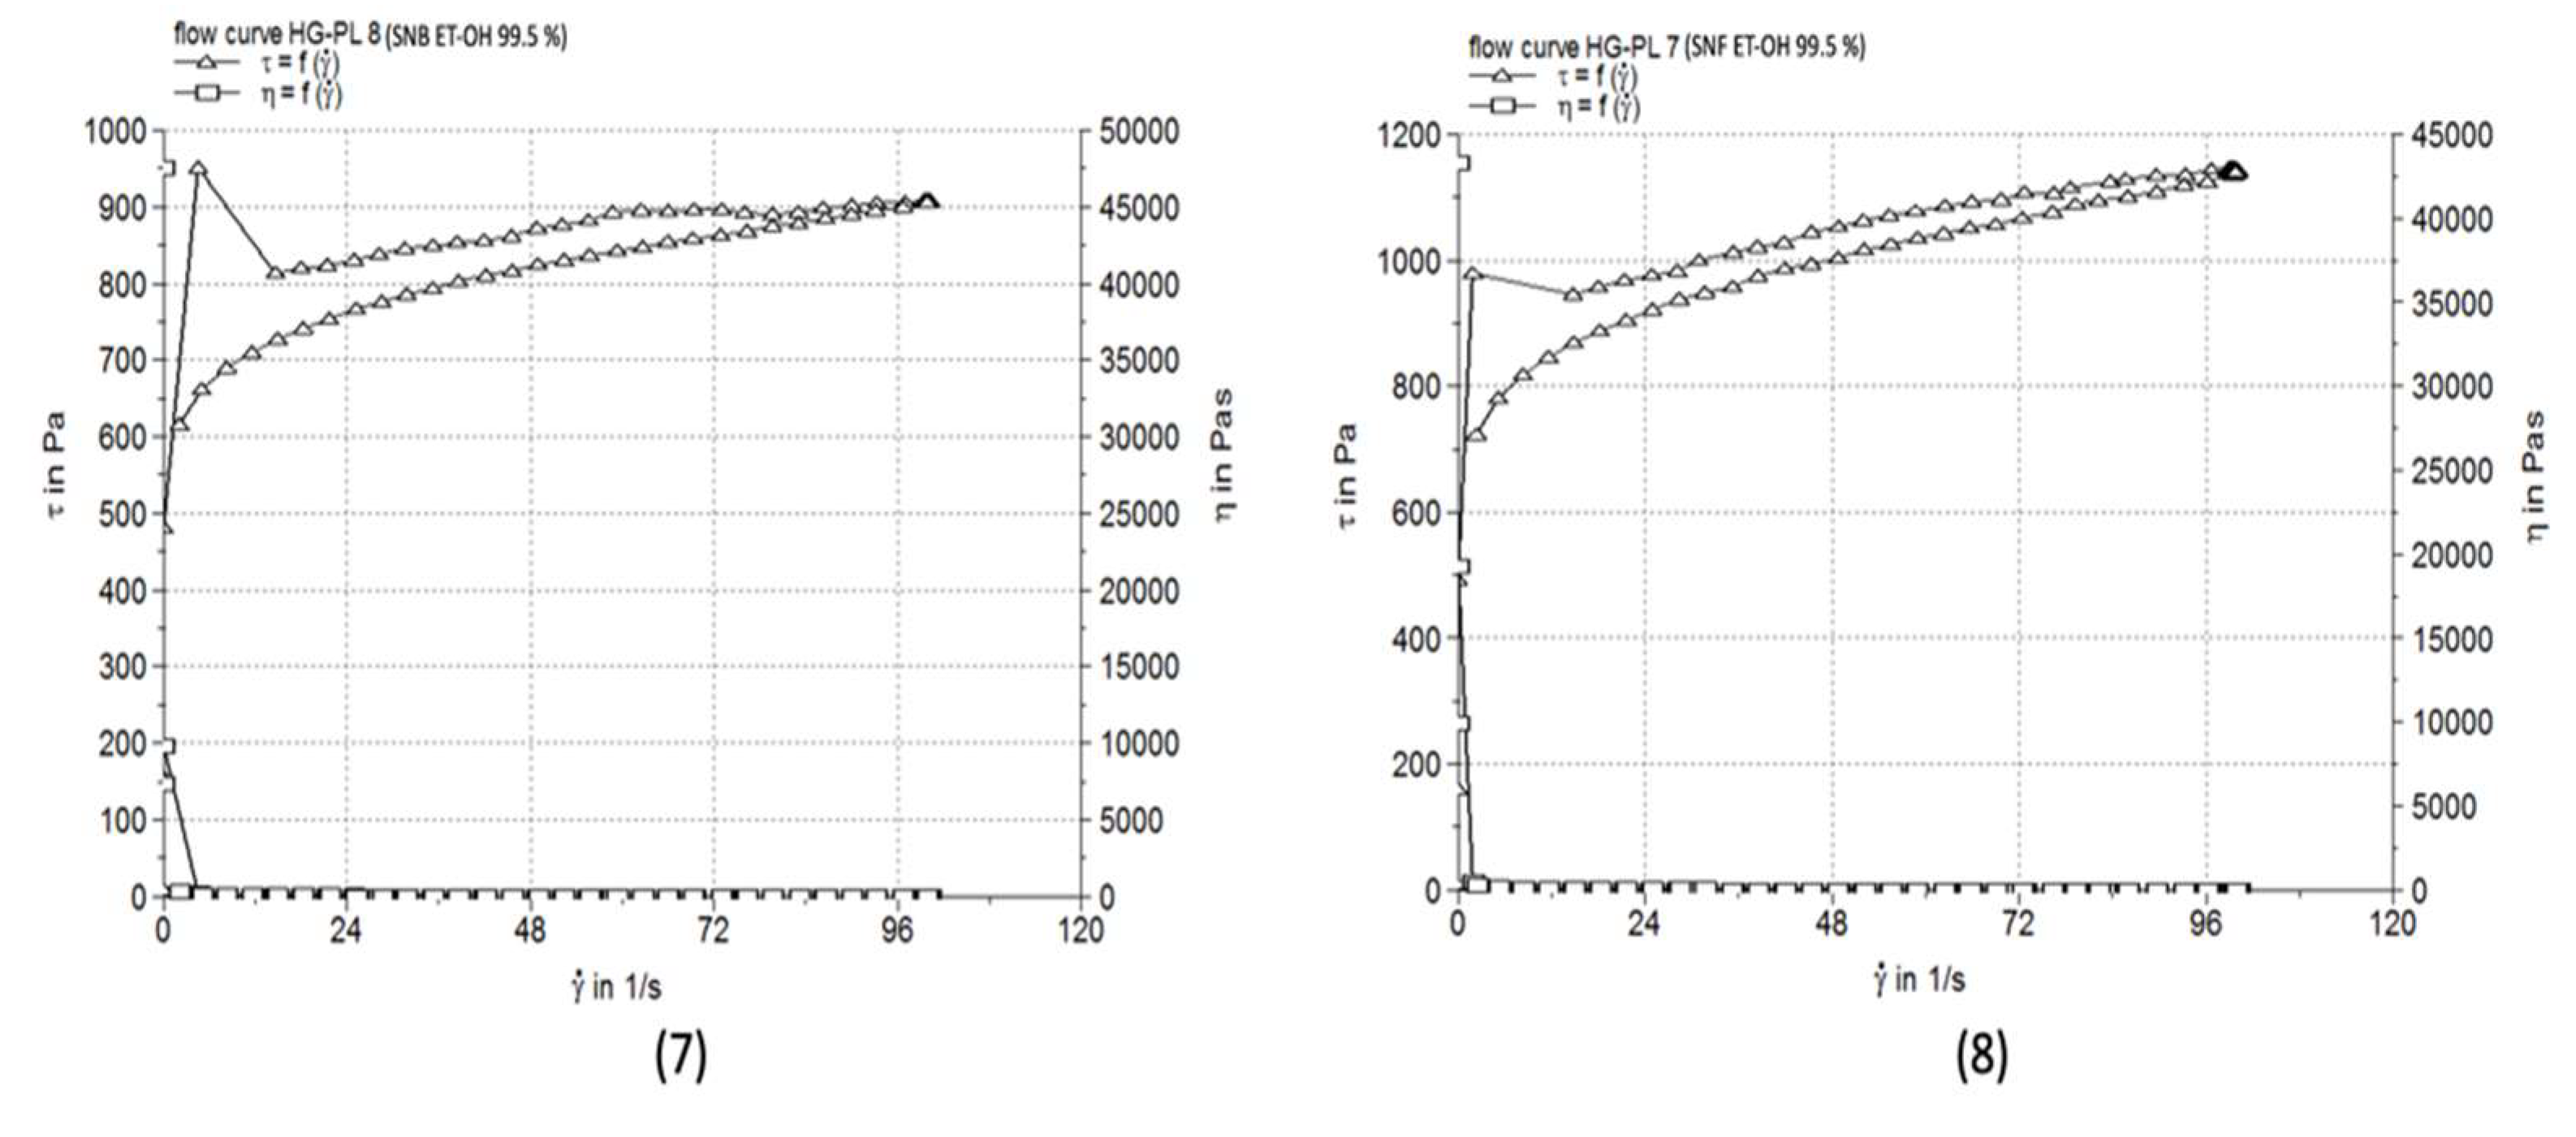
Compared to the control hydrogel (Blank HG-PL), the current formulations (HG-PL 7 and HG-PL 8) present initial values of shear stress (τ in Pa) and dynamic viscosity (η in Pas) relatively similar to the control, indicating close consistencies and comparable rheological behaviors.
The HG-PL 7 hydrogel (elder flower extract, 99.5% ethanol) presents initial viscosity values and stress similar to or slightly lower than the control hydrogel. This suggests a stable formulation, suitable for topical applications that require comfortable applicability and easy distribution on the skin.
The HG-PL 8 hydrogel (elder bark-branch extract, ethanol 99.5%) demonstrates slightly higher initial viscosity and tension values than the control, indicating a slightly more adherent and stable consistency, which could support prolonged persistence and slow release of the active compounds.
The consistency or the structural strength of a semisolid material is the resistance exhibited by a sample to deformation by an applied force. Consistency has two main components, which can be quantified, namely the hardness and the spreadability, both being important properties for topical formulations. The hardness is usually measured by penetrometry and expressed as penetration depth (in mm), based on the inversely proportional relationship between them (a harder semisolid exhibits a lower penetration depth). The spreadability of a topical formulation is usually measured by parallel plate method and is considered an important characteristic, because of its ease of application on the skin and extrudability from the package.
The penetration depth values exhibited by the four plain oleogels were slightly higher than the upper limit generally recommended for white petrolatum (300 mm), which is extensively used as excipient and ointment base for pharmaceutical semisolids. On the other hand, the incorporation of ethanolic vegetal extracts in the oleogel vehicles determined in all cases an approximately 3-fold decrease in the penetration values, which indicates the increase in the consistency of the formulations; however, the formulation with basil extract in absolute ethanol (OG 3) was only 1.4 times more consistent than the oleogel base (penetration value 256.3±4.73 mm versus 370.0±7.24) (Table 6). Similarly, all the plant extract-loaded poloxamer based hydrogels produced lower penetration values than that of plain hydrogel, revealing their higher consistency (Table 6). The differences between these formulations can be attributed primarily to the different chemical composition of the plant extracts and, secondarily, to their ethanolic concentration.
The results of spreadability test are presented in Figure 5 and Figure 6 by plotting the spreading area (in mm2) of gels as function of applied weight (in g) at 25 °C.
Under the pressure of a 750 g weight, the blank oleogel based on SFO showed the highest spreading area (1962.50±2.35 mm2) and consequently the best spreadability among all oleogel bases, whereas the oleogel bases containing IPM, DEGEE or OO produced lower spreading areas (1519.76±1.47 mm2, 1319.59±2.28 mm2 and respectively 1256.00±3.11 mm2) (Figure 14). Except the OG 3 formulation, significant lower spreadability values were measured for all extract-loaded oleogel formulations with respect to those obtained for the corresponding plain oleogels, indicating greater consistency and viscosity (Figure 14). In contrast, the OG 3 formulation presented higher area of spreadability than that of plain oleogel (2640.74±3.51 mm2 versus 1962.50±2.35 mm2), being softer and less viscous (Figure 14).
The effect of decreasing vehicle’s spreadability in the presence of the plant extract was also observed in the series of poloxamer-based hydrogels. Thereby, the values of the spreading area measured for all plant extract-loaded hydrogels varied into a relatively narrow range (from 1074.67±2.85 mm2 to 1319.59±1.44 mm2) but were lower than that of the plain hydrogel (1384.74±1.69 mm2).
Overall, despite the observed differences between plain and extract-loaded gels, it is worth mentioning that all these systems were characterized by appropriate consistency (hardness) and spreadability.
3.5. Comparative pH Evaluation
3.5.1. Association Between Wound pH Category and Burn Surface Area at Specific Timepoints
To investigate the potential influence of the wound pH environment on healing progression at discrete timepoints, the measured pH at each burn site was categorized as Acidic (<6), Neutral (6.0–7.0), or Basic (>7.0) on Days 1, 4, 9, 14, and 21 post-burn. Burn surface area (mm²) was compared across these pH categories for each respective day using the Kruskal-Wallis test.
On Day 1, all burn surface areas were uniformly 200 mm², precluding statistical comparison across pH categories. On Day 4, no significant difference in burn surface area was observed among the pH categories (p = 0.297).
Figure 16.
Progression of skin surface pH over time by topical cream formulation.
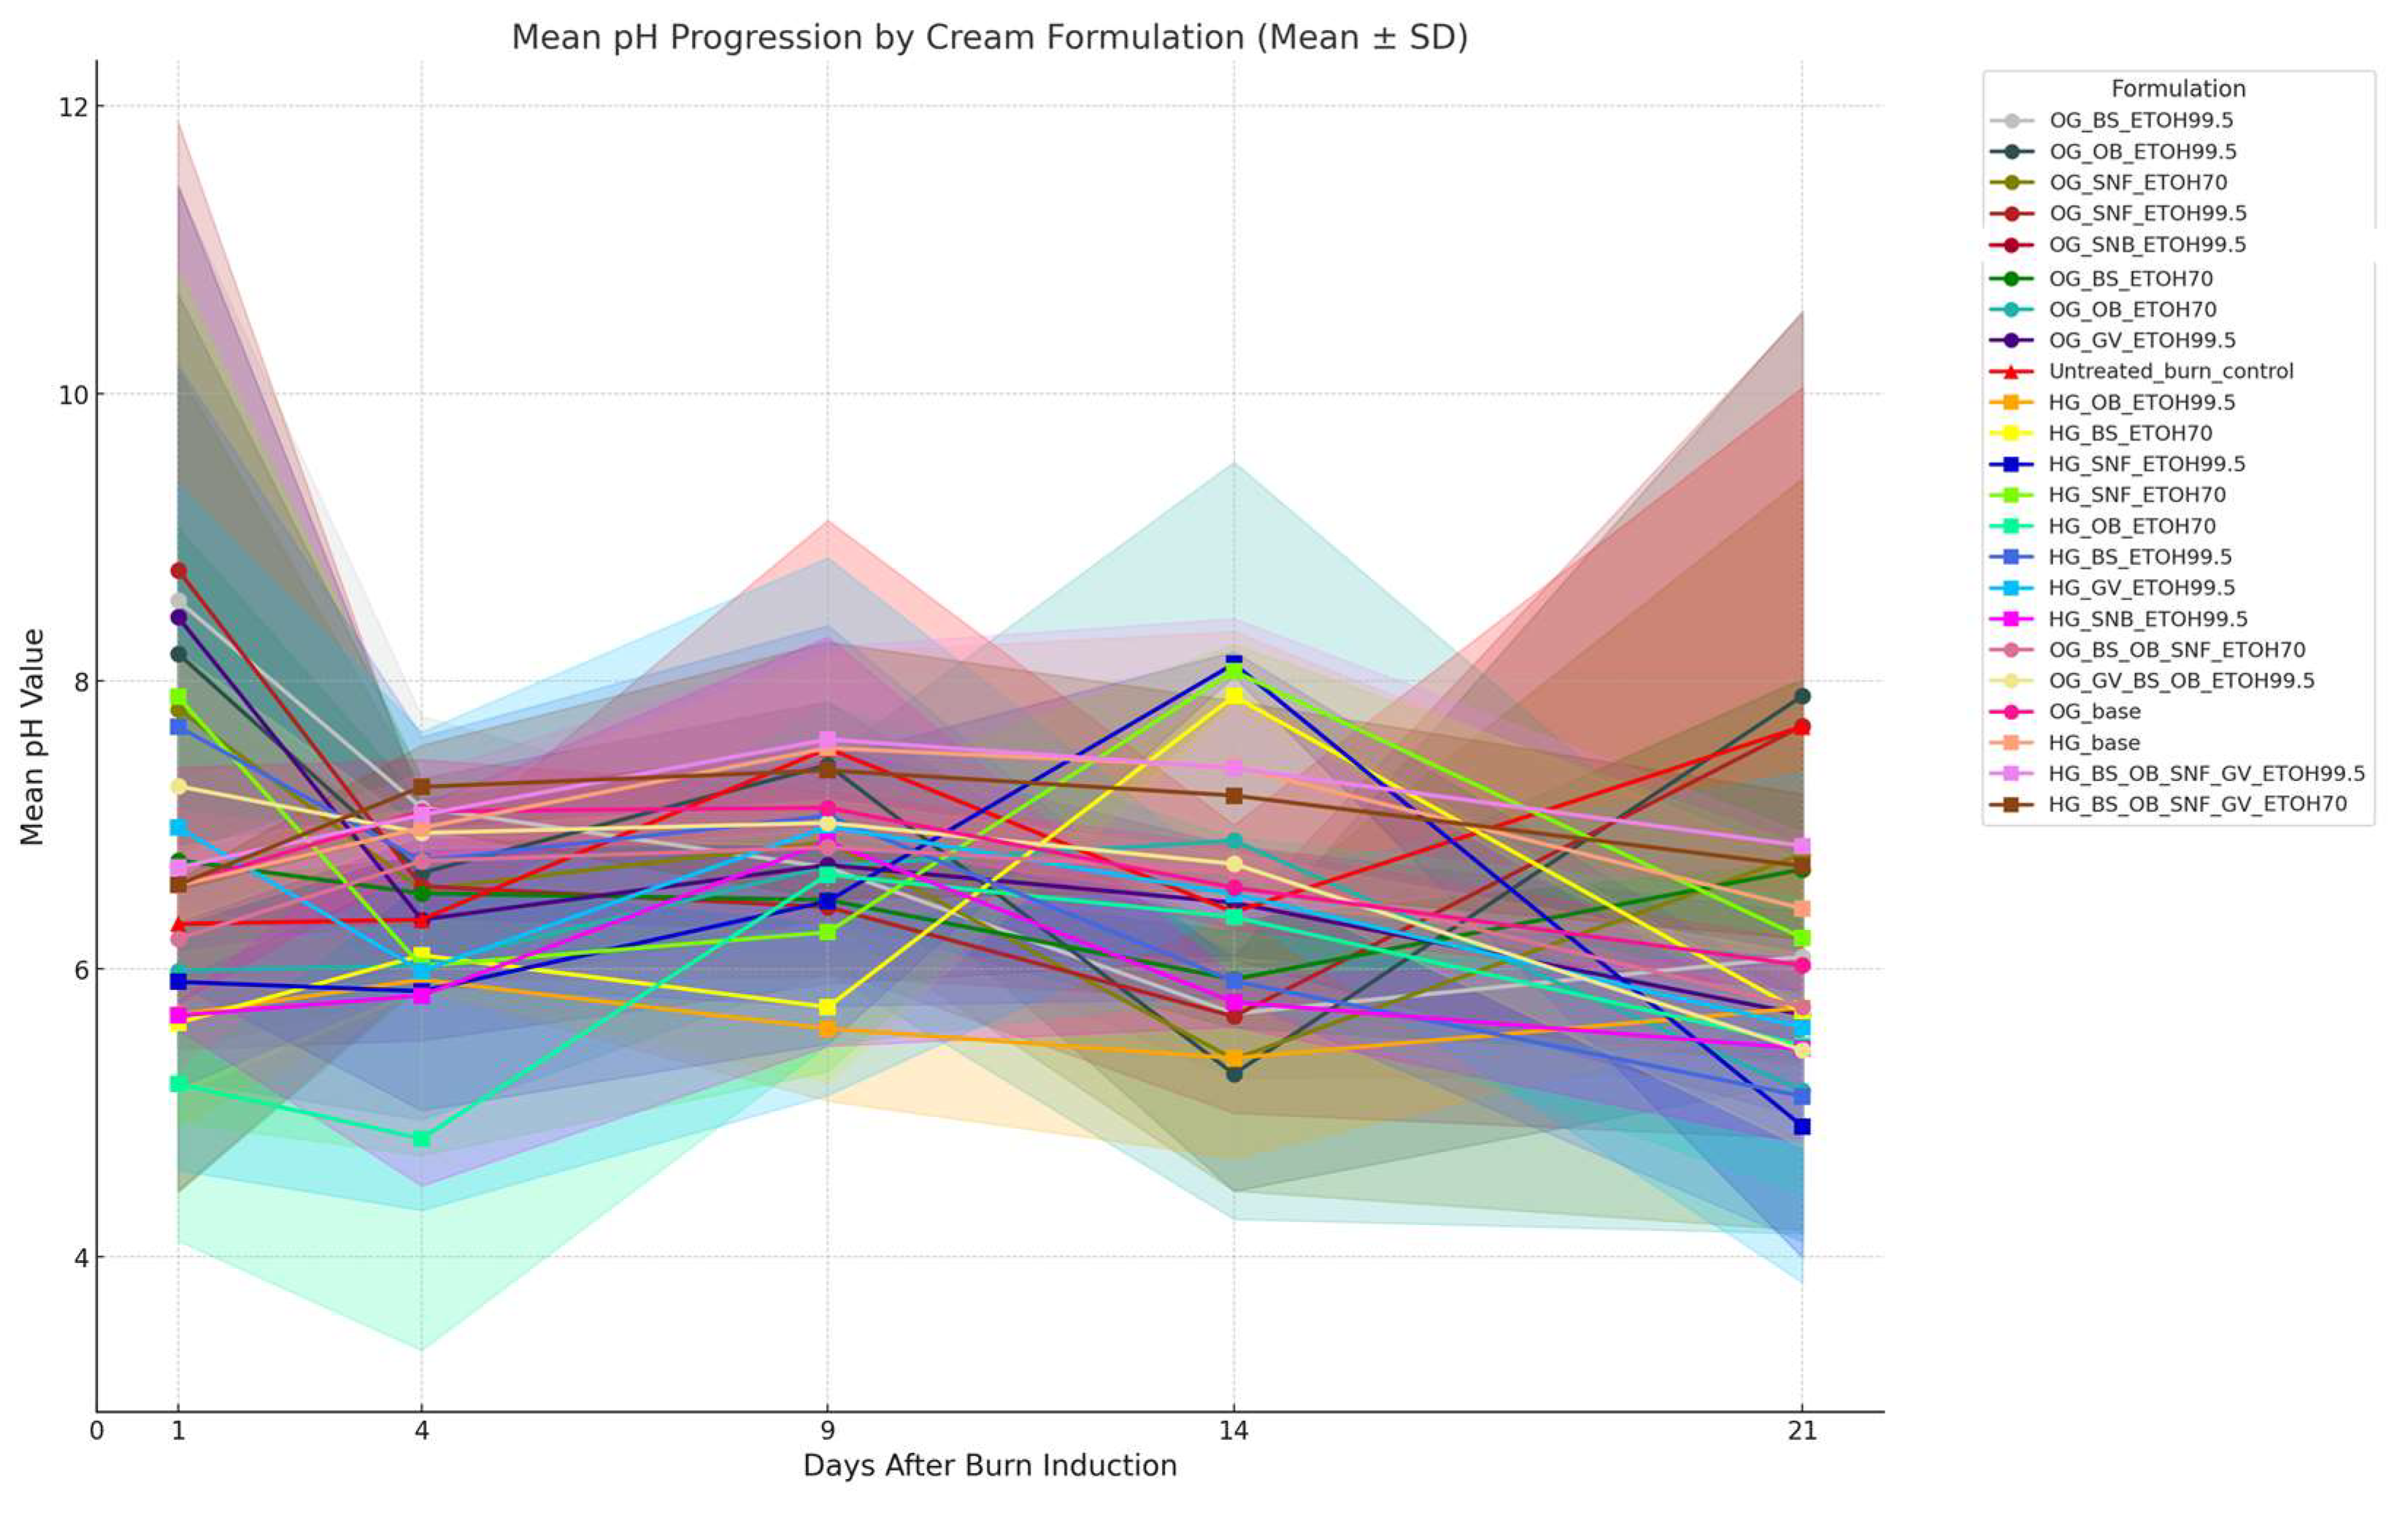
The figure illustrates the progression of mean skin surface pH values (± standard deviation) over a 21-day period following burn induction for topical cream formulations containing different plant extracts (Ocimum basilicum – OB, Sambucus nigra – SN, Boswellia serrata – BS, Gallium verum – GV), formulated as oleogels (OG) and hydrogels (HG) with varying ethanol (EtOH) concentrations.
Figure 17.
Skin surface pH distribution by treatment formulation type before and after burn injury.
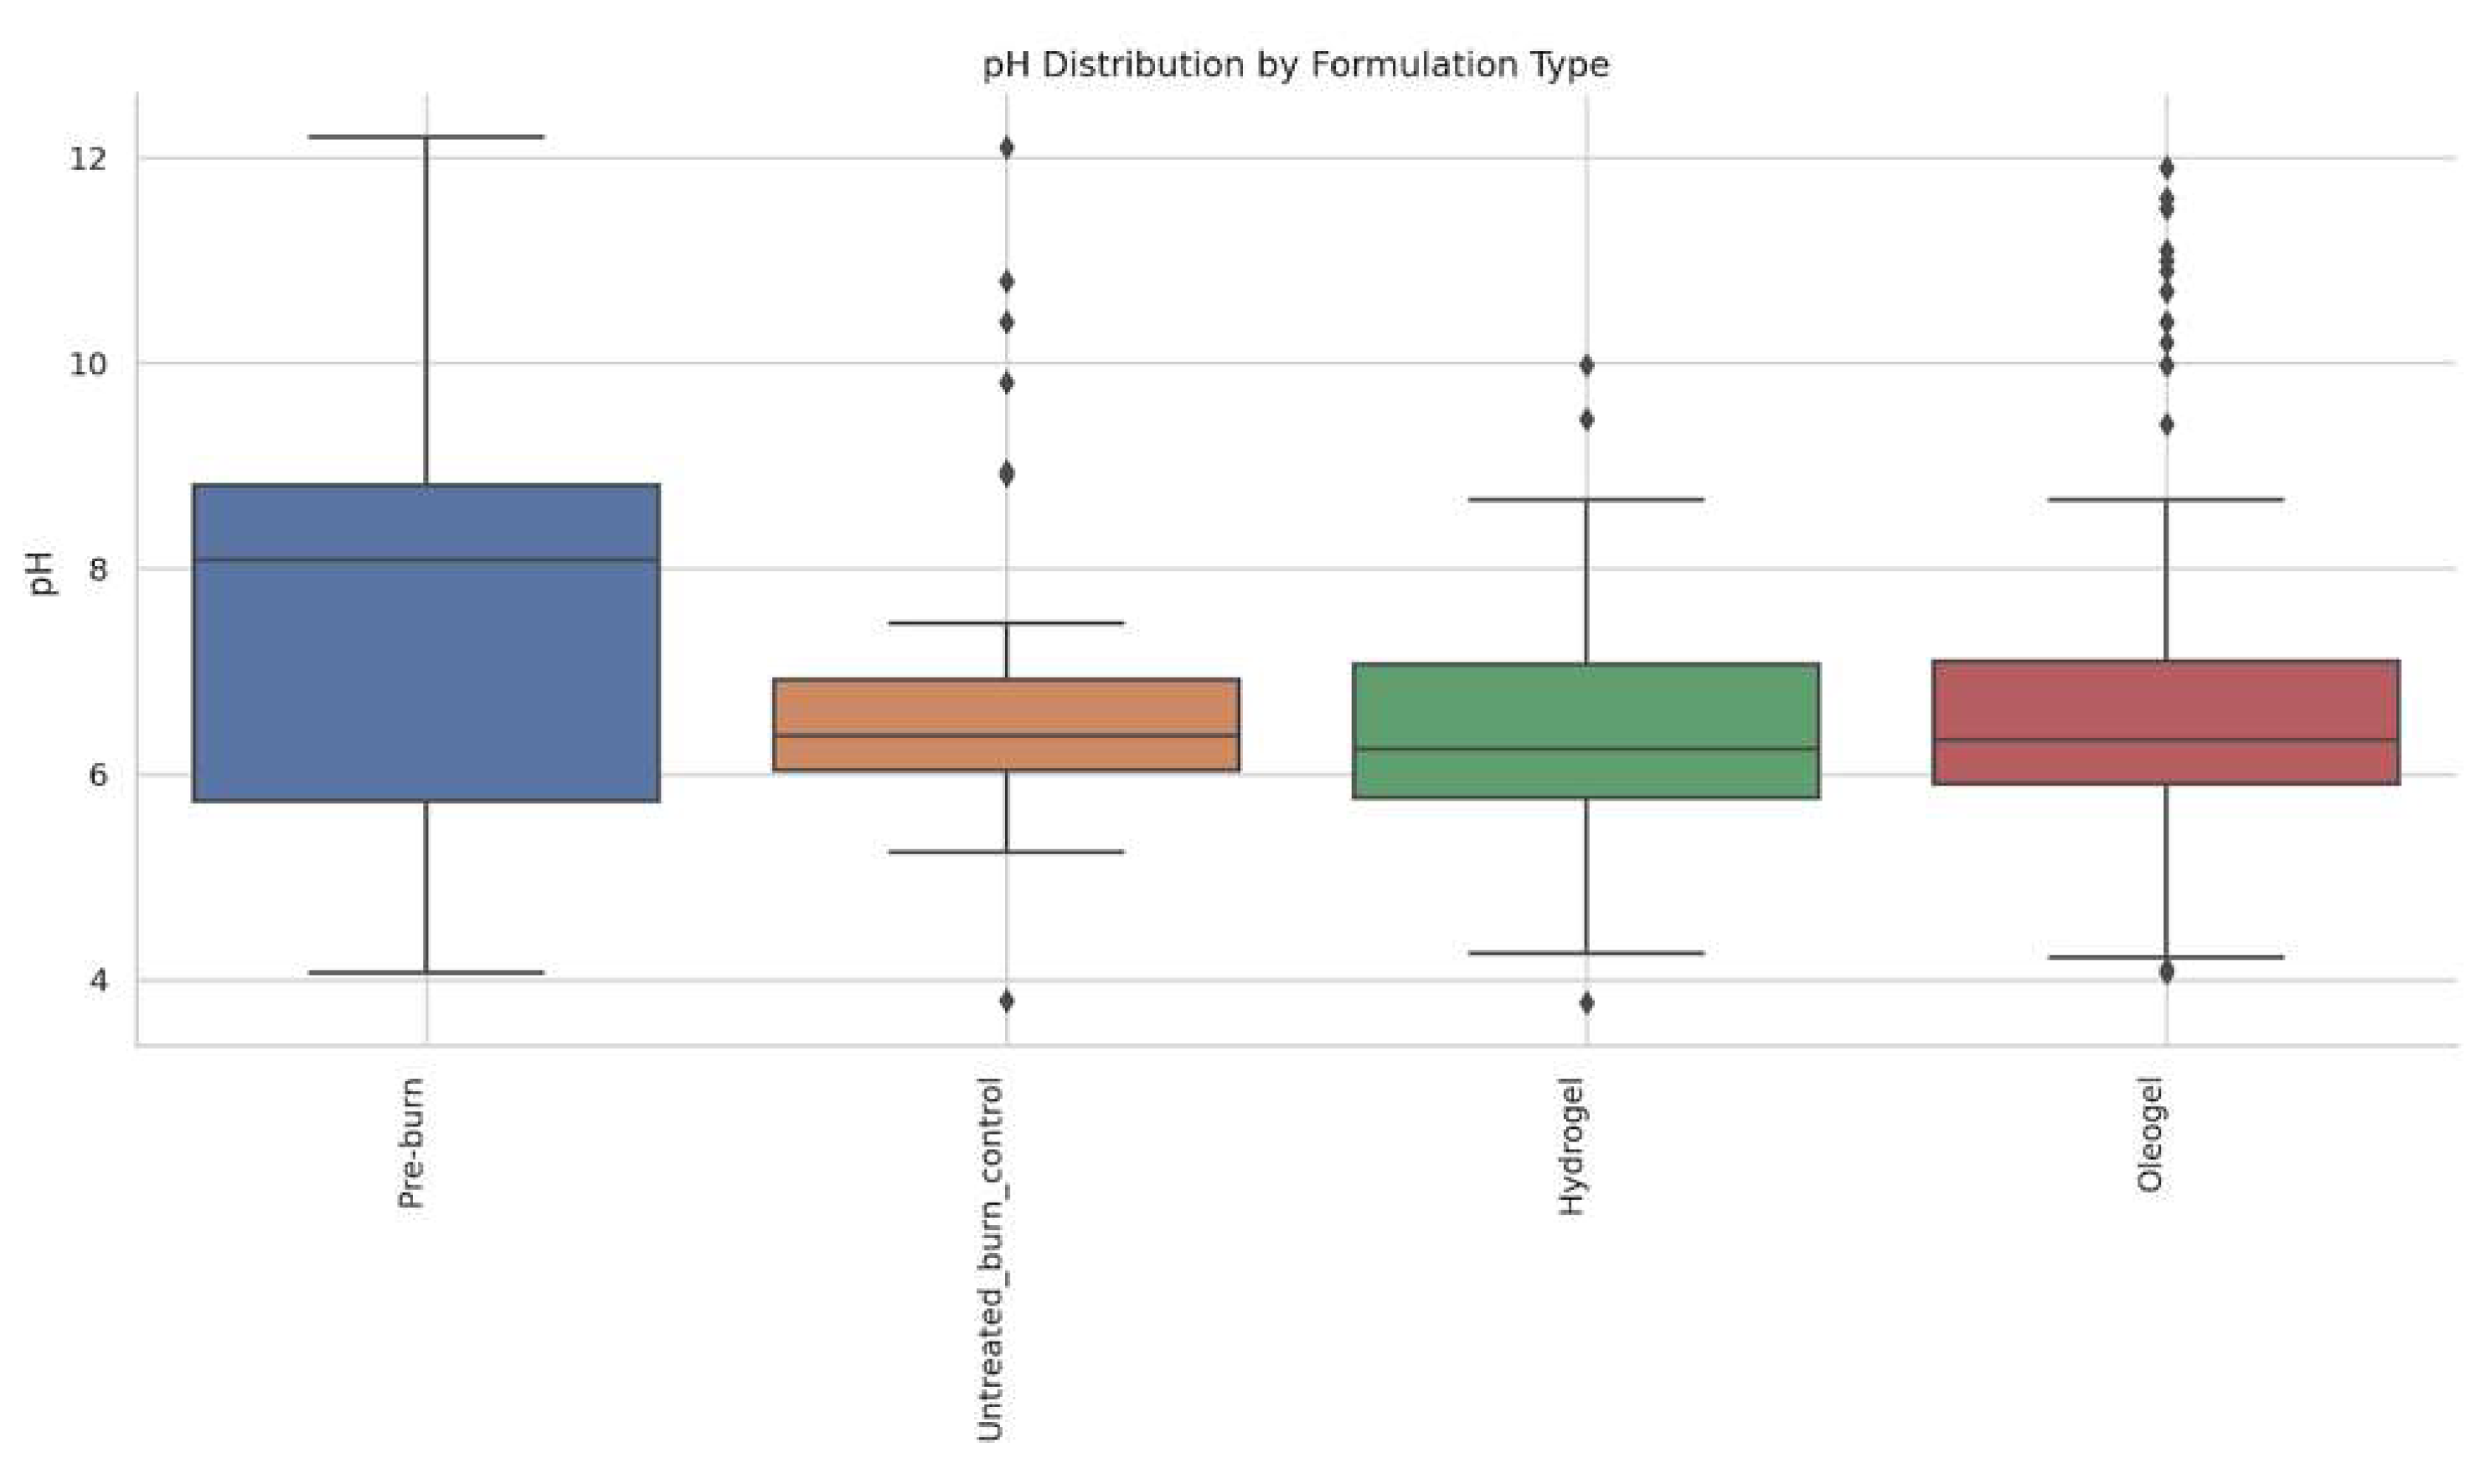
Box plot illustrating the distribution of skin surface pH values grouped by treatment formulation types: pre-burn (baseline), untreated burn control, hydrogel, and oleogel formulations. Horizontal lines within boxes represent median values; boxes indicate interquartile ranges; whiskers show the range excluding outliers, and diamonds represent outliers. The variability in pH among different formulations indicates the potential impact of treatment type on the skin’s pH and consequently on the healing environment.
Figure 18.
Effect of topical formulation pH on burn surface area at Day 4 post-burn.
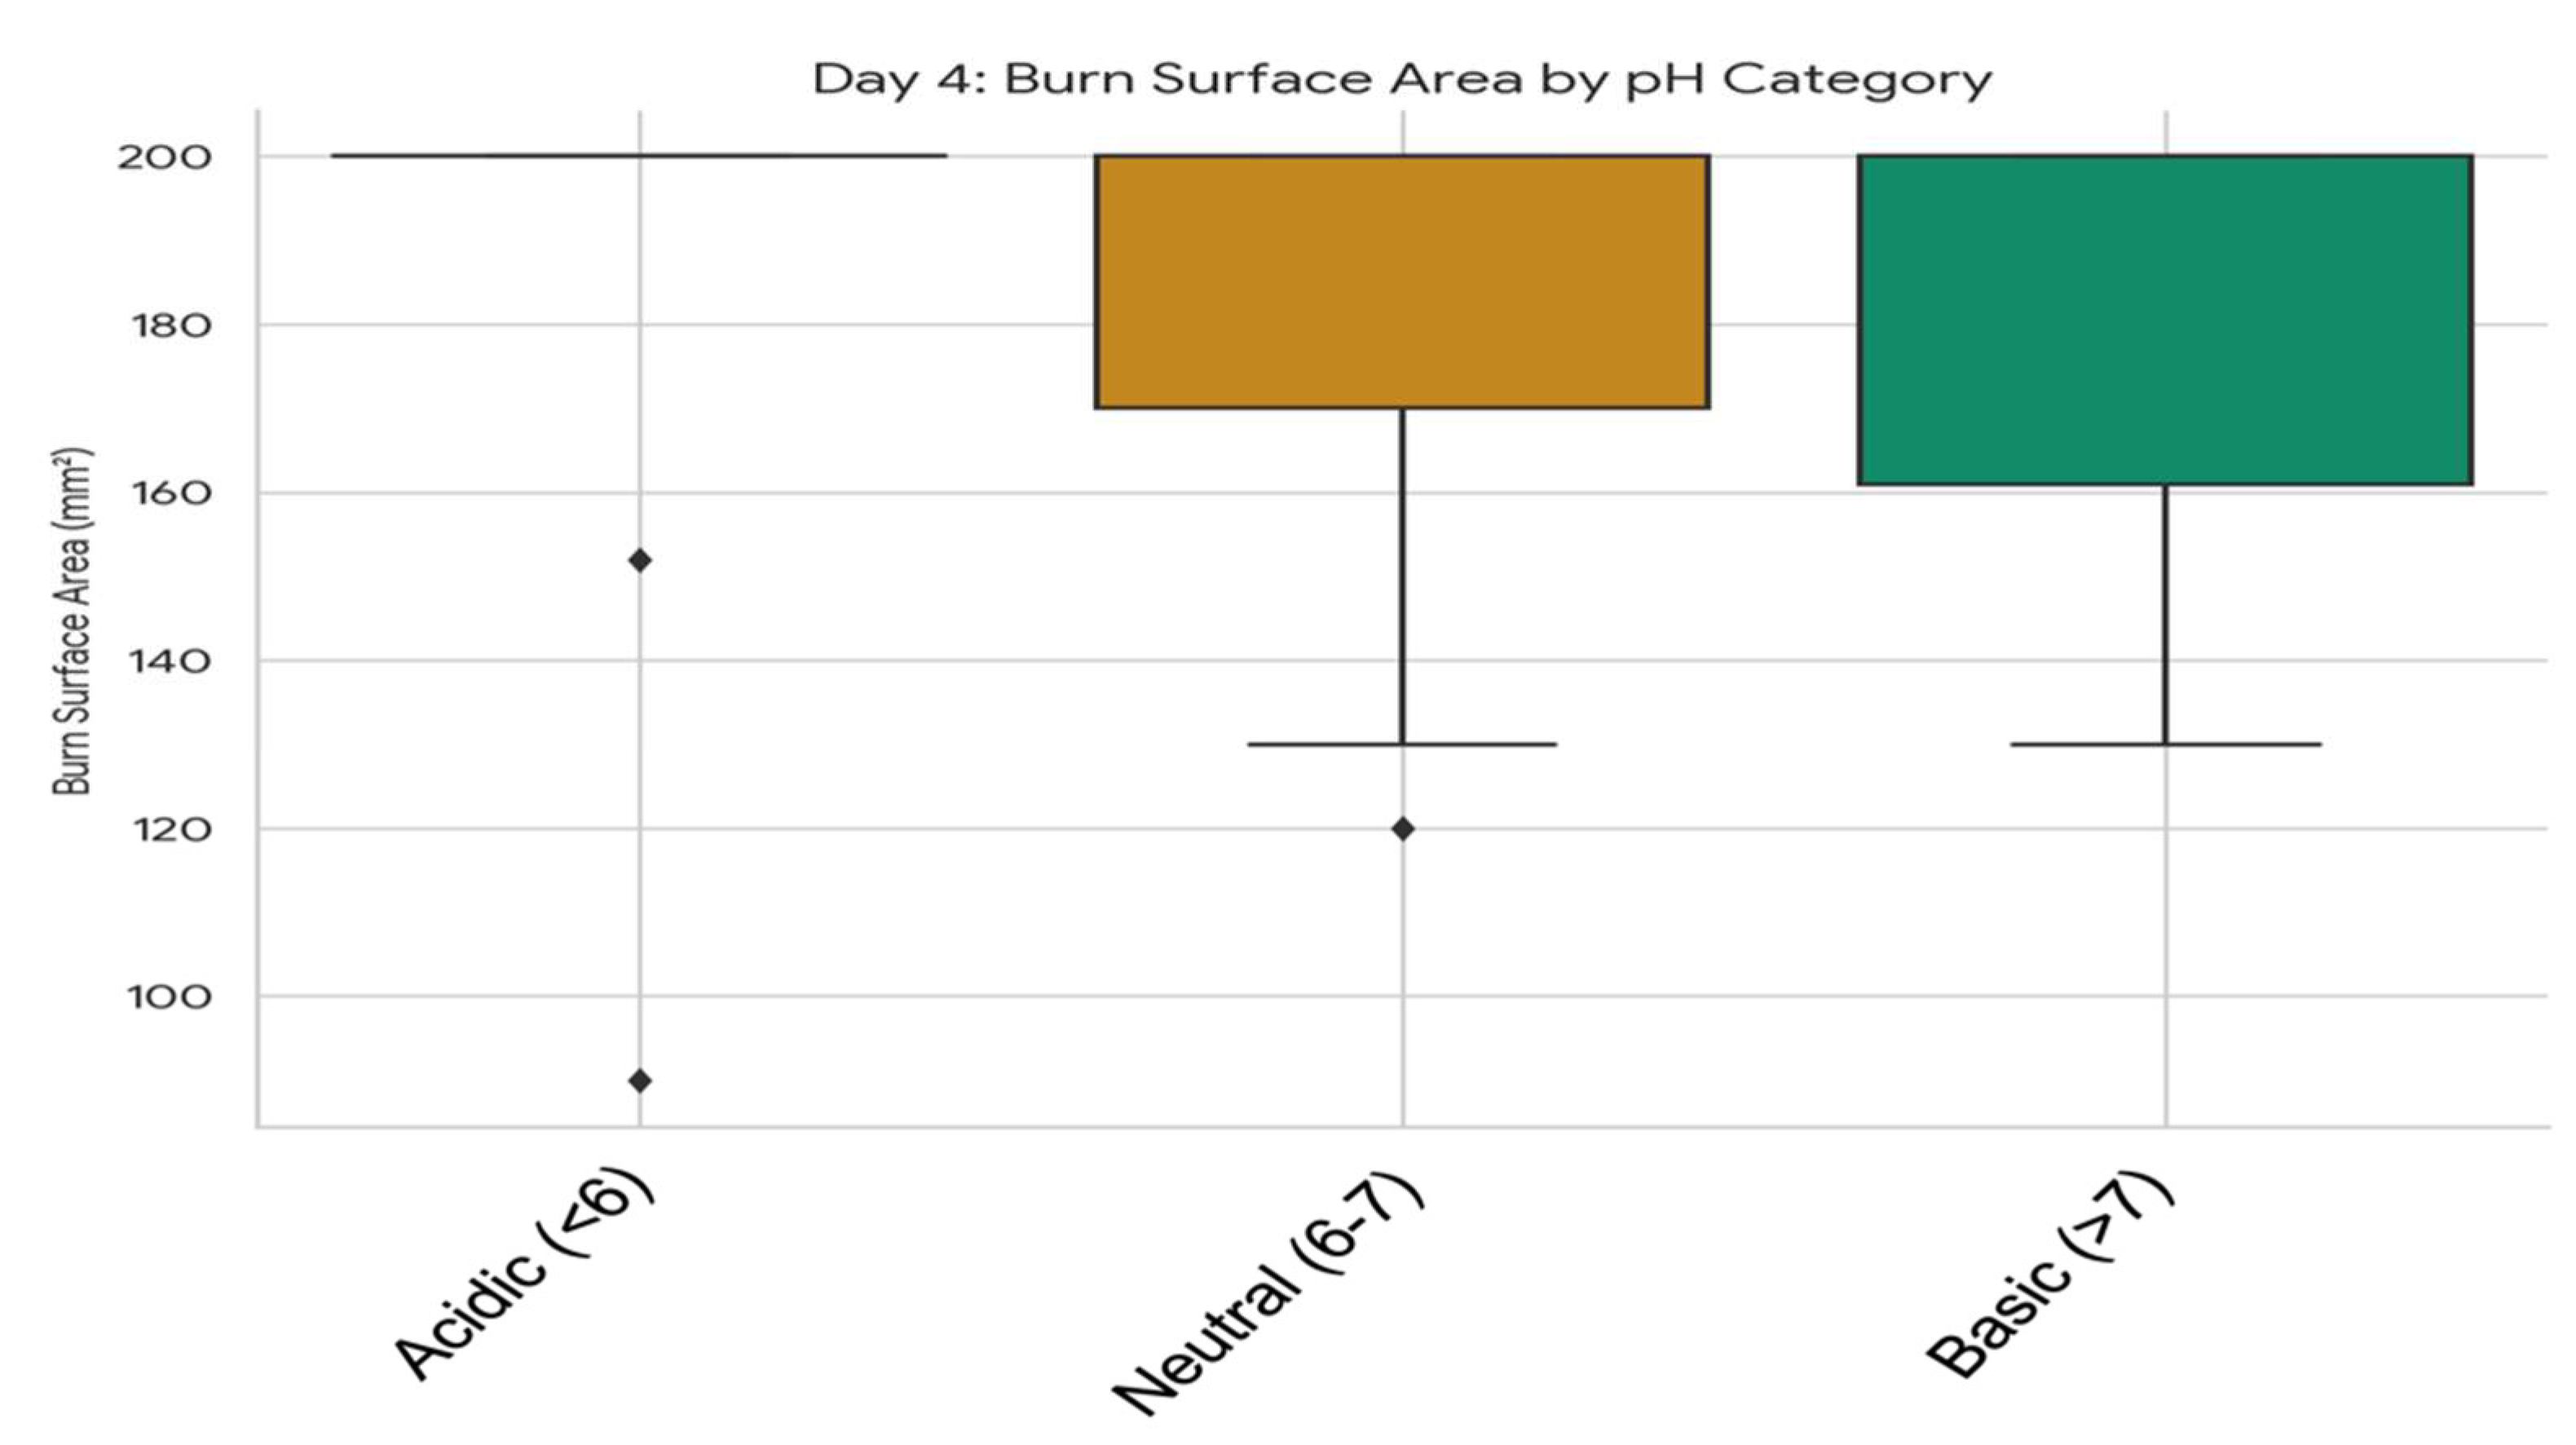
Box plot illustrating the burn surface areas (mm²) at day 4 post-injury, categorized by topical formulation pH: acidic (pH < 6), neutral (pH 6–7), and basic (pH > 7). Boxes represent the interquartile range, horizontal lines within boxes denote median values, whiskers show the range of the data excluding outliers, and diamonds indicate outliers. Lower surface area values indicate better healing progression.
However, statistically significant differences emerged at intermediate timepoints. On Day 9, a significant difference in burn surface area was found across pH categories (p = 0.025). Visual inspection of the data distribution (See Figure 19) suggested that burns exhibiting an acidic pH (<6) on this day generally had smaller surface areas compared to those with neutral or basic pH. This association was more pronounced on Day 14, where a highly significant difference in burn surface area was detected among pH categories (p < 0.001). Burns measured with an acidic pH (<6) on Day 14 consistently showed smaller surface areas relative to burns with neutral or basic pH (See Figure 20).
Box plot showing burn surface areas (mm²) measured on day 14 post-injury, categorized by the pH of applied topical formulations: acidic (pH < 6), neutral (pH 6–7), and basic (pH > 7). The horizontal lines inside the boxes represent median values; boxes indicate interquartile ranges; whiskers show the range of data excluding outliers, while diamonds indicate outliers. Smaller surface area values correspond to improved burn healing.
By Day 21, although considerable healing had occurred across all groups, the differences in burn surface area among the pH categories measured on this final day were no longer statistically significant (p = 0.673).
These findings indicate a statistically significant association between an acidic wound environment (pH < 6) and reduced burn surface area during the intermediate stages (Days 9 and 14) of the observation period in this model.
Figure 21.
Effect of topical formulation pH on burn surface area at Day 21 post-burn.
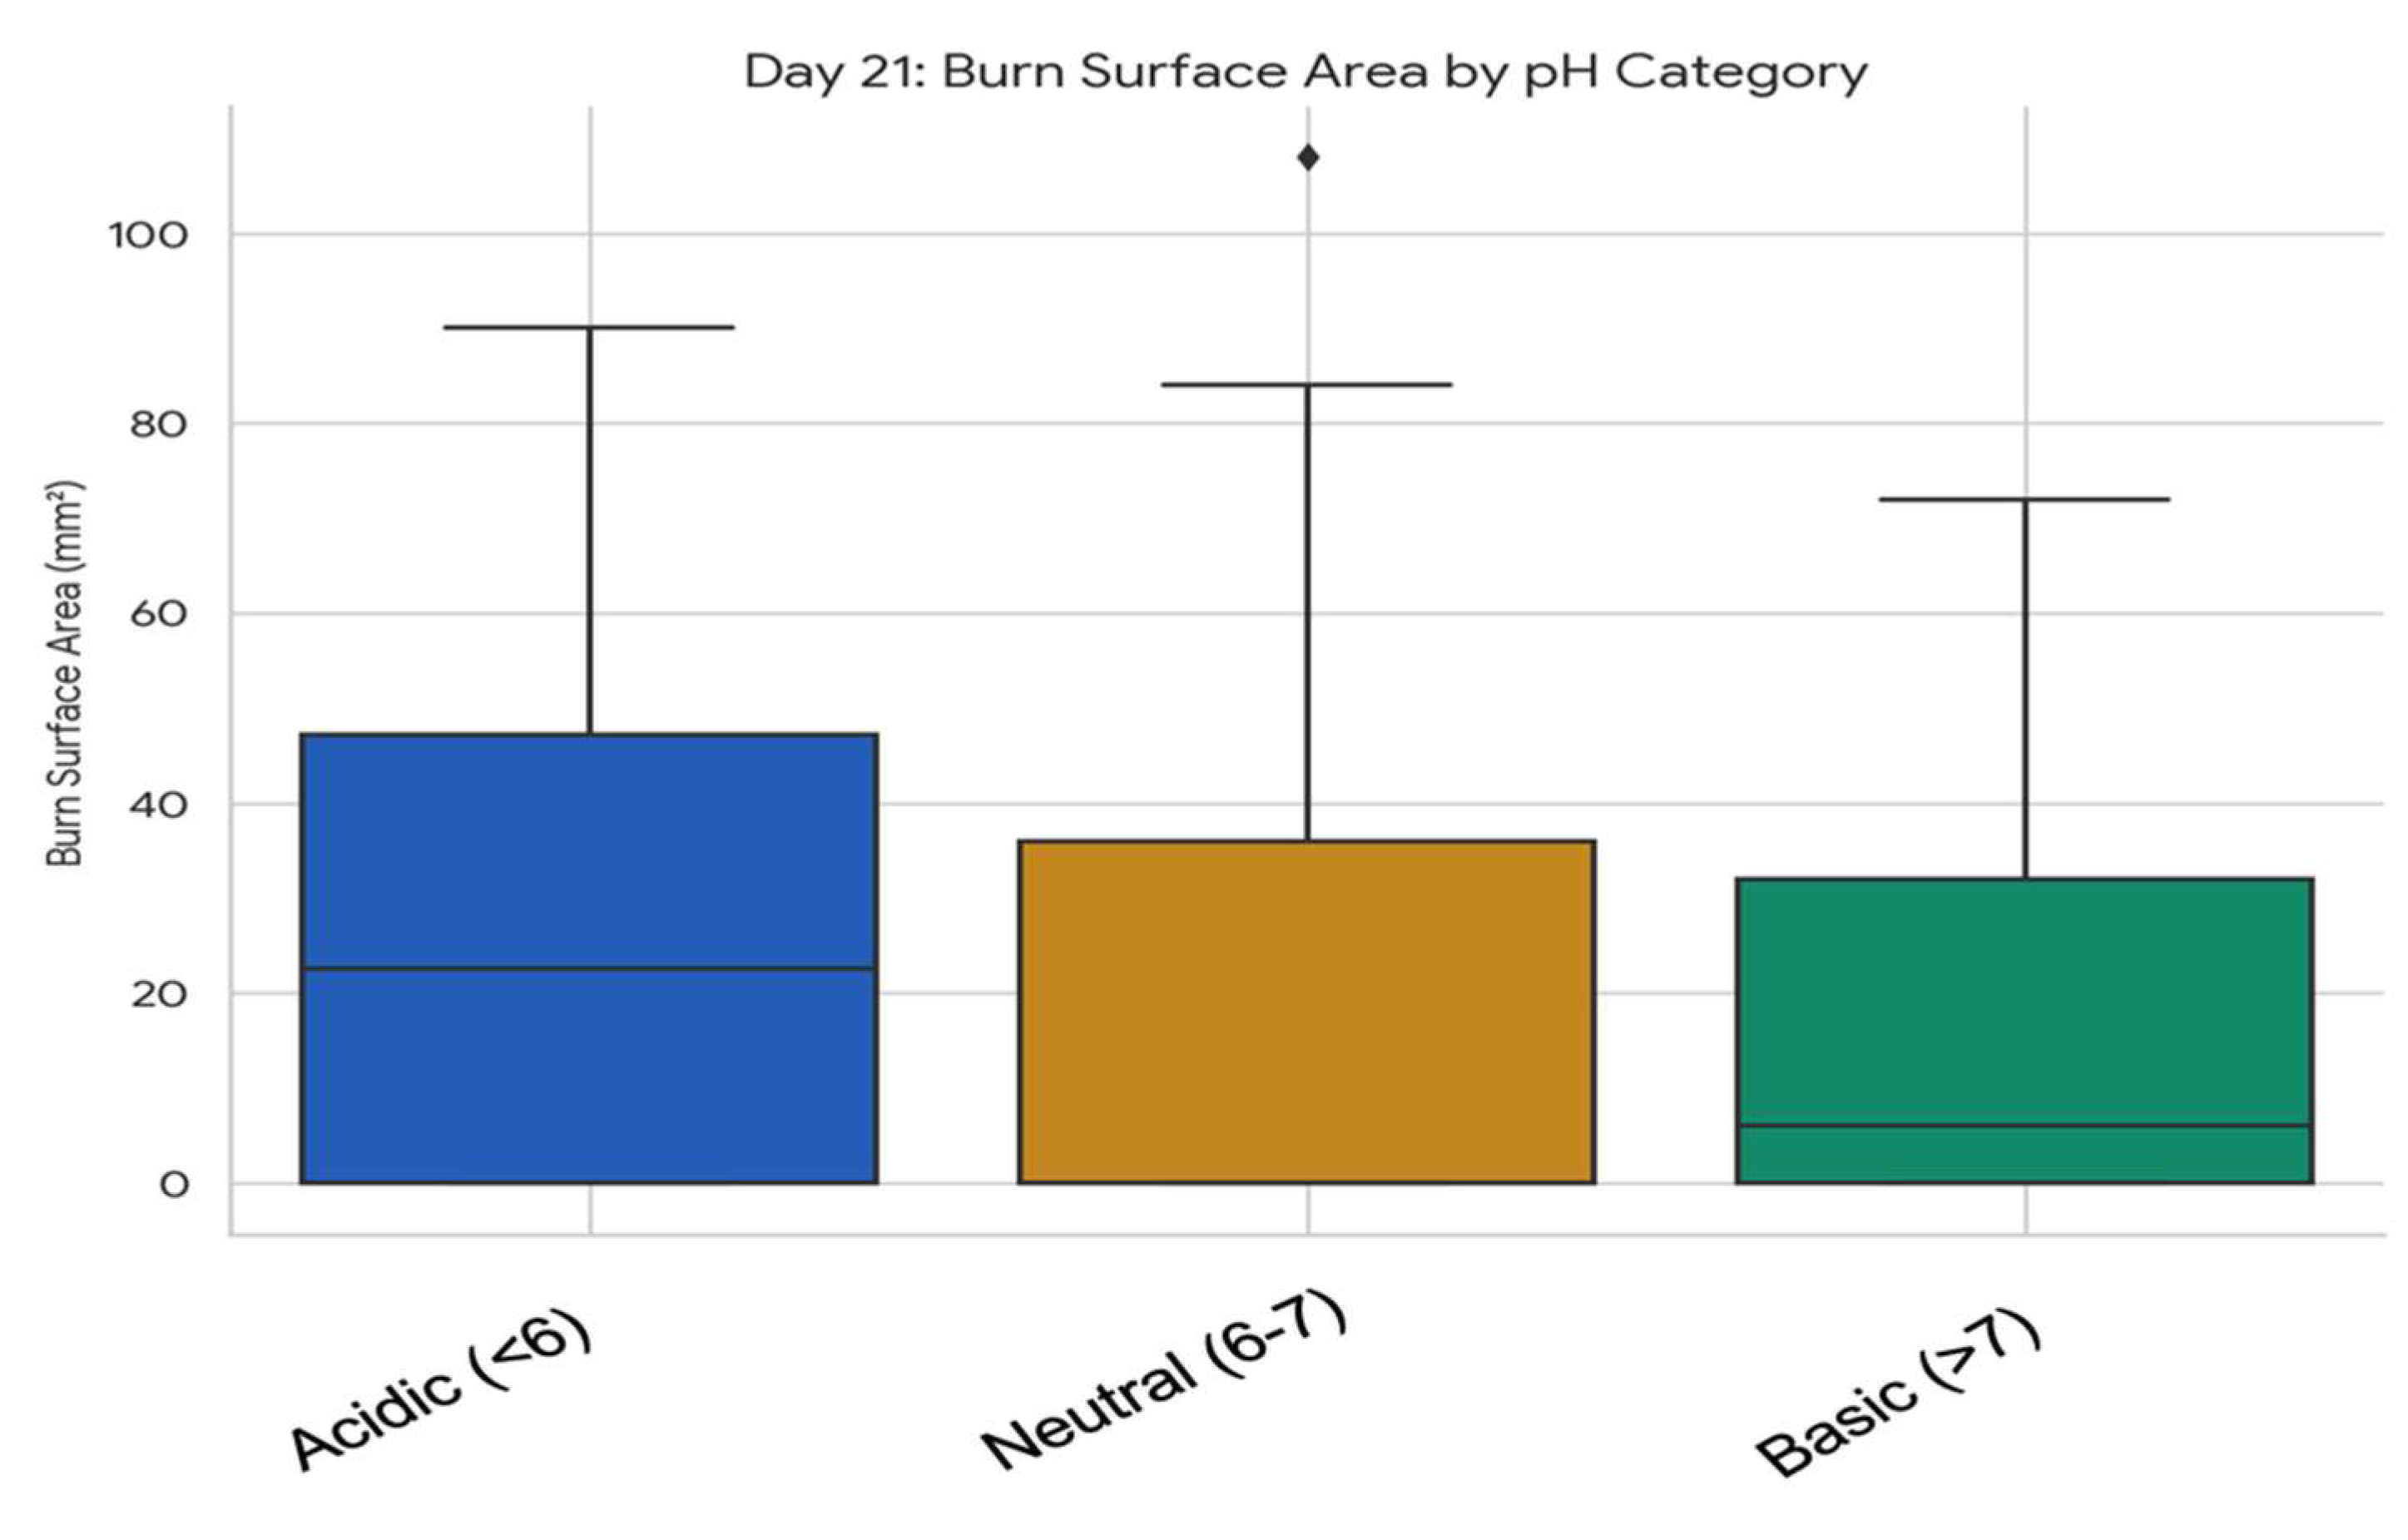
Box plot illustrating burn surface areas (mm²) at day 21 post-injury, grouped by pH category of topical formulations: acidic (pH < 6), neutral (pH 6–7), and basic (pH > 7). The horizontal lines within each box indicate median burn surface areas, boxes represent the interquartile range, whiskers represent the range excluding outliers, and the diamond shape indicates an outlier. Lower values indicate better healing outcomes with smaller burn surface areas.
Figure 22.
Evolution of pH values in formulations across different timepoints.
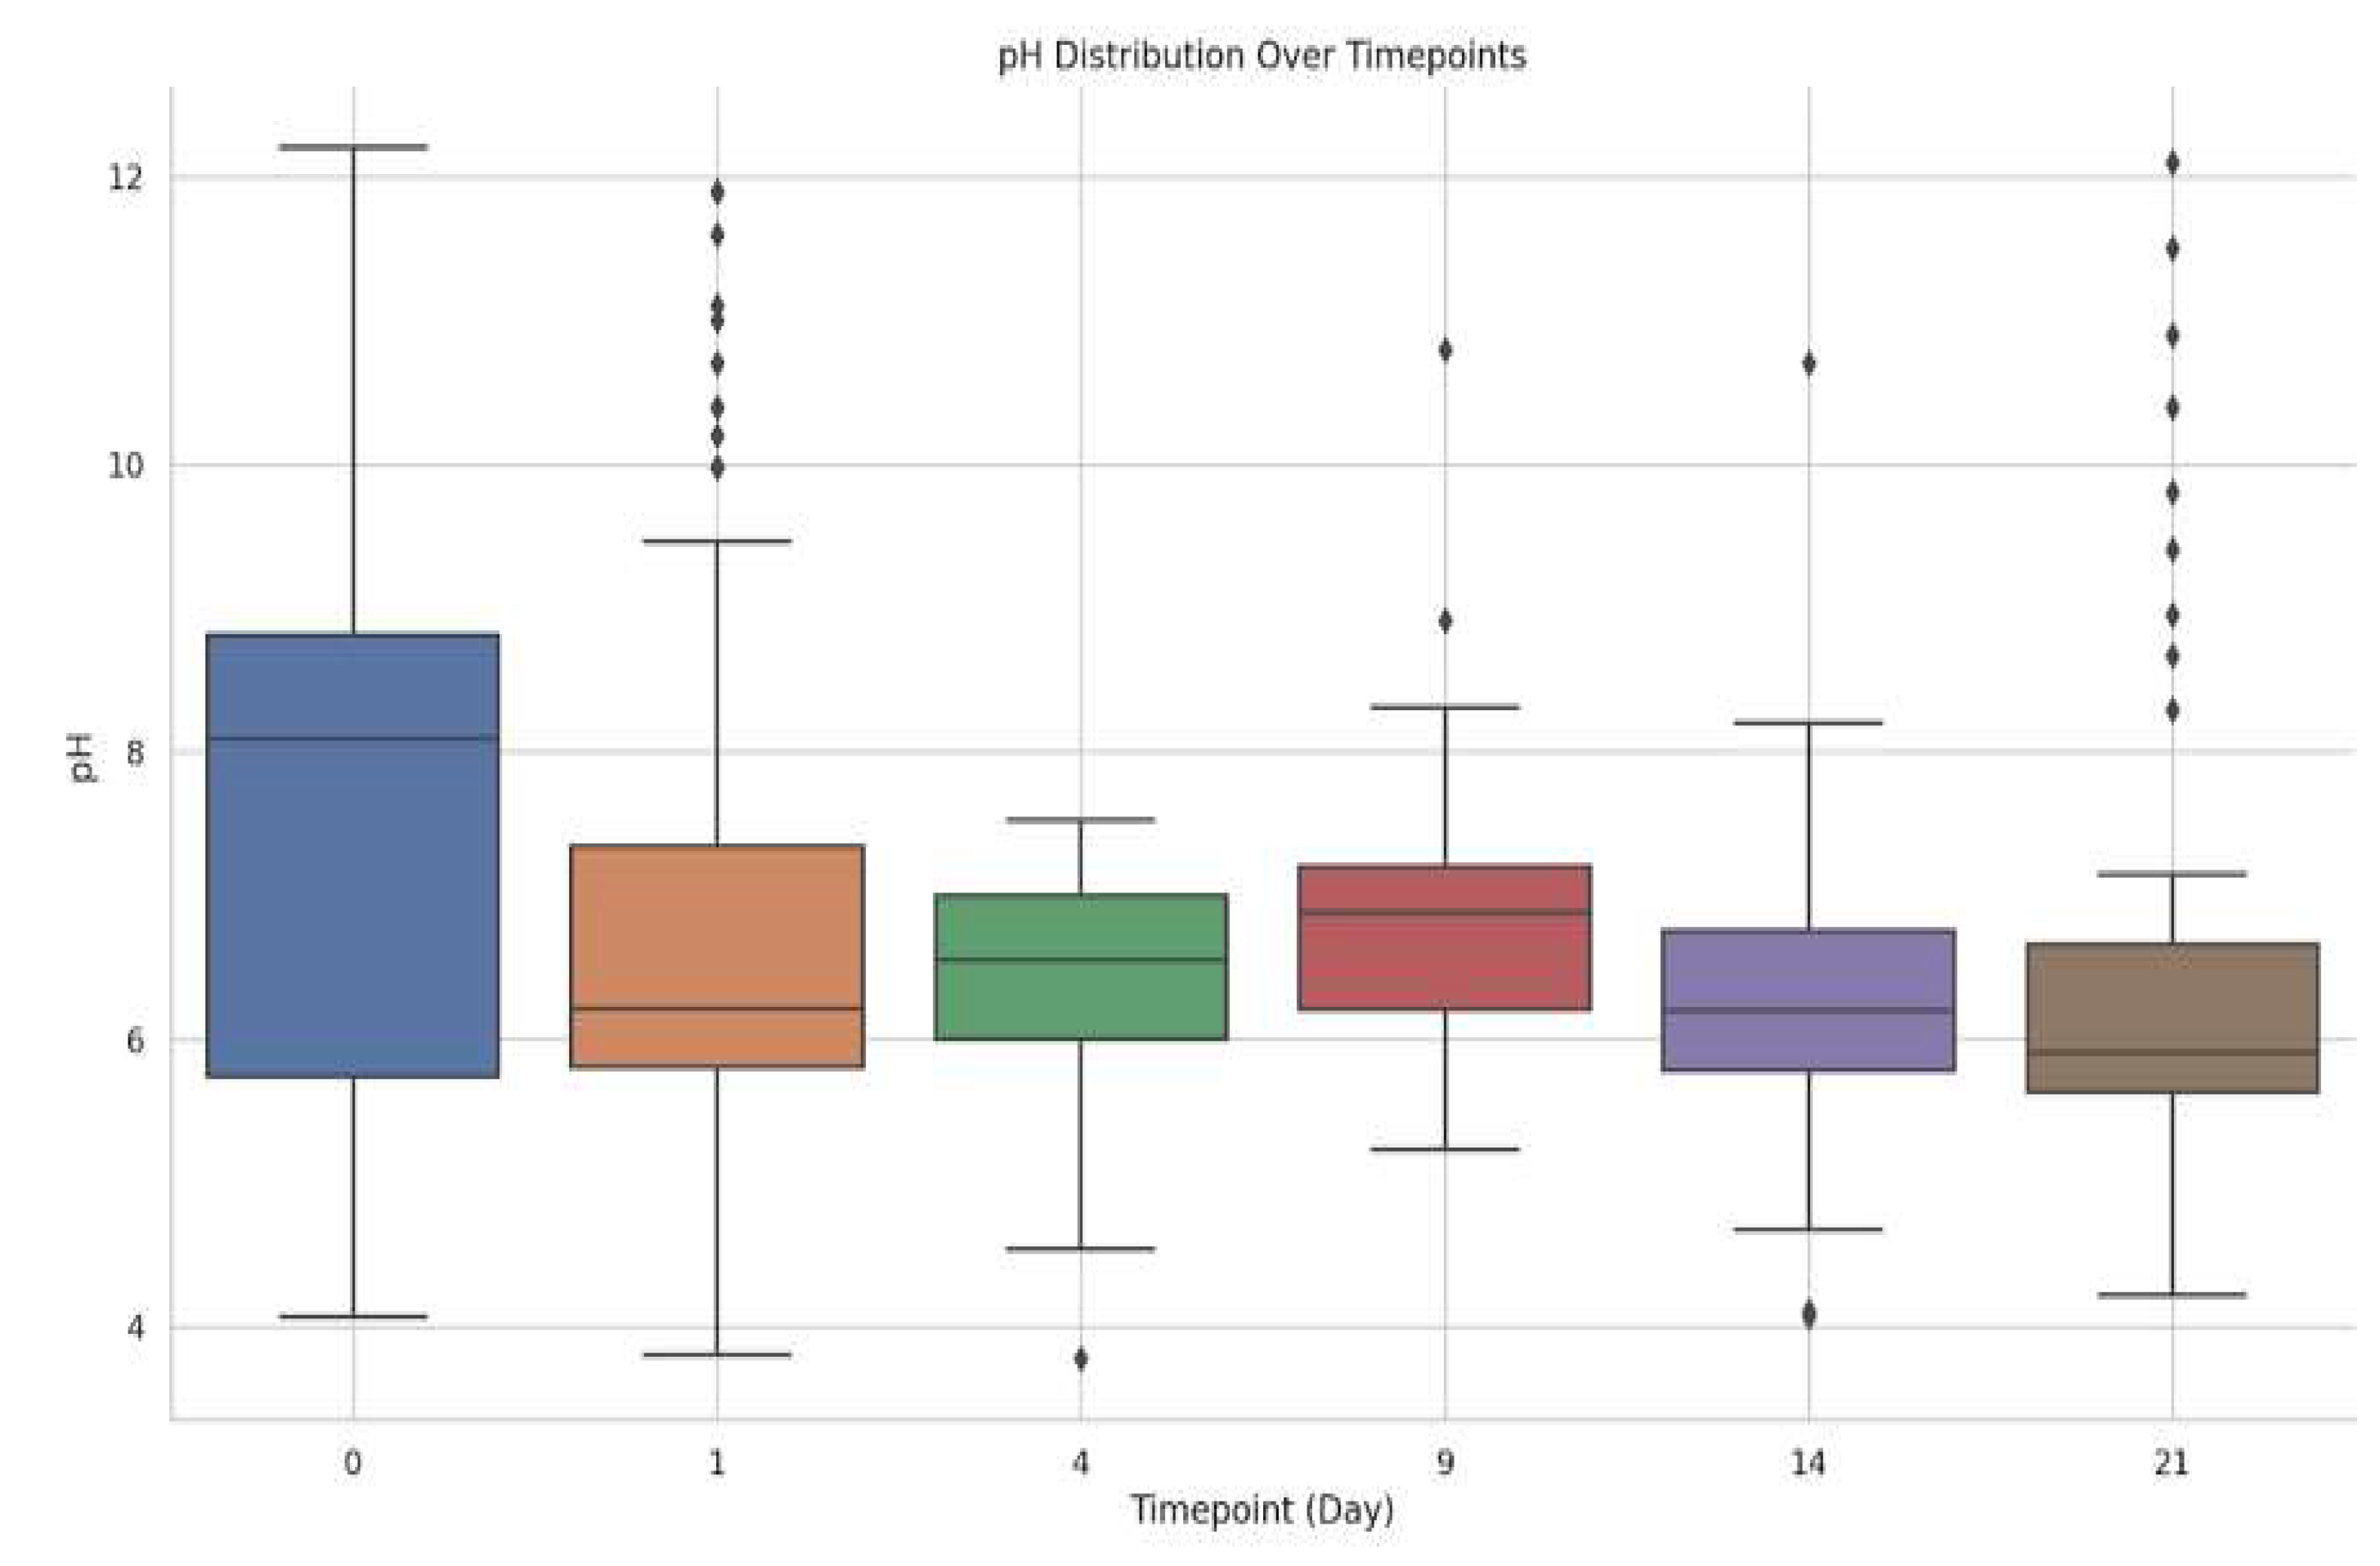
The boxplot represents the distribution and stability of pH values measured at multiple timepoints (Day 0, 1, 4, 9, 14, and 21) throughout the experimental period. Boxes indicate the interquartile range (25th–75th percentiles), the central line represents the median, whiskers denote the variability outside the upper and lower quartiles, and points beyond whiskers represent outliers. The observed stabilization of pH values indicates formulation stability over time.
Graph 1.
Distribution of skin surface pH values measured following the application of various topical formulations during the post-burn period. The histogram is complemented by a density curve illustrating the general distribution trend of the data.
Graph 1.
Distribution of skin surface pH values measured following the application of various topical formulations during the post-burn period. The histogram is complemented by a density curve illustrating the general distribution trend of the data.
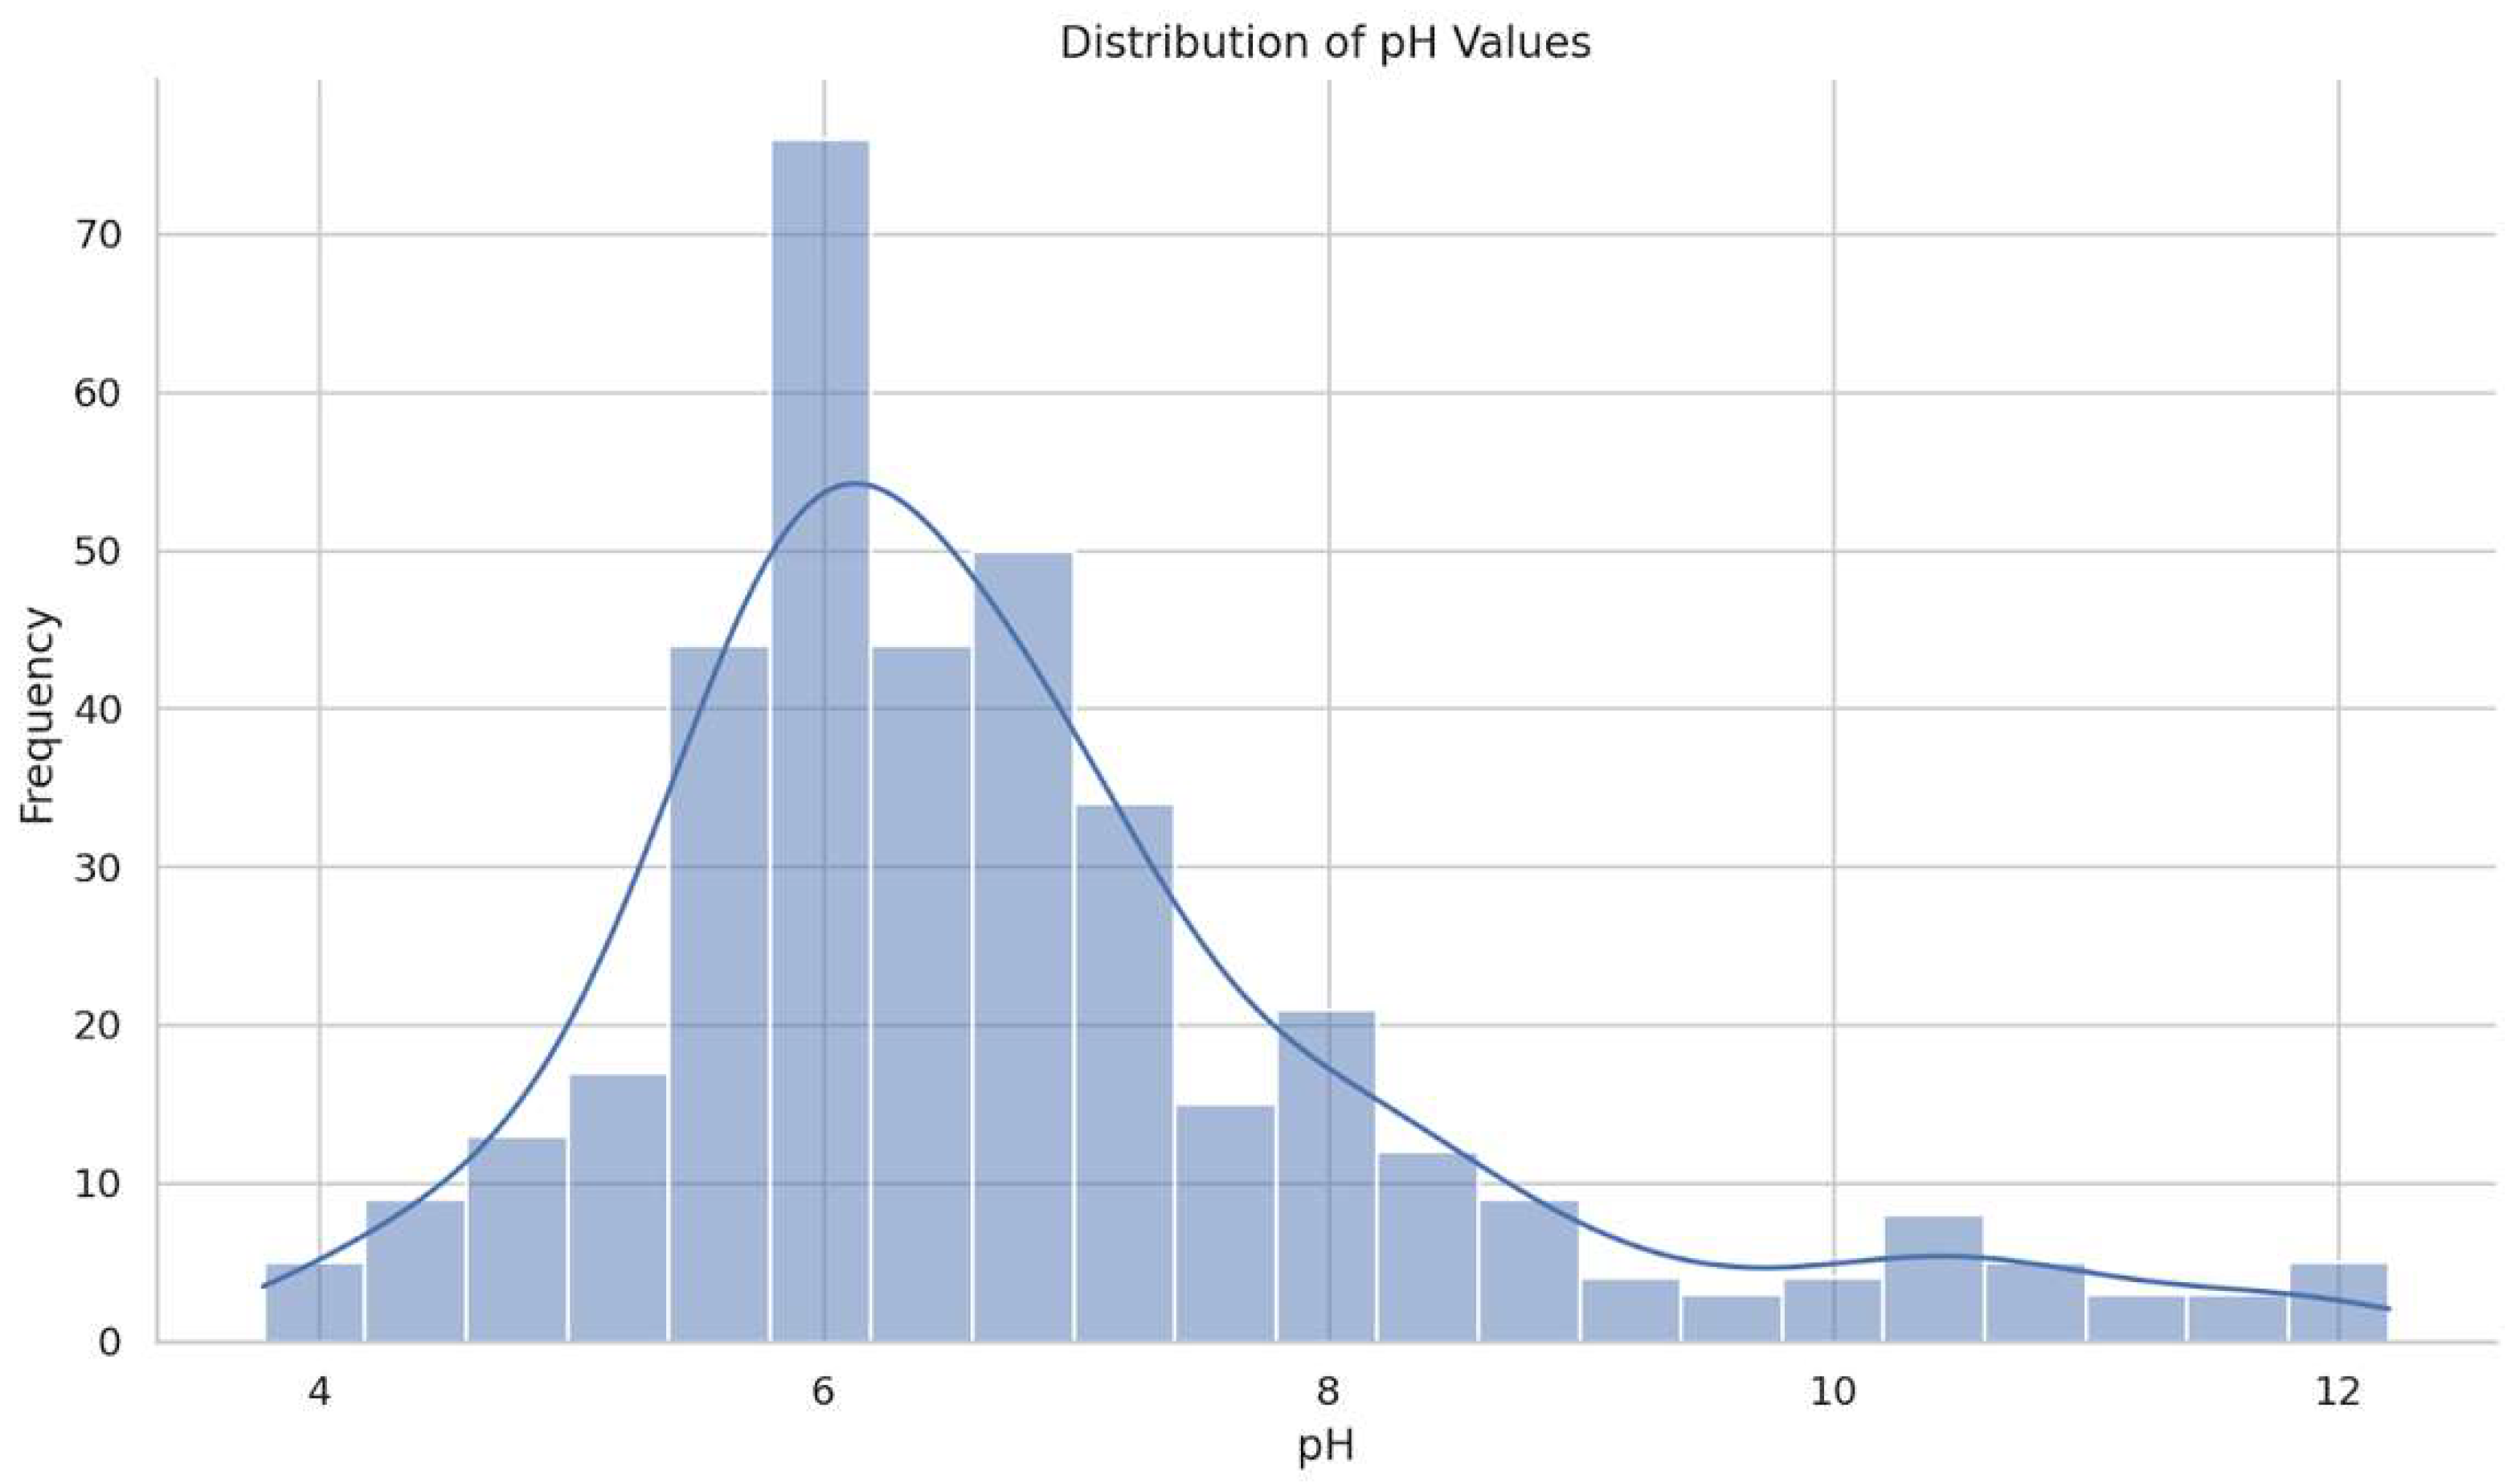
The graph illustrates the frequency distribution of skin surface pH measurements after the application of studied topical formulations. Most pH values are concentrated between 5 and 7, showing a clear peak around neutral to slightly acidic (~pH 6). Extreme values, either highly acidic (below pH 4) or highly basic (above pH 10), are infrequent. This distribution suggests that most topical formulations help maintain a relatively neutral or mildly acidic skin environment, favorable for post-burn skin healing.
3.5.2. Comparative Analysis of Skin Surface pH and Temperature Dynamics in Relation to Plant Extracts and Formulation Types
The Sambucus nigra bark extract in absolute ethanol (HG_SNB_99.5%) is distinguished by the most stable and consistently acidic pH value, suggesting the best compatibility with the physiological requirements of skin healing compared to another Sambucus nigra formulation extract. On the other hand, topical formulation with Ocimum basilicum (HG_OB_70%), its constant acidic stability, recommending it as the most suitable for therapeutic application in wound treatment, due to its superior compatibility with the physiological environment. The pH trend in Ocimum basilicum formulations appears to be dependent on the extraction solvent (see Figure 16).
Galium verum in absolute ethanol (HG_GV_99.5% and OG_GV_99.5%) demonstrates efficient adaptation and final stabilization in an acidic environment, indicating good therapeutic potential (see Figure 16).
All another formulations extract, regardless of solvent and formulation, show significant variations, suggesting the need for further optimization for clinical use.
Figure 23.
Comparison of wound surface evolution and skin temperature over time (mean ± SD).
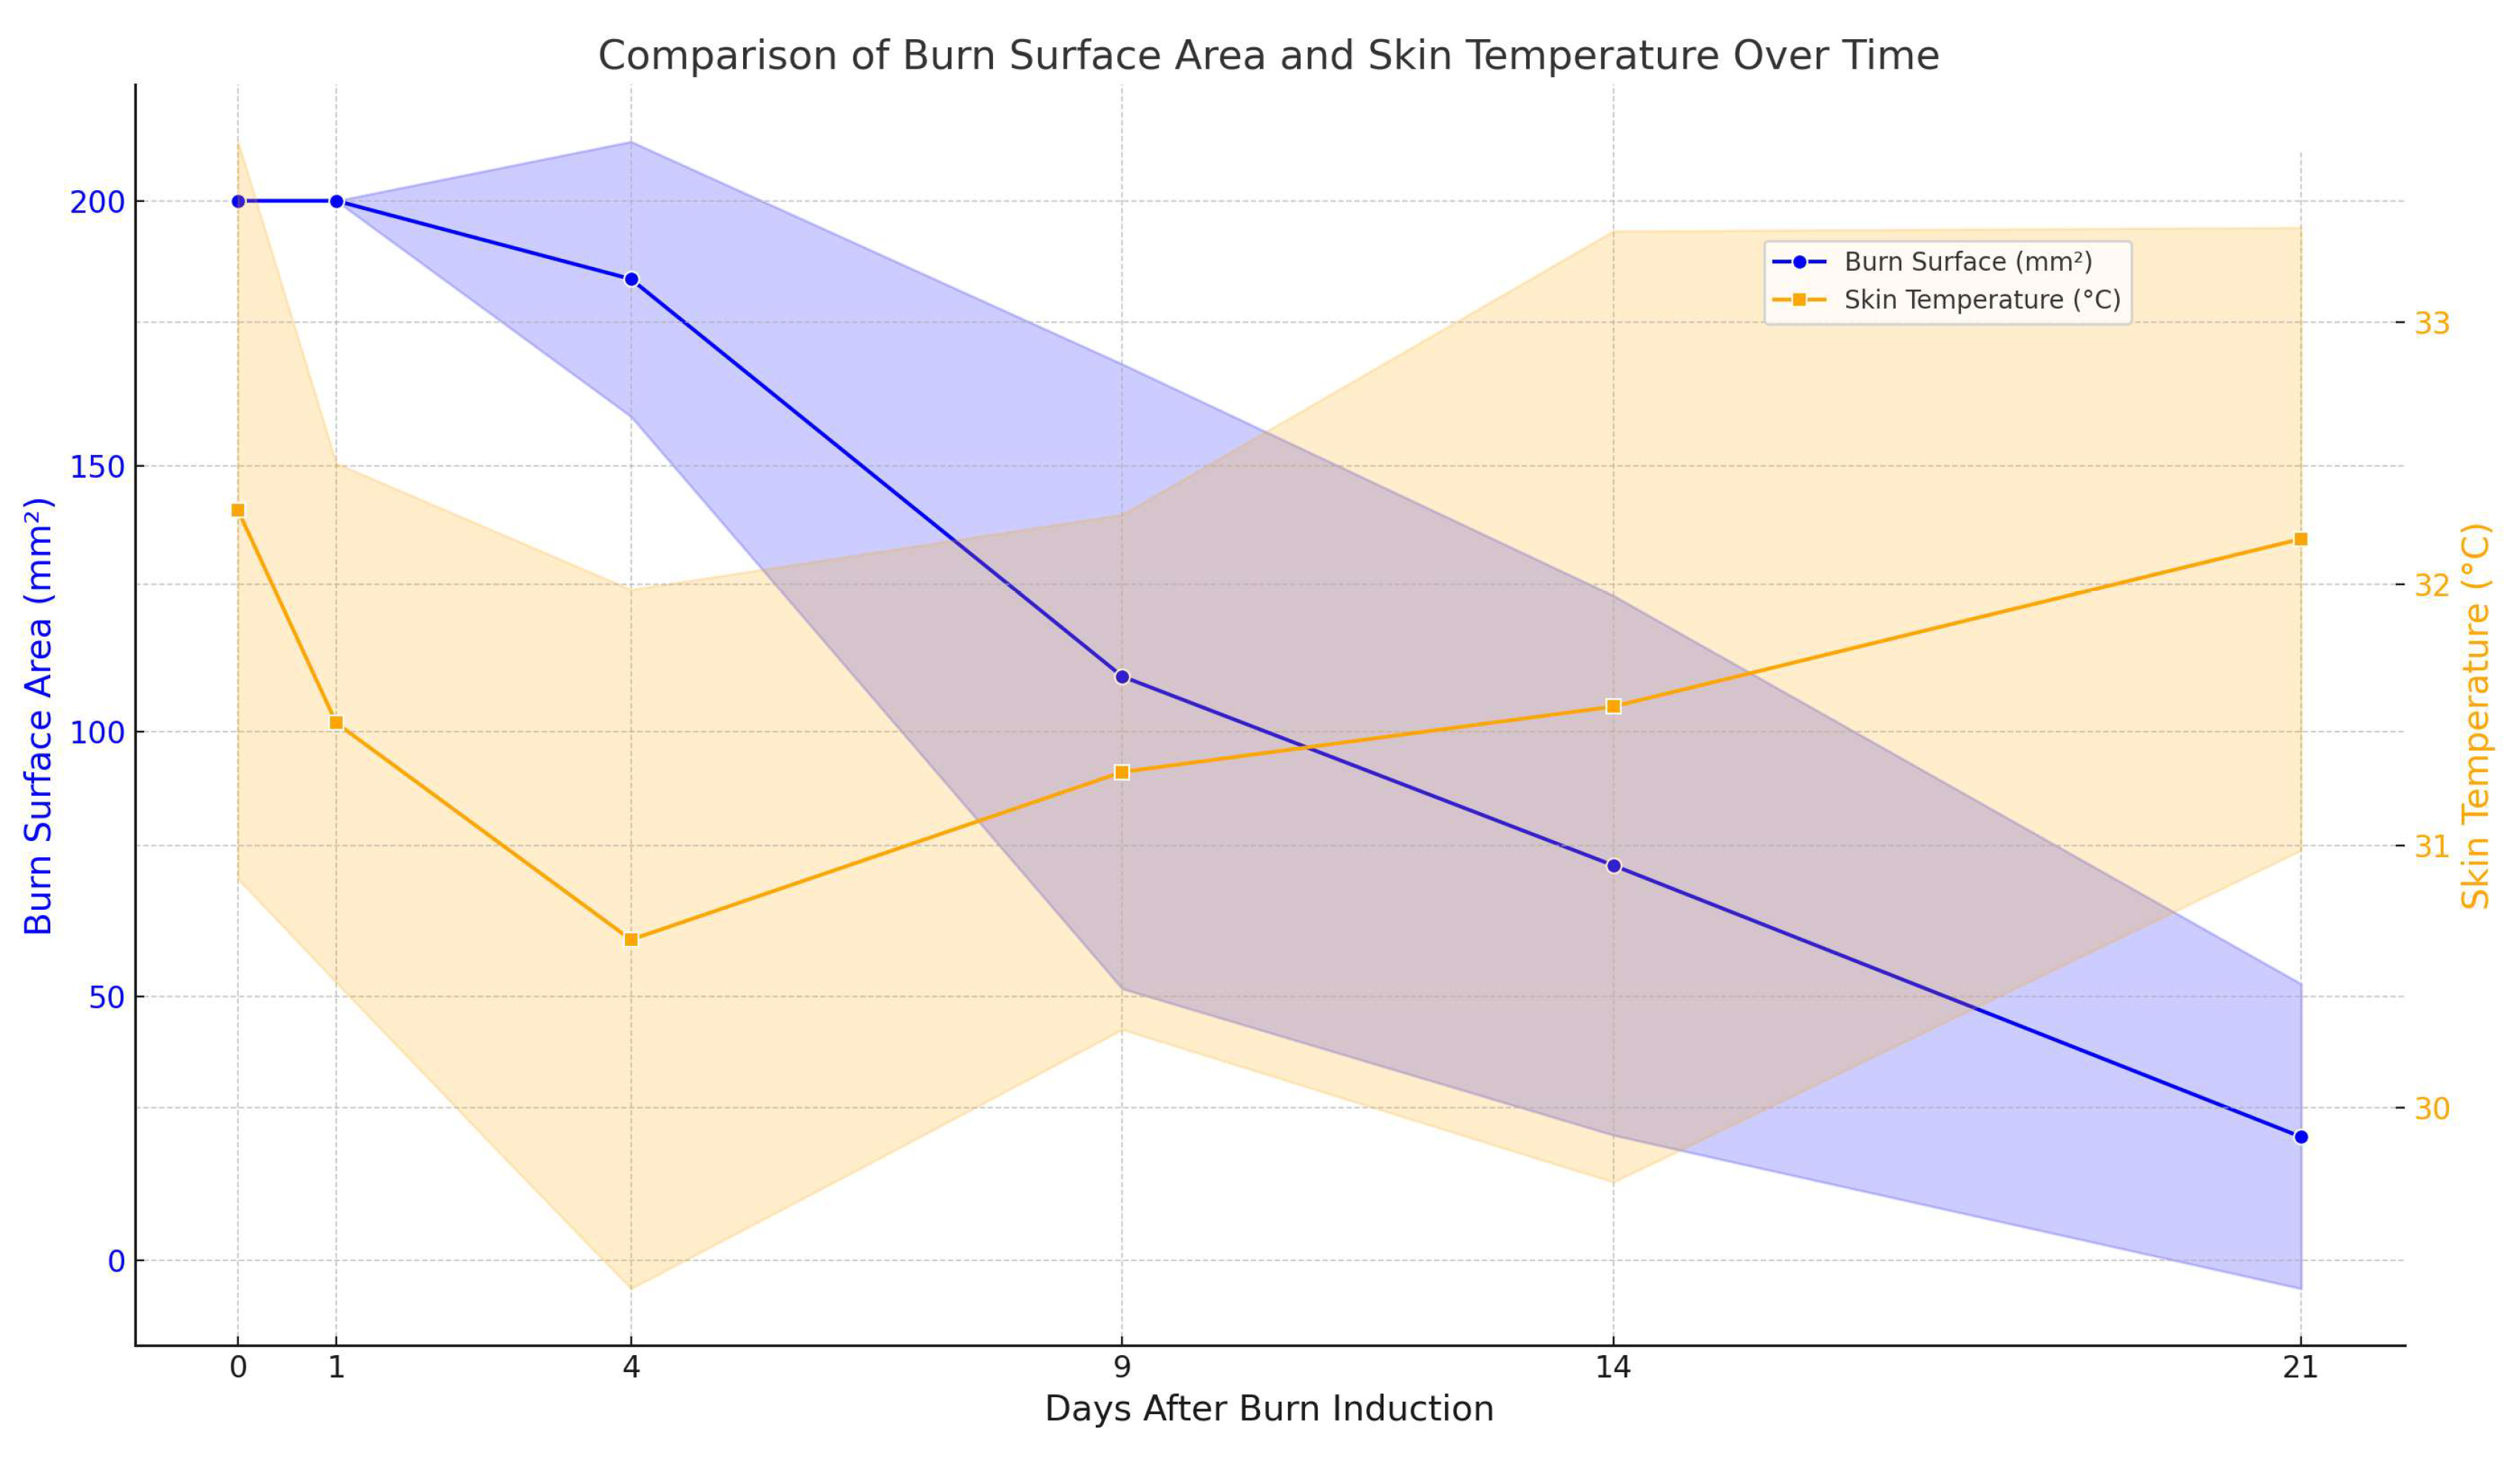
The burn surface area decreases clearly and consistently over time, demonstrating effective wound healing.
Skin temperature shows some fluctuation but does not display a strong or clear decreasing/increasing trend directly corresponding to the healing progression. Instead, temperature appears relatively stable, with minor fluctuations.
Figure 24. shows the dynamics of the mean skin temperature (in °C), measured on days 0, 1, 4, 9, 14, and 21 after experimental induction of a scald burn using various topical formulations (oleogels—OG and hydrogels—HG). The basal temperature before the burn (“Pre-burn baseline”) is used as a reference.
Initially (day 0), the mean skin temperature in the burned area is increased compared to the basal level, reflecting the inflammation and hyperemia associated with the thermal injury. First days after the burn induction (day 1 to day 4), most formulations lead to a slight decrease in local temperature, which could suggest a reduction of the local inflammatory process.
Between days 4 and 9, the temperature evolution differs between the oleogel and hydrogel formulations. Formulation without incorporated extracts maintaining a constant temperature around 30-31°C compared with others that show more pronounced variations (e.g., OG_OB_ETOH70, HG_OB_ETOH99.5).
A sign that the inflammatory process is attenuated and wound healing is approaching complete epithelialization are shown in day 14 and 21 where most formulations converge towards a temperature close to the basal value. However, formulations HG_OB_ETOH70 and HG_OB_ETOH99.5 seem to maintain a slightly higher temperature, which may indicate a prolonged inflammatory process compared to other formulations.
These data suggest that the type and composition of topical formulations directly influence the burn wound’s skin temperature. This temperature indirectly correlates with the degree of inflammation and, implicitly, with the evolution of the healing process. Formulations with a faster reduction and maintenance of values closer to baseline may indicate superior efficacy in controlling inflammation and accelerating healing.
3.6. Clinical and Histological Evaluation of Burn Healing
Oleogel applications accelerated the general healing process, with individual formulations of Ocimum basilicum and Boswellia serrata showing the highest efficacy, demonstrating a greater reduction in wound surface area.
Histologically point of view, these showed enhanced epithelialization and granulation with reduced inflammation (see Figure 25).
In contrast, formulations with a more basic pH, such as those containing Ocimum basilicum, showed histologically increased fibrosis and deep inflammation, potentially leading to hypertrophic scarring.
Hydrogels demonstrated similar clinical performance, with the Sambucus nigra flower extract formulation showing evident effects on vascularization and epithelialization, correlated with a progressive decrease in pH toward acidic values.
3.6.1. Impact of pH Variations in Hydrogel Formulations on Vascularization, Epithelialization, and Inflammation
Regarding the hydrogel formulations, it is observed that SNF 99.5%, from an acidic pH at rheological characterization and day 0 tends towards neutral-basic values starting with day 4 to day 14, progressively decreasing to an acidic pH on day 21. From a histopathological evolutionary point of view, it presents many neoformation vessels and an advanced epithelialization process observed on day 14.
On the other hand, the BS 99.5% extract from a slightly acidic rheological pH to a basic-neutral pH from day 0 to day 9, and from day 14 it becomes acidic. Histopathologically, an accentuated epithelialization process is noted, with less fibrosis from day 14, but with the maintenance of a slight inflammatory syndrome also on day 21.
3.6.2. Correlation Between Formulation pH, Rheological Characteristics, and Healing Progression
Statistical analysis revealed a significant correlation between acidic formulation pH and reduction of wound surface area on days 9 and 14 (p<0.05). pH values accelerate the healing compared to neutral or basic formulations
Topical products exhibiting higher initial viscosity and thixotropy showed enhanced persistence and stability on the wound surface, promoting sustained release of bioactive compounds, clinically translating into improved epithelialization, reduced inflammation, and overall faster healing processes.
4. Discussion
The study findings underscore the critical importance of maintaining a slightly acidic skin environment during post-burn wound healing. Our observations align with recent literature indicating that an acidic wound pH supports antimicrobial activity, maintains skin barrier integrity, and accelerates epithelialization and granulation processes [30,31].
The extracts plant used in the present study, particularly, Boswellia serrata and Sambucus nigra, demonstrated significant capacity to dynamically regulate the pH local, in direct correlation with the histological and clinical outcomes.
Due to their abundant boswellic acids, Boswellia serrata extracts, are reported in the literature to have an anti-inflammatory effect by inhibiting the 5-lipoxygenase pathway and reducing chronic inflammatory infiltrate [8].
Additionally, the presence of rutin, chlorogenic acid and rosmarinic acid in Sambucus nigra and Galium verum significantly contributes to reducing local oxidative stress and stimulating collagen synthesis, essential aspects of tissue regeneration [1].
The rheological properties of the formulations, notably their high viscosity and thixotropy, facilitated a sustained and stable release of bioactive compounds, directly contributing to the clinically observed therapeutic efficacy. Previous studies confirm that topical formulations exhibiting pseudoplastic and thixotropic behavior ensure optimal adherence and prolonged persistence on wounds, thus enabling gradual and sustained release of active substances [11]
Role of LogP and Additional Physicochemical Parameters in Assessing Skin Permeability
The classification of LogP values in relation to skin permeability of compounds as hydrophilic, optimally permeable, or lipophilic can represent a determining factor in dermatopharmacological practice based on the understanding that the octanol-water partition coefficient can serve as an indicator of a compound’s ability to penetrate the stratum corneum [32,33].
Although the numerical thresholds are commonly used, LogP <1 for hydrophilic, 1-3 for optimal permeability, and>3 for lipophilic, in the pharmacological branch, they are used as guides in developing topical formulations [29,34].
The study conducted by Chen et al. (2018) showed a strong correlation between LogP values and skin permeability coefficients (Kp), demonstrating that compounds with higher LogP values tend to have increased skin permeability [34].
Although LogP is a significant factor in determining skin permeability, but it is not the only determinant regarding physicochemical properties [35]. Also, in vitro clinical data and those on human subjects must be correlated, for example, with molecular weight, hydrogen bonding capacity, and molecular size, as well as complex analyses related to polarity, solubility, and experimental data using Franz cells or Raman confocal microscopy to understand better the mechanism of skin permeability of the evaluated topical formulations [36,37].
Integrating the phytochemical, physicochemical, rheological, and permeability characteristics studied herein provides a robust rationale for the observed clinical efficacy. Specifically, optimized LogP values enhance skin penetration of active components, aligning with the controlled release characteristics facilitated by the rheological properties of the formulations. Furthermore, the resulting pH modulation synergizes with these physicochemical aspects, collectively creating an optimal environment conducive to accelerated wound healing.
Correlation of Rheological Assessment in Literature Topical Formulation
The flow and viscosity curves depicted in Figure 1, Figure 2, Figure 3 and Figure 4 confirmed the non-newtonian thixotropic pseudoplastic (shear-thinning) behavior of all analyzed gels. The thixotropy is displayed by the hysteresis-loop referring to the system capacity to recover its viscosity in time when the flow is discontinued applied, and the specific pseudoplastic behavior is indicated by a fall in viscosity with increasing share rate [38]. All studied gels (oleogels and hydrogels) showed a time-dependent decrease of the viscosity determined by the shear rate, which is considered as a typical rheological behavior for such systems [39,40]
This sudden drop of viscosity to relatively low shear rate values can be attributed to the shear sensitivity of the oleogels, which can be correlated with weak interactions forces within their tridimensional network. The pseudoplastic flow is a desirable characteristic for a pharmaceutical topical gel as it improves the preparation’s spreadability on the skin.
The values of viscosity and degree of thixotropy (Table 2) for all oleogel systems (control and extract-loaded formulations) show the influence of the composition and polarity of both oleogel liquid phase and plant extracts on the gel microstructure, as it was previously reported [41].
Different extents of thixotropy displayed by the experimental extract-loaded hydrogels suggest changes in the level of interactions responsible for the gel structural network caused more probably by the components of the extracts, since it was previously evidenced that ethanol affect the poloxamer gel formation only in concentrations higher than 20% [42,43].
Clinical Significance of pH and Temperature Monitoring in Effective Wound Healing Management
Wound healing is a process that involves numerous biochemical and physiological parameters, among which pH and temperature are extremely important [44]. Investigation and monitoring of indicators can generate valuable information about lesions overall favorable or unfavorable status, with the potential for maintaining inflammation, the likelihood of bacterial colonization of the wound, and these two parameters [45].
Changing the pH of the wound can have a major impact on wound evolution. Healthy skin maintains the protective barrier at an optimal pH between 4.1 and 5-8 [3]. A deviation towards an alkaline pH (>6.5) can signal a bacterial infection or vicious healing conditions [46,47].
The importance of temperature variations in wound management is equally critical.
The increase in temperature of an acute injury is also due to local vascular activity, by providing oxygen and nutrients essential for restoring the integrity of the protective barrier [48,49].
These in healing wounds tend to be slightly higher than in normal skin, but sudden temperature increases indicate infection and an increased inflammatory response, while temperature decreases may indicate compromised circulation and ischemia [49,50]. Fluctuations of up to 2.2°C can serve as warning signs of impending wound deterioration, underscoring the importance of continuous and accurate temperature monitoring [51,52].
Although temperature and pH monitoring in our study were on days 0,4-,9-,14-,21- our results are also supported by the observations of Ning Tang et. of 2021 showing that continuous, real-time monitoring of pH and temperature parameters using sensors in the wound dressing offers significant clinical and patient comfort advantages in the effective management of wound healing [45].
Furthermore, research by Graziela Heberlé et al. (2012) and Eneida Janiscki Da-Lozzo et al. (2011) indicates that topical formulations, such as emulgels containing bioactive ingredients such as curcuminoids or cranberry extracts, can further influence wound microenvironment parameters such as pH and temperature [53,54].
Limitations and Future Directions
The pH values obtained in this study could be influenced by certain specific endogenous and exogenous factors, potentially affecting the accuracy of results, as indicated by other studies [55,56]. Thus, further research is required to analyze the pH of topical creams considering all known factors from specialized literature on the studied plants. Additionally, a comparative analysis of adjusted versus unadjusted pH results could provide valuable dermatopharmacological guidance for developing topical formulations intended as potential treatments for burns or other inflammatory-based lesions in both human and veterinary medicine. Moreover, future studies should also focus on characterizing the diffusion of topical formulations into the skin concerning the molecular weight of the compounds present in plant extracts.
Additional limitations of this study include the limited duration of observation, which may not fully capture long-term healing outcomes such as final scarring or tissue remodeling.
The animal model used, although widely accepted, has physiological differences compared to human skin, which could limit the applicability of the results to clinical human settings.
Moreover, the lack of direct and detailed microbiological assessments in the study restricts understanding of specific antimicrobial activities of the tested formulations.
Additionally, to the study did not explore varying concentrations of plant extracts, leaving unanswered questions regarding optimal therapeutic dosages. Lastly, interindividual variability (genetic, metabolic) influencing healing and treatment responses was not addressed.
Future research directions should include controlled clinical trials on human populations to validate efficacy and safety, extended monitoring for evaluating long-term scarring outcomes, detailed microbiological evaluations, comparative studies on different extract concentrations, and advanced molecular characterization to elucidate underlying healing mechanisms.
Furthermore, the studies who will examining individual variability and combination therapies, as well as economic feasibility analyses, would further strengthen the clinical application potential of these topical formulations.
5. Conclusions
The present study demonstrates the efficacy of oleogel and hydrogel formulations containing plant extracts (Boswellia serrata, Sambucus nigra, Galium verum and Ocimum basilicum) as a potential first-line treatment in experimental post-burn wound dressings that may facilitate wound healing. The main findings include:
Phytochemical analysis revealed significant bioactive compounds (boswellic acids, rutin, chlorogenic acid, rosmarinic acid) that contribute to anti-inflammatory, antioxidant and regenerative effects.
Optimized physicochemical properties (appropriate pH and LogP values) significantly improved skin permeability and supported healing processes.
Rheological properties (high viscosity and thixotropy) ensured efficient application, prolonged persistence and sustained release of active substances.
Clinical and histological evaluations confirm accelerated healing, improved epithelialization, reduced inflammation and favored tissue regeneration, directly correlating with the properties of the formulation.
Thus, the careful integration and balancing of these factors highlights the fact that these formulations represent promising candidates for advanced clinical management of post-burn wounds.
Author Contributions
Conceptualization, Oana-Janina Roșca, Alexandru Nistor, Roxana Negrea-Ghiulai and Codruța Marinela Șoica; Data curation, Oana-Janina Roșca and Alexandru Nistor; Formal analysis, Alexandru Nistor and Codruța Marinela Șoica; Funding acquisition, Oana-Janina Roșca; Investigation, Oana-Janina Roșca, Georgeta-Hermina Coneac and Alexandru Nistor; Methodology, Oana-Janina Roșca, Roxana Racoviceanu and Alexandru Nistor; Project administration, Oana-Janina Roșca; Resources, Oana-Janina Roșca, Georgeta-Hermina Coneac, Roxana Racoviceanu, Ioana Olariu and Ana-Maria Cotan; Supervision, Roxana Racoviceanu, Cristina Adriana Dehelean, Lavinia Lia Vlaia and Codruța Marinela Șoica; Validation, Georgeta-Hermina Coneac; Visualization, Alexandru Nistor; Writing—original draft, Oana-Janina Roșca, Alexandru Nistor and Lavinia Lia Vlaia; Writing—review & editing, Oana-Janina Roșca, Georgeta-Hermina Coneac, Roxana Racoviceanu, Alexandru Nistor, Ioana Olariu, Ana-Maria Cotan, Roxana Negrea-Ghiulai, Cristina Adriana Dehelean, Lavinia Lia Vlaia and Codruța Marinela Șoica.
Funding
This research was funded by “Victor Babes” University of Medicine and Pharmacy Timisoara, Doctoral Grant 14082/2019. The APC was funded by “Victor Babes” University of Medicine and Pharmacy Timisoara, Doctoral School.
Institutional Review Board Statement
The animal study protocol was approved by the Institutional Ethics Committee of Victor Babes University of Medicine and Pharmacy Timisoara (Nr. 17/11.03.2022).
Data Availability Statement
The original contributions presented in this study are included in the article/supplementary material. Further inquiries can be directed to the corresponding author(s).
Conflicts of Interest
The authors declare no conflicts of interest.
Abbreviations
The following abbreviations are used in this manuscript:
| Blank-OG-OO | Blank Oleogel Olive Oil formulation |
| BS | Boswellia serrata |
| Compritol 888 ATO | Glyceryl dibehenate excipient |
| DEGEE | Diethylene glycol monoethyl ether |
| GV | Galium verum |
| HG | Hydrogel |
| LC-MS | Liquid chromatography-mass spectrometry |
| LogP | Logarithm of partition coefficient |
| OC | Ocimum basilicum |
| OG | Oleogel |
| pH | Potential of hydrogen |
| PVP-I | Liposome polyvinyl-pyrrolidone-iodine |
| RAPID-3D | Rat Printed Induction Device - 3D |
| SD | Standard deviation |
| SNB | Sambucus nigra brunch bark |
| SNF | Sambucus nigra flower |
| SFO | Sunflower oil |
| TA | Topical antimicrobial |
References
- Okur, M.E.; Karantas, I.D.; Şenyiğit, Z.; Üstündağ Okur, N.; Siafaka, P.I. Recent trends on wound management: new therapeutic choices based on polymeric carriers. Asian J. Pharm. Sci. 2020, 15, 661–684. [Google Scholar] [CrossRef] [PubMed]
- Wilkinson, H.N.; Hardman, M.J. Wound healing: cellular mechanisms and pathological outcomes. Open Biol. 2020, 10, 200223. [Google Scholar] [CrossRef]
- Percival, S.L.; McCarty, S.M.; Lipsky, B. Biofilms and wounds: an overview of the evidence. Adv Wound Care 2015, 4, 373–381. [Google Scholar] [CrossRef]
- Gethin, G. The Significance of Surface pH in Chronic Wounds. Wounds UK 2007, 3, 52–56. [Google Scholar]
- Schreml, S.; Szeimies, R.M.; Karrer, S.; Heinlein, J.; Landthaler, M.; Babilas, P. Theimpact of the pH value on skin integrity and cutaneous wound heaking. J Eur Acad Dermatol Venerol. 2010, 24, 373–378. [Google Scholar] [CrossRef] [PubMed]
- Maver, T.; Maver, U.; Stana Kleinschek, K.; Mlinarič Raščan, I.; Smrke, D.M. Advanced therapies of skin injuries. Wien. Klin. Wochenschr. 2015, 127 (Suppl 5), S187–S198. [Google Scholar] [CrossRef] [PubMed]
- Scalamandré, A. Smart Technologies in wound prevention and care. In Innovations and Emerging Technologies in Wound Care; Gefen, A., Ed.; Elsevier: Amsterdam, Netherlands, 2020; pp. 225–244. [Google Scholar]
- Ghasemian, M.; Owlia, S.; Owlia, M.B. Review of anti-inflammatory herbal medicines. Adv Pharmacol Sci. 2016, 2016, 9130979. [Google Scholar] [CrossRef]
- Hamedi, A.; Zarshenas, M.M.; Sohrabpour, M.; Zargaran, A. Herbal medicinal oils in traditional Persian medicine. Pharm Biol. 2013, 51, 1208–18. [Google Scholar] [CrossRef]
- Ajaz, N.; Tiwari, V.; Saxena, V. Advanced topical formulations for wound healing: An overview. Asian J Pharm Sci 2021, 16, 119–136. [Google Scholar] [CrossRef]
- Boateng, J.; Catanzano, O.; Silver, I.A. Advanced therapeutic dressings for effective wound healing—A review. J. Pharm. Sci. 2015, 104, 3653–3680. [Google Scholar] [CrossRef]
- Roșca, O. -J.; Nistor, A.; Coneac, G. -H.; Olariu, I.-V.; Cotan, A.-M.; Racoviceanu, R.; Heredea, E.R.; Ciudoiu, A.; Didea, G.; Lupou, C- M.; et al. Wound Healing Properties of Plant-Based Hydrogel and Oleogel Formulations in a Rat Scald Burn Model. Pharmaceutics 2025, 17, 597. [Google Scholar] [CrossRef]
- . Ghiulai, R.; Avram, S.; Stoian, D.; Pavel, I.Z.; Coricovac, D.; Oprean, C.; Vlase, L.; Farcas, C.; Mioc, M.; Minda, D.; Motoc, A.; Szuhanek, C.; Danciu, C.; Soica, C.; Sima, L. Lemon balm extracts prevent breast cancer progression in vitro and in ovo on chorioallantoic membrane Assay. Evid Based Complement Alternat Med. 2020, 6489159. [Google Scholar] [CrossRef] [PubMed]
- Oniga, I.; Puscas, C.; Silaghi-Dumitrescu, R.; Olah, N.K.; Sevastre, B.; Marica, R.; Marcus, I.; Sevastre-Berghian, A.C.; Benedec, D.; Pop, C.E.; et al. Origanum vulgare ssp. Vulgare: chemical composition and biological studies. Molecules 2018, 23, 2077. [Google Scholar] [CrossRef]
- Daina, A.; Michielin, O.; Zoete, V. SwissADME: a free web tool to evaluate pharmacokinetics, drug-likeness and medicinal chemistry friendliness of small molecules. Sci Rep. 2017, 7, 42717. [Google Scholar] [CrossRef] [PubMed]
- Pantone LLC. Pantone Matching System® Color Chart; Pantone Inc. Carlstadt, NJ, 2023. [Accessed 2024-05-02]. Available from: https://www.pantone.com/color-systems/pantone-color-systems-explained.
- Wyszecki, G.; Stiles, W.S. Color science: concepts and methods, quantitative data and formulae. Wiley-Interscience: New York, 2000; p. 117. [Google Scholar]
- Sinko, P.J. Martin’s Physical Pharmacy and Pharmaceutical Sciences: Physical Chemical and Biopharmaceutical Principles in the Pharmaceutical Sciences, 7th ed.Wolters Kluwer: Philadelphia, 2017; Volume Chapter 17, pp. 433–466. [Google Scholar]
- European Pharmacopoeia (Ph.Eur.), 11th ed.; Strasbourg, France: Council of Europe; 2023, General Chapter 2.2.1. Clarity and degree of opalescence of liquids.
- The United States Pharmacopeial Convention. The United States Pharmacopoeia and National Formulary USP 43–NF 38. Rockville (MD): The United States Pharmacopeial Convention; 2019, p. 6415.
- Lawless, H.T.; Heymann, H. Sensory evaluation of food: principles and practices, Chapter 10, Descriptive analysis; p. 227–257, 2nd ed.; Springer: New York, 2010. [Google Scholar]
- Stone, H.; Bleibaum, R.N.; Thomas, H.A. Sensory evaluation practices, 5th ed. Academic Press: London, 2020; Chapter 8, Odor evaluation techniques. 177–208. [Google Scholar]
- Meilgaard, M.C.; Civille, G.V.; Carr, B.T. Sensory Evaluation Techniques. 5th ed. Boca Raton: CRC Press; 2016. Chapter 5, Descriptive analysis techniques; p. 141–174.
- Directorate for the Quality of Medicines; Healthcare of the Council of Europe. Measurement of Consistency by Penetrometry. In European Pharmacopoeia; 11th ed.; Council of Europe: Strasbourg, France, 2022; p. p 360. [Google Scholar]
- Parente, M.E.; Ochoa Andrade, A.; Ares, G.; Russo, F.; Jiménez-Kairuz, Á. Bioadhesive hydrogels for cosmetic applications. Int J Cosmet Sci. 2015, 37, 511–518. [Google Scholar] [CrossRef] [PubMed]
- Directorate for the Quality of Medicines; Healthcare of the Council of Europe. Potentiometric Determination of pH. European Pharmacopeia; 11th edition; EDQM Council of Europe: Strasbourg, France, 2022. [Google Scholar]
- NC3Rs. Revision of the ARRIVE Guidelines. https://nc3rs.org.uk/our-portfolio/revision-arrive-guidelines (accessed accessed Jan 1, 2025).
- Lipinski, C.A.; Lombardo, F.; Dominy, B.W.; Feeney, P.J. Experimental and computational approaches to estimate the solubility and pemeability in drug discovery and development settings. Adv Drug Deliv Rev. 2001, 46, 3–26. [Google Scholar] [CrossRef]
- Bos, J.D.; Meinardi, M.M. The 500 Dalton rule for the skin penetration of chemical compounds and drugs. Exp Dermatol. 2000, 9, 165–169. [Google Scholar] [CrossRef]
- Schreml, S.; Szeimies, R.M.; Karrer, S.; Heinlin, J.; Landthaler, M.; Babilas, P. The impact of the pH value on skin integrity and cutaneous wound healing. J. Eur Acad. Dermatol. Venereol. 2010, 24, 373–378. [Google Scholar] [CrossRef]
- Wilkinson, H.N.; Hardman, M.J. Wound healing: cellular mechanism and pathological outcomes. Open Biol. 2020, 10, 200223. [Google Scholar] [CrossRef]
- Percival, S.L.; McCarty, S.M.; Lipsky, B. Biofilms and wounds: An overview of the evidence. Adv. Wound Care, 2015; 4, 373–381. [Google Scholar] [CrossRef]
- Gethin, G. The Significance of Surface pH in Chronic Wounds. Wounds UK 2007, 3, 52–56. [Google Scholar]
- Chen, Y.; Quan, P.; Liu, X.; Wang, M.; Fang, L. Novel Chemical Permeation enhancers for Transdermal Drug Delivery. Asian J. Pharm Sci. 2018, 13, 51–64. [Google Scholar] [CrossRef]
- Pecoraro, B.; Tutone, M.; Hoffman, E.; Hutter, V.; Almerico, AM.; Traynor, M. Predicting skin permeability by means of computational approaches: reliability and caveats in pharmaceutical studies. J.Chem Inf Model. 2019, 59, 968–981. [Google Scholar] [CrossRef] [PubMed]
- Patel, A.; Iliopoulos, F.; Caspers, P.J.; Puppes, G.J.; Lane, M.E. In vitro – in vivo correlation in dermal delivery: the role of excipients. Pharmaceutics 2021, 13, 542. [Google Scholar] [CrossRef]
- . Iliopoulos, F.; Caspers, PJ.; Puppels, G.J.; Jane, M.E. Franz cell diffusion testing and quantitative confocal Raman spectroscopy: in vitro-in vivo correlation. Pharmaceutics 2020, 12, 887. [Google Scholar] [CrossRef] [PubMed]
- Mewis, J.; Wagner, N.J. Thixotropy. Adv Colloid Interface Sci. 2009, 147–148, 214–227. [Google Scholar] [CrossRef]
- Barroso, N.G.; Okuro, P.K.; Ribeiro, A.P. B.; Cunha, R.L. Tailoring properties of mixed-component oleogels: wax and monoglyceride interactions towards flaxseed oil structuring. Gels 2020, 6, 5. [Google Scholar] [CrossRef]
- Martín-Alfonso, M.A.; Rubio-Valle, J.F.; Hinestroza, J.P.; Martín-Alfonso, J.E. Impact of vegetable oil type on the rheological and tribological behavior of montmorillonite-based oleogels. Gels 2022, 8, 504. [Google Scholar] [CrossRef]
- Sánchez, R.; Franco, J.M.; Delgado, M.A.; Valencia, C.; Gallegos, C. Rheology of oleogels based on sorbitan and glycerol monostearates and vegetable oils for lubricating applications. Grasas Aceites 2011, 62, 328–336; [Google Scholar] [CrossRef]
- Chaibundit, C.; Ricardo, N.M.; Muryn, C.A.; Madec, M.B. , Yeates, S.G., Booth, C. Effect of ethanol on the gelation of aqueous solutions of Pluronic F127. J. Colloid Interface Sci. 2010, 351, 190–196. [Google Scholar] [CrossRef]
- Fakhari, A.; Corcoran, M.; Schwarz, A. Thermogelling properties of purified Poloxamer 407. Heliiyon 2017, 3, e00390. [Google Scholar] [CrossRef]
- Schneider, L.A.; Korber, A.; Grabbe, S.; Dissemond, J. Influence of pH on wound-healing: a new perspective for wound-therapy? Arch. Dermatol. Res. 2007, 298, 413–420. [Google Scholar] [CrossRef] [PubMed]
- Tang, N.; Zheng, Y.; Jiang, X. , Zhou, C.; Jin, H.; Jin, K., Wu, W., Haick, H. Wearable sensors and systems for wound healing-related pH and temperature detection. Micromachines 2021, 12, 430. [Google Scholar] [CrossRef]
- Ono, S.; Imai, R.; Ida, Y.; Shibata, D.; Komiya, T.; Matsumura, H. Increased wound pH as an indicator of local wound infection in second degree burns. Burns 2015, 41, 820–824. [Google Scholar] [CrossRef]
- Watters, C.; Yuan, T.T.; Rumbaugh, K.P. Beneficial and deleterious bacterial-host interactions in chronic wound pathophysiology. Chronic Wound Care Manag. Res. 2015, 2, 53–62. [Google Scholar] [CrossRef]
- Martínez-Jiménez, M.A.; Aguilar-García, J.; Valdés-Rodríguez, R. Metlich-Medlich, M.A.; Dietsch, L.J.P. Gaitán-Gaona, F.I. Kolosovas-Machuca; González, F.J. Sánchez-Aguilar, J.M. Local Use of insulin in wounds of diabetic patients: higher temperature, fibrosis, and angiogenesis. Plast. Reconstr. Surg. 2013, 132, 1015e–1019e. [Google Scholar] [CrossRef] [PubMed]
- Nakagami, G.; Sanada, H.; Iizaka, S.; Kadono, T.; Higashino, T.; Koyanagi, H.; Haga, N. Predicting Delayed Pressure Ulcer Healing Using Thermography: A Prospective Cohort Study. J. Wound Care 2010, 19, 465–472. [Google Scholar] [CrossRef]
- Wilmore, D.W.; Aulick, L.H.; Mason, A.D., Jr.; Pruitt, B.A., Jr. Influence of the Burn Wound on Local and Systemic Responses to Injury. Ann. Surg. 1977, 186, 444. [Google Scholar] [CrossRef]
- Wijlens, A.M.; Holloway, S.; Bus, S.A.; van Netten, J.J. An Explorative Study on the Validity of Various Definitions of a 2.2 °C Temperature Threshold as Warning Signal for Impending Diabetic Foot Ulceration. Int. Wound J. 2017, 14, 1346–1351. [Google Scholar] [CrossRef]
- Armstrong, D.G.; Holtz-Neiderer, K.; Wendel, C.; Mohler, M.J.; Kimbriel, H.R.; Lavery, L.A. Skin temperature monitoring reduces the risk for diabetic foot ulceration in high-risk patients. Am. J. Med. 2007, 120, 1042–1046. [Google Scholar] [CrossRef]
- Heberlé, G.; Dos Santos, M.A.; Magri, S. Cosmetic formulations containing blueberry extracts (Vaccinium myrtillus L.). TOJSAT 2012, 2, 1–6. [Google Scholar]
- Da-Lozzo, E.J.; Moledo, R.C.; Faraco, C.D.; Ortolani-Machado, C.F.; Bresolin, T.M.; Silveira, J.L. Curcumin/Xanthan-Galactomannan hydrogels: Rheological analysis and biocompatibility. Carbohydr. Polym. 2013, 93, 279–284. [Google Scholar] [CrossRef] [PubMed]
- Ali, S.M.; Yosipovitch, G. Skin pH: from basic science to basic skin care. Acta Derm. Venereol. 2013, 93, 261–267. [Google Scholar] [CrossRef] [PubMed]
- Power, G.; Moore, Z.; O’Connor, T. Measurement of pH, exudate composition and temperature in wound healing: A systematic review. J. Wound Care 2017, 26, 381–397. [Google Scholar] [CrossRef] [PubMed]
Figure 1.
Comparative quantitative analysis of major phenolic compounds in selected plant extracts.
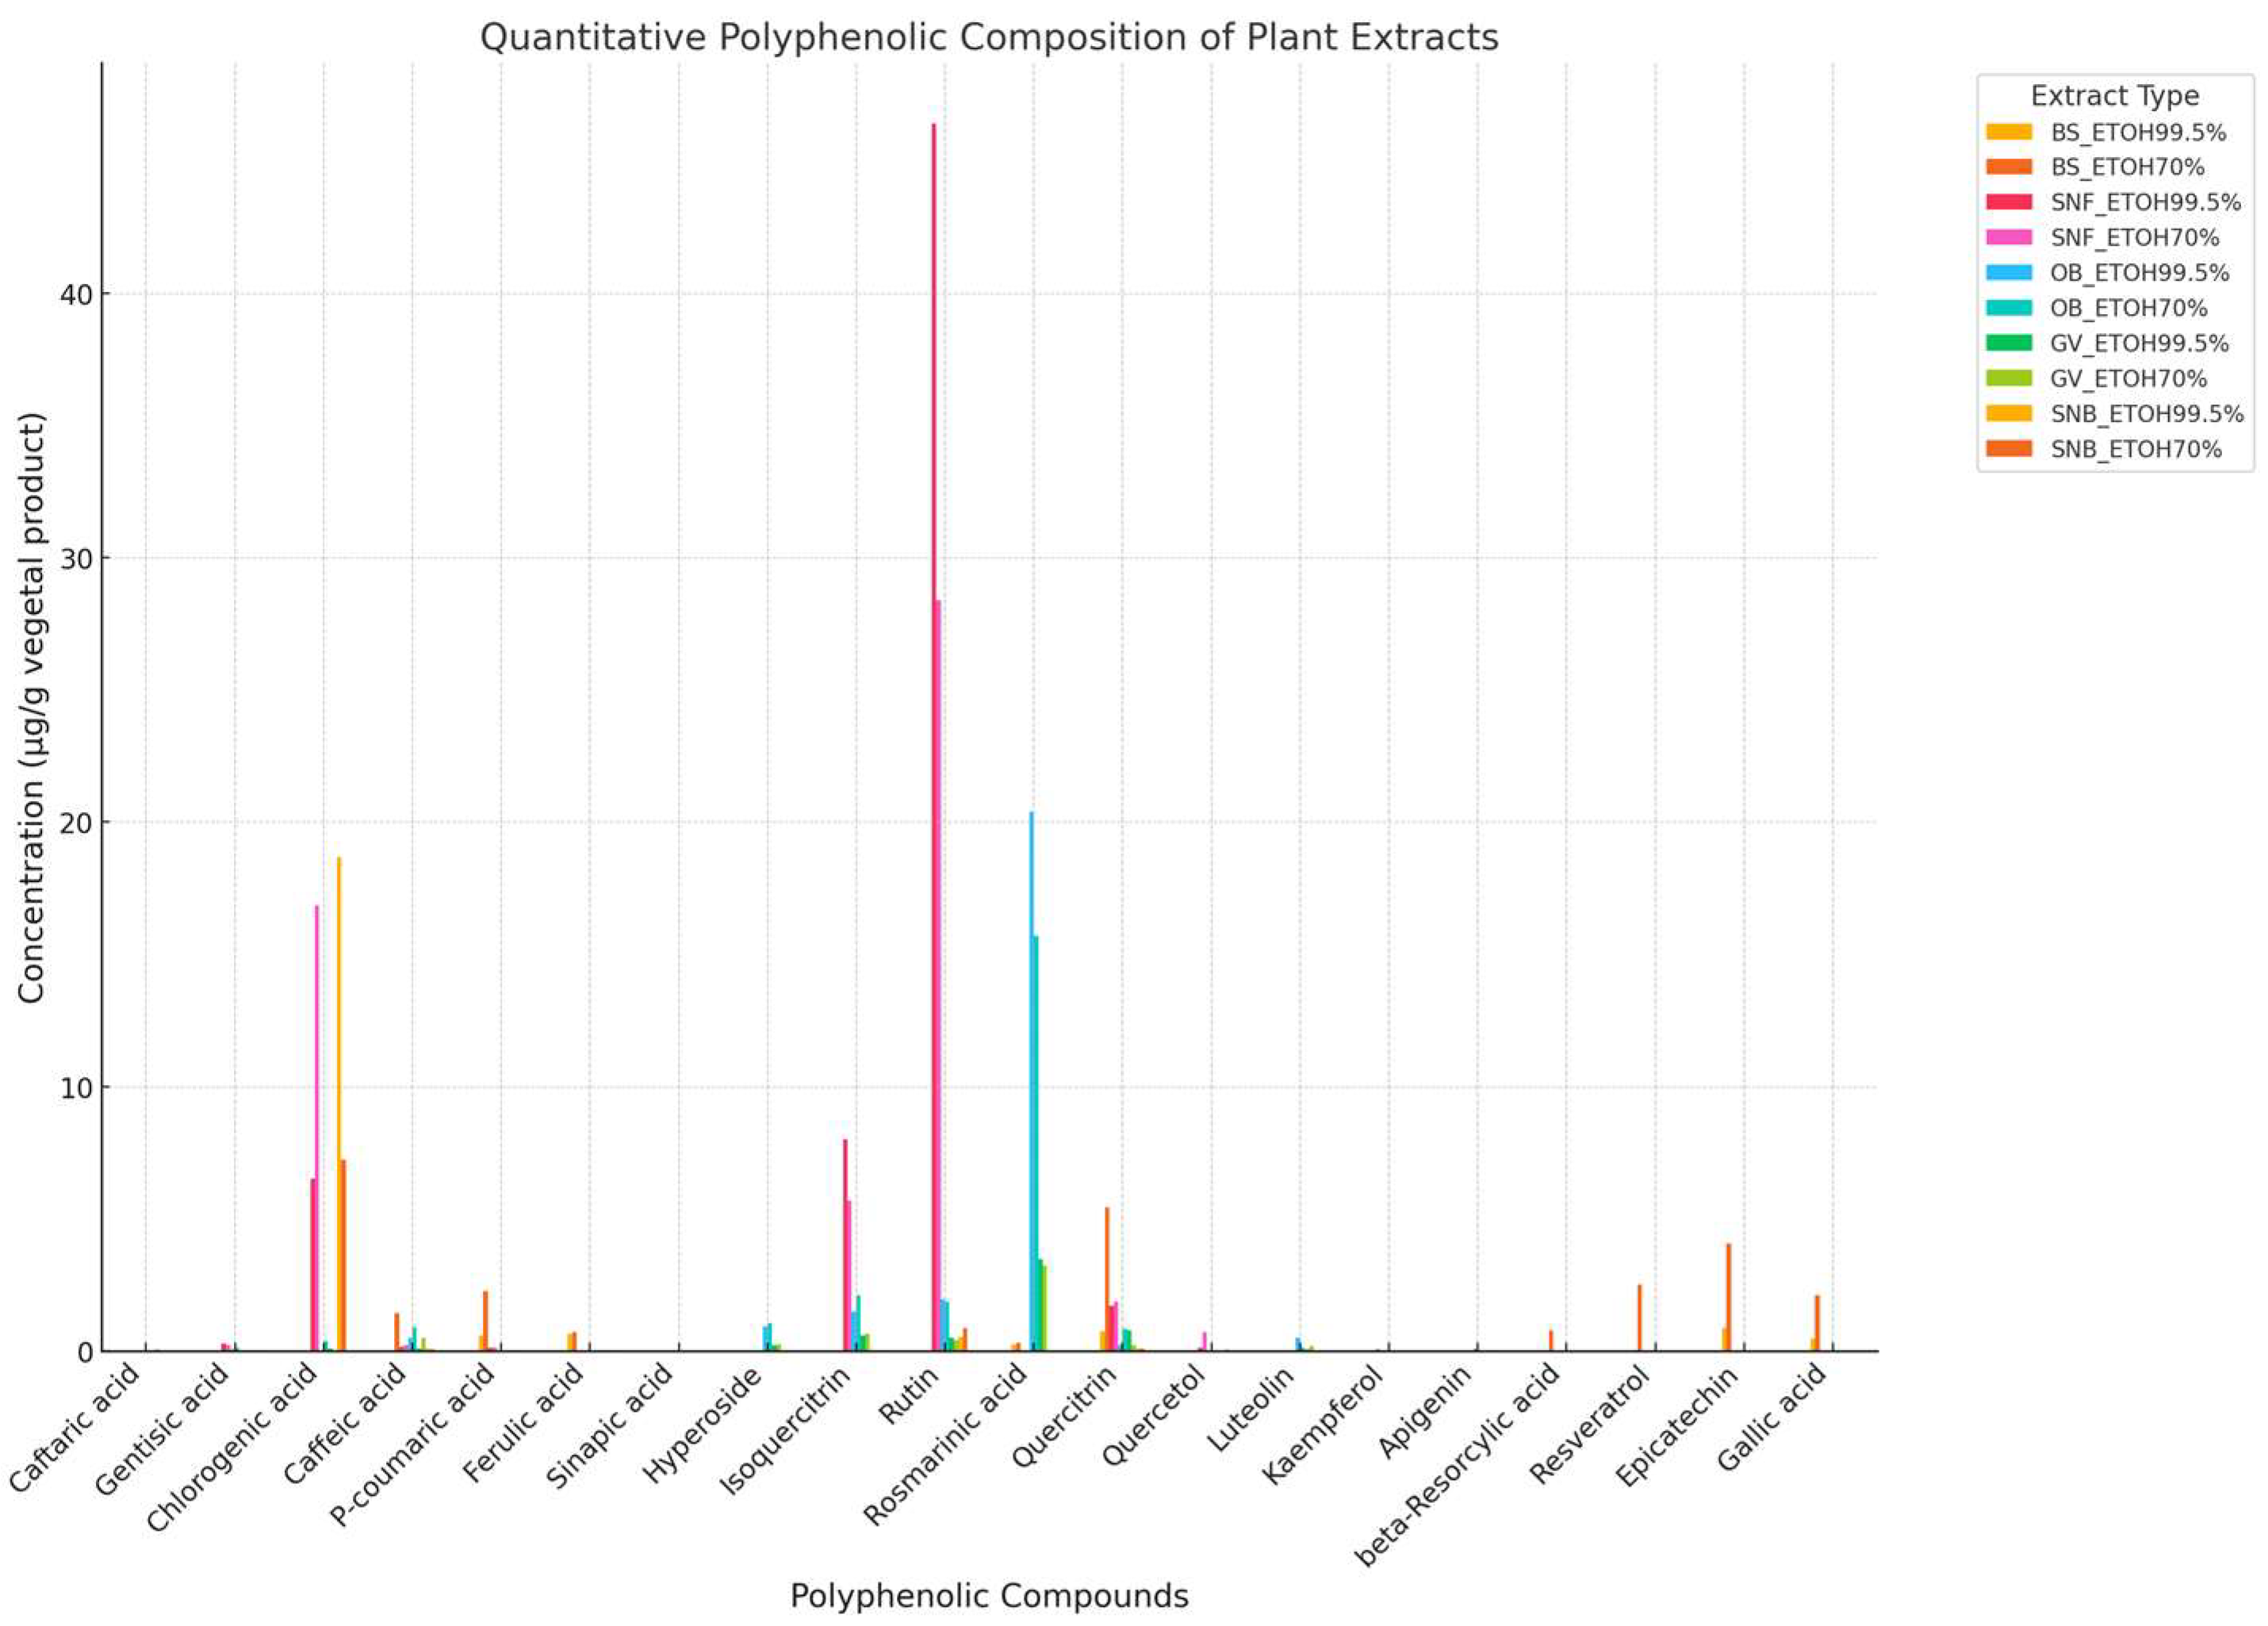
Figure 3.
Determination of pH Values for Oleogel (OG) and Hydrogel (HG) Formulations.
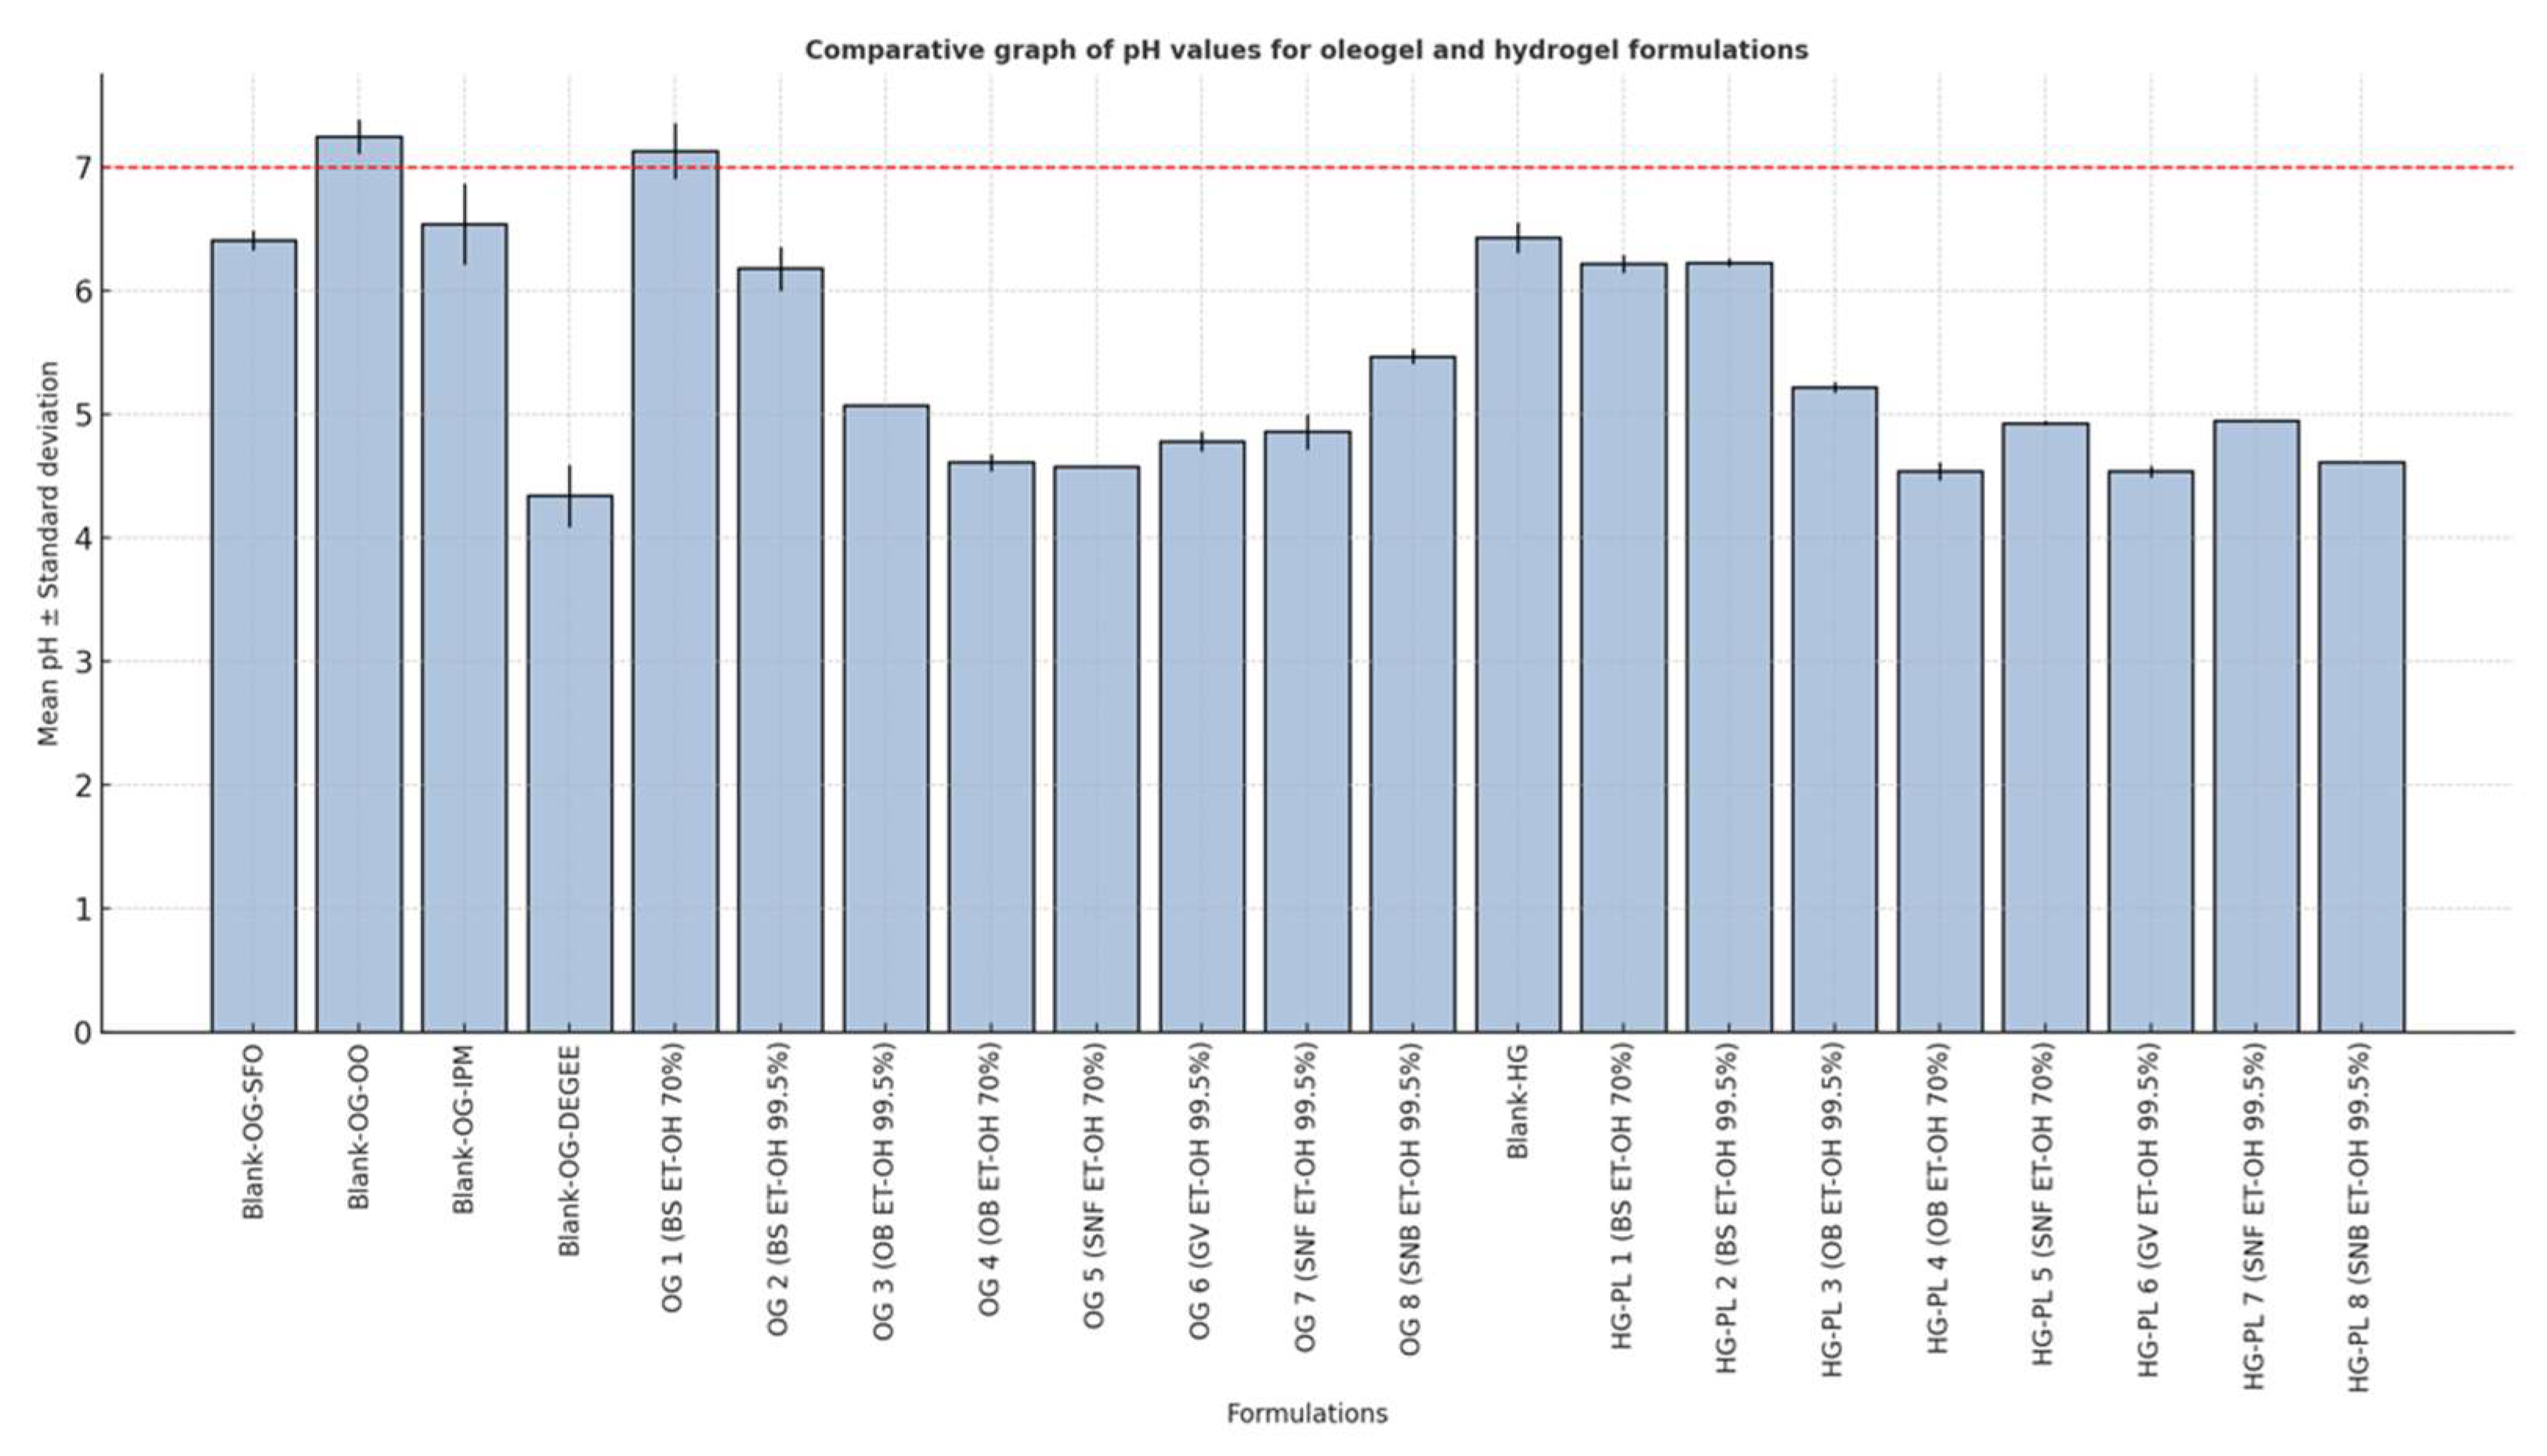
Figure 4.
Rheological curves (tension and viscosity) of Blank-OG-SFO (control).
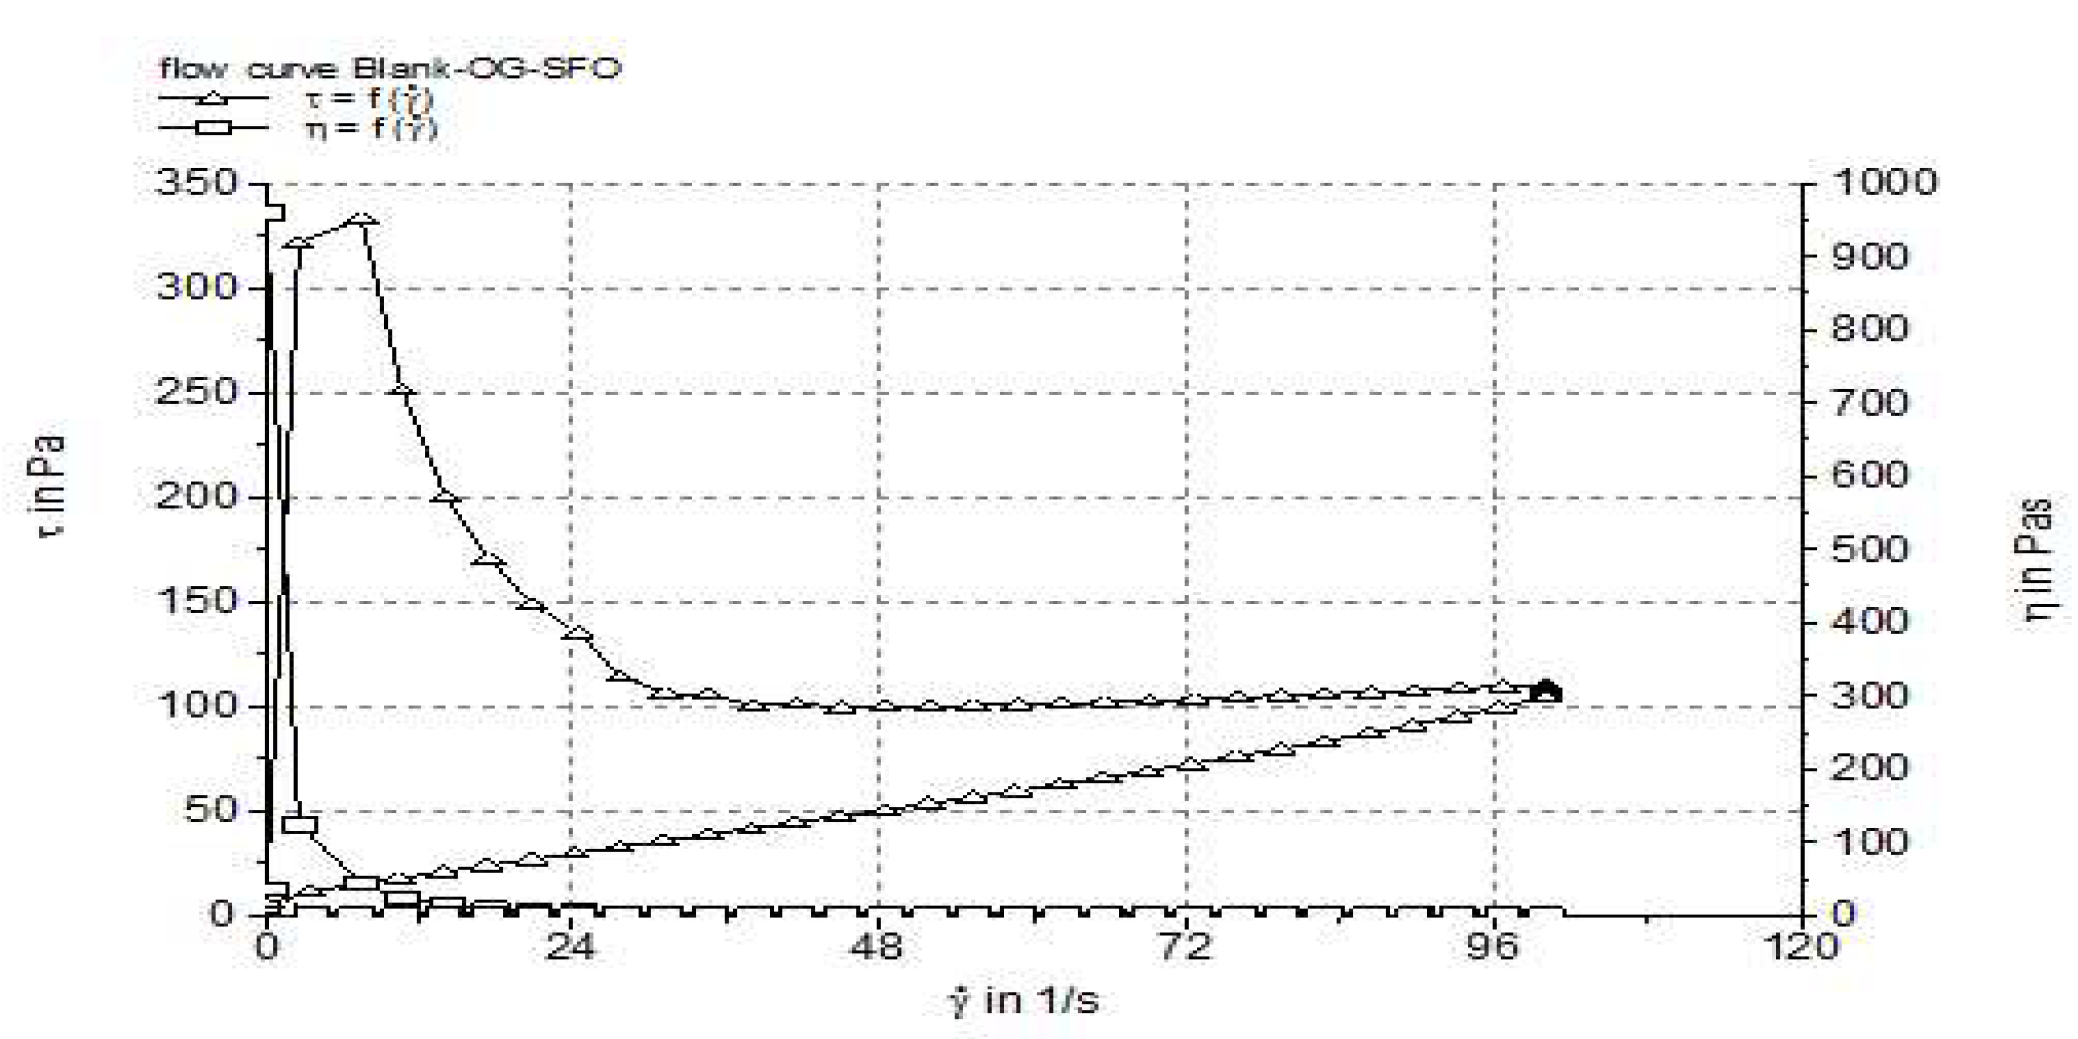
Figure 5.
Comparative rheological curves (tension and viscosity) of formulations OG 1 (70% ethanol) and OG 2 (99.5% ethanol) based on frankincense extract and sunflower oil.
Figure 5.
Comparative rheological curves (tension and viscosity) of formulations OG 1 (70% ethanol) and OG 2 (99.5% ethanol) based on frankincense extract and sunflower oil.
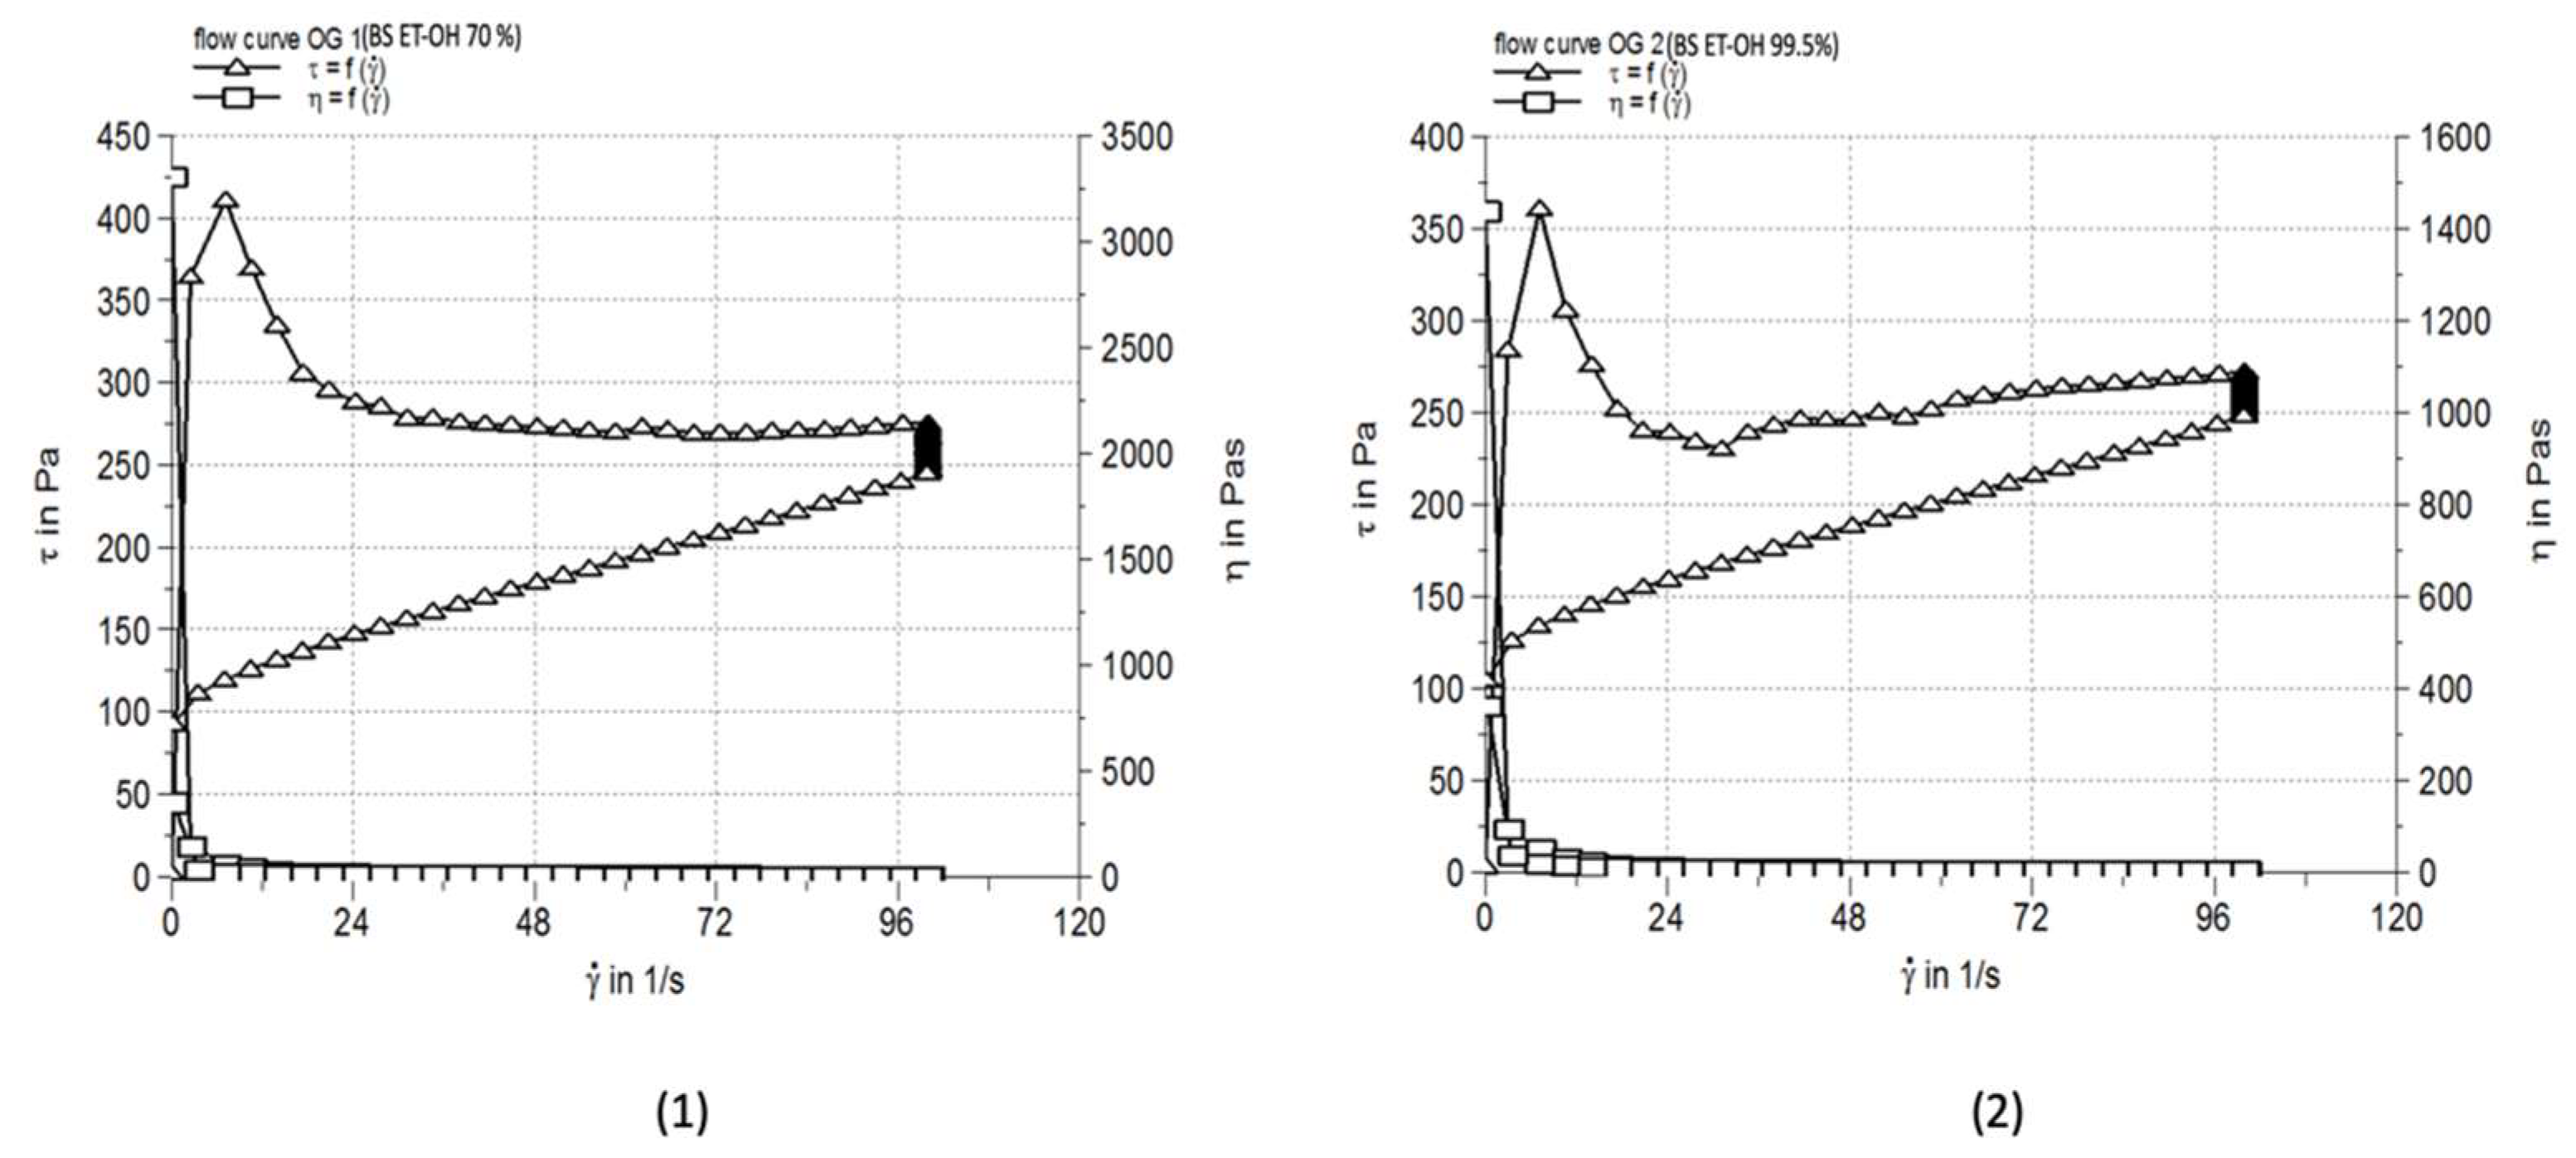
Figure 6.
Comparative rheograms (shear stress and dynamic viscosity) of OG 3 (basil extract, 99.5% ethanol) and OG 8 (elder bark-branch extract, 99.5% ethanol) formulations versus Blank-OG-SFO.
Figure 6.
Comparative rheograms (shear stress and dynamic viscosity) of OG 3 (basil extract, 99.5% ethanol) and OG 8 (elder bark-branch extract, 99.5% ethanol) formulations versus Blank-OG-SFO.
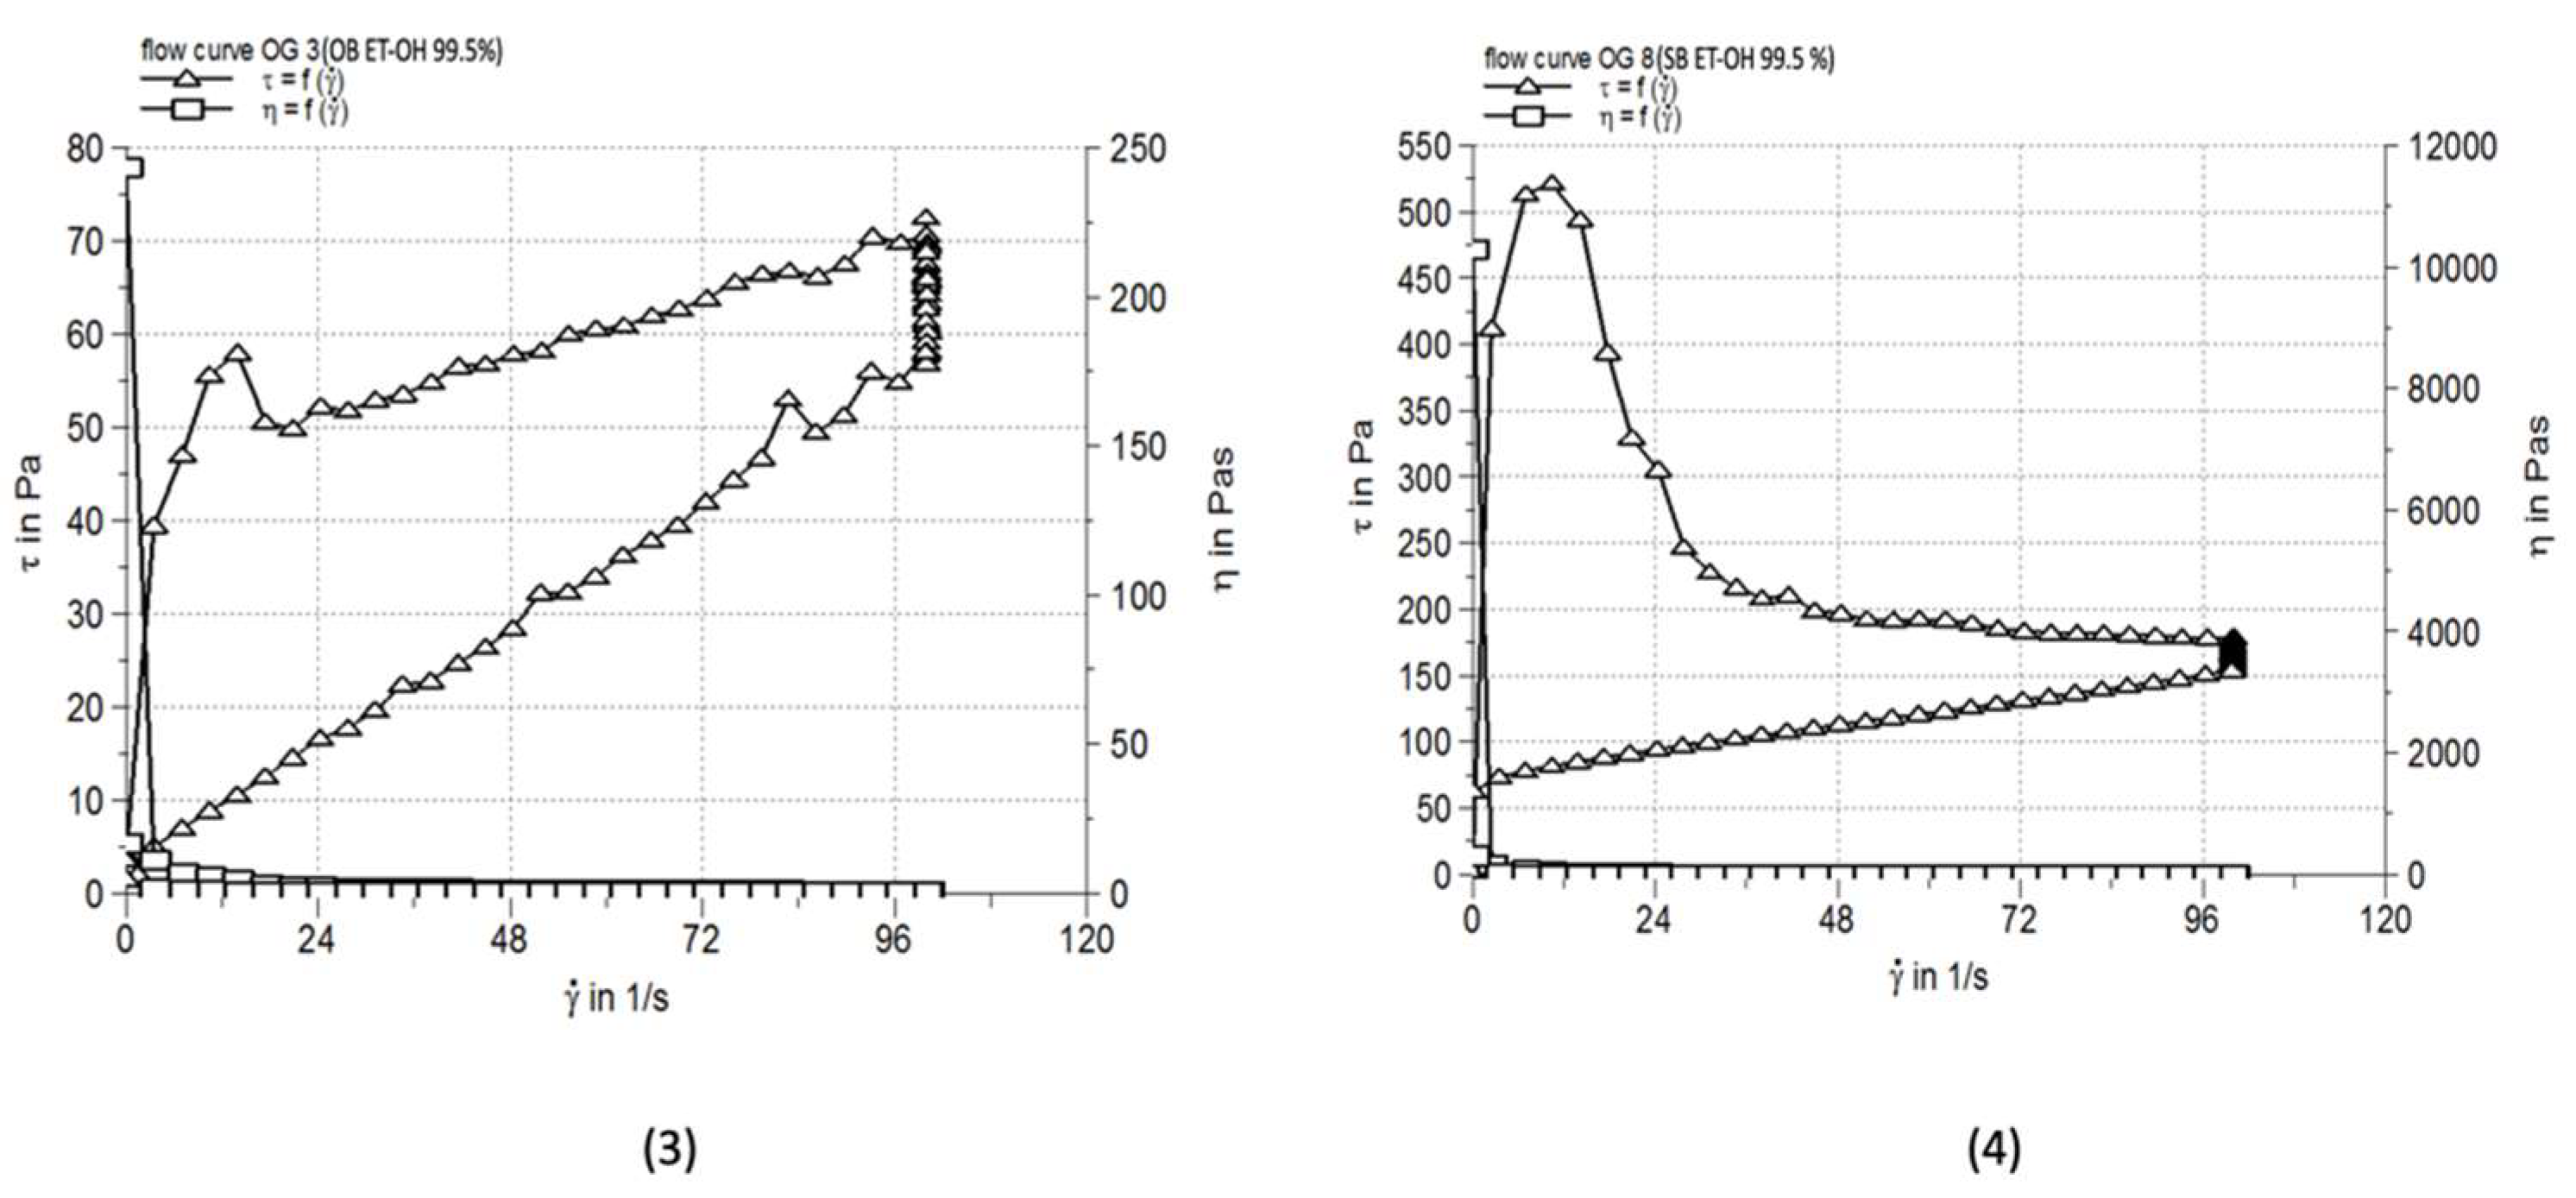
Figure 7.
Comparative analysis of the rheological profile for olive oil-based oleogels loaded with plant extract, compared to the control formulation (Blank-OG-OO).
Figure 7.
Comparative analysis of the rheological profile for olive oil-based oleogels loaded with plant extract, compared to the control formulation (Blank-OG-OO).
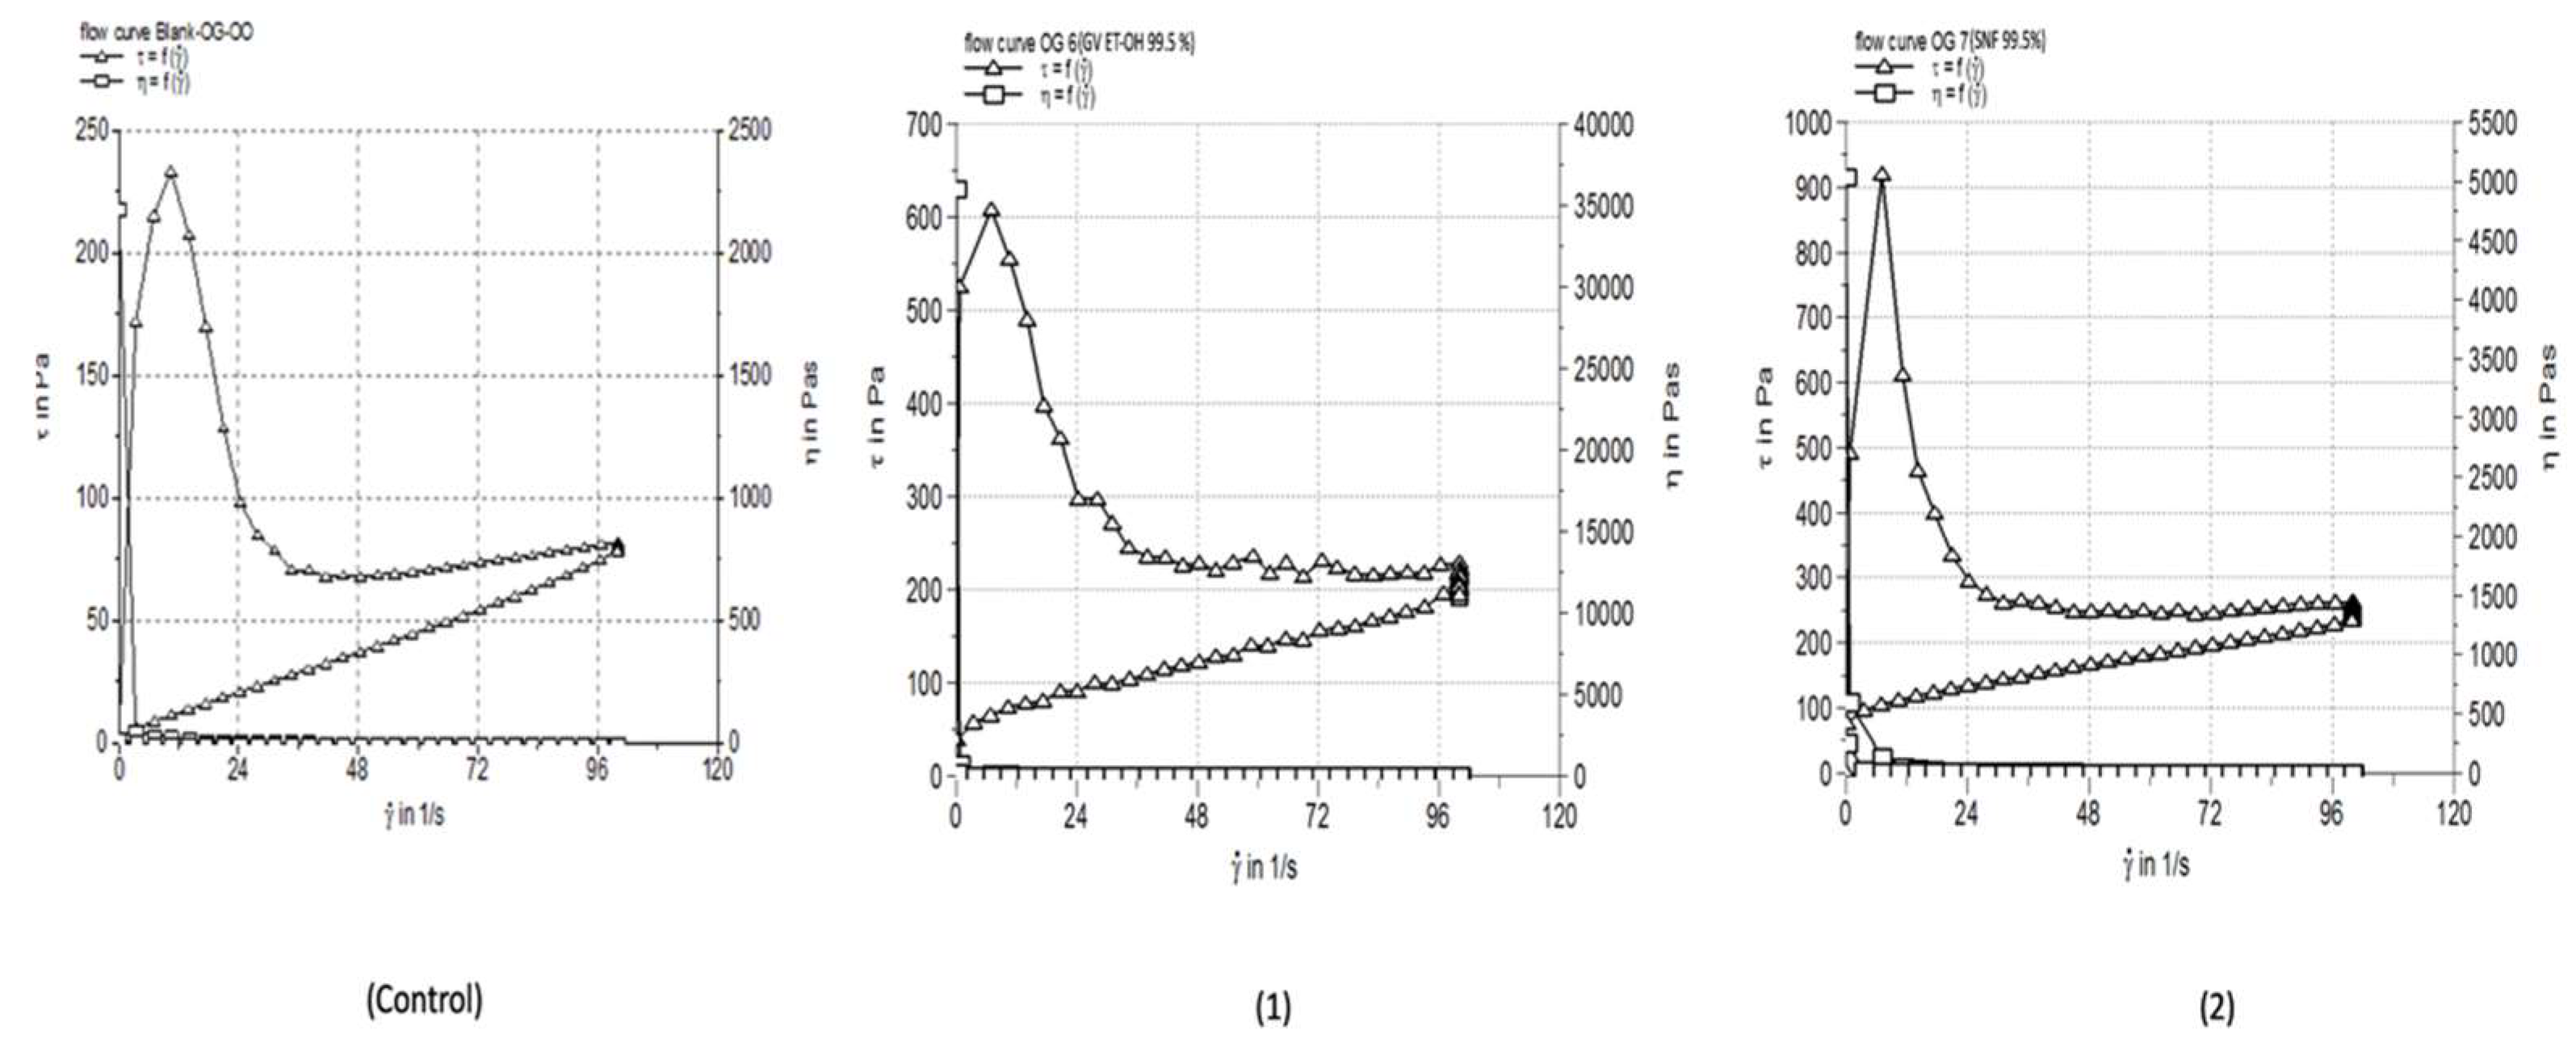
Figure 8.
Flow and viscosity profiles of plant extract-loaded oleogels based on diethylene glycol monoethyl ether.
Figure 8.
Flow and viscosity profiles of plant extract-loaded oleogels based on diethylene glycol monoethyl ether.
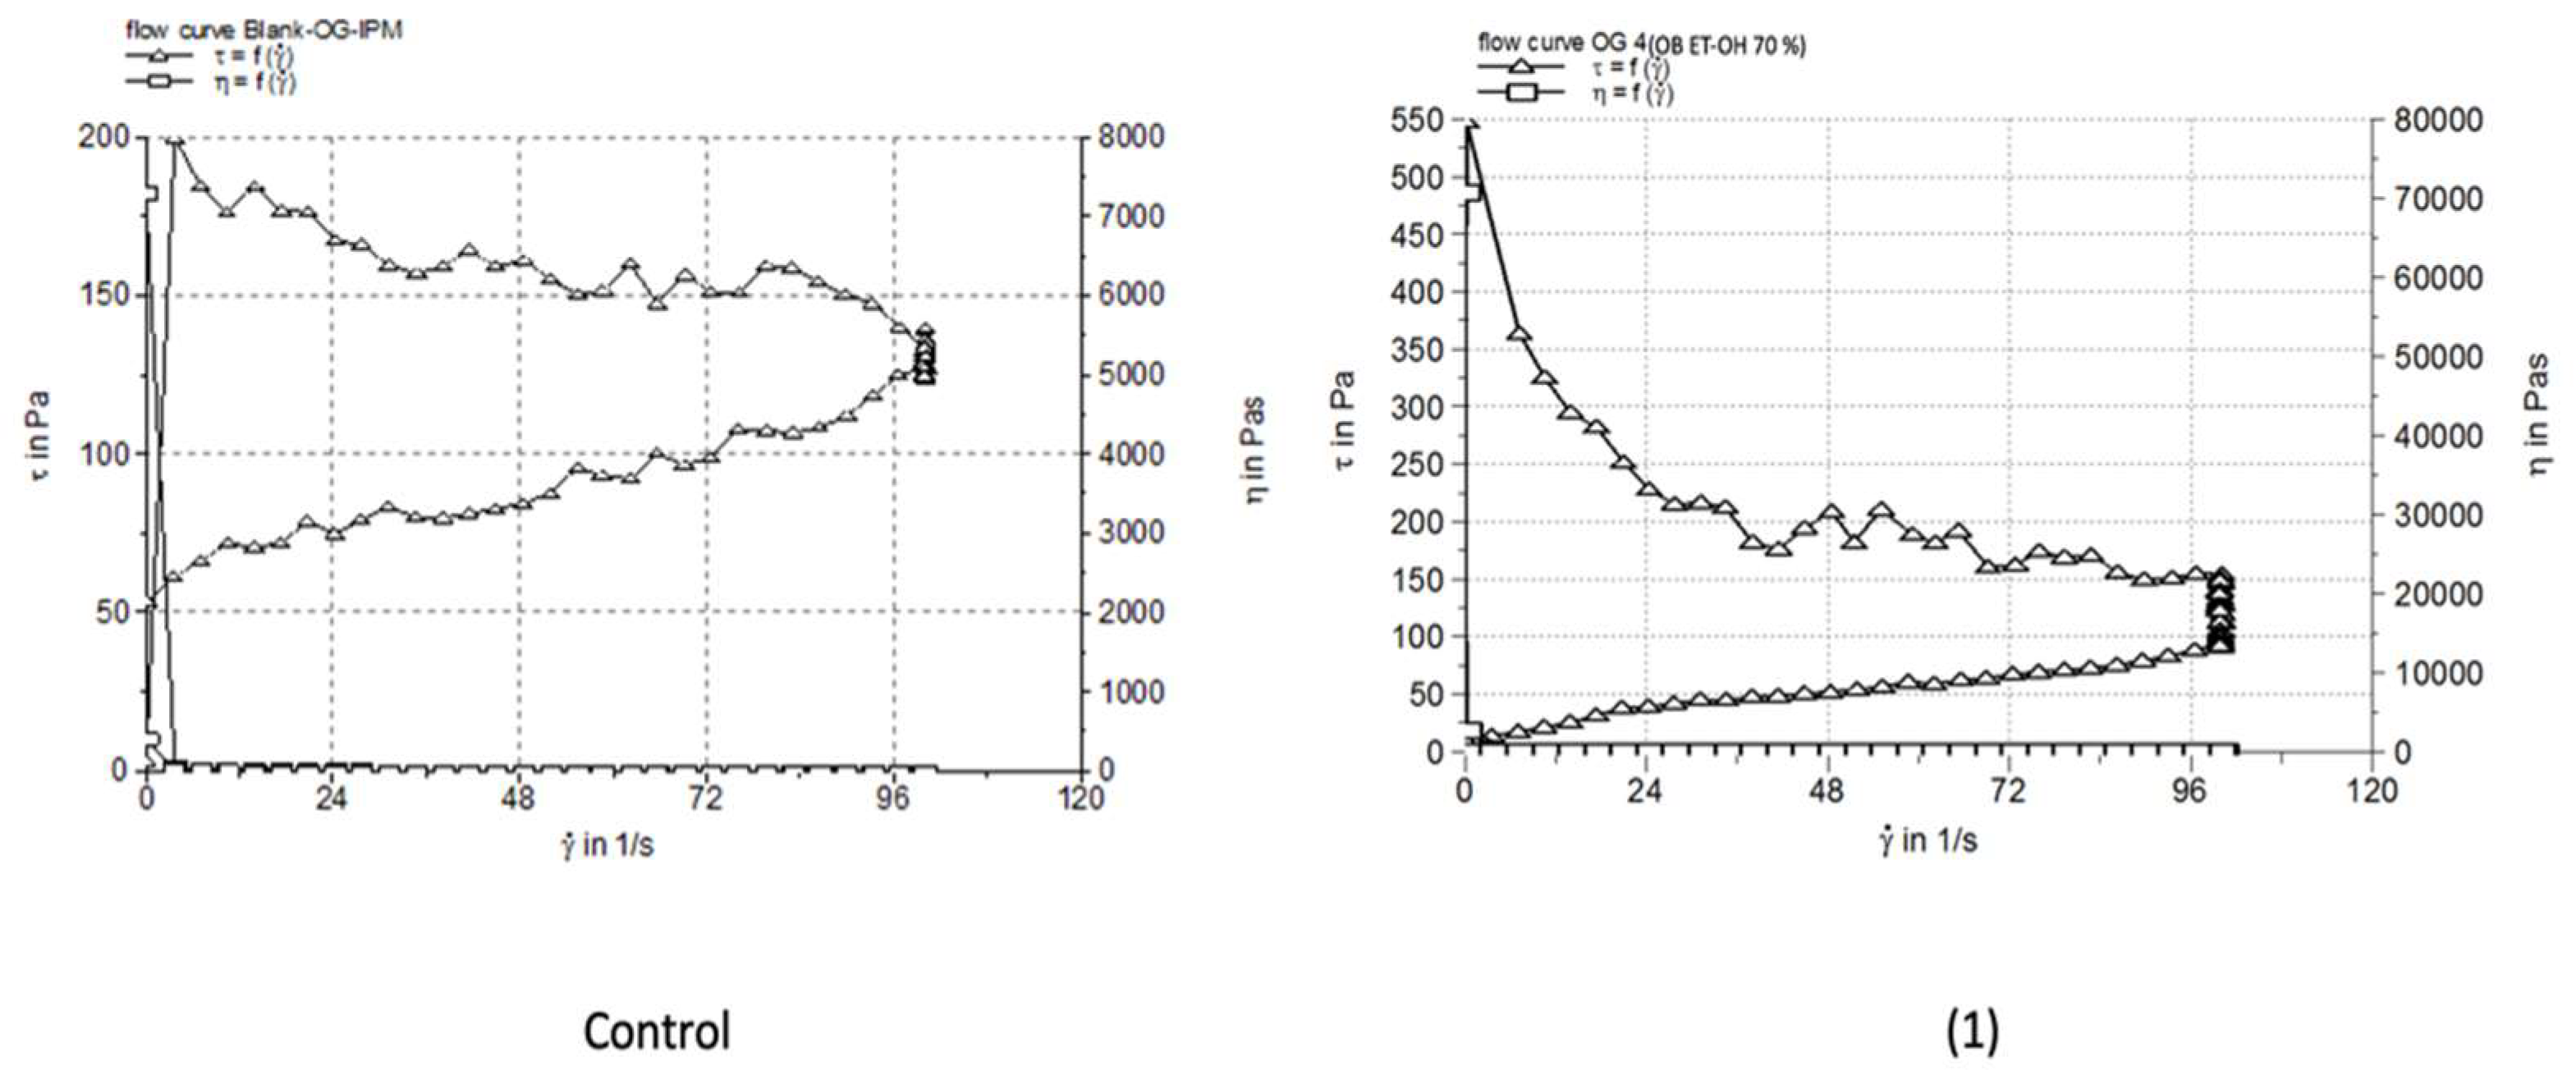
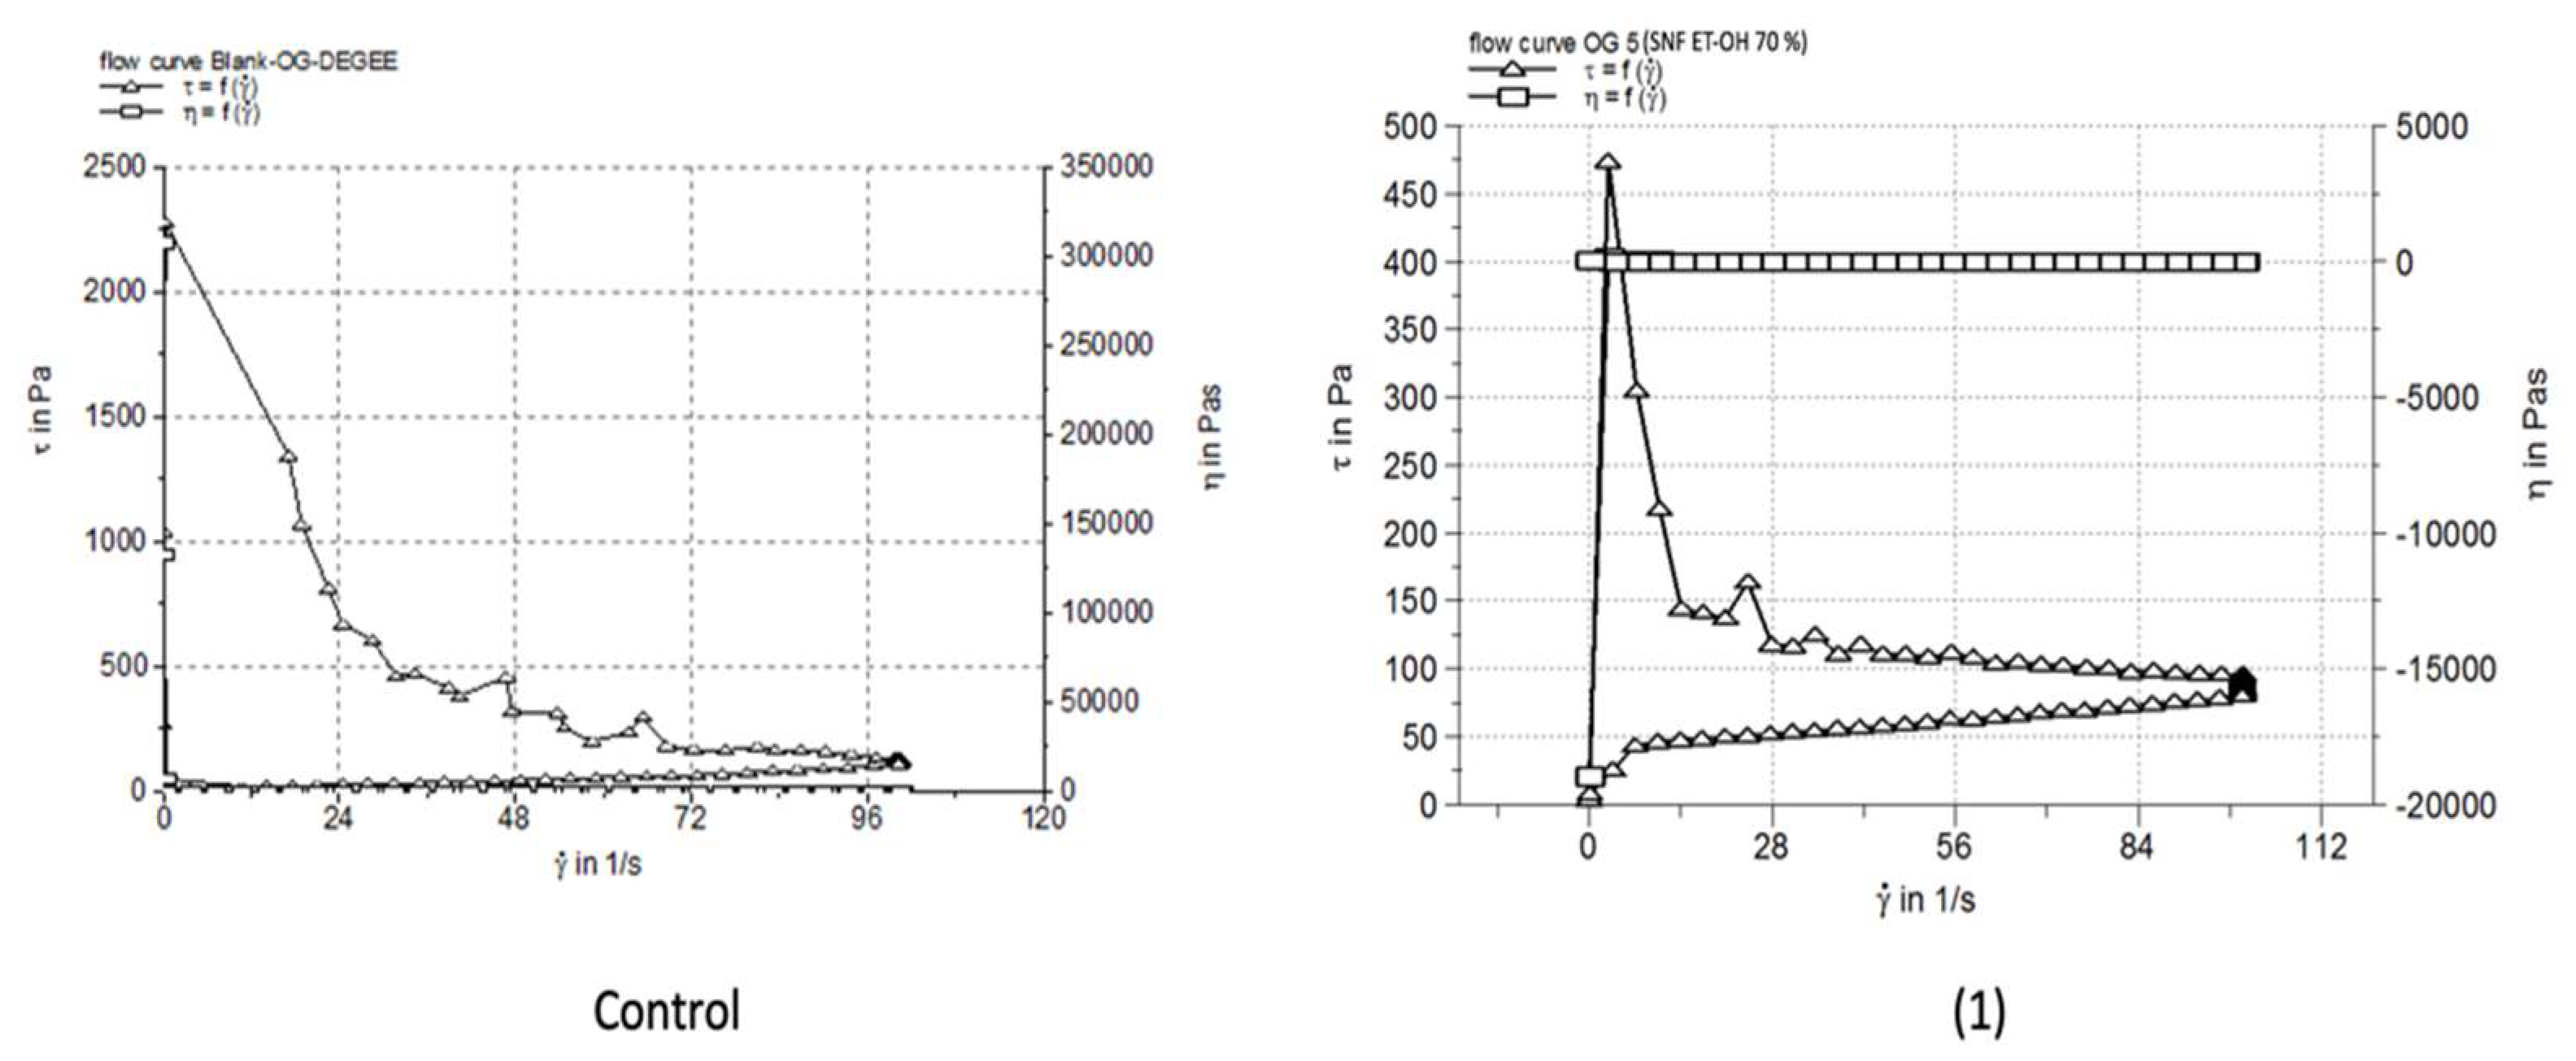
Figure 9.
Analysis of the rheological profile of the Poloxamer 407-based control hydrogel (Blank HG-PL) intended for topical applications.
Figure 9.
Analysis of the rheological profile of the Poloxamer 407-based control hydrogel (Blank HG-PL) intended for topical applications.
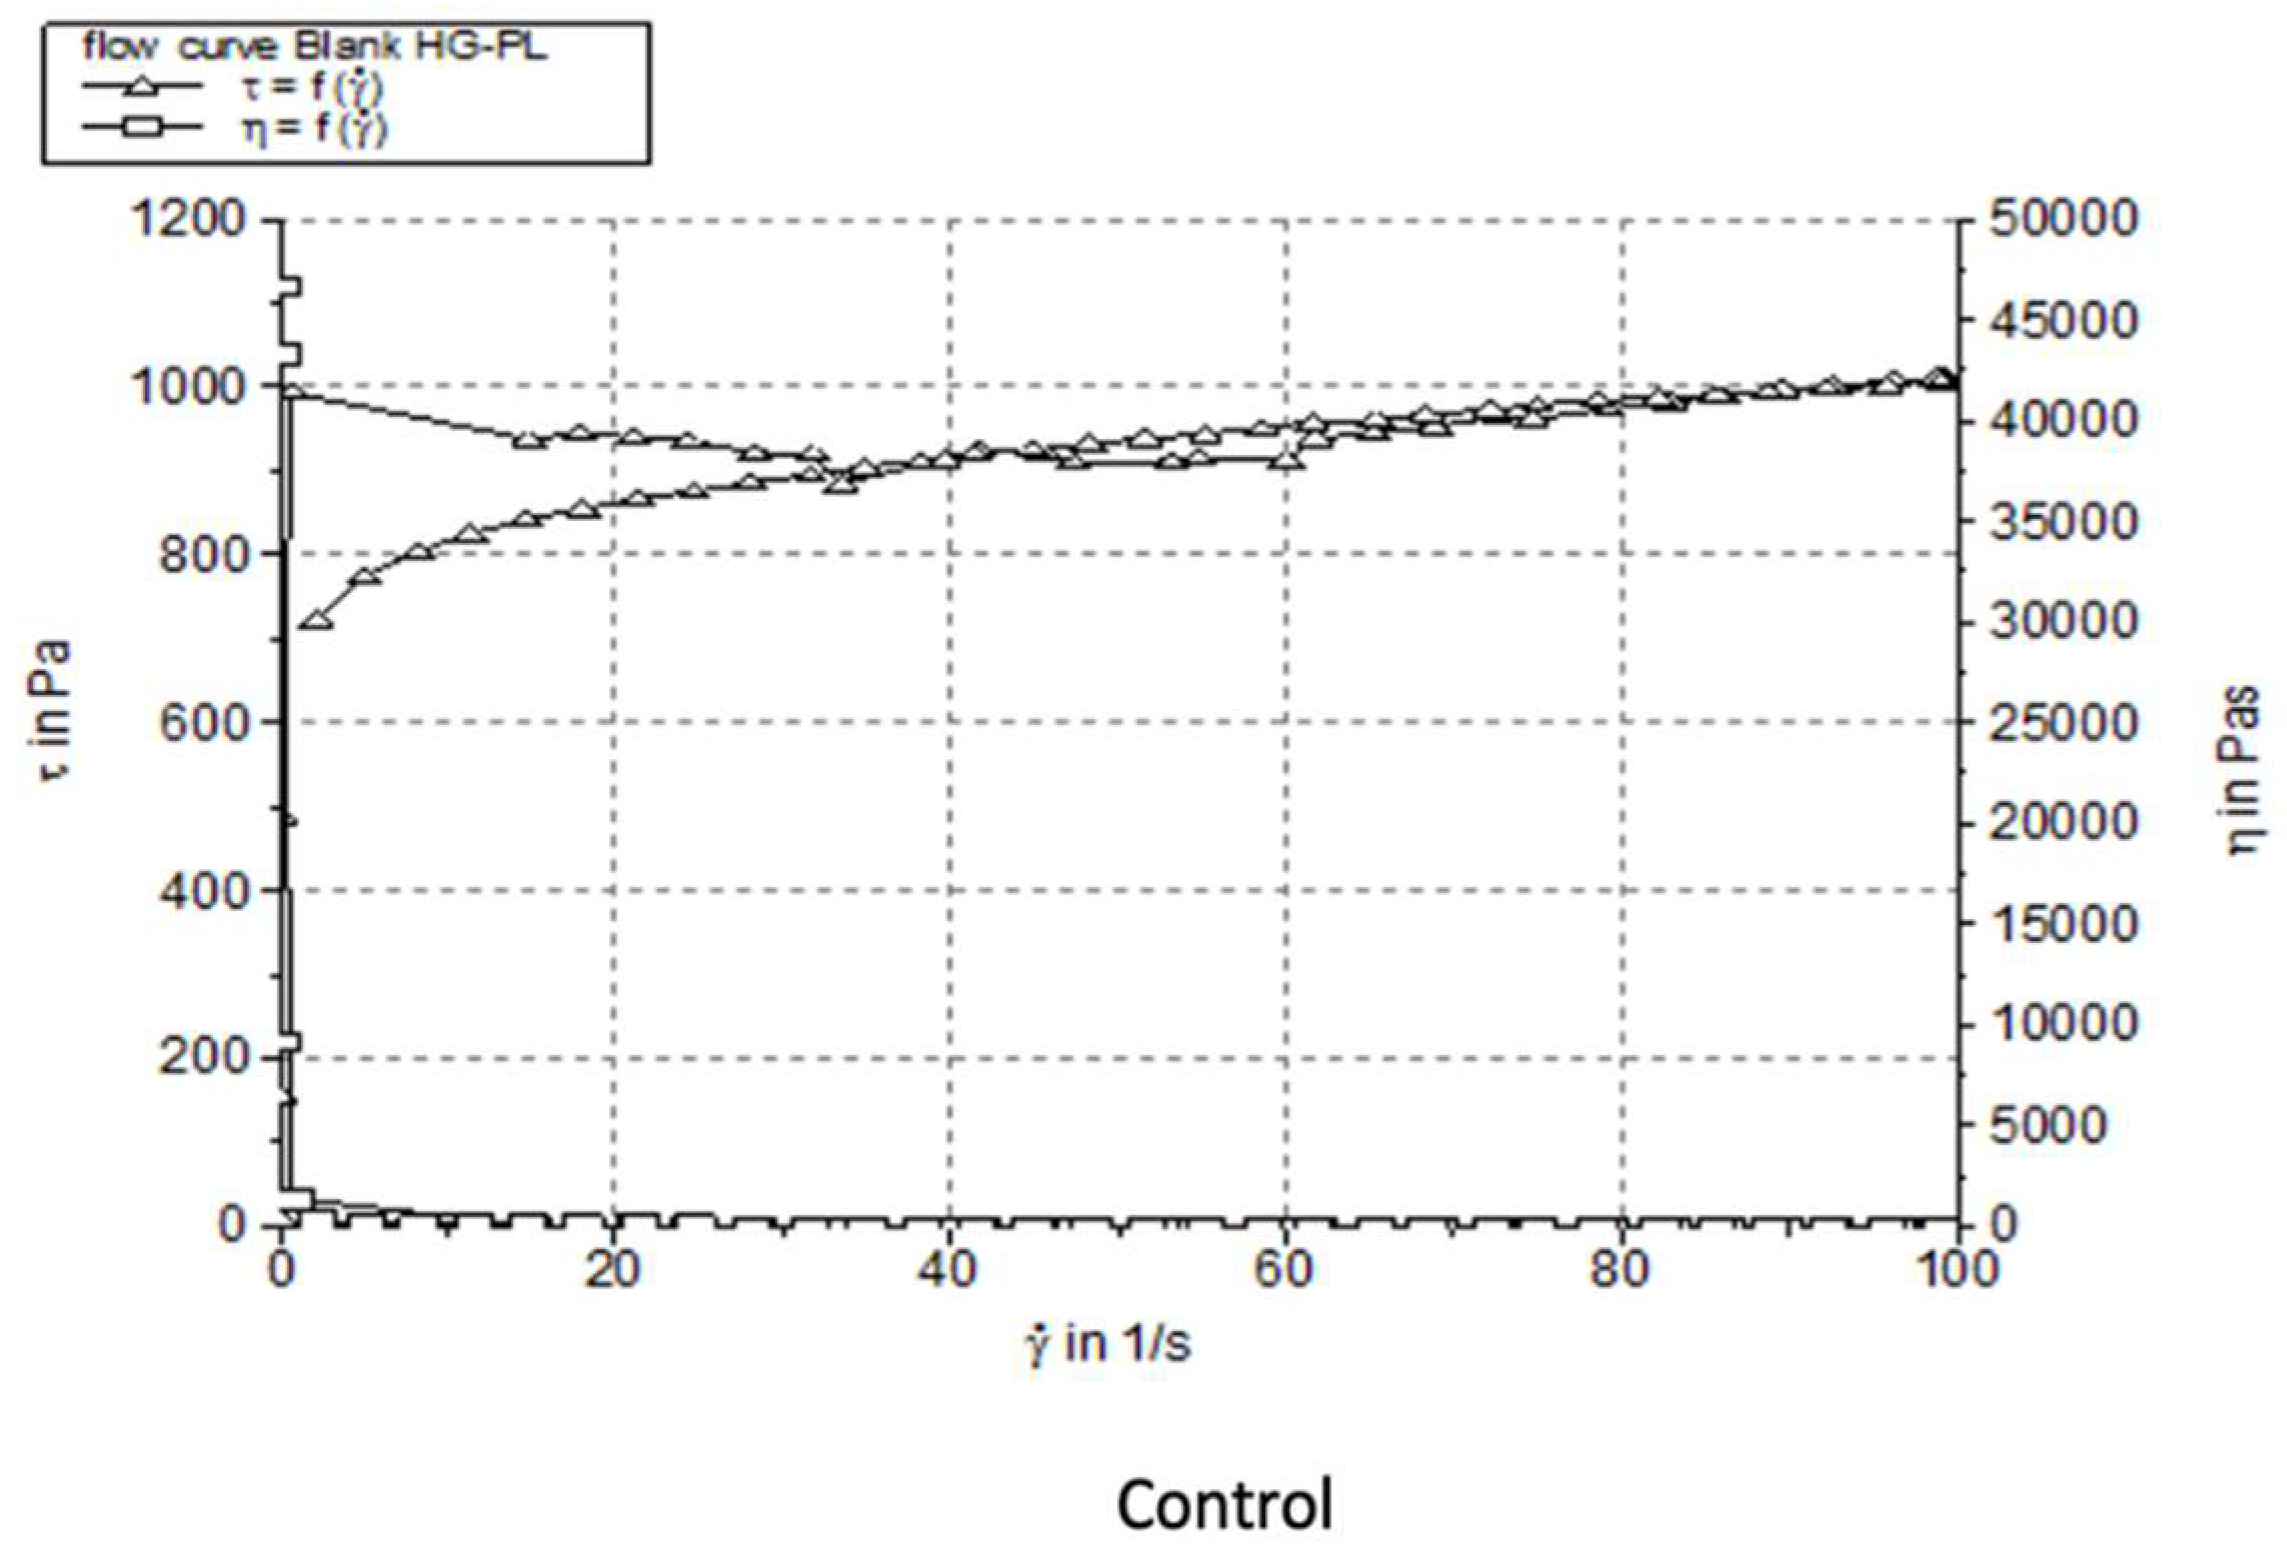
Figure 10.
Comparative rheological profiles (shear stress and dynamic viscosity) of the hydrogels HG-PL 1 (incense extract in 70% ethanol) and HG-PL 2 (incense extract in 99.5% ethanol) compared to the control hydrogel (Blank HG-PL).
Figure 10.
Comparative rheological profiles (shear stress and dynamic viscosity) of the hydrogels HG-PL 1 (incense extract in 70% ethanol) and HG-PL 2 (incense extract in 99.5% ethanol) compared to the control hydrogel (Blank HG-PL).
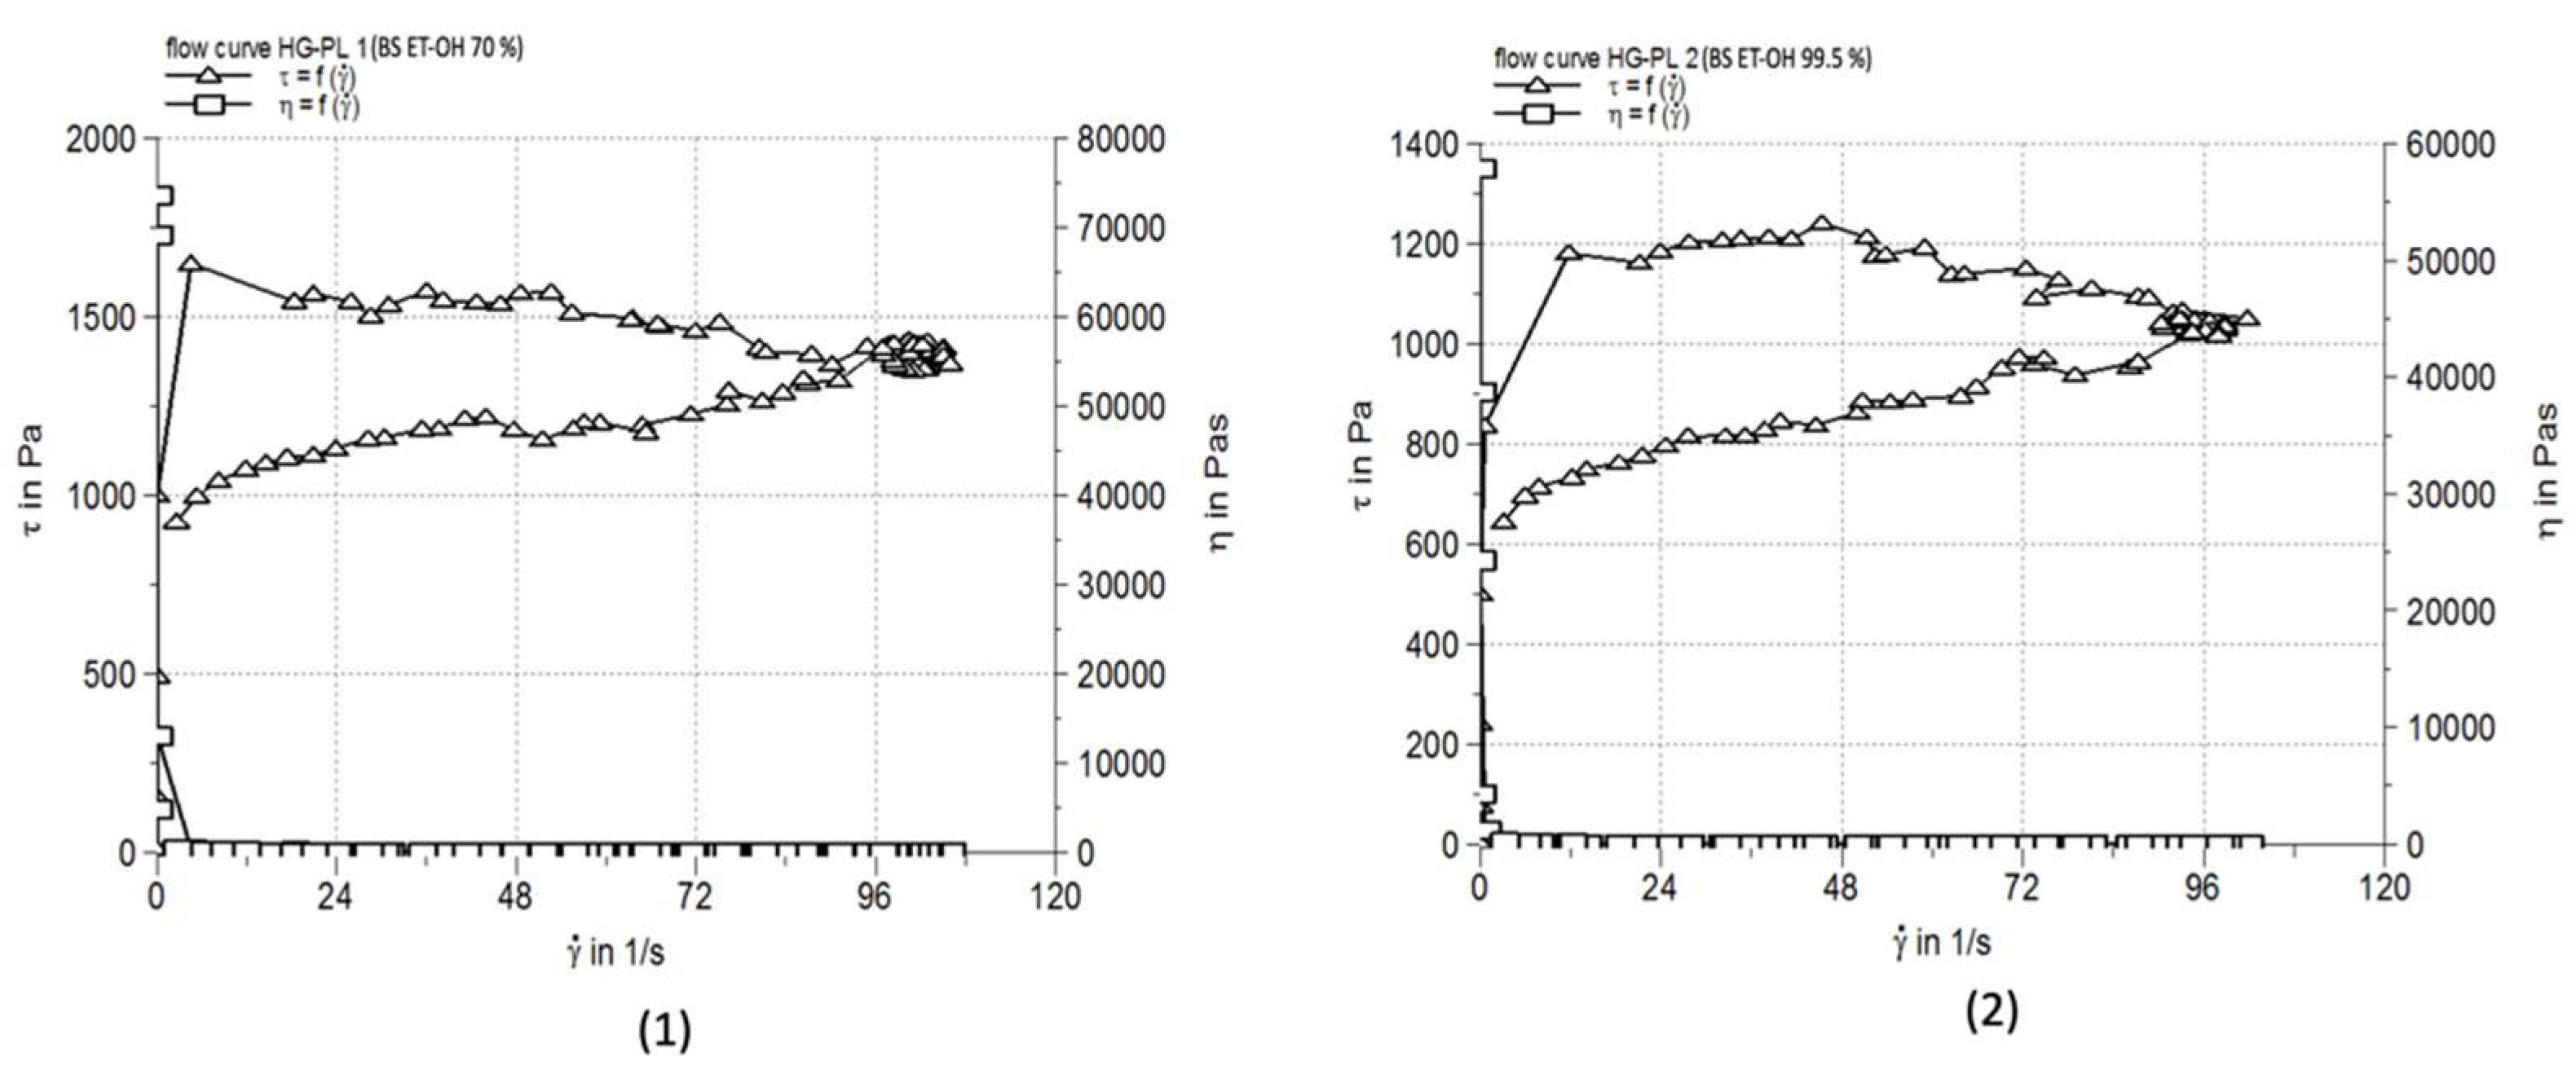
Figure 14.
Spreadability profiles of plant extract-loaded oleogels.
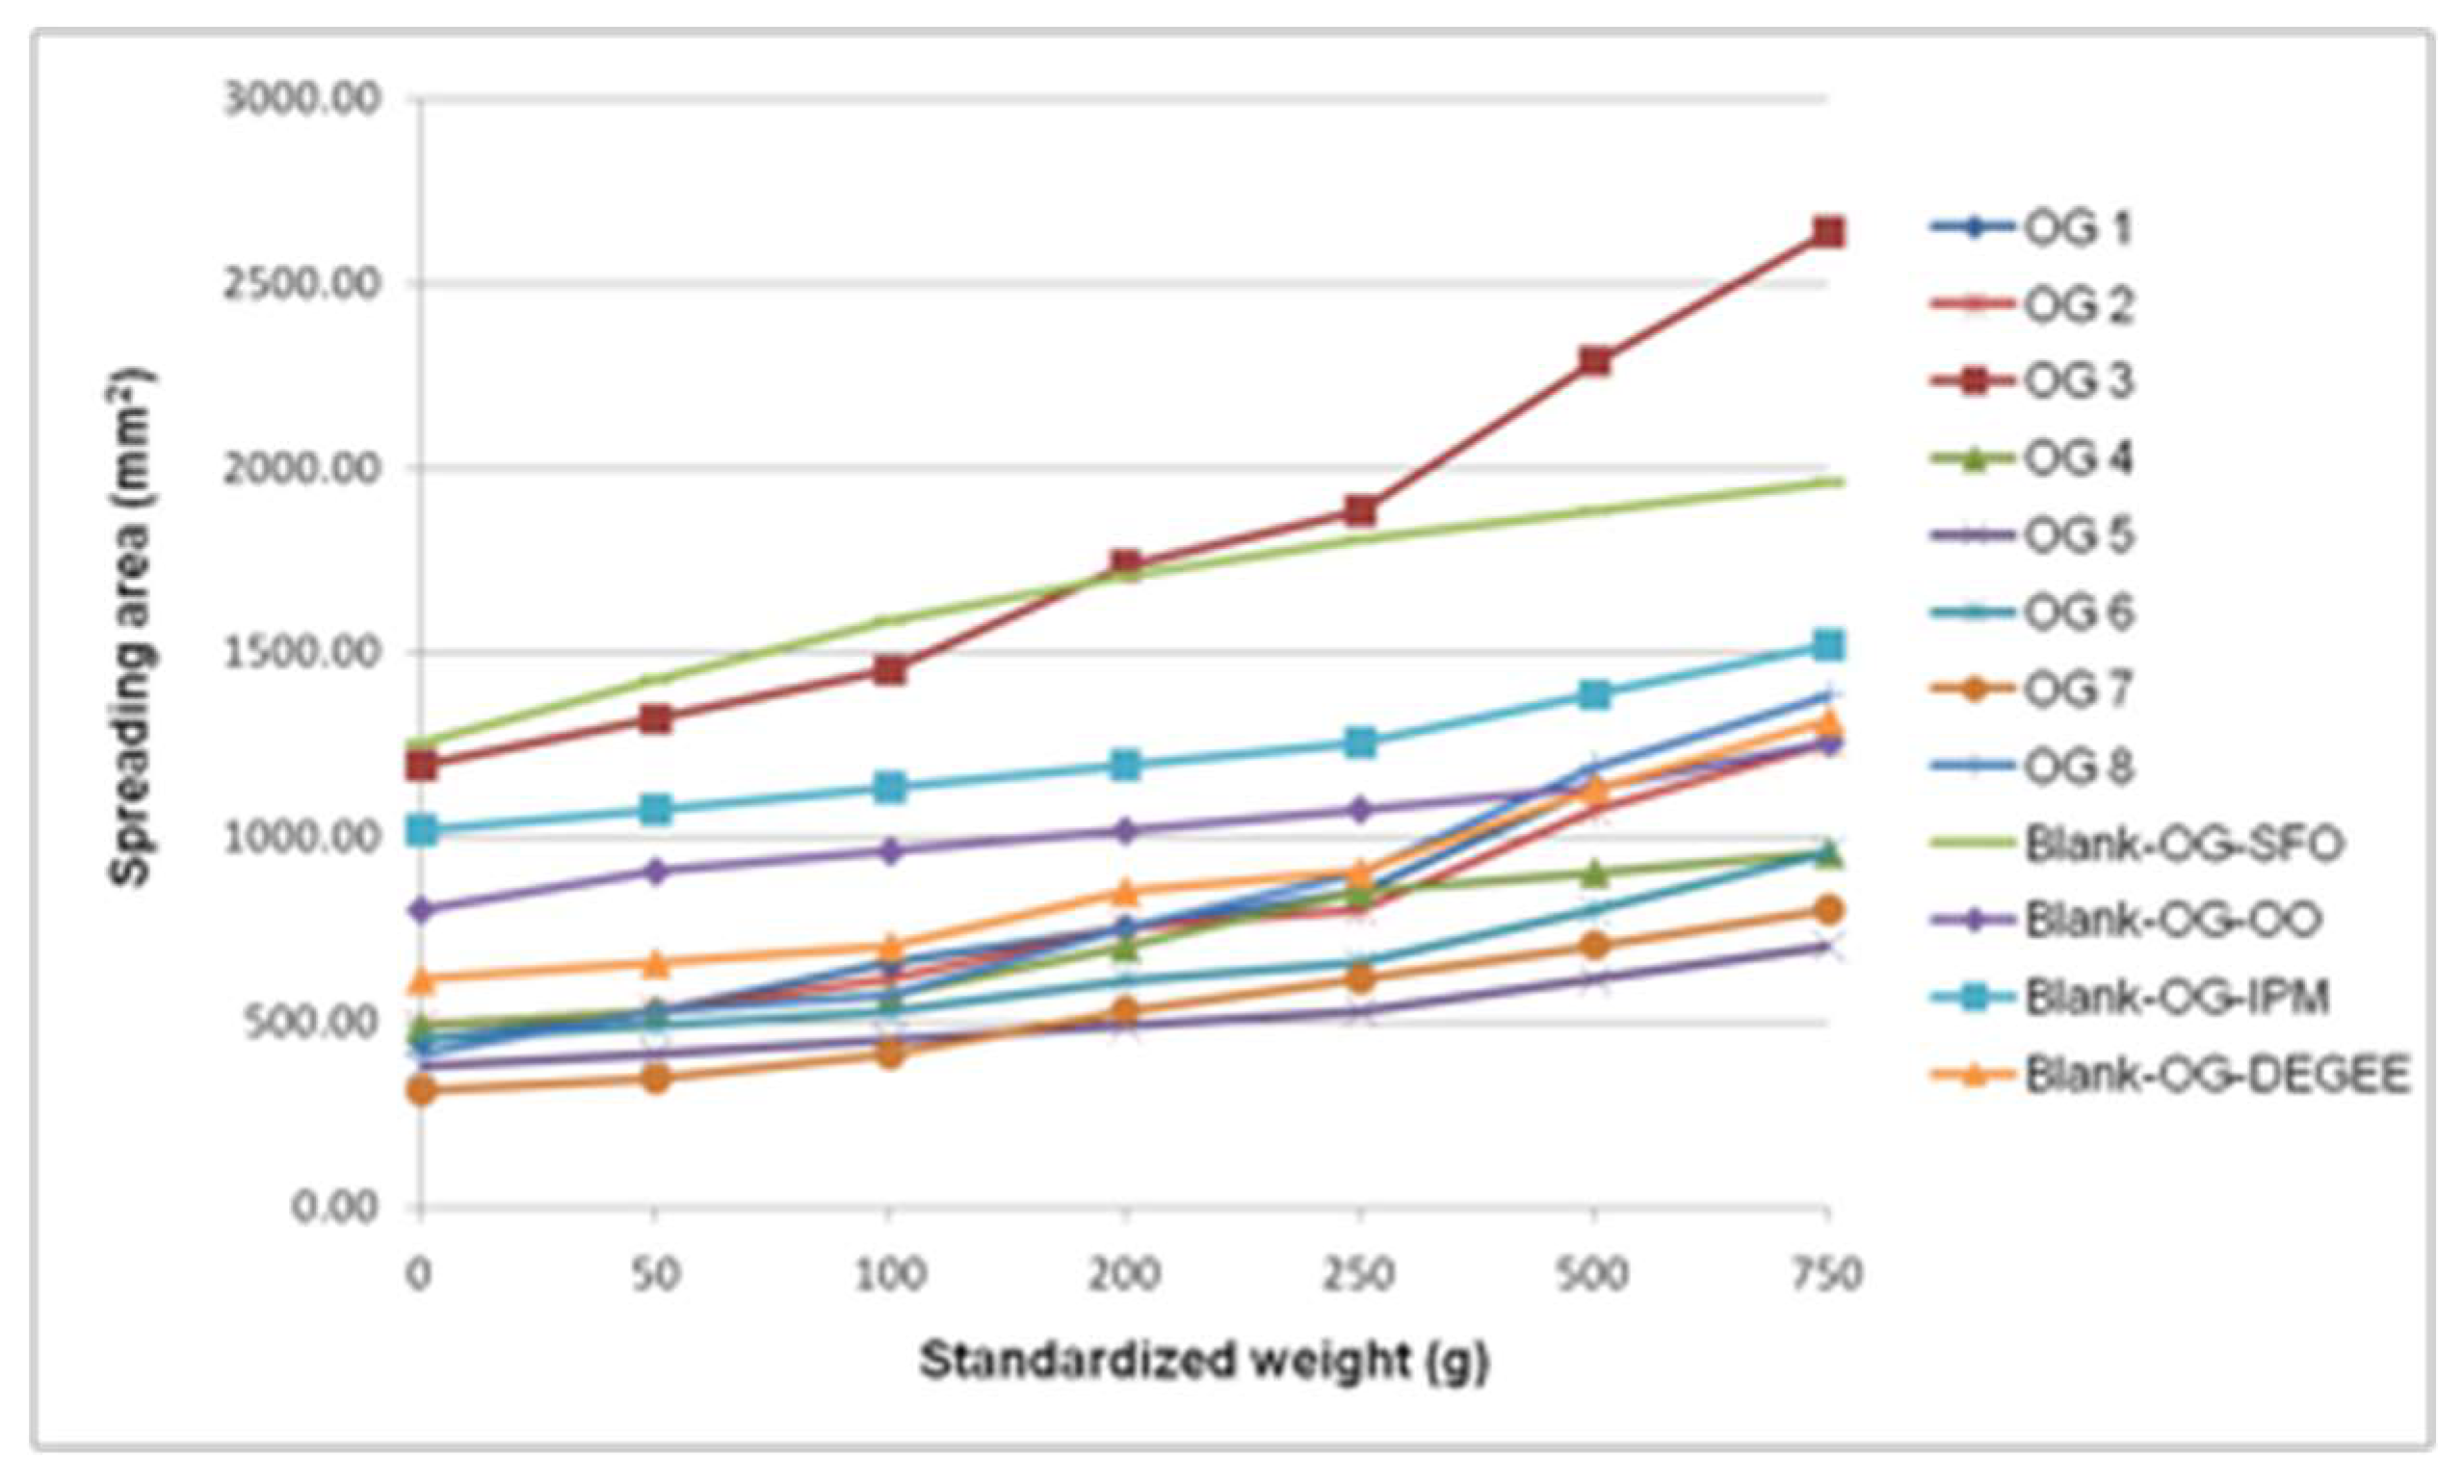
Figure 15.
Spreadability profiles of plant extract-loaded poloxamer-based hydrogels.
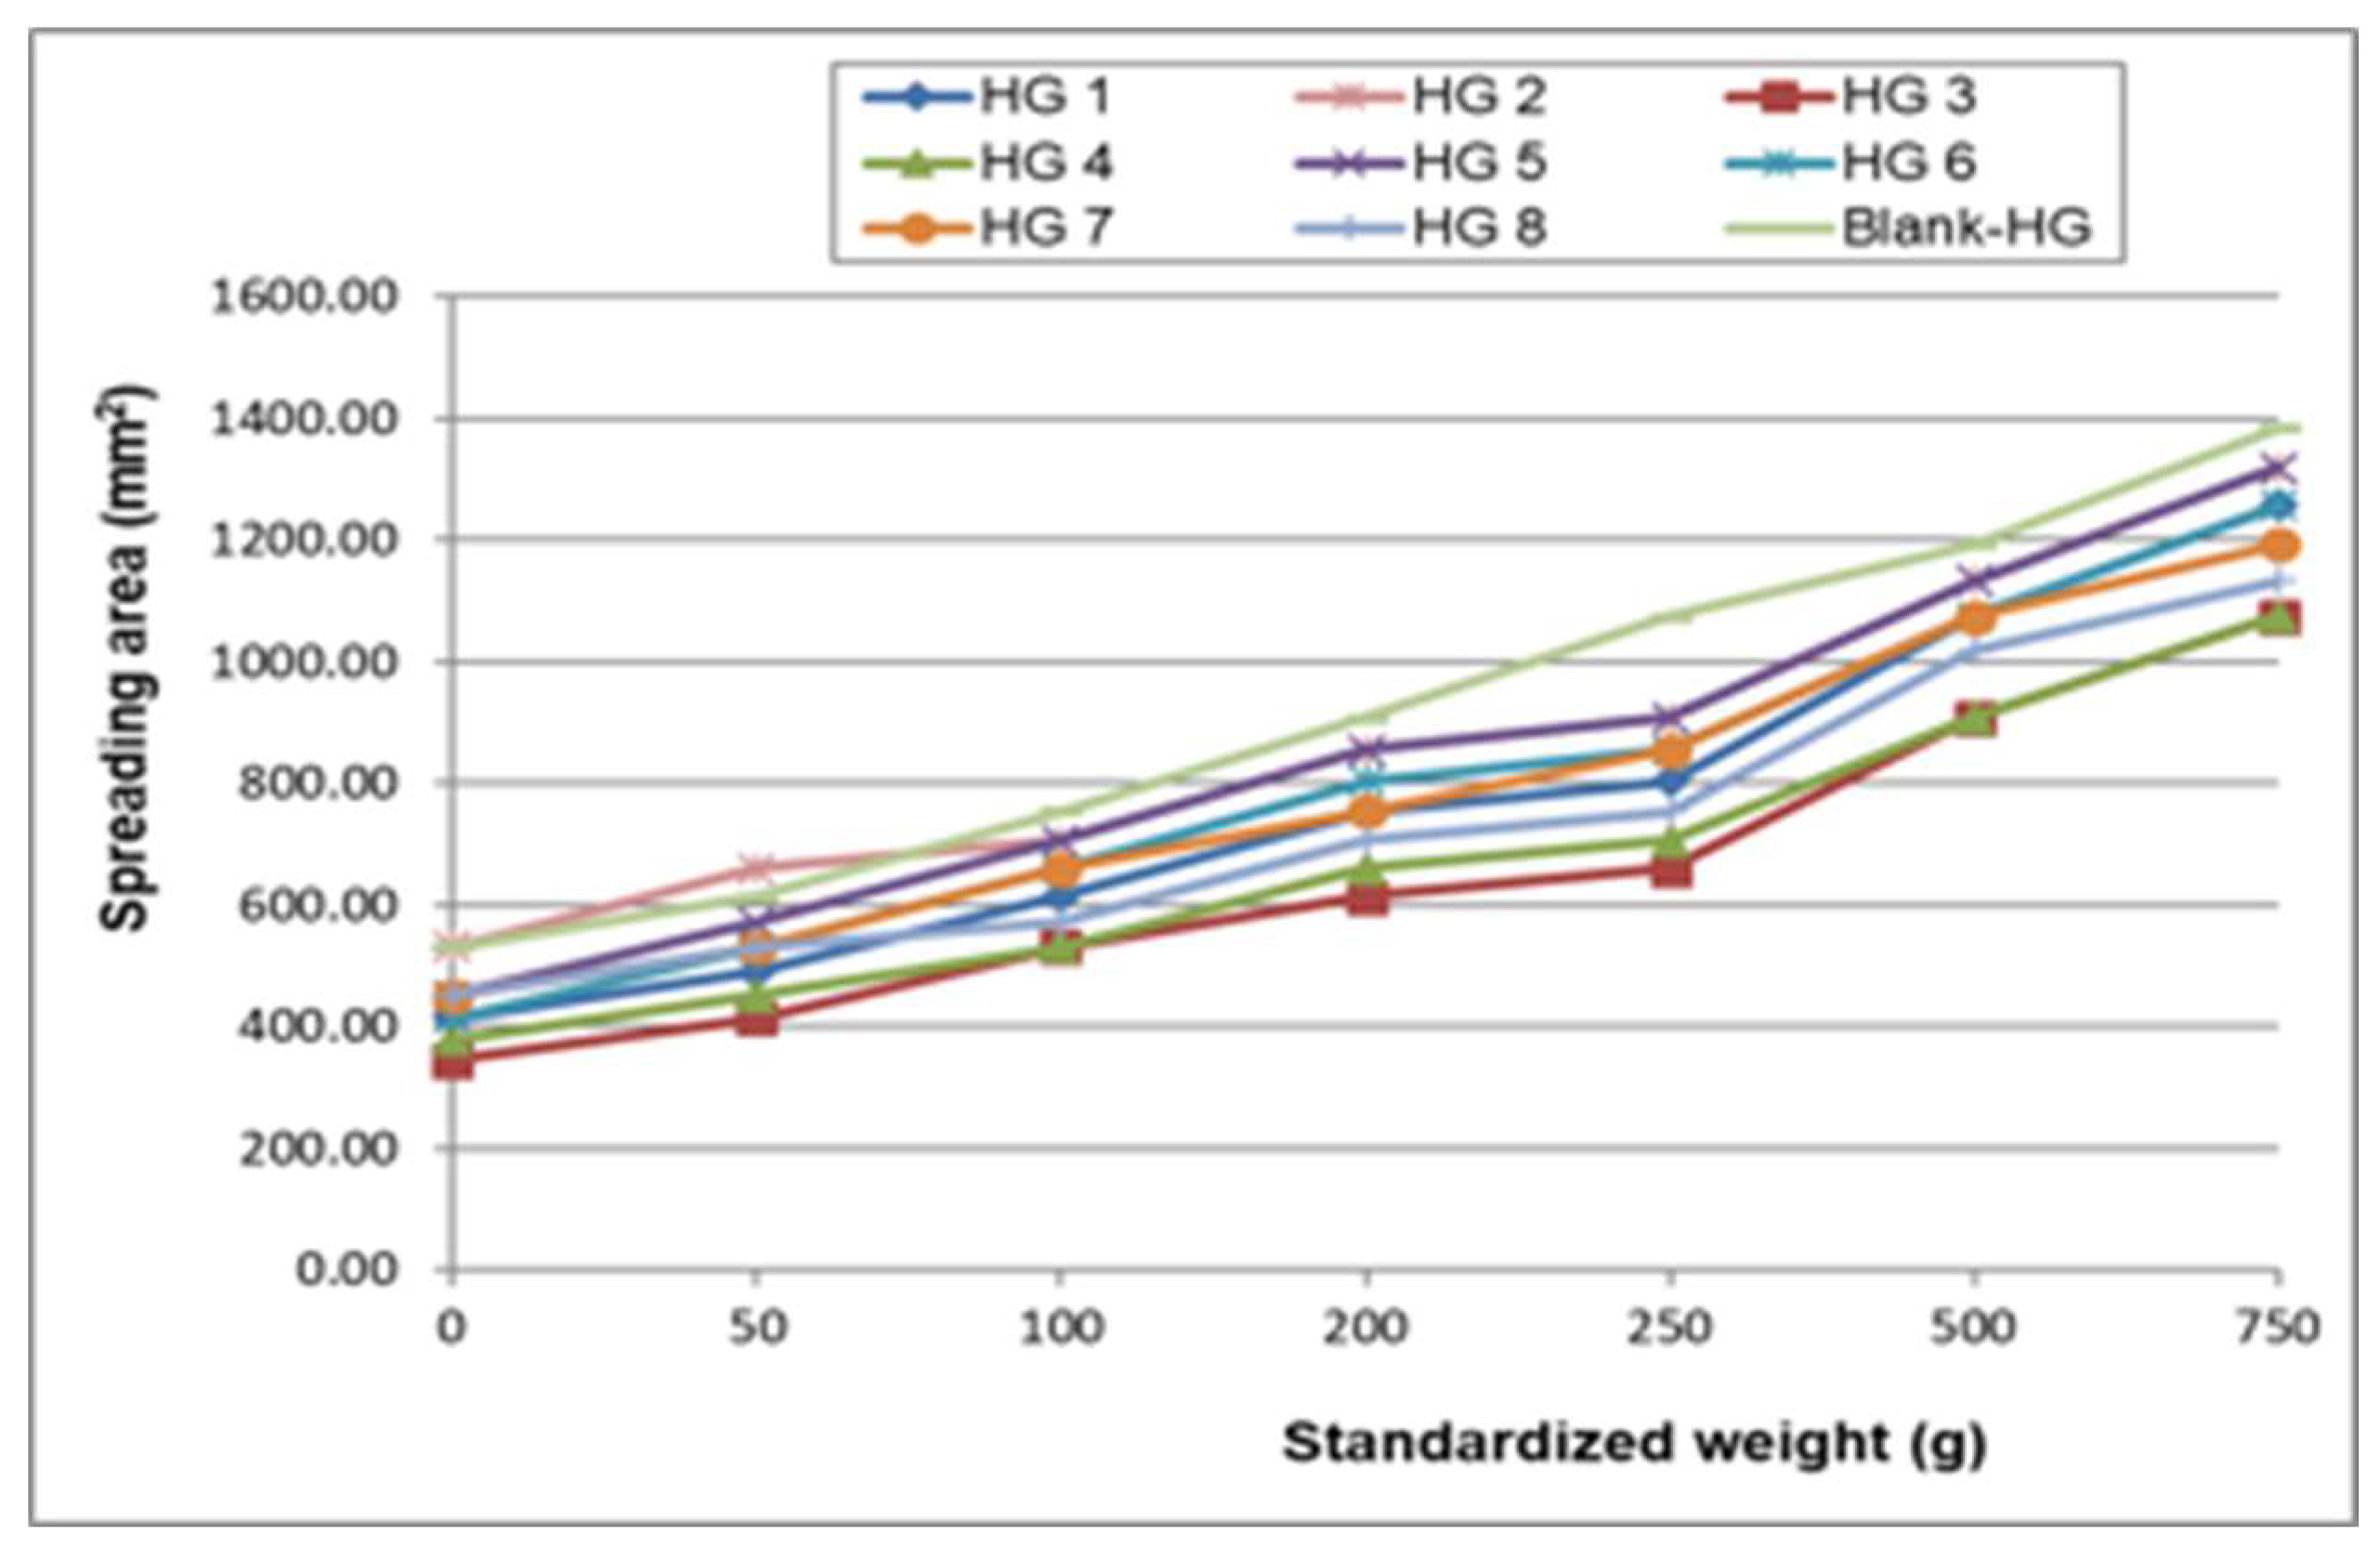
Figure 19.
Effect of topical formulation pH on burn surface area at Day 9 post-burn.
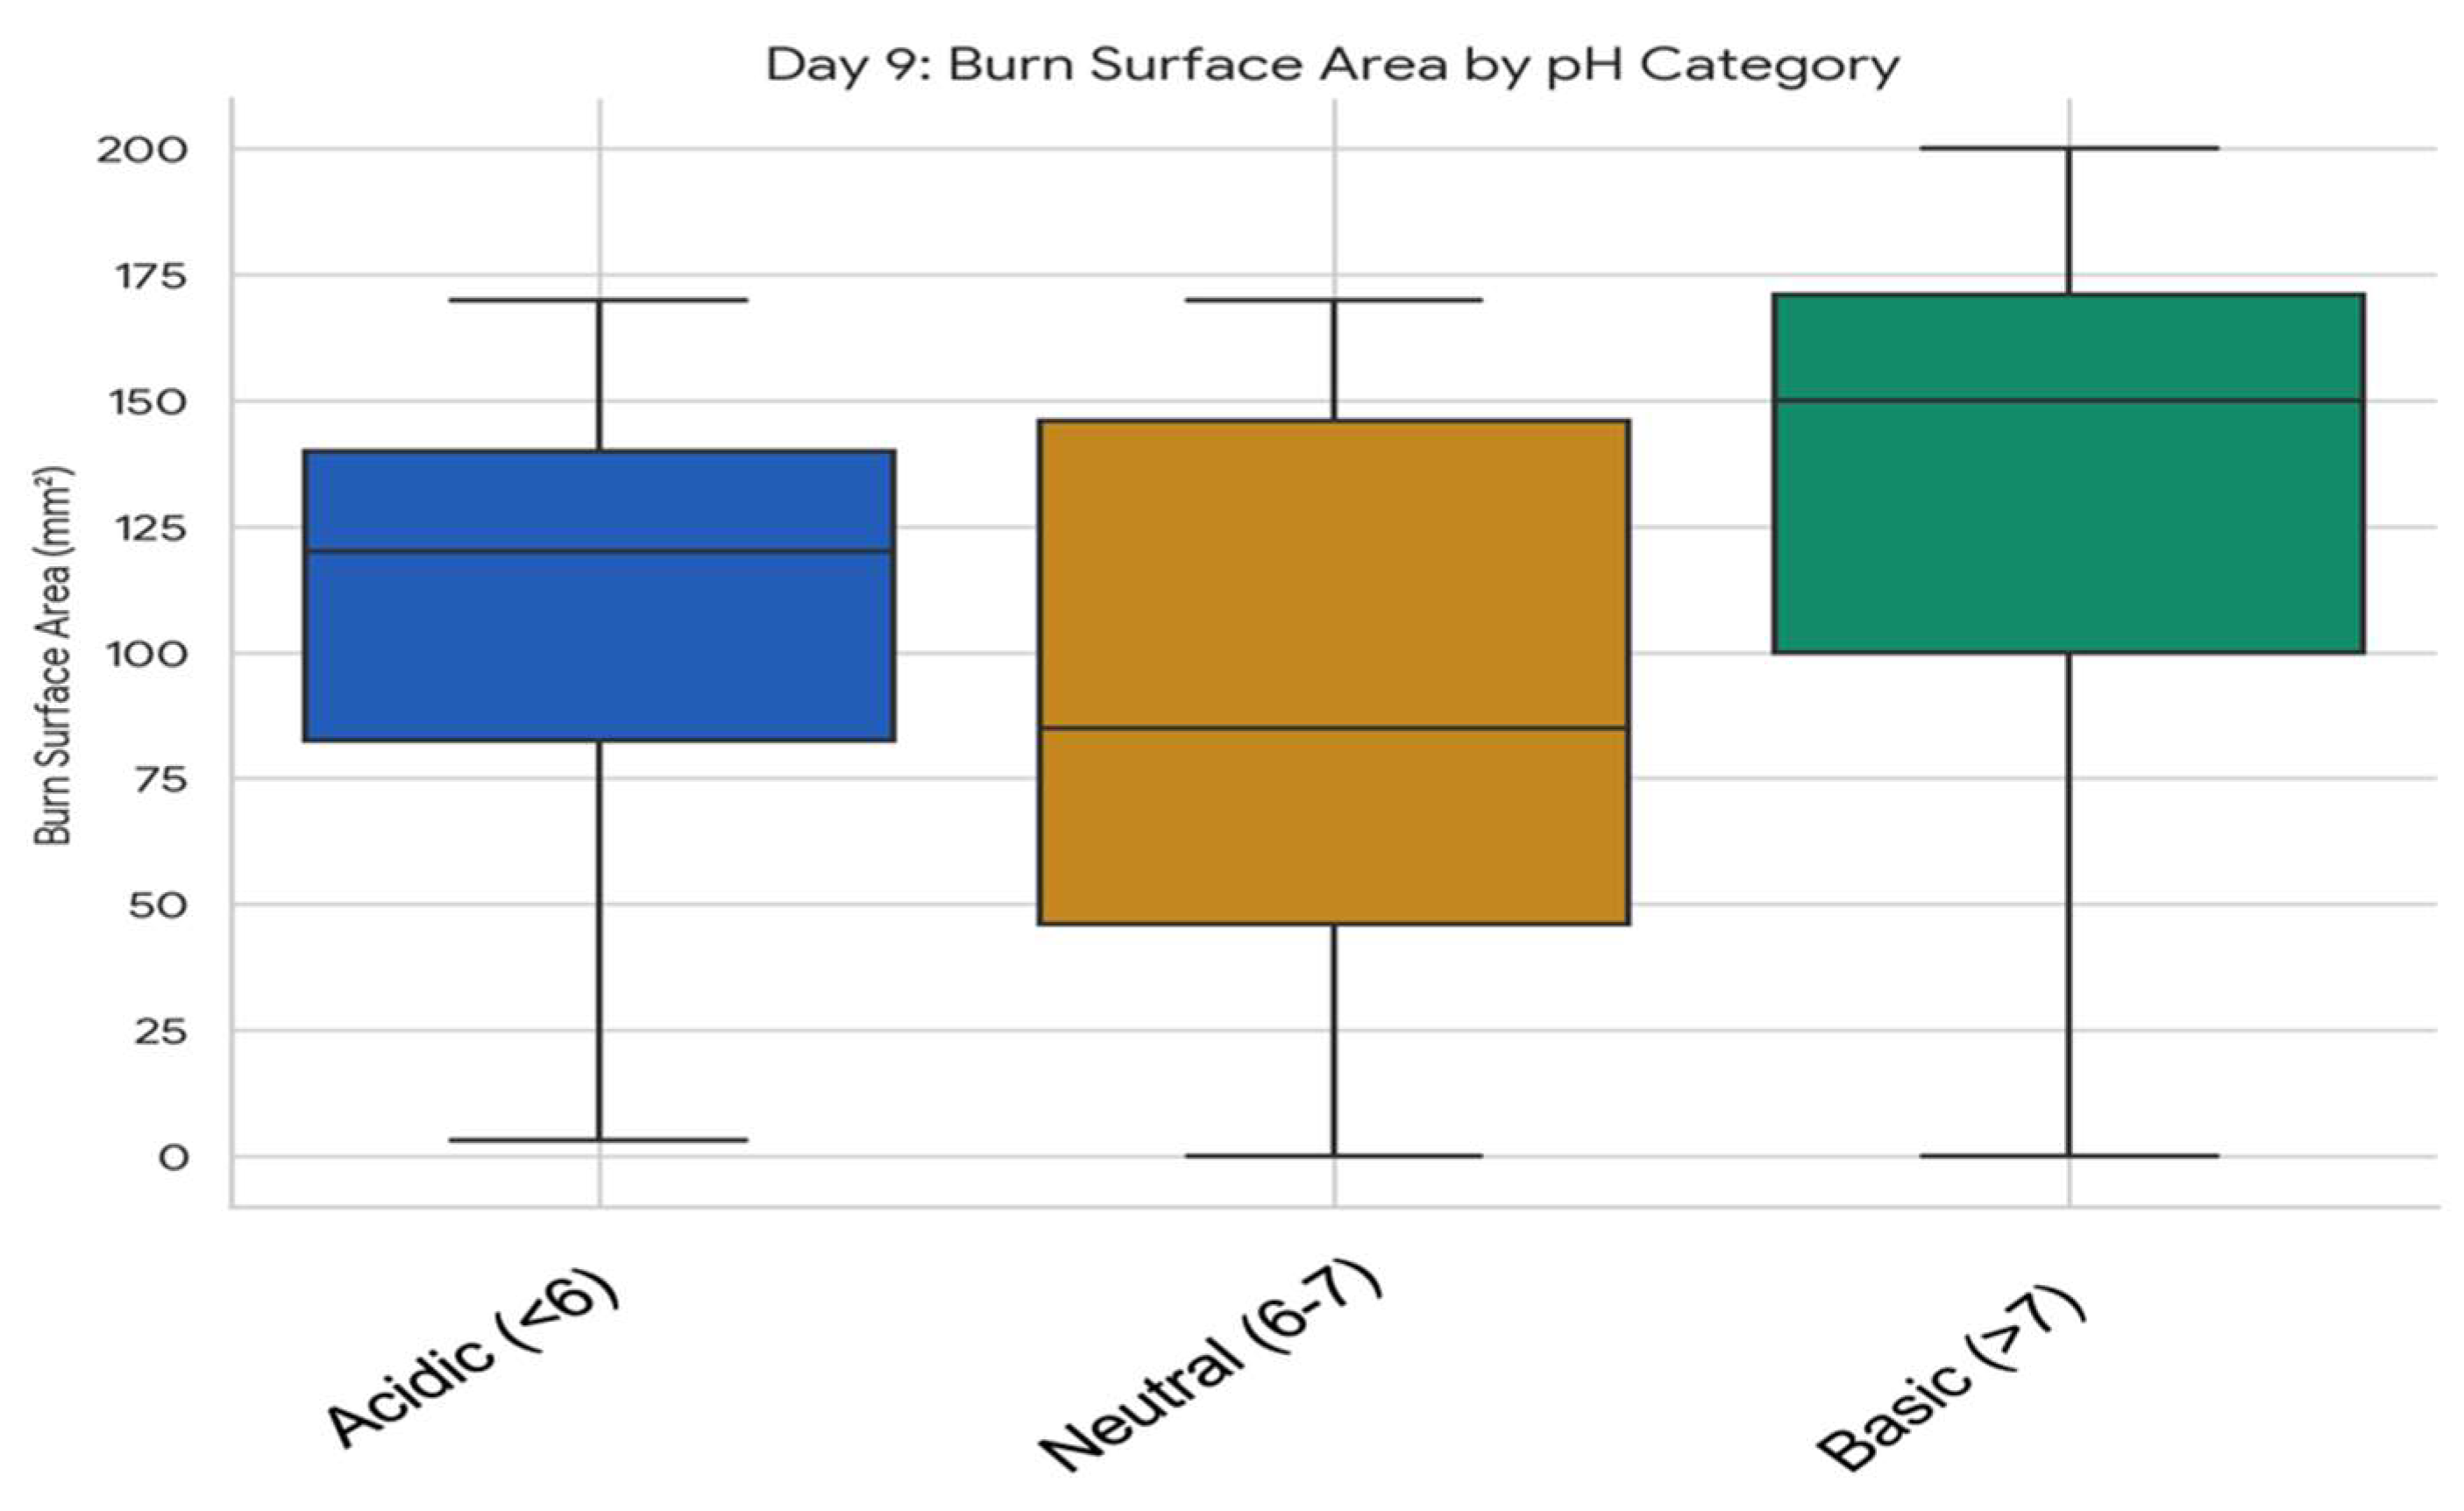
Figure 20.
Effect of topical formulation pH on burn surface area at Day 14 post-burn.
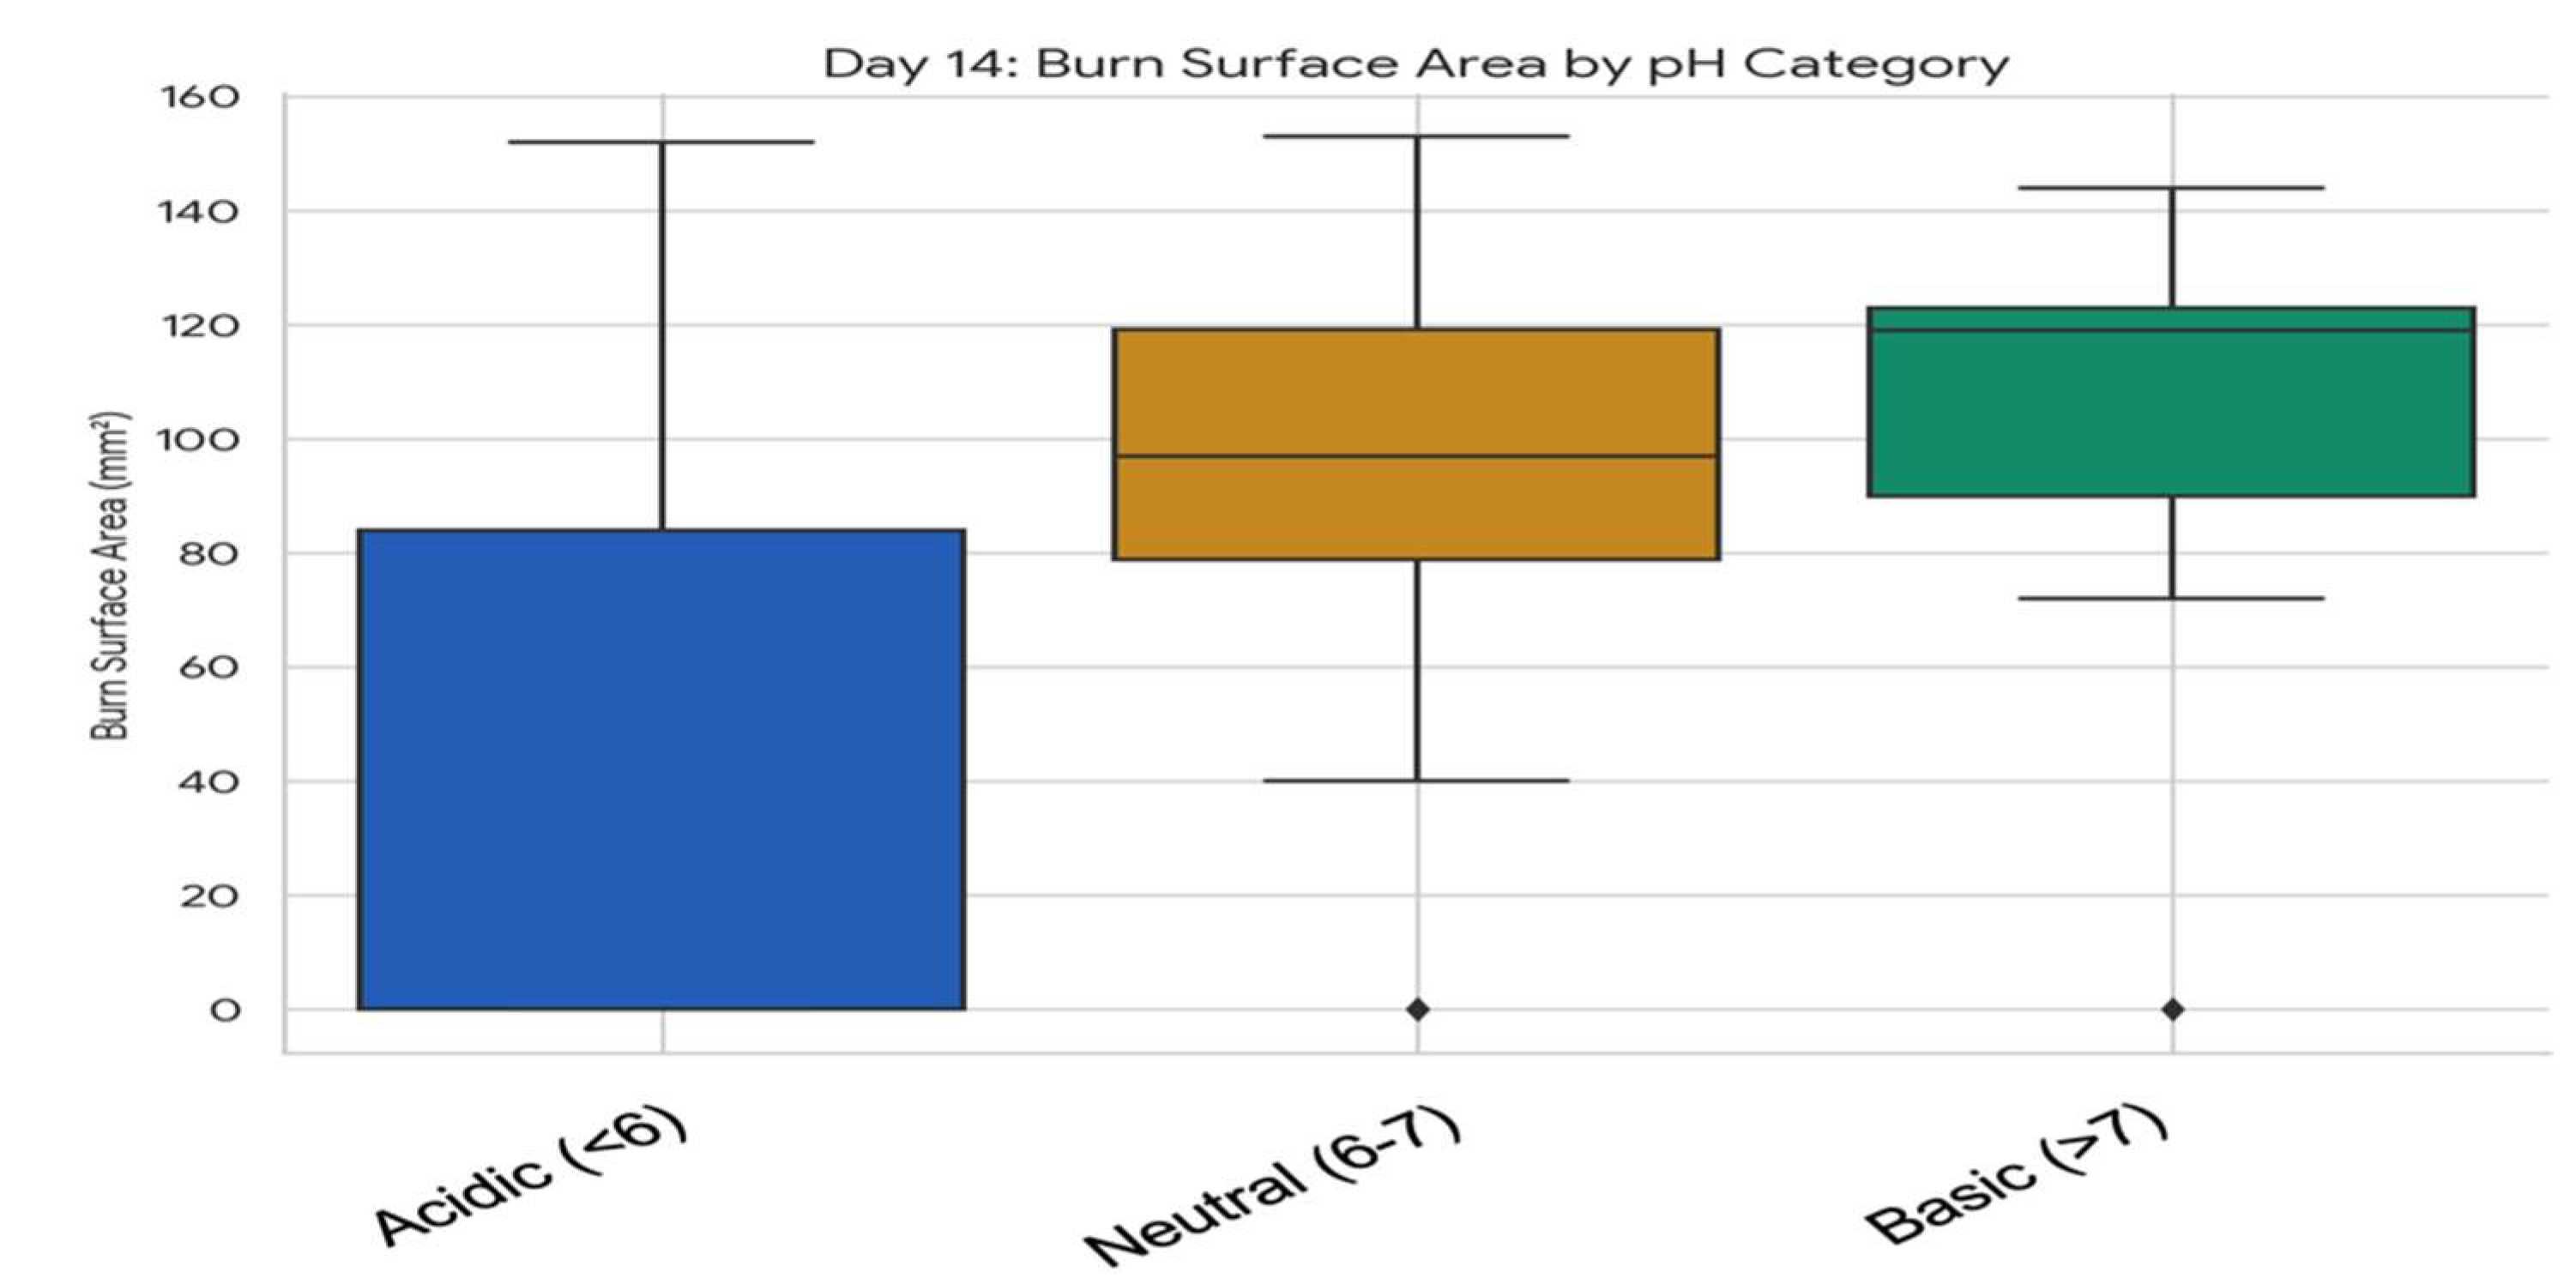
Figure 24.
Evolution of mean skin temperature after burn induction, depending on the topical formulation used (mean ± SD).
Figure 24.
Evolution of mean skin temperature after burn induction, depending on the topical formulation used (mean ± SD).
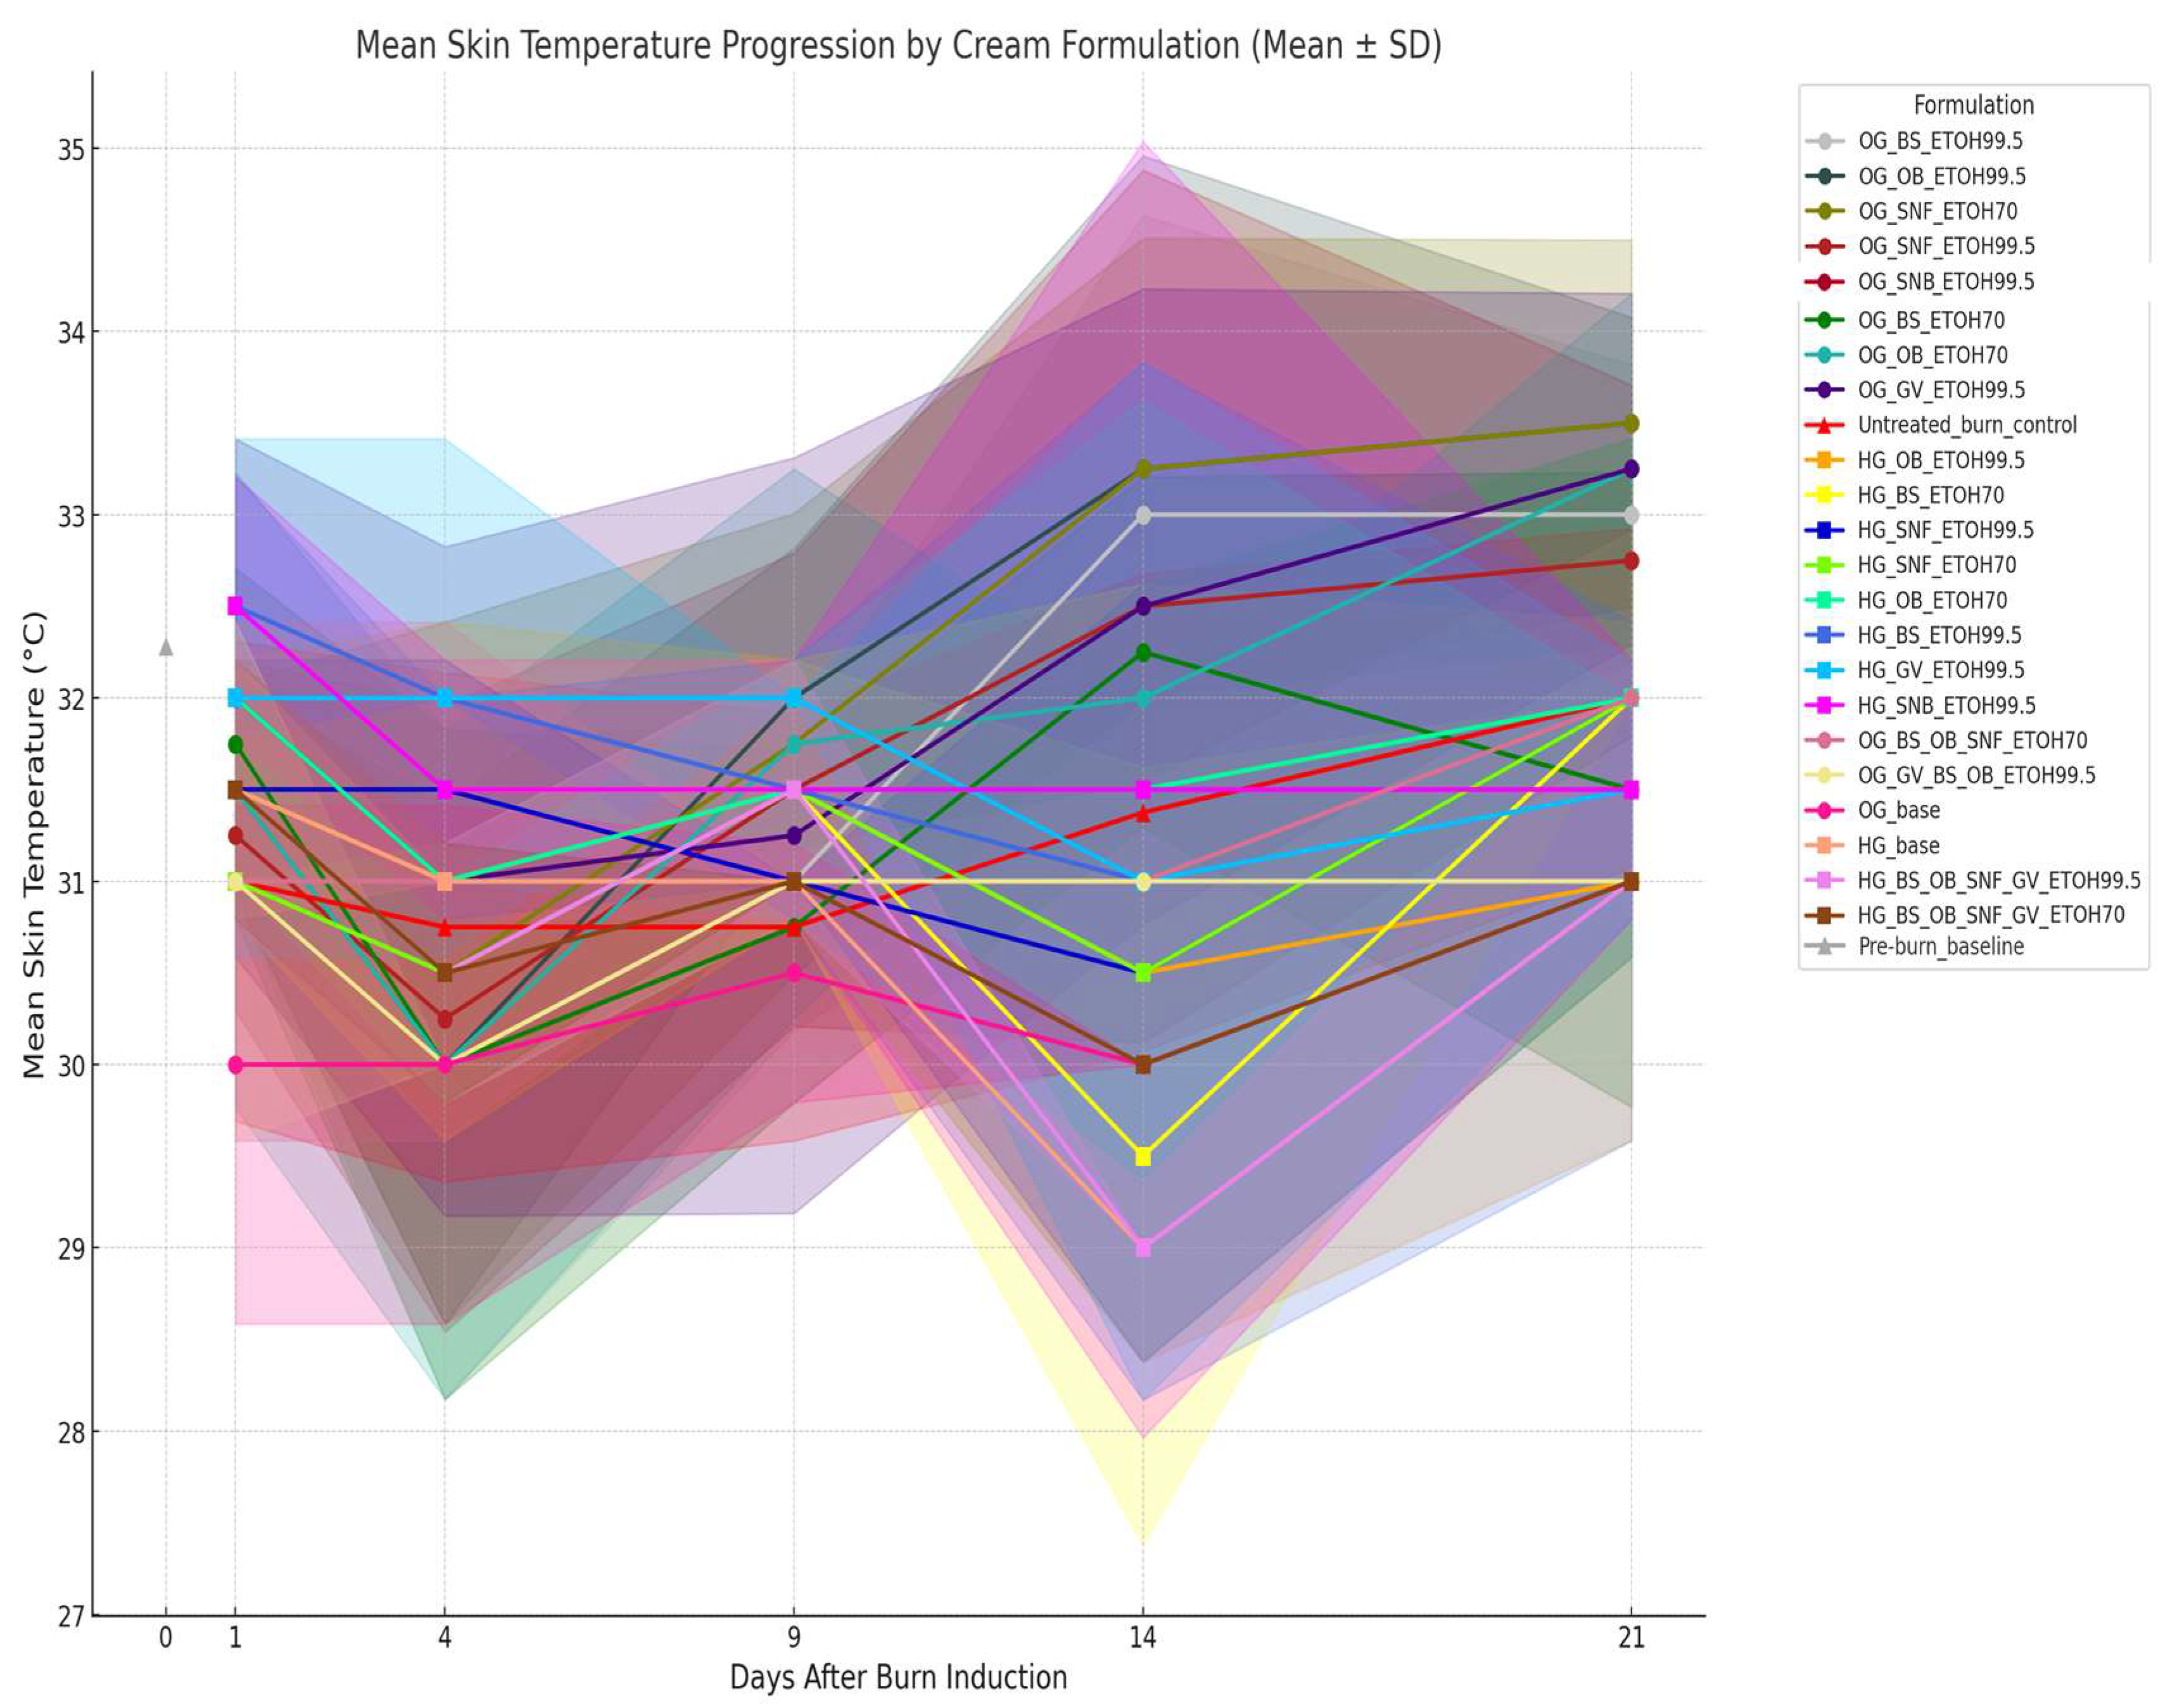
Figure 25.
Histological evolution of the healing process of burn wounds in rats depending on the applied extract (OB – Ocimum basilicum, SNF – Sambucus nigra flos, BS – Boswellia serrata). The Figure 25 is created in BioRender by Rosca Oana-Janina, https://BioRender.com.
Figure 25.
Histological evolution of the healing process of burn wounds in rats depending on the applied extract (OB – Ocimum basilicum, SNF – Sambucus nigra flos, BS – Boswellia serrata). The Figure 25 is created in BioRender by Rosca Oana-Janina, https://BioRender.com.
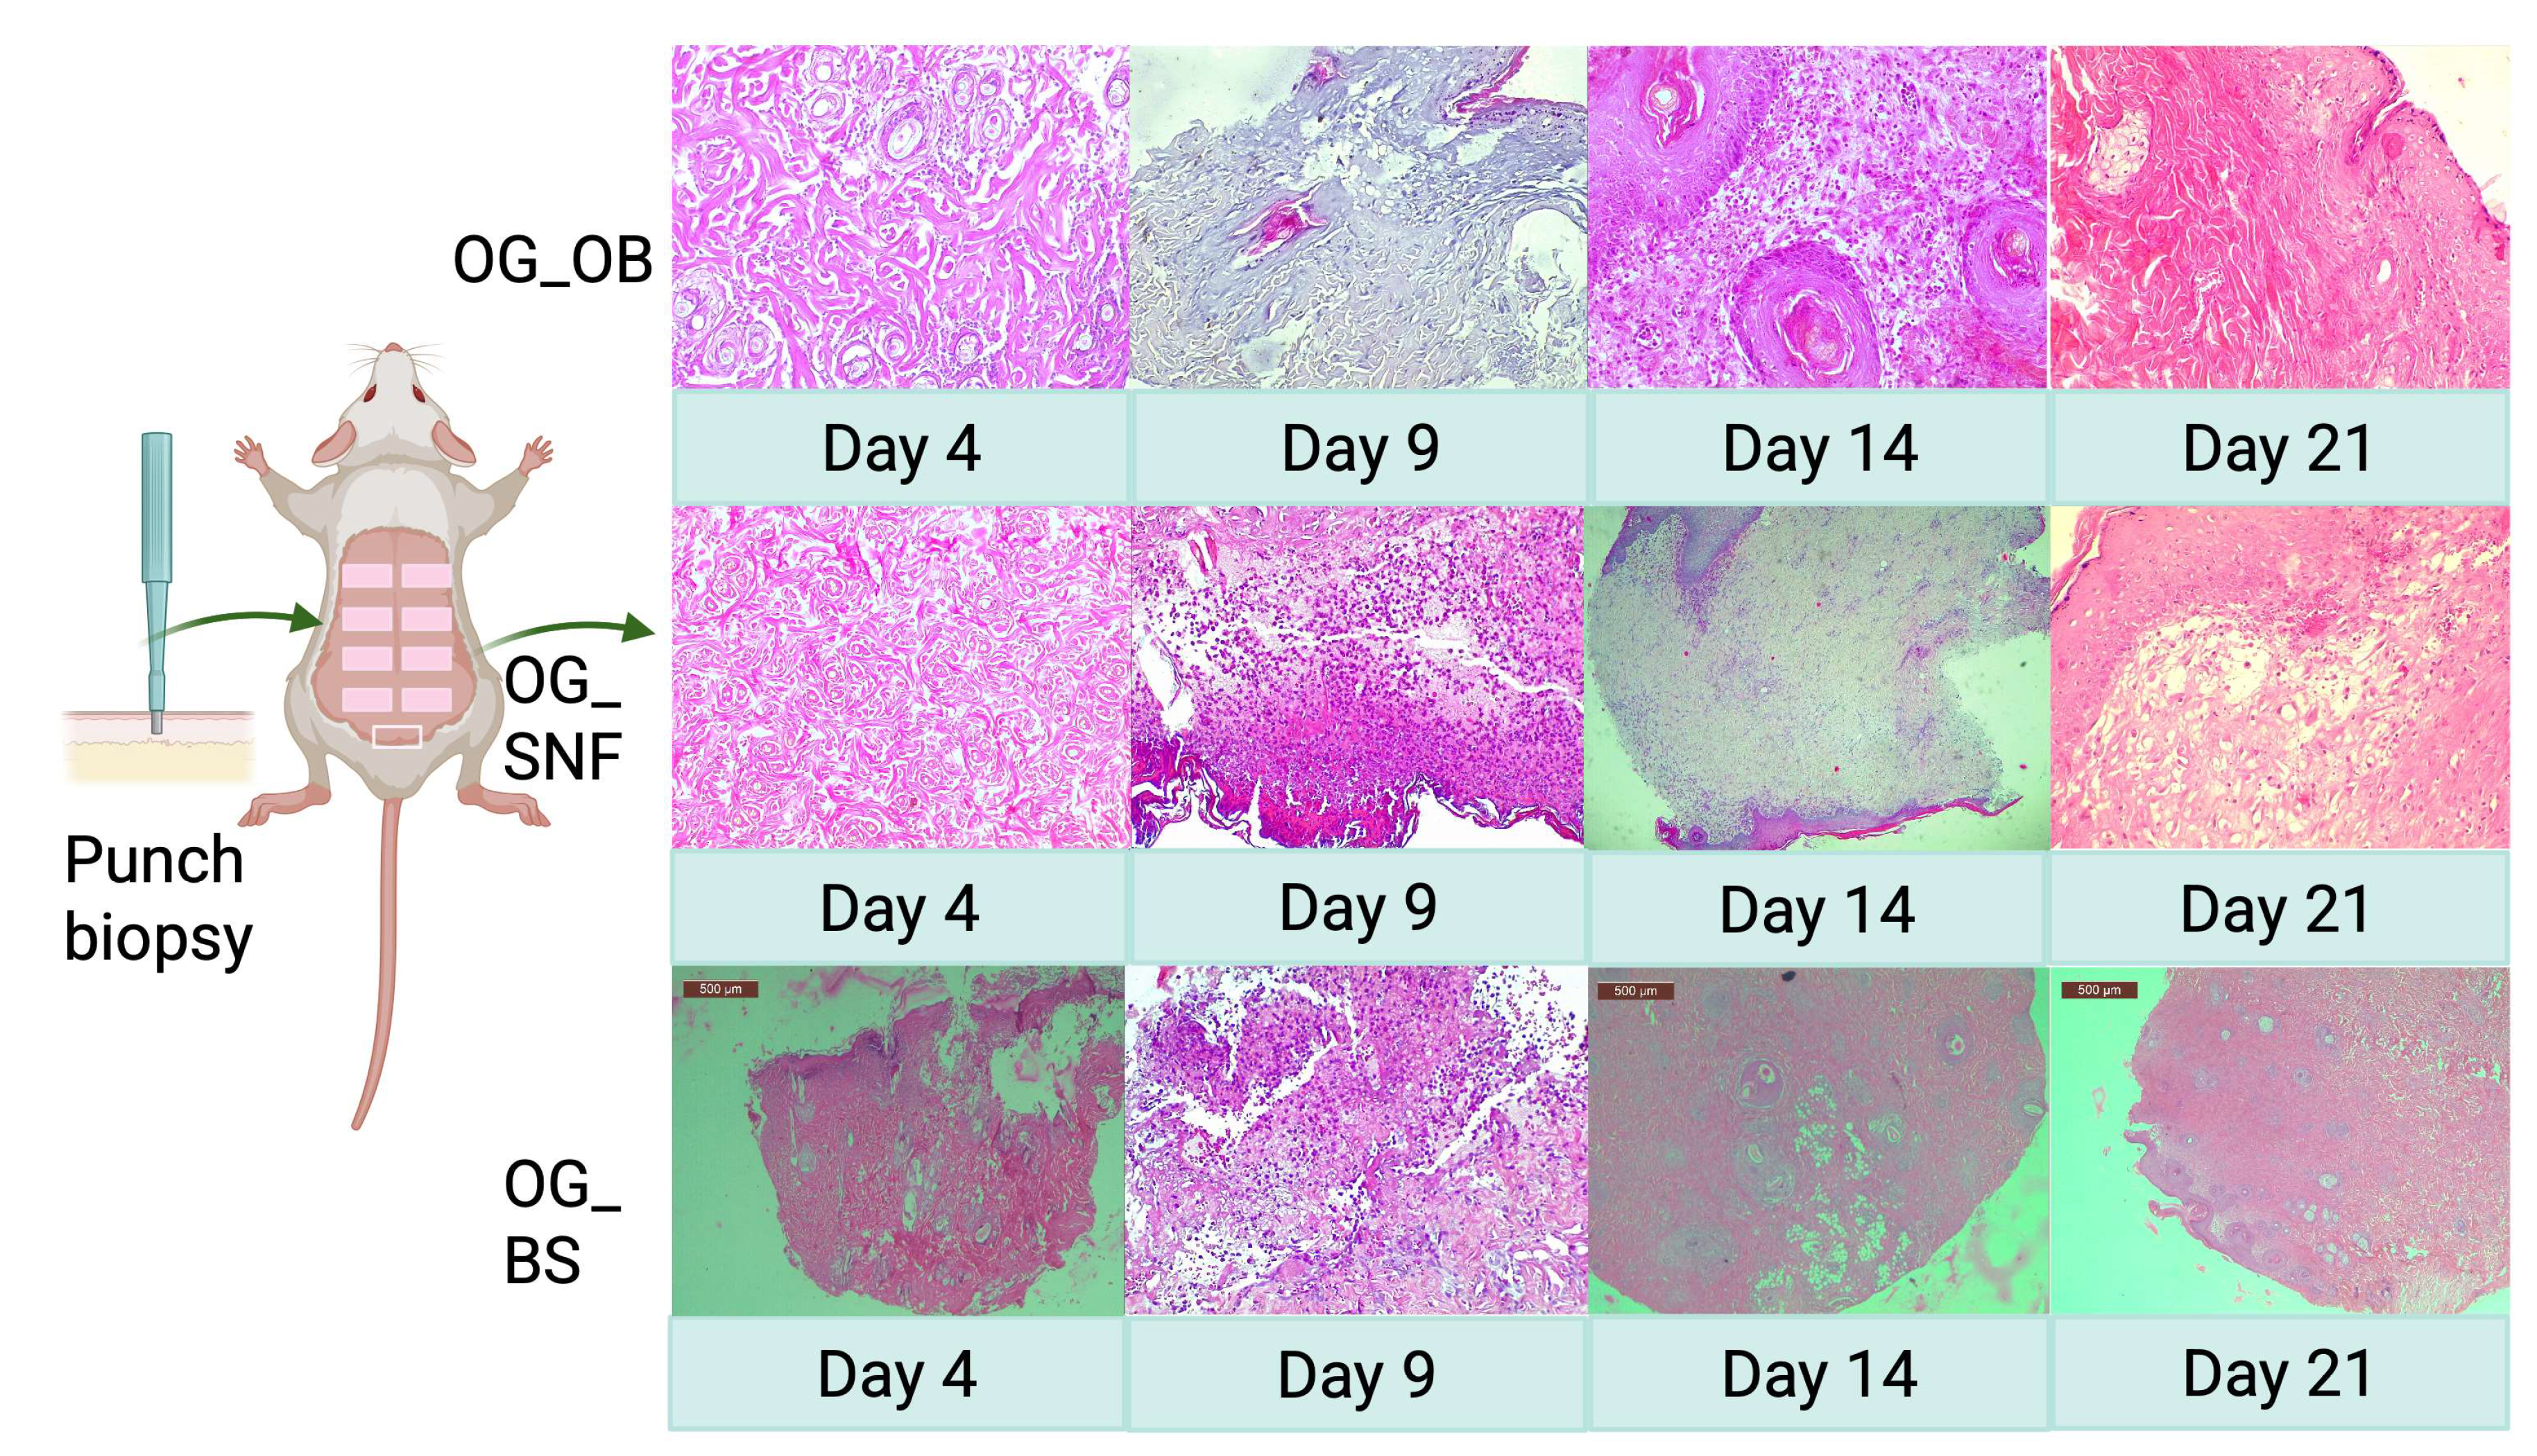
Table 3.
Standardization of Formulation Color Using Pantone Codes []methods.
| Qualitative description (original) | Suggested Pantone reference |
|---|---|
| Pearly white | Pantone 11-0601 |
| Straw yellow | Pantone 13-0922 |
| White | Pantone 11-0601 |
| Dull-yellow | Pantone 13-0850 |
| Orange | Pantone 16-1364 |
| Green-moss | Pantone 17-0530 |
| Brown | Pantone 18-0930 |
| Pale brown | Pantone 15-1213 |
| Brownish-dark | Pantone 19-1015 |
| Brownish-green | Pantone 18-0435 |
| Colorless | Pantone Transparent |
Table 4.
Standardized Scale for Opacity/Transparency [].
| Term used | Definition | Example formulations |
|---|---|---|
| Transparent | Completely clear, no turbidity | Blank-HG |
| Translucent | Slightly cloudy but still clear | HG-PL 3–8 |
| Slightly opaque | Mild turbidity, partially opaque | Blank-OG-SFO, HG-PL 1, HG-PL 2 |
| Opaque | Completely opaque, no transparency | OG 1–8, Blank-OG-OO, Blank-OG-IPM, Blank-OG-DEGEE |
Table 5.
Suggested Standardization of Aromatic Descriptions [].
| Original odor description | Improved standardized description |
|---|---|
| Sunflower oil characteristic | Mild vegetal, characteristic of sunflower oil |
| Olive oil characteristic | Mild vegetal, characteristic of olive oil |
| Isopropyl myristate characteristic | Neutral, characteristic of IPM |
| DEGEE characteristic | Slightly chemical, neutral odor |
| Specific, slightly aromatic | Mild herbal aroma |
| Specific aromatic | Herbal, fresh aroma |
| Specific aromatic (brownish) | Earthy, herbal aroma |
| Specific aromatic (brown-dark) | Woody, earthy aroma |
| Odorless | Odorless (neutral) |
Table 6.
Viscosity, thixotropy and penetration depth measured for the studied plant extract-loaded oleogels and hydrogels.
Table 6.
Viscosity, thixotropy and penetration depth measured for the studied plant extract-loaded oleogels and hydrogels.
| Formulation | Viscosiy (Pa·s) | Thixotropy (Pa/s) | Penetration depth (mm) |
|---|---|---|---|
| Blank-OG-SFO | 1.071733±0.014 | 8019 | 370.0±7.24 |
| Blank-OG-OO | 0.799833±0.009 | 5845 | 321.0±8.07 |
| Blank-OG-IPM | 1.3042±0.041 | 7367 | 339.0±3.65 |
| Blank-OG-DEGEE | 1.217±0.081 | 54860 | 330.0±6.41 |
| OG 1 | 2.583±0.084 | 10850 | 107.0±5.64 |
| OG 2 | 2.586±0.066 | 6977 | 106.7±5.03 |
| OG 3 | 0.640±0.041 | 2900 | 256.3±4.73 |
| OG 4 | 1.185±0.182 | 17370 | 113.0±2.28 |
| OG 5 | 0.867±0.043 | 7717 | 103.7±1.53 |
| OG 6 | 2.062±0.091 | 17300 | 118.0±2.14 |
| OG 7 | 2.457±0.081 | 15910 | 113.7±1.53 |
| OG 8 | 1.645±0.068 | 13710 | 130.0±2.66 |
| Blank HG-PL | 10.179 ± 0.027 | 9932 | 126.3±1.58 |
| HG-PL 1 | 13.855±0.415 | 94340 | 84.7±3.05 |
| HG-PL 2 | 10.839±0.275 | 88420 | 85.3±2.52 |
| HG-PL 3 | 11.389±0.097 | 17410 | 97.7±1.15 |
| HG-PL 4 | 5.723±0.028 | 30040 | 99.3±1.53 |
| HG-PL 5 | 7.274±0.187 | 77680 | 119.7±0.58 |
| HG-PL 6 | 9.341±0.055 | 14740 | 113.3±2.08 |
| HG-PL 7 | 11.467±0.059 | 15360 | 112.0±1.05 |
| HG-PL 8 | 9.073±0.019 | 10470 | 117.3±2.52 |
Disclaimer/Publisher’s Note: The statements, opinions and data contained in all publications are solely those of the individual author(s) and contributor(s) and not of MDPI and/or the editor(s). MDPI and/or the editor(s) disclaim responsibility for any injury to people or property resulting from any ideas, methods, instructions or products referred to in the content. |
© 2025 by the authors. Licensee MDPI, Basel, Switzerland. This article is an open access article distributed under the terms and conditions of the Creative Commons Attribution (CC BY) license (http://creativecommons.org/licenses/by/4.0/).
Copyright: This open access article is published under a Creative Commons CC BY 4.0 license, which permit the free download, distribution, and reuse, provided that the author and preprint are cited in any reuse.


