Submitted:
10 June 2025
Posted:
11 June 2025
Read the latest preprint version here
Abstract
Metabolic regulation is governed by two fundamental principles: enzyme kinetics and chemical thermodynamics. These principles play distinct yet complementary roles—thermodynamics determines the energetic favorability of reactions, while kinetics governs the rates at which those reactions proceed. Glycolysis has long served as a classical model for studying these mechanisms; however, the interaction between kinetics and thermodynamics, specifically how the pathway maintains stable flux and metabolite levels under perturbation, remains underexplored. Here, I propose a principle of kinetic-thermodynamic coupling in the glycolytic pathway. This principle explains how reaction rates, intermediate concentrations, and Gibbs free energy (ΔG) are coordinated such that equal flux is sustained through each enzymatic step. Using PKM2 as an illustrative example, the framework reveals how PKM2 activity, intermediate concentrations, Gibbs free energy values, and glycolytic rate are intricately coordinated, allowing the pathway to maintain flux continuity during transitions between steady states. Mathematical expressions are derived that link PKM2 activity to the thermodynamic structure of glycolysis, quantify its flux and concentration control coefficients, and define the mass transfer, duration, and average rate associated with the transient interstate phase. This coupling enables glycolysis to transition rapidly—within a fraction of a millisecond—between distinct steady states with minimal disruption. Together, the principle presented here unveils that glycolysis is not only responsive but intrinsically self-stabilizing, capable of maintaining homeostasis despite variations in enzyme activity, and it offers a novel biochemical perspective that fills a critical gap in our understanding of glycolytic regulation.
Keywords:
glycolysis
; enzyme kinetics
; chemical thermodynamics
; steady state
; PKM2
; cancer cells
Introduction
In cancer cells, aerobic glycolysis, the Warburg effect, is characterized by elevated glycolytic flux and increased lactate production, even in the presence of sufficient oxygen. The biological and clinical significance of aerobic glycolysis has attracted widespread attention: a Google Scholar search for “glycolysis and cancer” yields over 436,000 results. Interest in flux control of glycolysis in cancer is also substantial, with approximately 114,000 results for the terms “flux control, glycolysis, cancer.”
Cancer cells adapt glycolytic flux according to nutrient availability. Under nutrient-rich conditions, glycolysis supports rapid growth by diverting intermediates into anabolic pathways. In nutrient-limited environments, glycolysis shifts toward energy production to maintain cell survival. Thus, glycolysis is dynamically regulated to meet varying cellular demands [1,2,3].
Previous studies have primarily focused on kinetic regulation of glycolysis—examining mechanisms such as allosteric modulation, transcriptional control, feedback inhibition, and feedforward activation. These investigations have emphasized how changes in enzyme activity influence glycolytic flux. In contrast, thermodynamic considerations have typically been limited to the role of Gibbs free energy in governing reaction directionality and energy transfer within the pathway.
What remains largely unexplored is how enzyme kinetics and thermodynamics interact within the glycolytic pathway. Specifically, the coordination between glycolytic flux, the rate of each step, intermediate concentrations, and the ΔG values of individual reactions has received little attention. Another critical issue is that, although glycolysis is widely recognized as a dynamic and adaptable pathway, particularly in cancer metabolism, its capacity to maintain a stable steady state under fluctuating conditions is often overlooked.
This stability is not passive but actively maintained through kinetic-thermodynamic coupling, which allows the pathway to redistribute metabolite concentrations and Gibbs free energy (ΔG) in response to perturbations. As a result, steady-state flux is preserved even when enzyme activity changes, revealing glycolysis as a self-stabilizing system rather than merely a responsive one.
Results
Kinetic-Thermodynamic Coupling in the Glycolytic Pathway
To examine the interdependence between enzyme kinetics and thermodynamics in glycolysis, it is essential to focus on the core glycolytic pathway and exclude branching reactions (e.g., pentose phosphate pathway, serine biosynthesis pathway). This simplification enables a clearer analysis of the fundamental principles governing flux and intermediate metabolite distribution.
Glycolysis can be analyzed under two conditions:
- The steady state, in which intermediate metabolite levels and reaction rates remain constant over time; and
- The interstate, a transient phase during transitions between steady states.
Steady-State Glycolysis:A Question of Equal Flux
At steady state, the flux through every enzyme-catalyzed reaction in glycolysis is equal and constant. This raises a fundamental question: How can reaction rates remain equal when the total activity of 11 glycolytic enzymes differ by up to three orders of magnitude [4,5,6,7]?
In glycolysis, the actual catalytic activity of each enzyme depends on two factors:
- the enzyme’s total concentration or activity, and
- the concentration of its substrate.
Thus, for every step in the pathway to operate at the same rate, the concentrations of intermediates must be precisely tuned to compensate for differences in enzyme abundance or activity. Furthermore, these intermediate concentrations must remain stable over time to maintain this kinetic balance.
Thermodynamic Determinants of Intermediate Distribution
This leads to a second key question: how are these intermediate concentrations finely tuned across the pathway? This question concerns the distribution of intermediate metabolite concentrations, which is governed by the thermodynamic properties of the pathway.
Consider a linear metabolic pathway consisting of n sequential reactions at steady state, where each reaction k is coupled to the next via shared metabolites: the product of one step becomes the substrate for the next. Let the metabolites be labeled as X0, X1, X2, ….., Xn, where:
- X0 is the initial substrate,
- Xn is the final product
- Xk (for k =1,2,3,…,n−1) is both the product of reaction k and the substrate of reaction k+1.
The Gibbs free energy (ΔGk) for each reaction k is given by:
| , k =1,2,3…..n, (Eq. 1) |
Because the product of one reaction is the substrate of the next, coupling imposes the following relationships:
Reaction k produces Xk:
Reaction k + 1 consumes Xk: ,
The above equations could be rearranged to
| ⇒ (Eq. 2) |
| ⇒ (Eq. 3) |
Substituting Eq. 2 into Eq. 3 yields:
| (Eq. 4) |
Extending this sequentially across the entire pathway yields:
| (Eq. 5) |
The above equations show that in a linear metabolic pathway at steady state, the concentrations of intermediates are interdependent and must satisfy the thermodynamic constraints imposed by each reaction’s ΔG. This sequential coupling ensures that the entire pathway operates in a coordinated manner, balancing energy changes and metabolite levels.
By analogy, all the reactions and ΔG values within the glycolytic pathway are sequentially coupled to one another, and the concentrations of all the intermediates in the pathway are thermodynamically equilibrated.
From this perspective, the distribution of intermediate concentrations arises from thermodynamic equilibration. The need to maintain equal flux through each enzymatic step is satisfied by adjusting intermediate concentrations, which in turn are constrained by the overall thermodynamic landscape.
Thus, actual enzyme activity becomes a function of both:
- the enzyme’s total activity, and
- the thermodynamic equilibrated concentrations of its substrate.
This defines the principle of kinetic-thermodynamic coupling: the rates, concentrations of intermediates, and ΔG values are interdependent and co-regulated to ensure flux stability.
Pathway-Level Conservation of Thermodynamic Features
Importantly, because the thermodynamic properties of glycolysis govern intermediate distributions, this profile is conserved across cell types [4,5,6,7]. Among the 11 glycolytic reactions, three catalyzed by hexokinase 2 (HK2), phosphofructokinase-1 (PFK1), and pyruvate kinase (PK) operate far from equilibrium, and thus provide the primary thermodynamic driving force for glycolysis. The remaining reactions are at near-equilibrium state. The lactate dehydrogenase (LDH) reaction is also exergonic in cancer cells, with an average ΔG of ~–7 kJ/mol. Because the ΔG profile is conserved across diverse cell types, the thermodynamic regulation of metabolite concentrations is systemically stable.
Interstate Between Any Two Steady States
Now consider the transient phase between two steady states—referred to here as the interstate. This occurs when the total activity of any glycolytic enzyme is altered, triggering dynamic shifts in enzyme activity, reaction rate, and metabolite concentrations.
For example, when the total activity of an enzyme decreases, its catalytic rate also falls. As a result, the substrate accumulates, and the product concentration decreases. These changes alter the ΔG of the reaction and, through thermodynamic coupling, propagate upstream and downstream to neighboring steps.
However, this transient state is typically very short-lived, on the order of fractions of a millisecond, and returns to a new steady state after thermodynamic re-equilibration. Although short in duration, this transition can be described quantitatively and reveals how the system dynamically responds to enzyme perturbation (see the subsequent Transient Interstate Between Any Two Steady States).
Summary 1
Steady-state glycolysis is maintained by a balance between enzyme kinetics and chemical thermodynamics. Equal flux through all steps and stable metabolite concentrations are ensured by a coordinated adjustment of enzyme activity and thermodynamic constraints. This defines the principle of kinetic-thermodynamic coupling, which explains how the system achieves stability and balance despite substantial variation in enzyme abundance.
Application of Kinetic-Thermodynamic Coupling to the Regulation of Glycolysis by PKM2
Pyruvate kinase M2 (PKM2) is the most extensively studied glycolytic enzyme in cancer biology, with over 22,000 results retrieved from a Google Scholar search for “PKM2, glycolysis, cancer.” It is believed to orchestrate metabolic programming by shifting glycolysis between energy-generating and biosynthetic modes.
Traditionally considered a rate-limiting enzyme due to the irreversibility of its reaction, PKM2 activity is tightly regulated through multiple mechanisms: including gene expression via diverse signaling pathways [8,9,10,11,12,13,14,15,16,17], allosteric inhibition by amino acids (e.g., alanine, phenylalanine, proline, tryptophan, valine) [18,19,20], allosteric activation by fructose-1,6-bisphosphate (FBP), serine, and SAICAR [21,22,23], and post-translational modifications such as phosphorylation [17,24,25,26,27,28,29,30], acetylation [31,32,33], hydroxylation [34], lactylation [35], oxidation [36,37], methylation [38], and glycosylation [39].
According to current understanding, this dynamic regulation allows PKM2 to modulate glycolysis in response to the metabolic needs of cancer cells. When PKM2 activity is suppressed, upstream intermediates accumulate, enabling diversion into anabolic pathways such as the pentose phosphate pathway (PPP) or serine synthesis pathway (SSP), supporting biomass production and cell growth. Conversely, activation of PKM2 depletes these intermediates and enhances ATP production.
Despite extensive study, the intermediate biochemical mechanisms—how PKM2 exerts its influence over glycolysis—remain largely unexplored.
In this section, I present a mechanistic framework grounded in the principle of kinetic-thermodynamic coupling. This framework reveals how PKM2, its substrates, and the ΔG landscape of the glycolytic pathway interact during metabolic transitions.
To maintain clarity: the total enzyme activity of PKM2 is denoted as PKM2t, the actual catalytic activity within the pathway is denoted PKM2a, and metabolite concentrations are written in brackets (e.g., [PEP] for phosphoenolpyruvate).
Thermodynamic and Kinetic Reasoning
Let us consider two steady states of glycolysis:
- Steady state a, where PKM2t is high, and
- Steady state b, where PKM2t is low.
When the system transitions from a to b, PKM2t is reduced. However, the upstream flux, such as that catalyzed by hexokinase 2 (HK2), remains constant. As a result, the substrate of PKM2, [PEP], begins to accumulate.
This increase in [PEP] drives the Gibbs free energy of the PKM2 reaction (ΔGPKM2) to become more negative, in other words, the reaction becomes more exergonic. Due to thermodynamic coupling, this perturbation propagates upstream, leading to the accumulation of intermediates including 2-phosphoglycerate (2-PG), 3-phosphoglycerate (3-PG), glyceraldehyde-3-phosphate (GA3P), dihydroxyacetone phosphate (DHAP), and fructose-1,6-bisphosphate (FBP).
However, the propagation does not extend beyond the PFK1-catalyzed step. This is because the PFK1 reaction maintains a highly negative ΔG (≈ –15 kJ/mol) [4,5,6,7], creating a thermodynamic ‘barrier’ that blocks upstream diffusion of the perturbation.
Even though reduced PKM2t elevates [FBP], the resulting change in ΔGPFK1 is modest and insufficient to bring the reaction near equilibrium. As a result, the concentrations of fructose-6-phosphate (F6P) and glucose-6-phosphate (G6P) remain essentially unchanged.
Stabilization of Glycolytic Input
The stability of [G6P] is especially important because G6P is a strong allosteric inhibitor of HK2. Preventing changes in [G6P] ensures that HK2 activity remains stable, and thus the glycolytic input is preserved. In this way, the large ΔGPFK1 functions as a thermodynamic insulator, maintaining input stability despite downstream disturbances.
Intermediate Metabolite Redistribution and Thermodynamic EQUILIBRATION
During the transition from steady state a to b, ΔGPK becomes more negative, while ΔGPFK1 becomes less negative. This shift leads to a proportional increase in the concentrations of intermediates between PFK1 and PKM2 (i.e., [FBP], [DHAP], [GA3P], [3-PG], [2-PG], [PEP]). Since the reactions connecting these metabolites are near equilibrium, their thermodynamic relationships are preserved, and concentrations shift proportionally.
Conversely, when the system transitions from b back to a (i.e., increasing PKM2t), ΔGPKM2 becomes less negative, and ΔGPFK1 becomes more negative, resulting in a proportional decrease in those same intermediate concentrations.
Despite these shifts, concentrations of [F6P], [G6P], and pyruvate remain stable in both directions of the transition.
Thermodynamic Buffering of PKM2 Activity
This thermodynamic redistribution serves a buffering function: as PKM2t changes, opposing changes in [PEP] and [FBP] stabilize PKM2a. Thus, the glycolytic rate is buffered against large variations in total PKM2 levels. Thus, despite large changes in PKM2t, the glycolytic rate remains stable, due to the compensatory shifts in substrate concentration and reaction energetics.
Theoretical Prediction and Experimental Validation
The theoretical framework of kinetic-thermodynamic coupling outlined above yields predictions that have been experimentally tested [6].
a. Glycolytic flux remains constant despite PKM2 knockdown. An 80% knockdown of PKM2 using siRNA does not reduce glycolytic flux. Glucose uptake and lactate production remain unchanged. This indicates that PKM2a is maintained, despite a sharp drop in PKM2t.
b. [PEP] increases to compensate for reduced PKM2t. As PKM2t decreases, [PEP] rises. This inverse relationship between [PEP] and PKM2t helps maintain a stable PKM2a by compensating for the reduction in enzyme availability through increased substrate concentration.
c. [FBP] increases but remains saturating. [FBP] also rises during PKM2 knockdown. However, because FBP’s Kd for PKM2 is in the nanomolar range (~25.5 ± 148.1 nM) [40], and [FBP] in cells is in the hundreds of micromolar to millimolar range [6], PKM2 is fully saturated with FBP both before and after knockdown. Thus, changes in FBP concentration do not alter PKM2 activity within this range.
d. ΔG shifts confirm pathway redistribution. ΔGPKM2 becomes more negative, consistent with the rise in [PEP]; ΔGPFK1 becomes less negative, due to the accumulation of FBP; ΔG values for other steps remain unchanged; the intermediates in the segment between PFK1 and PKM2 increases proportionally.
e. [F6P] and [G6P] remain stable. Even though ΔGPFK1 becomes slightly less negative, it remains sufficiently exergonic (approximately –13 kJ/mol) to prevent equilibrium and maintain the disequilibrium barrier. As a result, [F6P] and [G6P] levels remain constant, and HK2 activity is unaffected. This insulation of the glycolytic input from downstream disturbances ensures the input flux does not change significantly and suggests that flux to PPP flux does not change significantly.
Summary 2
Both theoretical prediction and experimental evidence support the principle of kinetic-thermodynamic coupling and demonstrate that thermodynamic buffering of intermediate concentrations plays a central role in maintaining glycolytic flux even when PKM2t is markedly perturbed, which are also schematically shown in Figure 1A, left and right panels.
Quantitative Coupling of PKM2 Kinetics with Thermodynamics in the Glycolytic Pathway
To quantitatively examine the relationship between PKM2 kinetics and the thermodynamic properties of the glycolytic pathway, we turn to the cell-free glycolysis system. This system is composed of:
- Cell lysates containing all glycolytic enzymes
- Substrates such as glucose, ATP, ADP, and NAD⁺
- Minimal diversion into branch pathways (e.g., PPP, SSP, mitochondrial metabolism)
Thus, the system functions as an isolated, linear glycolytic pathway, progressing from glucose to lactate under steady-state conditions.
Because the system is linear and lacks branching, the rate through each enzyme in the pathway is identical:
Jlactate = Jglycolysis = Ji (Eq. 6)
Where Jlactate is the rate of lactate generation, Jglycolysis is the rate of glycolysis, Jᵢ refers to the flux through any enzyme in the pathway: JHK2, JPGI, JPFK1, Jaldolase, JTPI, JGAPDH, JPGK1, JPGAM, Jenolase, JPK, and JLDH.
Hence:
where Jlactate could be experimentally determined and () could be expressed by Michaelis-Menton kinetics [4,5,6,7]
JPKM2 = Jlactate (Eq. 7)
| (Eq. 8) |
However, Since PKM2a in the glycolytic pathway is regulated by the FBP, and since FBP reduces the Km without affecting Vmax, Km is substituted by K0.5,
| (Eq. 9) |
Eq. 8 is valid only when [FBP] saturates PKM2. The saturation of PKM2 by FBP is calculated based on the equation of the fractional occupancy of enzyme (θ)
Where KFBP is the dissociation constant for FBP binding to PKM2
Given:
- KFBP ≈ 25.5 ± 148.1 nM [40]
Substituting into the equation of the fractional occupancy of enzyme reveals that PKM2 is nearly 100% saturated with FBP under both in vitro and in vivo conditions.
Therefore, Eq. 8 is valid under physiological and experimental conditions.
Linking Thermodynamics to Kinetics
When [PKM2]% changes between 100% and 20%, Jlactate remains unchanged, also remains constant(6). Rearranging Eq. 8 gives:
| (Eq. 10) |
[PEP] is not an isolated variable but is constrained by the thermodynamic landscape of the glycolytic pathway. As shown above, changes in PKM2t activity leads to reciprocal changes in ∆GPKM2 and ∆GPFK1: when PKM2t increases, ∆GPKM2 becomes less negative while ∆GPFK1 becomes more negative; conversely, when PKM2t decreases, ∆GPKM2 becomes more negative while ∆GPFK1 becomes less negative; in either case, Gibbs free energy values of other reactions in the glycolytic pathway remains constant. Thus, [PEP] can also be expressed in terms of the actual changes of ∆GPKM2 and ∆GPFK1:
First, since:
| ∆GPKM2 = +RT ln |
which can be rearranged to:
| (1) |
for PFK1-catalyzed reaction:
| ∆GPFK1 = +RT ln |
which can be rearranged to:
| (2) |
Substituting (2) into (1) yields
| Eq. 11 |
Combining Eq. 10 and Eq. 11 yields
| (Eq. 12) |
Summary 4
Equations 9 – 11 together means that
- PKM2 kinetics is tightly coupled with thermodynamics of the glycolytic pathway.
- When [PKM2] or PKM2t decreases, ΔGPKM2 becomes more negative, ΔGPFK1 becomes less negative, and [PEP] increases.
- When [PKM2] or PKM2t increases, ΔGPKM2 becomes less negative, ΔGPFK1 becomes more negative, and [PEP] decreases.
- This reciprocal changes of ΔGPKM2 and ΔGPFK1 in the glycolytic pathway are the basis for the reciprocal changes of PKM2t and [PEP], that maintains PKM2a and glycolytic rate constant despite the marked change of PKM2t.
Thus, Equations 5–11 form an interdependent system that quantitatively links PKM2t (total activity), PKM2a (vPKM2), [PEP], the thermodynamic landscape of the glycolytic pathway, and Jlactate (system output) (Figure 1B).
Relevance to Living Cells
Although derived from a cell-free system, this model applies to living cells based on the experimental observations [6]:
a) The profile of ΔG values in glycolysis is comparable between cell-free systems and intact cells.
b) PKM2 knockdown leads to the same outcomes in both contexts: glycolytic flux remains stable, ΔGPK becomes more negative, ΔGPFK1 becomes less negative, and intermediate concentrations rise proportionally between PFK1 and PKM2.
c) [FBP] remains saturating for PKM2 in cells (0.21–1.51 mM range).
d) Actual PKM2 activity (PKM2a) is unaffected by knockdown.
Transient Interstate Between Any Two Steady States
Between any two steady states of glycolysis lies a transient intermediate state - a brief period in which both flux and metabolite concentrations are dynamically adjusting. This intermediate phase is quantifiable and reflects the coordinated shifts in enzymatic activity, metabolite pools, and ΔG distribution.
Let’s consider a situation where PKM2t decreases from an initial steady-state level (a) to a new lower level (b), resulting in a shift from steady state a to steady state b. Three key parameters define this transient transition:
- m denotes the total amount of substrate processed by PKM2 during the transition
- denotes the average catalytic velocity of PKM2 during the transition
- t denotes the time required to complete the transition
These are related by:
| (Eq. 13) |
Given the [PEP] values at the beginning and end of the transition, and FBP is saturating PKM2, the velocity of PKM2 at each steady state can be defined using a Michaelis-Menten-like expression:
At steady state a (initial):
At steady state b (final):
The average velocity () during the transition is:
| (Eq.14) |
Substituting the equation for and integrating yields:
Solving the integral (see Method) and yielding:
| (Eq. 15) |
The time (t) required for the system to transition between steady states is deduced from following:
Because
Solving the integral (see Method) yields:
| (Eq. 16) |
This framework can be applied to:
- Instantaneous changes in PKM2t, or
- Stepwise changes across n discrete steps.
If PKM2 activity does not change instantaneously but transitions stepwise in n discrete steps, then the total mass (m) and total time (t) are the sums across all transient substates:
The average velocity over the transition is then:
Notably, the cumulative effect of stepwise transitions is mathematically equivalent to that of a single instantaneous transition from [PKM2]ₐ to [PKM2]b, when integrated across all intermediate states. Therefore, these equations provide a framework for evaluating both instantaneous and gradual transitions between glycolytic steady states
As an example, consider a scenario where PKM2 activity decreases in Hela cells due to siRNA knockdown, resulting in a drop from 958301000 to 286268000 μmol/min·l cells, and during this transition, the intracellular [PEP] increases from 67 to 215 μM (See Method).
Applying Eq. 14, 15 and 16:
| = 183159000 mol/min·l cells |
| = 0.049 milliseconds |
| = 150 μmol/l cells |
This calculation demonstrates that the duration of the interstate is very short so that the total mass processed is small.
Summary 3
Transitions between steady states in glycolysis occur through a brief, quantifiable “interstate” phase (Figure 1A, middle panel), during which metabolite concentrations and Gibbs free energy values are dynamically redistributed.
This interstate is governed by the same kinetic-thermodynamic principles as the steady state and ensures that the system adjusts efficiently and predictably. The magnitude of intermediate redistribution, the rate of adjustment, and the duration of the transition are all tightly constrained by the pathway’s thermodynamic landscape.
PKM2’s Flux Control Coefficient and Intermediate Concentration Control Coefficient
The flux control coefficient (FCC) and concentration control coefficient (CCC) are central concepts in Metabolic Control Analysis (MCA). They describe how a particular enzyme influences the behavior of a metabolic pathway at steady state:
- FCC quantifies an enzyme’s influence on the flux through the pathway.
- CCC quantifies its influence on the concentration of a given intermediate.
These are system-level properties governed by network context and do not, by themselves, reveal the biochemical mechanism underlying control. The principle of kinetic-thermodynamic coupling, however, offers mechanistic insight into why PKM2 exerts negligible control over glycolytic flux but significantly affects intermediate concentrations.
Flux Control Coefficient (FCC) of PKM2
FCC is defined as the infinitesimal fractional change in pathway flux (J) in response to an infinitesimal fractional change in enzyme activity:
| ÷ (Eq. 17) |
Because an 80% knockdown of PKM2 does not significantly affect glycolytic flux, then:
| 0 (Eq. 18) |
This implies that PKM2 does not exert rate-limiting control under physiological conditions.
Concentration Control Coefficient (CCC) of PKM2
CCC is defined as the fractional change in metabolite concentration [Sⱼ] caused by an infinitesimal change in enzyme activity [Eᵢ]:
| = ⸱ (Eq. 19) |
For example, the CCC of PKM2 on [PEP] is:
| = (Eq. 20 ) |
Rearranged:
| = (Eq. 21) |
Resolving the differentiation (see Method) and yielding
| = (Eq. 22) |
The value of is negative, which means increasing PKM2 decreases PEP or decreasing PKM2 increases PEP.
Similarly, could be calculated by the mathematical deduction (see Method)
| = (Eq. 23) |
It is not surprising that Eq. 16 is the same as Eq 17, because it is assuming that in the reaction catalyzed by enolase, Q ≈Keq.
Likewise, the CCC of PKM2 over 3-PG, GA3P, DHAP, FBP could be mathematically deduced.
Alternatively, the CCC of PKM2 on 2-PG, 3-PG, GA3P, DHAP, and FBP can be derived from the following reasoning: because the reactions between PEP and FBP are near-equilibrium, the concentrations of all intermediates in this segment change proportionally in response to PKM2 perturbation:
| = |
therefore
| = = = = = = (Eq. 24) |
In contrast, [F6P], [G6P], and [pyruvate] do not change significantly following PKM2 knockdown. This is consistent with:
- The ΔG of the PFK1 reaction insulating upstream segments
- The final step (LDH) maintaining pyruvate homeostasis
Therefore:
| = |
| == 0 (Eq. 25) |
Summary 5
While PKM2 exerts little control over glycolytic flux (FCC ≈ 0) (Figure 1C), it strongly influences the concentrations of intermediates in the segment between PKM2 and PFK1 but not other intermediates (Figure 1D). This arises from the kinetic-thermodynamic architecture of glycolysis and explains how intermediate levels are responsive to enzyme perturbations, even when the pathway output remains stable.
Discussion
At steady state, glycolysis maintains equal flux through all reactions and stable concentrations of intermediates by dynamically coordinating enzyme activity with thermodynamic constraints. This interdependence defines the principle of kinetic-thermodynamic coupling, wherein the kinetics of each step are governed not only by enzyme levels but also by the thermodynamic landscape of the pathway.
While the dynamic adaptability of glycolysis has been extensively studied, the inherent stability of its steady state has received far less attention. The principle of kinetic-thermodynamic coupling suggests that glycolysis possesses a built-in capacity to rapidly reestablish homeostasis following perturbation - such as changes in enzyme activity or substrate levels - typically within a fraction of a millisecond. This perspective reframes our understanding of glycolytic regulation: glycolysis is not merely a passive and flexible pathway that responds to external changes, but a resilient, self-stabilizing system governed by intrinsic thermodynamic and kinetic constraints.
Through the perspective of the kinetic-thermodynamic coupling in the glycolytic pathway, the following insights that have not been previously perceived can be further revealed:
Flux Stability Through Thermodynamic Buffering
When a glycolytic enzyme such as PKM2 is perturbed, the system compensates through thermodynamic adjustments by changing substrate concentrations and redistributing Gibbs free energy (ΔG) across reactions. This thermodynamic buffering maintains a constant actual enzymatic rate (v), even when total enzyme activity varies significantly. As a result, glycolytic flux remains stable across a wide range of enzymatic perturbations. This principle explains experimental observations such as the stability of glycolytic rate despite large reductions in PKM2, GAPDH, PGK1, and LDH activity, and the accompanying rise in substrate concentrations and ΔG changes [4,5,6,7].
The Interstate Between 2 Steady States
Transitions between steady states occur through a brief and quantifiable interstate phase. During this phase, intermediate concentrations and ΔG values adjust dynamically, but the total substrate turnover and time elapsed are minimal. The interstate is governed by the same kinetic-thermodynamic principles as the steady state, ensuring efficient and predictable transitions. For example, PKM2 perturbation induces a redistribution of [PEP] and ΔGPK within fractions of a millisecond, with negligible cumulative effects on flux or pool size.
Flux and Concentration Control
While enzymes like PKM2 exert little control over overall glycolytic flux (FCC ≈ 0), they strongly influence the concentrations of intermediates between PFK1 and PKM2. This is a natural outcome of the kinetic-thermodynamic architecture: the pathway flexibly adjusts concentrations to maintain flux, while preserving flux stability.
Pathway-Level Thermodynamic Organization
Thermodynamics in linear pathways like glycolysis does more than determine reaction direction, it shapes the entire energetic profile of the system. In contrast to isolated reactions, pathway thermodynamics governs how ΔG is distributed, how intermediate pools are stabilized, and how changes in one step influence others.
The highly exergonic ΔGPFK1 step functions as a thermodynamic barrier, preventing downstream disturbances (e.g., from PKM2, GAPDH, PGK1, LDH) from propagating backward to affect upstream metabolites like [G6P]. This preserves glycolytic input and stabilizes hexokinase (HK2) activity against feedback inhibition.
Feedforward Saturation
Fructose-1,6-bisphosphate (FBP) is a potent allosteric activator of PKM2. However, because [FBP] is present at saturating levels under both basal and perturbed conditions, its concentration fluctuations do not affect PKM2 activity. This feedforward loop is thus insulated by saturation, ensuring that changes in glycolytic rate are not attributed to FBP variation.
A Diagnostic Framework for Enzyme Regulation
Kinetic-thermodynamic coupling provides a testable signature for assessing whether an enzyme (e.g., PKM2) is functionally regulating glycolysis. If regulatory changes of PKM2 (e.g., expression, PTMs, or allosteric effectors) influence glycolysis, one should observe:
- Reciprocal shifts in ΔGPK and ΔGPFK1
- Proportional changes in intermediate concentrations between PFK1 and PKM2
- Stability of upstream ([G6P], [F6P]) and downstream ([pyruvate]) metabolites
- An inverse correlation between PKM2t and [PEP] that preserves PKM2a
The Flux to Lactate and to Side Branches
Based on the proposed principle, along with experimental data, reducing PKM2t by up to 80% does not significantly decrease PKM2a in the pathway. Consequently, neither glucose consumption nor flux to lactate is significantly affected. Since the rate to lactate does not change significantly, implying the rate to pyruvate does not change significantly, hence the pyruvate to mitochondrial metabolism would not change significantly. Since [G6P] remains unchanged due to the restraint of ∆GPFK1, PPP flux is not likely changing significantly. In contrast, [3PG] increases markedly, leading to approximately twofold increase in SSP flux [6]. Nevertheless, because the flux of 3-PG to SSP is much lower than its flux to lactate, this shift has a negligible impact on overall lactate production. For example, in HeLa cells, the 3-PG flux into SSP is approximately 15 nmol/h per million cells [41], in contrast to flux to lactate averages around 2000 nmol/h per million cells [4,5,6,7,41], twofold increase of SSP negligibly influence the rate to lactate. The flux is schematically showing in Figure 2.
Beyond PKM2
The same logic applies to other glycolytic enzymes such as GAPDH and PGK1, which also demonstrate thermodynamic redistribution and flux buffering upon perturbation [4,5,6,7]. More broadly, in any linear or branched metabolic pathway, the interplay between kinetics and thermodynamics is inevitable. Thus, kinetic-thermodynamic coupling may represent a generalizable design principle underlying metabolism.
Methods
The principle of kinetic-thermodynamic coupling is reasoned out based on the fundamental theory of enzyme kinetics and Gibbs free energy equations, and based on the glycolytic flux rate, the concentration pattern of the glycolytic intermediates, and the distribution of Gibbs free energy in the glycolytic pathway at the steady-state glycolysis, reported by us previously [4,5,6,7].
The Average Velocity for the System to Transition Between Steady States
is derived by the following mathematical reasoning:
because the initial PEP concentration is [PEP]a, and the PKM2 velocity is given by:
where K0.5 is the PEP concentration at half-maximal velocity under saturating levels of the allosteric regulator FBP (this will be further explained in the subsequent section of The quantitative coupling of PKM2 kinetics with glycolytic thermodynamics).
Upon reaching steady state b, the PEP concentration is [PEP]b, and the PKM2 velocity becomes:
The average velocity during the transition from va to vb is given by:
| (Eq. 14) |
Substitute u = , then du = d[PEP]
| = |
| (Eq. 15) |
The Time (t) Required for the System to Transition Between Steady States
The time (t) required for the system to transition between steady states is deduced from following:
because
Therefore
because
Therefore
| = |
Therefore
| (Eq. 16) |
The Data Used to Calculate , t, and Mass Transfer (m) for the System to Transition Between Steady States
The following numbers from Hela cells [41] are used for calculating , t, and m.
| Kcat[PKM2]a (μmol/min∙mg protein)(before PKM2 KD) | 3387 |
| Kcat[PKM2]b (μmol/min∙mg protein)(after PKM2 KD) | 1012 |
| mg protein/l cells | 282000 |
| Kcat[PKM2]a (μmol/min∙l cells) | 955134000 |
| Kcat[PKM2]b (μmol/min∙l cells) | 285666000 |
| K0.5 (μM) | 74 |
| [PEP]a (μM) (before PKM2 KD) | 67 |
| [PEP]b (μM) (after PKM2 KD) | 215 |
| ∆[PEP] (μM) | 148 |
| v̅ (μmol/min∙l cells) | 183159000 |
| t (ms) | 0.049 |
| m (μmol/l cells) | 150 |
Calculation of
According to the definition of CCC, the infinitesimal fractional change of [PEP] responding to the infinitesimal fractional change of [PKM2] could be express by
| = (1) |
Rearrange:
| = (2) |
| Because (3) |
| = |
| = (4) |
Combining (2) and (4)
| ==(5) |
Combining (3) and (5), simplified as
| = (Eq. 22) |
Calculation of CCC of PKM2 for Other Glycolytic Intermediates
Similarly, could be calculated by the following mathematical deduction:
| [2-PG] = |
As reaction quotient (Q) of enolase-catalyzed reaction in the glycolytic pathway is near equilibrium,
| Q ≈ |
| [2-PG] ≈ (1) |
Inserting into (1)
| [2-PG] = (2) |
| = |
| = (3) |
Thus:
| =⸱ (4) |
Combining (1) and (4), simplified as,
| = ⸱ (5) |
Inserting into (5)
| = (Eq. 23) |
Funding and additional information
This work has been supported in part by China national 973 project (2013CB911303), China Natural Science Foundation projects (82073038, 81772947), a key project (2018C03009) funded by Zhejiang Provincial Department of Sciences and Technologies to X.H.
References
- Jia, D., Lu, M., Jung, K. H., Park, J. H., Yu, L., Onuchic, J. N., Kaipparettu, B. A., and Levine, H. (2019) Elucidating cancer metabolic plasticity by coupling gene regulation with metabolic pathways. Proc Natl Acad Sci U S A 116, 3909-3918.
- Fendt, S. M., Frezza, C., and Erez, A. (2020) Targeting Metabolic Plasticity and Flexibility Dynamics for Cancer Therapy. Cancer Discov 10, 1797-1807.
- Parlani, M., Jorgez, C., and Friedl, P. (2023) Plasticity of cancer invasion and energy metabolism. Trends Cell Biol 33, 388-402.
- Jin, C., Zhu, X., Wu, H., Wang, Y., and Hu, X. (2020) Perturbation of phosphoglycerate kinase 1 (PGK1) only marginally affects glycolysis in cancer cells. J Biol Chem 295, 6425-6446.
- Zhu, X., Jin, C., Pan, Q., and Hu, X. (2021) Determining the quantitative relationship between glycolysis and GAPDH in cancer cells exhibiting the Warburg effect. J Biol Chem 296, 100369.
- Jin, C., Hu, W., Wang, Y., Wu, H., Zeng, S., Ying, M., and Hu, X. (2024) Deciphering the interaction between PKM2 and the built-in thermodynamic properties of the glycolytic pathway in cancer cells. J Biol Chem 300, 107648.
- Zeng, S., Wang, Y., Ying, M., Jin, C., Ying, C., Wang, D., Wu, H., and Hu, X. (2024) Elucidating the kinetic and thermodynamic insight into regulation of glycolysis by lactate dehydrogenase and its impact on tricarboxylic acid cycle and oxidative phosphorylation in cancer cells. eLife Sciences Publications, Ltd.
- de Wit, R. H., Mujic-Delic, A., van Senten, J. R., Fraile-Ramos, A., Siderius, M., and Smit, M. J. (2016) Human cytomegalovirus encoded chemokine receptor US28 activates the HIF-1alpha/PKM2 axis in glioblastoma cells. Oncotarget 7, 67966-67985.
- Yang, L., Hou, Y., Yuan, J., Tang, S., Zhang, H., Zhu, Q., Du, Y. E., Zhou, M., Wen, S., Xu, L., Tang, X., Cui, X., and Liu, M. (2015) Twist promotes reprogramming of glucose metabolism in breast cancer cells through PI3K/AKT and p53 signaling pathways. Oncotarget 6, 25755-25769.
- Sun, Q., Chen, X., Ma, J., Peng, H., Wang, F., Zha, X., Wang, Y., Jing, Y., Yang, H., Chen, R., Chang, L., Zhang, Y., Goto, J., Onda, H., Chen, T., Wang, M. R., Lu, Y., You, H., Kwiatkowski, D., and Zhang, H. (2011) Mammalian target of rapamycin up-regulation of pyruvate kinase isoenzyme type M2 is critical for aerobic glycolysis and tumor growth. Proc Natl Acad Sci U S A 108, 4129-4134.
- Panasyuk, G., Espeillac, C., Chauvin, C., Pradelli, L. A., Horie, Y., Suzuki, A., Annicotte, J. S., Fajas, L., Foretz, M., Verdeguer, F., Pontoglio, M., Ferre, P., Scoazec, J. Y., Birnbaum, M. J., Ricci, J. E., and Pende, M. (2012) PPARgamma contributes to PKM2 and HK2 expression in fatty liver. Nat Commun 3, 672.
- Wu, M., An, J., Zheng, Q., Xin, X., Lin, Z., Li, X., Li, H., and Lu, D. (2016) Double mutant P53 (N340Q/L344R) promotes hepatocarcinogenesis through upregulation of Pim1 mediated by PKM2 and LncRNA CUDR. Oncotarget 7, 66525-66539.
- Shang, Y., He, J., Wang, Y., Feng, Q., Zhang, Y., Guo, J., Li, J., Li, S., Wang, Y., Yan, G., Ren, F., Shi, Y., Xu, J., Zeps, N., Zhai, Y., He, D., and Chang, Z. (2017) CHIP/Stub1 regulates the Warburg effect by promoting degradation of PKM2 in ovarian carcinoma. Oncogene 36, 4191-4200.
- Xu, Q., Liu, L. Z., Yin, Y., He, J., Li, Q., Qian, X., You, Y., Lu, Z., Peiper, S. C., Shu, Y., and Jiang, B. H. (2015) Regulatory circuit of PKM2/NF-kappaB/miR-148a/152-modulated tumor angiogenesis and cancer progression. Oncogene 34, 5482-5493.
- Zhang, L. F., Lou, J. T., Lu, M. H., Gao, C., Zhao, S., Li, B., Liang, S., Li, Y., Li, D., and Liu, M. F. (2015) Suppression of miR-199a maturation by HuR is crucial for hypoxia-induced glycolytic switch in hepatocellular carcinoma. EMBO J 34, 2671-2685.
- Guo, M., Zhao, X., Yuan, X., Jiang, J., and Li, P. (2017) MiR-let-7a inhibits cell proliferation, migration, and invasion by down-regulating PKM2 in cervical cancer. Oncotarget 8, 28226-28236.
- Li, H., Li, J., Jia, S., Wu, M., An, J., Zheng, Q., Zhang, W., and Lu, D. (2015) miR675 upregulates long noncoding RNA H19 through activating EGR1 in human liver cancer. Oncotarget 6, 31958-31984.
- Morgan, H. P., O’Reilly, F. J., Wear, M. A., O’Neill, J. R., Fothergill-Gilmore, L. A., Hupp, T., and Walkinshaw, M. D. (2013) M2 pyruvate kinase provides a mechanism for nutrient sensing and regulation of cell proliferation. Proc Natl Acad Sci U S A 110, 5881-5886.
- Sparmann, G., Schulz, J., and Hofmann, E. (1973) Effects of L-alanine and fructose (1,6-diphosphate) on pyruvate kinase from ehrlich ascites tumour cells. FEBS Lett 36, 305-308.
- Yuan, M., McNae, I. W., Chen, Y., Blackburn, E. A., Wear, M. A., Michels, P. A. M., Fothergill-Gilmore, L. A., Hupp, T., and Walkinshaw, M. D. (2018) An allostatic mechanism for M2 pyruvate kinase as an amino-acid sensor. Biochem J 475, 1821-1837.
- Dombrauckas, J. D., Santarsiero, B. D., and Mesecar, A. D. (2005) Structural basis for tumor pyruvate kinase M2 allosteric regulation and catalysis. Biochemistry 44, 9417-9429.
- Chaneton, B., Hillmann, P., Zheng, L., Martin, A. C. L., Maddocks, O. D. K., Chokkathukalam, A., Coyle, J. E., Jankevics, A., Holding, F. P., Vousden, K. H., Frezza, C., O’Reilly, M., and Gottlieb, E. (2012) Serine is a natural ligand and allosteric activator of pyruvate kinase M2. Nature 491, 458-462.
- Keller, K. E., Tan, I. S., and Lee, Y. S. (2012) SAICAR stimulates pyruvate kinase isoform M2 and promotes cancer cell survival in glucose-limited conditions. Science 338, 1069-1072.
- Hitosugi, T., Kang, S., Vander Heiden, M. G., Chung, T. W., Elf, S., Lythgoe, K., Dong, S., Lonial, S., Wang, X., Chen, G. Z., Xie, J., Gu, T. L., Polakiewicz, R. D., Roesel, J. L., Boggon, T. J., Khuri, F. R., Gilliland, D. G., Cantley, L. C., Kaufman, J., and Chen, J. (2009) Tyrosine phosphorylation inhibits PKM2 to promote the Warburg effect and tumor growth. Sci Signal 2, ra73.
- Presek, P., Reinacher, M., and Eigenbrodt, E. (1988) Pyruvate kinase type M2 is phosphorylated at tyrosine residues in cells transformed by Rous sarcoma virus. FEBS Lett 242, 194-198.
- Bettaieb, A., Bakke, J., Nagata, N., Matsuo, K., Xi, Y., Liu, S., AbouBechara, D., Melhem, R., Stanhope, K., Cummings, B., Graham, J., Bremer, A., Zhang, S., Lyssiotis, C. A., Zhang, Z. Y., Cantley, L. C., Havel, P. J., and Haj, F. G. (2013) Protein tyrosine phosphatase 1B regulates pyruvate kinase M2 tyrosine phosphorylation. J Biol Chem 288, 17360-17371.
- Christofk, H. R., Vander Heiden, M. G., Wu, N., Asara, J. M., and Cantley, L. C. (2008) Pyruvate kinase M2 is a phosphotyrosine-binding protein. Nature 452, 181-186.
- Yang, W., Zheng, Y., Xia, Y., Ji, H., Chen, X., Guo, F., Lyssiotis, C. A., Aldape, K., Cantley, L. C., and Lu, Z. (2012) ERK1/2-dependent phosphorylation and nuclear translocation of PKM2 promotes the Warburg effect. Nat Cell Biol 14, 1295-1304.
- Park, Y. S., Kim, D. J., Koo, H., Jang, S. H., You, Y. M., Cho, J. H., Yang, S. J., Yu, E. S., Jung, Y., Lee, D. C., Kim, J. A., Park, Z. Y., Park, K. C., and Yeom, Y. I. (2016) AKT-induced PKM2 phosphorylation signals for IGF-1-stimulated cancer cell growth. Oncotarget 7, 48155-48167.
- Lee, K. M., Nam, K., Oh, S., Lim, J., Lee, T., and Shin, I. (2015) ECM1 promotes the Warburg effect through EGF-mediated activation of PKM2. Cell Signal 27, 228-235.
- Lv, L., Li, D., Zhao, D., Lin, R., Chu, Y., Zhang, H., Zha, Z., Liu, Y., Li, Z., Xu, Y., Wang, G., Huang, Y., Xiong, Y., Guan, K. L., and Lei, Q. Y. (2011) Acetylation targets the M2 isoform of pyruvate kinase for degradation through chaperone-mediated autophagy and promotes tumor growth. Mol Cell 42, 719-730.
- Lv, L., Xu, Y. P., Zhao, D., Li, F. L., Wang, W., Sasaki, N., Jiang, Y., Zhou, X., Li, T. T., Guan, K. L., Lei, Q. Y., and Xiong, Y. (2013) Mitogenic and oncogenic stimulation of K433 acetylation promotes PKM2 protein kinase activity and nuclear localization. Mol Cell 52, 340-352.
- Park, S. H., Ozden, O., Liu, G., Song, H. Y., Zhu, Y., Yan, Y., Zou, X., Kang, H. J., Jiang, H., Principe, D. R., Cha, Y. I., Roh, M., Vassilopoulos, A., and Gius, D. (2016) SIRT2-Mediated Deacetylation and Tetramerization of Pyruvate Kinase Directs Glycolysis and Tumor Growth. Cancer Res 76, 3802-3812.
- Luo, W., Hu, H., Chang, R., Zhong, J., Knabel, M., O’Meally, R., Cole, R. N., Pandey, A., and Semenza, G. L. (2011) Pyruvate kinase M2 is a PHD3-stimulated coactivator for hypoxia-inducible factor 1. Cell 145, 732-744.
- Wang, J., Yang, P., Yu, T., Gao, M., Liu, D., Zhang, J., Lu, C., Chen, X., Zhang, X., and Liu, Y. (2022) Lactylation of PKM2 Suppresses Inflammatory Metabolic Adaptation in Pro-inflammatory Macrophages. Int J Biol Sci 18, 6210-6225.
- Iqbal, M. A., Siddiqui, F. A., Gupta, V., Chattopadhyay, S., Gopinath, P., Kumar, B., Manvati, S., Chaman, N., and Bamezai, R. N. (2013) Insulin enhances metabolic capacities of cancer cells by dual regulation of glycolytic enzyme pyruvate kinase M2. Mol Cancer 12, 72.
- Anastasiou, D., Poulogiannis, G., Asara, J. M., Boxer, M. B., Jiang, J. K., Shen, M., Bellinger, G., Sasaki, A. T., Locasale, J. W., Auld, D. S., Thomas, C. J., Vander Heiden, M. G., and Cantley, L. C. (2011) Inhibition of pyruvate kinase M2 by reactive oxygen species contributes to cellular antioxidant responses. Science 334, 1278-1283.
- Liu, F., Ma, F., Wang, Y., Hao, L., Zeng, H., Jia, C., Wang, Y., Liu, P., Ong, I. M., Li, B., Chen, G., Jiang, J., Gong, S., Li, L., and Xu, W. (2017) PKM2 methylation by CARM1 activates aerobic glycolysis to promote tumorigenesis. Nat Cell Biol 19, 1358-1370.
- Wang, Y., Liu, J., Jin, X., Zhang, D., Li, D., Hao, F., Feng, Y., Gu, S., Meng, F., Tian, M., Zheng, Y., Xin, L., Zhang, X., Han, X., Aravind, L., and Wei, M. (2017) O-GlcNAcylation destabilizes the active tetrameric PKM2 to promote the Warburg effect. Proc Natl Acad Sci U S A 114, 13732-13737.
- Macpherson, J. A., Theisen, A., Masino, L., Fets, L., Driscoll, P. C., Encheva, V., Snijders, A. P., Martin, S. R., Kleinjung, J., Barran, P. E., Fraternali, F., and Anastasiou, D. (2019) Functional cross-talk between allosteric effects of activating and inhibiting ligands underlies PKM2 regulation. Elife 8.
- Wang, Y., Wu, H., and Hu, X. (2025) Quantification of the inputs and outputs of serine and glycine metabolism in cancer cells. Arch Biochem Biophys 768, 110367.
Figure 1.
Coupling between enzyme kinetics and chemical thermodynamics in PKM2-mediated regulation of glycolysis. (A) A representative transition between two steady-state glycolytic conditions in HeLa cells (JBC, 2024). Left panel: glycolysis at steady state with 100% PKM2 total activity (PKM2t). Right panel: glycolysis at steady state with 20% PKM2t. Middle panel: transient intermediate state during the transition from high to low PKM2t. Decreasing PKM2t from 100% to 20% redistributes the Gibbs free energy (ΔG) along the glycolytic pathway. at high PKM2t: ΔGPK is less negative, whereas ΔGPFK1 is more negative, at low PKM2t: ΔGPK becomes more negative, while ΔGPFK1 is less negative, and ΔG values of other glycolytic reactions remain largely unchanged. This redistribution of ΔG results in coordinated changes in glycolytic intermediate concentrations. At high PKM2t: levels of FBP, GA3P, DHAP, 3-PG, 2-PG, and PEP are proportionally reduced; at low PKM2t, levels of these intermediates proportionally increase, while G6P, F6P, and pyruvate levels are largely unaffected. The sizes of ovals represent relative concentrations of intermediates, distributed according to the thermodynamic landscape. PKM2 is saturated by its dominant allosteric activator, FBP, and is not further inhibited or activated by other allosteric effectors such as alanine, phenylalanine, proline, tryptophan, serine, or TEPP-46 [4,5,6,7]. Changes in PKM2t do not alter G6P concentration, hence unlikely change the flux through the pentose phosphate pathway (PPP). However, the resulting changes in 3-PG levels significantly affect the flux through the serine synthesis pathway (SSP): High PKM2t, lower 3-PG and lower SSP flux; while Low PKM2t, higher 3-PG and higher SSP flux. Despite this, the overall glycolytic flux remains constant, as glycolytic flux to pyruvate is approximately 2 orders of magnitude folds higher than the SSP flux (4-7,41). Thus, PKM2t can vary between 100% and 20% without changing glycolytic flux. This is achieved through a compensatory increase in [PEP], which offsets the decrease in PKM2t and maintains constant actual PKM2 activity (PKM2a = vPKM2). PKM2t, PKM2a, glycolytic flux, intermediate concentrations, and pathway thermodynamics are tightly coupled. The shift from one steady state to another requires passing through a transient, non-steady-state glycolytic state, which is mathematically tractable in terms of flux (v̅), time (t), and mass (m), and contributes minimally to the overall system. (B) Equation showing that PKM2a (vPKM2) remains constant due to a reciprocal relationship between [PEP] and PKM2t and [PEP] is thermodynamically equilibrated in the pathway. (C) Flux control coefficient equation indicating that PKM2 has a negligible effect on total glycolytic flux. (D) Concentration control coefficient equation indicating that PKM2 significantly controls the levels of intermediates in the segment between PFK1 and PKM2, while negligibly the levels of G6P, F6P, and pyruvate.
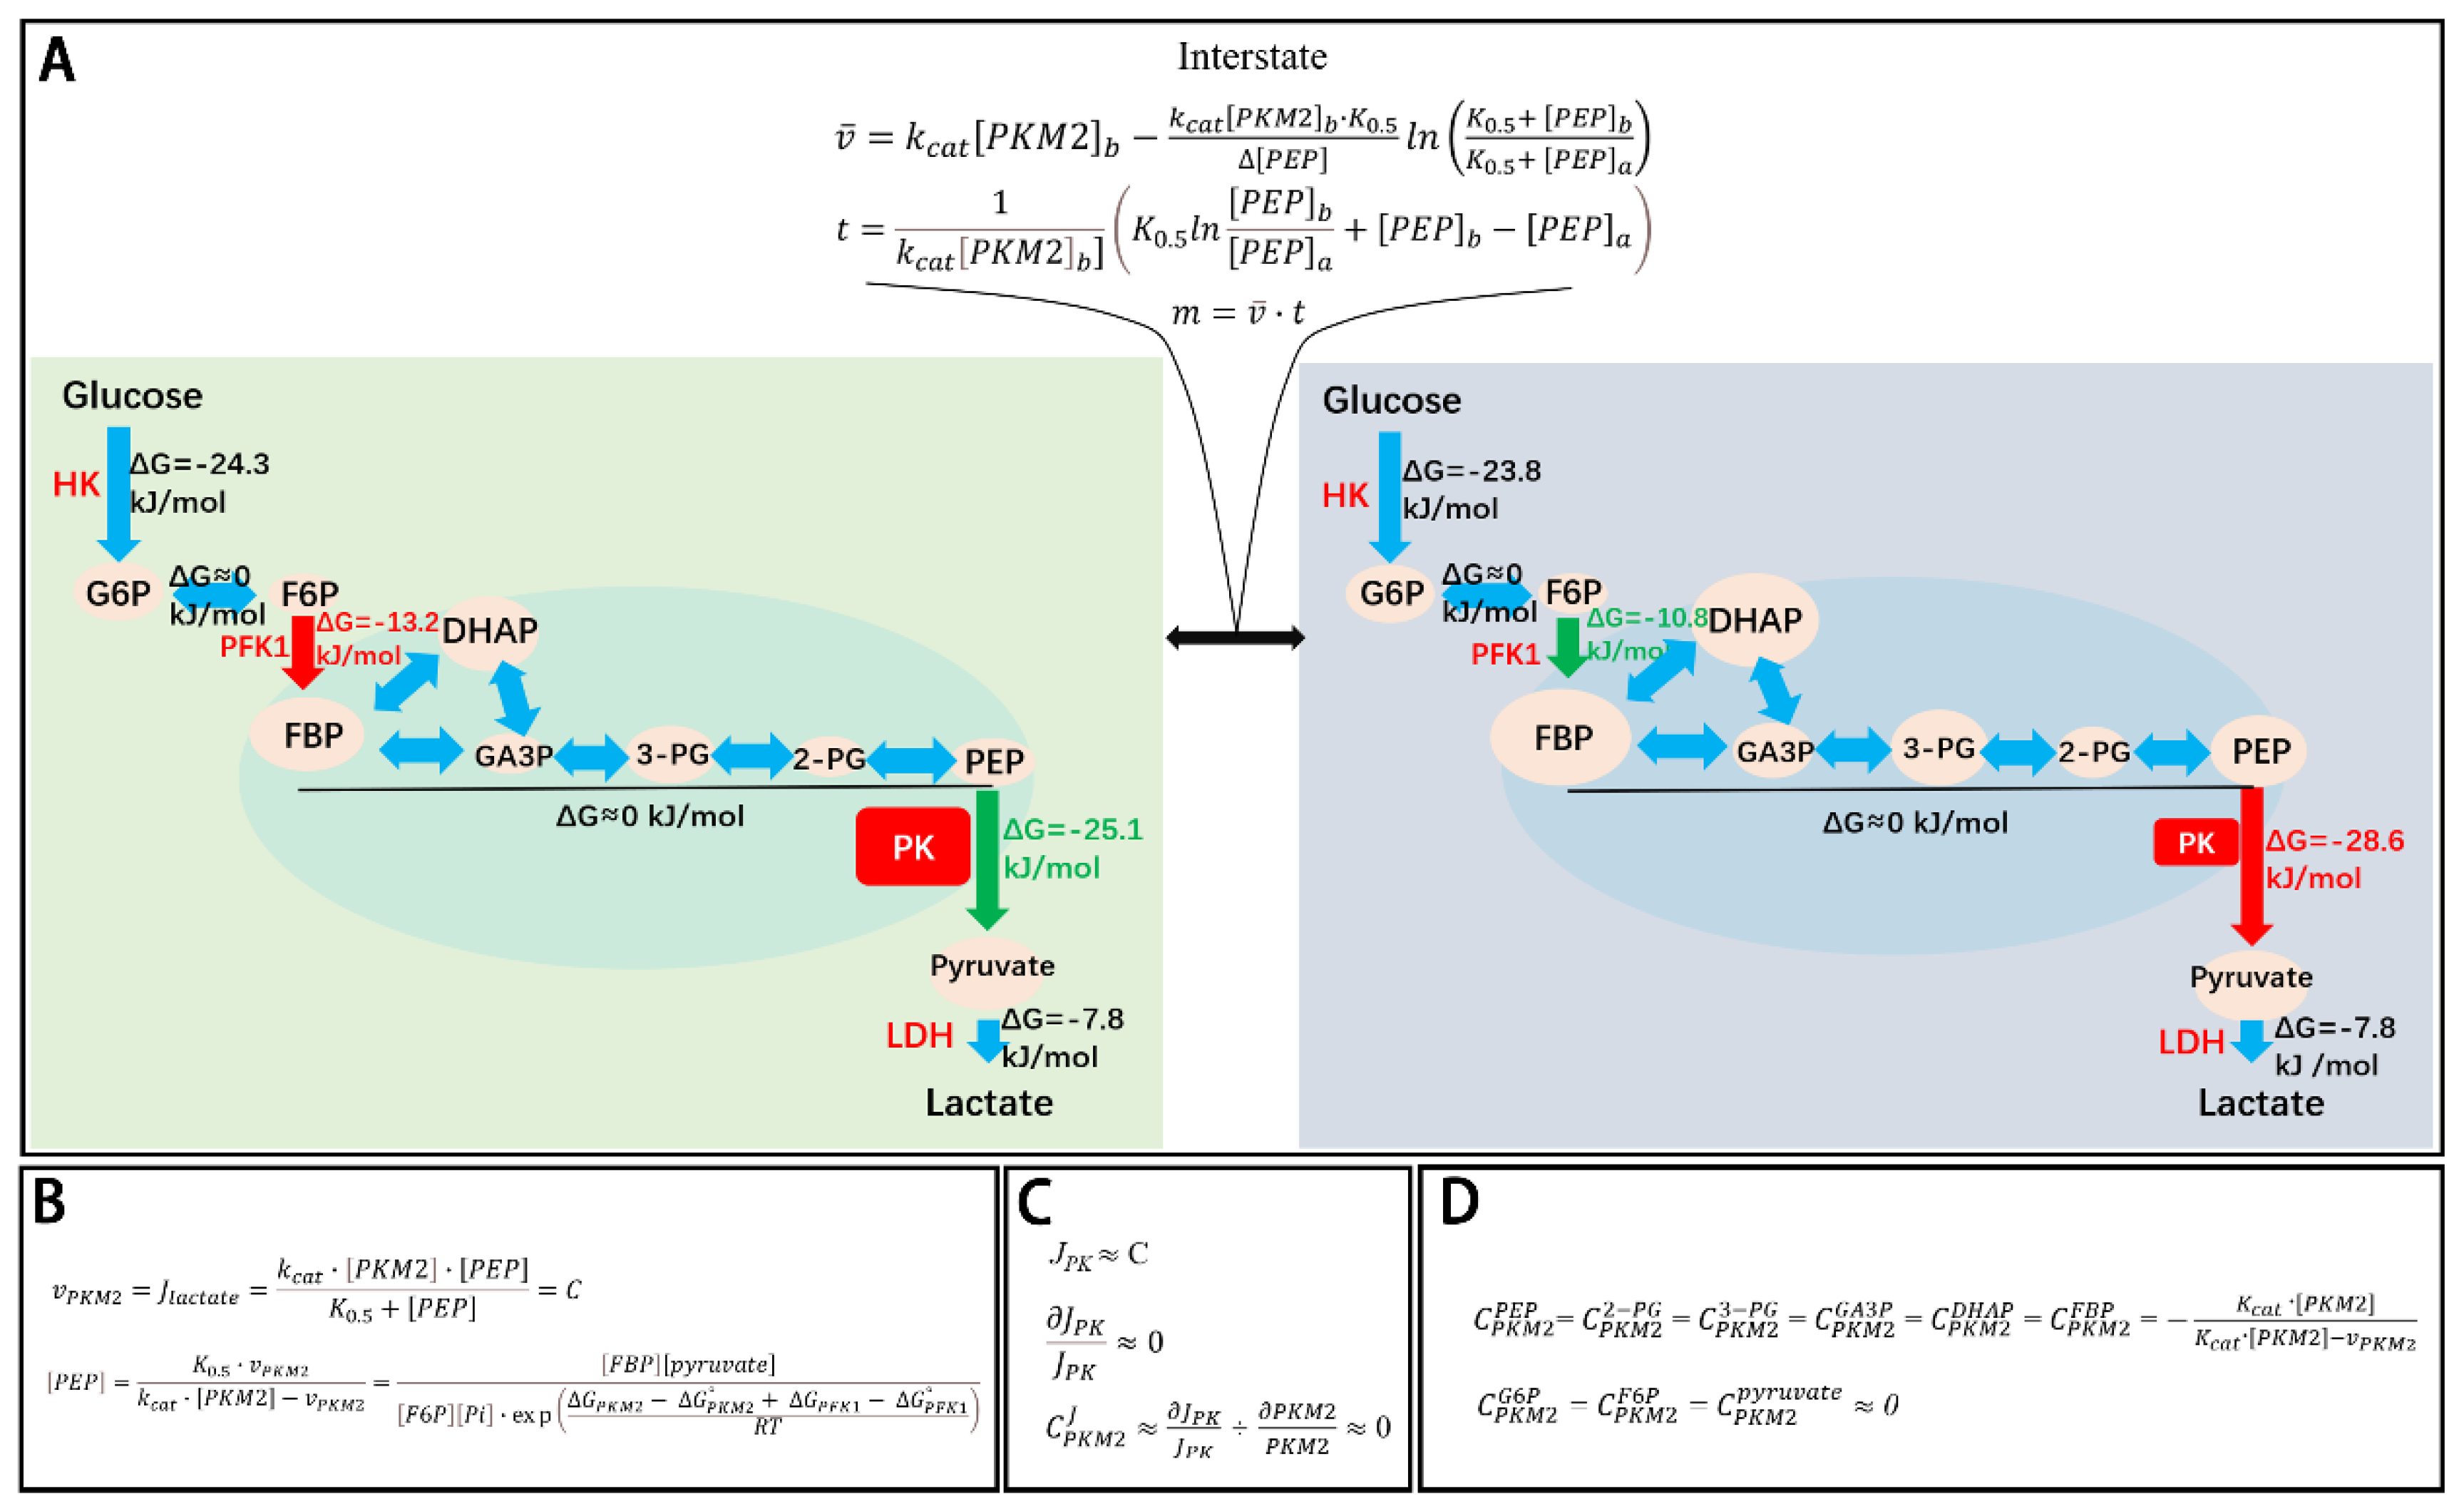
Figure 2.
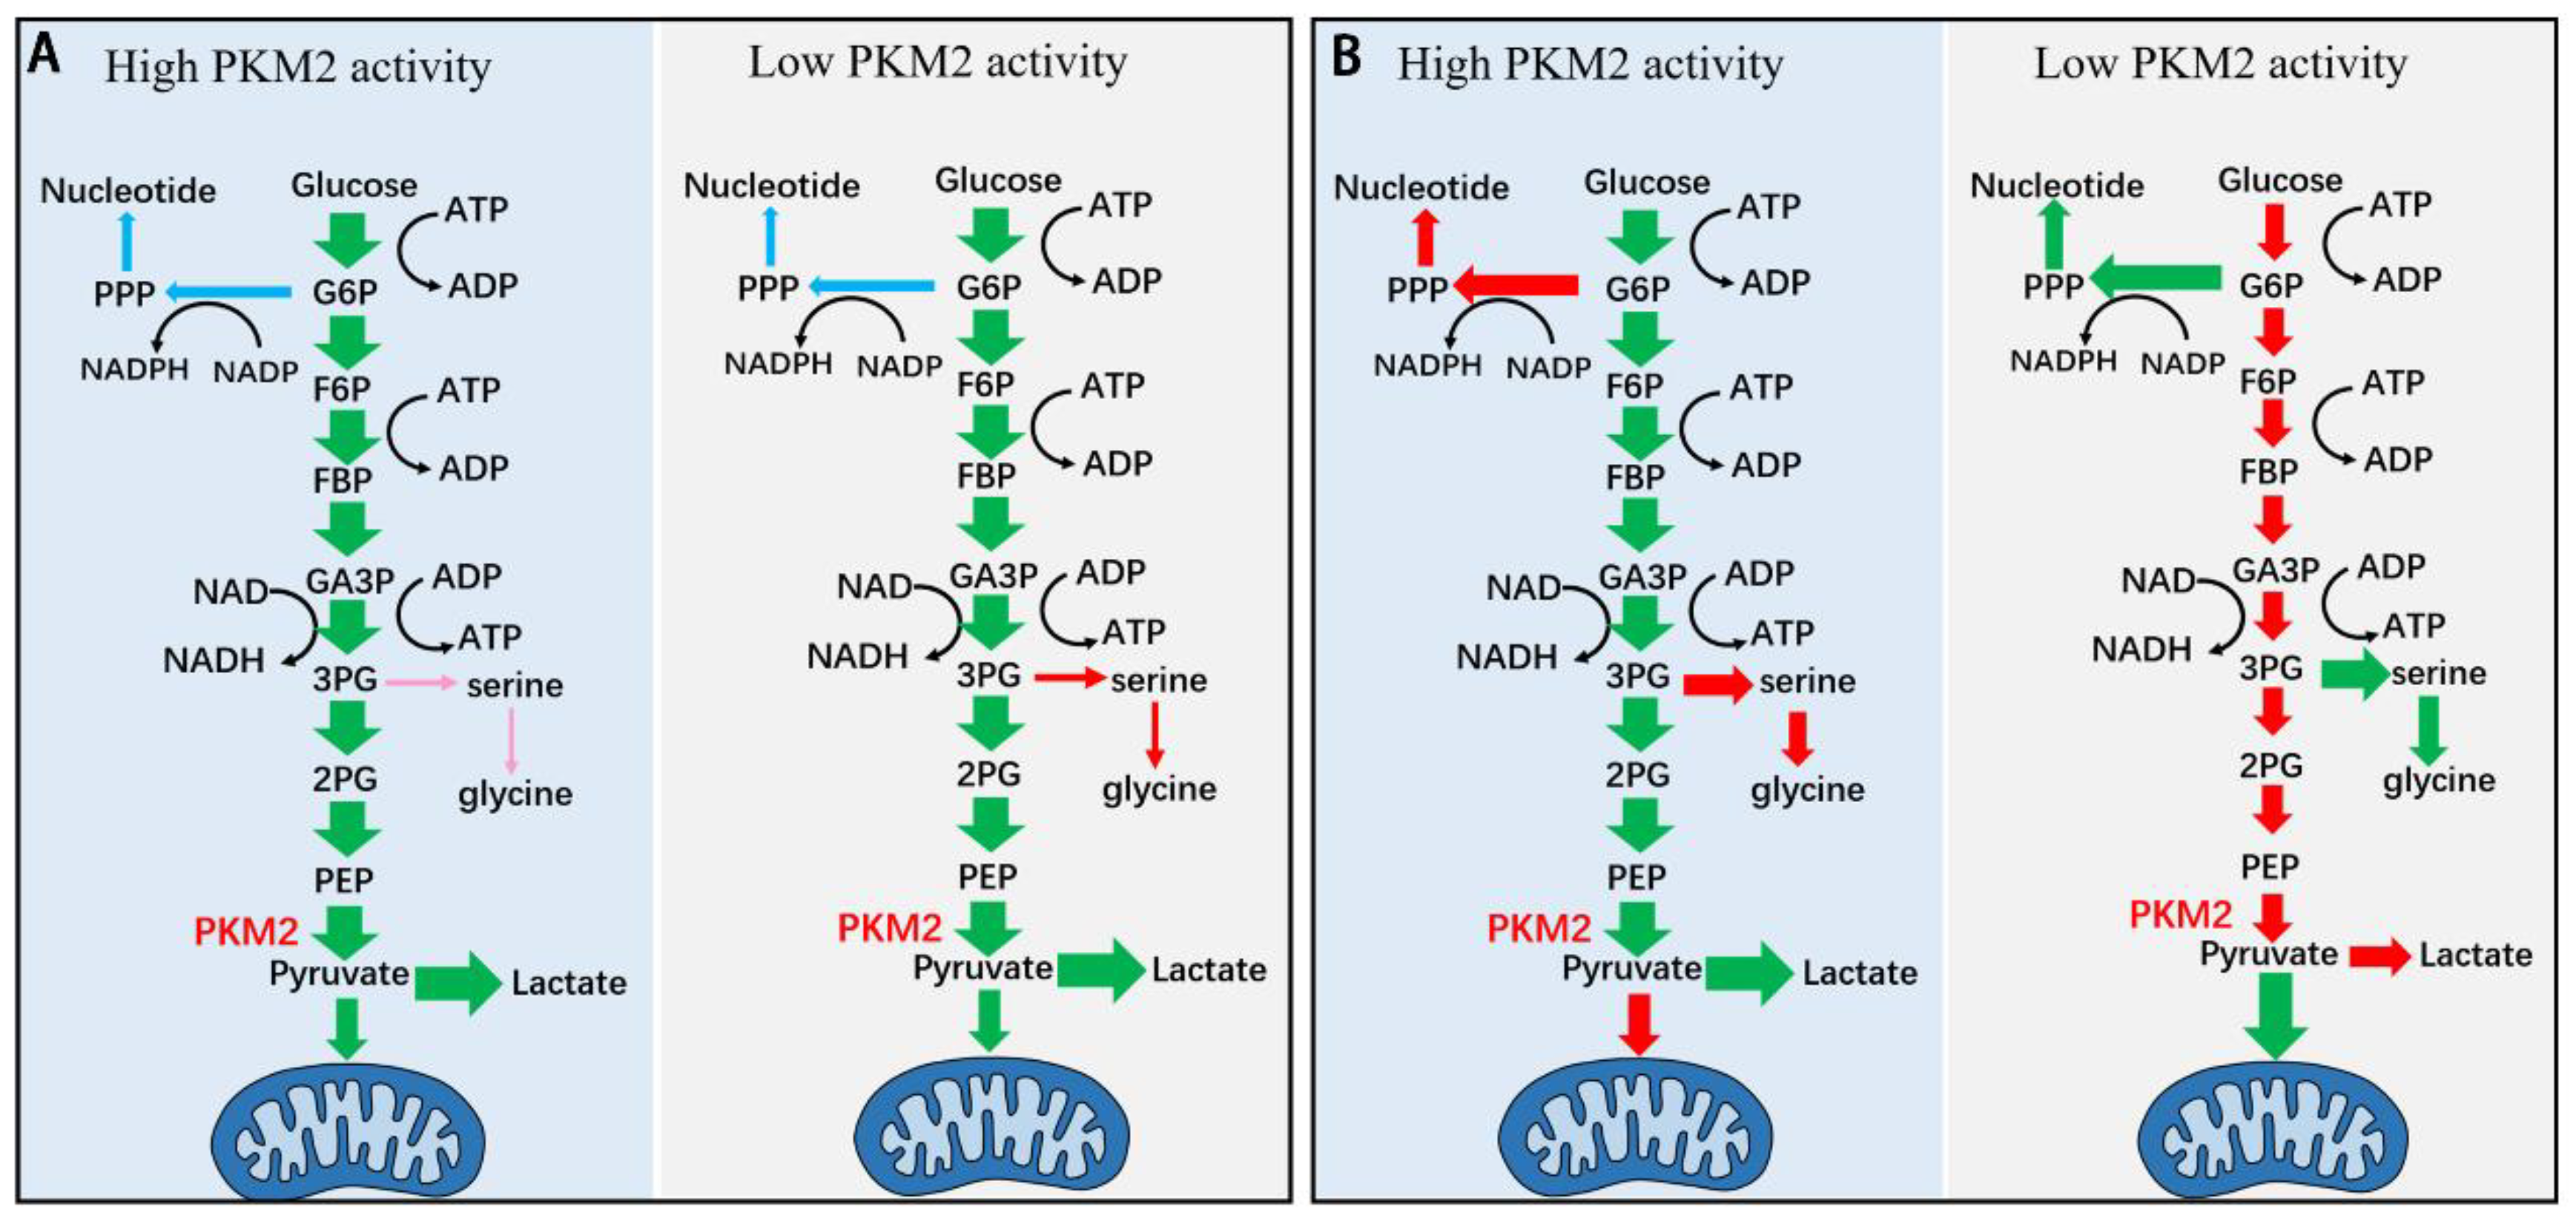
Schematic diagram showing the model of kinetic-thermodynamic coupling in the regulation of glycolysis by PKM2 (A) and the model of current understanding of regulation of glycolysis by PKM2 (B). (A) Changes in the total activity impact glycolysis through kinetic-thermodynamic coupling in the pathway (see Figure 1 and text). Increase or decrease in the PKM2t does not significantly changes PKM2a, does not significantly changes the rate to PPP, the rate to lactate, nor the rate to mitochondria metabolism. Increase in PKM2t decreases the rate to serine synthesis pathway, while decreases in PKM2t increases the rate to SSP, yet the rate to SSP is negligible as compared with the rate to lactate (see also Figure 1). (B) Changes in the total activity of PKM2 directly exert effect on glycolysis. Increase in the total activity of PKM2 increases the glycolytic rate and depletes its upstream intermediates; the depletion of G6P and 3-PG reduces their flux to PPP and SSP, respectively; and the rate of pyruvate to mitochondria metabolism decreases while the rate of pyruvate to lactate increases. Conversely, decrease in the total activity of PKM2 reduces glycolytic rate and accumulates its upstream intermediates; the accumulation of G6P and 3-PG enhances their flux to PPP and SSP, respectively; the rate of pyruvate to mitochondria metabolism increases while the rate of pyruvate to lactate decreases. The two models are different and deserve attention.
Figure 2.
Schematic diagram showing the model of kinetic-thermodynamic coupling in the regulation of glycolysis by PKM2 (A) and the model of current understanding of regulation of glycolysis by PKM2 (B). (A) Changes in the total activity impact glycolysis through kinetic-thermodynamic coupling in the pathway (see Figure 1 and text). Increase or decrease in the PKM2t does not significantly changes PKM2a, does not significantly changes the rate to PPP, the rate to lactate, nor the rate to mitochondria metabolism. Increase in PKM2t decreases the rate to serine synthesis pathway, while decreases in PKM2t increases the rate to SSP, yet the rate to SSP is negligible as compared with the rate to lactate (see also Figure 1). (B) Changes in the total activity of PKM2 directly exert effect on glycolysis. Increase in the total activity of PKM2 increases the glycolytic rate and depletes its upstream intermediates; the depletion of G6P and 3-PG reduces their flux to PPP and SSP, respectively; and the rate of pyruvate to mitochondria metabolism decreases while the rate of pyruvate to lactate increases. Conversely, decrease in the total activity of PKM2 reduces glycolytic rate and accumulates its upstream intermediates; the accumulation of G6P and 3-PG enhances their flux to PPP and SSP, respectively; the rate of pyruvate to mitochondria metabolism increases while the rate of pyruvate to lactate decreases. The two models are different and deserve attention.
Disclaimer/Publisher’s Note: The statements, opinions and data contained in all publications are solely those of the individual author(s) and contributor(s) and not of MDPI and/or the editor(s). MDPI and/or the editor(s) disclaim responsibility for any injury to people or property resulting from any ideas, methods, instructions or products referred to in the content. |
© 2025 by the authors. Licensee MDPI, Basel, Switzerland. This article is an open access article distributed under the terms and conditions of the Creative Commons Attribution (CC BY) license (http://creativecommons.org/licenses/by/4.0/).
Copyright: This open access article is published under a Creative Commons CC BY 4.0 license, which permit the free download, distribution, and reuse, provided that the author and preprint are cited in any reuse.


