
Submitted:
15 May 2025
Posted:
15 May 2025
You are already at the latest version
Abstract
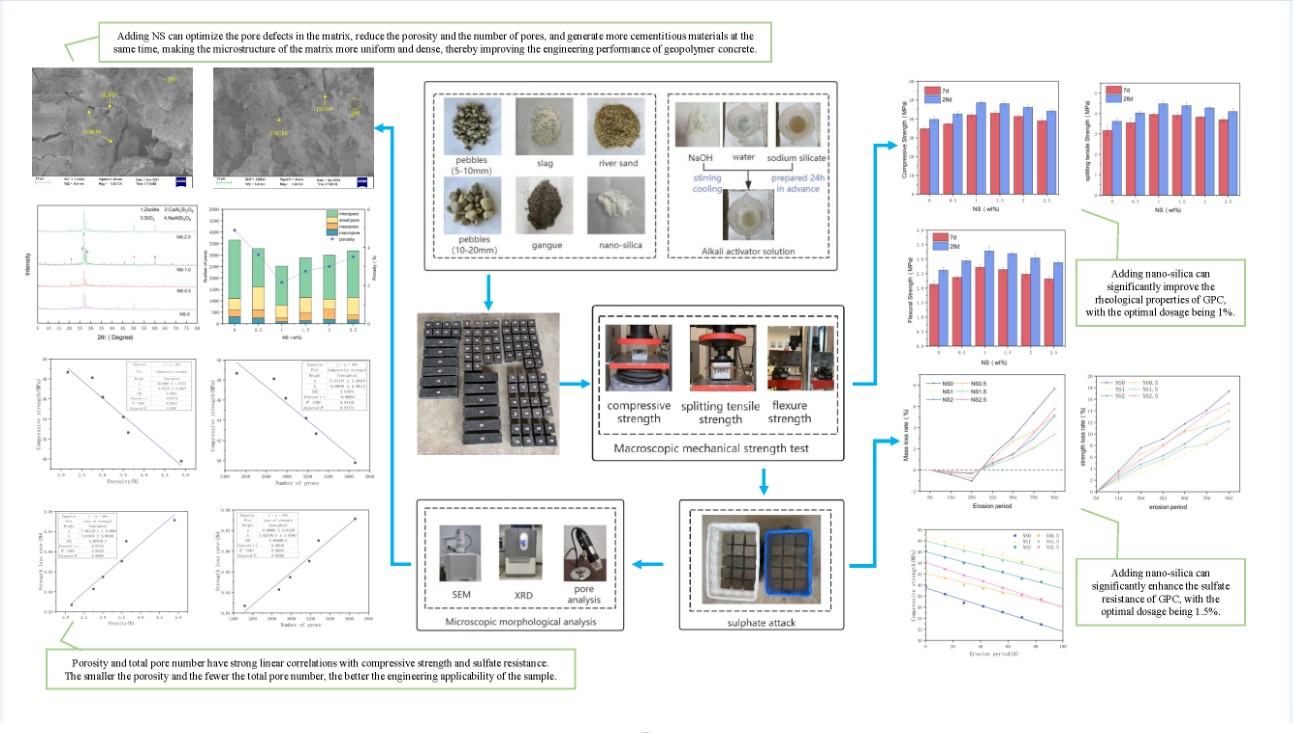
To enhance the engineering applicability of coal gangue-based geopolymer concrete (CGGC), Nano-silica (NS) was used to modify CGGC, the influence of different NS dosage (0-2.5wt%) on mechanical properties and durability of CGGC was studied. The compressive, flexural and splitting tensile strengths were tested, the mass and strength loss of samples were analyzed under different sulfate attack ages with different NS dosages. With the increase in the dosage of NS, the mechanical strength and sulfate resistance of CGGC first increase and then decrease. When the dosage is 1%, the mechanical properties are improved most significantly, and when the dosage is 1.5%, the sulfate resistance is the strongest. Combined with scanning electron microscopy, X-ray diffraction and pore image analysis tests, it was revealed that NS optimized the pore defects in the matrix, generated more cementitious materials, and made the microstructure of the matrix more uniform and denser, both porosity and total pore number had a good linear correlation with compressive strength and sulfate resistance. The smaller the porosity and the fewer the total pore number, the better the engineering applicability of the sample.
Keywords:
Geopolymer concrete
; Coal gangue
; Nano-silica
; Pore structure
1. Introduction
In recent years, with the enhancement of people's environmental awareness and the increasingly severe problem of global warming, green building materials have received widespread attention. Geopolymer concrete (GPC) can effectively reduce carbon dioxide emissions when replacing ordinary Portland cement concrete (OPC)[1,2], and at the same time solve the serious problem of industrial solid waste accumulation[3]. Moreover, GPC has excellent mechanical properties[4,5], high-temperature resistance[6], acid resistance[7], seawater erosion resistance[8] and electrical performance[9], and thus has received extensive attention.
Coal gangue is the waste produced during the coal mining and washing processes. Currently, Chinese coal mines have accumulated a large amount of coal gangue, which is increasing by 300 million tons annually[10]. The massive accumulation of coal gangue leads to the waste of land resources. Meanwhile, when it catches fire spontaneously, it will release harmful gases such as nitrogen oxides[11]. Previous studies have shown that calcined coal gangue is rich in amorphous aluminosilicate and is an ideal material for preparing geopolymers[12]. However, the calcium content in coal gangue is extremely low, which leads to insufficient strength of its geopolymer. Therefore, it is necessary to activate and compound it with other silicon-aluminum raw materials with high calcium content (such as slag) to optimize its performance[13,14]. At present, the performance research of geopolymer concrete using slag and fly ash as cementitious materials has been quite mature.[15,16,17,18]. Nevertheless, investigations into employing coal gangue as a cementitious substance are rather limited.
The unstable development of GPC strength and relatively low fracture performance[19], also hinder its application in engineering construction. The utilization of nanomaterials in the realm of civil engineering offers innovative approaches for enhancing the properties of GPC[20,21]. Nano-silica (NS), being the most prevalent nanomaterial, has garnered considerable focus owing to its remarkable pozzolanic activity and the capacity to reduce the energy requirement for nucleation[22,23]. A suitable quantity of NS can substantially boost the mechanical characteristics and durability of GPC, while also refining the microstructure of the substance[24]. Previous studies have shown that the modification of geopolymers by NS mainly occurs through filling effects, nucleation effects, and pozzolanic effects:NS fills the pores in the structure, improves the interface transition zone structure, enhances the overall density, and reduces the porosity[25,26,27,28]; NS acts as nucleation sites for gel precipitation, leading to the formation of additional geopolymer gels, promoting the hydration process of geopolymers, and initiating the latent activity of mineral admixtures.[29,30,31,32]; NS can react with the hydration compound Ca(OH)2,The process of refining Ca(OH)2 crystal grains and producing high-strength calcium silicate hydrate (C-S-H) gel is effectively achieved.[33,34,35].
Numerous research studies have demonstrated that the modification effect of NS in different matrix materials varies greatly[36,37,38]. Meanwhile, polymer materials are usually exposed to harsh environments for a long time and are prone to durability problems. One of the primary factors impacting the durability of concrete materials is sulfate exposure.[39,40,41]. Large amounts of sulfate are present in seawater, groundwater, river water and saline-alkali land in nature[42]. At present, the optimal dosage of NS in coal gangue base polymer concrete is not clear. Moreover, research on NS-modified polymers mainly focuses on their mechanical strength, while studies on the influence of their resistance to sulfate attack are relatively scarce. Thus, investigating the ideal dosage of NS in coal gangue geopolymer concrete and its impact on the sulfate resistance of geopolymer concrete is of paramount importance.
In summary, nano-silica-modified coal gangue geopolymer concrete (NS-CGGC) was synthesized employing coal gangue as the primary raw material and nano-silica as the modifying agent. Tests for compressive strength, splitting tensile strength, flexural strength, and sulfate attack resistance were carried out. A comparative analysis was conducted to assess the impact of varying NS dosages on the mechanical characteristics and sulfate resistance of CGGC. The microscopic mechanism of the comprehensive performance changes of geopolymers caused by NS was revealed through methods such as SEM, XRD and image analysis. The objective of this study is to establish a reference for the formulation design of geopolymer concrete in the future, as well as provide a foundation for the practical application of geopolymer concrete in extremely severe conditions.
2. Experimental Procedure
2.1. Materials
Raw materials: The coal gangue powder is produced by Yunshi Mineral Products Processing Plant in Lingshou County, Hebei Province. It is a first-grade calcined coal gangue powder with a grayish-black appearance, a particle size of approximately 18 μm, a density of about 2.8 g/cm³, and a loss on ignition of 7.9%. The blast furnace slag (BFS) is produced by Hebei Jiegui Mineral Products Co., Ltd. It appears as white powder with a particle size of approximately 75 μm and a density of about 2.9 g/cm³, and its loss on ignition is 0.23%. The analysis of the chemical composition of both materials is presented in Table 1.
Alkali activator: A mixture of sodium silicate and sodium hydroxide solution. Sodium hydroxide appears as flaky solid with a purity of 98%. Sodium silicate is a semi-transparent viscous liquid with an initial modulus of 3.17 and a water content of 50%.
Coarse and fine aggregates: The coarse aggregate consists of continuously graded pebbles, where large pebbles measure between 10 and 20 millimeters, while smaller pebbles range from 5 to 10 millimeters. In a 1:1 ratio, both large and small pebbles are incorporated into the geopolymer concrete. The fine aggregate is natural river sand, with a fineness modulus of 2.6 to 3.0 and an apparent density of 2635 kg/m³.
Nanomaterials: The hydrophilic nano-silica used in the experiment was produced by Zhongbei Nano Powder Technology Co., Ltd. The substance seems to be an irregularly shaped, opaque white powder. The physical characteristics are presented in Table 2. Nano calcium carbonate with a particle size of 20 nm.
Chemical reagent: Anhydrous sodium sulfate (Na2SO4), with a colorless and transparent crystalline appearance, and a purity of 99.6%.
2.2. Mix Proportion Design
Based on the team's previous experience, the quality ratio of BFS to CG is 1:1, and the binder-to-aggregate ratio, water-to-binder ratio, and sand ratio are 4, 0.41, and 0.38 respectively. Based on this foundation, an investigation into the impact of NS dosage on the performance of CGGC was conducted. The dosage of NS with a particle diameter of 20 nanometers was 0.5%, 0.1%, 1.5%, and 2%.and 2.5% of the overall weight of the cementitious materials, respectively. The mix ratio is presented in Table 3.
2.3. Test Procedure
Mix the water glass and sodium hydroxide 24 hours in advance, add water and stir thoroughly, then let it stand and cool to complete the preparation of the alkali activator. After thoroughly mixing the cementitious material, coarse and fine aggregates, and NS for 5 minutes, the alkali activator is added and the mixture is further stirred for 4 minutes. After all the materials are thoroughly mixed, they should be quickly filled into the mold and vibrated on the vibration table until they are compacted. Then, a layer of impermeable film should be covered on the surface of the sample. After 24 hours, the solidified and hardened specimens were demolded, wrapped with impermeable film, and kept in an oven at 80℃ for 24 hours. After being taken out of the oven, they were placed in a drying room at 20±2℃ for curing until a predetermined duration. Then, the well-cured concrete was tested and analyzed. The entire test process is shown in Figure 1.
2.4. Tests
2.4.1. Strength Test
In accordance with the "Test Methods for Mechanical Properties of Normal Concrete" (GB/T 50081-2019), a cubic compressive strength test (100mm×100mm×100mm) was performed utilizing a microcomputer-controlled pressure testing machine (WHY-2000), which has a measurement precision of ±1%. Cubic specimens (100mm×100mm×100mm) were subjected to splitting tensile tests using a splitting tensile fixture. The flexural strength of the sample (100mm×100mm×400mm) was determined through the application of the three-point loading technique. The test images are shown in Figure 1. The specimens were non-standard ones. According to the provisions of the standard for mechanical property test methods, the compressive, splitting tensile and flexural strengths should be respectively multiplied by 0.95, 0.85 and 0.85 as corrections.
2.4.2. Sulfate Erosion Test
In accordance with the "Standard Test Methods for Long-Term Performance and Durability of Concrete" (GB/T50082-2024), the specimens are immersed in a 5% Na2SO4 solution, as shown in Figure 2(a). After 14d, 28d, 42d, 56d, 70d and 84 days of the erosion period, the influence of sulfate erosion on the specimens was reflected by observing the surface morphology changes, testing the compressive strength changes and the mass changes. The measurement of mass changes is shown in Figure 2(b). The rate of mass depletion (Δm) and the rate of compressive strength decline (ΔF) were determined using Equations (1) and (2), respectively.
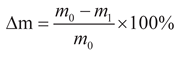
The value of m0 represents the mass of the sample prior to erosion (in g), while m1 denotes the mass of the sample following erosion (in g).
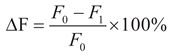
The value of F0 represents the initial strength of the material prior to erosion (in MPa), while F1 denotes the strength of the material following erosion (in MPa).
2.4.3. Micromorphology Analysis
The remaining samples in the center of the geopolymers following the splitting tensile test were chosen as the testing specimens and were subsequently divided into fragments with a width ranging from 10 to 20 millimeters. The test samples were placed in a brass stub sample holder and double-sided carbon tape. After being dried with infrared light for 5 minutes, they were coated with a small ion sputtering instrument to improve their surface conductivity. The microscopic architecture of the specimens was examined using a Prisma-E scanning electron microscope. The microscopic images were captured at a voltage range of 0.3-30 kV and a magnification level of 5-10,000x.
2.4.4. XRD Analysis
The composition of the ground samples (which were obtained by crushing the mortar and reducing it to a powder with a particle size less than 80 μm) was examined utilizing a UIima IV X-ray diffraction analyzer. XRD analysis was conducted across a range of scan angles (2θ), spanning from 5 degrees to 80 degrees.
2.4.5. Two-Dimensional Pore Analysis
The sample slices were processed. To enhance the contrast of the pores, the test surface was immersed in black ink for coloring and then dried. Micron-sized calcium carbonate particles were dusted onto the substrate to occlude the interstices. The treated test surface was photographed with a digital microscope camera. Then, Image J software was used to perform binary processing on the captured images, as shown in Figure 3, to make the pores stand out more clearly against the test surface. Finally, the number and size of the pores were statistically analyzed.
3. Results and Discussion
3.1. Mechanical Strength
3.1.1. Compressive Strength
(1) Destructive form
Figure 4 shows the failure images of CGGC and NS-CGGC specimens under a curing age of 28 days in the compressive strength test. It can be seen from the figure that CGGC has more cracks when it fails, with obvious surface spalling and poor specimen integrity. NS-CGGC has significantly fewer cracks and narrower widths when it fails, with only a small amount of debris falling off the surface. The specimen has a low degree of damage and high integrity, indicating that NS can improve the integrity of the specimen.
(2) data and analysis
Figure 5(a) illustrates the alteration in compressive strength among specimens subjected to varying NS dosages, specifically at curing ages of 7 days and 28 days. As evident from the graph, as NS dosage increases, The compressive strength of the samples initially rises before experiencing a decline, and the optimal NS concentration varies between 7 days and 28 days. Figure 5(b) illustrates the improvement rate of compressive strength for specimens with varying NS dosages in comparison to the control group at 7 days and 28 days. Observation of the graph reveals that the compressive strength improvement rate of the test samples initially rises before experiencing a decline as NS dosage continues to rise. This is in line with the variation in compressive strength. The compressive strength values for the reference group samples at 7 days and 28 days are 34.76 MPa and 39.78 MPa, respectively. Upon NS dosage reaching 1.5%, the compressive strength of the samples attains its peak value of 43.08 MPa at 7 days, which is 23.94% greater than that of CGGC. Upon NS dosage reaching 1%, the compressive strength of the test samples attains its peak value of 48.67 MPa at 28 days, which is 22.35% greater than that of CGGC.
3.1.2. Split Tensile Strength
(1) Destructive form
Figure 6 illustrates the failure images of splitting tensile strength tests for CGGC and NSCGGC specimens, both at a curing age of 28 days. As observed from the illustration, following the emergence of fine fissures in CGGC, it rapidly extended into two broad vertical fissures, a characteristic feature of brittle failure. Upon the inclusion of NS, the microscopic cracks within the samples exhibited no rapid expansion following their emergence. And the destruction displayed a particular level of flexibility. A single longitudinal primary fissure emerged on the specimen's surface, preserving its overall structural soundness.
(2) data and analysis
Figure 7(a) presents the splitting tensile strength of test samples with varying NS dosages at curing ages of 7 days and 28 days. As evident from the diagram, as NS dosage rises, the specimens exhibit an initial increase in their splitting tensile strength, followed by a subsequent decrease. When the dosage of NS is less than 1%, the splitting tensile strength of the specimens gradually increases with the increase of NS dosage. When the dosage of NS exceeds 1%, the splitting tensile strength of the specimens gradually decreases with the increase of NS dosage. The tensile strengths of the reference group specimens at 7 days and 28 days are 3.17 MPa and 3.62 MPa, respectively. When the NS dosage was 1% and the curing periods were 7 days and 28 days respectively, the peak splitting tensile strengths of the tested samples were 3.96 MPa and 4.48 MPa respectively. Figure 7(b) illustrates the improvement rate of splitting tensile strength in comparison to the reference group at 7 days and 28 days for various NS dosages. Observation of the graph reveals that the increment rate of splitting tensile strength in the samples initially rises before experiencing a decline as NS dosage continues to increase. This is in line with the law of variation in splitting tensile strength. When the NS dosage was 1%, the increments rate of splitting tensile strength after 7 days and 28 days of curing were 24.92% and 23.76% respectively.
3.1.3. Flexural Strength
(1) Destructive form
Figure 8 illustrates the failure pattern observed in the flexural strength test conducted on the specimen. In the case of CGGC, a single diagonal crack band emerged as the applied load increased, and the crack width swiftly widened until it traversed the entire cross-sectional area. Upon the incorporation of NS, the deterioration of the sample demonstrated a specific degree of malleability. In addition to the primary crack, some fine and relatively short microcracks were present.
(2) data and analysis
Figure 9(a) illustrates the alteration in flexural strength of specimens subjected to varying NS dosages at curing periods of 7 days and 28 days. Observing the graph, it is evident that as NS dosage rises, the flexural strength of the samples initially rises before experiencing a subsequent decline. That is, when the NS dosage is less than 1%, the flexural strength of the samples gradually increases with the increase of NS dosage. As the dosage of NS exceeds 1%, the flexural strength of the specimens gradually decreases with the increase of NS dosage. The flexural strengths of the reference group specimens at 7 days and 28 days are 2.13 MPa and 2.62 MPa, respectively. When the NS dosage is 1% and the curing age is 7 days and 28 days, the flexural strengths of the specimens reach the maximum values of 2.72 MPa and 3.28 MPa, respectively. Figure 9(b) illustrates the flexural strength increasement rate of test samples with varying NS dosages in comparison to the reference group at 7 days and 28 days. As observed from the diagram, the flexural strength increasement rate of the samples exhibit an initial rise followed by a decline as the NS dosage rises, which is consistent with the flexural strength variation pattern. When the NS dosage is 1% and the curing age is 7 days and 28 days, the flexural strength improvement rates are 27.70% and 25.19%, respectively.
3.2 Sulfate erosion
3.2.1 Apparent deformation
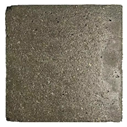
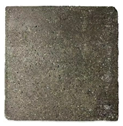
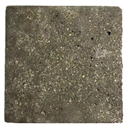
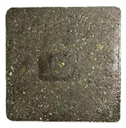
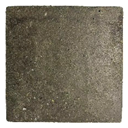
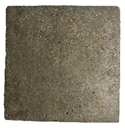
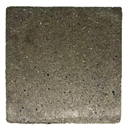
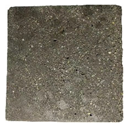
The apparent deformation of specimens with different immersion ages is shown in Table 4. It can be seen from the figure that both groups of specimens have surface phenomena such as epidermal peeling, flaking and damage, and the degree of damage of the specimens increases with the increase of immersion age. When the immersion age is 84 days, the surface of the NS0 specimen has already presented a honeycomb-like appearance. Compared with the NS0 specimen, after the addition of NS, the flaking phenomenon on the surface of the specimen is weakened, and only slight peeling occurs when the immersion age is 84 days. At the same immersion age, the specimens with added NS have better integrity, and the degree of surface damage and flaking is smaller. This indicates that the addition of NS can effectively inhibit the damage caused by sulfate attack.
3.2.2. The Law of Quality Loss
The mass change results of specimens with different NS dosages immersed in 5% sodium sulfate solution are shown in Figure 10. It can be seen from the figure that when the NS dosage is the same, with the increase of immersion age, the mass of the specimens first slightly increases and then gradually decreases. For CGGC immersed in 5% sodium sulfate solution for 14 and 28 days, with the increase of NS dosage, the mass increase first decreases and then increases. During a period of 42 days, 56 days, 70 days, and 84 days, as the NS dosage is increased, the rate of mass loss initially decreases before subsequently rising.
3.2.3. The Law of Strength Loss
The relationship between the compressive strength of specimens with different immersion ages and the NS dosage is illustrated in Figure 11(a). It can be seen from the figure that under the same NS dosage, the compressive strength of the specimens gradually decreases with the increase of the immersion age, and the law conforms to a linear relationship, which can be expressed by Equation (3). The fitting parameters are shown in Table 5. The correlation coefficient R2 is all greater than 0.95, indicating that the formula has a good correlation. It can be seen from the table that the value range of the fitting parameter a is 39.47 to 48.82; the value range of the fitting parameter b is -0.08 to -0.06, with a small difference, so it can be approximately considered that the straight lines are parallel. The relationship between the compressive strength loss rate of samples with different immersion ages and the NS dosage is illustrated in Figure 11(b). It can be seen from the figure that under the same immersion age, the specimens' compressive strength loss rate initially rises and subsequently declines as the NS dosage is increased. When the dosage is 1.5%, the strength loss rate is the smallest.
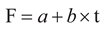
In the formula, F denotes the compressive strength of the sample (in MPa); t denotes the soaking age (in d); the fitting parameters a and b are the intercept and slope, respectively.
3.3. Microscopic Analysis
3.3.1. SEM
The SEM scanning results are shown in Figure 12 and Figure 13. Figures 12(a) and (b) present the 1.00KX SEM magnification effects of the NS0 group and the NS1 group. It can be observed that the CGGC present a rough surface., with numerous pores and cracks. NS-1 has a smooth and dense surface, with narrower crack widths, shorter crack lengths, and more gel. The gel marked by circles in the illustration significantly prevents the formation of cracks. Macroscopically, the group with added NS has higher mechanical strength.
Figures 13(a) and (b) show the 10.00KX SEM magnification effects of the NS-1.0 group and the NS-2.0 group. The arrows in the figures indicate the growth direction of the gel. By comparing the two figures, it can be observed that the surface of NS-1.0 is more uniform, and the gel products are orderly and regularly overlapped; while the gel products of NS-2.0 are irregularly intertwined and overlapped, with numerous defects in the structure. This occurs because adding too much NS results in agglomeration, which subsequently leads to the buildup of gel. Macroscopically, when the NS content is 2%, the splitting tensile strength of the concrete decreases to some extent.
3.3.2. XRD
To elucidate the impact of NS content on the hydration outcomes of CGGC, XRD analysis was performed on the 28-day specimens from each NS content category, and the findings are presented in Figure 14. The XRD patterns mainly consist of quartz phase (SiO2), zeolite phase, albite phase (NaAlSi3O8), anorthite phase (CaAl2Si2O8), and amorphous gel phase.
By comparing the XRD curves of the control group and the NS groups, it is observed that the peak intensities of the quartz and albite phases in the NS groups increase significantly within the range of 25-30°, reaching the maximum value when the NS dosage is 1%. Compared with the NS0 group, the intensity increases are 298 and 286, respectively. This indicates that the inclusion of NS results in a heightened peak intensity of the quartz crystal phase, NS functions as a filler to address defects within the matrix. Simultaneously, the introduction of NS facilitates the geopolymerization reaction, augmenting the reaction products, particularly the N-A-S-H gel content. Consequently, this renders the geopolymer structure more dense and stable, while also bolstering the strength and sulfate resistance of NSCGGC.
By comparing the NS-1 group and the NS-2 group, it is found that the peak intensity of the albite phase in the NS-2 group is significantly reduced. This is due to the agglomeration of NS, which is unfavorable for the geopolymerization reaction, and this is also consistent with the observed changes in mechanical properties and sulfate resistance.
3.3.3. Pore Analysis
Six groups of specimens underwent a two-dimensional pore analysis. In each group, three samples were chosen, and for each sample, three cross-sections underwent testing. From each cross-section, nine regions were carefully chosen to ensure uniformity. Initially, the targeted areas were imaged utilizing an electron microscope camera, after which 486 images underwent analysis through Image J software. The binary images of the samples are depicted in Figure 15. The software output the total number of pores, porosity, and pore size distribution and other geometric parameters, which were used for quantitative analysis of the specimens and to elucidate the mechanism through which NS influences the macroscopic behavior of geopolymer concrete, specifically from the viewpoint of pore characteristics.
According to Table 6, the pores were classified and the results of pore analysis are shown in Figure 16. The findings demonstrate that adding NS can substantially decrease the porosity and the number of pores within the samples. Both the porosity and the number of pores of the samples first decrease and then increase with the increase of NS dosage, and the optimal dosage is 1%. In the reference group, GCGC exhibits a porosity of 4.899% and a total pore count of 3660. When the NS dosage reaches 1%, the porosity of GCGC decreases to 2.162%, and the total pore number reduces to 2515. This represents a reduction of 55.87% in porosity and 31.28% in total pore number compared to the reference group. This is because NS exhibits a filling effect and high reactivity during geopolymerization, allowing it to fill pores and serve as nucleation sites, thereby increasing the compactness of the structure.
3.3.4. Correlation Between Pore Characteristics and Mechanical Strength and Durability
(1) Correlation between pore characteristics and compressive strength
To accurately describe the influence of pore structure on the strength of CGGC, it is necessary to study the relationship between pore structure parameters and CGGC. As shown in Figure 17, the square of the linear correlation coefficient between the 28-day compressive strength of CGGC and the porosity is 0.9303; the square of the linear correlation coefficient between the 28-day compressive strength of concrete and the total number of pores is 0.91774. This indicates that both the porosity and the total number of pores can well reflect the magnitude of the concrete strength. Based on the magnitude of the linear correlation, it can be inferred that the influence of different pore structure parameters on the compressive strength is in the order of total porosity > total number of pores.
(2) Correlation between the pore characteristics and the strength loss rate under sulfate attack
As observed in Figure 18, a substantial linear relationship exists between the pore structure parameters of CGGC and the rate of compressive strength loss in the specimens. When the immersion ages are 28 days, 56 days and 84 days respectively, the square of the linear correlation coefficient between the compressive strength loss rate and the porosity is 0.92907, 0.86836 and 0.80544 respectively, and the square of the linear correlation coefficient between the compressive strength loss rate and the total pore number is 0.95303, 0.9153 and 0.71424 respectively. This indicates that both the porosity and the total pore number can well reflect the sulfate resistance of concrete, among which the total pore number has the greatest influence on the sulfate resistance of CGGC, followed by the porosity. The linear correlation coefficients between the porosity and total pore number and the compressive strength loss rate of the samples gradually decrease with the increase of the immersion age. This is mainly because the difference between the pore characteristics and the initial pore characteristics increases continuously with the increase of the sulfate immersion age.
4. Conclusions
Based on the preparation of CGGC by CG and BFS, the effects of different NS dosages (0-2.5wt%) on the mechanical properties and sulfate resistance of CGGC were mainly studied. Subsequently, the specimens were examined for microstructure, composition, and pore architecture. The findings of the study can be summarized as follows:
(1) As the NS dosage increases, the mechanical strength of CGGC initially rises and subsequently declines. The mechanical properties of CGGC are enhanced most markedly when the NS dosage reaches 1%. At 28 days, the compressive strength of coal gangue-slag composite geopolymer concrete is the highest (48.67 MPa), the splitting tensile strength is the highest (4.48 MPa), and the flexural strength is the highest (3.28 MPa).
(2) As the NS dosage increases, the sulfate resistance of CGGC initially improves and then declines. The sulfate resistance of CGGC reaches its peak when the NS dosage is 1.5%. After 84 days of erosion, the strength loss rate of NS-CGGC is the smallest (10.93%), which is 37.08% lower than that of CGGC.
(3) The results of SEM, XRD and two-dimensional pore analysis show that the incorporation of NS optimizes the pore defects in the base, reduces the porosity and pore number; at the same time, more cementitious materials are generated, making the microstructure of the base more uniform and dense, and enhancing the engineering performance of the geopolymer concrete.
(4) The examination of the connection between pore structure features and macroscopic properties reveals a strong linear relationship between porosity, total pore number, and the compressive strength as well as sulfate resistance of the specimens. Samples with lower porosity and fewer total pores tend to exhibit greater compressive strength and better sulfate resistance.
Geopolymer concrete has a good resource-economic-environmental synergy effect. After clarifying the impact of varying NS dosages on the mechanical and sulfate resistance properties of BFSCGGC in this study, it provides a basis for the engineering application of CGGC in high sulfate erosion areas. The subsequent research will focus on the synergistic modification of nanomaterials and fiber materials, as well as investigating the impact of curing systems on the functionality of CGGC, to promote the systematization of material research.
Author Contributions
All authors have accepted responsibility for the entire content of this manuscript and approved its submission.
Funding
This research has no unstated external funding support.
Institutional Review Board Statement
Not applicable.
Informed Consent Statement
Not applicable.
Data Availability Statement
Additional data will be available upon request.
Acknowledgments
The authors would like to thank the State Key Laboratory of Geohazard Prevention and Geoenvironment Protection (Chengdu University of Technology) for providing the working environment and scientific research conditions for their scientific research team. This study was supported by Higher Education Personnel Training Quality and Teaching Reform Project of Sichuan Province (JG2021-730), Key Research and Development Program Project of Xinjiang Autonomous Region (2023B03011-3), Key Research and Development Program Project of the Tibet Autonomous Region (XZ202401ZY0091), Research project of Guangzhou Education Bureau (2024312467), Specialized Project of the seventh Construction Engineering Co., Ltd. of Chengdu Construction Engineering Group (JGSP2024-001), College Students’ Innovation and Entrepreneurship Training Program (202310616003, S202410616072).
Conflicts of Interest
The authors declare no conflict of interest.
References
- Feng, Z.; Zhang, P.; Guo, J.; Zheng, Y.; Hu, S. Single and Synergistic Effects of Nano-SiO2 and Hybrid Fiber on Rheological Property and Compressive Strength of Geopolymer Concrete. Construction and Building Materials 2025, 472, 140945. [CrossRef]
- AL-Tam, S.M.; Riad, A.; Mohammed, N.; Al-Otaibi, A.; Youssf, O. Advancement of Eco-Friendly Slag-Based High-Strength Geopolymer Concrete. Journal of Materials Research and Technology 2025, 34, 1636–1653. [CrossRef]
- Kansal, C.M.; Goyal, R. Analysing Mechanical Properties of Concrete with Nano Silica, Silica Fume and Steel Slag. Materials Today: Proceedings 2021, 45, 4520–4525. [CrossRef]
- Lao, J.-C.; Huang, B.-T.; Fang, Y.; Xu, L.-Y.; Dai, J.-G.; Shah, S.P. Strain-Hardening Alkali-Activated Fly Ash/Slag Composites with Ultra-High Compressive Strength and Ultra-High Tensile Ductility. Cement and Concrete Research 2023, 165, 107075. [CrossRef]
- Nikoloutsopoulos, N.; Sotiropoulou, A.; Kakali, G.; Tsivilis, S. Physical and Mechanical Properties of Fly Ash Based Geopolymer Concrete Compared to Conventional Concrete. Buildings 2021, 11, 178. [CrossRef]
- Cai, R.; Ye, H. Clinkerless Ultra-High Strength Concrete Based on Alkali-Activated Slag at High Temperatures. Cement and Concrete Research 2021, 145, 106465. [CrossRef]
- Deb, P.S.; Sarker, P.K.; Barbhuiya, S. Sorptivity and Acid Resistance of Ambient-Cured Geopolymer Mortars Containing Nano-Silica. Cement and Concrete Composites 2016, 72, 235–245. [CrossRef]
- Li, H.; Zhang, Z.; Deng, Y.; Xu, F.; Hu, J.; Zhu, D.; Yu, Q.; Shi, C. Geopolymer Composites for Marine Application: Structural Properties and Durability. Cement and Concrete Composites 2024, 152, 105647. [CrossRef]
- Saafi, M.; Andrew, K.; Tang, P.L.; McGhon, D.; Taylor, S.; Rahman, M.; Yang, S.; Zhou, X. Multifunctional Properties of Carbon Nanotube/Fly Ash Geopolymeric Nanocomposites. Construction and Building Materials 2013, 49, 46–55. [CrossRef]
- Guo, G.; Li, H.; Zha, J. An Approach to Protect Cultivated Land from Subsidence and Mitigate Contamination from Colliery Gangue Heaps. Process Safety and Environmental Protection 2019, 124, 336–344. [CrossRef]
- Lazorenko, G.; Kasprzhitskii, A.; Yatsenko, E.A.; Wensheng, L.; Chaudhary, S. Towards Coal Mining Waste Valorization: Gangue as Resource for the Production of Geopolymer and Related Alkali-Activated Materials. Green Technologies and Sustainability 2025, 3, 100205. [CrossRef]
- Sui, S.; He, G.; Jiang, C.; Wang, H.; Kong, X.; Li, S.; Wang, F.; Liu, Z.; Zhao, S.; Jiang, J. Investigation on the Activation of Various Coal Gangues and the Reaction Mechanism with Portlandite. Construction and Building Materials 2025, 463, 140120. [CrossRef]
- Geng, J.; Zhou, M.; Li, Y.; Chen, Y.; Han, Y.; Wan, S.; Zhou, X.; Hou, H. Comparison of Red Mud and Coal Gangue Blended Geopolymers Synthesized through Thermal Activation and Mechanical Grinding Preactivation. Construction and Building Materials 2017, 153, 185–192. [CrossRef]
- Huang, G.; Ji, Y.; Li, J.; Hou, Z.; Dong, Z. Improving Strength of Calcinated Coal Gangue Geopolymer Mortars via Increasing Calcium Content. Construction and Building Materials 2018, 166, 760–768. [CrossRef]
- Aldawsari, S. Durability of Fly Ash/Slag Geopolymers: Role of OPC and Silica under Sulfate Attack. Construction and Building Materials 2025.
- Duan, K. Flowability and In-Situ Phase Evolution of Na2CO3-Carbide Slag-Activated Blast Furnace Slag and Fly Ash. Construction and Building Materials 2025.
- Yang, D. Effects of Red Mud, Desert Sand, and Ground Granulated Blast Furnace Slag on the Mechanical Properties and Microstructure of Fly Ash-Based Geopolymer. Construction and Building Materials 2025.
- Zhang, Z.; Su, T.; Zhang, L.; Zheng, R.; Ma, K.; Zhang, L.; Amaechi, C.V.; Wang, C. The Influence of Fly Ash and Slag on the Mechanical Properties of Geopolymer Concrete. Buildings 2024, 14, 2720. [CrossRef]
- Adebayo, I.W.; Long, G.; Tang, Z.; Ghone, M.O.; Zaland, S.; Garba, M.J.; Yang, K.; Akhunzada, K.; Oluwasina, U.A. Effect of Crumb Rubber and Polyethylene Fiber on the Strength and Toughness of Fly Ash/Slag-Based Geopolymer Concrete. Construction and Building Materials 2024, 455, 139133. [CrossRef]
- Siang Ng, D.; Paul, S.C.; Anggraini, V.; Kong, S.Y.; Qureshi, T.S.; Rodriguez, C.R.; Liu, Q.; Šavija, B. Influence of SiO2, TiO2 and Fe2O3 Nanoparticles on the Properties of Fly Ash Blended Cement Mortars. Construction and Building Materials 2020, 258, 119627. [CrossRef]
- Qin, L.; Xu, Z.; Liu, Q.; Bai, Z.; Wang, C.; Luo, Q.; Yuan, Y. Experimental Study on Mechanical Properties of Coal Gangue Base Geopolymer Recycled Aggregate Concrete Reinforced by Steel Fiber and Nano-Al2 O3. REVIEWS ON ADVANCED MATERIALS SCIENCE 2023, 62, 20230343. [CrossRef]
- Oh, T.; Chun, B.; Lee, S.K.; Kim, G.W.; Banthia, N.; Yoo, D.-Y. Effect of High-Volume Substituted Nanosilica on the Hydration and Mechanical Properties of Ultra-High-Performance Concrete (UHPC). Cement and Concrete Research 2024, 175, 107379. [CrossRef]
- Guo, J.; Xia, X.; Zhang, P.; Wang, K. Reinforcement Mechanism of Nano-SiO2 and Polypropylene Fibers on Concrete Abrasion Resistance Subject to Dynamic Sandy Water. Journal of Materials Research and Technology 2023, 27, 1630–1650. [CrossRef]
- Ababneh, A.; Al-shouha, A.; Al-Akhras, N.; Matalkah, F. Nano-Silica for Enhancing Corrosion Resistance of Kaolin-Based Geopolymer Concrete. Case Studies in Construction Materials 2025, 22, e04210. [CrossRef]
- Zhan, P.; Xu, J.; Wang, J.; Zuo, J.; He, Z. A Review of Recycled Aggregate Concrete Modified by Nanosilica and Graphene Oxide: Materials, Performances and Mechanism. Journal of Cleaner Production 2022, 375, 134116. [CrossRef]
- Zhang, P.; Sun, Y.; Wu, J.; Hong, J.; Gao, Z. Mechanical Properties and Microstructure of Nano-Modified Geopolymer Concrete Containing Hybrid Fibers after Exposure to Elevated Temperature. Construction and Building Materials 2023, 409, 134044. [CrossRef]
- Xu, Z.; Yu, H.; Sun, X.; Zhao, M.; Hui, D. Research on Mechanical Properties and Microscopic Mechanism of Multi-Based Geopolymer Concrete under Combined Action of Pre-Curing and Nano-Silica. Journal of Building Engineering 2024, 97, 110930. [CrossRef]
- Deng, F.; Cao, C.; Chi, Y.; Xu, L. Effect of Cellulose Nanofiber Addition on the Microstructure Characterization and Nano-Mechanical Behavior of Interfacial Transition Zones in Recycled Concrete. Journal of Materials Research and Technology 2024, 33, 7572–7585. [CrossRef]
- Arab, M.A.E.-S.; Mohamed, A.S.; Taha, M.K.; Nasr, A. Microstructure, Durability and Mechanical Properties of High Strength Geopolymer Concrete Containing Calcinated Nano-Silica Fume/Nano-Alumina Blend. Construction and Building Materials 2025, 472, 140903. [CrossRef]
- Zhang, P.; Wang, W.; Guo, J.; Zheng, Y. Abrasion Resistance and Damage Mechanism of Hybrid Fiber-Reinforced Geopolymer Concrete Containing Nano-SiO2. Journal of Cleaner Production 2025, 494, 144971. [CrossRef]
- Xu, Z.; Liu, Q.; Long, H.; Deng, H.; Chen, Z.; Hui, D. Influence of Nano-SiO2 and Steel Fiber on Mechanical and Microstructural Properties of Red Mud-Based Geopolymer Concrete. Construction and Building Materials 2023, 364, 129990. [CrossRef]
- Maglad, A.M.; Zaid, O.; Arbili, M.M.; Ascensão, G.; Șerbănoiu, A.A.; Grădinaru, C.M.; García, R.M.; Qaidi, S.M.A.; Althoey, F.; De Prado-Gil, J. A Study on the Properties of Geopolymer Concrete Modified with Nano Graphene Oxide. Buildings 2022, 12, 1066. [CrossRef]
- Lin, Y.; Alengaram, U.J.; Ibrahim, Z. Effect of Treated and Untreated Rice Husk Ash, Palm Oil Fuel Ash, and Sugarcane Bagasse Ash on the Mechanical, Durability, and Microstructure Characteristics of Blended Concrete – A Comprehensive Review. Journal of Building Engineering 2023, 78, 107500. [CrossRef]
- Lu, B.; Zhang, Z.; Zhu, H.; Liu, K.; Zhang, Y.; Chen, W. Optimization Design of Recycled Powder Mortar Mix Ratio Based on Orthogonal Test. Construction and Building Materials 2025, 474, 141145. [CrossRef]
- Wu, Z.; Khayat, K.H.; Shi, C. Effect of Nano-SiO2 Particles and Curing Time on Development of Fiber-Matrix Bond Properties and Microstructure of Ultra-High Strength Concrete. Cement and Concrete Research 2017, 95, 247–256. [CrossRef]
- Chen, P. Effect of Nano-Silica on Mechanical Properties and Shrinkage of Alkali-Activated Slag Cementitious Material. 2024.
- Dong, B. Effect of Nano-Silica on Mechanical Properties and Microstructure of Engineered Geopolymer Composites. Cement and Concrete Composites 2025.
- Raveendran, N. Synergistic Effect of Nano Silica and Metakaolin on Mechanical and Microstructural Properties of Concrete: An Approach of Response Surface Methodology. Case Studies in Construction Materials 2024.
- Xu, Z.; Long, H.; Liu, Q.; Yu, H.; Zhang, X.; Hui, D. Mechanical Properties and Durability of Geopolymer Concrete Based on Fly Ash and Coal Gangue under Different Dosage and Particle Size of Nano Silica. Construction and Building Materials 2023, 387, 131622. [CrossRef]
- Liu, Z.; Deng, D.; De Schutter, G. Does Concrete Suffer Sulfate Salt Weathering? Construction and Building Materials 2014, 66, 692–701. [CrossRef]
- Zhang, Z.; Yin, H.; Hao, S.; Cao, M.; Du, Y.; Ji, Y. Study on the Advancement Process of Alkali Loss and Deterioration of Concrete under MgSO4 Erosion. Journal of Materials Research and Technology 2025, 36, 2849–2862. [CrossRef]
- Zak, D.; Hupfer, M.; Cabezas, A.; Jurasinski, G.; Audet, J.; Kleeberg, A.; McInnes, R.; Kristiansen, S.M.; Petersen, R.J.; Liu, H.; et al. Sulphate in Freshwater Ecosystems: A Review of Sources, Biogeochemical Cycles, Ecotoxicological Effects and Bioremediation. Earth-Science Reviews 2021, 212, 103446. [CrossRef]
Figure 1.
Flowchart of the experiment.
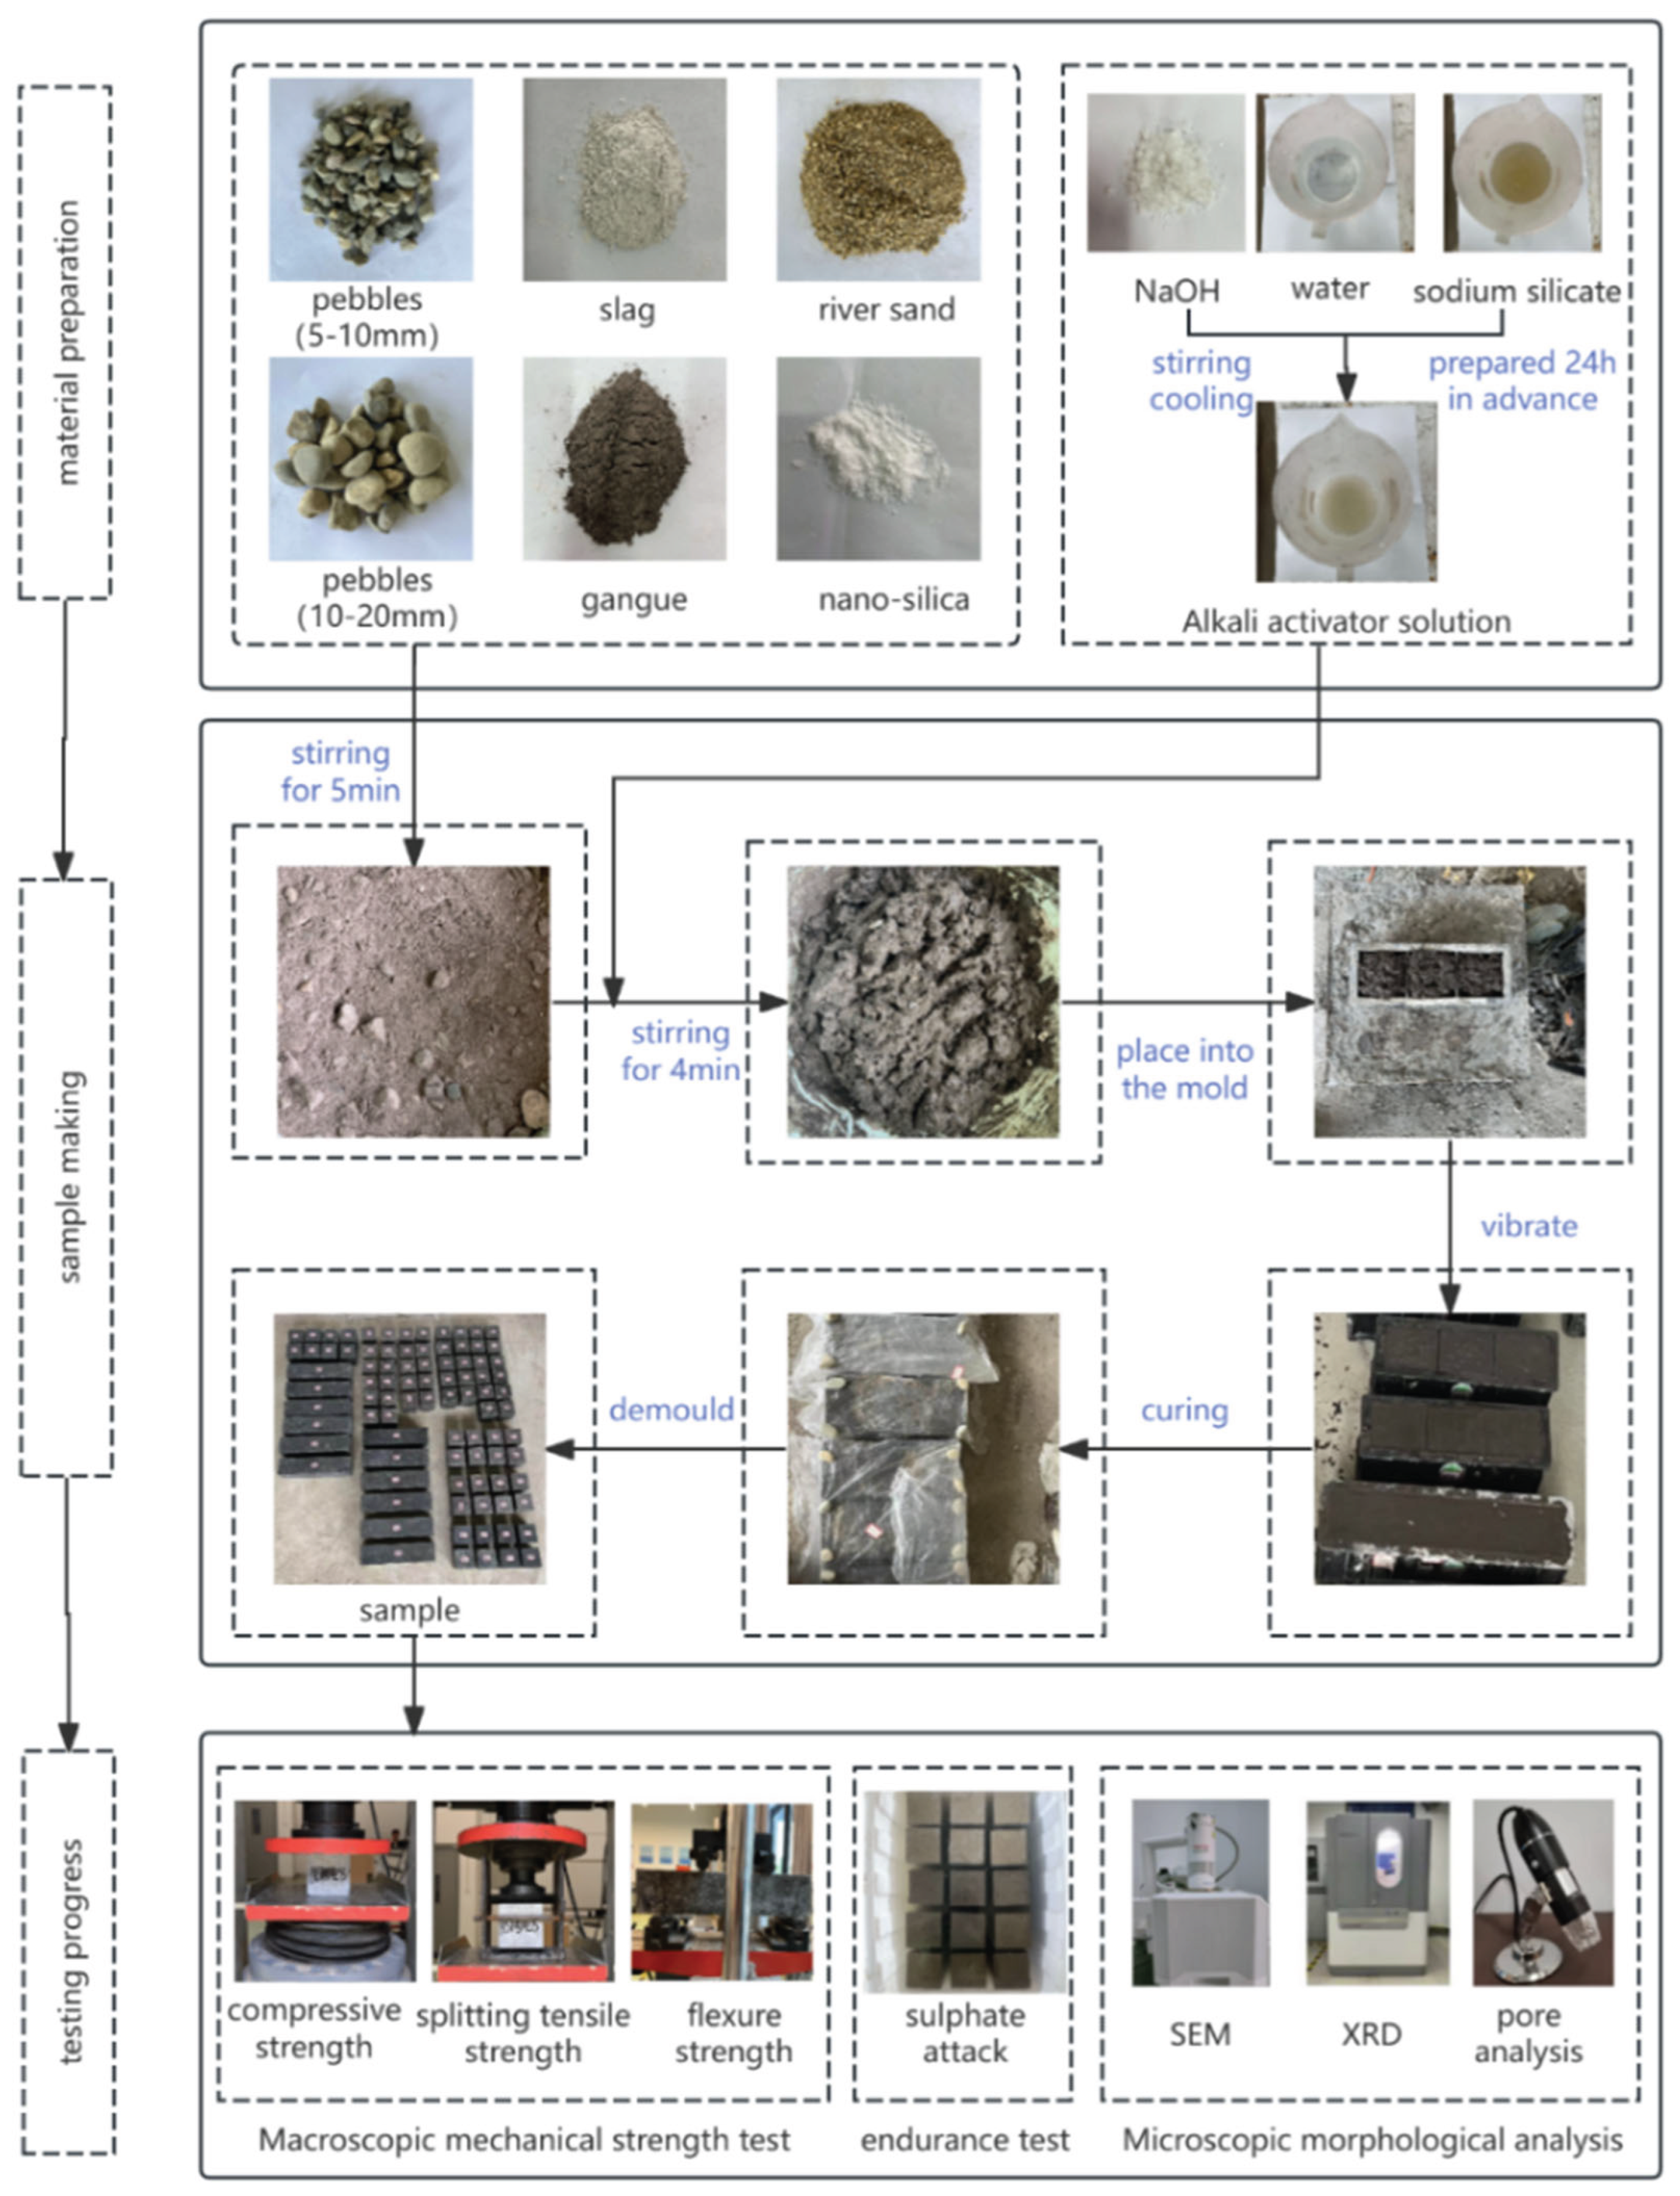
Figure 2.
Sulfate erosion test.
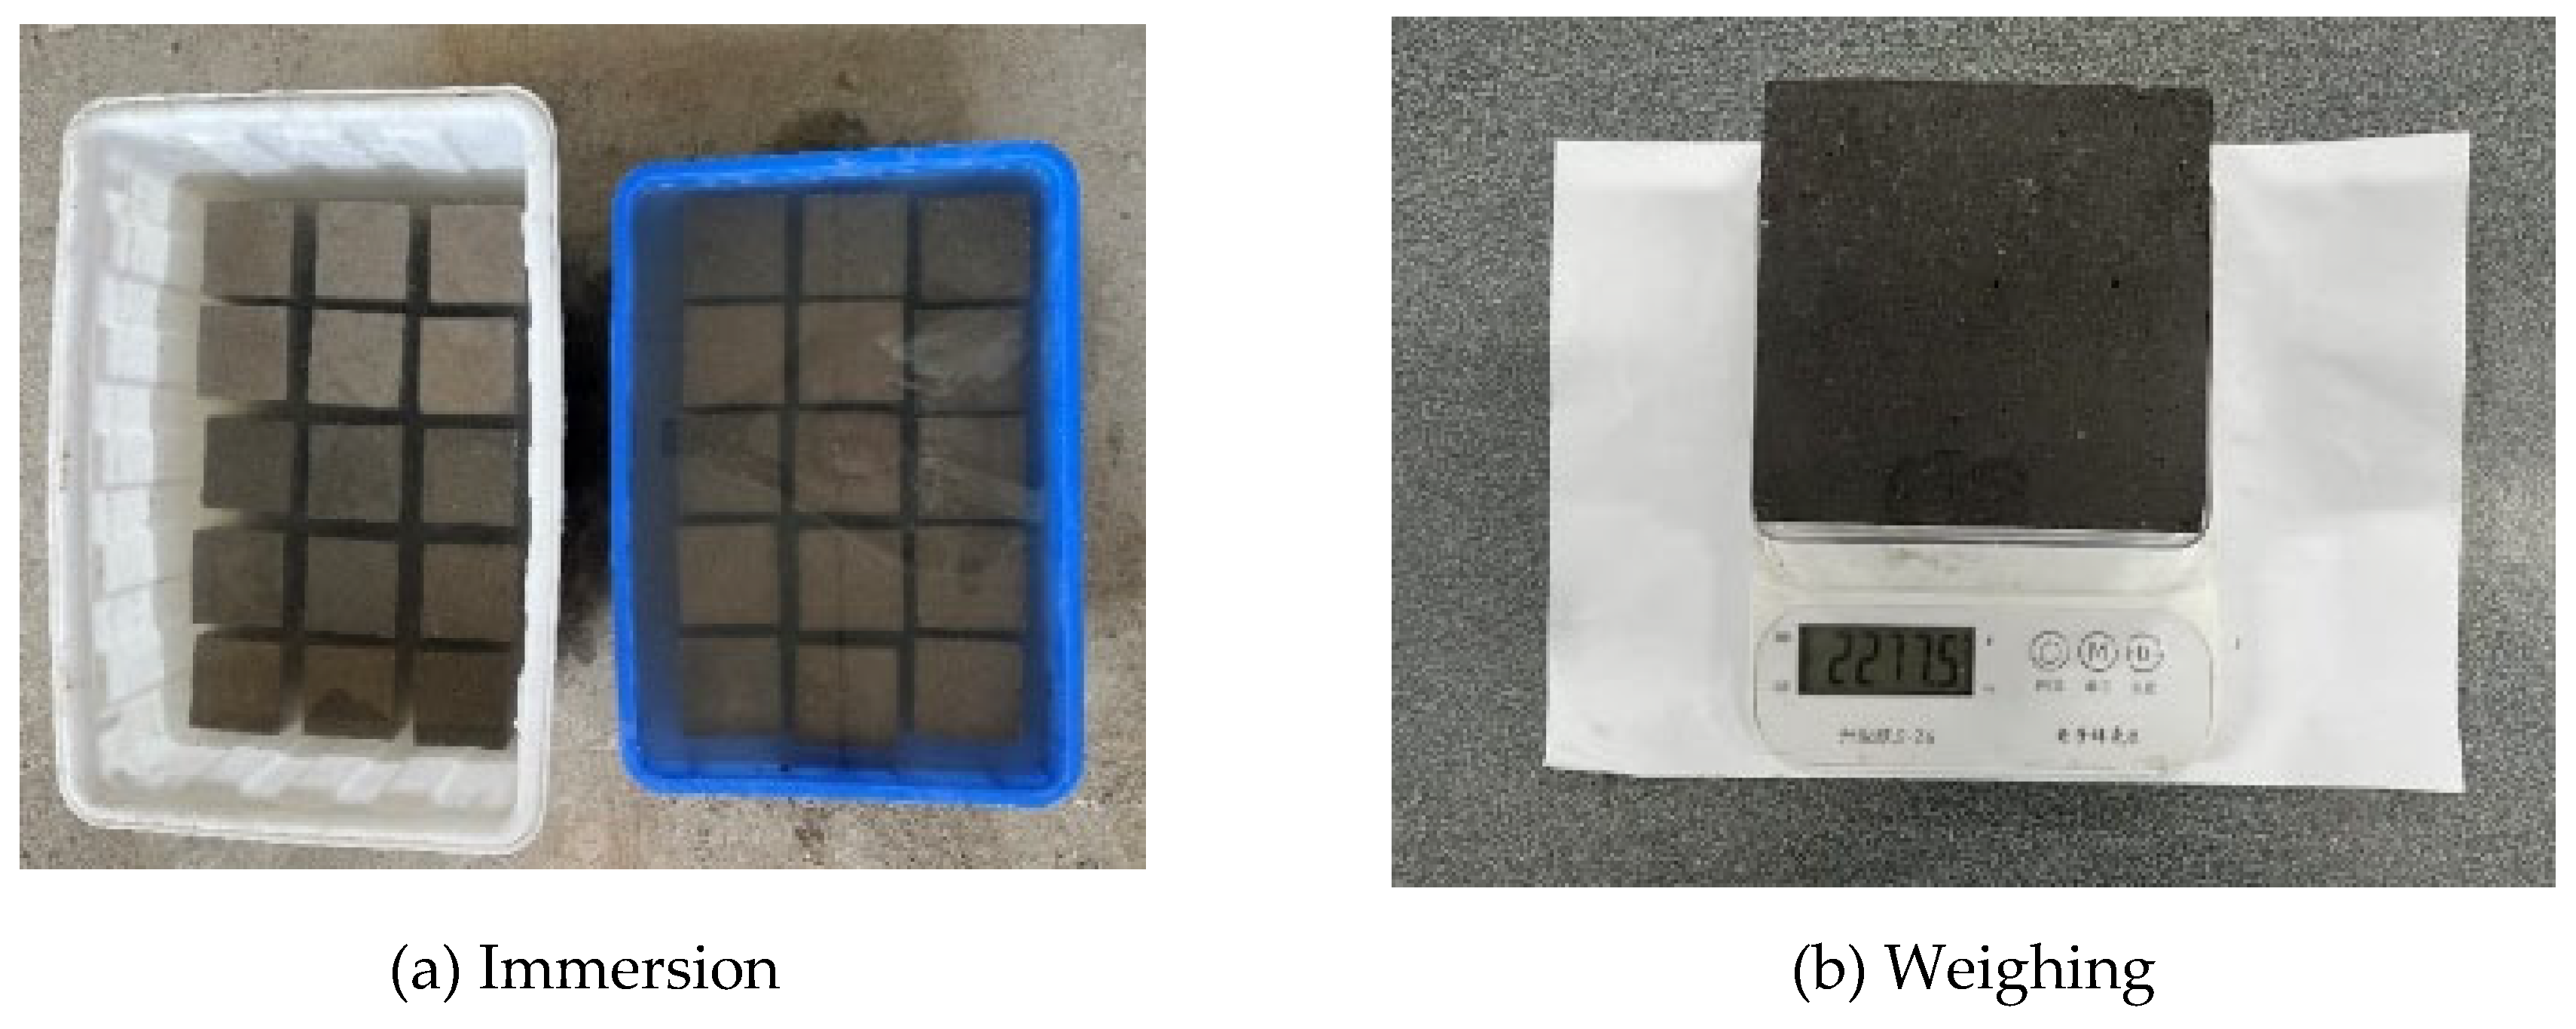
Figure 3.
Photographing and binarization processing.
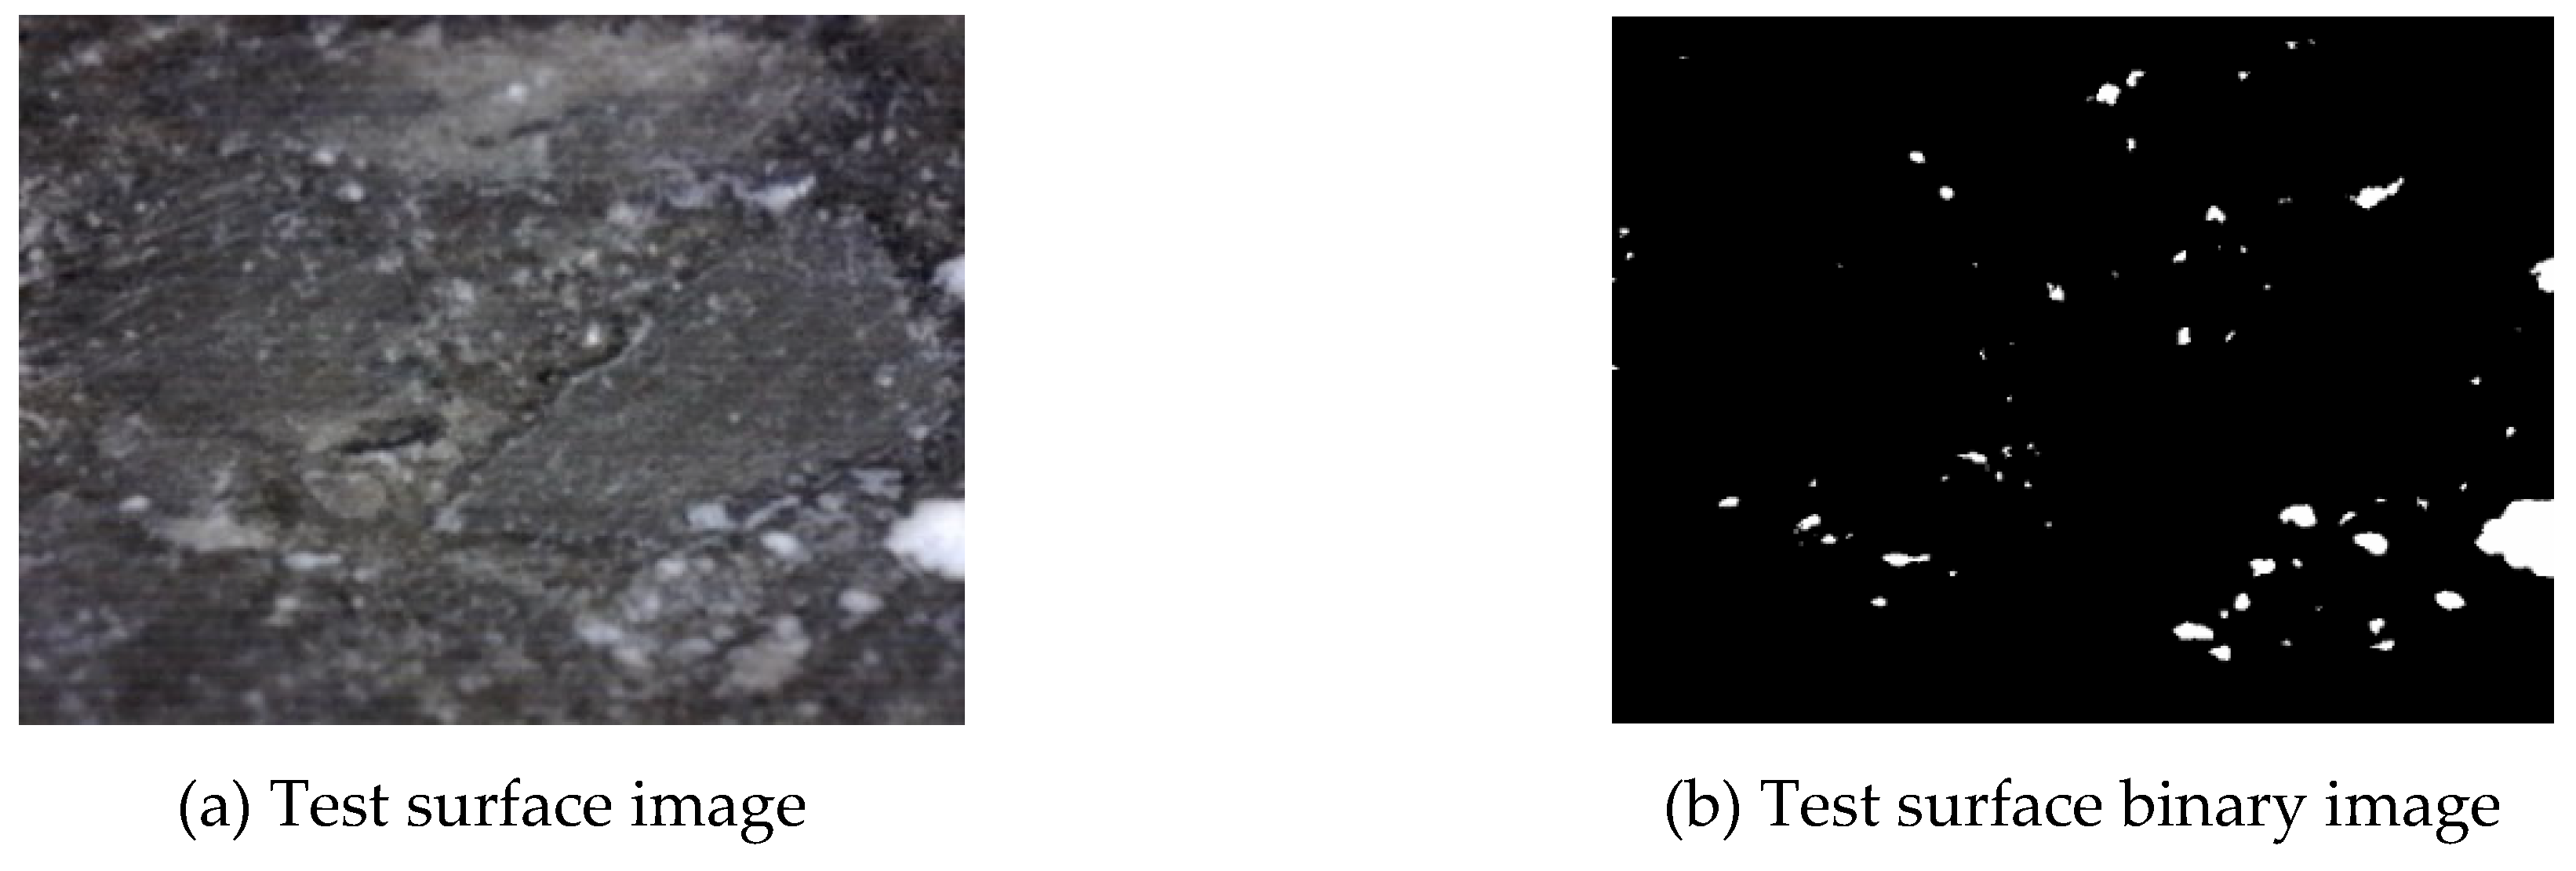
Figure 4.
Morphology of compressive failure.
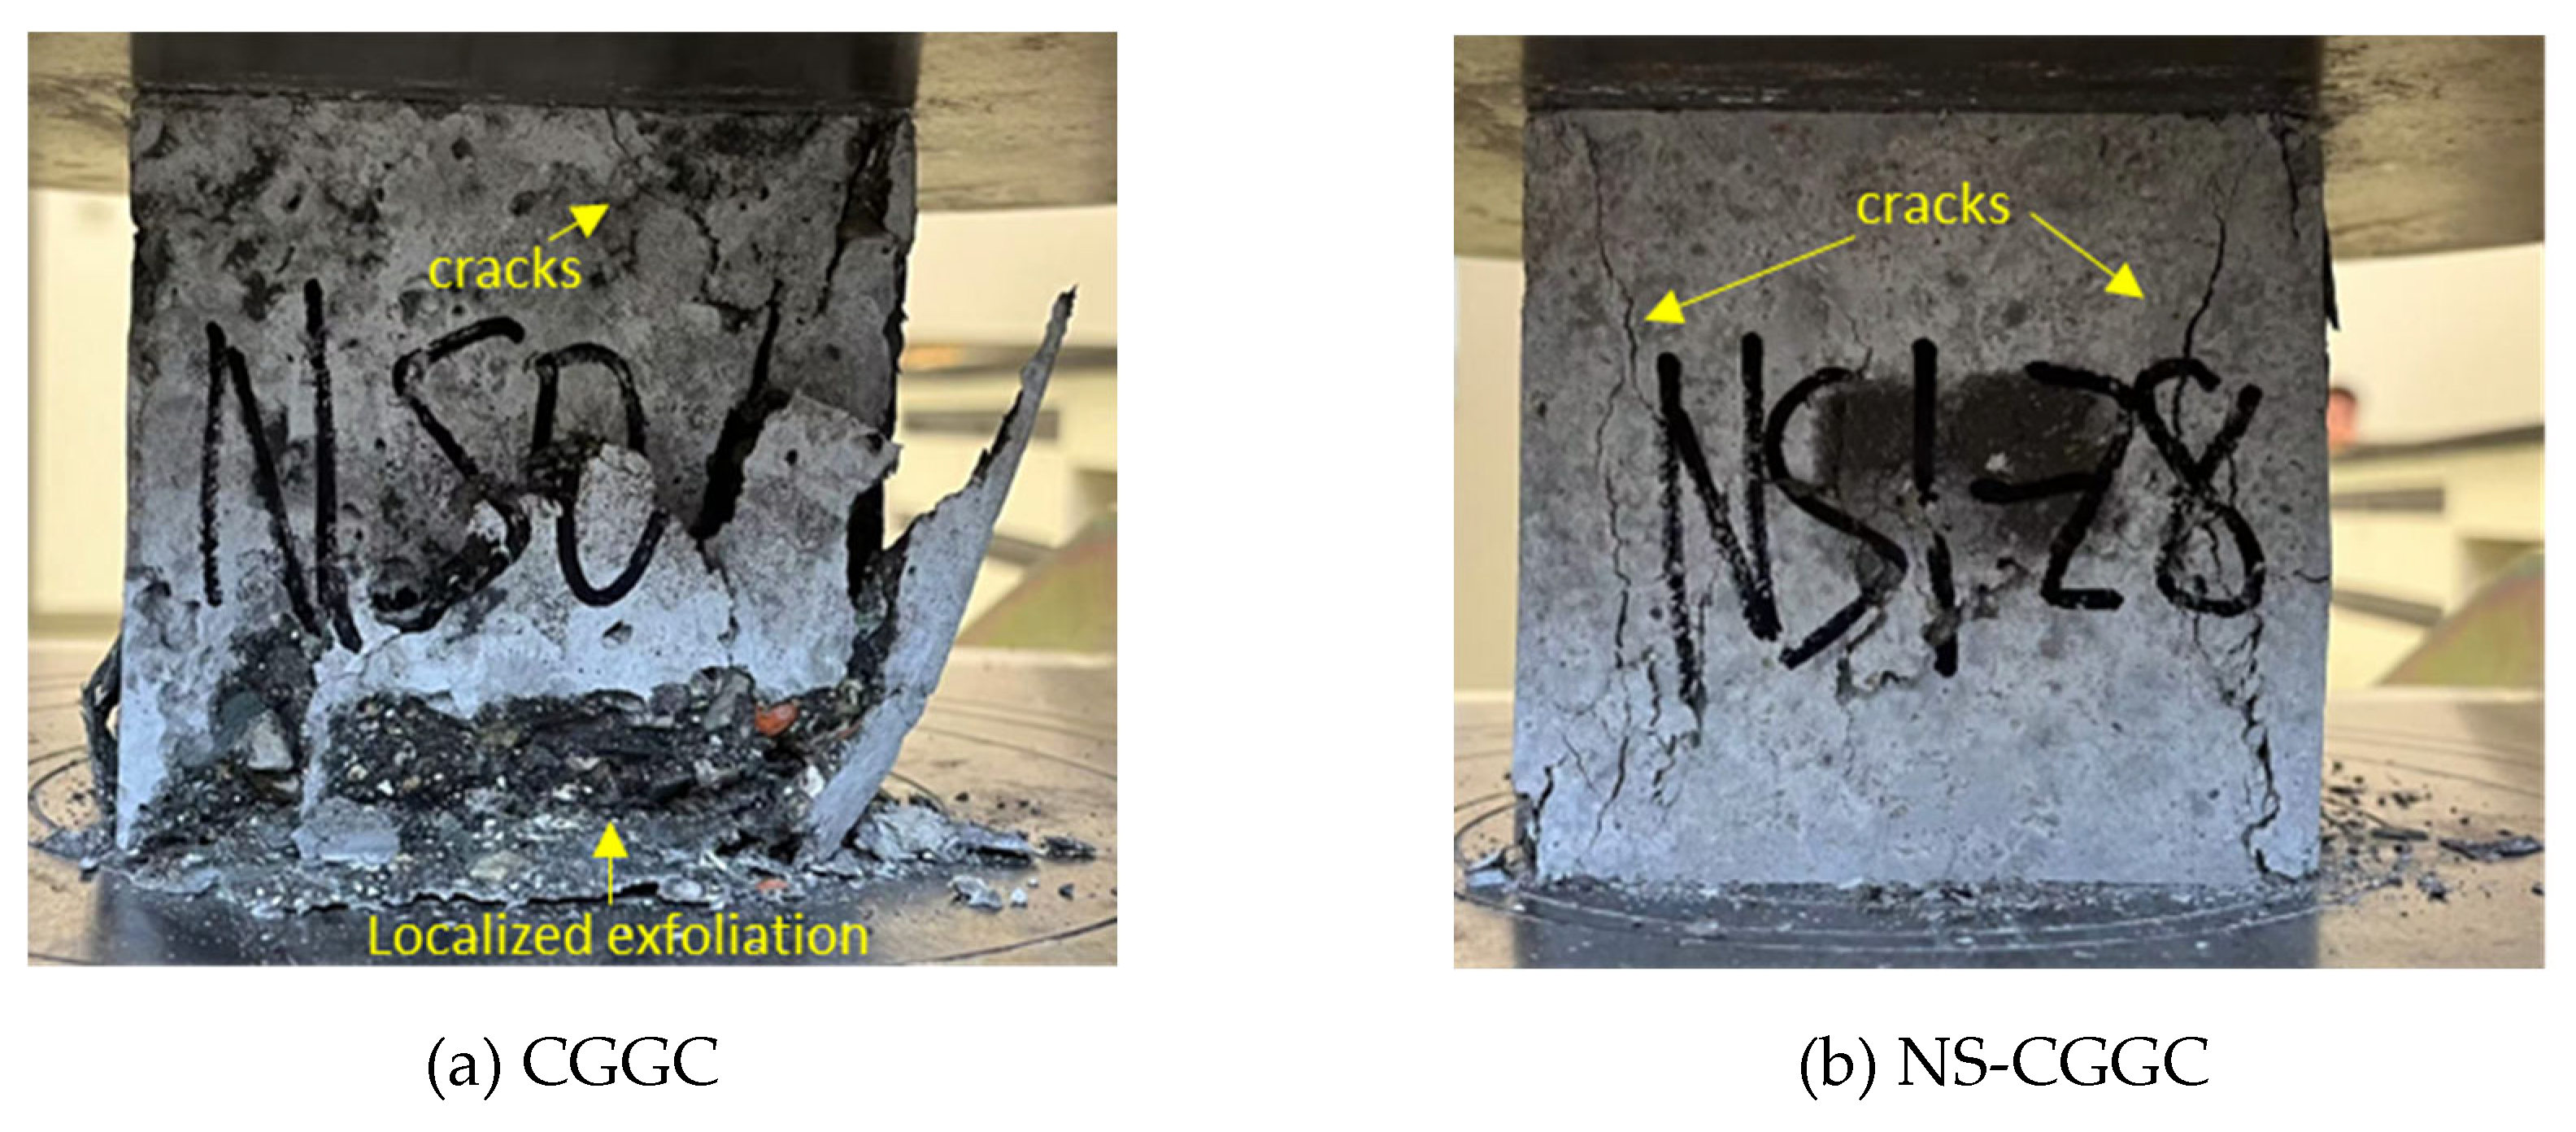
Figure 5.
NS-CGGC test results analysis diagram.
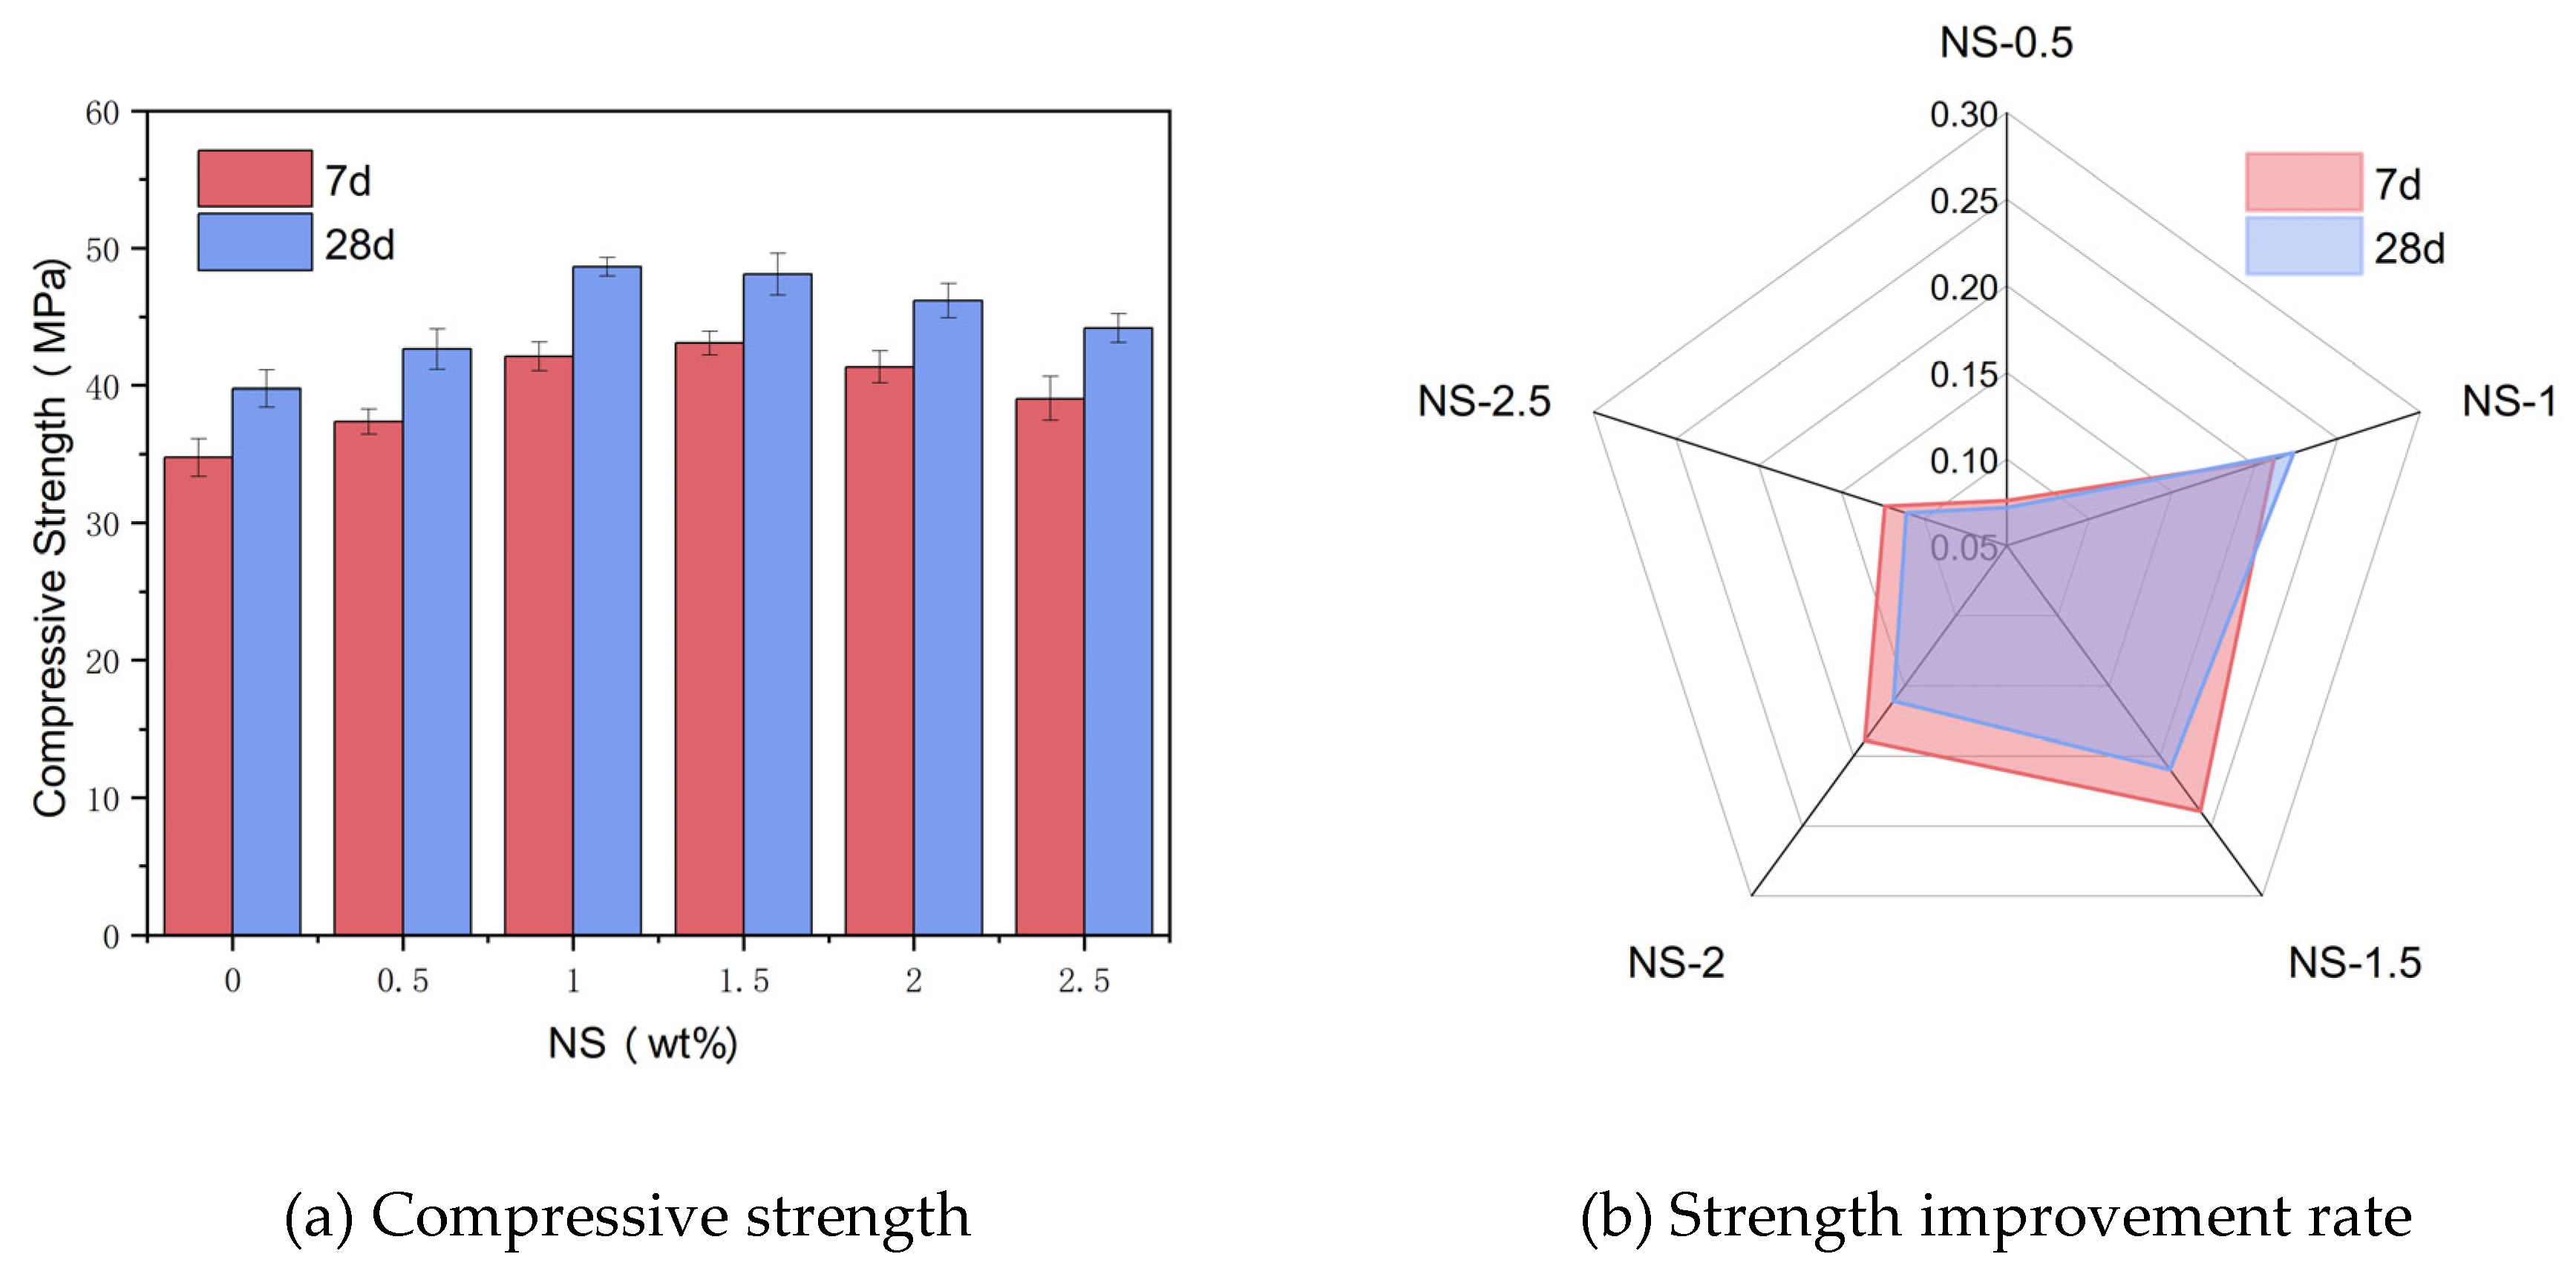
Figure 6.
Morphology of splitting tensile failure.
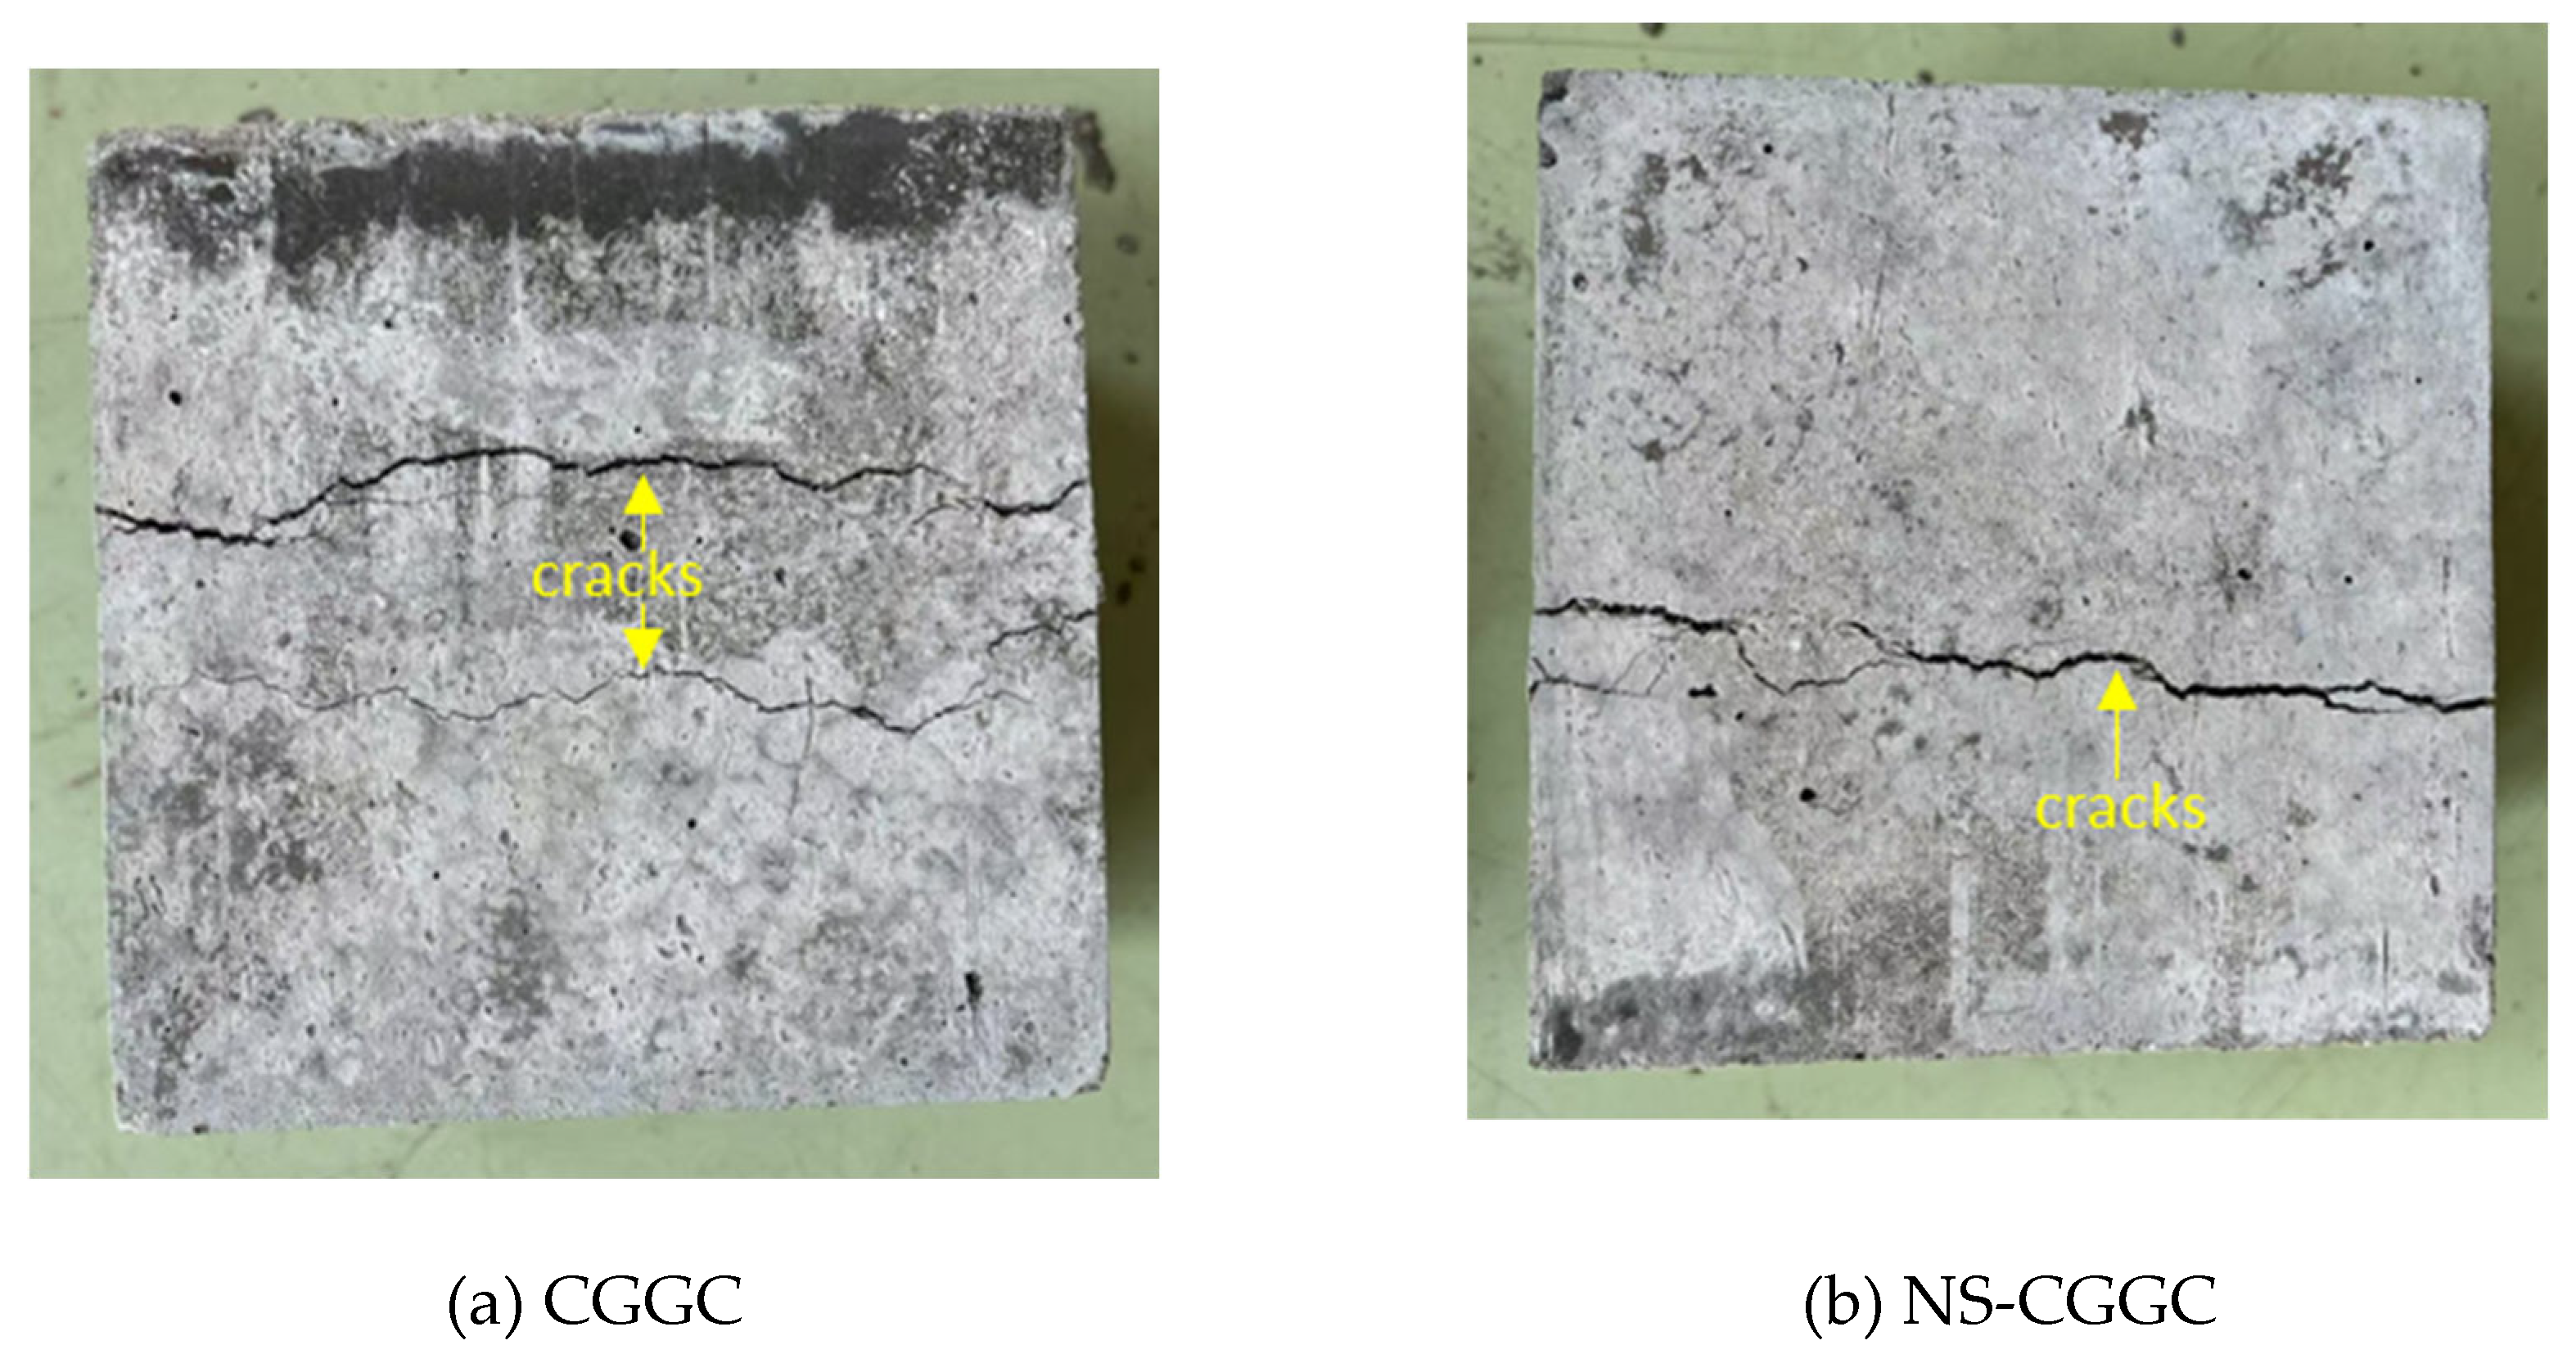
Figure 7.
NS-CGGC test results analysis diagram.
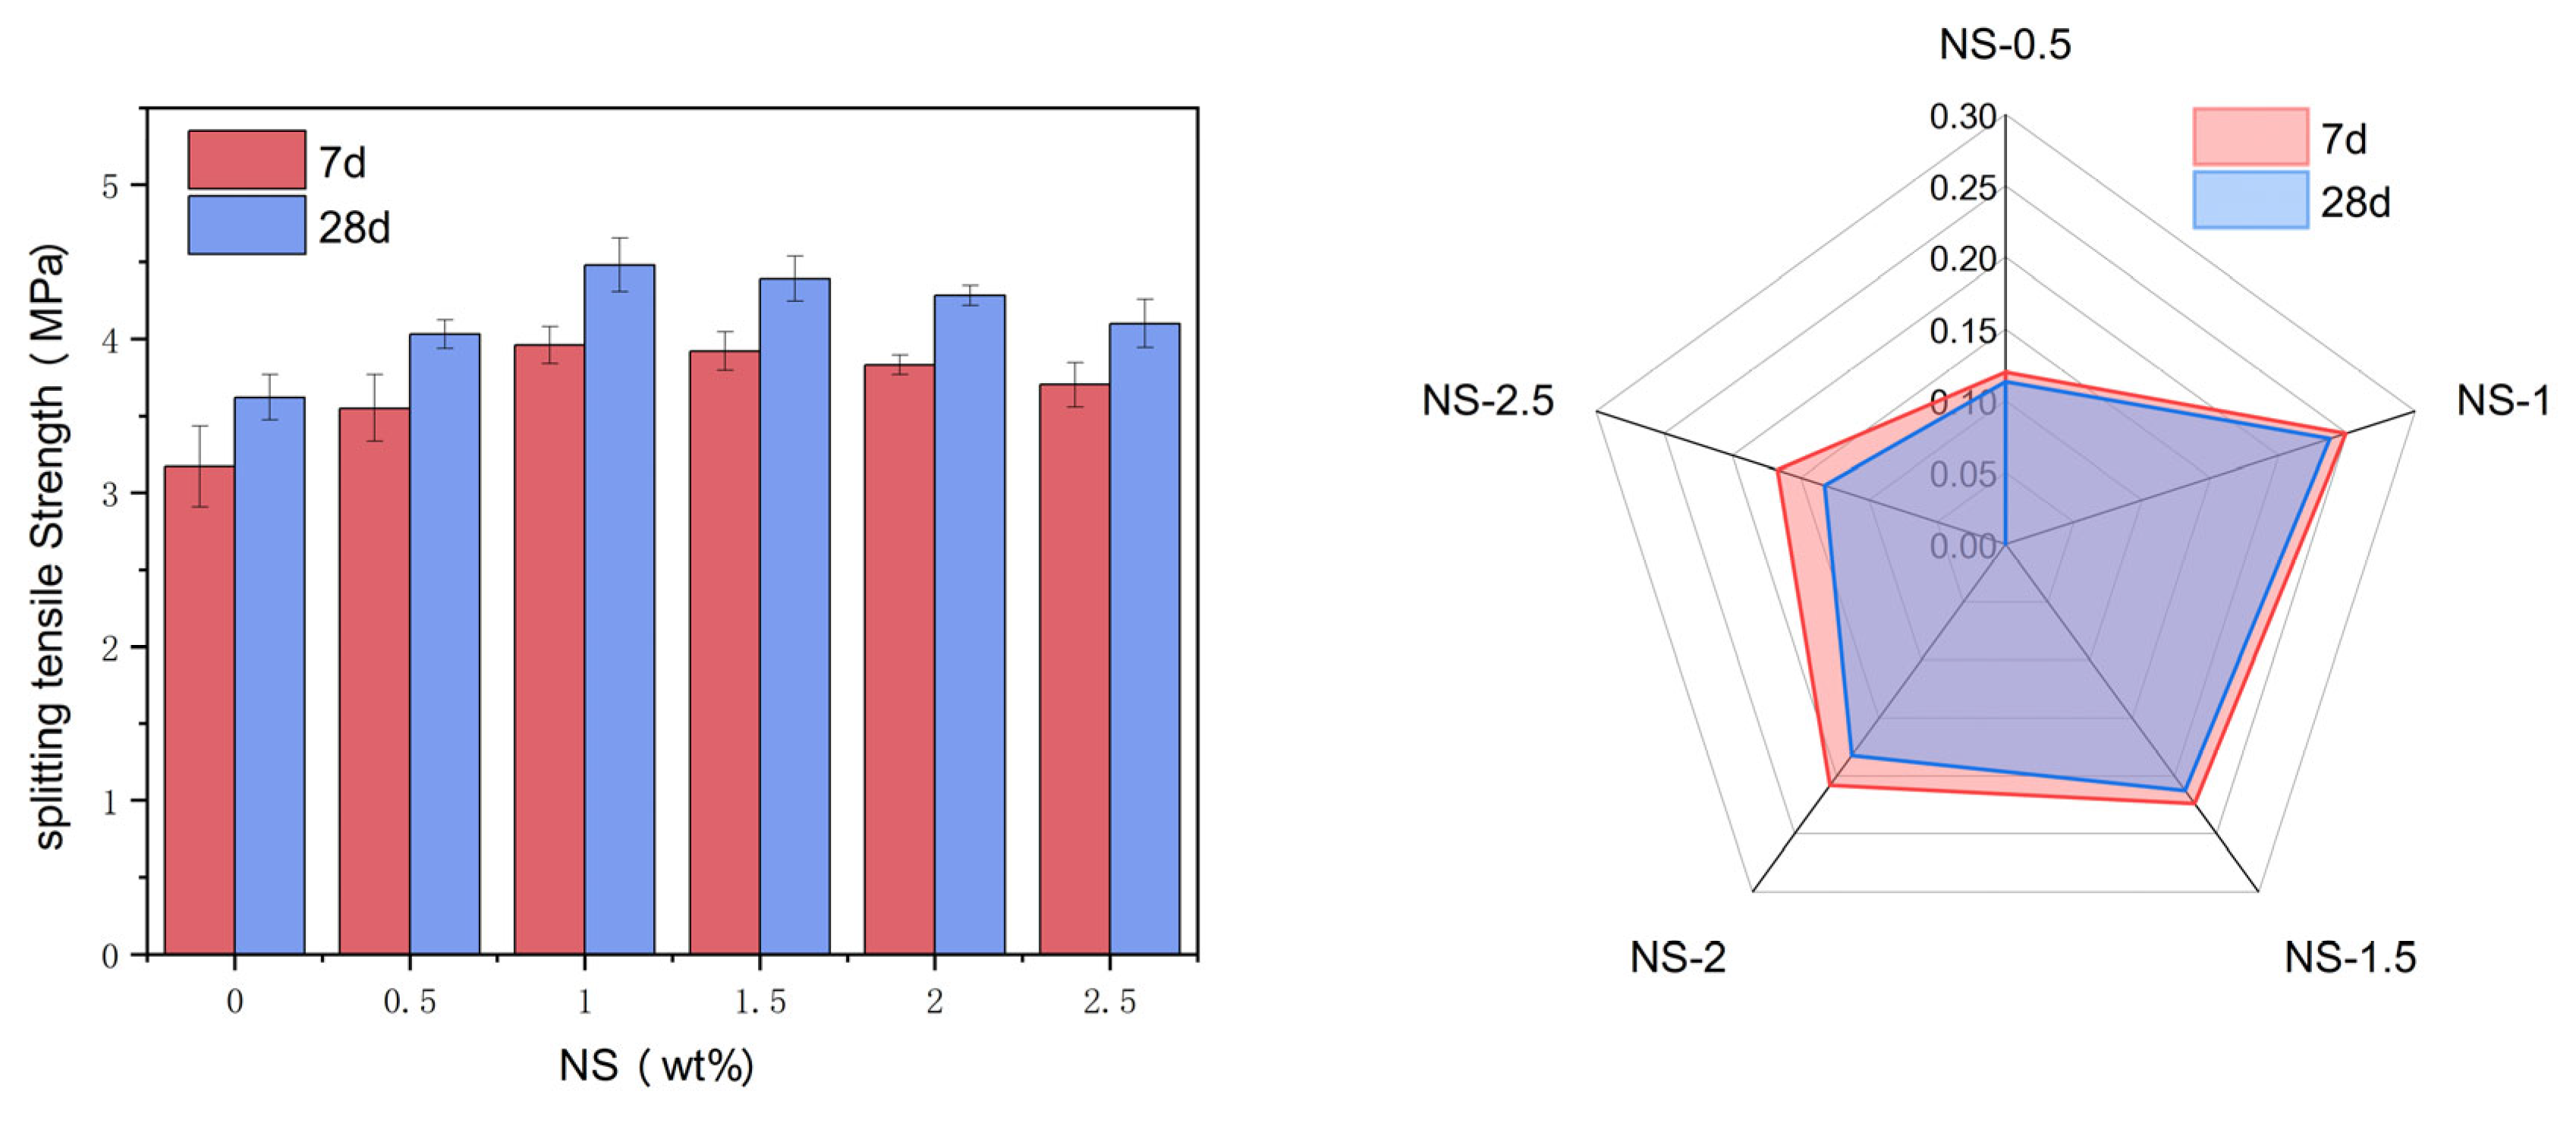
Figure 8.
Morphology of flexural failure.
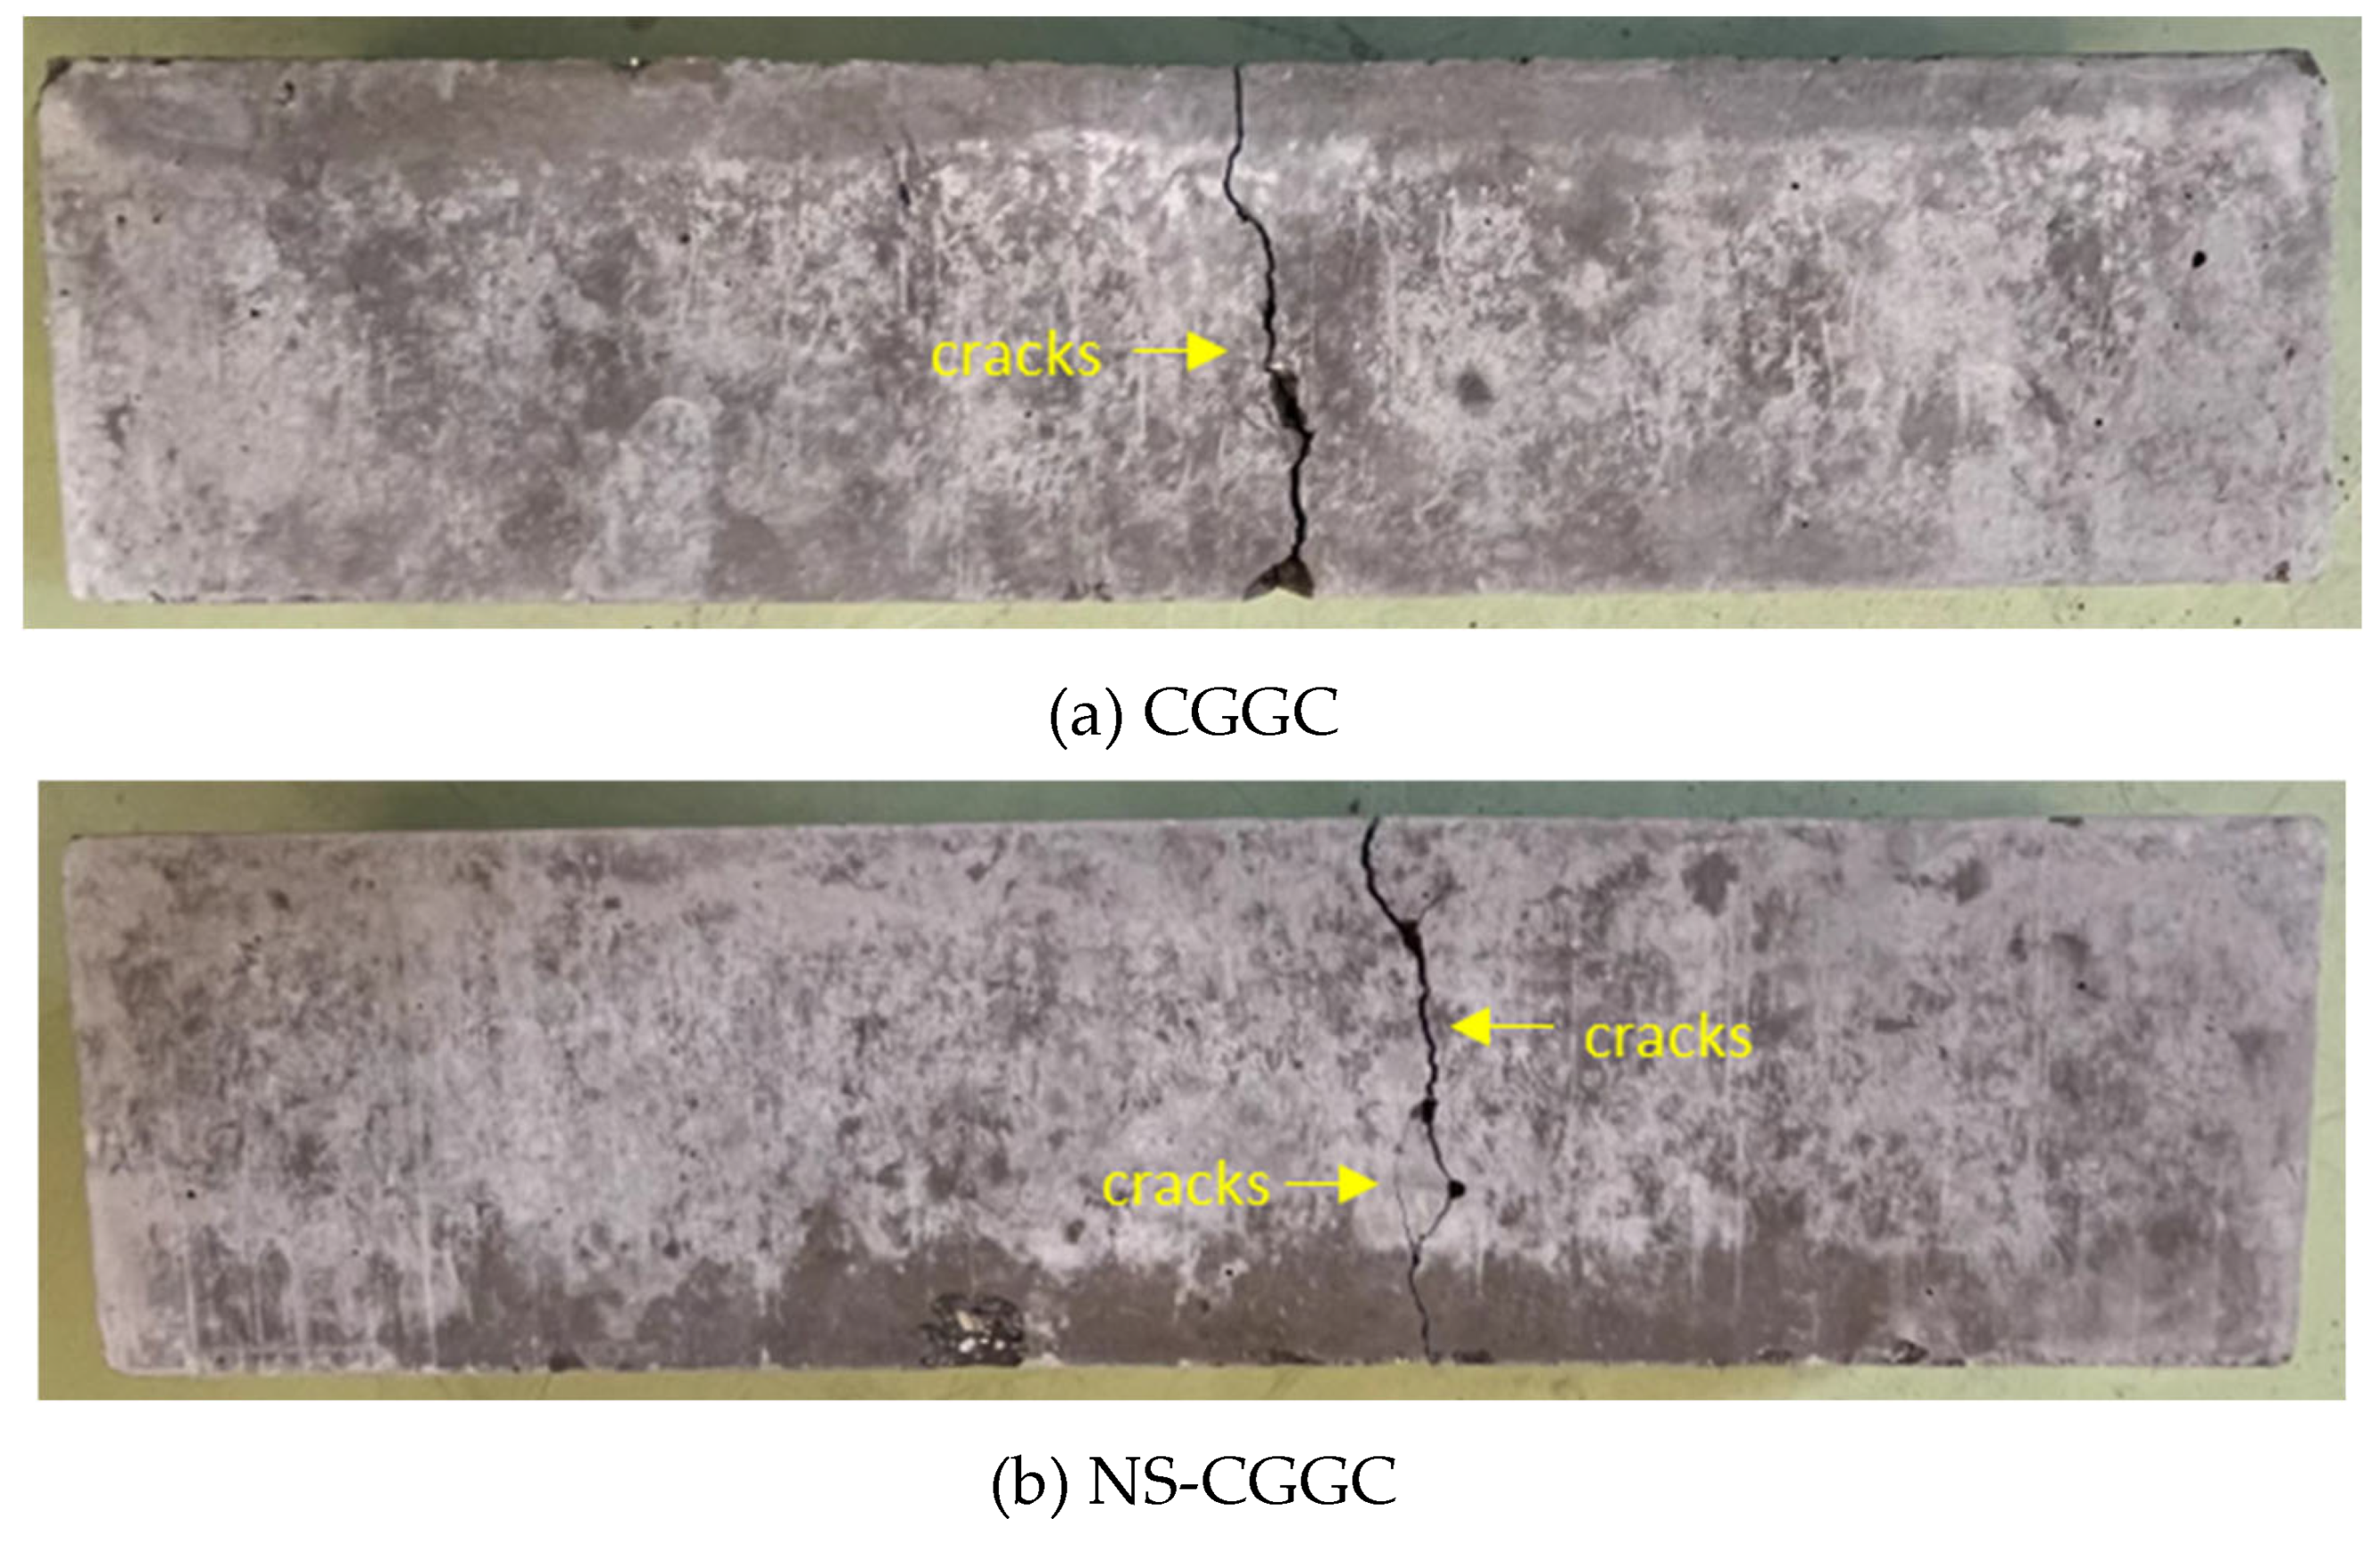
Figure 9.
NS-CGGC test results analysis diagram.
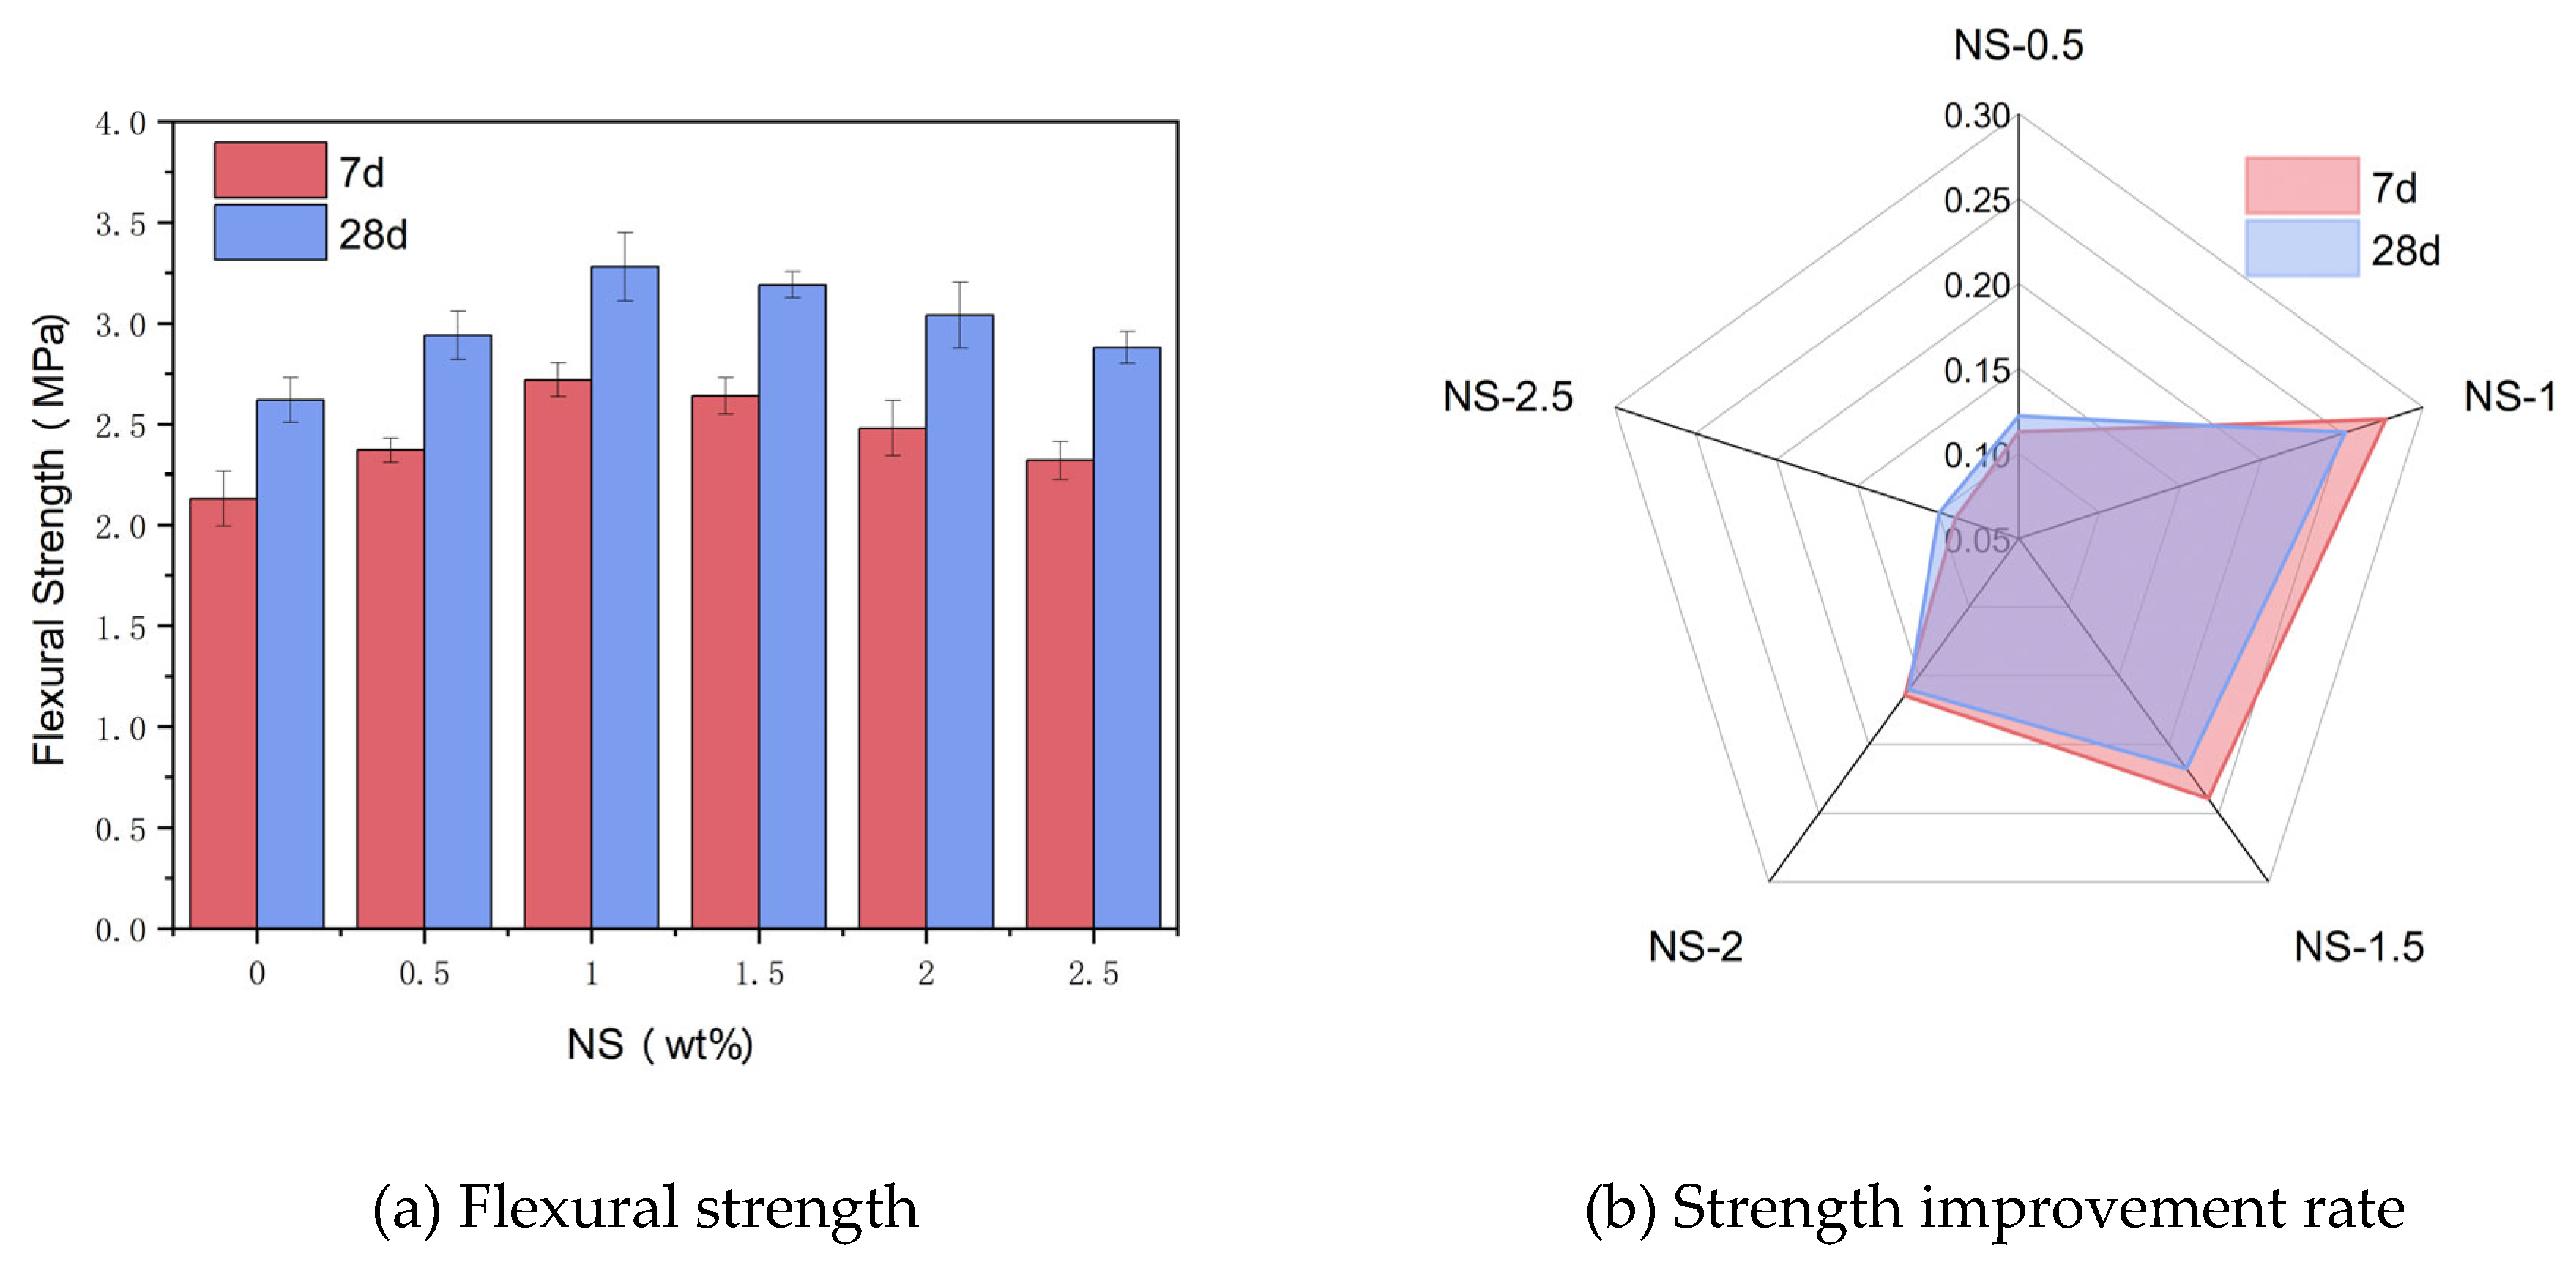
Figure 10.
Mass changes of specimens at different ages in sulfate solution.
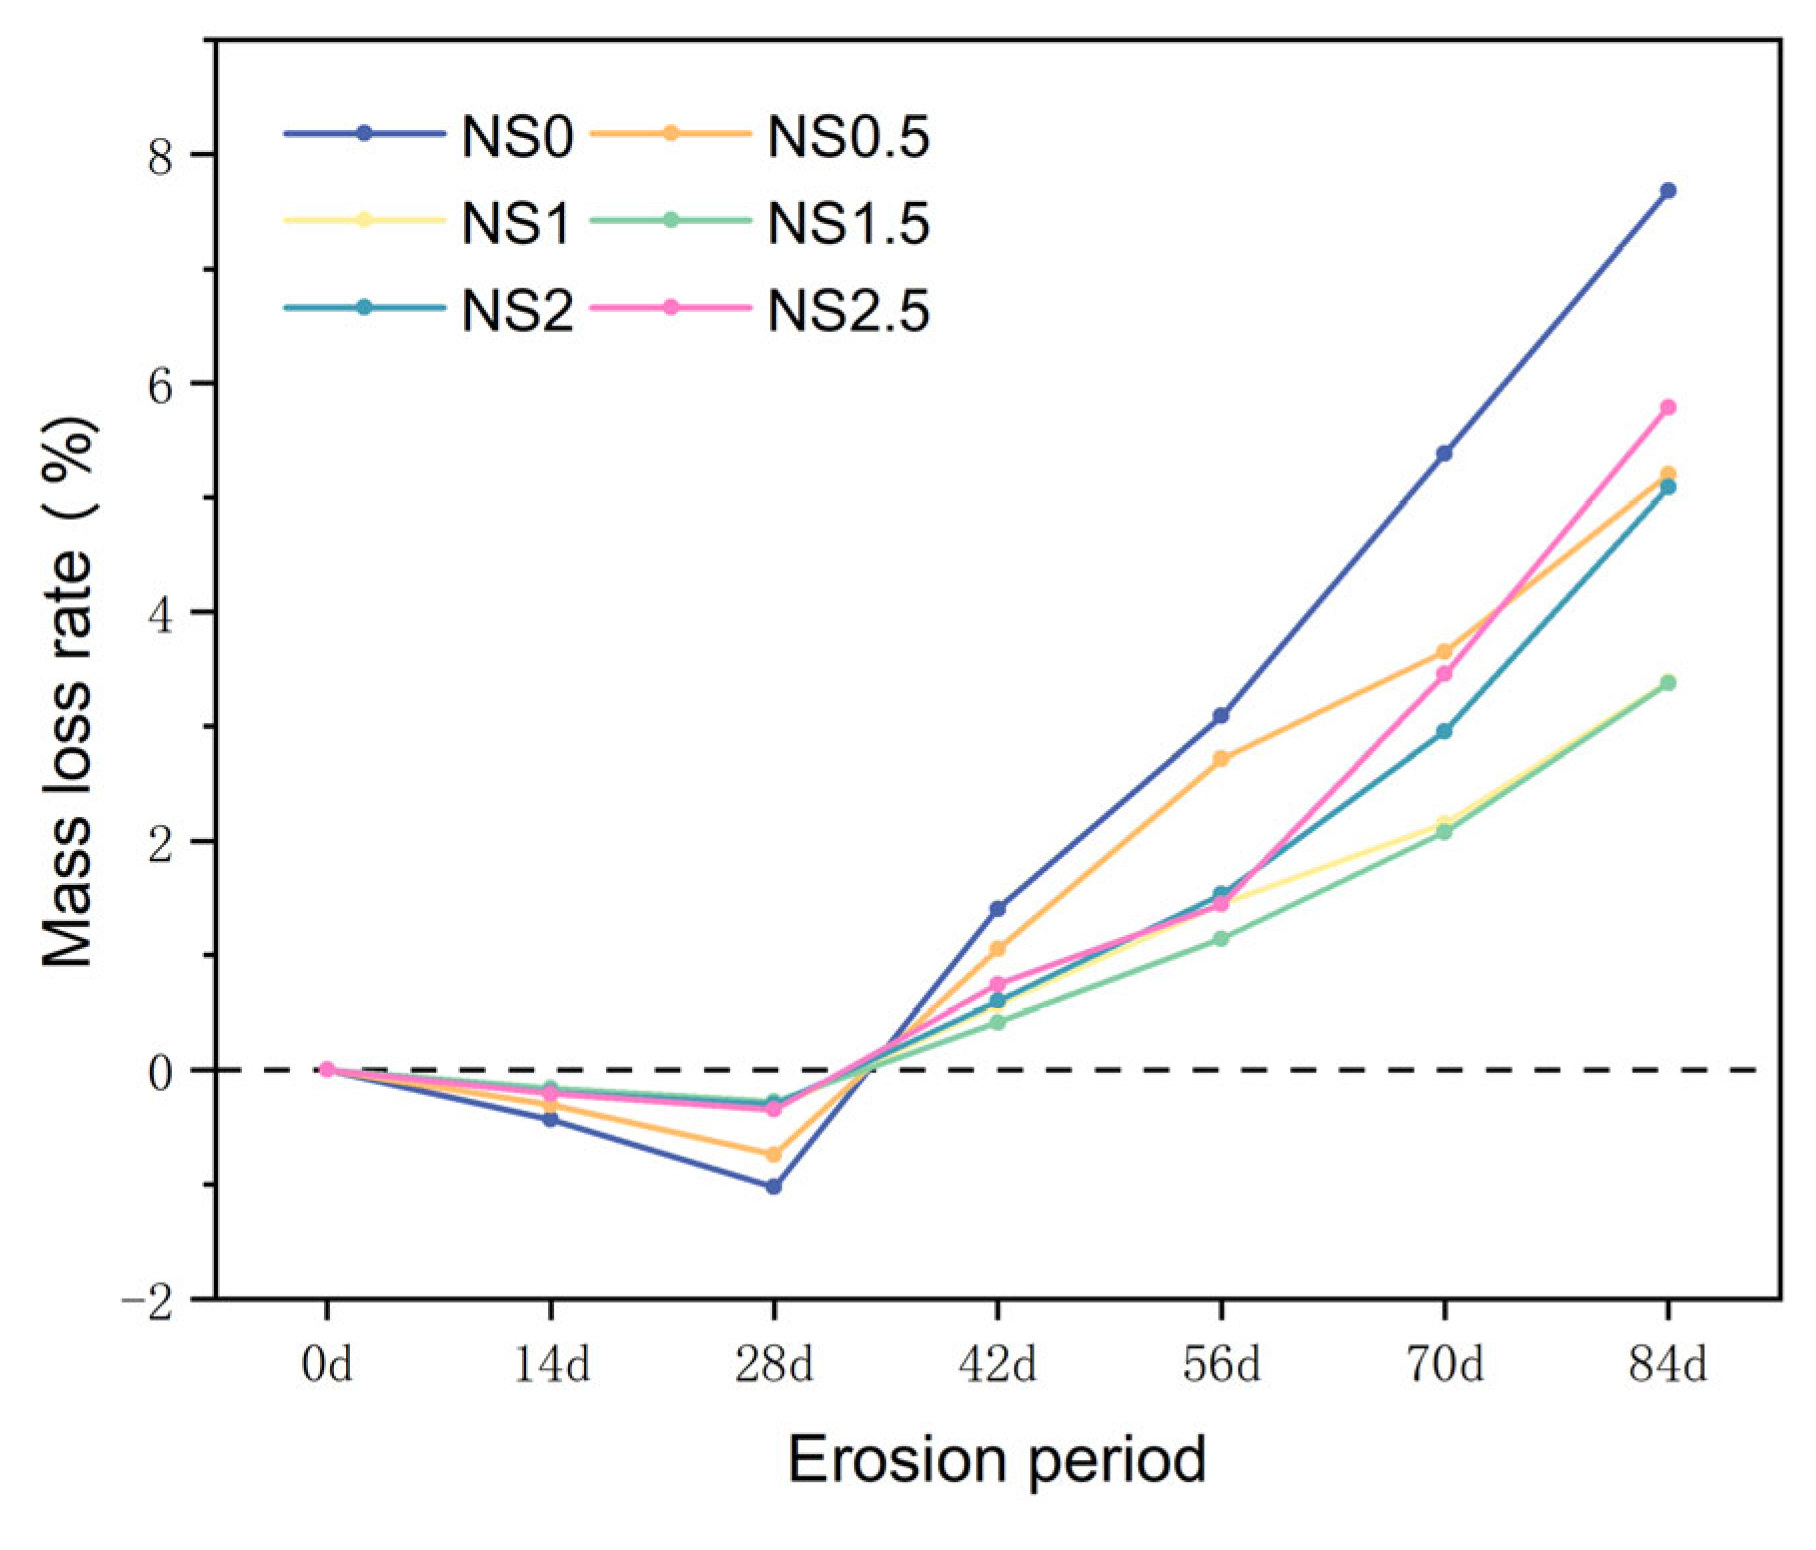
Figure 11.
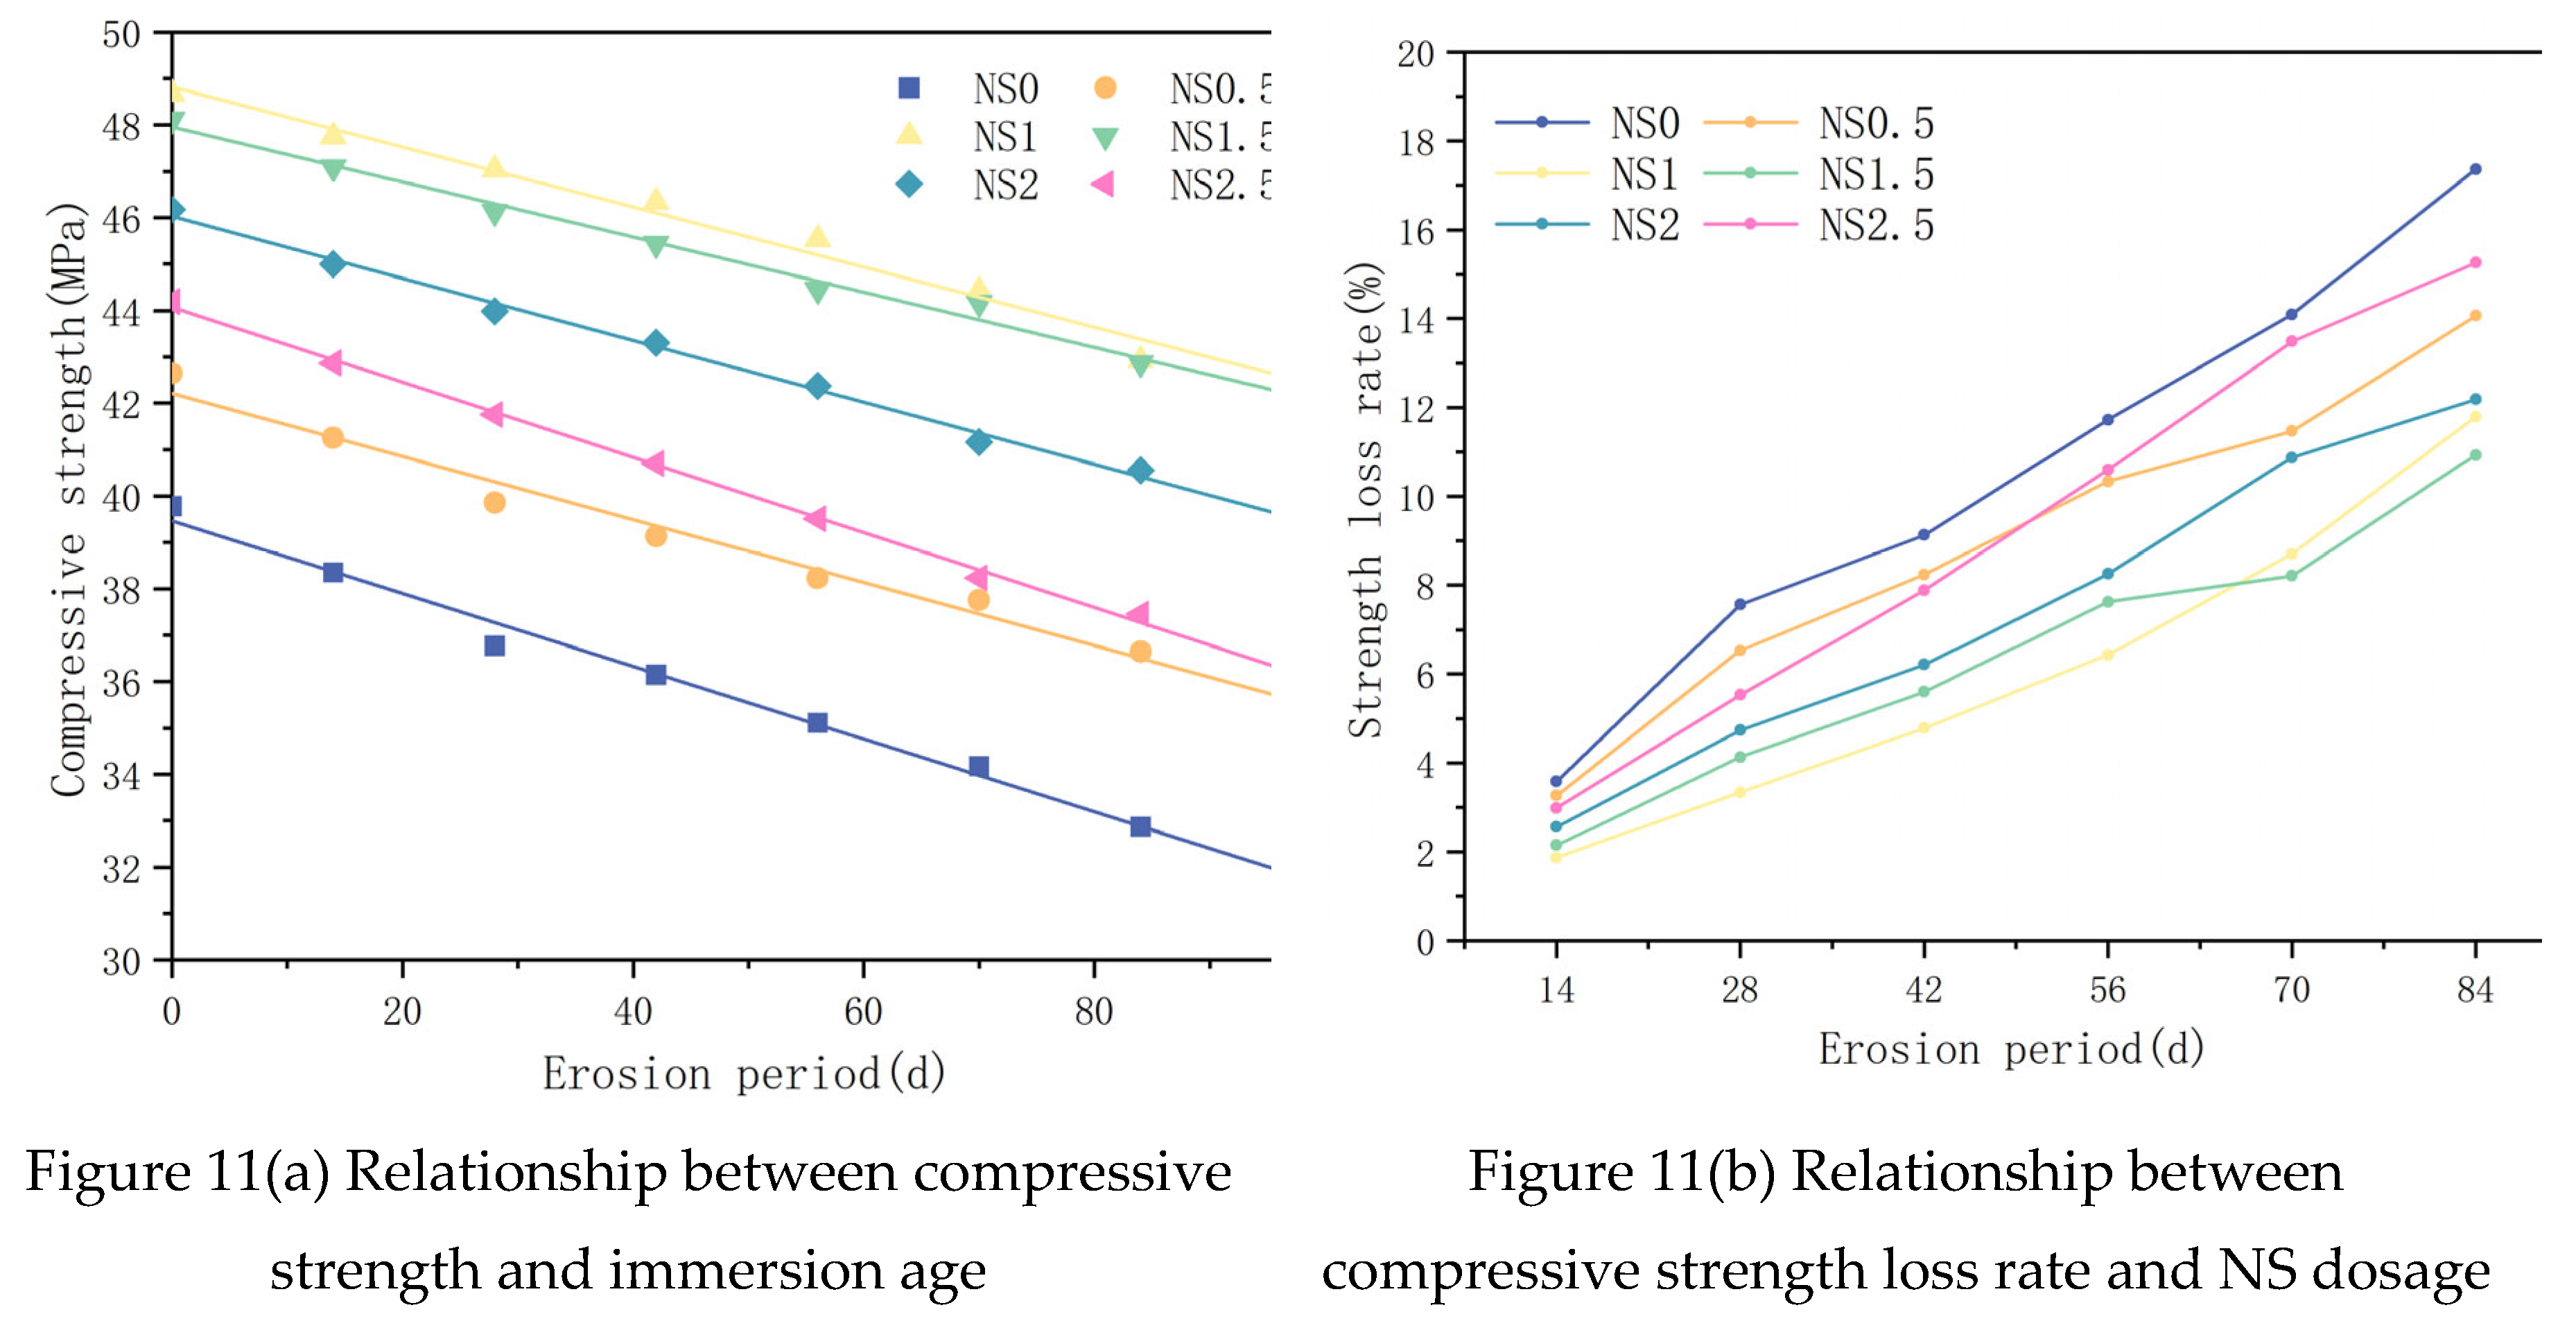
Figure 12.
Microscopic morphology (×1000).
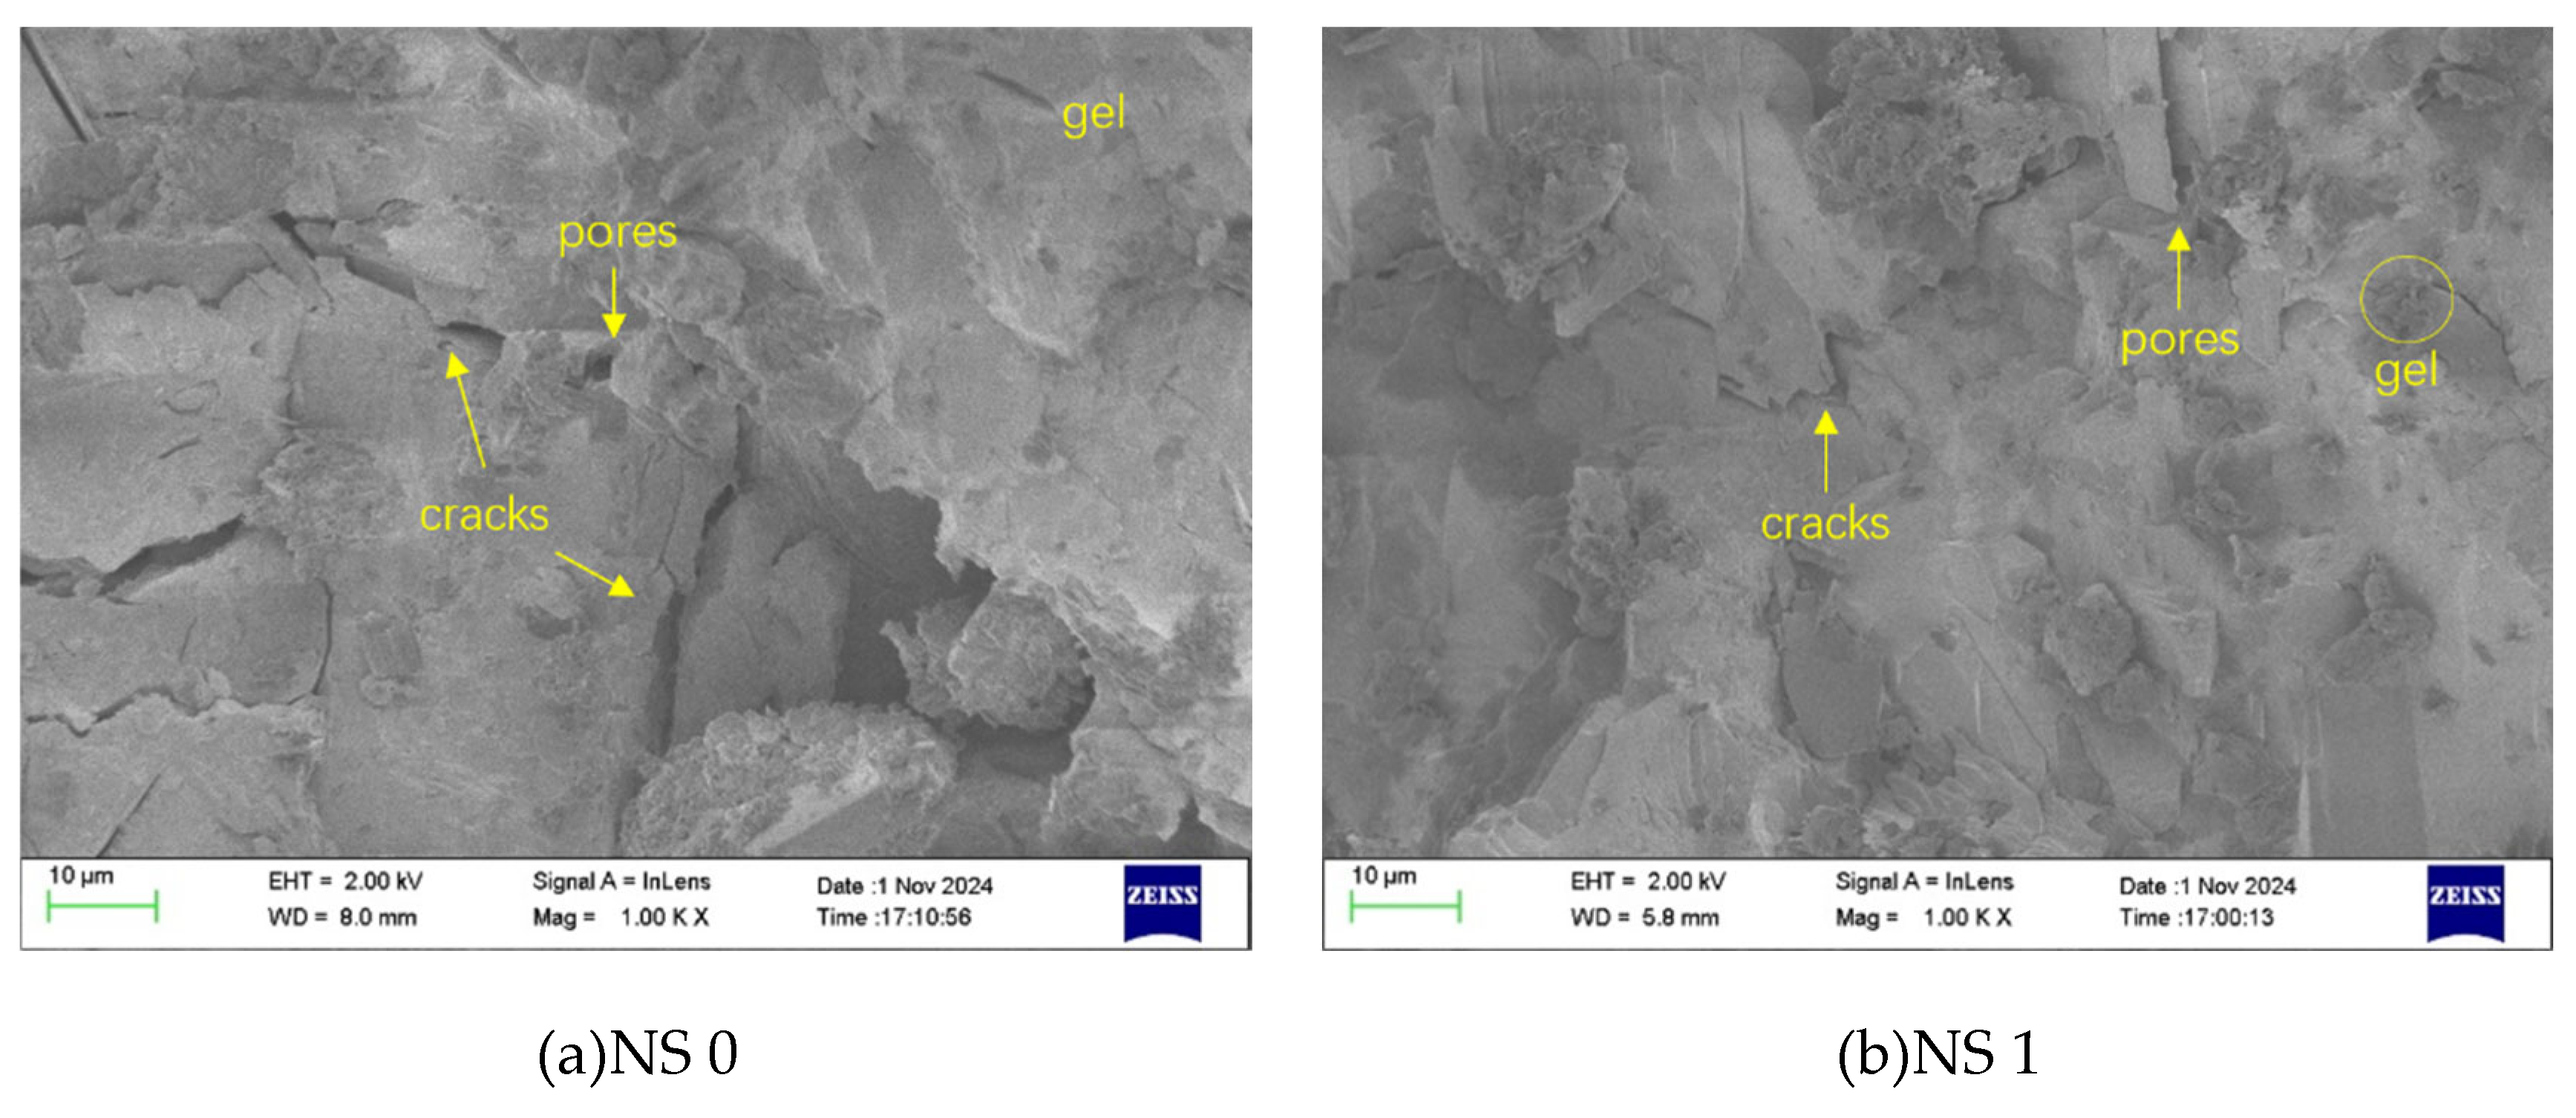
Figure 13.
Microscopic morphology (×10000).
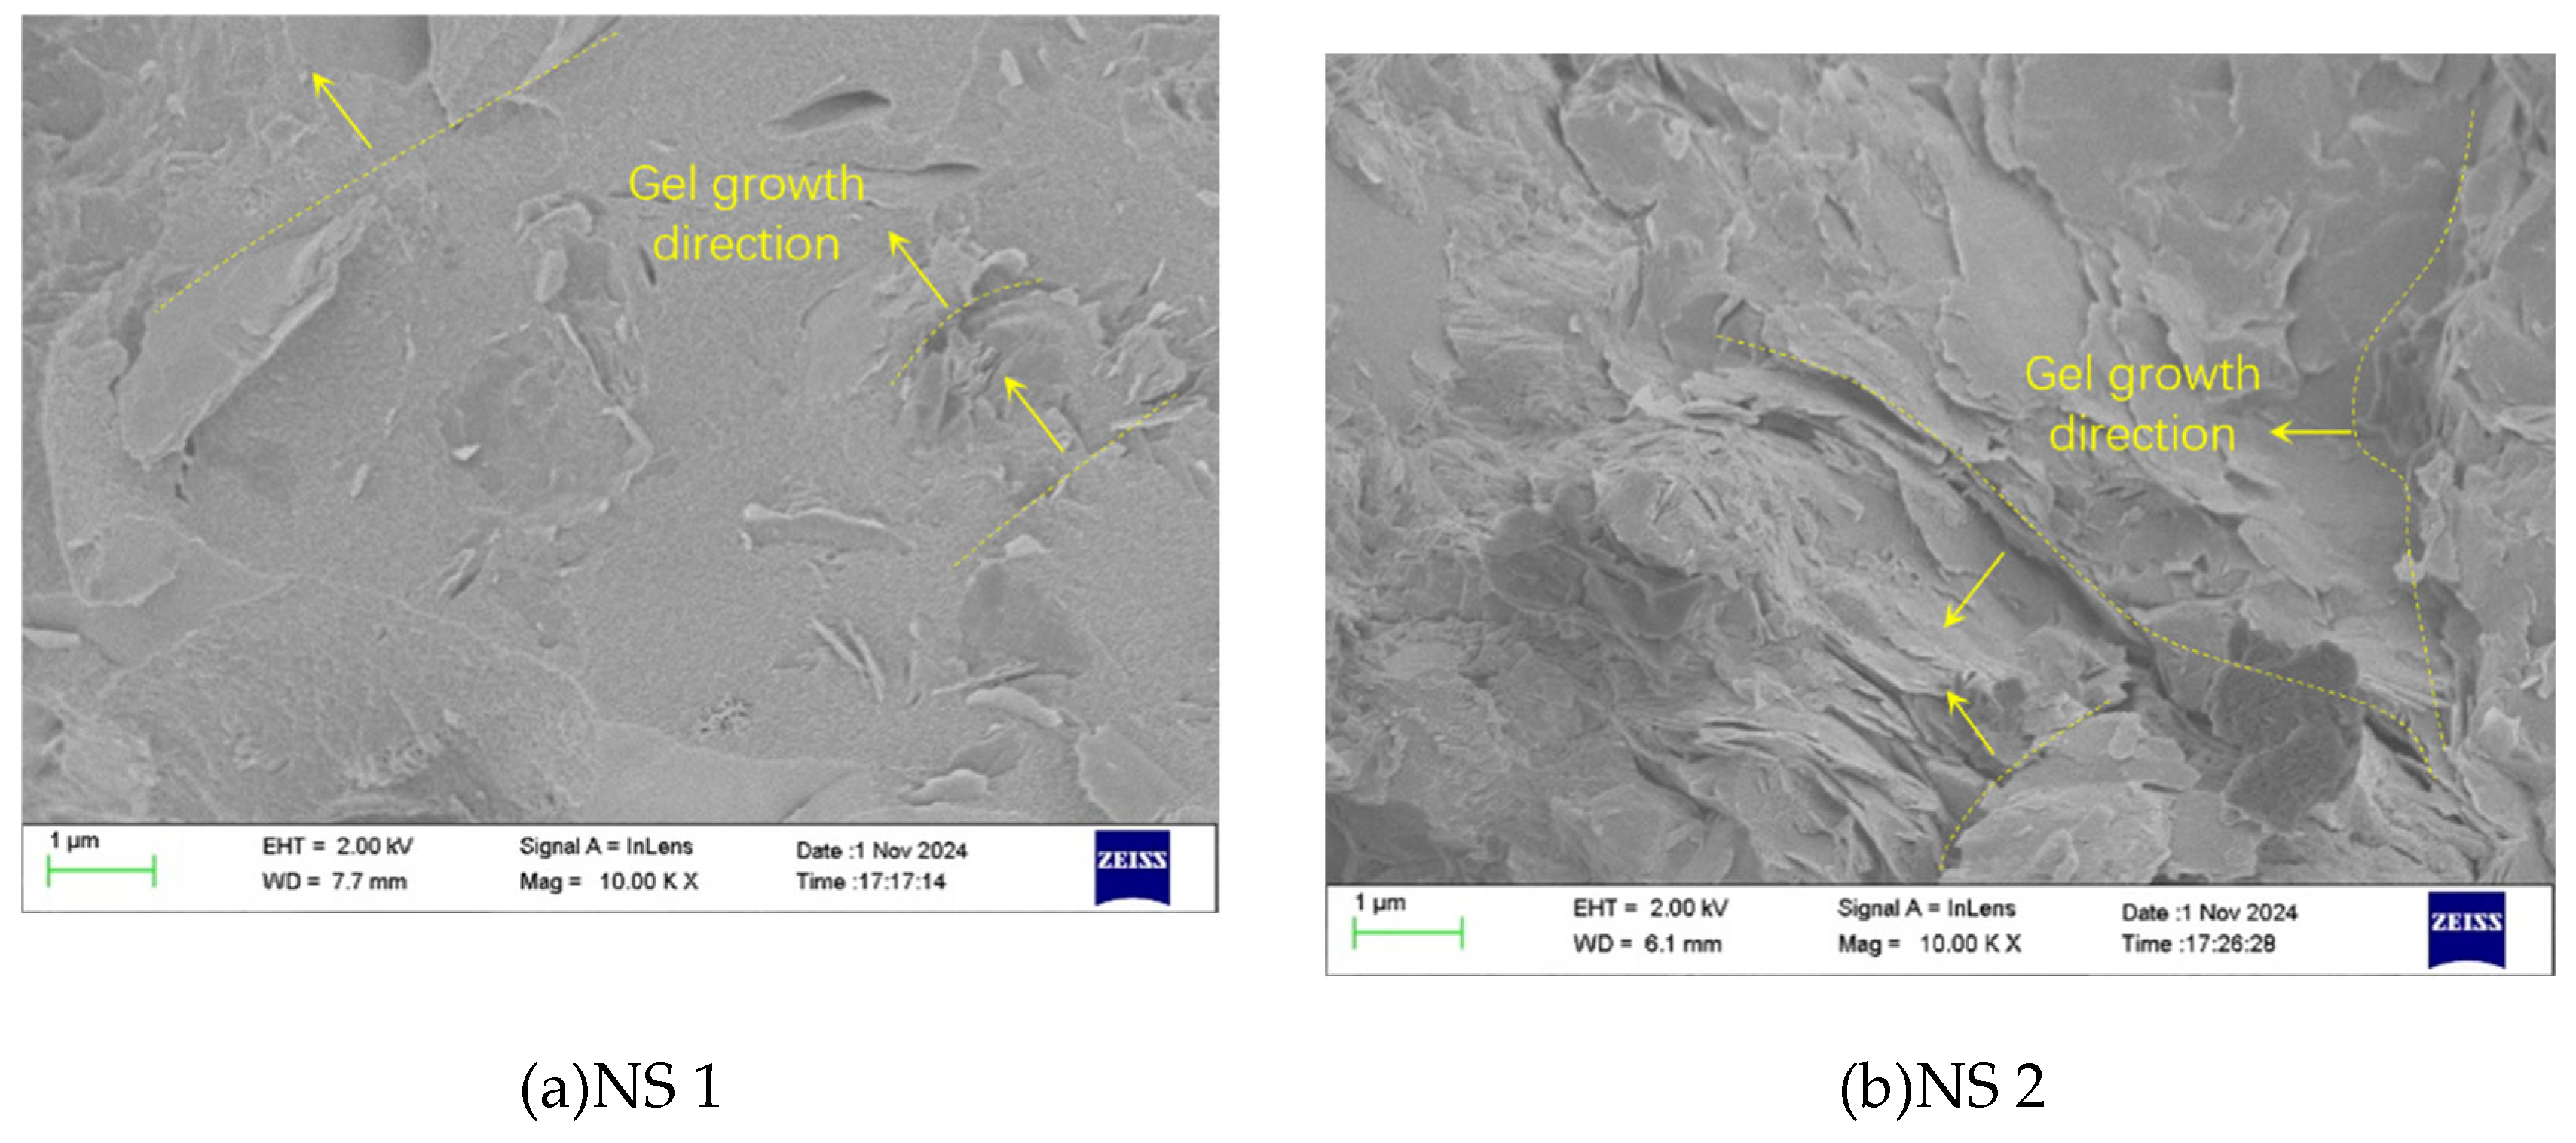
Figure 14.
XRD patterns.
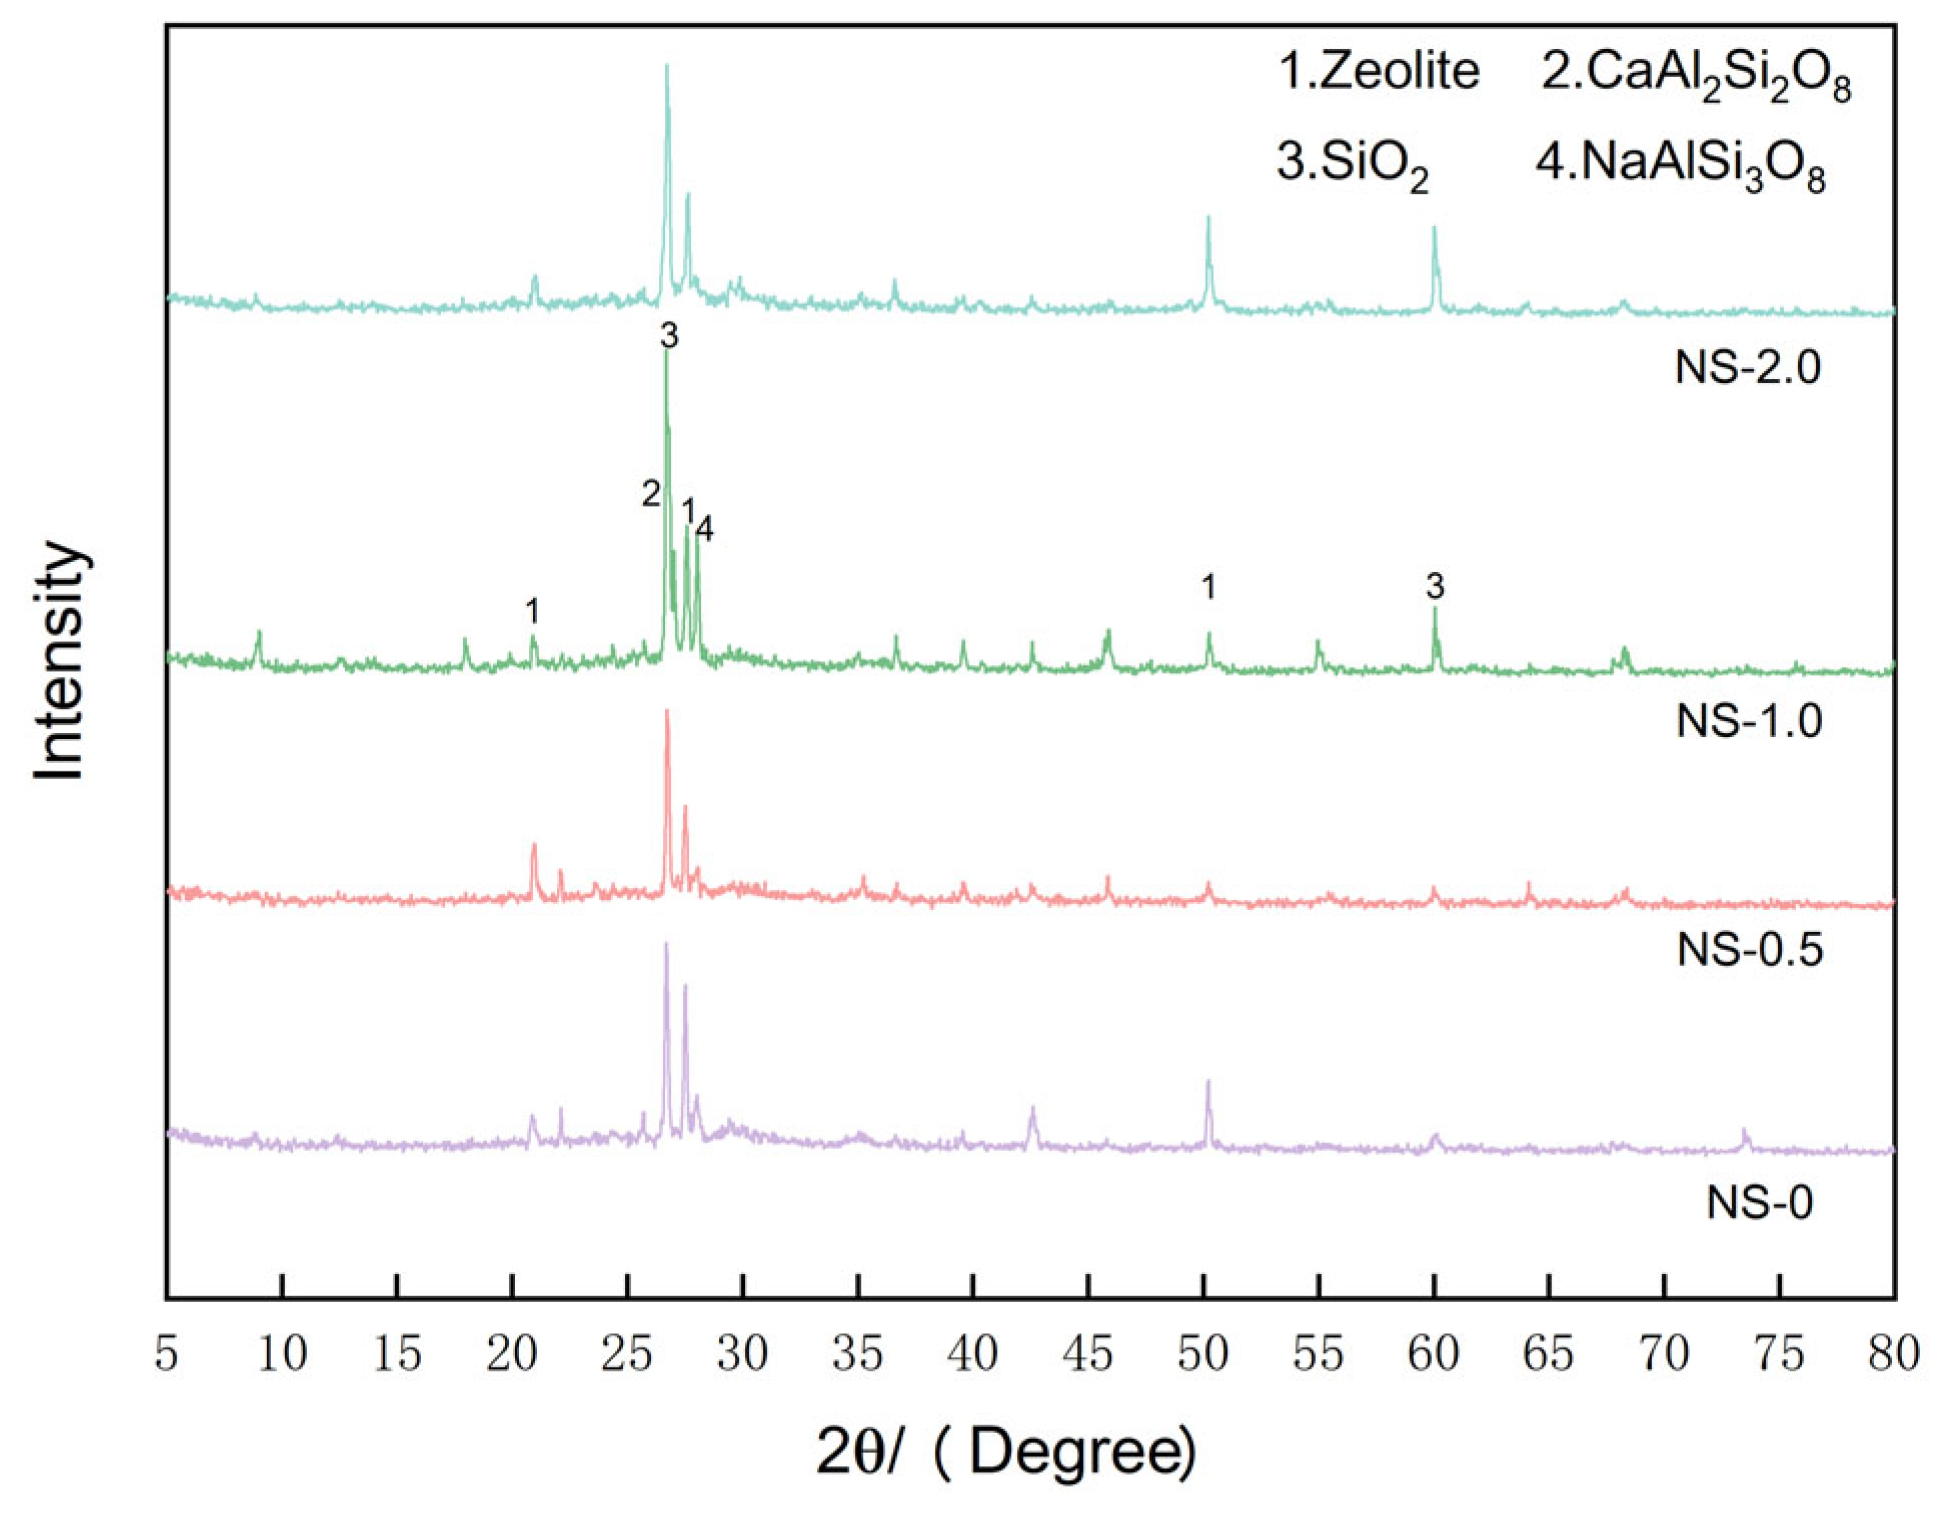
Figure 15.
Binary image of the sample.
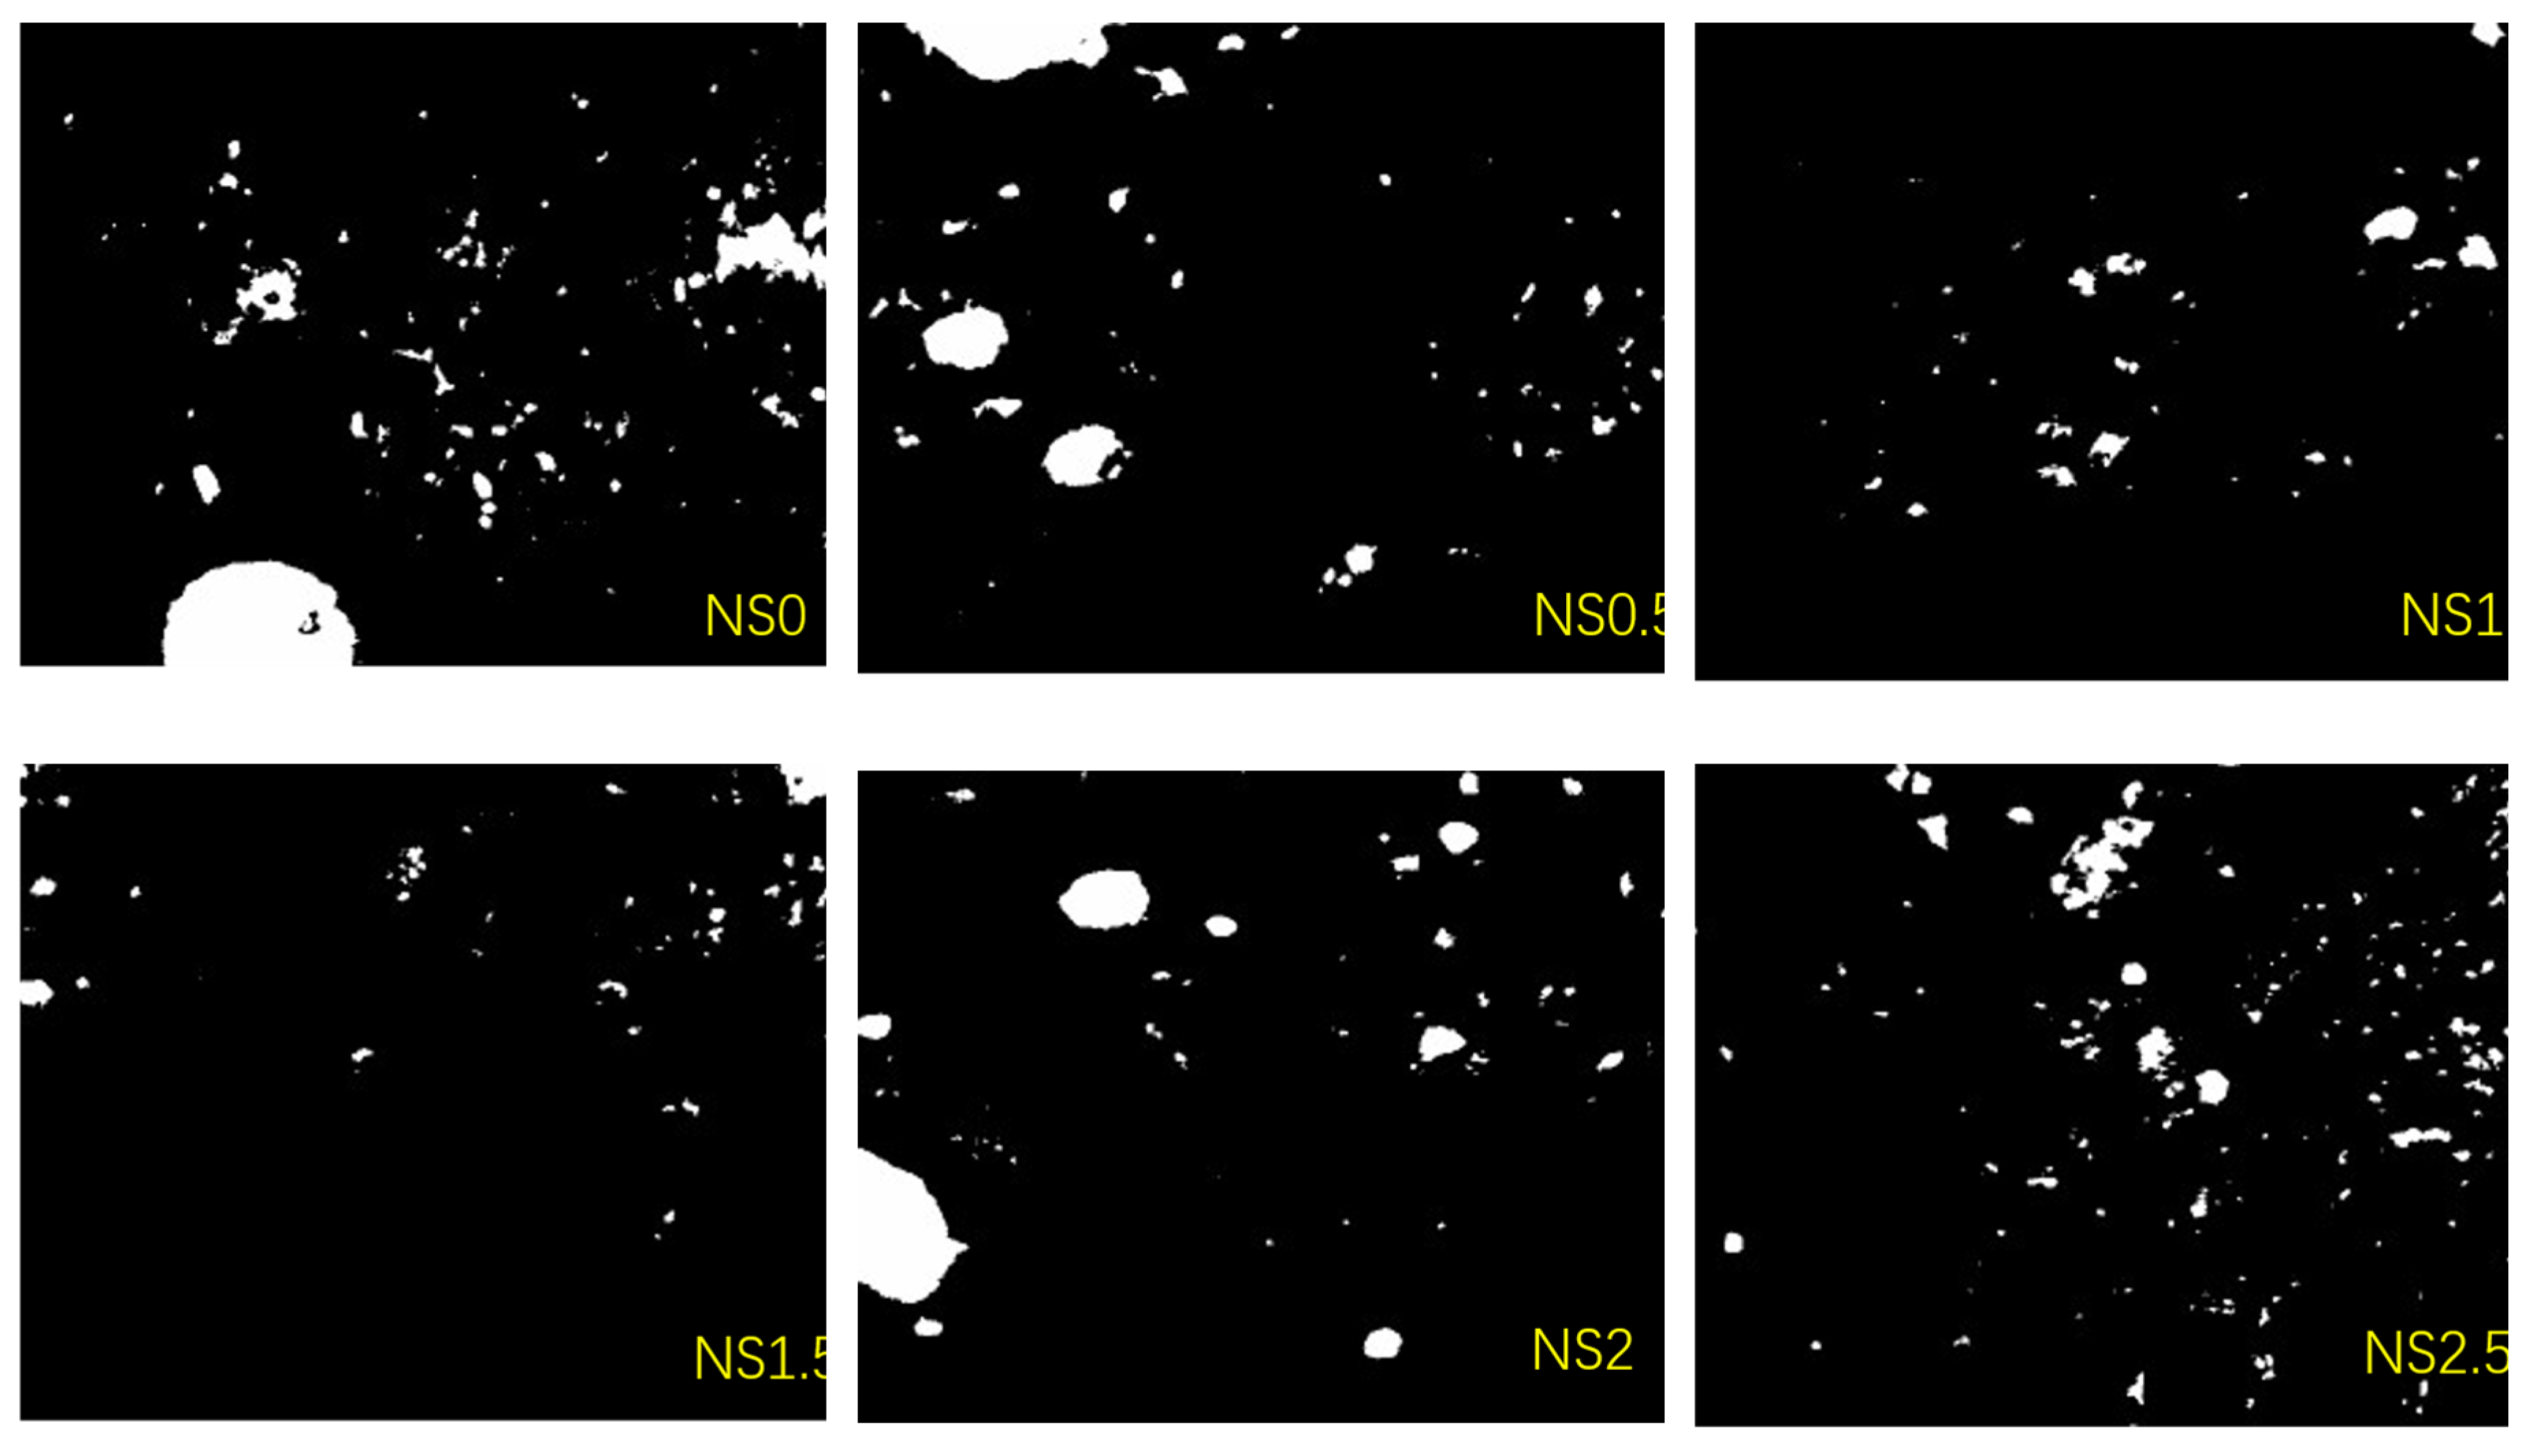
Figure 16.
Results of pore analysis.
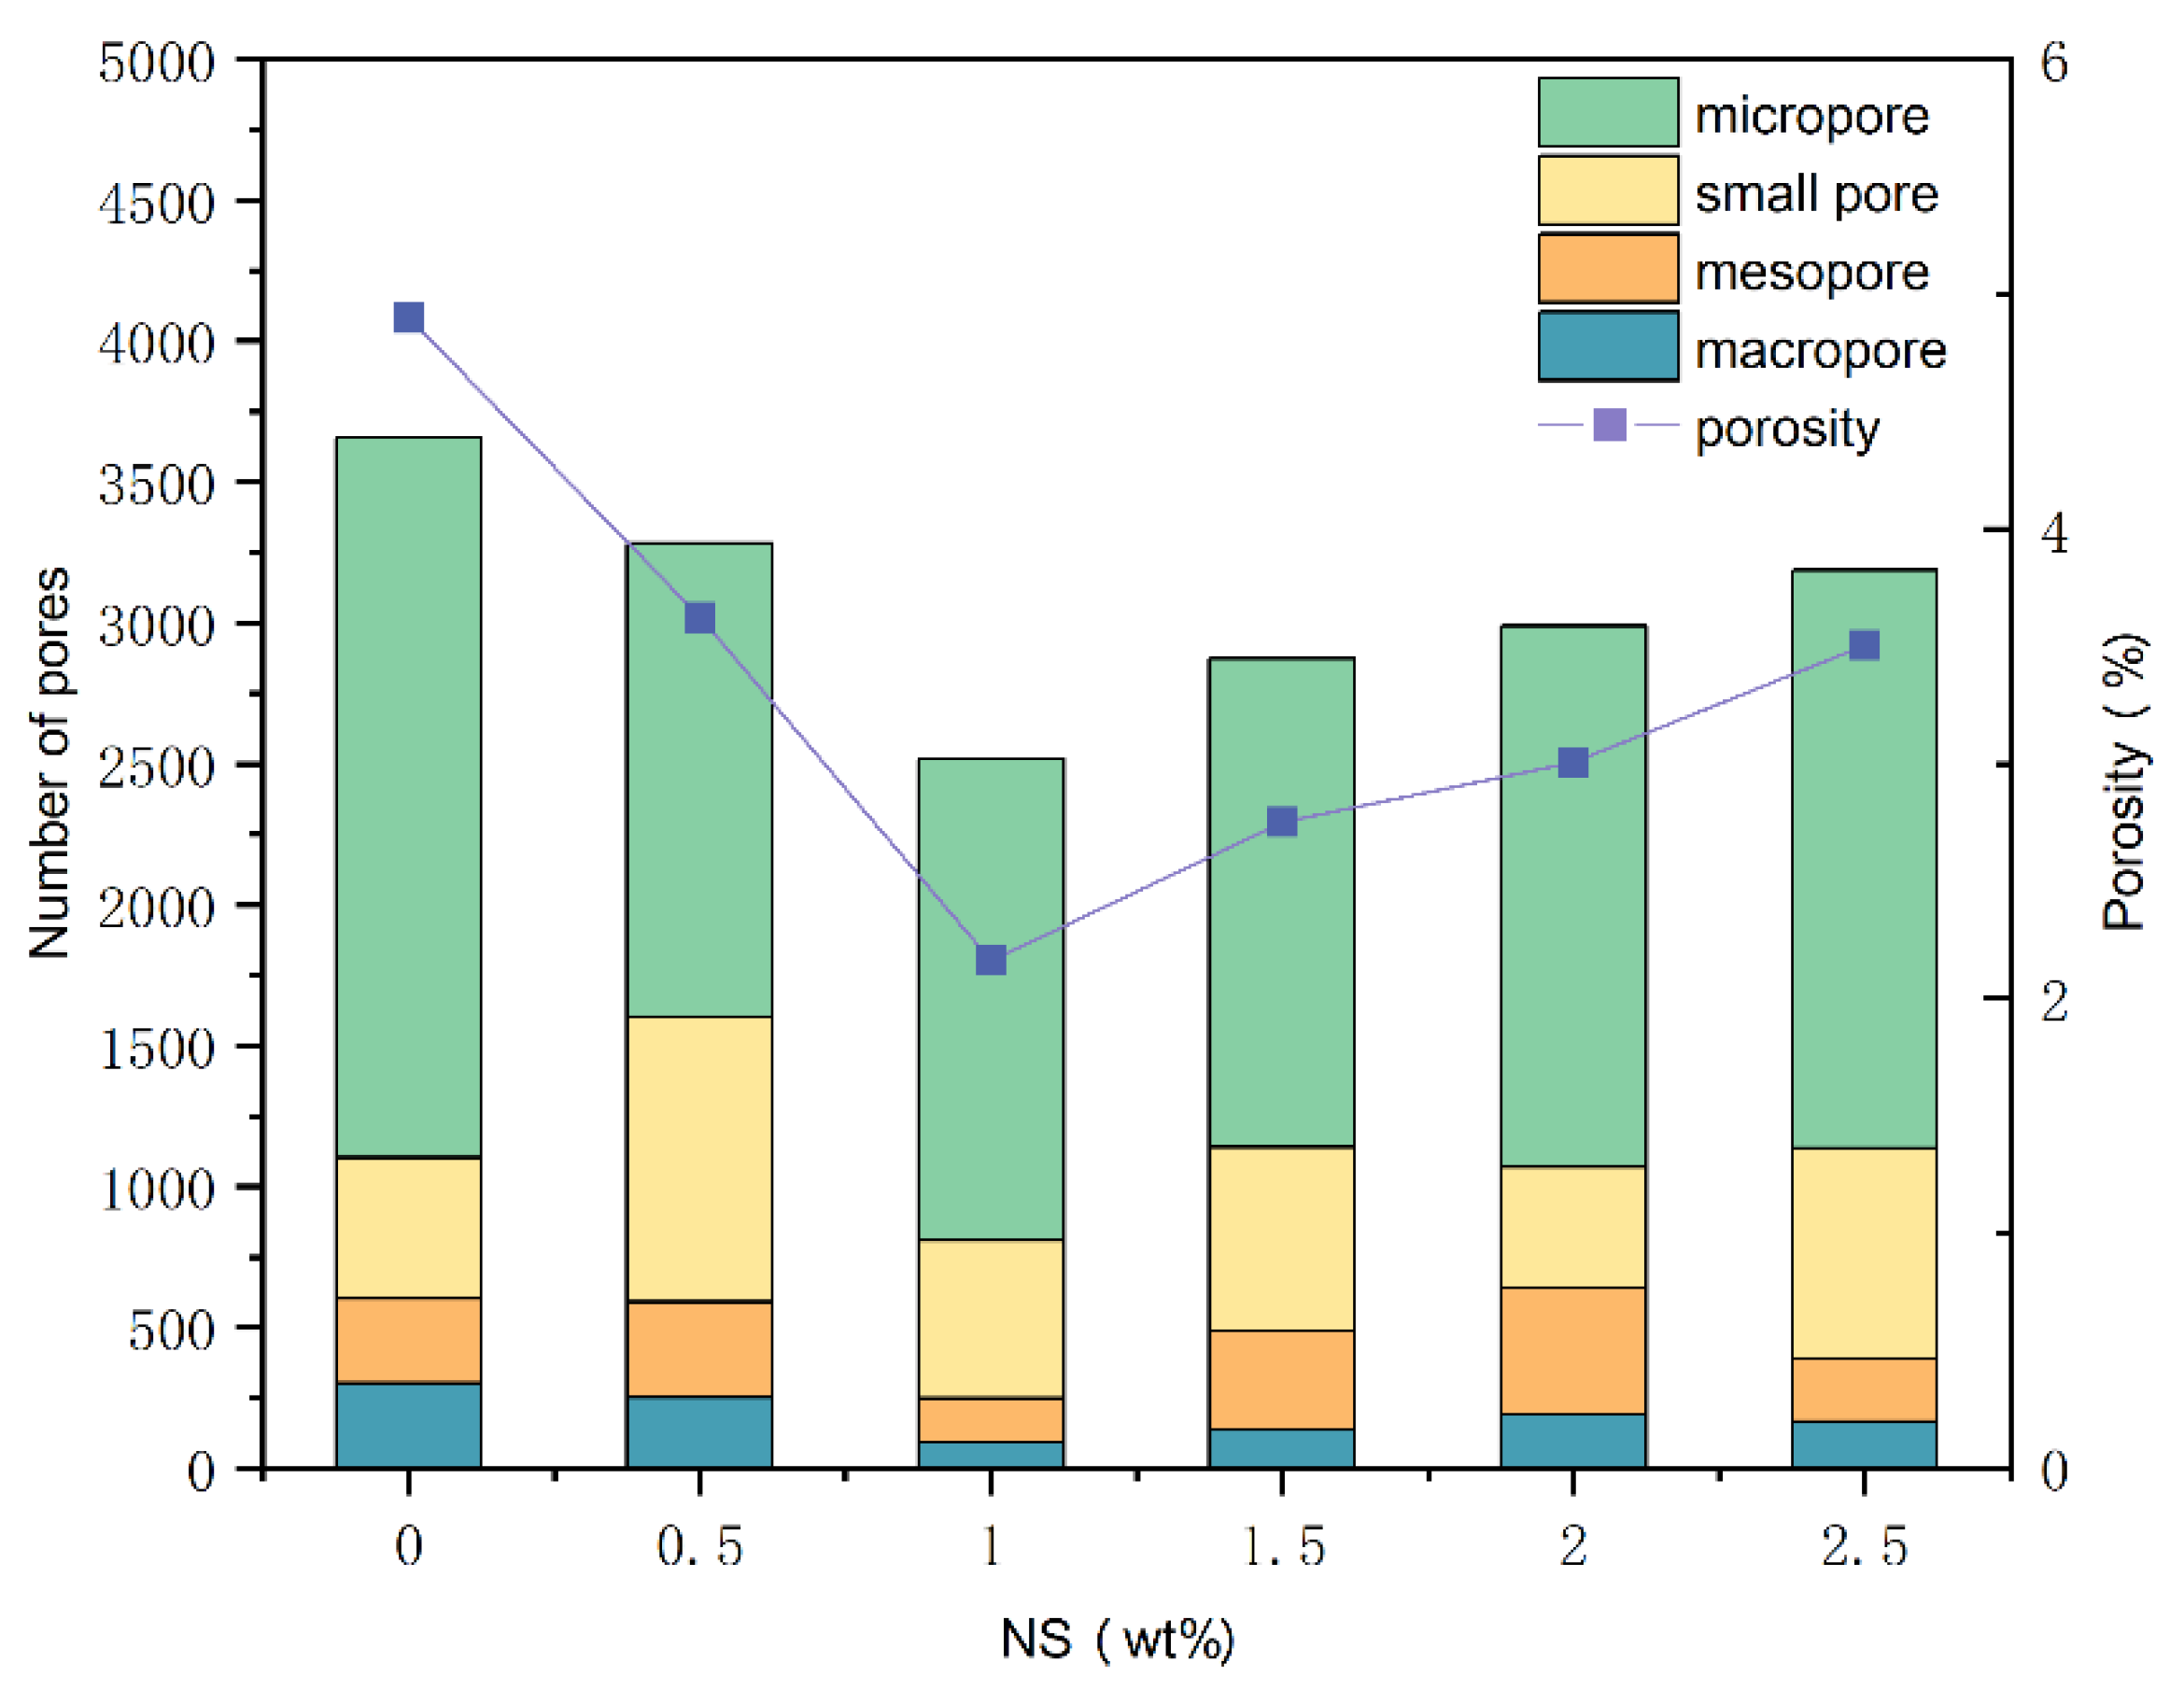
Figure 17.
Fitting diagram of correlation analysis between 28d compressive strength and pore characteristics.
Figure 17.
Fitting diagram of correlation analysis between 28d compressive strength and pore characteristics.
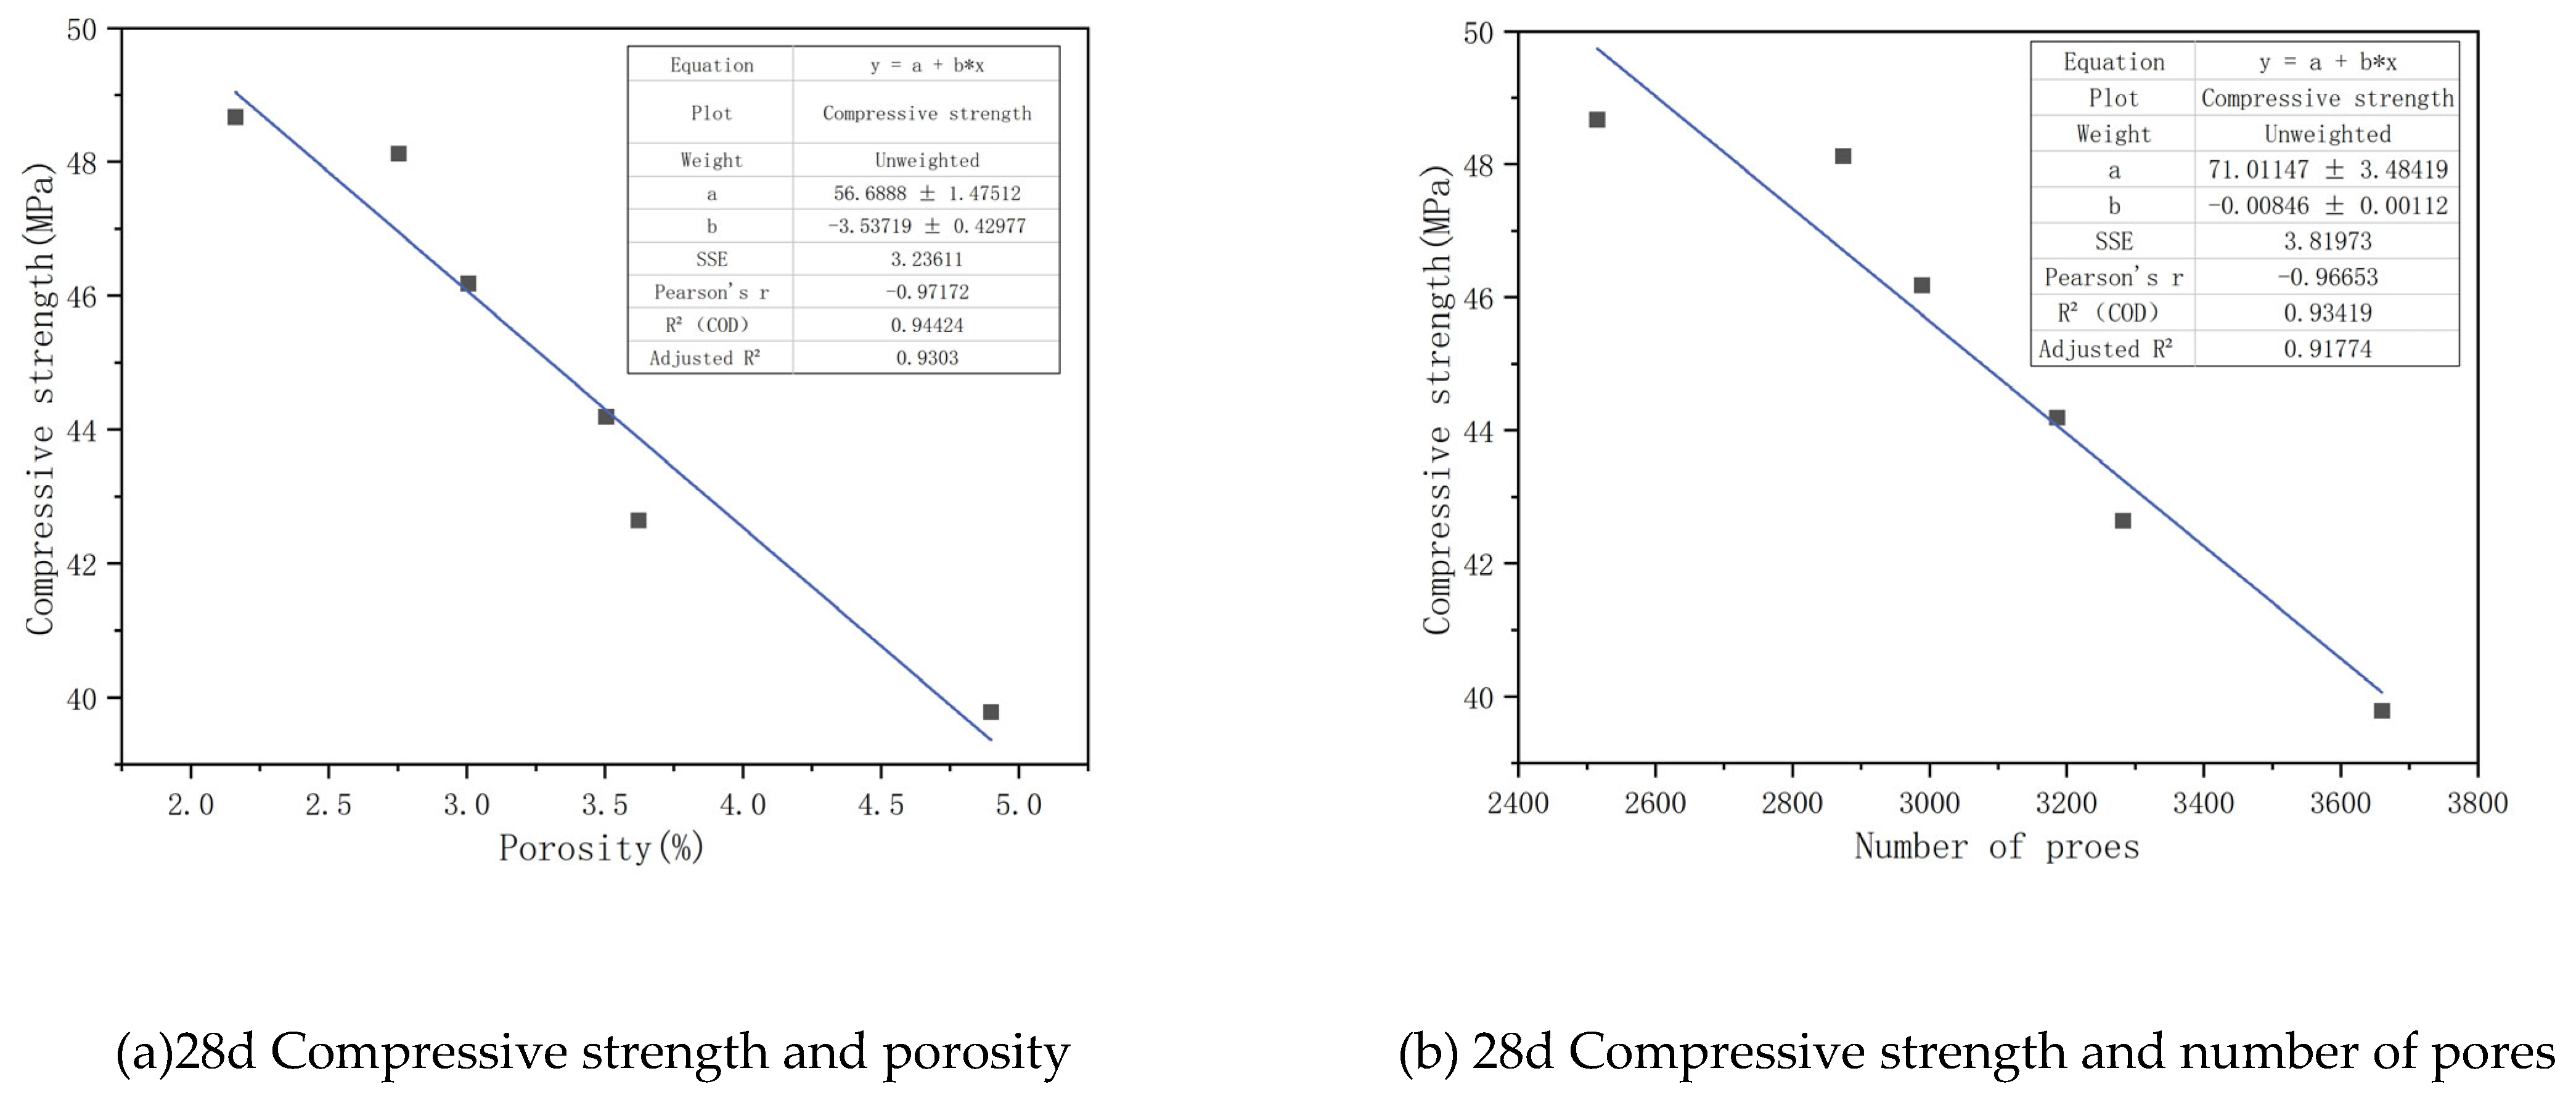
Figure 18.
Fitting graph of correlation analysis between compressive strength loss rate at different soaking ages and pore characteristics.
Figure 18.
Fitting graph of correlation analysis between compressive strength loss rate at different soaking ages and pore characteristics.
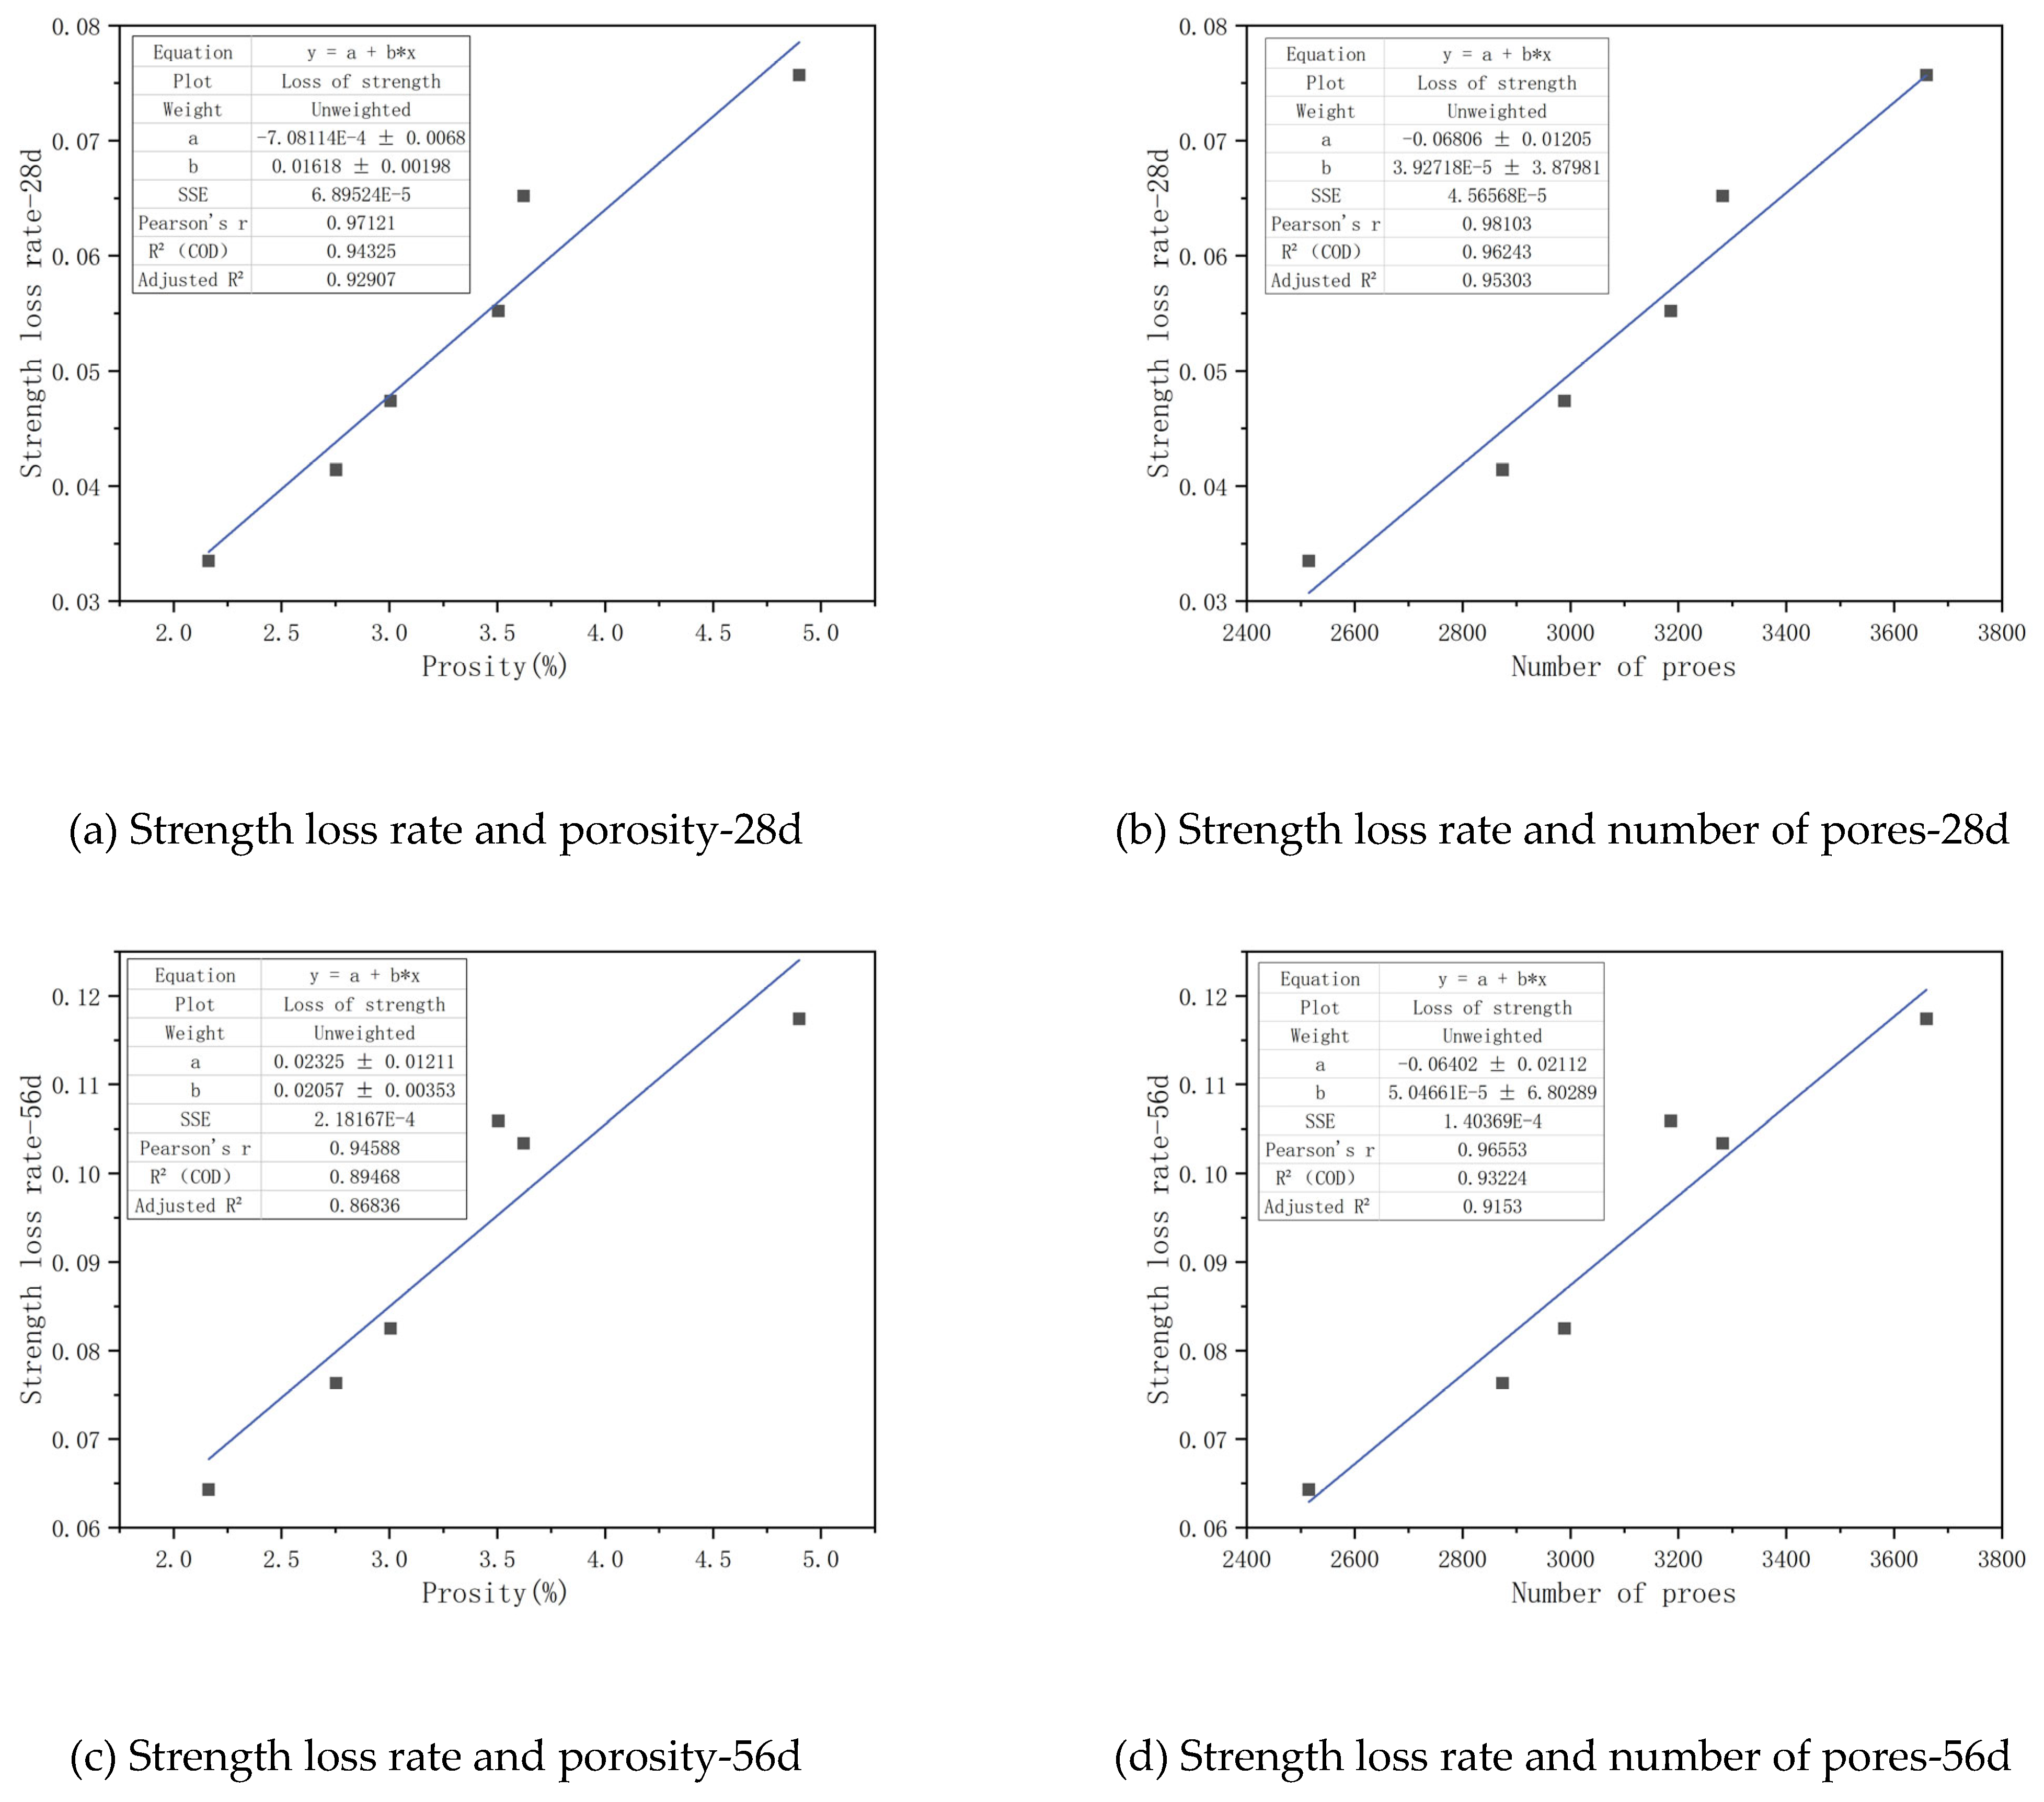
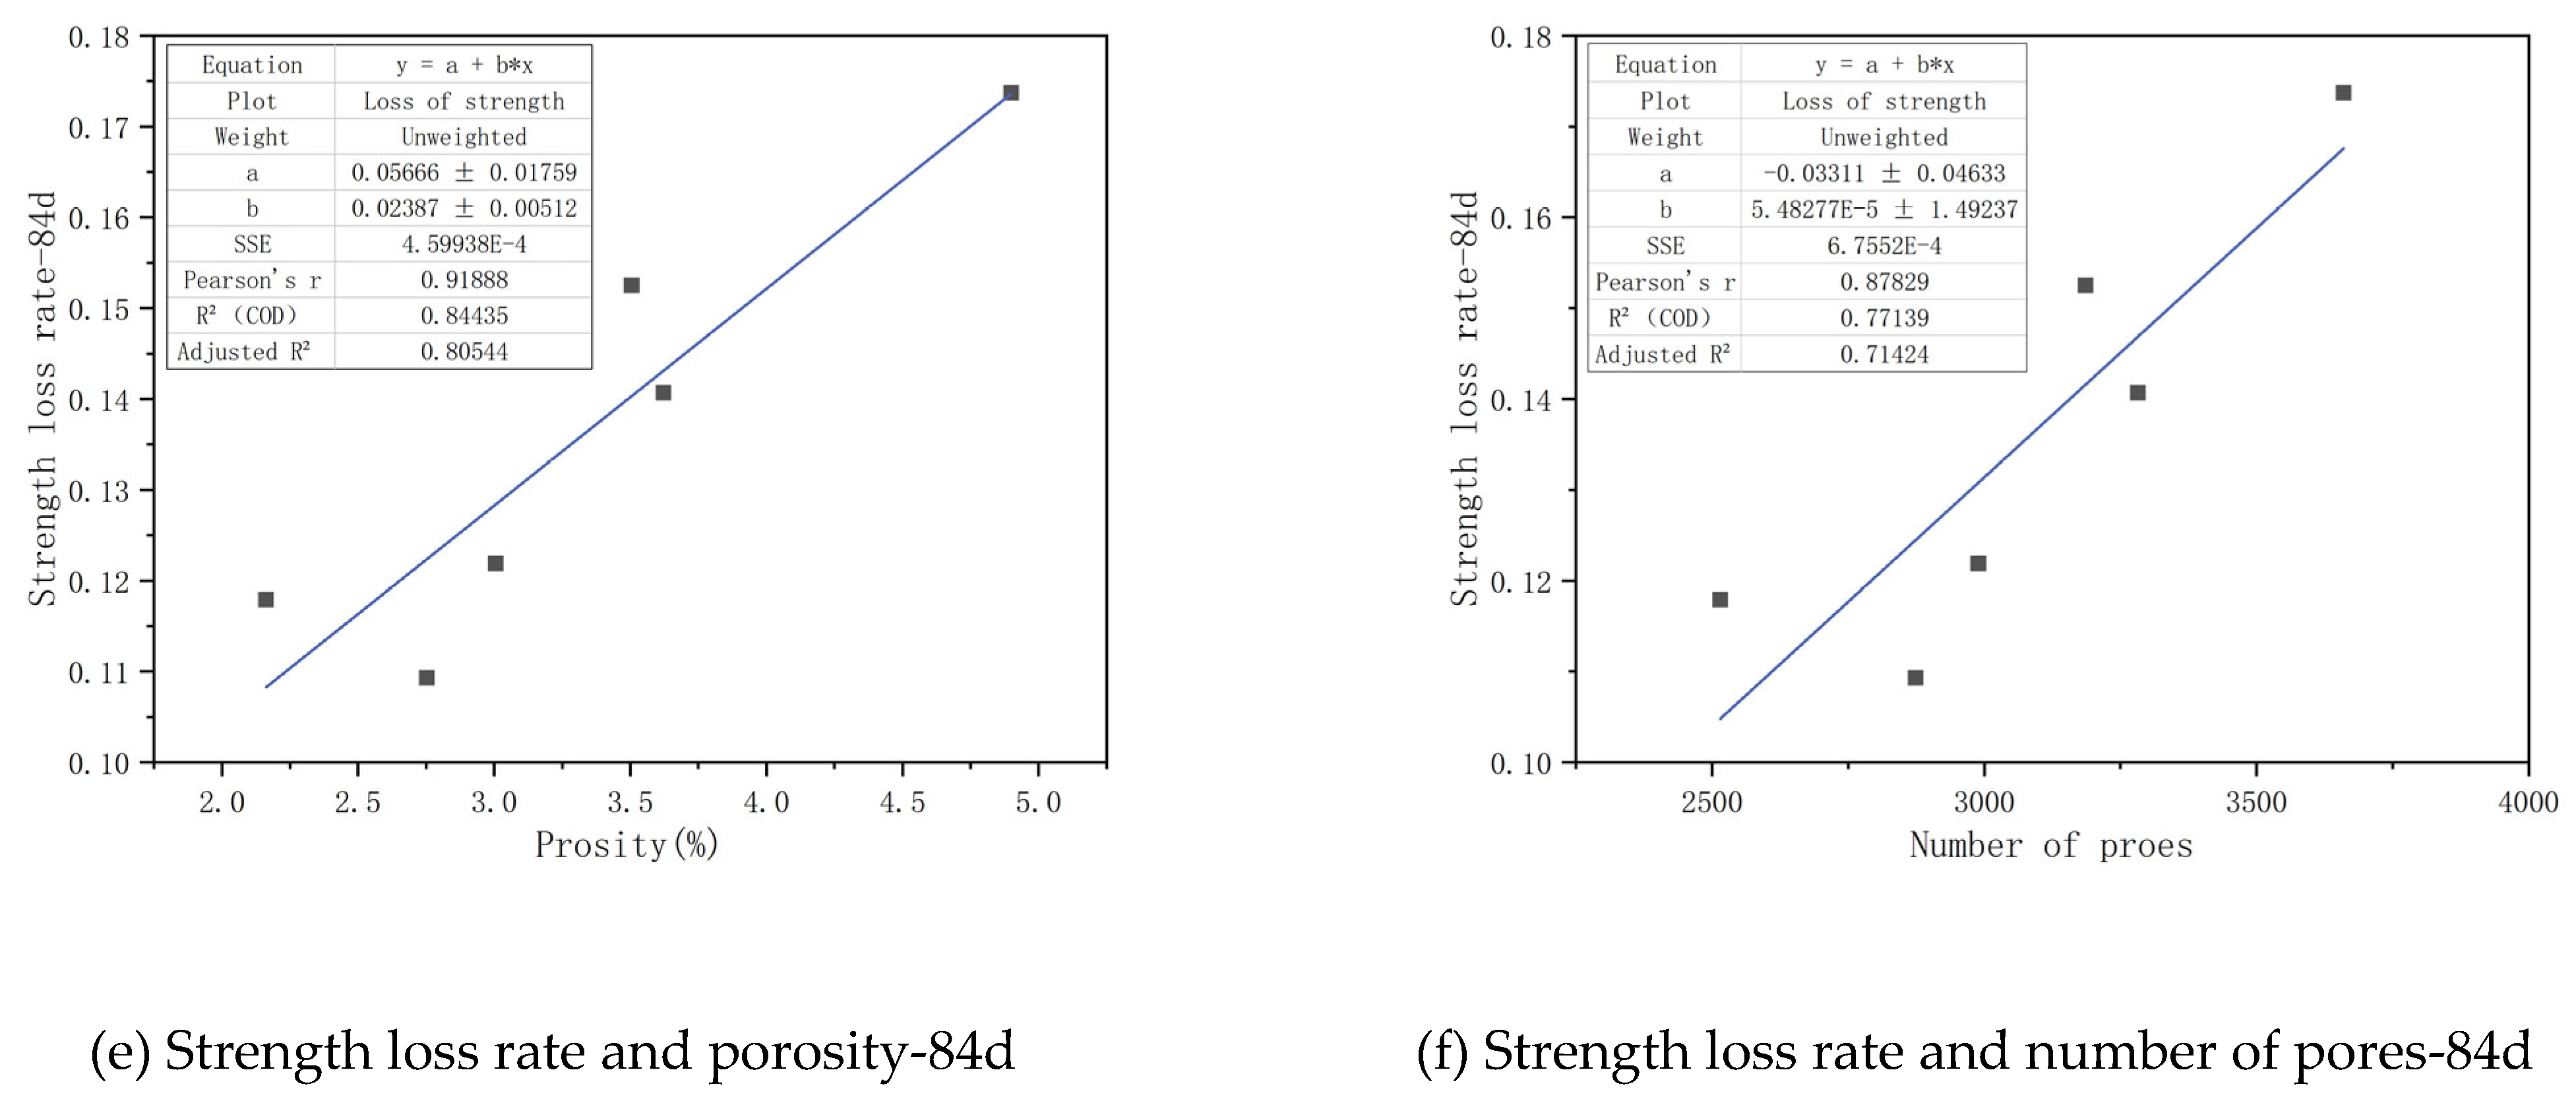

Table 1.
Chemical composition of raw materials (mass%).
| Materials | SiO2 | Al203 | CaO | Fe2O3 | Mg0 | Na0 | K2O |
| CG | 50.8 | 28.1 | 3.6 | 6.2 | 1.2 | 1.2 | 0.7 |
| BFS | 42.10 | 8.60 | 6.40 | 40.00 | 7.57 | - | - |
Table 2.
physical characteristics of NS.
| Particle size | Density (g/cm³) | Volume density (g/cm³) | Specific surface area (m²/g) | PH | purity(%) |
| 20nm | 2.2-2.6 | 0.06 | 240 | 7 | 99.9 |
Table 3.
Mix proportions of CGGC (Kg/m³).
| Test Group |
NS(wt%) | Coal gangue |
Slag | NaOH | Water glass |
River sand |
Coarse aggregate |
NS |
| CGGC | 0 | 214.3 | 214.3 | 41.1 | 180.2 | 651.5 | 1062.9 | 0 |
| NS-0.5 | 0.5 | 213.23 | 213.23 | 2.14 | ||||
| NS-1.0 | 1 | 212.16 | 212.16 | 4.29 | ||||
| NS-1.5 | 1.5 | 211.09 | 211.09 | 6.43 | ||||
| NS-2.0 | 2 | 210.01 | 210.01 | 8.57 | ||||
| NS-2.5 | 2.5 | 208.94 | 208.94 | 10.72 |
Table 4.
Morphology after sulfate erosion.
| Erosion period | 14d | 28d | 42d | 56d | 70d | 84d |
| CGGC | 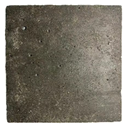 |
 |
 |
 |
 |
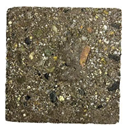 |
| NS-1-CGGC | 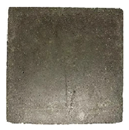 |
 |
 |
 |
 |
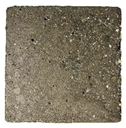 |
Table 5.
Fitting Parameters Table.
| NS (wt%) | a | b | R2 |
| 0 | 39.466 | -0.0784 | 0.98636 |
| 0.5 | 42.210 | -0.0679 | 0.97342 |
| 1 | 48.821 | -0.0647 | 0.97708 |
| 1.5 | 47.961 | -0.0594 | 0.98548 |
| 2 | 46.029 | -0.0668 | 0.99372 |
| 2.5 | 44.072 | -0.0810 | 0.99715 |
Table 6.
Classification Standards for Pores.
| Classification | Micropore | Small pore | Mesopore | Macropore |
| Equivalent pore diameter(μm) | 0~50 | 50~100 | 100~150 | >150 |
Disclaimer/Publisher’s Note: The statements, opinions and data contained in all publications are solely those of the individual author(s) and contributor(s) and not of MDPI and/or the editor(s). MDPI and/or the editor(s) disclaim responsibility for any injury to people or property resulting from any ideas, methods, instructions or products referred to in the content. |
© 2025 by the authors. Licensee MDPI, Basel, Switzerland. This article is an open access article distributed under the terms and conditions of the Creative Commons Attribution (CC BY) license (http://creativecommons.org/licenses/by/4.0/).
Copyright: This open access article is published under a Creative Commons CC BY 4.0 license, which permit the free download, distribution, and reuse, provided that the author and preprint are cited in any reuse.


