Submitted:
14 May 2025
Posted:
15 May 2025
Read the latest preprint version here
Abstract
In a world of rapid urbanisation and increasing global warming, Urban Heat Islands (UHIs) are posing as a hazard to public health, especially for vulnerable age groups. Given Milan's high urbanisation and scattered green infrastructure, Nature-Based Solutions (NBS) present a successful way to reduce the UHI effects. Geographic Information Systems (GIS) can help the targeted implementation and planning of NBS in urban areas. This research project develops a GIS-based model to overlap data about green infrastructure, UHI and density of vulnerable age groups in Milan. The aim is to assess the heat risk of urban areas with a high vulnerable population density in 2020 and 2030. A comprehensive literature review highlights the benefits and challenges of NBS. Land Surface Temperature (LST) maps using remote sensing are developed to identify spatial patterns of heat intensity in Milan on the hottest day measured in 2024 (31st of July). These are overlaid on demographic maps, derived from Nuclei di Identità Locale (NIL), to highlight the areas where vulnerable groups (children between 0 and 5 years old and elderly over 65 years old) are most at risk. The analysis identifies UHI hotspots in Milan, characterized by high temperatures (more than Milan’s average LST of 40.81°C), low vegetation cover, and vulnerable population.
Keywords:
climate change risks
; urban contest
; health
; children
; resilience
; GIS data
; risk maps
1. Introduction
Climate change is one of the most critical challenges of the last century that implicates ecosystems, economies, and societies. Urban areas, due to their density and excessive use of impermeable surfaces, are particularly vulnerable to its effects, especially with the Urban Heat Island (UHI) phenomenon, which intensifies temperatures in cities compared to their rural surroundings [1], [2]. This rise in urban temperature poses significant risks to public health, particularly for vulnerable age groups that are less able to adapt to extreme heat conditions, such as the elderly and young children [3,4,5,6,7,8].
In a global context of rising older population, the heat risks impose a growing concern, especially in densely populated cities in temperate climates where heat waves are increasingly frequent [7]. One out of six world inhabitants will be over 65 years old in 2050 according to United Nations prospects [9]. Regarding European Union (EU) inhabitants the older adult population (65+ years old) is premeditated to increase from 21.1% (94.3 million) at the beginning of 2022 to 31.5% in 2100 [10]. Therefore, the aim for reducing the heat related risks should be a priority for the public health and climate adaptation of cities [10,11,12].
More localized and data-driven approaches to climate adaptation are essential to mitigate these risks [14], [15]. The integration of remote sensing, demographic data, and Geographic Information Systems (GIS) offers a tool to map and understand spatial patterns of heat exposure and vulnerability [13], [16].
The aim of this research is to develop a methodology based on open-source GIS data to assess and identify urban areas with the highest health risks for vulnerable populations during heat waves and associated urban heat island (UHI) phenomena. Specifically, the study proposes a GIS-based methodology that combines Urban Heat Island data, demographic information, and green infrastructure mapping of Milan by districts. Being able to combine different datasets, GIS allows for a comprehensive analysis of a city’s environmental context, therefore facilitating policymakers to identify high risk areas, evaluate their effectiveness of NBS and develop a targeted implementation strategy [17], [18].
Milan was selected as the case study due to its significant climatic challenges. The city experiencing intense UHI effects and being among the European cities with the hottest recorded urban areas [19]. Its geographical position in the Pianura Padana and surrounded by the Alps, limits natural air circulation, facilitating heat retention. Using high-resolution satellite imagery and localised population estimates, the system identifies urban areas where vulnerable populations are at risk currently and in the future. A recent spatial analysis study on cardiovascular health emergencies was done in Milan highlighting the impact of urban features like temperature, access to drinking water fountains and population composition on the city’s heat vulnerability [20], emphasizing the need for more targeted strategies to protect the groups that are at risk.
2. Materials and Methods
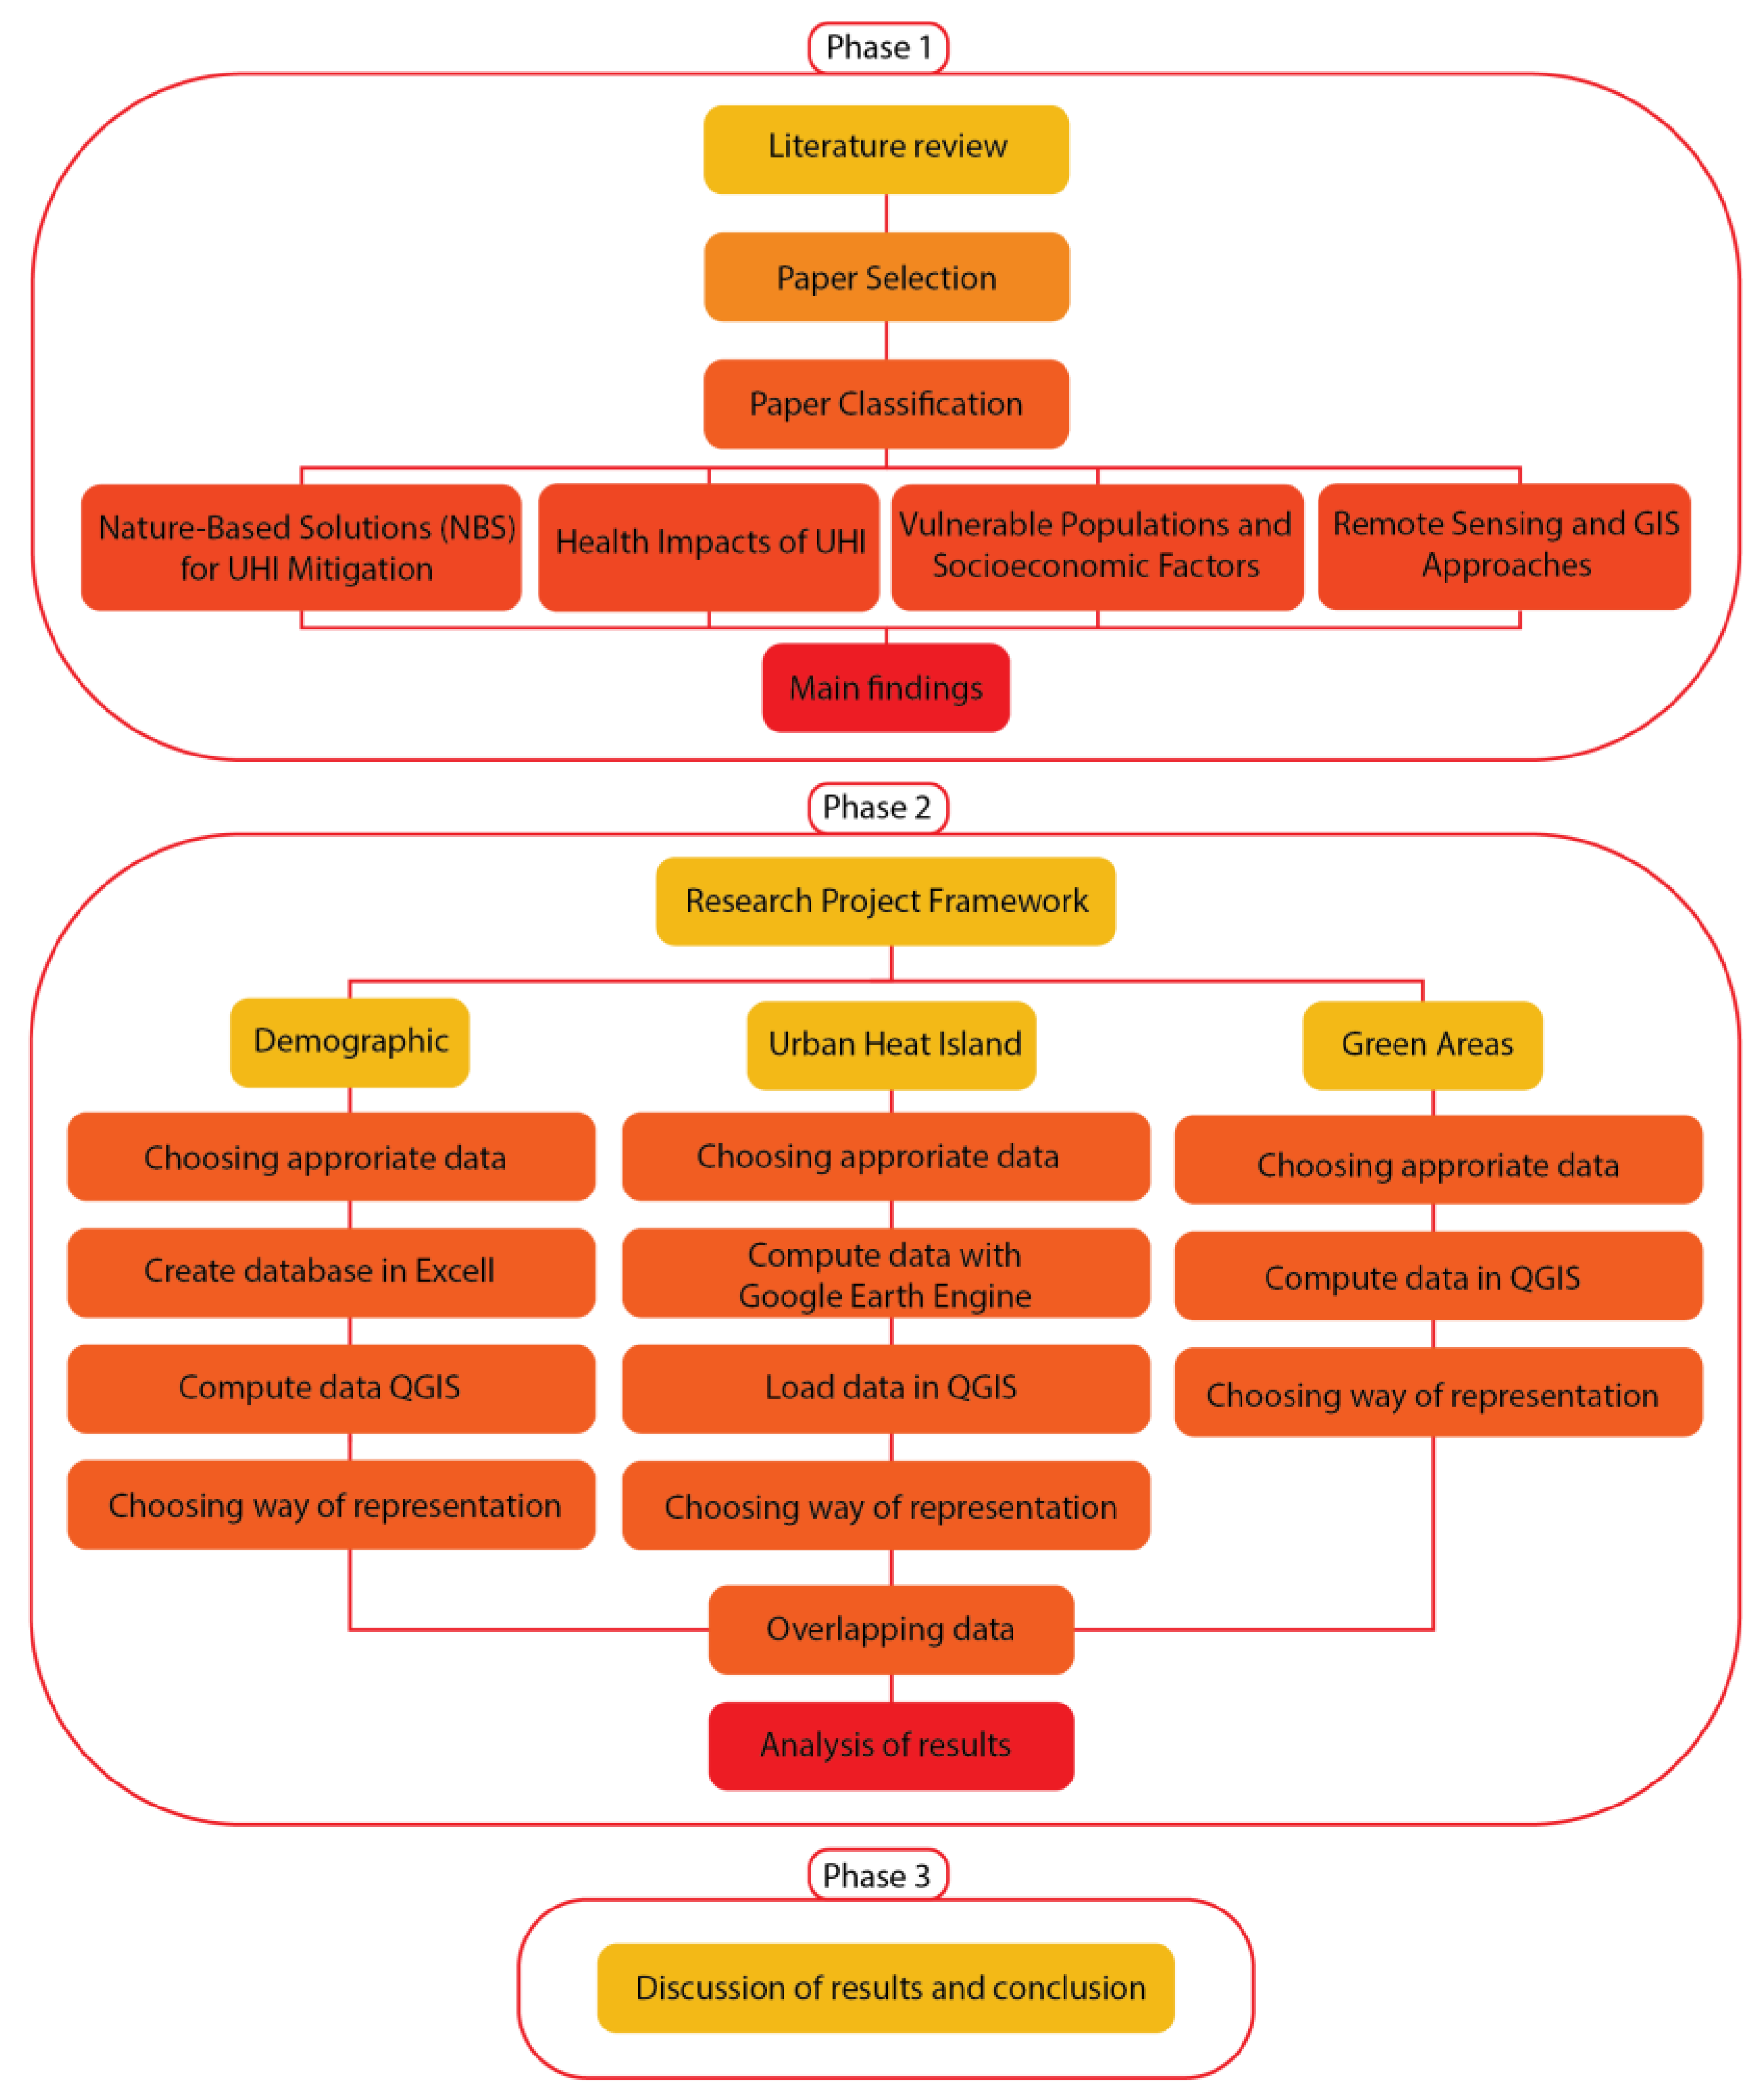
The research project was structured progressively in three main parts: 1) literature review; 2) methodology of spatial mapping and analysis; 3) Application and discussion of results for understanding the relationship between UHI and the vulnerable age groups in Milan. The phases of this project build upon each other, combining scientific research, spatial data analysis and public health issues to create a complete assessment of the risk of heat exposure and potential mitigation approaches.
The study initiates with a broad literature review, considering existing papers on climate change, UHI effects, nature-based solutions (NBS), and their implications for health. The review also assesses the role of remote sensing and GIS-based methodologies in UHI analysis, underlining other studies that incorporate demographic data to assess vulnerability. This initial work guarantees that the project relies on previous knowledge while identifying gaps that show the necessity for further spatial analysis.
Through this analysis, the most appropriate sources and GIS-based data transfer methodologies for the research were identified.
Subsequently, the research focuses on the application of the methodology selected for mapping and on the analysis of the UHI distribution in Milan, considering the spatial distribution of vulnerable people. Using Landsat 8 satellite imagery, land surface temperature (LST) and UHI have been extracted and processed in GIS software. The analysis is based on Nuclei di Identità Locale (NIL), a more detailed and targeted administrative boundary system of zoning and gathering demographic data in Milan. To continue the analysis, these maps will be overlaid with demographic data from the NIL database, helping the identification of areas where high temperatures overlap with the density of vulnerable age groups in the current scenario and for future projections (2030).
The final phase comprises the analysis and interpretation of spatial mapping results. This phase has been crucial for the assessment of the areas of heat exposure, the relationship between UHI and vulnerable communities, and the role of green infrastructures in mitigating extreme heat.
Figure 1.
Research methodology framework. Personal elaboration of the author.
3. Results
To better understand the risks maps, the context of the calculations that lead up to the final values need to be comprehended first.
For this risk assessment, it has been important to divide the city into neighbourhoods, for evaluating both the density of vulnerable populations (children and the elderly) and Land Surface Temperature (LST) during heat waves in smaller and homogenous areas. Milan is already splitted into Local Identity Units (Nuclei di Identità Locale – NILs), thus, they were used as the spatial units for this analysis. For determing the Land Surface Temperature (LST), surface temperature data from the Landsat 8 satellite (open-source data) was used, specifically from the day identified as the hottest perceived heat wave in Milan in 2024 (July 31st). The satellite data have then been processed for generating thermal maps using Google Earth Engine (GEE).
When computing the maps in Google Earth Engine (GEE), the code also computed the average Land Surface Temperature (LST) of Lombardia which is 33.96°C and of Milan, 40.81°C. Firstly, these results indicate a significant temperature difference of +6.85°C between Milan and its surrounding Lombardia region. This highlights the fact that Milan is itself, a heat island in the north of Italy due to the major urbanization and high density of impermeable land cover comparing to surrounding areas that benefit from vegetation and its evaporative cooling. Furthermore, was highlighted substantial temperature variations within Milan. To analyze this, as mentioned before in the methodology, the UHI index was computed for each NIL. For more comprehensive understanding and reading of the values shown on the map, the UHI values were converted back to degrees Celsius using the standard deviation of LST in Milan, 5.14°C, a value computed in GEE.
The results show a broad range of temperatures between the NILs. When reading this map, the UHI index has the baseline of 0.00 representing the citywide mean temperature on the 31st of July, of 40.81°C. As shown in the legend in Figure 2, the UHI index ranges from -0.92 to 1.47 which is the equivalent of ranging from 36.07°C to 48.37°C in land surface temperature. This means the coolest NIL is 4.37°C cooler than Milan’s average of 40.81°C and the hottest NIL is 7.56°C more than the average.
To evaluate the UHI’s risk, another Excel database was made with the densities of vulnerable population per age group per NIL using public demographic open sources data. For each vulnerable group, GIS maps were developed showing the population density per NIL for the years 2020 and 2030. Then, an overlay analysis was performed for each NIL, comparing vulnerable age groups with corresponding UHI values. This led to the creation of four maps: Urban Heat Island intensity and density of children (aged 0–5) per NIL in 2020 (Figure 2) and 2030; and Urban Heat Island intensity and density of the elderly (aged 65+) per NIL in 2020 (Figure 3) and 2030.
To provide a further comparison table, a comprehensive risk index for children and the elderly was calculated by combining UHI intensity data with demographic data in Excel. This allowed to identify the NILs with the highest risk within the vulnerable demographic density table, highlighting the most heat-exposed neighborhoods.
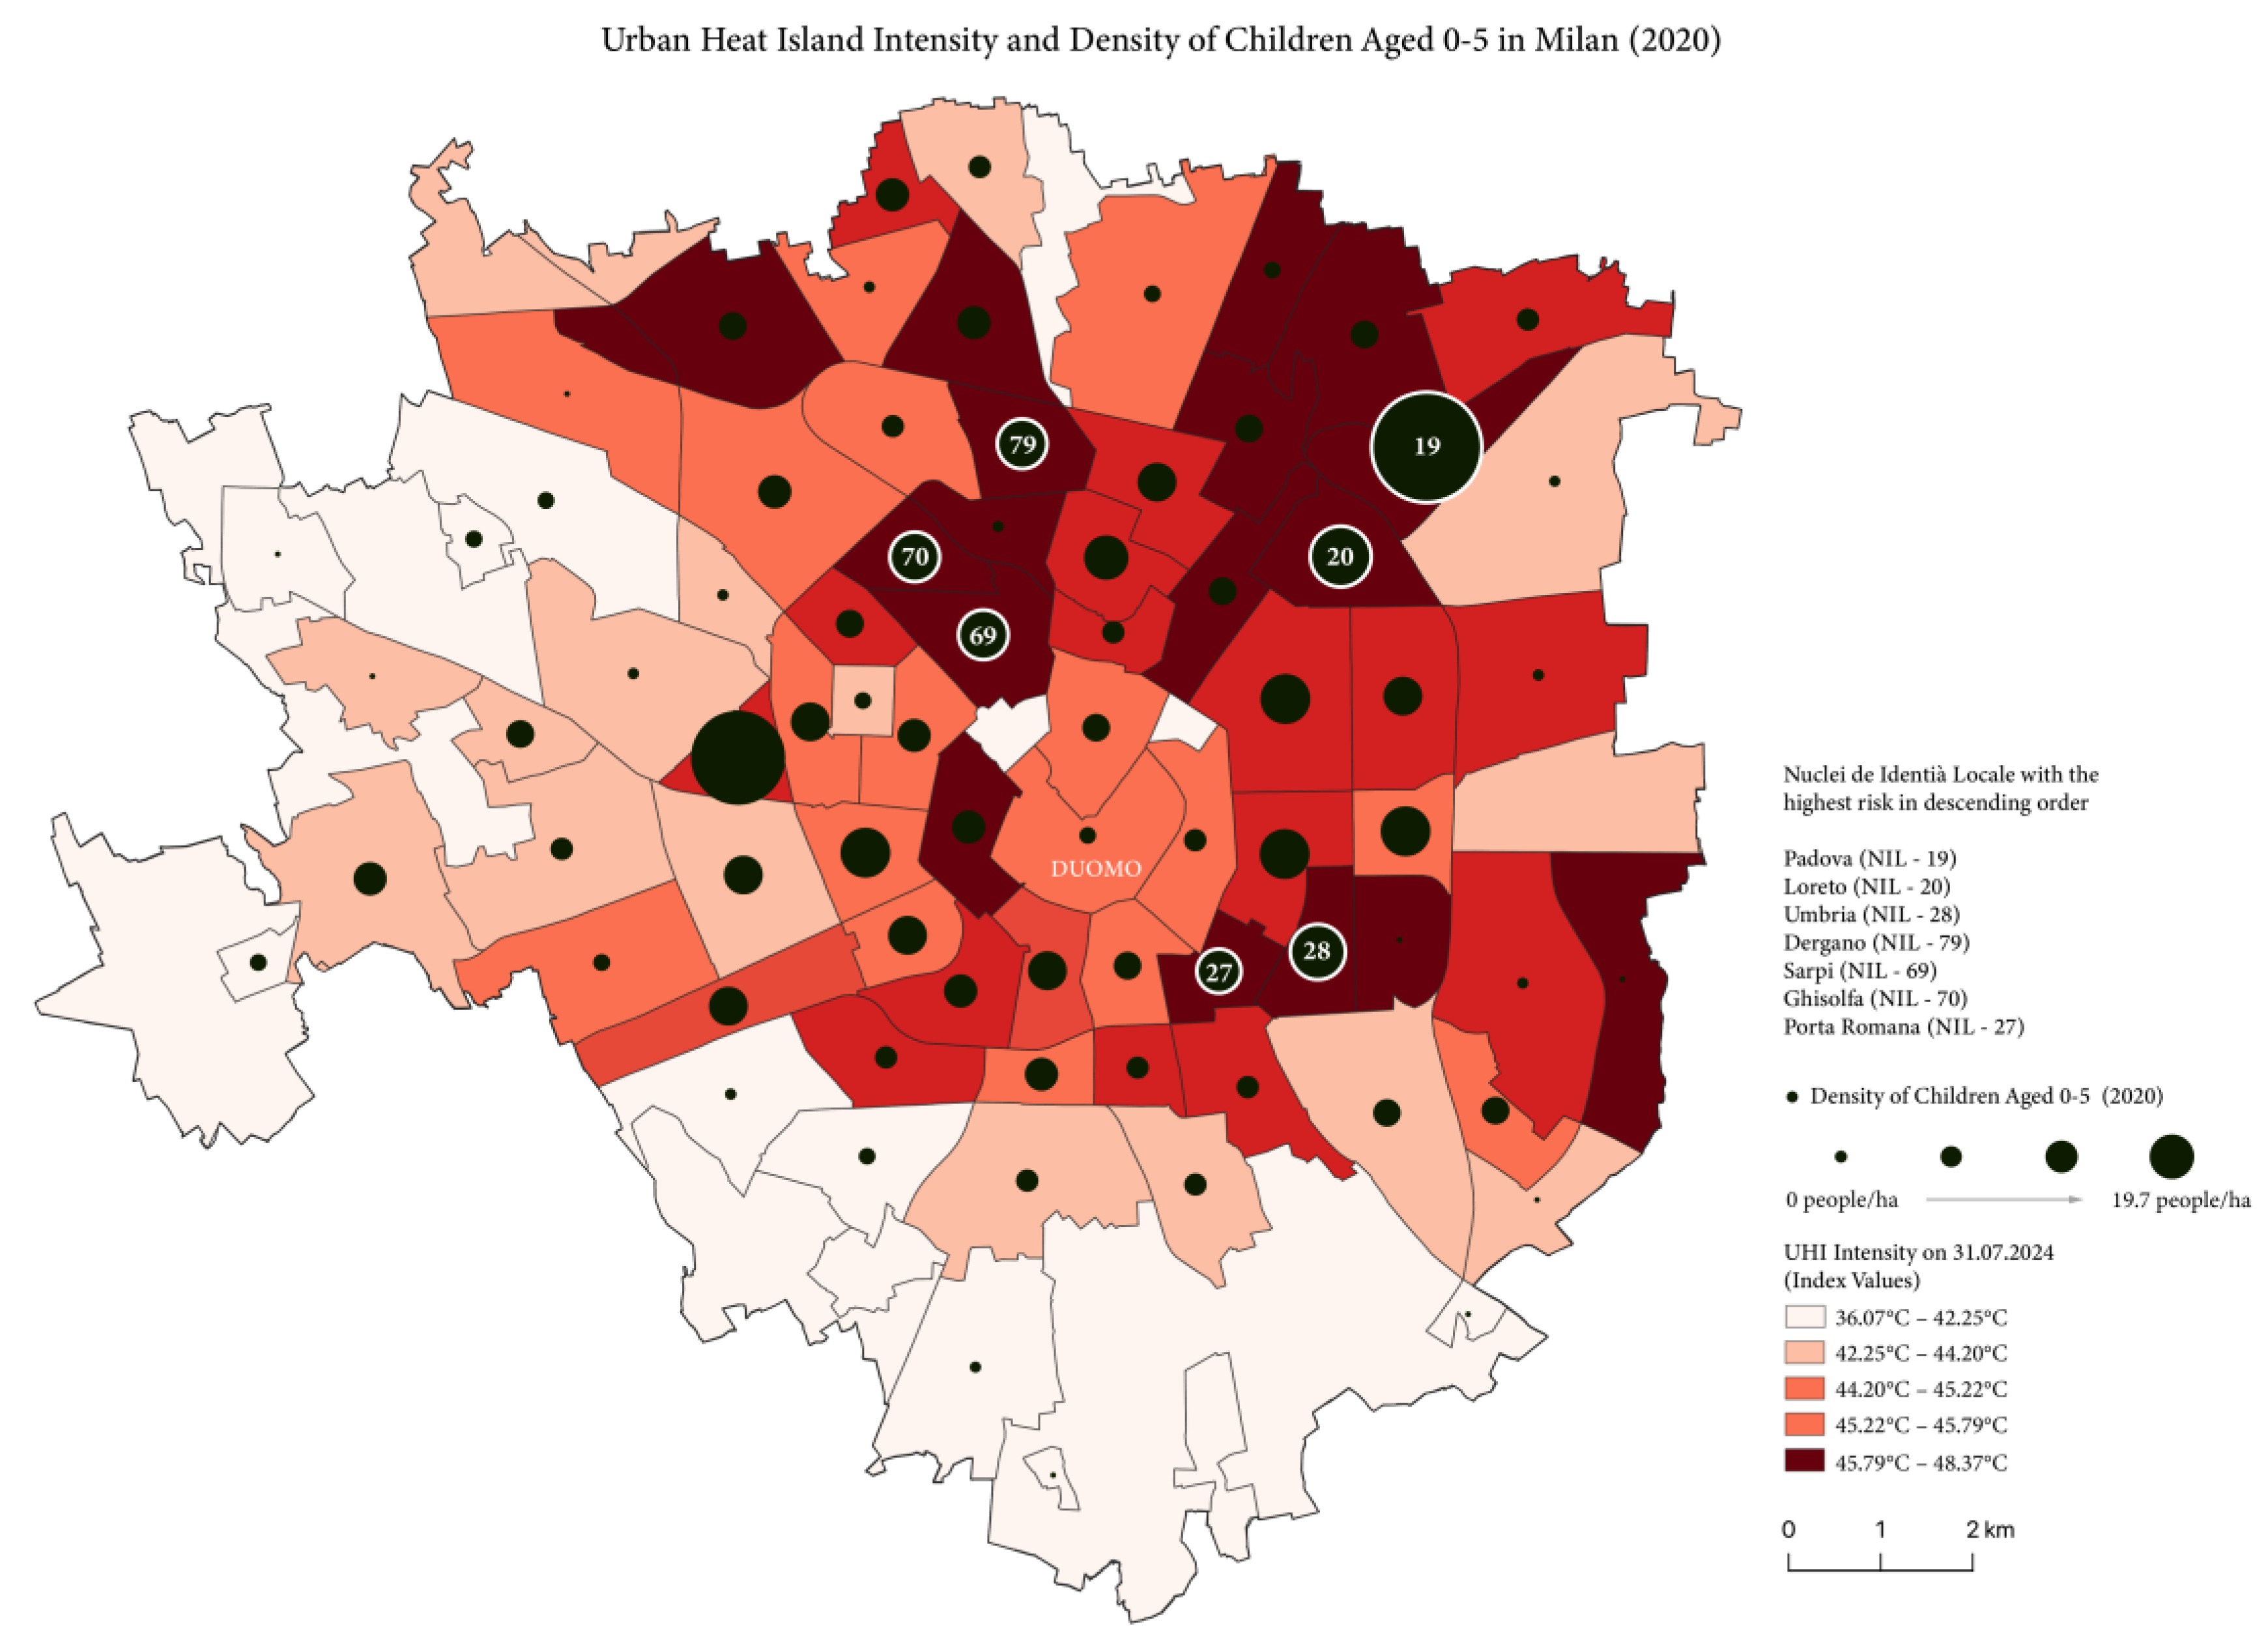
In figure 2 the Urban Heat Island (UHI) intensity across Milan’s NIL districts data is overlaid with the dark circles representing the density of children aged 0–5 years (2020), with bigger circles indicating higher density. The map highlights Padova as the most critical NIL, where both the UHI index and the density of young children are particularly high. In descending order of risk, the other precarious neighborhoods are Loreto (NIL - 20), Umbria (NIL - 28), Dergano (NIL – 79), Sarpi (NIL - 69), Ghisolfa (NIL - 70), and Porta Romana (NIL - 27).
Reading this map, it is understandable that the NILs with highest density of children aged 0-5 are Padova and San Siro. In addition, San Siro is quite suffering from higher urban heat island effects too. This map also clearly illustrates that the other NILs characterized by high percentage of children are living in zones with the highest UHI recorded.
Another crucial aspect to highlight is that the hottest NILs are located in the northern and eastern part of the city, while the ones in southern and western sides (which are close to the big green area of the Parco Agricolo Sud Milano), turned out to be less critical neighbourhoods. Particularly, the hottest area in Milan is Magenta (NIL – 7), followed by Centrale (NIL – 10), Greco (NIL – 13) and Bicocca (NIL – 15). Moreover, Magenta (NIL – 7) has even a relatively high concentration of elderly that is projected to have a significant growth in 2030.
In the risk maps showing the projection of the population density for children in 2030, the critical NILs remain relatively stable, being the same as in 2020.
Figure 2.
Urban Heat Island intensity and Density of children aged 0-5 recorded in 2020 per NIL. Personal elaboration of the author.
Figure 2.
Urban Heat Island intensity and Density of children aged 0-5 recorded in 2020 per NIL. Personal elaboration of the author.
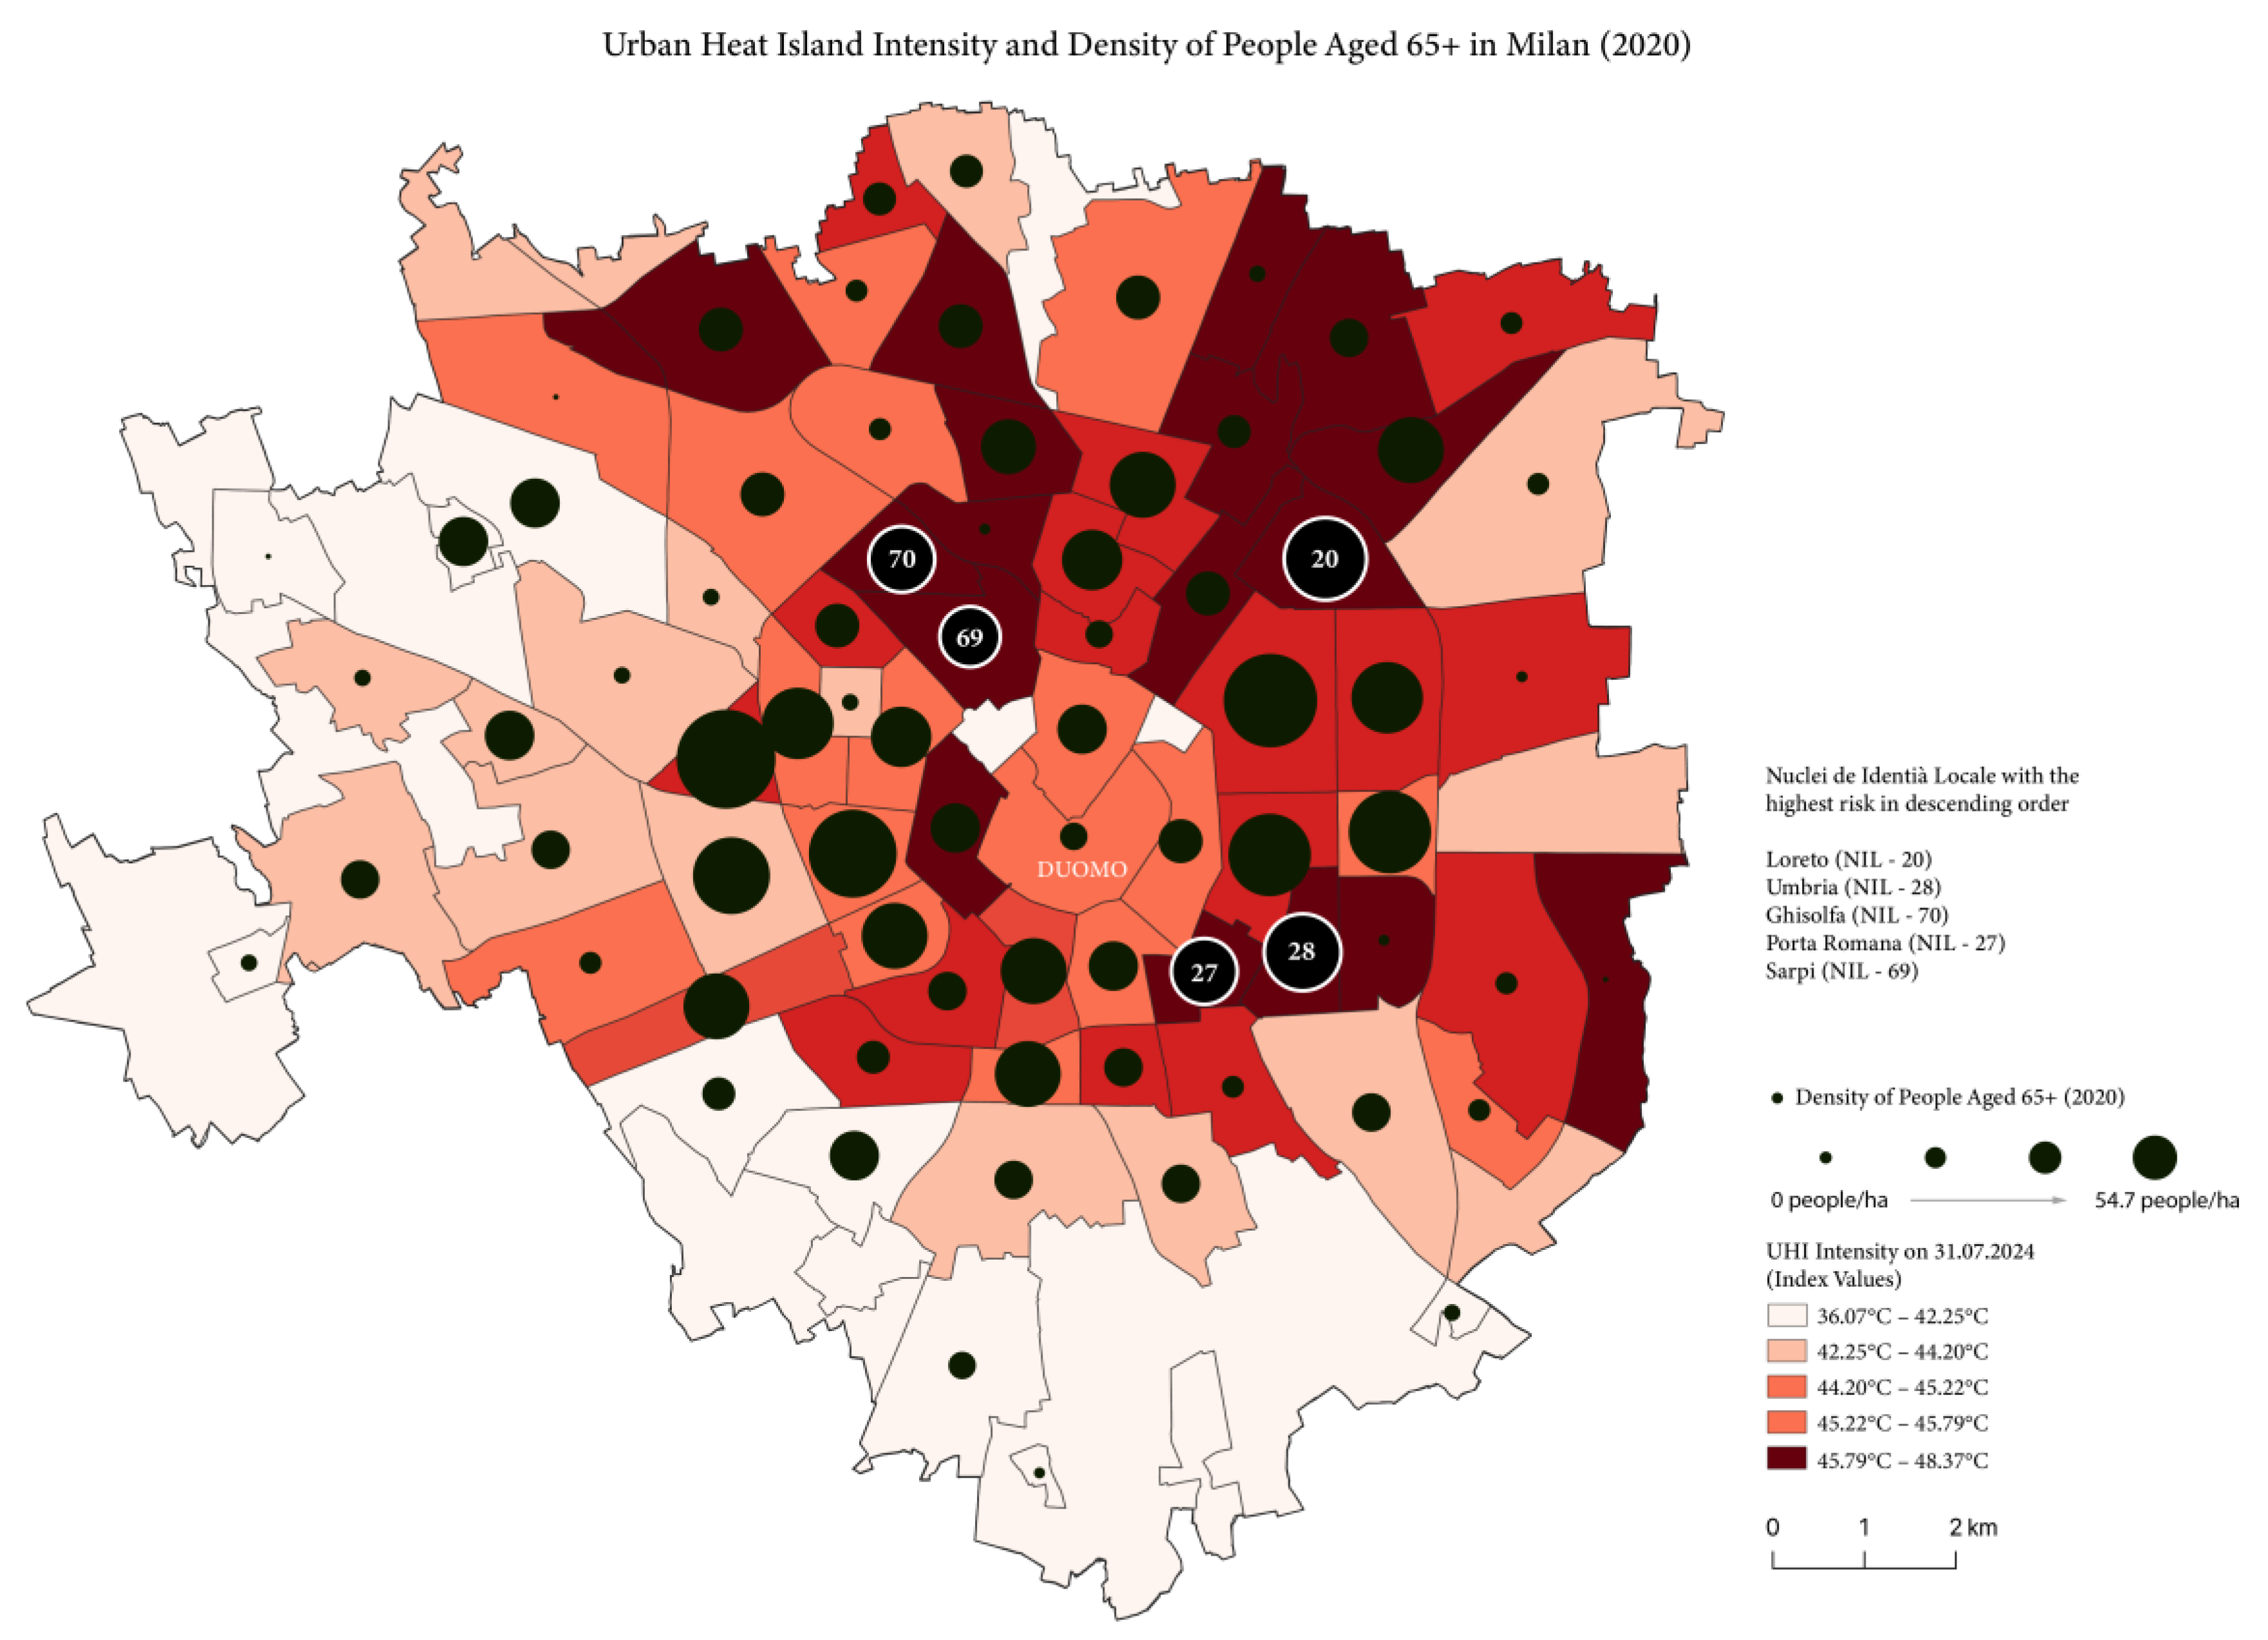
The density of people aged 65 and over is depicted in Figure 3 and overlaid with the UHI intensity map per NIL. Dark circles denote the elderly population density, with larger circles representing higher concentrations. The map elicits highly critical heat-vulnerable districts, as Loreto (NIL - 20), Umbria (NIL - 28), Ghisolfa (NIL - 70), Porta Romana (NIL - 27) and Sarpi (NIL - 69).
Comparing the map with the density of elderly people with the children’s one, it emerges that the older age group has a higher percentage across Milan. Indeed, for elderly, the density reaches 25 people/ha (compared to 19 children/ha) and in general they are more frequent in the NILs. Even in this case, beside high risk NILs, medium-high risk NILs are detected (in red colors), as Selinunte (NIL – 57), Buenos Aires (NIL – 21), XII Marzo (NIL – 26), Citta Studi (NIL – 22), Ticinese (NIL – 44), and Isola (NIL – 11).
For example, the highest density of people over 65 years old have been found in Loreto 44.8 people/ha, which is ranked as the 10th hottest area, while the highest density of children is in Padova with 19.7 people/ha (1.970 pp/Km2).
In the risk maps showing the projection of the density of elderly in 2030, the critical NILs will be more than in 2020: Dergano and Magenta will emerge as new high-density elderly areas, signifying an expansion of aging populations into different neighbourhoods.
Figure 3.
Urban Heat Island intensity and Density of population aged 65+ recorded in 2020 per NIL. Personal elaboration of the author.
Figure 3.
Urban Heat Island intensity and Density of population aged 65+ recorded in 2020 per NIL. Personal elaboration of the author.
The overlap concerning NILs with high density of vulnerable people and the hottest zones identified in UHI mapping underlines an important persistent connection between climate risk and social vulnerability. Loreto (NIL - 20), Umbria (NIL - 28), Padova (NIL - 19), Ghisolfa (NIL - 70), Sarpi (NIL - 69), and Porta Romana (NIL - 27) consistently emerge within the vulnerable age groups (elderly and children) in 2020 and also in the maps of 2030 projections. Besides facing high heat exposure, these areas also house populations that are less resilient to extreme heat, making them crucial locations for targeted interventions. Figure 4 spatially places the comprehensive risk index for children and the elderly resulted from the database overlapping the highest density of vulnerable population age groups in 2020 and in 2030 projections and peak UHI intensity.
Figure 4.
Comprehensive risk index for children and the elderly in 2020 and 2030. Personal elaboration of the author.
Figure 4.
Comprehensive risk index for children and the elderly in 2020 and 2030. Personal elaboration of the author.
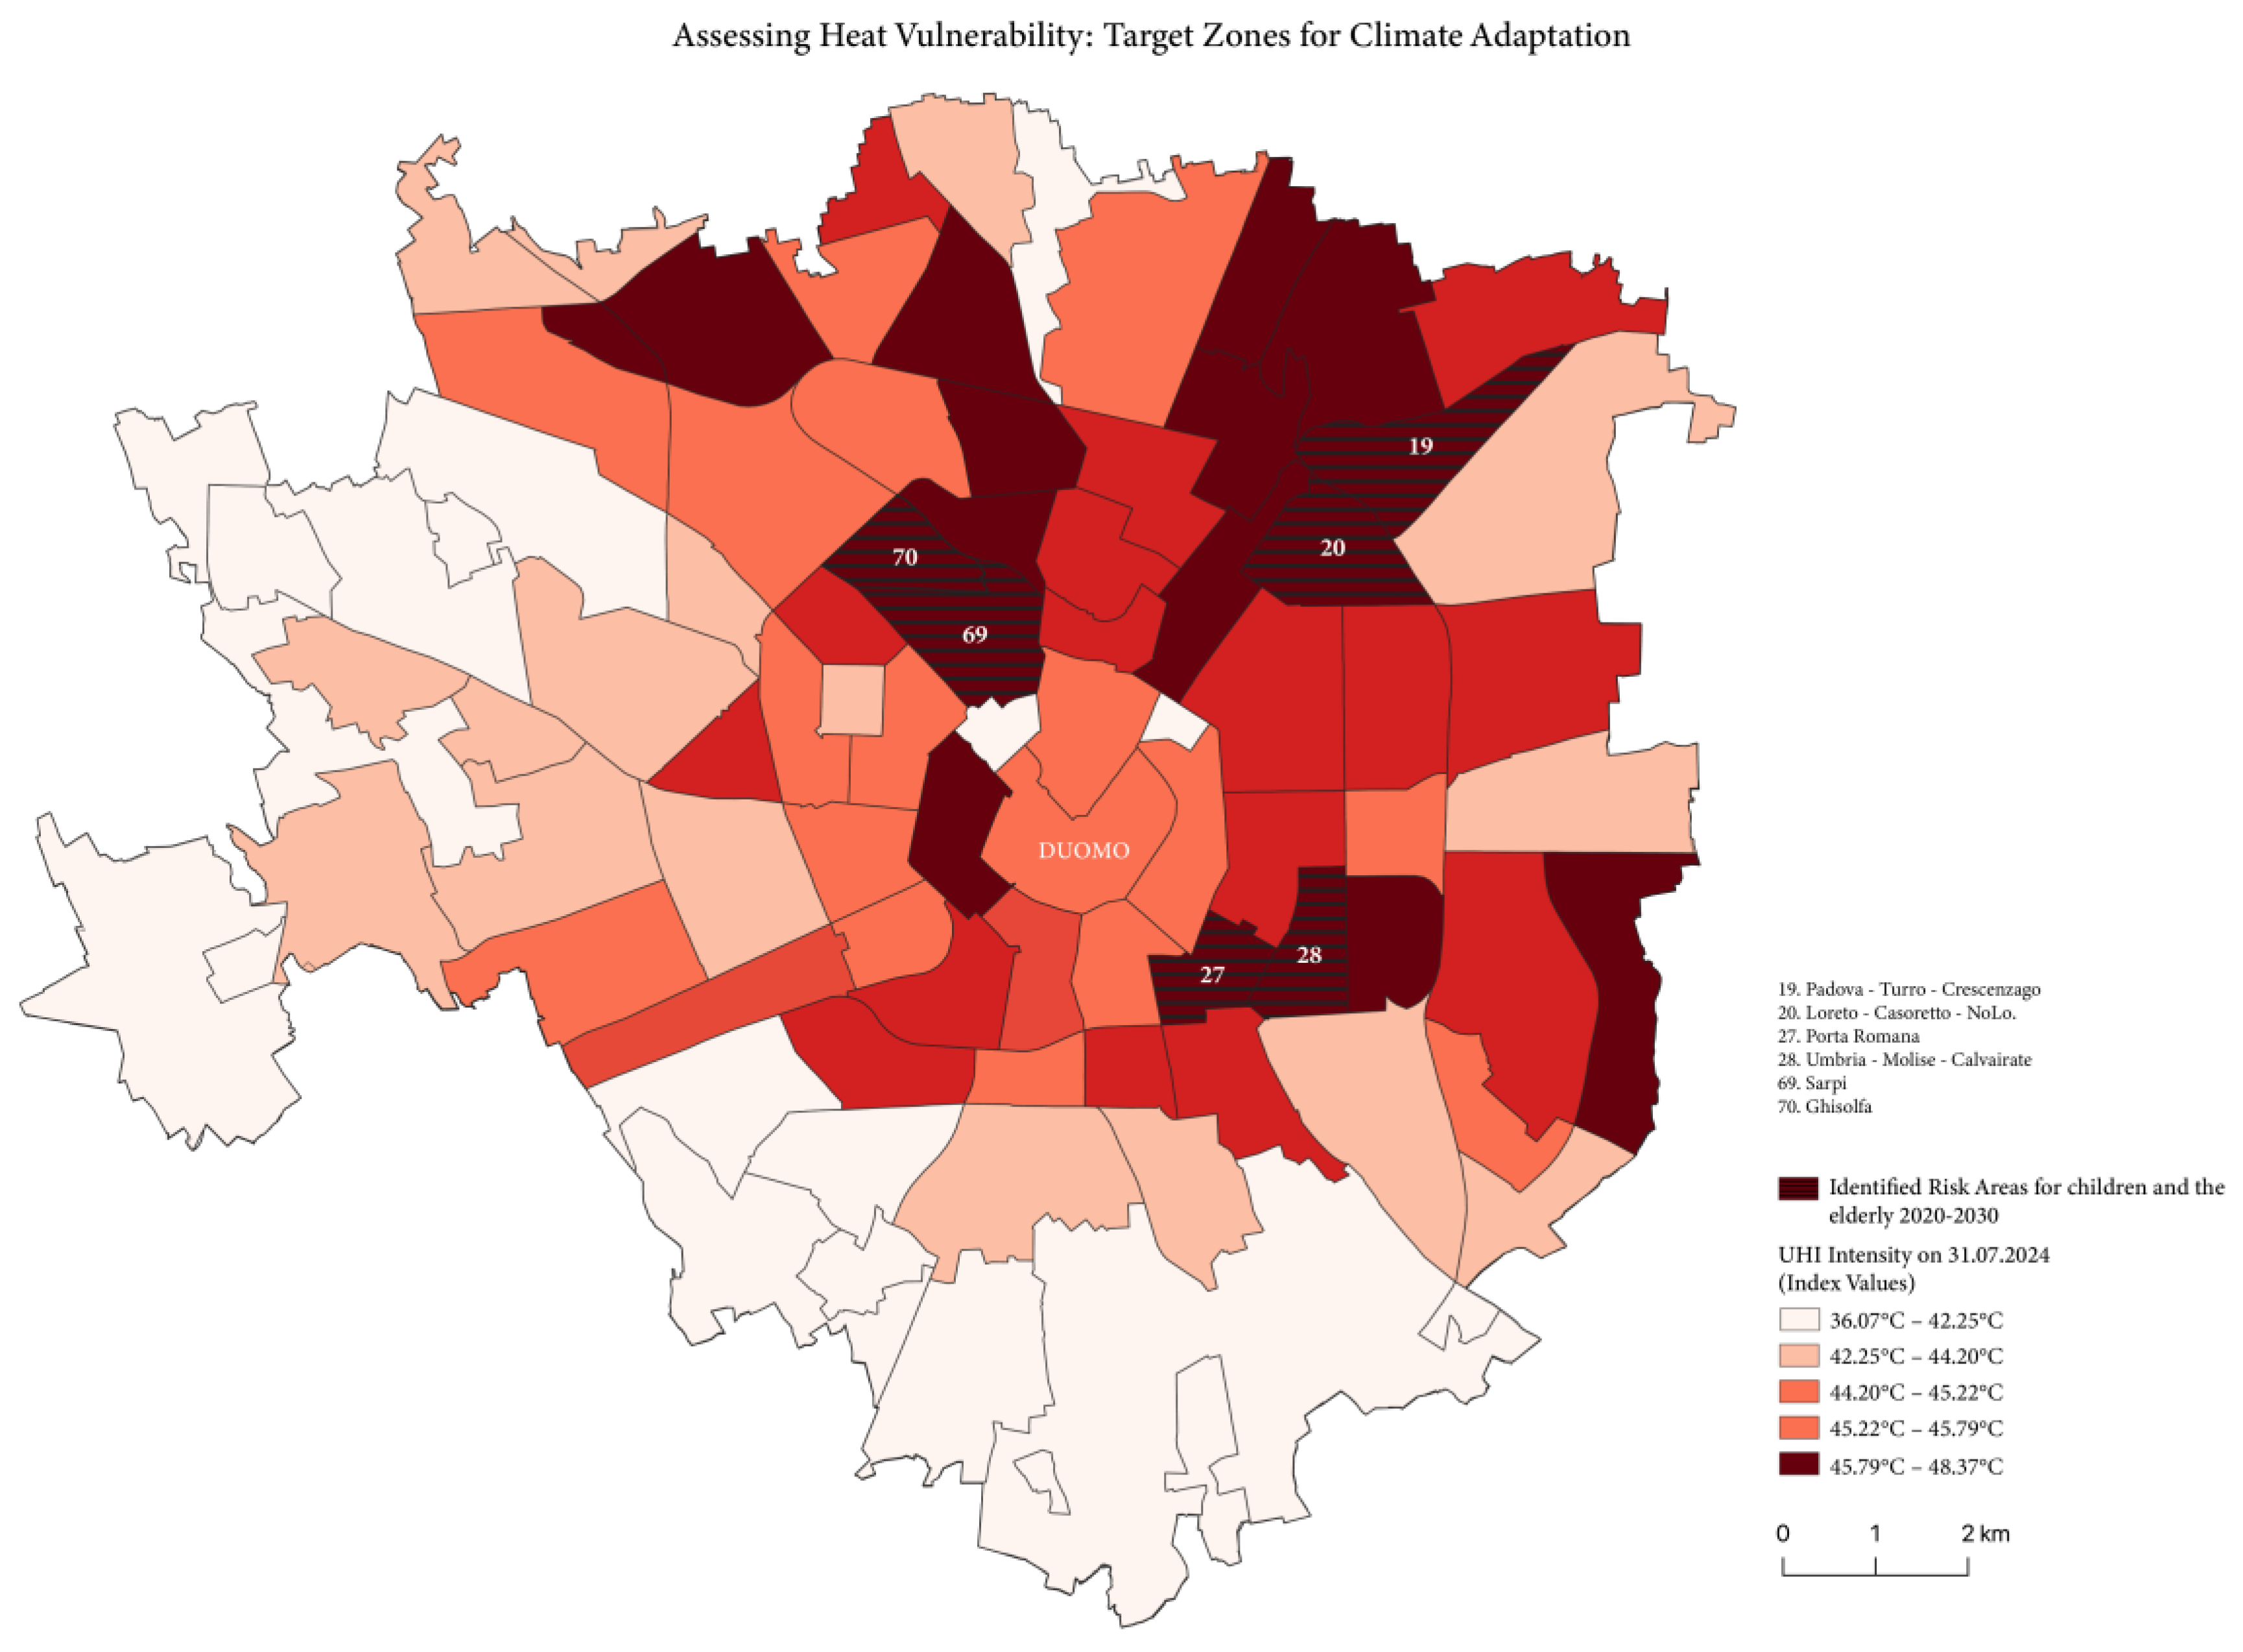
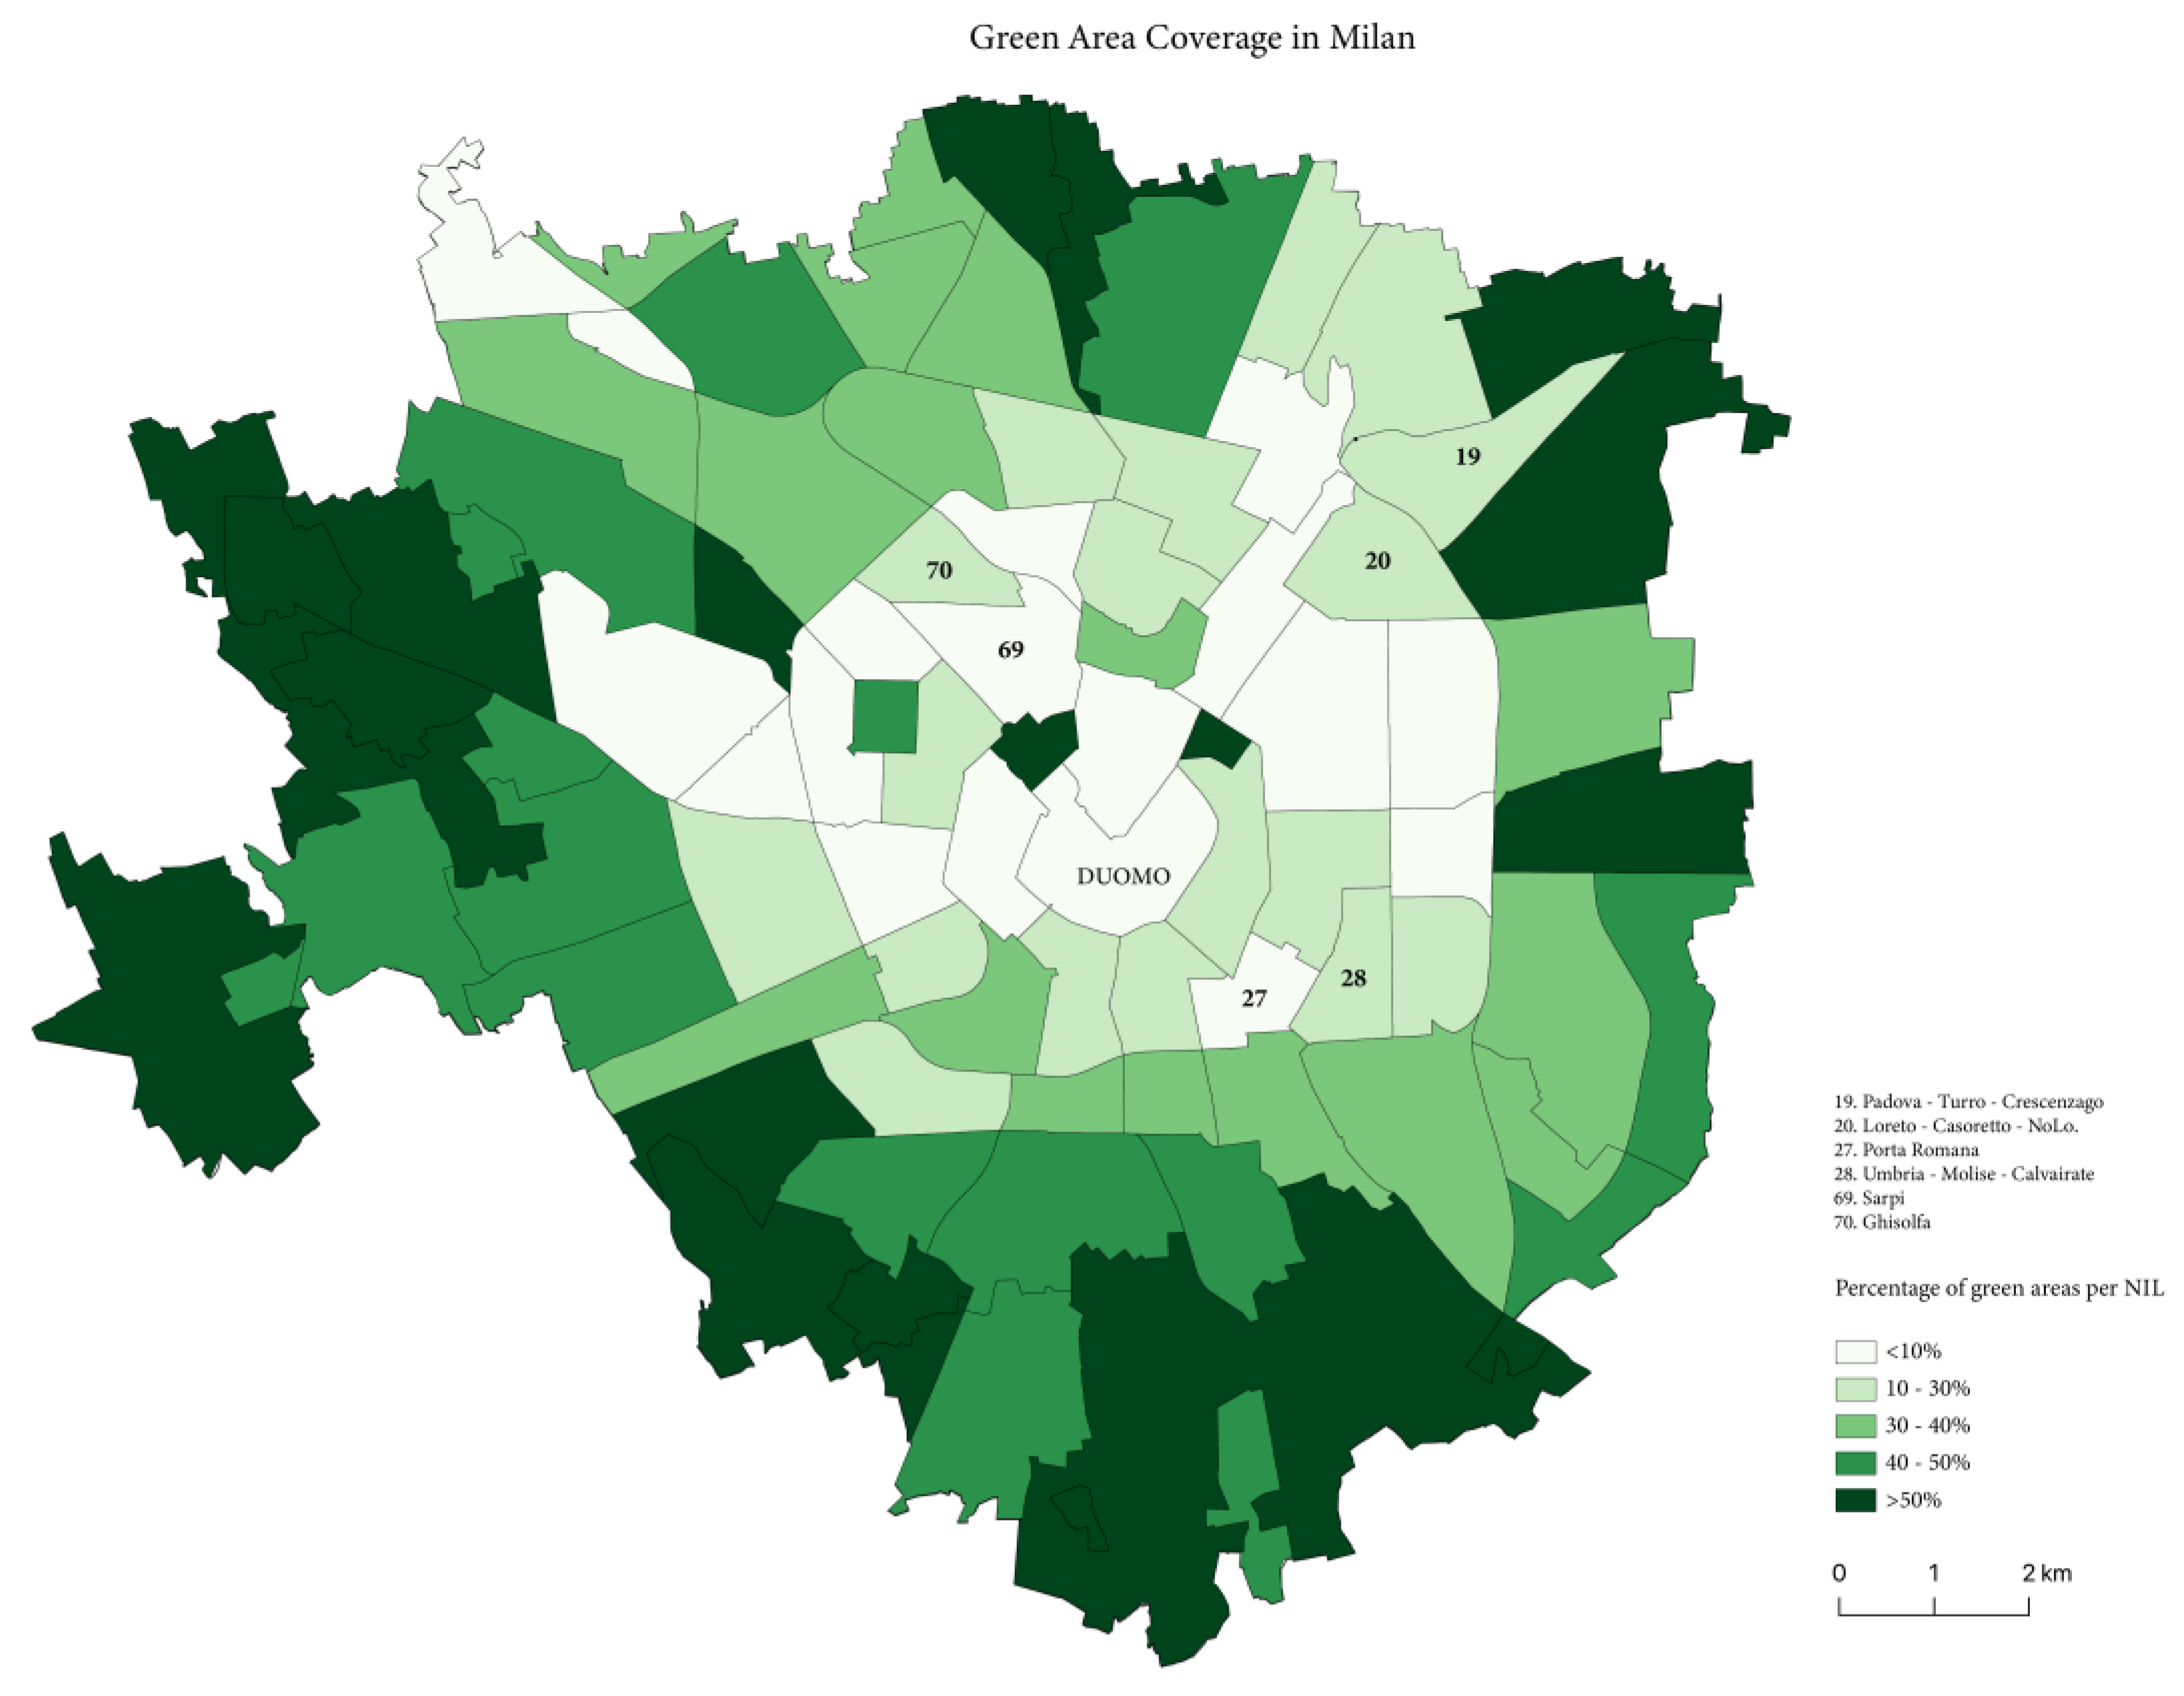
Figure 5 shows the distribution of green areas per NIL to highlight the correlation with the high-risk zones for vulnerable age groups in 2020 and 2030. A clear inverse correlation is observed between UHI intensity and green area density, underscoring the role of vegetation in mitigating urban heat. Notably, NILs with the highest concentration of vulnerable population, consistently correspond to areas with limited green infrastructure. This spatial overlap highlights these districts as critical targets for future nature-based interventions aimed at reducing thermal stress and enhancing climate resilience. Moreover, proximity to green areas is essential for the physical and mental health of elderly people and children, reducing stress, and encouraging outdoor activity. Due to their cooling effect, green spaces provide safer spaces for age groups with thermal regulation sensitivity, especially young children and the elderly.
Figure 5.
Percentage of green areas per NIL. Personal elaboration of the author.
4. Discussion
The spatial analysis performed offers a comprehensive understanding of Urban Heat Island (UHI) intensity in Milan and its relationship with demographic vulnerability and distribution of green infrastructure. Through mapping, distinct spatial patterns reveal areas where extreme heat exposure overlaps with at-risk populations, particularly young children (0-5 years old) and the elderly (65+ years old). Additionally, the green space distribution map highlights a clearly inverted relationship between vegetation coverage and UHI intensity, emphasizing the critical role of Nature-Based Solutions (NBS) in mitigating urban heat. These findings strengthen existing literature that finds vegetation to be an important cooling strategy, reducing surface temperatures through shading and evapotranspiration processes.
Several NILs consistently emerge in both 2020 and 2030 as having a high density of elderly residents, respectively over 30 people per hectare. These include Loreto (NIL - 20), Umbria (NIL - 28), Padova (NIL - 19), Ghisolfa (NIL - 70), Sarpi (NIL – 69), and Porta Romana (NIL - 27), which should be priority areas for heat mitigation strategies over the next decade. Additionally, Dergano (NIL – 79) and Magenta (NIL – 07) are projected to emerge as new high-density elderly areas by 2030, signifying an expansion of aging populations into different neighbourhoods. The persistence of certain NILs across the 10-year difference suggests that these areas will continue to have substantial aging residents, emphasizing their long-term vulnerability to extreme heat events. The demographic modification observed in Dergano (NIL – 79) and Magenta (NIL – 07) also stresses that the risks are expanding into new areas, demanding the implementation of adaptation strategies while thinking forward.
Older populations are more vulnerable to extreme heat because of reduced thermoregulation, pre-existing health conditions, and social isolation. Therefore, NILs with high elderly population densities should be prioritized for UHI adaptation measures such as expanding urban greening and higher tree canopy coverage in pedestrian zones, increasing shaded public spaces and cooling centers.
The NILs with the highest density of children, respectively those over 19.7 children per hectare, remain relatively stable, with almost all appearing in both 2020 and 2030 projections. Padova (NIL - 19), Loreto (NIL - 20), Umbria (NIL - 28), Porta Romana (NIL - 27), Dergano (NIL – 79), Sarpi (NIL – 69), and Ghisolfa (NIL – 70) consistently exhibit high densities of young children, indicating that these areas will continue to be high risk neighborhoods for heat exposure for children. This persistence of high density of children stresses the important need for child-friendly heat adaptation planning in these areas.
Young children are more sensitive to heat stress due to dehydration risks and their underdeveloped thermoregulatory systems and pregnant women risk giving birth to children with lower body wights. The aforementioned NILs should be selected for interventions like shaded and vegetated play areas in residential regions, water features and cooling facilities in schools and public parks and incorporating heat adaptation strategies in childcare and health centers. Due to children having lower regulation of body temperature and being dependent on caregivers, implementing heat-adaptive urban planning that focuses on thermal comfort and safety in areas with more families is crucial.
The persistent overlap concerning NILs with high density of vulnerable people and the hottest zones identified in UHI mapping underlines an important connection between climate risk and social vulnerability. Loreto (NIL - 20), Umbria (NIL - 28), Padova (NIL - 19), Ghisolfa (NIL – 70), Sarpi (NIL – 69), and Porta Romana (NIL - 27), consistently emerge within the vulnerable age groups (elderly and children) in both 2020 and 2030 projections. Besides facing high heat exposure, these areas also house populations that are less resilient to extreme heat, making them crucial locations for targeted interventions.
5. Conclusions
This study demonstrates the value of integrating GIS-based spatial analysis with demographic and environmental data to identify heat vulnerability in urban areas. By combining Urban Heat Island intensity, green infrastructure distribution, and vulnerable age groups demographic projections, the methodology supports targeted climate adaptation strategies. The approach is scalable, allowing application across multiple geographic levels, from neighborhoods to cities or regions. It is also adaptable, as additional layers such as socio-economic, epidemiological, environmental, and infrastructural data can be incorporated for more comprehensive risk assessments. Furthermore, the method is replicable, relying on open-source tools and publicly accessible data.
Looking forward, there is a need for the digitalization of urban and demographic datasets in editable formats such as Excel, CSV, or geolocated GIS packages. Additionally, better organization and accessibility of spatial and statistical data by public institutions would significantly enhance the quality and efficiency of such research, enabling more informed and equitable urban planning decisions.
Abbreviations
The following abbreviations are used in this manuscript:
| UHI | Urban Heat Island |
| LST | Land Surface Temperature |
| GEE | Google Earth Engine |
| GIS | Geographic Information Systems |
| NBS | Nature-Based Solutions |
| NIL | Nuclei di Identità Locale |
References
- F. Grilo et al., «Using green to cool the grey: Modelling the cooling effect of green spaces with a high spatial resolution», Sci. Total Environ., vol. 724, p. 138182, lug. 2020. [CrossRef]
- Z. Kalantari, C. S. S. Ferreira, H. Pan, e P. Pereira, «Nature-based solutions to global environmental challenges», Sci. Total Environ., vol. 880, p. 163227, lug. 2023. [CrossRef]
- L. Vasconcelos, J. Langemeyer, H. V. S. Cole, e F. Baró, «Nature-based climate shelters? Exploring urban green spaces as cooling solutions for older adults in a warming city», Urban For. Urban Green., vol. 98, p. 128408, ago. 2024. [CrossRef]
- Z. Xu et al., «Climate Change and Children’s Health—A Call for Research on What Works to Protect Children», Int. J. Environ. Res. Public. Health, vol. 9, fasc. 9, pp. 3298–3316, set. 2012. [CrossRef]
- L. Capari, H. Wilfing, A. Exner, T. Höflehner, e D. Haluza, «Cooling the City? A Scientometric Study on Urban Green and Blue Infrastructure and Climate Change-Induced Public Health Effects», Sustainability, vol. 14, fasc. 9, p. 4929, apr. 2022. [CrossRef]
- F. Mosca, G. M. Dotti Sani, A. Giachetta, e K. Perini, «Nature-Based Solutions: Thermal Comfort Improvement and Psychological Wellbeing, a Case Study in Genoa, Italy», Sustainability, vol. 13, fasc. 21, p. 11638, ott. 2021. [CrossRef]
- C. Aznarez, S. Kumar, A. Marquez-Torres, U. Pascual, e F. Baró, «Ecosystem service mismatches evidence inequalities in urban heat vulnerability», Sci. Total Environ., vol. 922, p. 171215, apr. 2024. [CrossRef]
- V. Gianfredi et al., «Urban Green Spaces and Public Health Outcomes: a systematic review of literature», Eur. J. Public Health, vol. 31, fasc. Supplement_3, p. ckab164.638, ott. 2021. [CrossRef]
- U. Nations, «Ageing», United Nations. Consulted: 6th May 2025. [Online]. Available at: https://www.un.org/en/global-issues/ageing.
- Eurostat, «Population projections in the EU». Consulted: 6th May 2025. [Online]. Available at: https://ec.europa.eu/eurostat/statistics-explained/index.php?title=Population_projections_in_the_EU.
- F. Van Der Hoeven e A. Wandl, «Amsterwarm: Mapping the landuse, health and energy-efficiency implications of the Amsterdam urban heat island», Build. Serv. Eng. Res. Technol., vol. 36, fasc. 1, pp. 67–88, gen. 2015. [CrossRef]
- M. Alied e N. T. Huy, «A reminder to keep an eye on older people during heatwaves», Lancet Healthy Longev., vol. 3, fasc. 10, pp. e647–e648, ott. 2022. [CrossRef]
- C. Sánchez-Guevara Sánchez, M. Núñez Peiró, e F. J. Neila González, «Urban Heat Island and Vulnerable Population. The Case of Madrid», in Sustainable Development and Renovation in Architecture, Urbanism and Engineering, P. Mercader-Moyano, A c. di, Cham: Springer International Publishing, 2017, pp. 3–13. [CrossRef]
- Oppio, C. Caprioli, M. Dell’Ovo, e M. Bottero, «Assessing Ecosystem Services through a multimethodological approach based on multicriteria analysis and cost-benefits analysis: A case study in Turin (Italy)», J. Clean. Prod., vol. 472, p. 143472, set. 2024. [CrossRef]
- E. Fradelos, I. Papathanasiou, D. Mitsi, K. Tsaras, C. Kleisiaris, e L. Kourkouta, «Health Based Geographic Information Systems (GIS) and their Applications», Acta Inform. Medica, vol. 22, fasc. 6, p. 402, 2014. [CrossRef]
- B. F. Khashoggi e A. Murad, «Issues of Healthcare Planning and GIS: A Review», ISPRS Int. J. Geo-Inf., vol. 9, fasc. 6, p. 352, mag. 2020. [CrossRef]
- F. Isola, F. Leone, e R. Pittau, «Evaluating the urban heat island phenomenon from a spatial planning viewpoint. A systematic review», TeMA - J. Land Use Mobil. Environ., fasc. 2, pp. 75–93, nov. 2023. [CrossRef]
- Buchin, M.-T. Hoelscher, F. Meier, T. Nehls, e F. Ziegler, «Evaluation of the health-risk reduction potential of countermeasures to urban heat islands», Energy Build., vol. 114, pp. 27–37, feb. 2016. [CrossRef]
- D. Lauwaet et al., «High resolution modelling of the urban heat island of 100 European cities», Urban Clim., vol. 54, 2024. [CrossRef]
- J. Nawaro, L. Gianquintieri, A. Pagliosa, G. M. Sechi, e E. G. Caiani, «Neighborhood determinants of vulnerability to heat for cardiovascular health: a spatial analysis of Milan, Italy», Popul. Environ., vol. 46, fasc. 4, p. 25, dic. 2024. [CrossRef]
Disclaimer/Publisher’s Note: The statements, opinions and data contained in all publications are solely those of the individual author(s) and contributor(s) and not of MDPI and/or the editor(s). MDPI and/or the editor(s) disclaim responsibility for any injury to people or property resulting from any ideas, methods, instructions or products referred to in the content. |
© 2025 by the authors. Licensee MDPI, Basel, Switzerland. This article is an open access article distributed under the terms and conditions of the Creative Commons Attribution (CC BY) license (http://creativecommons.org/licenses/by/4.0/).
Copyright: This open access article is published under a Creative Commons CC BY 4.0 license, which permit the free download, distribution, and reuse, provided that the author and preprint are cited in any reuse.


