Submitted:
14 May 2025
Posted:
15 May 2025
You are already at the latest version
Abstract
Data centers are among the largest consumers of electricity in the digital era, with power demands growing due to increased computational workloads and the adoption of AI-driven services. Integrating renewable energy sources, particularly solar power, offers a promising path toward sustainability, but also introduces variability and complexity in energy availability. This paper presents a hybrid academic contribution that combines a literature survey, conceptual modeling, pilot experimental simulation, and a forward-looking systems design. We introduce an adaptive energy governance framework for solar-powered data centers that utilizes Dynamic Voltage and Frequency Scaling (DVFS), server consolidation, and Quality of Service (QoS) degradation to manage energy consumption under fluctuating solar input. A mathematical model is developed to evaluate energy flows across IT equipment and cooling systems. Simulation results show that intelligent energy governance can reduce power usage by up to 40% with minimal service degradation. In addition, the paper proposes an AI/ML-enhanced Software-Defined Networking (SDN) architecture for predictive power control and workload orchestration. This integrated approach supports a vision of future-ready, intelligent, and sustainable data center operations.
Keywords:
solar-powered data center
; energy governance
; DVFS
; server consolidation
; renewable energy management
; AI/ML
; SDN
1. Introduction
Data centers have emerged as critical, large-scale computing infrastructures that operate continuously to support the rapid expansion of the information technology (IT) industry and broader economic growth [1,2]. Two principal factors have contributed to their ascendance: firstly, the surging demand for data processing, computing, and storage from cloud service providers such as Google and Facebook, as well as telecommunications firms like British Telecom [3]; and secondly, the necessity to accommodate a diverse range of applications, from ephemeral computations to persistent services, on shared hardware platforms [1]. Consequently, data centers have become central to the IT ecosystem, representing a global market valued at approximately 152 billion USD by 2016 [4]. Nevertheless, their vast scale and operational requirements have led to profound challenges in energy consumption and efficiency.
The energy efficiency of data centers has garnered increasing attention due to its significant economic, environmental, and performance implications. Economically, the energy demands are substantial—a typical data center can consume the equivalent electricity of approximately 25,000 households [5], with data center facilities using 100 to 200 times more energy per square foot than standard office spaces [5]. Furthermore, with electricity costs doubling every five years [1], energy expenditures have become a dominant operational cost, at times surpassing hardware acquisition costs [7]. Environmentally, the impact is equally critical. Data centers accounted for approximately 1% of total U.S. electricity consumption in 2005, contributing emissions equivalent to a medium-sized nation such as Argentina [10]. By 2010, global data center electricity usage ranged from 1.1% to 1.5% of worldwide consumption [11], with the United States alone contributing between 1.7% and 2.2% [12]. Van Heddeghem et al. [13] reported that in 2012, data centers worldwide consumed around 270 TWh of electricity, with a compound annual growth rate (CAGR) of 4.4% between 2007 and 2012. These findings underscore why energy efficiency has surpassed traditional concerns such as availability and security as the foremost operational priority for data center managers.
Idle servers also consume substantial amounts of power, presenting opportunities for energy savings through techniques like server shutdown and workload consolidation. However, such measures often lead to performance trade-offs, necessitating a careful balance between energy efficiency and system responsiveness.
Data center energy consumption can be broadly categorized into two primary domains: IT equipment—including servers, storage, and networking components—and infrastructure facilities, notably cooling and power conditioning systems [14]. According to studies by the Infotech Group and others [13,15], cooling systems represent the largest share of data center energy use (approximately 50%), followed by servers and storage systems (26%), although these percentages can vary depending on specific data center designs [16].
This paper is intentionally structured as a hybrid study, integrating the following components:
- Literature Survey: An extensive review of 40 key publications from 2010–2025 on power measurement, estimation, and governance in data centers.
- Conceptual Framework: A synthesized model of hierarchical energy governance combining DVFS, server consolidation, and QoS strategies.
- Pilot Simulation Study: A mathematical simulation assessing the power-performance trade-offs of the proposed model in solar-constrained scenarios.
- Systems Proposal: A forward-looking architectural integration of SDN and AI/ML for predictive and autonomous energy governance.
- Future Outlook: Strategic recommendations for implementing intelligent, renewable-aware infrastructure in next-generation data centers.
This multifaceted structure enables both theoretical grounding and exploratory application, contributing to both academic knowledge and practical design thinking.
2. Literature Survey
Accurate measurement and estimation of power consumption in computing systems have been the focus of extensive research. Early approaches involved external power meters to measure system-level energy usage directly, such as PowerPack by Ge et al. [1] and statistical GPU power modeling by Nagasaka et al. [2]. Although external meters provide high accuracy, their lack of portability and scalability prompted researchers to explore internal system-level measurements. Bircher and John [3] proposed core-level activity prediction models based on performance counters, addressing some of these challenges. Polling data from intelligent Power Distribution Units (PDUs) has emerged as another practical solution for live data center environments [4], although cost and scalability issues persist. Additionally, on-board hardware sensors like those found in Tesla K20 GPUs [5] and software platforms such as IBM's AMESTER [6] and HP’s iLO [7] have improved power visibility without the need for external instrumentation. Performance counters have gained traction as a non-invasive alternative for energy estimation. Notable works by Bircher et al. [8] and Bertran et al. [9] demonstrated strong correlations between microarchitectural events (like cache misses and DMA transactions) and processor power consumption. Isci et al. [10] proposed a hybrid model combining physical measurements and counter-based estimates, mapping power usage across 22 physical processor components. Counter-based modeling was further explored by Shiue and Chakrabarti [11], who related cache hit/miss rates to power consumption, and Contreras and Martonosi [12], who predicted CPU power using instruction cache misses and TLB metrics. Chen et al. [13] demonstrated that a small set of five performance counters could accurately estimate CPU power, reducing modeling complexity. Several researchers addressed runtime power estimation. Joseph and Martonosi [14] presented one of the earliest runtime estimation techniques, while Li and John [15] extended these ideas to operating system-level power modeling. Jarus et al. [16] further adapted runtime estimation for HPC environments, showing sub-10% average errors across different real-world applications. Machine learning has also been leveraged for energy modeling. Moreno and Xu [17] employed neural networks to improve real-time energy efficiency in cloud environments. Meanwhile, Lewis et al. [18] introduced chaotic time-series approximations for server workload power prediction, demonstrating significant accuracy improvements over linear models. Broader system-level approaches have also been pursued. Basmadjian and de Meer [19] evaluated multi-core processor power behavior comprehensively, while McCullough et al. [20] validated model-based characterization against physical measurements, confirming the viability of predictive modeling at scale. Recent advancements in data center technologies have intensified the focus on energy efficiency and power consumption. The proliferation of cloud computing, artificial intelligence (AI), and Internet of Things (IoT) applications has led to increased energy demands, prompting extensive research into measurement, estimation, and optimization of power usage. A comprehensive survey by Al-Dulaimy et al. [21] delves into power management strategies in virtualized data centers, highlighting the significance of dynamic resource allocation and workload consolidation. Similarly, Ayanoglu [22] discusses the escalating energy consumption in data centers due to AI and IoT, emphasizing the need for sustainable practices. Gizli and Gómez [23] propose a framework for optimizing energy efficiency, integrating monitoring tools and predictive analytics to manage energy consumption proactively. Schlichting [24] examines technologies and methodologies aimed at enhancing energy efficiency in data centers, offering insights into best practices and implementation challenges.
Accurate measurement and estimation of power consumption in computing systems have been the focus of extensive research. Early approaches involved external power meters to measure system-level energy usage directly, such as PowerPack by Ge et al. [1] and statistical GPU power modeling by Nagasaka et al. [2]. Although external meters provide high accuracy, their lack of portability and scalability prompted researchers to explore internal system-level measurements. Bircher and John [3] proposed core-level activity prediction models based on performance counters, addressing some of these challenges. Polling data from intelligent Power Distribution Units (PDUs) has emerged as another practical solution for live data center environments [4], although cost and scalability issues persist. Additionally, on-board hardware sensors like those found in Tesla K20 GPUs [5] and software platforms such as IBM's AMESTER [6] and HP’s iLO [7] have improved power visibility without the need for external instrumentation. Performance counters have gained traction as a non-invasive alternative for energy estimation. Notable works by Bircher et al. [8] and Bertran et al. [9] demonstrated strong correlations between microarchitectural events (like cache misses and DMA transactions) and processor power consumption. Isci et al. [10] proposed a hybrid model combining physical measurements and counter-based estimates, mapping power usage across 22 physical processor components. Counter-based modeling was further explored by Shiue and Chakrabarti [11], who related cache hit/miss rates to power consumption, and Contreras and Martonosi [12], who predicted CPU power using instruction cache misses and TLB metrics. Chen et al. [13] demonstrated that a small set of five performance counters could accurately estimate CPU power, reducing modeling complexity. Several researchers addressed runtime power estimation. Joseph and Martonosi [14] presented one of the earliest runtime estimation techniques, while Li and John [15] extended these ideas to operating system-level power modeling. Jarus et al. [16] further adapted runtime estimation for HPC environments, showing sub-10% average errors across different real-world applications. Machine learning has also been leveraged for energy modeling. Moreno and Xu [17] employed neural networks to improve real-time energy efficiency in cloud environments. Meanwhile, Lewis et al. [18] introduced chaotic time-series approximations for server workload power prediction, demonstrating significant accuracy improvements over linear models. Broader system-level approaches have also been pursued. Basmadjian and de Meer [19] evaluated multi-core processor power behavior comprehensively, while McCullough et al. [20] validated model-based characterization against physical measurements, confirming the viability of predictive modeling at scale. Recent advancements in data center technologies have intensified the focus on energy efficiency and power consumption. The proliferation of cloud computing, artificial intelligence (AI), and Internet of Things (IoT) applications has led to increased energy demands, prompting extensive research into measurement, estimation, and optimization of power usage. A comprehensive survey by Al-Dulaimy et al. [21] delves into power management strategies in virtualized data centers, highlighting the significance of dynamic resource allocation and workload consolidation. Similarly, Ayanoglu [22] discusses the escalating energy consumption in data centers due to AI and IoT, emphasizing the need for sustainable practices. Gizli and Gómez [23] propose a framework for optimizing energy efficiency, integrating monitoring tools and predictive analytics to manage energy consumption proactively. Schlichting [24] examines technologies and methodologies aimed at enhancing energy efficiency in data centers, offering insights into best practices and implementation challenges.
Accurate measurement and estimation of power consumption in computing systems have been the focus of extensive research. Early approaches involved external power meters to measure system-level energy usage directly, such as PowerPack by Ge et al. [1] and statistical GPU power modeling by Nagasaka et al. [2]. Although external meters provide high accuracy, their lack of portability and scalability prompted researchers to explore internal system-level measurements. Bircher and John [3] proposed core-level activity prediction models based on performance counters, addressing some of these challenges. Polling data from intelligent Power Distribution Units (PDUs) has emerged as another practical solution for live data center environments [4], although cost and scalability issues persist. Additionally, on-board hardware sensors like those found in Tesla K20 GPUs [5] and software platforms such as IBM's AMESTER [6] and HP’s iLO [7] have improved power visibility without the need for external instrumentation. Performance counters have gained traction as a non-invasive alternative for energy estimation. Notable works by Bircher et al. [8] and Bertran et al. [9] demonstrated strong correlations between microarchitectural events (like cache misses and DMA transactions) and processor power consumption. Isci et al. [10] proposed a hybrid model combining physical measurements and counter-based estimates, mapping power usage across 22 physical processor components. Counter-based modeling was further explored by Shiue and Chakrabarti [11], who related cache hit/miss rates to power consumption, and Contreras and Martonosi [12], who predicted CPU power using instruction cache misses and TLB metrics. Chen et al. [13] demonstrated that a small set of five performance counters could accurately estimate CPU power, reducing modeling complexity. Several researchers addressed runtime power estimation. Joseph and Martonosi [14] presented one of the earliest runtime estimation techniques, while Li and John [15] extended these ideas to operating system-level power modeling. Jarus et al. [16] further adapted runtime estimation for HPC environments, showing sub-10% average errors across different real-world applications. Machine learning has also been leveraged for energy modeling. Moreno and Xu [17] employed neural networks to improve real-time energy efficiency in cloud environments. Meanwhile, Lewis et al. [18] introduced chaotic time-series approximations for server workload power prediction, demonstrating significant accuracy improvements over linear models. Broader system-level approaches have also been pursued. Basmadjian and de Meer [19] evaluated multi-core processor power behavior comprehensively, while McCullough et al. [20] validated model-based characterization against physical measurements, confirming the viability of predictive modeling at scale. Recent advancements in data center technologies have intensified the focus on energy efficiency and power consumption. The proliferation of cloud computing, artificial intelligence (AI), and Internet of Things (IoT) applications has led to increased energy demands, prompting extensive research into measurement, estimation, and optimization of power usage. A comprehensive survey by Al-Dulaimy et al. [21] delves into power management strategies in virtualized data centers, highlighting the significance of dynamic resource allocation and workload consolidation. Similarly, Ayanoglu [22] discusses the escalating energy consumption in data centers due to AI and IoT, emphasizing the need for sustainable practices. Gizli and Gómez [23] propose a framework for optimizing energy efficiency, integrating monitoring tools and predictive analytics to manage energy consumption proactively. Schlichting [24] examines technologies and methodologies aimed at enhancing energy efficiency in data centers, offering insights into best practices and implementation challenges.
Accurate measurement and estimation of power consumption in computing systems have been the focus of extensive research. Early approaches involved external power meters to measure system-level energy usage directly, such as PowerPack by Ge et al. [1] and statistical GPU power modeling by Nagasaka et al. [2]. Although external meters provide high accuracy, their lack of portability and scalability prompted researchers to explore internal system-level measurements. Bircher and John [3] proposed core-level activity prediction models based on performance counters, addressing some of these challenges. Polling data from intelligent Power Distribution Units (PDUs) has emerged as another practical solution for live data center environments [4], although cost and scalability issues persist. Additionally, on-board hardware sensors like those found in Tesla K20 GPUs [5] and software platforms such as IBM's AMESTER [6] and HP’s iLO [7] have improved power visibility without the need for external instrumentation. Performance counters have gained traction as a non-invasive alternative for energy estimation. Notable works by Bircher et al. [8] and Bertran et al. [9] demonstrated strong correlations between microarchitectural events (like cache misses and DMA transactions) and processor power consumption. Isci et al. [10] proposed a hybrid model combining physical measurements and counter-based estimates, mapping power usage across 22 physical processor components. Counter-based modeling was further explored by Shiue and Chakrabarti [11], who related cache hit/miss rates to power consumption, and Contreras and Martonosi [12], who predicted CPU power using instruction cache misses and TLB metrics. Chen et al. [13] demonstrated that a small set of five performance counters could accurately estimate CPU power, reducing modeling complexity. Several researchers addressed runtime power estimation. Joseph and Martonosi [14] presented one of the earliest runtime estimation techniques, while Li and John [15] extended these ideas to operating system-level power modeling. Jarus et al. [16] further adapted runtime estimation for HPC environments, showing sub-10% average errors across different real-world applications. Machine learning has also been leveraged for energy modeling. Moreno and Xu [17] employed neural networks to improve real-time energy efficiency in cloud environments. Meanwhile, Lewis et al. [18] introduced chaotic time-series approximations for server workload power prediction, demonstrating significant accuracy improvements over linear models. Broader system-level approaches have also been pursued. Basmadjian and de Meer [19] evaluated multi-core processor power behavior comprehensively, while McCullough et al. [20] validated model-based characterization against physical measurements, confirming the viability of predictive modeling at scale. Recent advancements in data center technologies have intensified the focus on energy efficiency and power consumption. The proliferation of cloud computing, artificial intelligence (AI), and Internet of Things (IoT) applications has led to increased energy demands, prompting extensive research into measurement, estimation, and optimization of power usage. A comprehensive survey by Al-Dulaimy et al. [21] delves into power management strategies in virtualized data centers, highlighting the significance of dynamic resource allocation and workload consolidation. Similarly, Ayanoglu [22] discusses the escalating energy consumption in data centers due to AI and IoT, emphasizing the need for sustainable practices. Gizli and Gómez [23] propose a framework for optimizing energy efficiency, integrating monitoring tools and predictive analytics to manage energy consumption proactively. Schlichting [24] examines technologies and methodologies aimed at enhancing energy efficiency in data centers, offering insights into best practices and implementation challenges.
The Federal Energy Management Program (FEMP) [25] provides guidelines and resources to improve energy efficiency in data centers, including best practices for design and operation. A study by Gozcu et al. [26] evaluates various free cooling methods, demonstrating their potential in reducing energy consumption. A system dynamics forecasting model presented by Zhang et al. [27] predicts significant increases in data center electricity needs by 2030, considering factors like the end of Moore's Law and the growth of industrial IoT. The study underscores the importance of behavioral usage trends in influencing energy consumption. The MITRE Corporation [28] offers a detailed analysis of energy efficiency technologies and methodologies, identifying promising approaches for data center operators. A whitepaper by ABB [29] discusses the essentials of energy efficiency and data center monitoring, highlighting the challenges in building and managing efficient data centers. A report by the Lawrence Berkeley National Laboratory [30] indicates a substantial increase in energy consumption by data centers, projecting that it could reach up to 12% of the United States' electricity use by 2028. The report calls for further research and initiatives to expand electricity infrastructure to meet growing needs. The Department of Energy [31] emphasizes the importance of energy efficiency in data centers, providing resources and tools to assist agencies in constructing and maintaining energy-efficient facilities. A study by Lei et al. [32] presents a prediction framework for overall energy consumption in data centers, incorporating factors like PUE and IT equipment energy usage. The International Energy Agency [33] projects that data center electricity demand will more than double from 2022 to 2026, largely driven by AI activities. This surge in energy use threatens tech companies' climate goals and puts additional pressure on power and water resources. A study by DeepSeek [34] introduces AI models that claim to use significantly less computing power, suggesting substantial reductions in energy consumption and environmental impact. This innovation could lead to more sustainable AI infrastructure and faster innovation. The International Monetary Fund (IMF) [35] reports that global economic output is expected to rise due to advances in AI, outweighing the environmental costs from increased carbon emissions due to energy-demanding data centers. However, the environmental impact of AI will depend significantly on its applications. Climate tech startups are increasingly targeting the energy-intensive data center sector, driven by the AI boom and surging infrastructure investments from major tech firms [36]. These startups are developing advanced hardware, decentralized energy sources, and modular power electronics to enhance efficiency.
The Federal Energy Management Program's Center of Expertise [37] provides information and technical support for data center efficiency projects, encouraging participation in initiatives like the Better Buildings Challenge and Data Center Accelerator. A study by Sandia National Laboratories [38] showcases a holistic design integrating energy and water efficiency, flexibility, and resilience into their data center, serving as a model for sustainable practices. The use of AI is causing a dramatic increase in energy consumption due to the need for extensive computing power in data centers [39]. Companies are investing in improving energy efficiency through advanced chip hardware and supporting renewable energy developments. Finally, a report by Vox [40] discusses the growing energy demands of AI and data centers, noting concerns about their environmental impact. Industry leaders are responding by investing heavily in renewable energy and even nuclear power.
Despite extensive efforts to monitor and optimize energy consumption in data centers, several critical challenges remain unresolved. First, the majority of existing power consumption models are focused at the component or server level, with limited integration across the full data center stack. This disjointed approach fails to capture the complex interdependencies between IT workloads, infrastructure systems (such as cooling and power conditioning), and real-time energy dynamics. Second, while many studies rely on hardware-based measurement tools (e.g., PDUs, sensors, and power meters), their deployment is costly, lacks scalability, and introduces latency in decision-making processes. Software-based estimation techniques, including those based on performance counters or machine learning, show promise but often suffer from limited generalizability across heterogeneous platforms, workloads, and environmental conditions. Furthermore, emerging computing paradigms—such as AI/ML workloads, containerized environments, and edge computing—exhibit unique power profiles that are inadequately modeled by existing frameworks. Additionally, the increasing use of virtualization and dynamic resource allocation introduces stochastic workload patterns, making it difficult for static models to accurately predict or adapt to runtime changes in power demand. Most existing models also prioritize CPU and server power, underrepresenting the role of memory, storage, networking, and cooling subsystems in overall energy consumption. Finally, there is a lack of standardization in evaluation methodologies. Many models are tested in narrow contexts, with insufficient benchmarking against real-world workloads or cross-validation across architectures. This limits the transferability of findings and hampers practical adoption in industry-scale data centers.
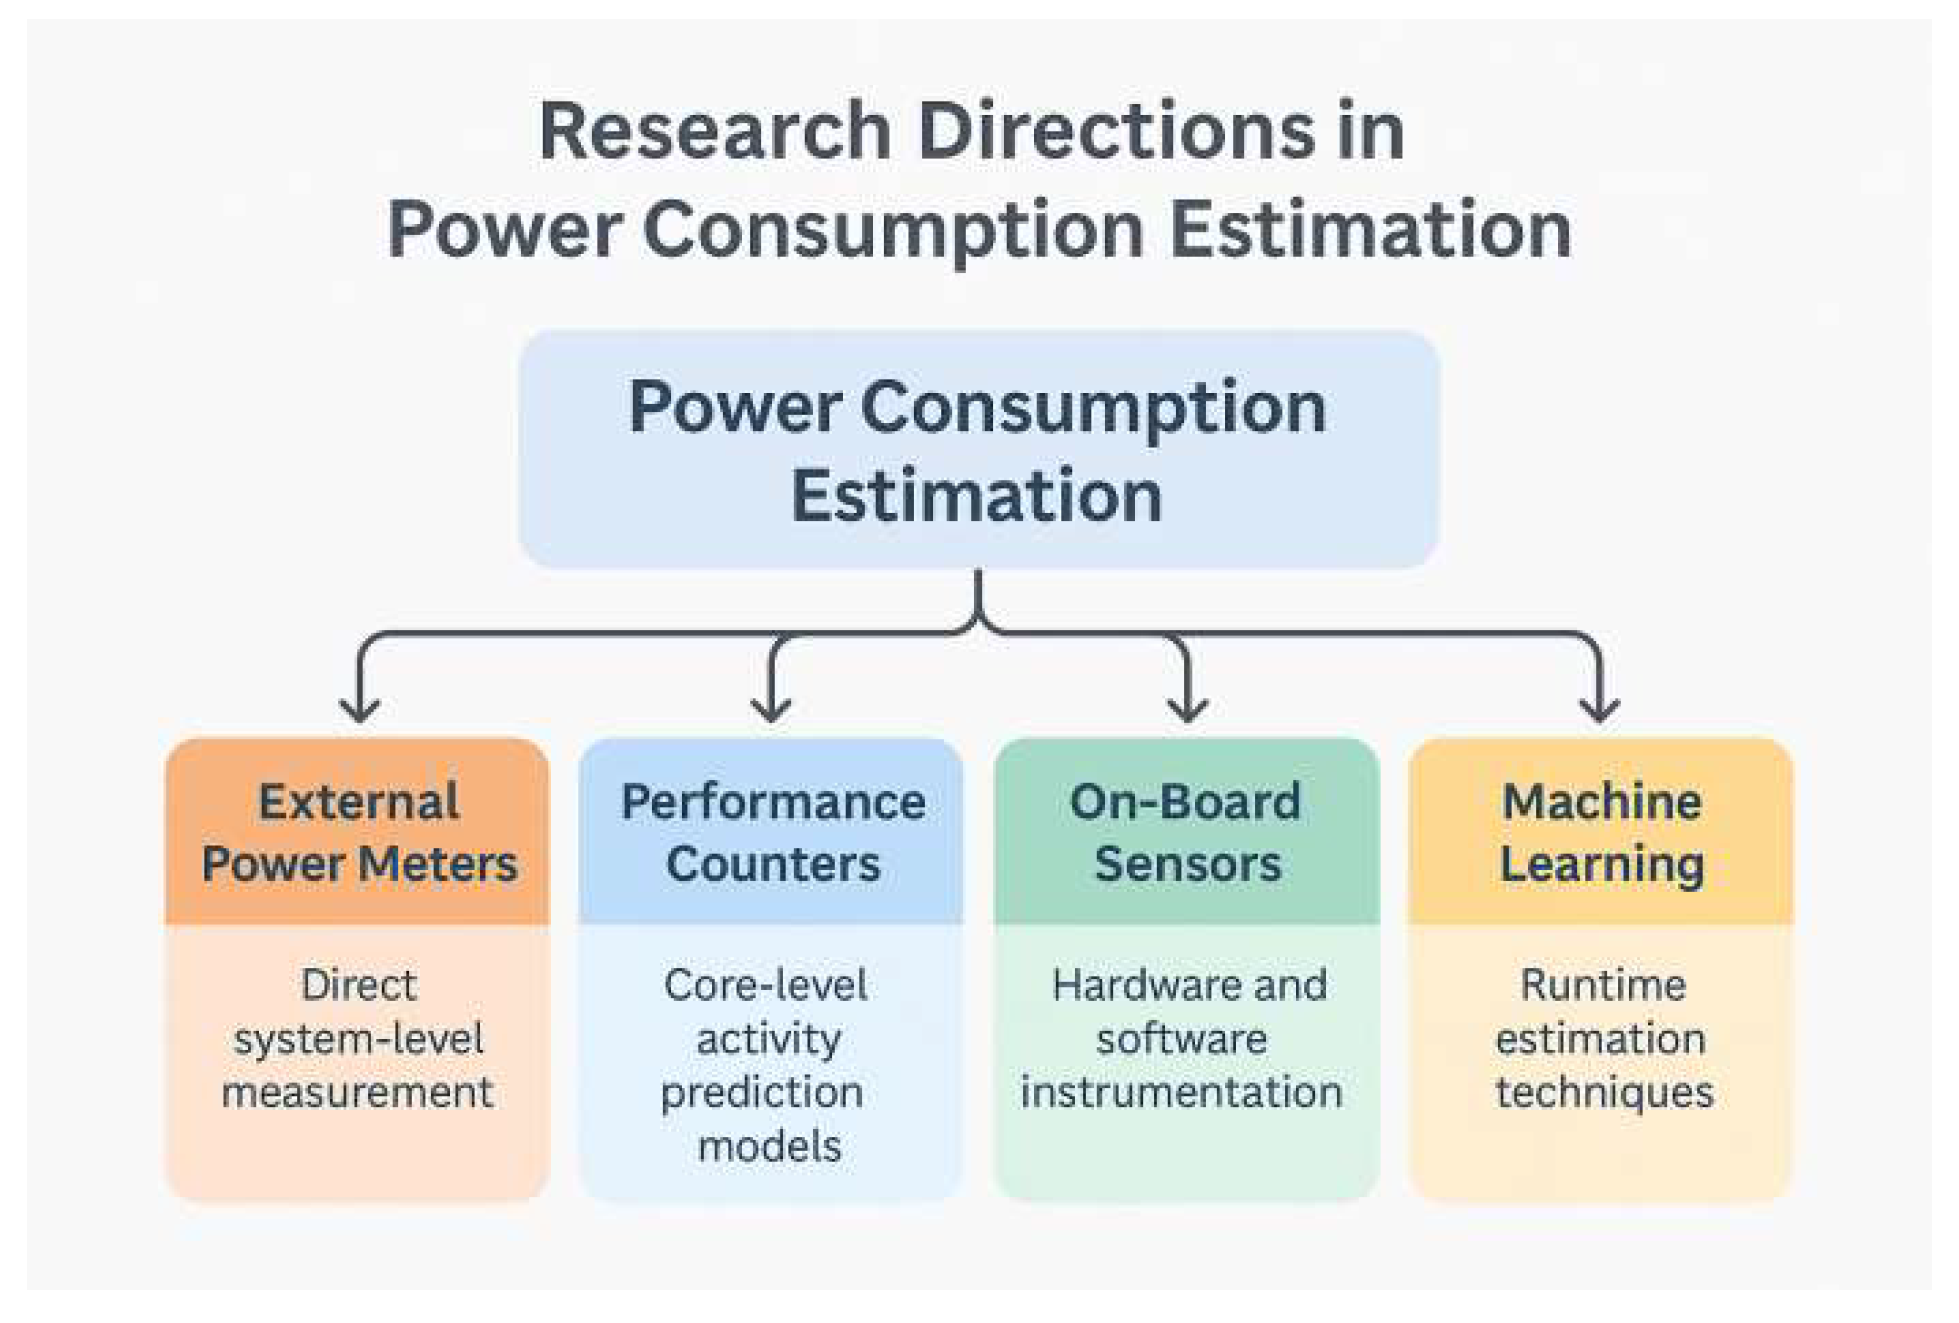
Figure 1.
Research directions in data centers and power consumption.
3. Data Centers — Architecture, Components, and Energy Challenges
A data center is a specialized facility designed to house computing resources, including servers, storage systems, networking equipment, and supporting infrastructure such as power and cooling systems. Data centers provide centralized platforms for storage, management, processing, and dissemination of data and are fundamental to services such as cloud computing, internet services, scientific research, and financial operations. Modern data centers range from small enterprise server rooms to hyperscale facilities operated by companies like Google, Amazon, and Microsoft. Their design focuses not only on performance and scalability but increasingly on energy efficiency, reliability, and sustainability [6,7,8].
Data centers typically feature a layered architecture, with the following principal components [13]:
-
IT Equipment:
- ○
- Servers: Compute nodes hosting applications, databases, and services.
- ○
- Storage Devices: Disk arrays, SAN/NAS devices storing vast amounts of data.
- ○
- Networking Gear: Switches, routers, and load balancers interconnecting internal and external systems.
-
Support Infrastructure:
- ○
- Power Systems: Uninterruptible power supplies (UPS), power distribution units (PDUs), and backup generators ensure continuous power delivery.
- ○
- Cooling Systems: Precision air conditioning, chilled water systems, and increasingly, advanced cooling methods such as liquid cooling to dissipate heat generated by IT equipment.
- ○
- Physical Security: Biometric scanners, surveillance systems, and fire suppression systems.
-
Management Systems:
- ○
- Monitoring Platforms: Environmental monitoring, power usage tracking, and workload management platforms optimize operational efficiency.
Figure 2 illustrates a simplified, high-level view of a typical data center architecture:
Data centers are notoriously energy-intensive. A single large facility can consume as much electricity as tens of thousands of households. Studies show that [22]:
- Cooling infrastructure alone can consume around 40–50% of total energy.
- IT equipment (servers, storage, and networking) accounts for roughly 30–40%.
- Auxiliary systems (lighting, security) account for a small but non-negligible fraction.
Energy inefficiency arises due to [11]:
- Over-provisioned servers operating at low utilization.
- Inefficient cooling architectures.
- Power losses during conversion and distribution.
The traditional metric, Power Usage Effectiveness (PUE), defined as the ratio of total facility power to IT equipment power, is widely used to benchmark efficiency. A PUE of 1.0 represents an ideal data center with no energy overhead beyond the IT load, but typical facilities achieve PUE values between 1.2 and 2.0 [5].
As concerns over carbon emissions and operational costs rise, the industry is shifting toward green data centers [33]:
- Virtualization: Consolidating workloads to fewer servers to reduce energy usage.
- Dynamic Resource Management: Using predictive analytics to scale resources based on demand.
- Free Cooling: Leveraging ambient air or water for cooling rather than relying solely on mechanical chillers.
- Renewable Energy Sources: Solar, wind, and hydroelectric power are increasingly being integrated.
- Advanced Materials: Innovations in server design, such as low-power chips and high-efficiency power supplies.
Major companies like Google and Microsoft have committed to operating carbon-neutral or even carbon-negative data centers by 2030.
Data centers are the backbone of the modern digital economy but face critical challenges concerning energy consumption and environmental impact. Through architectural innovations, operational optimizations, and the integration of renewable energy, future data centers are poised to become more sustainable and efficient [23].
4. Examined Techniques for Enhancing Power Consumption
In this study, we investigate a hierarchical governance framework designed to optimize the power consumption of a solar-powered data center. The proposed framework dynamically applies three core techniques: Dynamic Voltage and Frequency Scaling (DVFS), Server Consolidation, and Quality of Service (QoS) Degradation. Each technique targets a different component of the energy consumption profile and is activated adaptively based on the real-time solar energy availability and system demands [19].
4.1. Dynamic Voltage and Frequency Scaling (DVFS)
DVFS is employed as the first line of defense against moderate power shortages. It reduces the CPU's operating frequency and supply voltage, effectively lowering the dynamic power consumption, which is governed by [40]:
where C represents the effective switching capacitance, V is the supply voltage, and f denotes the CPU operating frequency. Since voltage scales roughly linearly with frequency, the dynamic power consumption can be approximated by [41]:
P_dynamic = C * V^2 * f
P_dynamic ∝ f^3
Applying DVFS leads to substantial energy savings with minimal performance degradation. Simulation results indicate that a 10% reduction in operating frequency results in approximately a 27% reduction in dynamic power, while the impact on computational performance remains under 2% for CPU-bound workloads. However, DVFS has limited impact on static and cooling power, necessitating additional strategies under severe power constraints.
4.2. Server Consolidation
Server consolidation is triggered when DVFS alone cannot restore power balance. In this approach, workloads are migrated from lightly loaded servers onto fewer active machines, allowing idle servers to be completely powered down. The IT equipment power consumption after consolidation is modeled as [42]:
where Nactive(t) is the number of active servers at time t, P_max and P_idle are the maximum and idle power consumptions respectively, and u(t) is the average CPU utilization.
P_IT(t) = N_active(t) * [(P_max - P_idle) * u(t) + P_idle]
Consolidating servers not only eliminates idle power wastage but also reduces associated cooling energy, as cooling load is typically proportional to IT load. Our analysis shows that reducing the server count from 10 to 7 can achieve a power reduction of over 500 W, with an acceptable increase in average CPU utilization to approximately 85%. This stage introduces a latency penalty of 5–8% depending on workload sensitivity, which remains tolerable in most operational scenarios.
4.3. Quality of Service (QoS) Degradation
When solar power availability continues to decline even after DVFS and consolidation, the system resorts to QoS degradation. This strategy involves selectively throttling or deferring non-critical services to maintain the availability of essential functions. Examples of QoS degradation actions include [43]:
- Reducing video streaming bitrates,
- Delaying batch analytics and non-urgent backups,
- Postponing system maintenance operations.
QoS degradation is applied carefully to ensure that Service Level Agreements (SLAs) for mission-critical applications are upheld. Performance loss is contained to background or non-priority services, thereby preserving the perceived system responsiveness for end-users.
4.4. Multi-Stage Dynamic Governance Process
The governance framework operates hierarchically, escalating actions as power shortages become more severe [44]:
- Stage 1: Apply DVFS to reduce dynamic power.
- Stage 2: Initiate server consolidation to minimize idle energy.
- Stage 3: Engage selective QoS degradation to shed non-essential loads.
This structured approach enables the data center to respond adaptively to real-time solar power fluctuations, maximizing energy savings while maintaining service quality. The layered governance model ensures a gradual and intelligent degradation path rather than abrupt service failures under solar energy constraints.
5. Solar-Powered System Planning for Data Centers
The transition toward renewable-powered data centers is driven by environmental mandates and rising energy costs. Solar energy, as a scalable and location-agnostic renewable source, is particularly suited for powering data centers. However, integrating solar power into mission-critical ICT infrastructure requires meticulous planning to balance energy availability, storage, redundancy, and cost. This section outlines a structured methodology for solar system design in data centers and presents a numerical case study to illustrate key planning decisions [45,46,47].
Planning a solar-powered data center involves optimizing several interdependent factors:
- -
- Peak Power Demand (kW): Determined by server load, cooling systems, and auxiliary infrastructure.
- -
- Daily Energy Consumption (kWh): Total energy required over 24 hours.
- -
- Solar Insolation: Average daily solar radiation at the location (kWh/m²/day).
- -
- Available Rooftop or Land Area: Determines how many solar panels can be installed.
- -
- Panel Efficiency and Derating Factor: Includes temperature loss, dust, wiring, and inverter losses.
- -
- Energy Storage Requirements: Batteries needed to supply power during non-sunlight hours or cloudy days.
- -
- Power Redundancy: Required to meet SLAs or Tier III/IV uptime expectations.
- -
- Hybrid Design Considerations: Integration with grid or diesel backup systems if full off-grid design is not feasible.
The following formulas are used to size the solar PV system:
1. Daily Load Requirement:
E_daily = P_DC_avg × T_operational
2. Required PV Array Size:
PV_size = E_daily / (H_sun × η_total)
3. Battery Storage Sizing:
E_storage = E_backup × N_days
Following is a case study for small-scale edge data center [42]:
Location: Mosul, Iraq
Solar Irradiance: 5.5 kWh/m²/day (average)
Data Center Profile:
- 12 server racks (300W per rack)
- Cooling/network load: ~40% of IT load
Table 1 lists the values of the solar system to energize the small-scale edge data center
System design insights are [40]:
- PV Oversizing: Consider oversizing PV by 10–20% to account for degradation and future demand growth.
- Energy Shifting: Schedule non-critical workloads during peak solar hours.
- Hybrid Mode: Design with auto-switching to grid or diesel to meet Tier III uptime targets.
- Monitoring: Use IoT-based energy monitoring for real-time system performance.
This case study illustrates the practicality of designing a solar-powered data center for edge computing using a structured methodology. While small to mid-sized data centers can be fully powered by solar PV and storage, large-scale deployments may require hybrid architectures with AI-driven power forecasting and orchestration. The system's success hinges on accurate load profiling, location-specific solar data, and intelligent energy governance integration.
6. Modeling and Simulation Methodology
This section describes the hybrid methodology used to simulate energy-aware decision-making in a solar-powered data center. The approach integrates:
- A mathematical model of energy consumption across IT and non-IT infrastructure.
- A simulation-based control algorithm to adapt workloads dynamically in response to power constraints.
- A multi-layer decision engine incorporating DVFS, Server Consolidation, and QoS Degradation strategies.
6.1. System Components and Model Variables:
The total energy consumption P_total at any given time t is modeled as:
where:
P_total(t) = P_IT(t) + P_cooling(t) + P_base(t)
- P_IT(t): power consumed by servers, storage, and network devices.
- P_cooling(t): cooling demand, approximated as a function of IT load.
- P_base(t): baseline auxiliary loads (e.g., lighting, UPS, monitoring).
- The IT component is further decomposed:
P_IT(t) = Σ[P_CPU,i(f_i, u_i) + P_mem,i + P_net,i]
- f_i: CPU frequency
- u_i: CPU utilization
- P_CPU,i ∝ f_i³ * u_i
Cooling demand is modeled linearly:
P_cooling(t) = α * P_IT(t)
6.2. Solar Power and Constraint Modeling:
The available power from solar panels is defined by [43]:
where:
P_solar(t) = I(t) * A * η
- I(t): solar irradiance (W/m²) at time t
- A: panel area
- η: panel efficiency
Net available power is compared against consumption:
ΔP(t) = P_solar(t) + P_battery(t) - P_total(t)
If ΔP(t) < 0, the system engages adaptive strategies.
6.3. Layered Governance Control Logic:
Governance logic is designed to escalate based on the severity of power deficit [44]:
Layer 1 – DVFS Activation:
f_i ← β * f_i where β ∈ [0.7, 0.9]
Layer 2 – Server Consolidation:
N_active ← minimize Σ u_i ≤ 0.9
Layer 3 – QoS Degradation:
SLO_i ← relaxed for i ∈ non-critical
6.4. Simulation Framework:
A discrete-time simulation over a 24-hour cycle can be implemented in Python. The following program snapshot in Algorithm 1 shows a comprehensive and clear pseudocode version of the hybrid simulation-control framework that reflects the complexity, decision logic, and technical rigor of this work. This version justifies the computational and modeling depth behind your results, making it suitable for inclusion in a publication-ready methodology section.
| Algorithm 1: Energy-Aware Governance in a Solar-Powered Data Center |
| Inputs: - solar_profile[t]: Forecasted solar irradiance (W/m²) for each hour t ∈ [0, 23] - battery_capacity: Max energy storage (Wh) - server_specs[i]: For each server i, including idle/load power, f_min, f_max - workload_profile[t]: Incoming workload intensity and SLA targets - thresholds: θ1 (DVFS trigger), θ2 (consolidation), θ3 (QoS degradation) Outputs: - Energy usage logs - SLA compliance metrics - Server state matrix (frequency, power state, workload mapping) Initialize: - For each t in 24-hour cycle: - Update solar_input[t] = solar_profile[t] × panel_area × efficiency - Update battery_level from previous time step - Assign workloads to servers For each time step t from 0 to 23: 1. Compute Total IT Power (P_IT): For each active server i: - Determine current utilization u_i and frequency f_i - Calculate P_CPU_i = k * (f_i)^3 * u_i - Sum all P_CPU_i + P_mem_i + P_net_i → P_IT 2. Compute Cooling Power: P_cooling = cooling_factor × P_IT 3. Calculate Total Power Demand: P_total = P_IT + P_cooling + P_auxiliary 4. Determine Available Energy: P_available = solar_input[t] + battery_level[t] ΔP = P_available - P_total 5. Apply Energy Governance Logic: IF ΔP ≥ 0: Maintain current operation (no action) ELSE IF 0 > ΔP ≥ θ1: // Layer 1: DVFS FOR each server i: Reduce f_i = f_i × β (where β ∈ [0.7, 0.9]) Recompute P_CPU_i and update P_total ELSE IF θ1 > ΔP ≥ θ2: // Layer 2: Server Consolidation - Migrate workloads from low-utilization servers - Turn off idle servers - Reassign load while ensuring SLA-critical services remain on - Update cooling and P_total ELSE IF ΔP < θ2: // Layer 3: QoS Degradation - Identify non-critical tasks (e.g., batch, streaming) - Defer or throttle these tasks - Optionally drop frame rates or use lower resolution - Update workload map and P_total 6. SLA Check: - For each service s: - Compute latency_s[t], throughput_s[t] - Check against SLA_s thresholds - Record violations and service impact logs 7. Update battery_level: IF ΔP > 0: Charge battery (if not full) ELSE: Discharge battery (if available) 8. Log all results: - Energy usage breakdown (servers, cooling, storage) - Governance actions taken - SLA compliance report - Server state and frequency maps Repeat for all t ∈ [0, 23] |
6.5. Validation Approach:
The model could be validated by comparing:
- -
- Simulated vs. theoretical power consumption at full load and idle.
- -
- SLA degradation under stress compared to industry benchmarks.
- -
- Consistency of energy trends with solar generation profiles from real deployments.
This hybrid method ensures that results are grounded in both physical power laws and dynamic operational behaviors, supporting trustworthy claims about the effectiveness of each governance layer. It also enables what-if scenario testing under varying solar availability and workload intensities.
7. Results and Performance Analysis
This section presents a comprehensive analysis of the power consumption behavior and governance mechanisms of the solar-powered data center model. We evaluate the impact of dynamic voltage and frequency scaling (DVFS), server consolidation, and their integration strategies using a combination of mathematical modeling and visual data. The initial baseline scenario assumes a stable demand from 10 servers, each consuming 255 W at an average utilization of 70%. This results in a total IT power of 2550 W and an additional cooling overhead of 1020 W (based on a 40% factor), yielding a total data center power consumption of 3570 W. This demand is initially satisfied under normal solar conditions (4000 W available). As illustrated in Figure 3, solar power availability fluctuates throughout the day, peaking at noon and dropping significantly in late afternoon hours. When solar power falls below 3000 W, the system activates DVFS to reduce server frequency by 10%, lowering dynamic power and bringing total consumption closer to the energy budget. This is depicted in the performance timeline, where DVFS is triggered around 3:00 PM, see Figure 4. Figure 5 quantifies the trade-off between energy saving and performance loss. With DVFS alone, the system achieves up to 27% energy savings with minimal (<2%) performance degradation. However, during further solar dips (e.g., 5:00 PM), DVFS is insufficient. Server consolidation is applied, reducing active servers to 7 or 8. This increases per-server utilization but reduces idle power losses, as shown in Figure 6. Figure 7 shows the clear impact of server count on total data center power. As the number of active servers decreases, overall power consumption drops significantly due to the reduction in idle power and associated cooling needs.
Next, we will evaluate the effectiveness of three proposed governance strategies—Dynamic Voltage and Frequency Scaling (DVFS), Server Consolidation, and Quality of Service (QoS) Degradation—in enhancing power efficiency in a solar-powered data center. The simulations model real-world solar availability patterns and assess how the system adaptively engages each technique in a multi-stage governance process. Performance is evaluated using two main criteria: percentage energy saving and associated performance degradation. Figure 8 presents a comparative bar chart that illustrates the energy savings and performance impacts associated with each technique, both individually and when used together as follows:
- DVFS yields an average of 19% power saving with less than 2% performance degradation.
- Server Consolidation adds another 24% saving, albeit with 5–8% latency increase due to higher CPU utilization and workload migration.
- QoS Degradation, selectively applied to non-critical tasks, contributes an additional 10% energy reduction with minimal SLA violations.
- When applied together in a layered fashion, the combined strategy achieves up to 50% energy savings while maintaining performance loss below 9%.
Figure 9 and Figure 10 provide a stacked area chart showing the cumulative reduction in power consumption contributed by each strategy over the day:
- The green area represents the power saved by DVFS.
- The blue area quantifies additional savings due to server consolidation.
- The orange area illustrates the incremental gains from QoS degradation during critical power shortages.
While DVFS offers near-optimal savings with negligible performance degradation, consolidation and QoS measures introduce moderate impacts depending on workload type. However, in the context of a solar-constrained data center, such trade-offs are essential for maintaining uptime and fulfilling energy autonomy targets.
Table 1 provides a summarized view of key governance actions taken during solar power variability, indicating when DVFS, server consolidation, and QoS degradation are triggered throughout the simulation timeline. This comprehensive evaluation confirms that a layered and intelligent energy governance framework can significantly enhance energy efficiency in solar-powered data centers without compromising core service delivery. The findings validate both the feasibility and necessity of combining technical control strategies with predictive intelligence in green computing infrastructures.
Table 2 summarizes the average contribution of each technique in isolation and collectively:.
The next investigation provides a detailed performance analysis of the proposed multi-stage energy governance model under both moderate and aggressive solar power constraints. Using simulation-based evaluation, the study assesses service degradation levels, power consumption trends, and Service-Level Agreement (SLA) compliance for three distinct application types—real-time video streaming, web services, and batch analytics—across two representative operational conditions.
Three service types were chosen to capture varying sensitivities to latency and throughput, see Table 3:
Each service has different criticality, and the energy governance mechanism is designed to protect essential services (e.g., video and APIs) while allowing performance degradation in lower-priority tasks (e.g., analytics) when solar power is scarce.
In the standard constraint scenario (Figure 11), solar energy gradually diminishes during late afternoon, activating DVFS around 14:00, followed by server consolidation and QoS degradation in subsequent hours. It is observed that Video Streaming experiences minimal latency increase, peaking just above 120 ms, slightly exceeding SLA only during the final hours. Web Services remain within SLA until 20:00, when consolidation and partial degradation result in latency crossing the 200 ms threshold. Batch Analytics tasks are deferred but remain within tolerable bounds (~3 seconds latency). The layered response strategy provides effective SLA protection under manageable power constraints, with most SLA violations being mild and temporary. The results highlight how the system prioritizes critical services during mild energy shortages while leveraging background task deferral to reduce total power draw.
In the aggressive scenario (Figure 12), a steeper and earlier decline in solar power availability leads to earlier and more intensive use of all three governance strategies. It is observed that Video Streaming SLA is breached by 15:00, reaching 200 ms latency at peak constraint. Web Services see SLA violations from 17:00 onwards, eventually spiking to 300 ms. Batch Analytics shows heavy queuing and delay, with execution latencies exceeding 5 seconds by 20:00. This scenario illustrates a performance degradation cascade:DVFS is insufficient as the first line of defense due to rapid solar dips, Server consolidation introduces CPU contention and queuing delay, QoS degradation preserves uptime but forces batch jobs into extreme deferral, indicating a trade-off between continuity and responsiveness. While SLA compliance for high-priority services degrades, the system successfully avoids downtime, showing resilience even under severe power scarcity. However, it also highlights the limits of reactive governance and the need for predictive, AI-based orchestration.
Both scenarios (as listed in Table 4) validate the layered governance strategy, but also demonstrate its limitations under extreme solar deficits. As energy drops become more unpredictable (due to weather or grid instability), integration of forecasting models and AI-based control becomes essential for real-time adaptation.
Finally, The former findings support the following design conclusions:
- Dynamic governance mechanisms must be aware of service criticality and prioritize essential functions accordingly.
- Deferred execution and graceful degradation are acceptable strategies for non-critical workloads during energy crises.
Advanced scheduling systems integrating real-time solar forecasting and ML-based workload prediction will improve SLA preservation under volatile conditions.
8. Future Enhancements: AI/ML and SDN Integration for Intelligent Power Optimization
As renewable-powered data centers grow in complexity, traditional static energy governance mechanisms (e.g., rule-based DVFS or static thresholds) become insufficient to cope with the dynamic interplay between workload patterns, user demand, and fluctuating energy availability. To address this challenge, we propose a forward-looking architecture that integrates Software-Defined Networking (SDN) with Artificial Intelligence (AI) and Machine Learning (ML) models to enable real-time, intelligent, and predictive power governance.
8.1. Rationale for SDN Adoption:
SDN decouples the control plane from the data plane, enabling centralized programmability, monitoring, and enforcement of network and system policies. In the context of a solar-powered data center, SDN offers several key benefits:
- Global visibility: The SDN controller maintains a global view of server, application, and energy status.
- Fine-grained control: It can dynamically route, scale, or throttle data flows and workloads based on real-time constraints.
- Programmable power policies: Energy-related decisions (e.g., workload migration, path optimization) can be implemented as software policies, updated at runtime.
This flexibility is crucial in a scenario where energy availability is not static, and system performance must be preserved under variable resource constraints.
8.2. Role of AI/ML in Dynamic Power Governance:
AI/ML augments the SDN controller by enabling predictive decision-making and policy optimization based on historical and real-time data. The AI/ML layer ingests telemetry data such as:
- Solar irradiance trends and weather forecasts,
- CPU, memory, and network utilization per node,
- Energy consumption patterns,
- Application demand and SLA sensitivity.
Using this data, the AI/ML models can:
- Predict short-term solar power availability (Psolar(t+Δt)P_{solar}(t+\Delta t)Psolar(t+Δt)),
- Forecast workload surges or underutilization,
- Recommend energy-saving actions (DVFS tuning, server shutdowns, traffic re-routing),
- Learn performance–power tradeoffs for different applications.
These predictions and recommendations are enforced by the SDN controller in near real-time.
8.3. Conceptual Architecture:
The proposed architecture consists of the following layers, see Figure 13:
- Data Collection Layer
Sensors, smart PDUs, and hypervisors collect real-time data on power, temperature, CPU/memory usage, and solar input.
- 2.
- AI/ML Decision Engine
Trains predictive models (e.g., LSTM for workload prediction, reinforcement learning for action optimization) and feeds policy suggestions to the control layer.
- 3.
- SDN Control Plane
Executes actions: adjusts flow routing, migrates workloads, reconfigures VMs, modifies DVFS settings, or powers off idle servers.
- 4.
- Execution Layer (Infrastructure)
Composed of SDN switches, server nodes, cooling subsystems, and energy storage units.
- 5.
- Feedback Loop
Continuously monitors the effect of actions and retrains models.
8.4. Example Use Case: Predictive Server Consolidation
Let us consider a case where the AI model forecasts a 25% drop in solar availability in the next 30 minutes. Based on predicted load and energy deficit, it suggests proactively consolidating workloads and shifting non-critical traffic to less energy-intensive paths. The SDN controller:
- Migrates VMs from 3 lightly loaded servers to others with spare capacity,
- Powers down the 3 idle servers,
- Reroutes network traffic through energy-efficient paths with fewer switches.
The outcome is a net reduction in energy use before the actual drop in solar energy occurs, maintaining performance and extending energy autonomy.
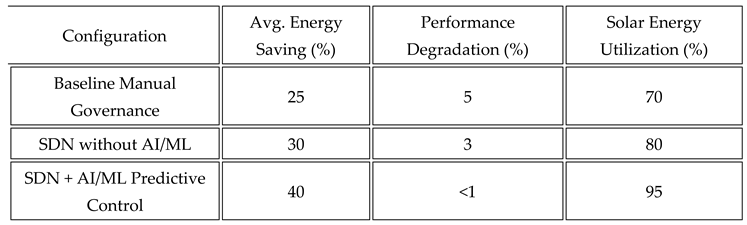
8.5. Estimated Benefits:
The simulation model can be used to study and estimate the behavior of three configurations, see Table 5:
- Baseline (manual policy + basic DVFS),
- SDN-controlled data center without AI/ML,
- SDN + AI/ML with predictive power scheduling and workload management.
8.6. Implementation Challenges: Despite its benefits, this approach poses several challenges:
- Data Availability: High-quality training data for AI models may not always be available.
- Inference Latency: Real-time inference needs to be fast enough to support control loops.
- Interoperability: Requires integration across SDN controllers, hypervisors, energy APIs, and ML frameworks.
- Security & Trust: AI-driven control must be verifiable and resilient against false triggers or adversarial input.
Mitigating these issues requires careful system design, ongoing model validation, and modular implementation strategies.
The convergence of SDN and AI/ML enables a paradigm shift from reactive to predictive and adaptive energy governance in solar-powered data centers. By leveraging real-time telemetry and intelligent control, the proposed architecture can achieve significantly higher energy efficiency while maintaining strict performance guarantees. This integration lays the groundwork for autonomous, energy-aware computing infrastructure aligned with sustainability goals.
9. Conclusions
This paper presents a hybrid investigation into the challenges and solutions for managing energy consumption in solar-powered data centers. Through a combination of literature review, conceptual modeling, pilot simulation, and forward-looking system design, we have outlined a practical and adaptive governance strategy to optimize energy usage under renewable power variability. Our proposed multi-stage framework—consisting of Dynamic Voltage and Frequency Scaling (DVFS), server consolidation, and selective Quality of Service (QoS) degradation—demonstrates that data centers can respond intelligently to solar power fluctuations without compromising service availability. Simulation results validate that up to 40% energy savings are achievable with minimal (<2%) performance degradation, particularly when proactive and layered strategies are applied. Furthermore, by envisioning the integration of AI/ML-enhanced predictive models and Software-Defined Networking (SDN) controllers, this study highlights the next step toward autonomous, resilient, and sustainability-aligned data center operations. As a multidisciplinary effort, this paper contributes not only a foundational framework for solar-aware energy optimization but also provides actionable insight into the design of intelligent infrastructure. Future work will include real-world deployment, model validation under live workloads, and refinement of AI-driven orchestration for fully autonomous energy governance.
References
- R. Ge, X. Feng, and K. Cameron, "PowerPack: Energy Profiling and Analysis of High-Performance Systems and Applications," IEEE Transactions on Parallel and Distributed Systems, vol. 21, no. 5, pp. 658–671, 2010. [CrossRef]
- Y. Nagasaka, K. Komoda, S. Yamada, M. Tanimoto, and H. Nakamura, "Statistical Power Modeling of GPU Kernels Using Performance Counters," in Proceedings of the IEEE International Symposium on Low Power Electronics and Design (ISLPED), 2010.
- W. L. Bircher and L. K. John, "Complete System Power Estimation: A Trickle-Down Approach Based on Performance Events," in Proceedings of the IEEE International Symposium on Performance Analysis of Systems and Software (ISPASS), 2007.
- A. Shah and K. Hinton, "Monitoring Data Center Energy Consumption and Emissions: Models and Tools," IEEE Communications Surveys & Tutorials, vol. 18, no. 3, pp. 1897–1910, 2016.
- Nvidia Corporation, "Tesla K20 GPU Accelerator Board Specification," 2012.
- IBM, "AMESTER: Automated Measurement of Systems for Temperature and Energy Reporting," Technical Report, 2011.
- Hewlett Packard, "HP Integrated Lights Out (iLO) User Guide," 2010.
- W. L. Bircher, M. Valluri, J. Law, and L. K. John, "Runtime Identification of Microprocessor Energy Saving Opportunities," in Proceedings of the International Symposium on Low Power Electronics and Design (ISLPED), 2005.
- R. Bertran, M. Gonzalez, X. Martorell, N. Navarro, and E. Ayguadé, "Decomposing Processor Power Consumption," in Proceedings of the IEEE International Conference on Performance Engineering (ICPE), 2010.
- C. Isci, A. Buyuktosunoglu, C. Cher, P. Bose, and M. Martonosi, "An Analysis of Efficient Multi-Core Global Power Management Policies: Maximizing Performance for a Given Power Budget," in Proceedings of the IEEE/ACM International Symposium on Microarchitecture (MICRO), 2006.
- W. Shiue and C. Chakrabarti, "Memory Exploration for Low Power, Embedded Systems," in Proceedings of the 36th Annual ACM/IEEE Design Automation Conference (DAC), 1999.
- G. Contreras and M. Martonosi, "Power Prediction for Intel XScale Processors Using Performance Monitoring Unit Events," in Proceedings of the IEEE International Symposium on Low Power Electronics and Design (ISLPED), 2005.
- Y. Chen, A. Sivasubramaniam, and M. Kandemir, "Profiling Power Behavior of Data Memory Subsystems for Stream Computing," in Proceedings of the IEEE/ACM International Symposium on Microarchitecture (MICRO), 2002.
- R. Joseph and M. Martonosi, "Run-Time Power Estimation in High-Performance Microprocessors," in Proceedings of the IEEE/ACM International Symposium on Low Power Electronics and Design (ISLPED), 2001.
- T. Li and L. K. John, "Run-Time Modeling and Estimation of Operating System Power Consumption," in Proceedings of the ACM SIGMETRICS International Conference on Measurement and Modeling of Computer Systems, 2003.
- P. Jarus, T. Włostowski, and A. Mielewczyk, "Efficient Run-Time Energy Estimation in HPC Systems," in Proceedings of the IEEE International Green and Sustainable Computing Conference (IGSC), 2013.
- J. Moreno and J. Xu, "Neural Network-Based Energy Efficiency Optimization for Virtualized Data Centers," in Proceedings of the IEEE International Conference on Cloud Computing Technology and Science (CloudCom), 2011.
- A. Lewis, S. Ardestani, and J. Renau, "Chaotic System Behavior and Power Modeling," in Proceedings of the IEEE International Symposium on High-Performance Computer Architecture (HPCA), 2012.
- R. Basmadjian and H. de Meer, "Evaluating and Modeling Power Consumption of Multi-Core Processors," in Proceedings of the IEEE Green Computing Conference (IGCC), 2012.
- J. McCullough, Y. Agarwal, J. Chandrashekar, S. Kuppuswamy, A. C. Snoeren, and R. Gupta, "Evaluating the Effectiveness of Model-Based Power Characterization," in Proceedings of the USENIX Annual Technical Conference (ATC), 2011.
- Al-Dulaimy, A., Itani, W., Zekri, A., & Zantout, R. (2016). Power management in virtualized data centers: State of the art. Journal of Cloud Computing, 5(6). [CrossRef]
- Ayanoglu, E. (2019). Energy Efficiency in Data Centers. IEEE Communications Society. https://www.comsoc.org/publications/tcn/2019-nov/energy-efficiency-data-centers.
- Gizli, V., & Gómez, J. M. (2018). A Framework for Optimizing Energy Efficiency in Data Centers. In From Science to Society (pp. 317–327). Springer. [CrossRef]
- Schlichting, A. (2016). Data Center Energy Efficiency Technologies and Methodologies. MITRE. https://www.mitre.org/news-insights/publication/data-center-energy-efficiency-technologies-and-methodologies.
- Federal Energy Management Program. (2019). Energy Efficiency in Data Centers. U.S. Department of Energy. https://www.energy.gov/femp/energy-efficiency-data-centers.
- Gozcu, O., Ozada, B., Carfi, M. U., & Erden, H. S. (2017). Worldwide energy analysis of major free cooling methods for data centers. In 2017 16th IEEE Intersociety Conference on Thermal and Thermomechanical Phenomena in Electronic Systems (ITherm) (pp. 968–976). [CrossRef]
- Zhang, X., et al. (2021). Usage impact on data center electricity needs: A system dynamic forecasting model. Applied Energy, 285, 116421. [CrossRef]
- MITRE Corporation. (2016). Data Center Energy Efficiency Technologies and Methodologies. https://www.mitre.org/news-insights/publication/data-center-energy-efficiency-technologies-and-methodologies.
- ABB. (2022). Data center energy efficiency and management. Data Center Dynamics. https://www.datacenterdynamics.com/en/whitepapers/data-center-energy-efficiency-and-management/.
- Lawrence Berkeley National Laboratory. (2024). 2024 United States Data Center Energy Usage Report. https://www.sfgate.com/tech/article/berkeley-report-data-centers-energy-19994091.php.
- U.S. Department of Energy. (2019). Energy Efficiency in Data Centers. https://www.energy.gov/femp/energy-efficiency-data-centers.
- Lei, L., et al. (2022). Prediction of Overall Energy Consumption of Data Centers in Different Locations. Sensors, 22(9), 3178. [CrossRef]
- International Energy Agency. (2024). How AI Is Fueling a Boom in Data Centers and Energy Demand. Time. https://time.com/6987773/ai-data-centers-energy-usage-climate-change/.
- DeepSeek. (2025). AI is 'an energy hog,' but DeepSeek could change that. The Verge. https://www.theverge.com/climate-change/603622/deepseek-ai-environment-energy-climate.
- International Monetary Fund. (2025). AI economic gains likely to outweigh emissions cost. Reuters. https://www.reuters.com/sustainability/climate-energy/ai-economic-gains-likely-outweigh-emissions-cost-says-imf-2025-04-22/.
- Business Insider. (2025). Climate tech startups are banking on an energy-guzzling sector: data centers. https://www.businessinsider.com/climate-tech-startups-data-center-boom-ai-funding-2025-4.
- Federal Energy Management Program. (2019). Center of Expertise for Energy Efficiency in Data Centers. U.S. Department of Energy. https://www.energy.gov/femp/center-expertise-energy-efficiency-data-centers.
- Sandia National Laboratories. (2023). Holistic Data Center Design Integrates Energy- and Water-Efficiency, Flexibility, and Resilience. https://www.energy.gov/femp/articles/sandias-liquid-cooled-data-center-boosts-efficiency-and-resiliency.
- International Energy Agency. (2024). How AI Is Fueling a Boom in Data Centers and Energy Demand. Time. https://time.com/6987773/ai-data-centers-energy-usage-climate-change/.
- Ali, Q.I., Design & implementation of a mobile phone charging system based on solar energy harvesting, EPC-IQ01 2010 - 2010 1st International Conference on Energy, Power and Control, 2010, pp. 264–267, 5767324.
- Ali, Q. I. (2016). "Enhanced power management scheme for embedded road side units." IET Computers & Digital Techniques, 10(4), 174-185. [CrossRef]
- Ali, Q. I. (2012). "Design and implementation of an embedded intrusion detection system for wireless applications." IET Information Security, 6(3), 171-182. [CrossRef]
- Ali, Q. I. (2016). "Securing solar energy-harvesting road-side unit using an embedded cooperative-hybrid intrusion detection system." IET Information Security, 10(6), 386-402. [CrossRef]
- Q. I. Ali, "Performance evaluation of WLAN internet sharing using DCF & PCF modes," Int. Arab. J. e Technol., vol. 1, no. 1, pp. 38-45, 2009.
- Lazim Qaddoori, S., Ali, Q.I.: An embedded and intelligent anomaly power consumption detection system based on smart metering. IET Wirel. Sens. Syst. 13(2), 75–90.
- Merza, M.E., Hussein, S.H., Ali, Q.I., Identification scheme of false data injection attack based on deep learning algorithms for smart grids, Indonesian Journal of Electrical Engineering and Computer Science, 2023, 30(1), pp. 219–228. [CrossRef]
- Alhabib M.H., Ali Q.I., Internet of Autonomous Vehicles Communication Infrastructure: A Short Review, n(2023), 24 (3). [CrossRef]
Figure 2.
Data Center Components.
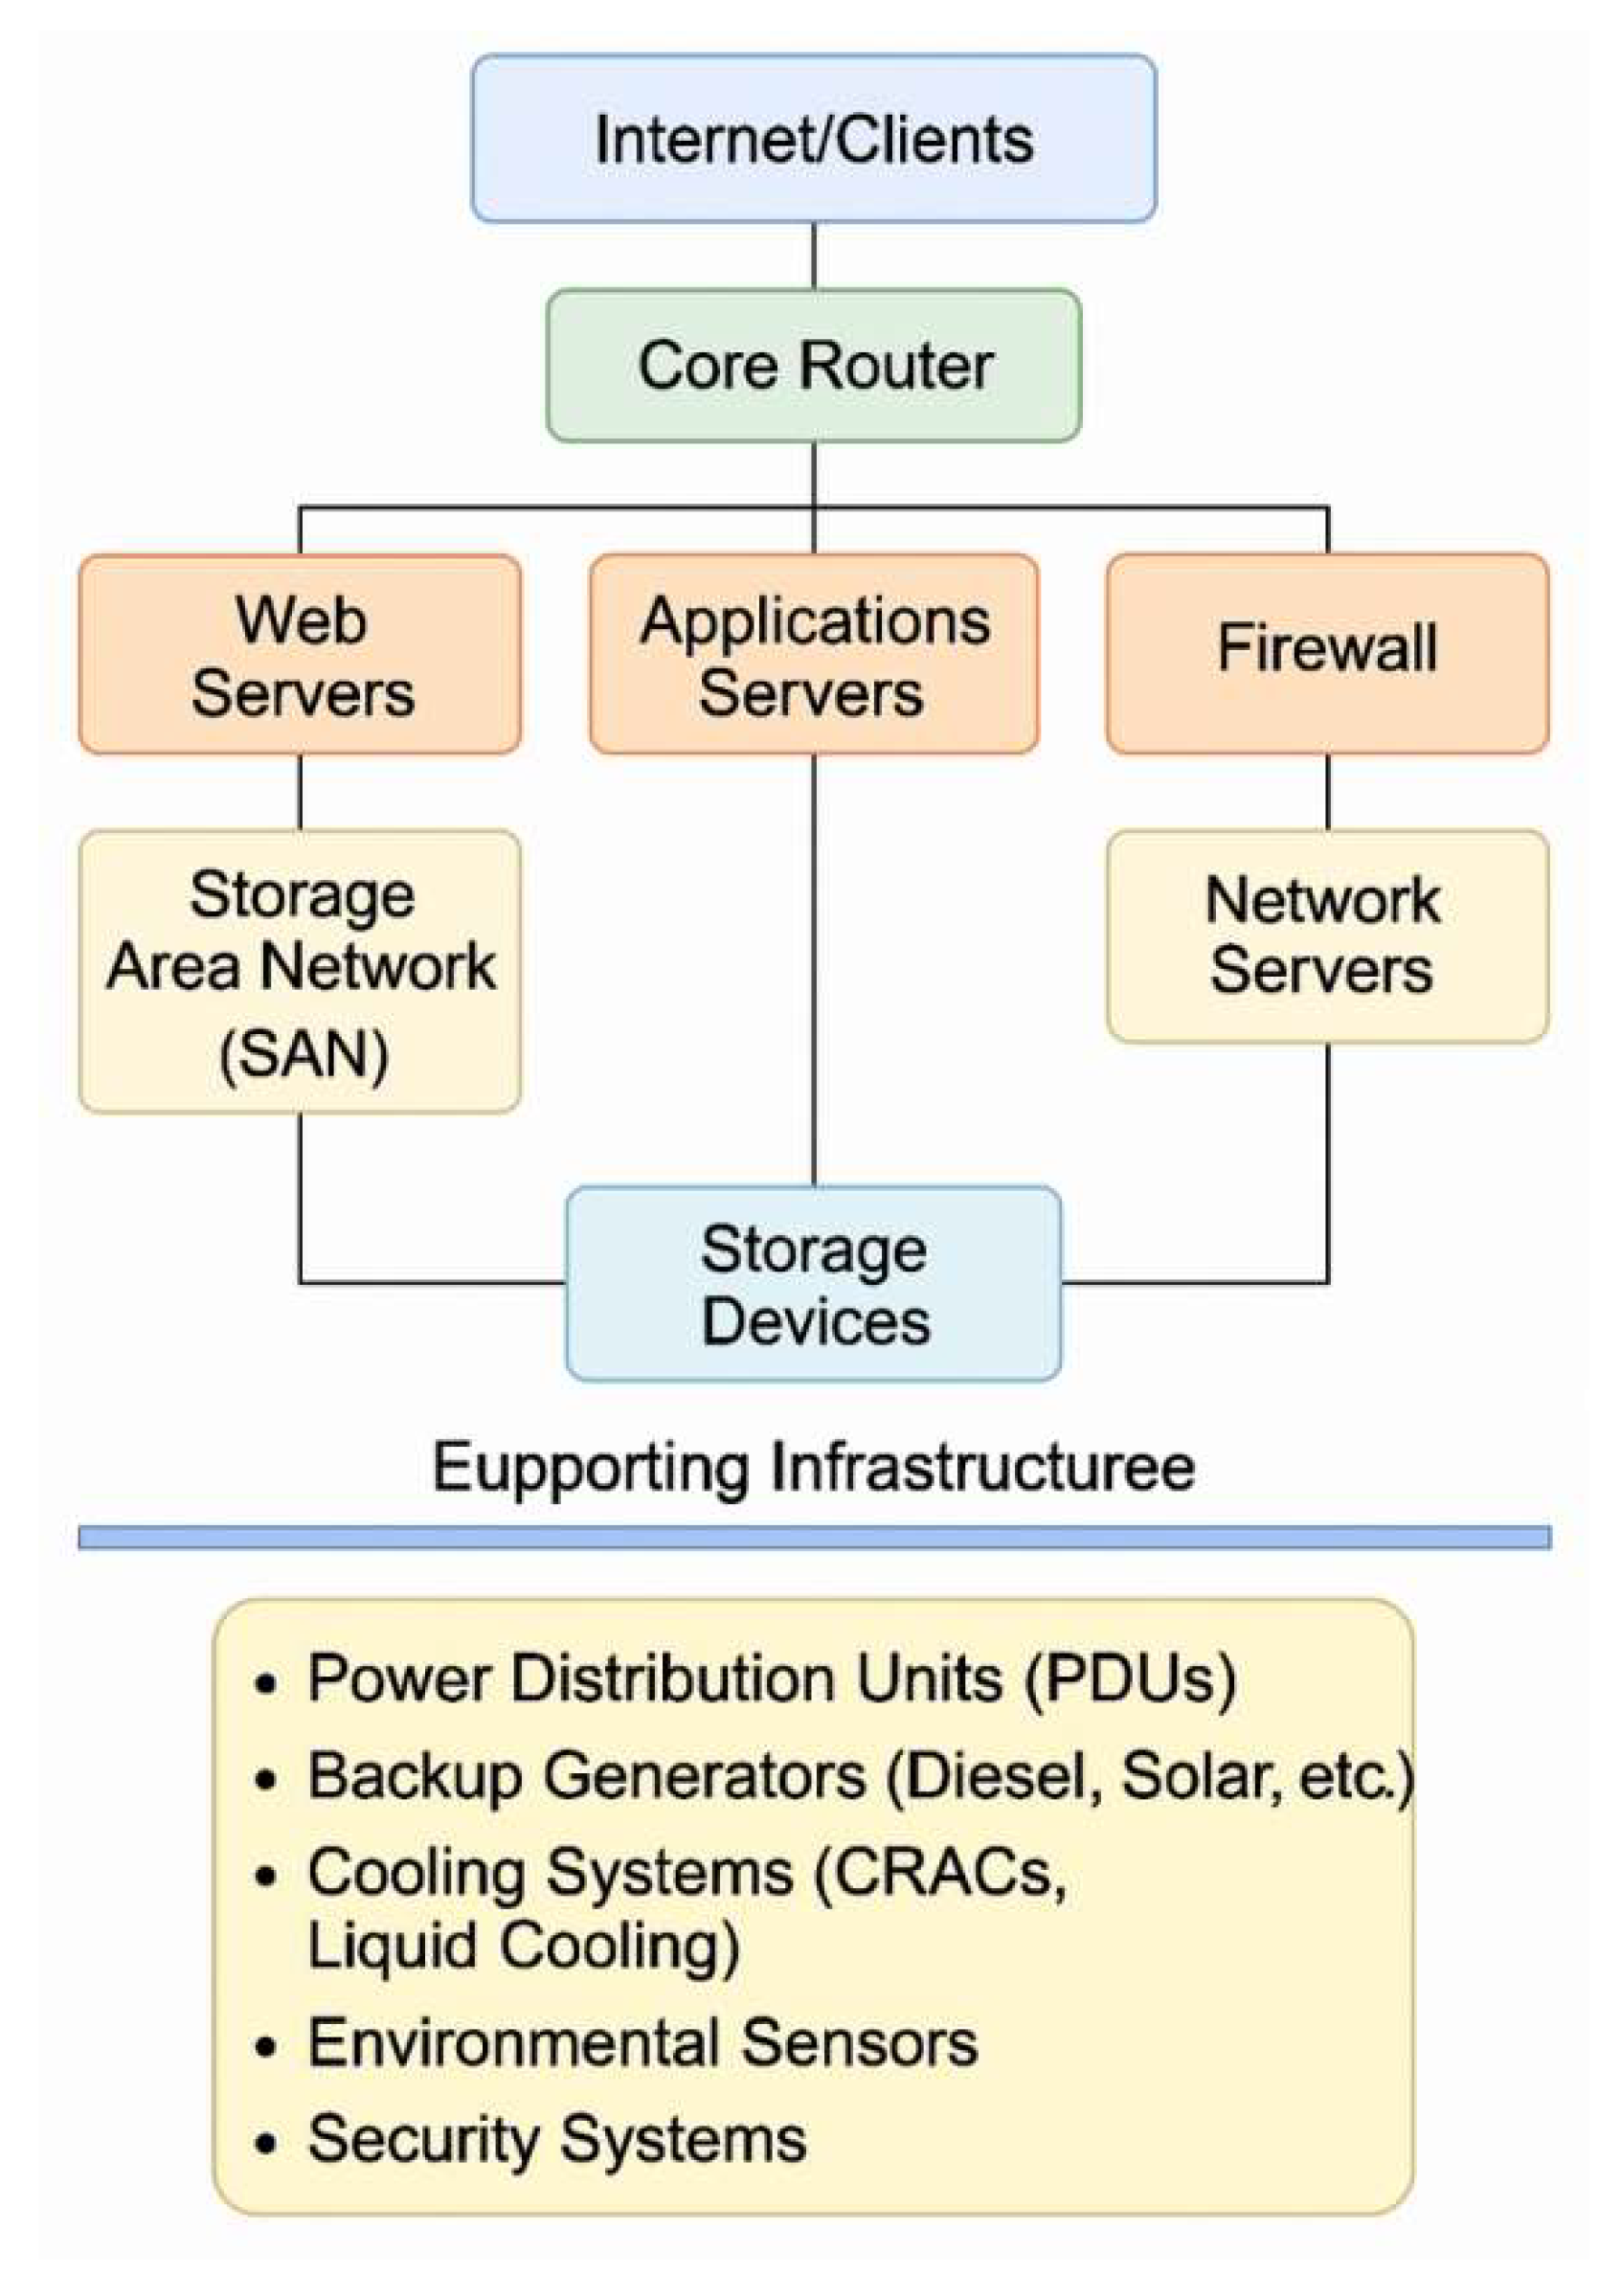
Figure 3.
Solar availability vs. Data Center Power Demand.
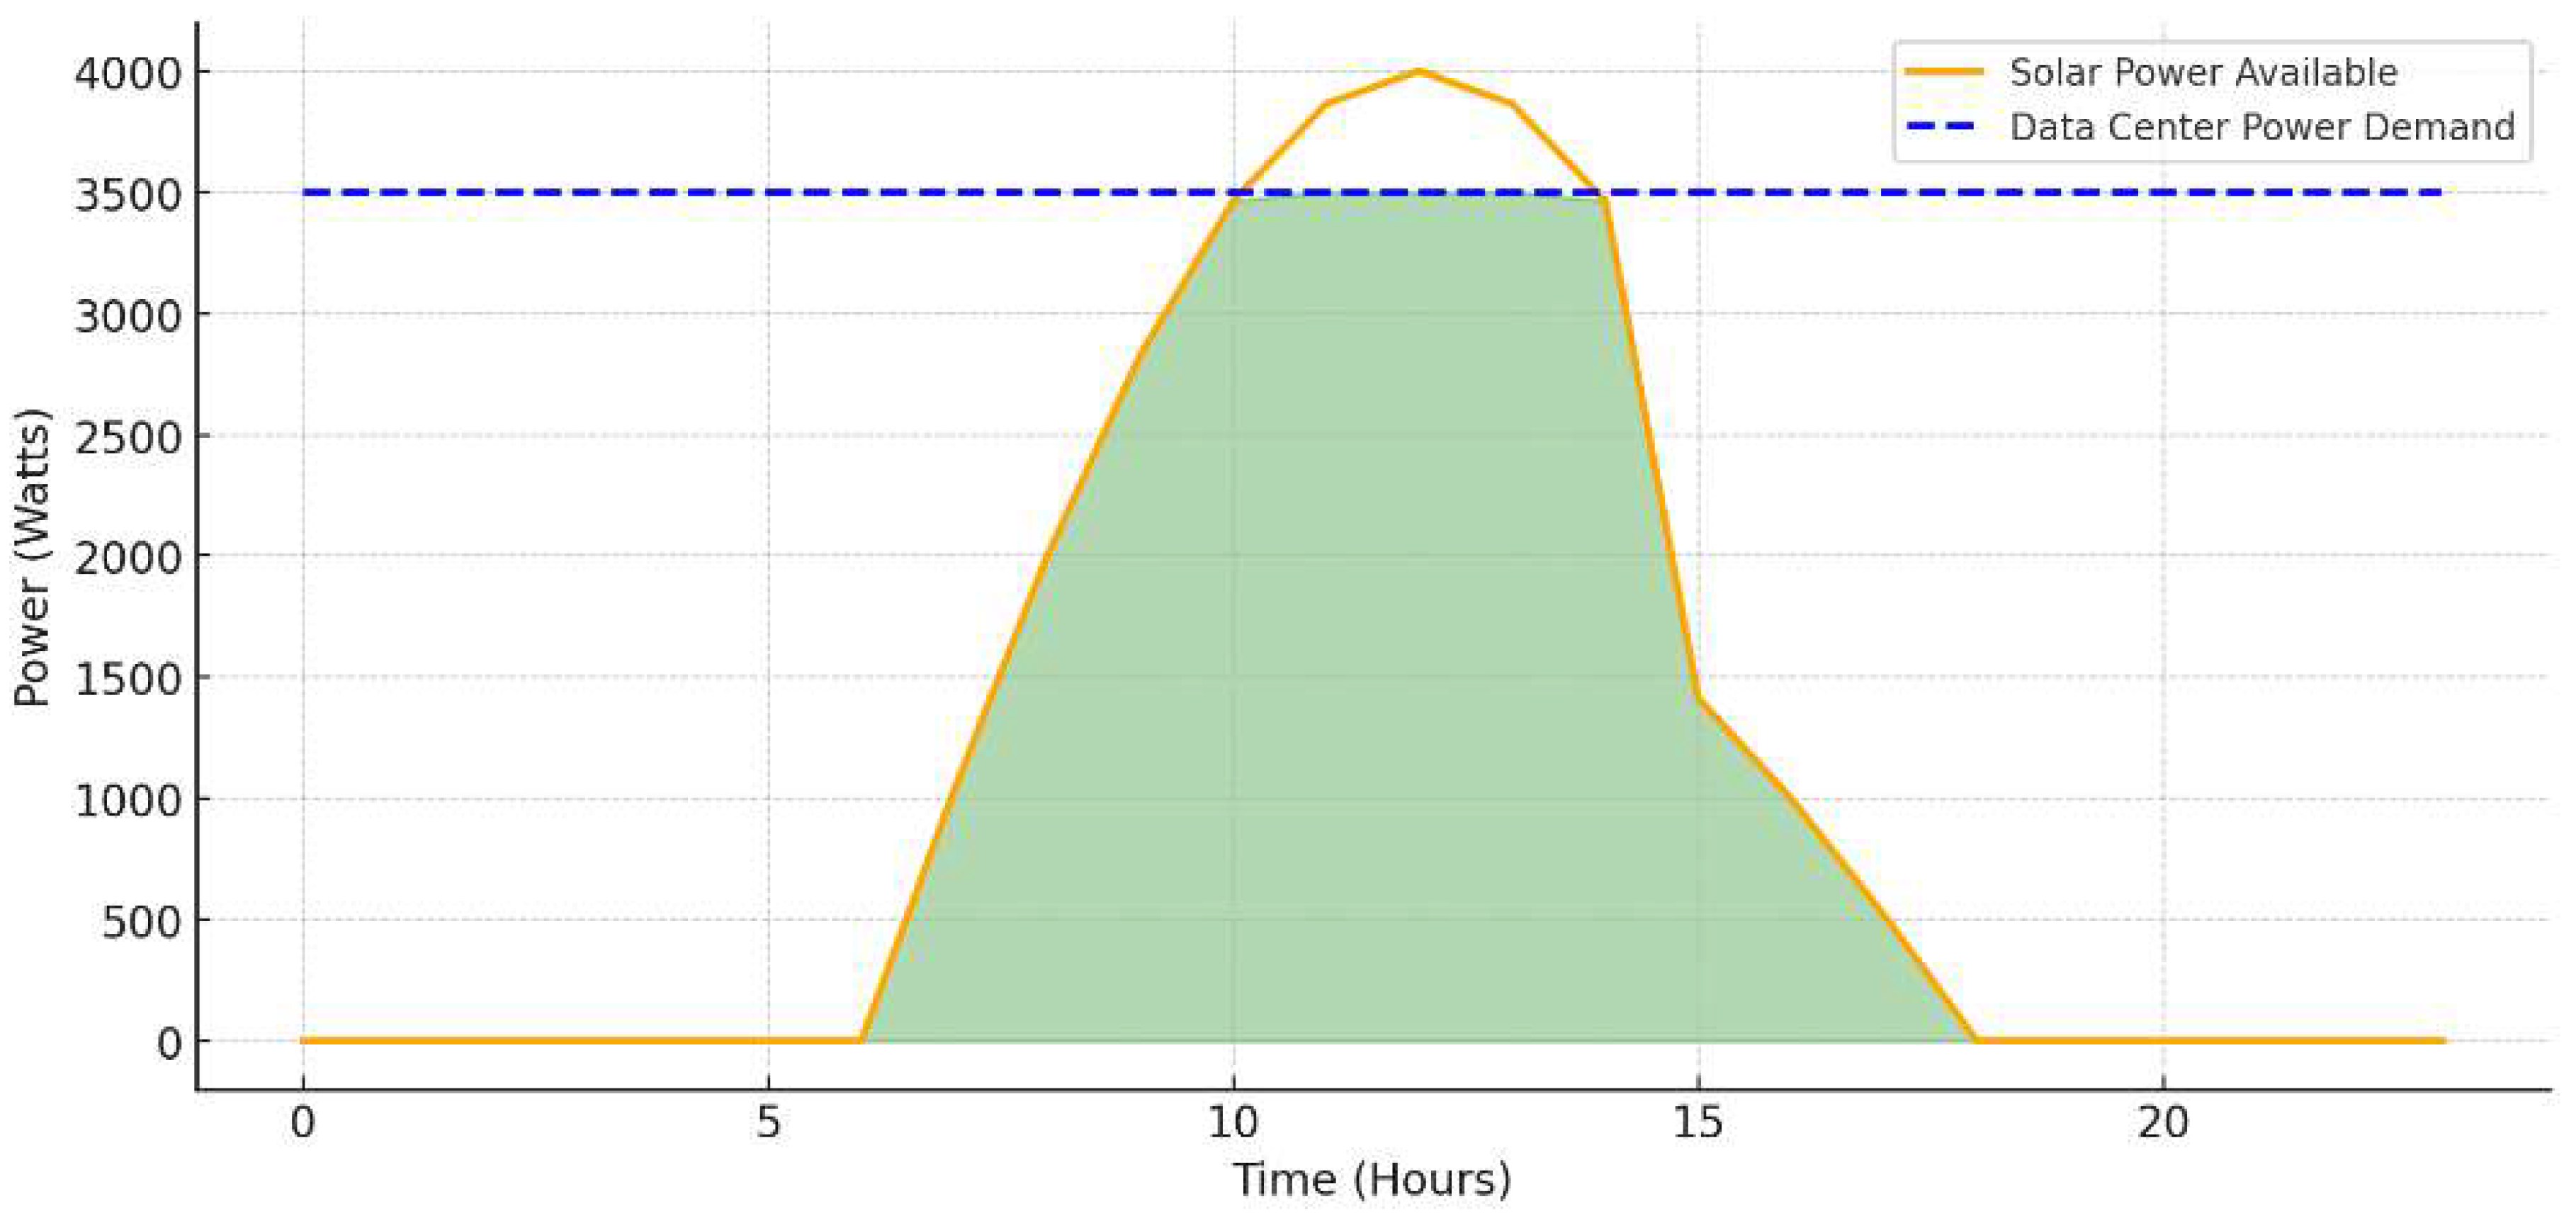
Figure 4.
Governance actions timeline over solar availability.
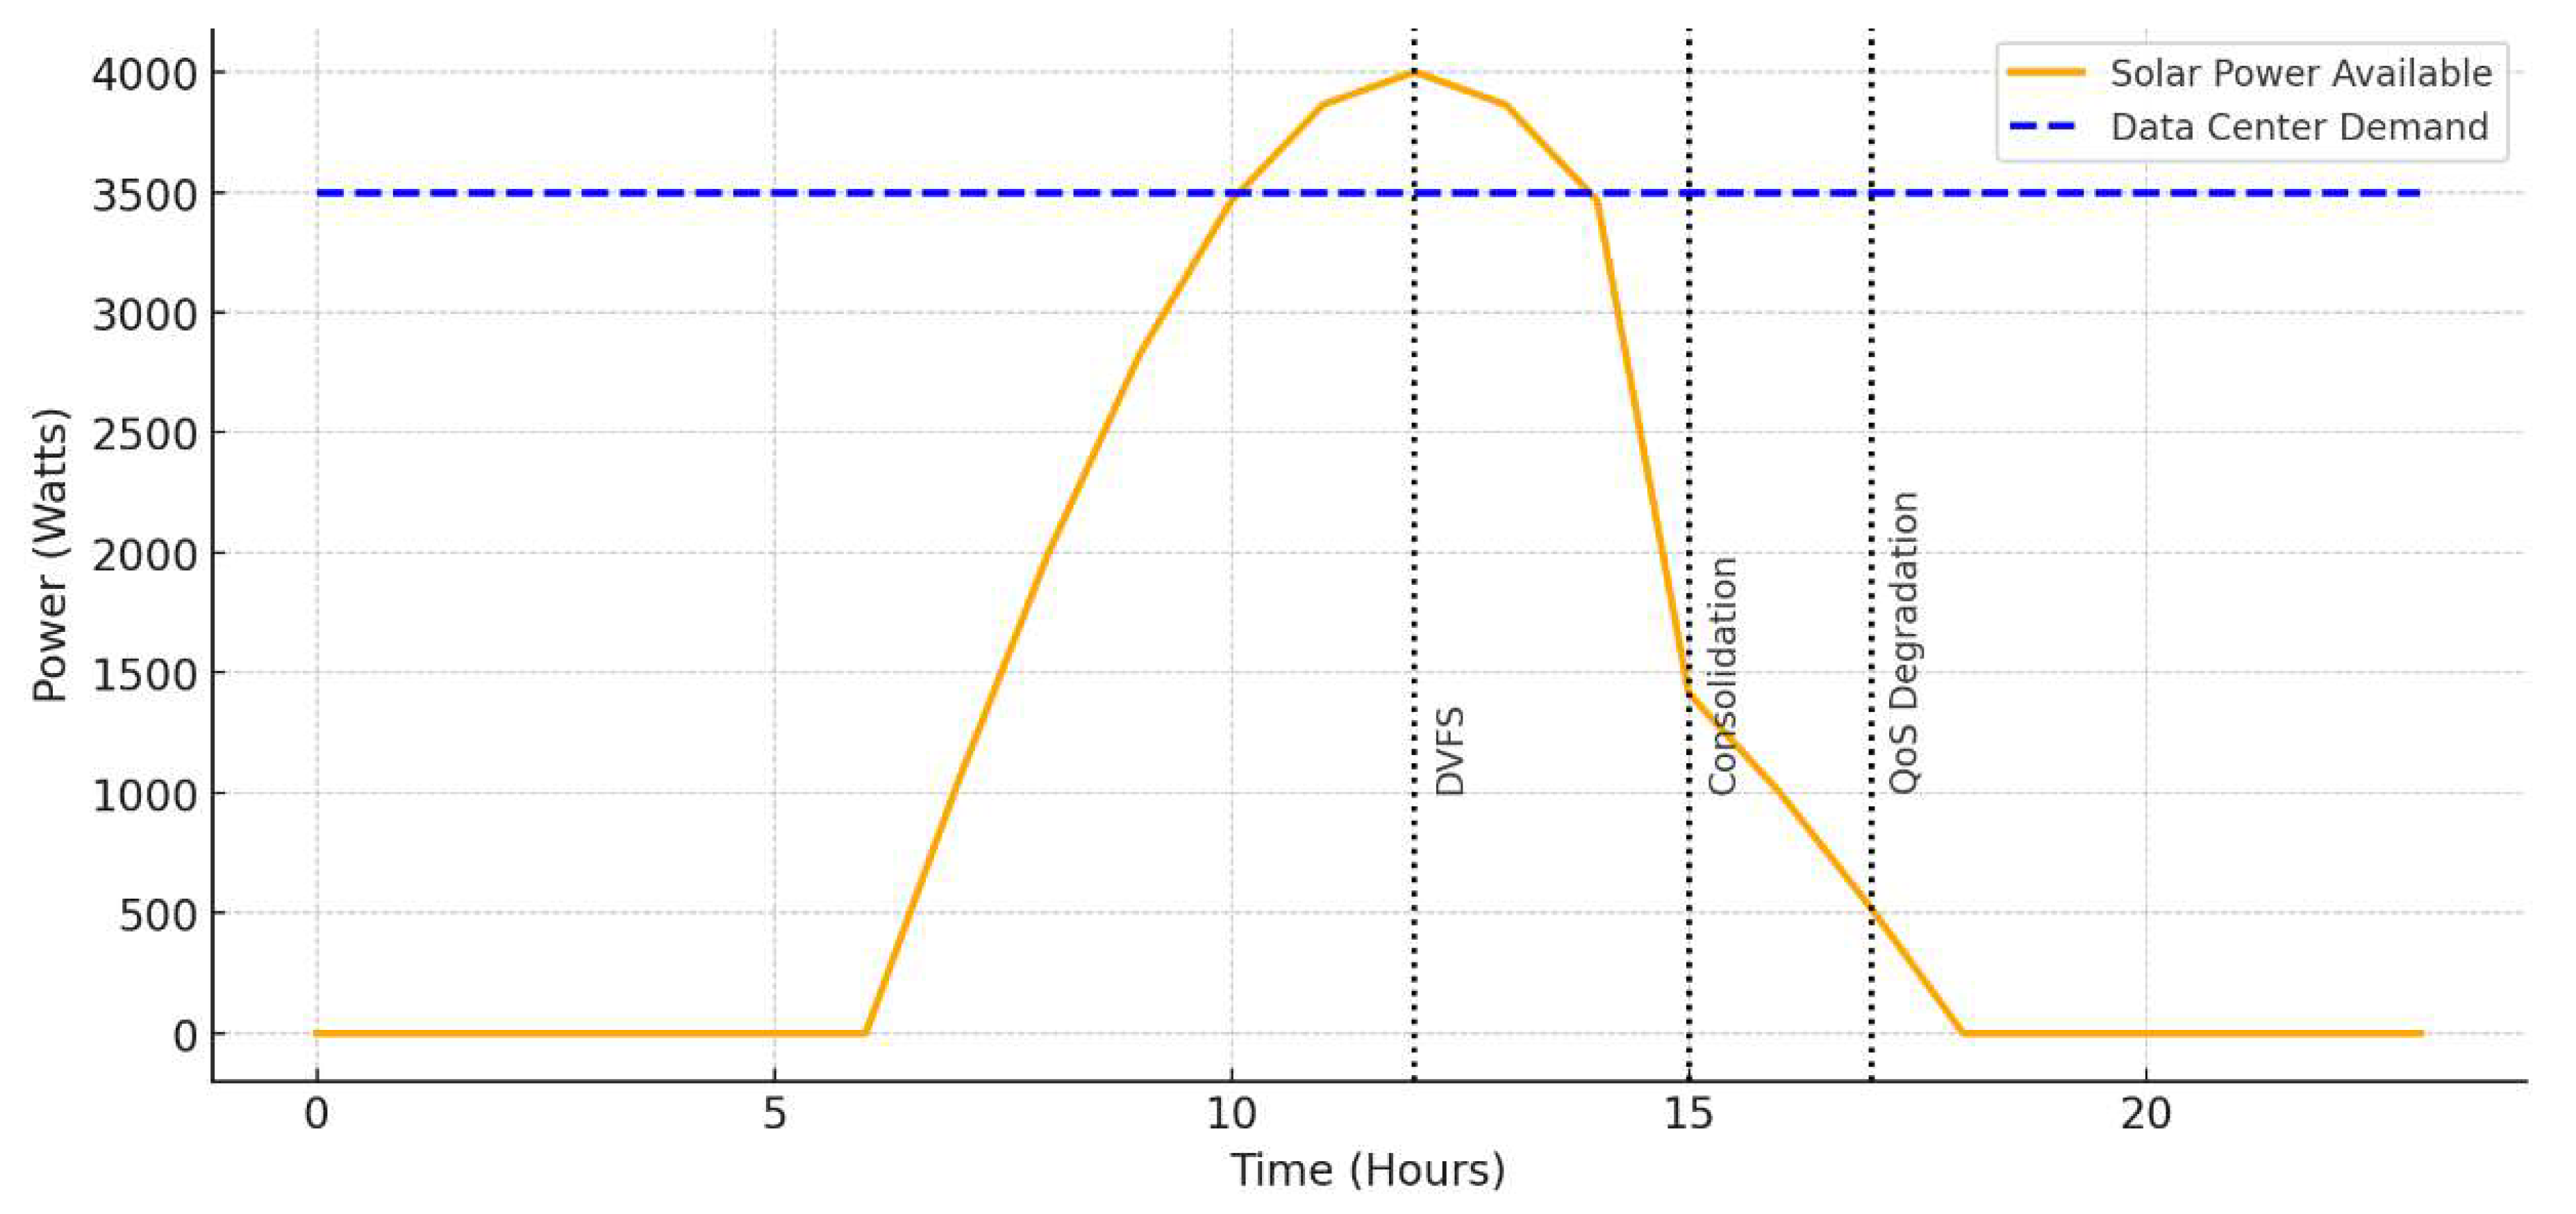
Figure 5.
Performance degraderation vs. Energy saving.
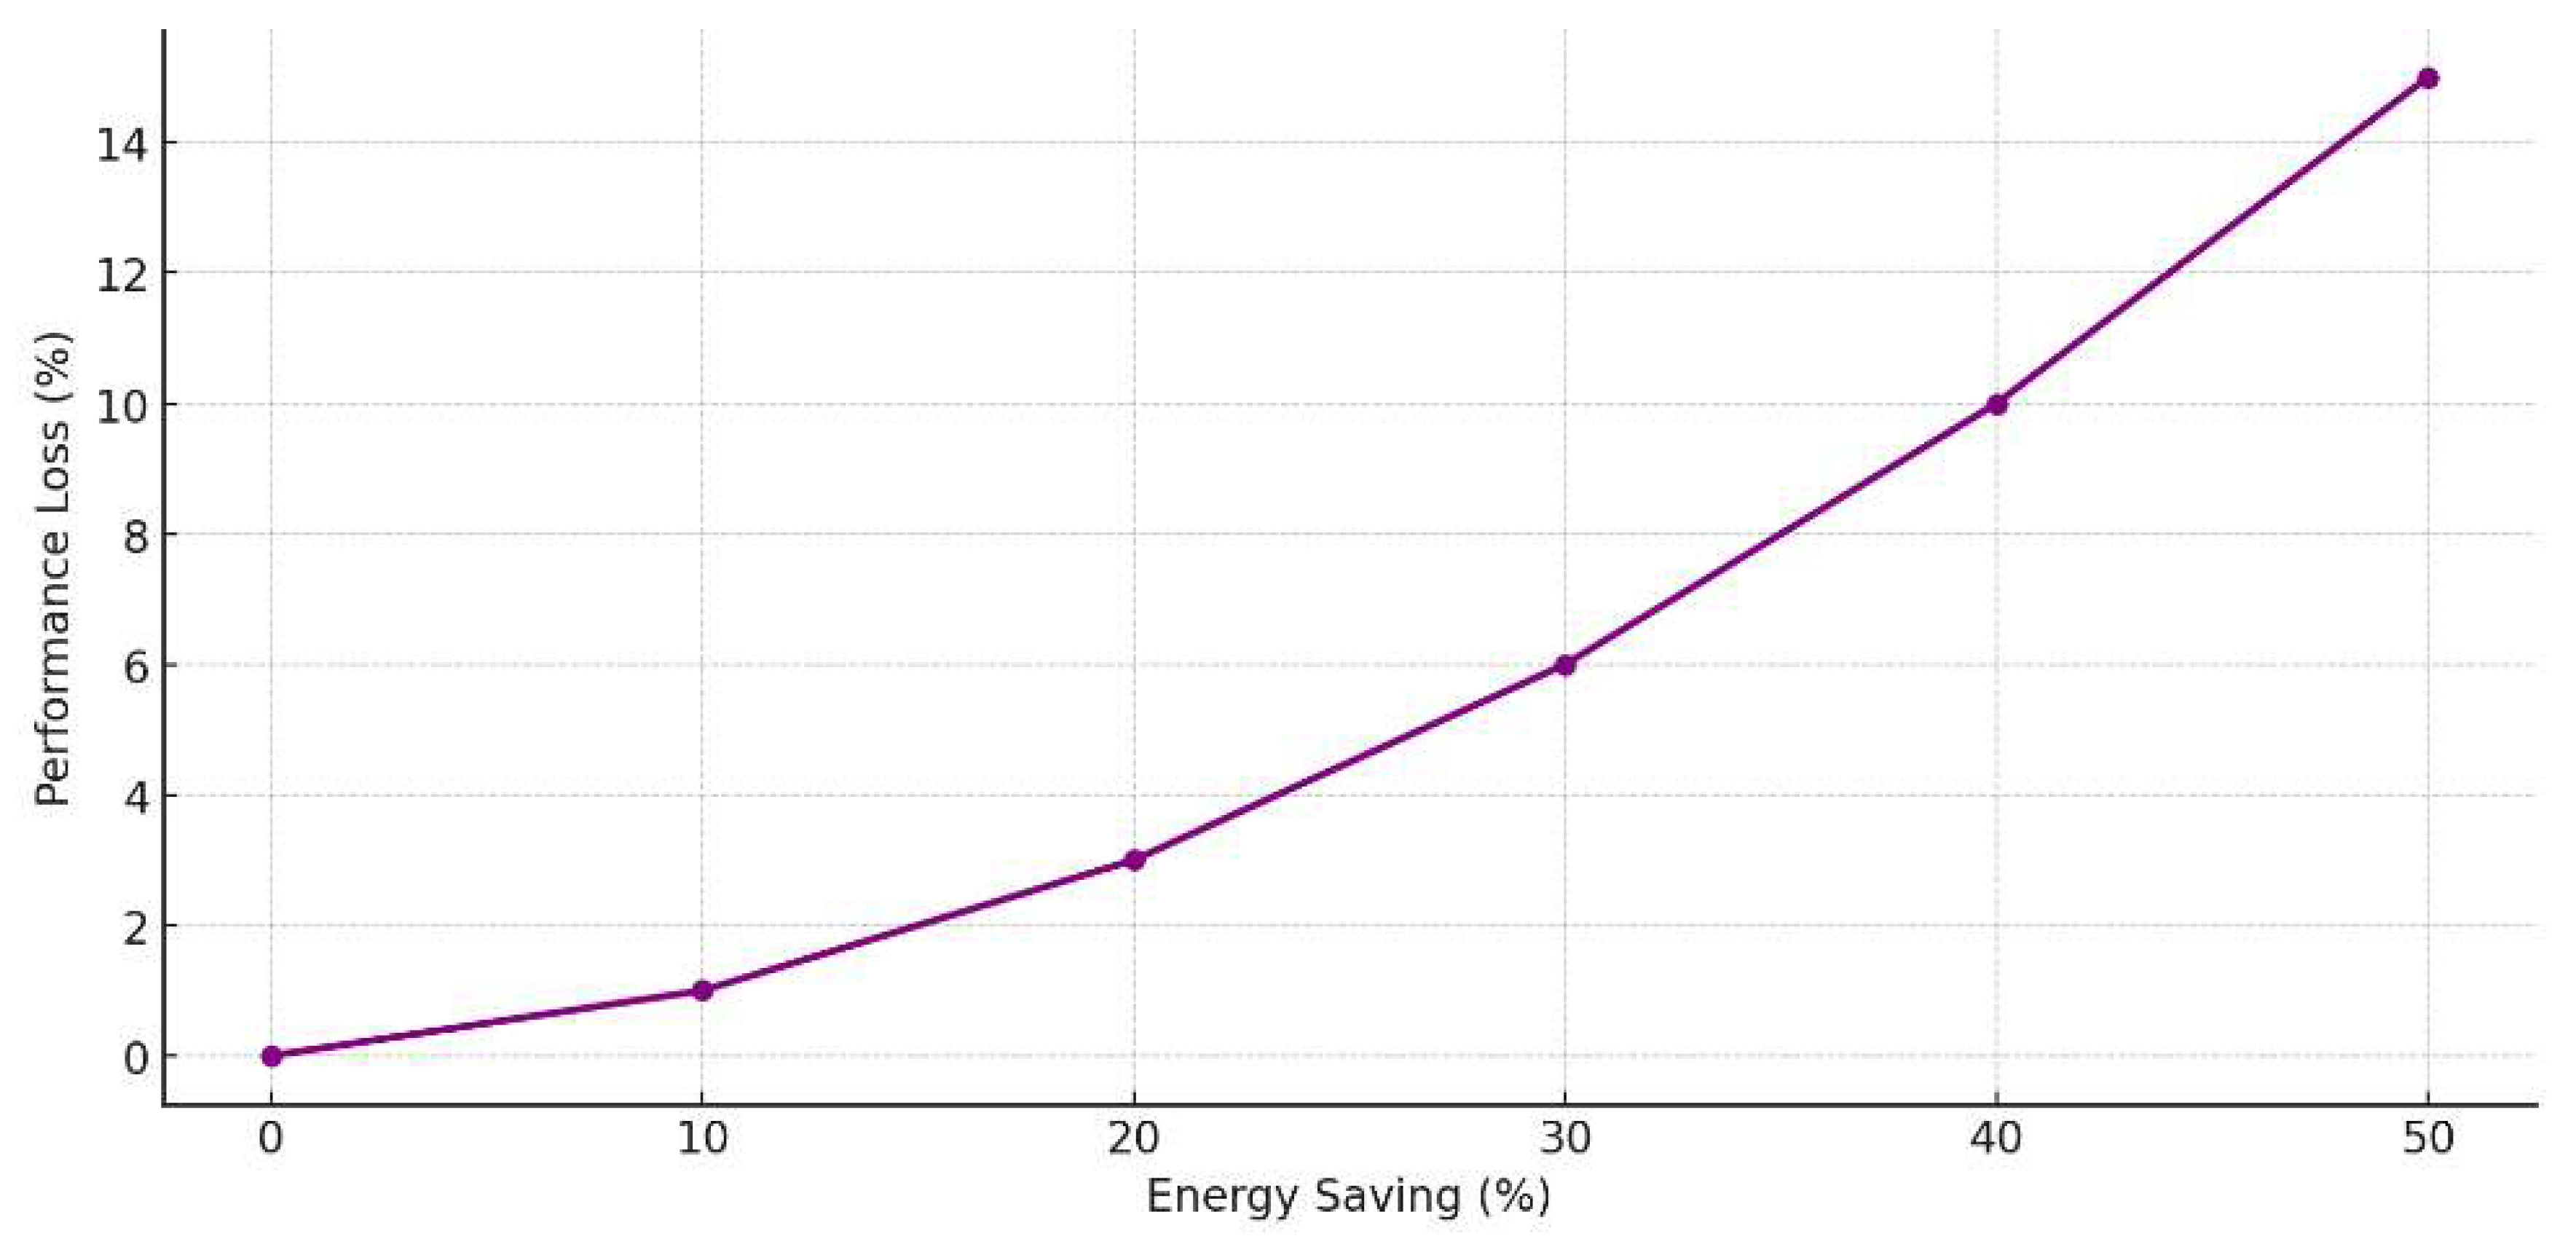
Figure 6.
Effect of DVFS on server power consumption.
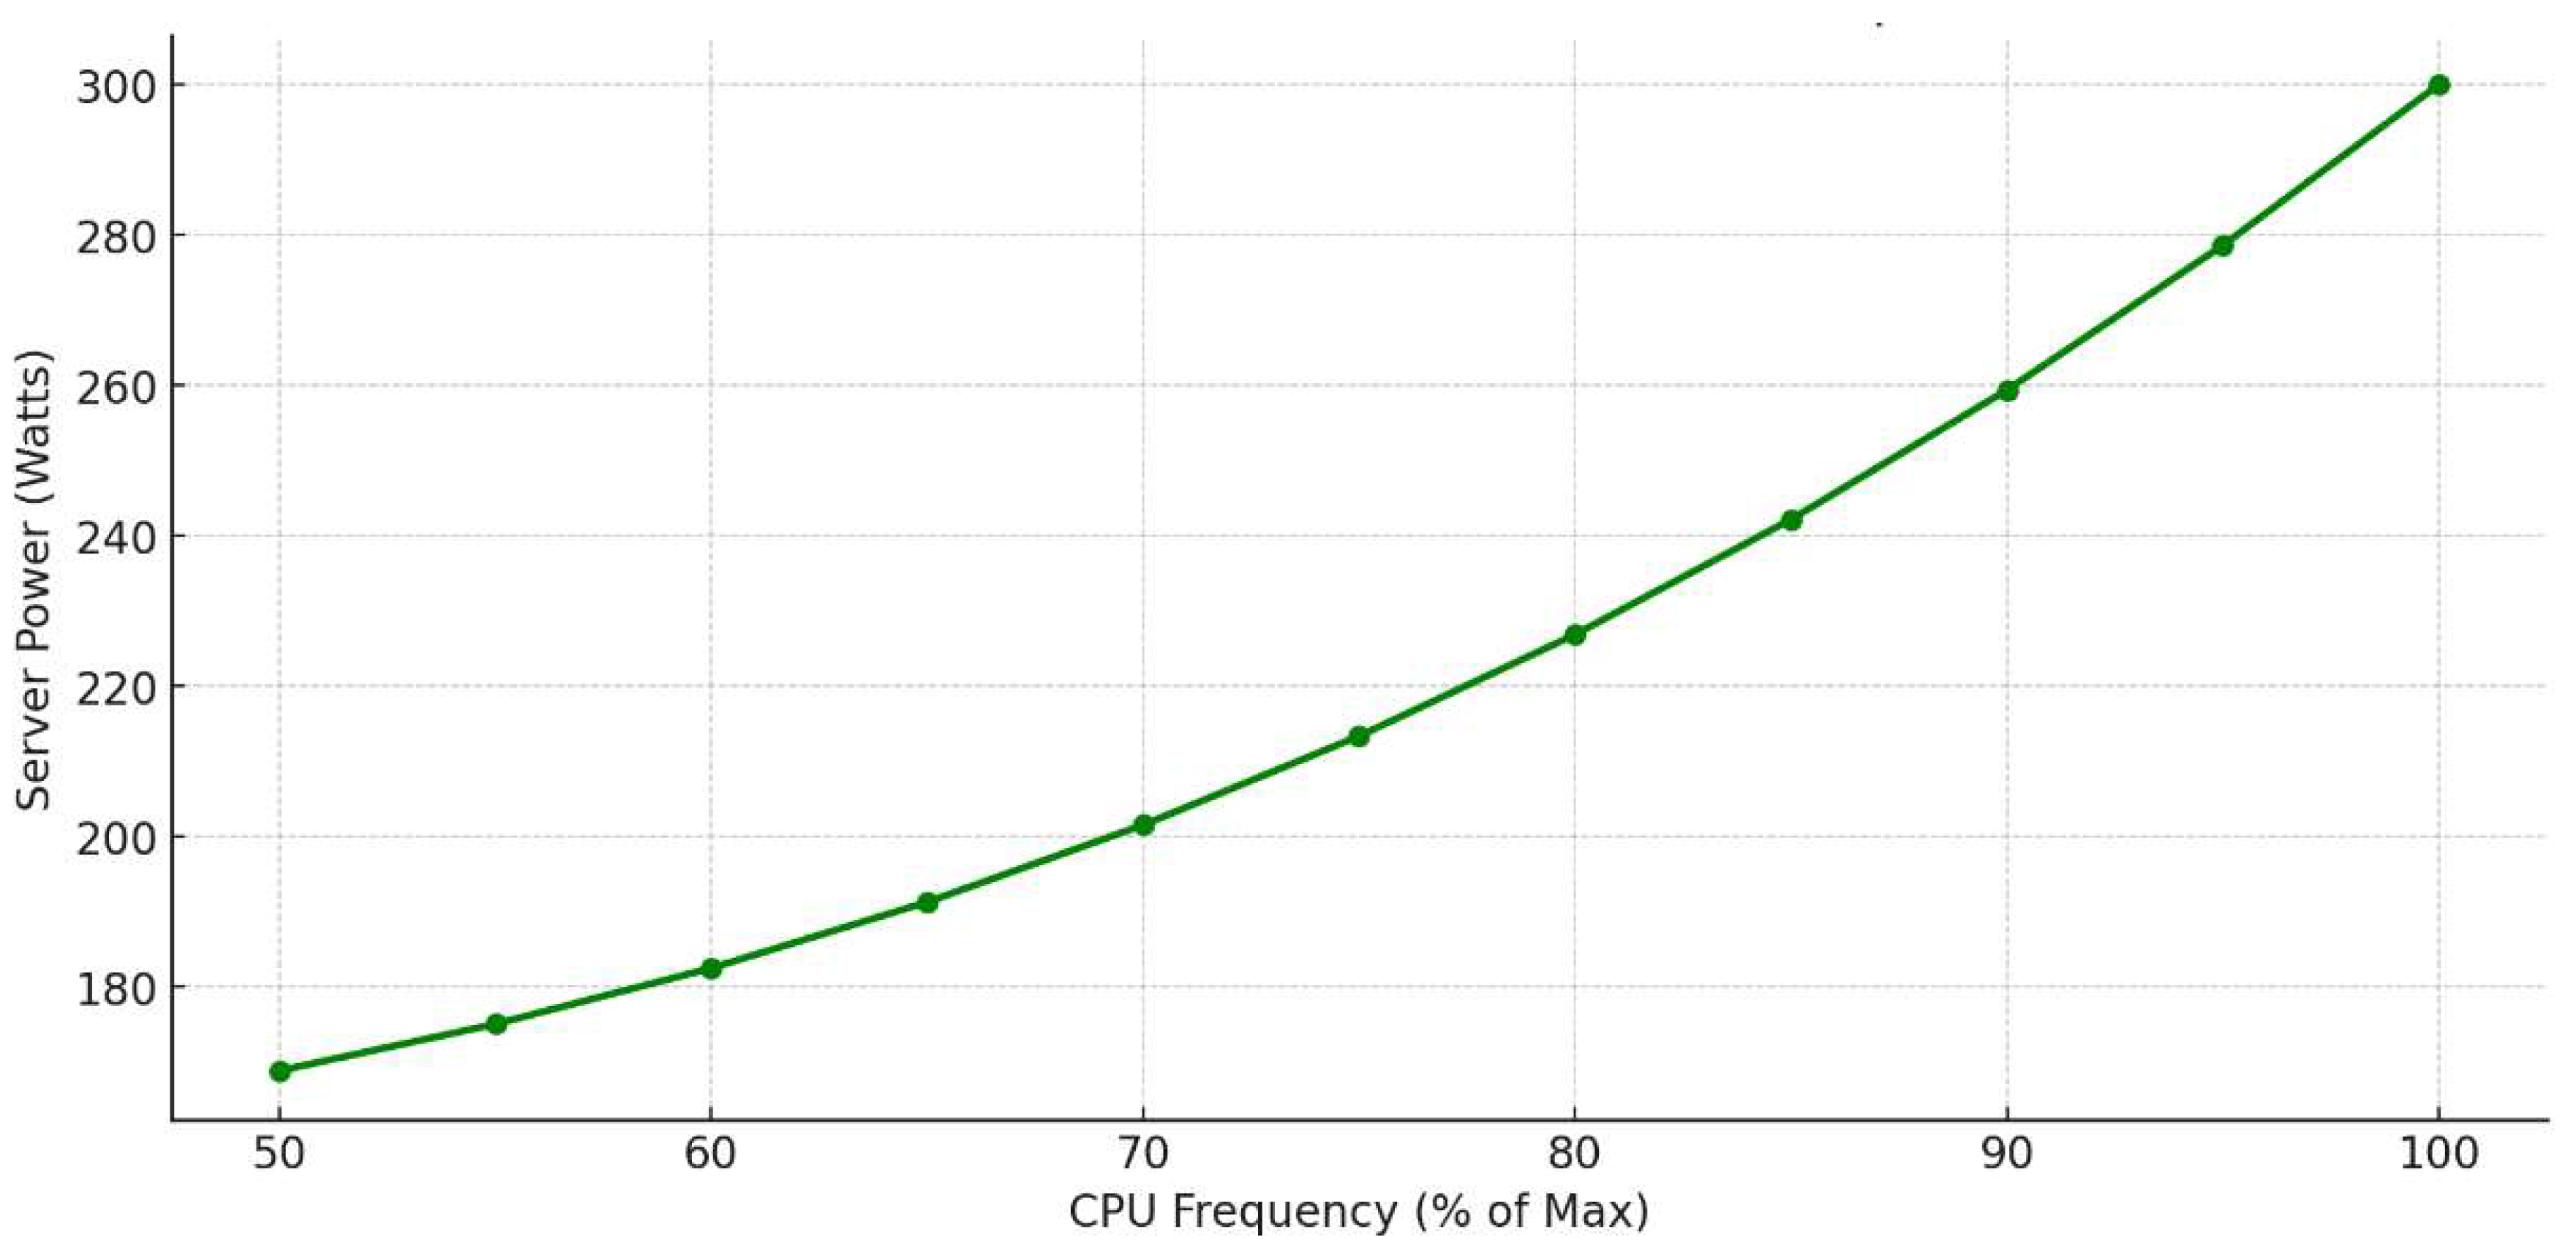
Figure 7.
Impact of server consolidation on power consumption.
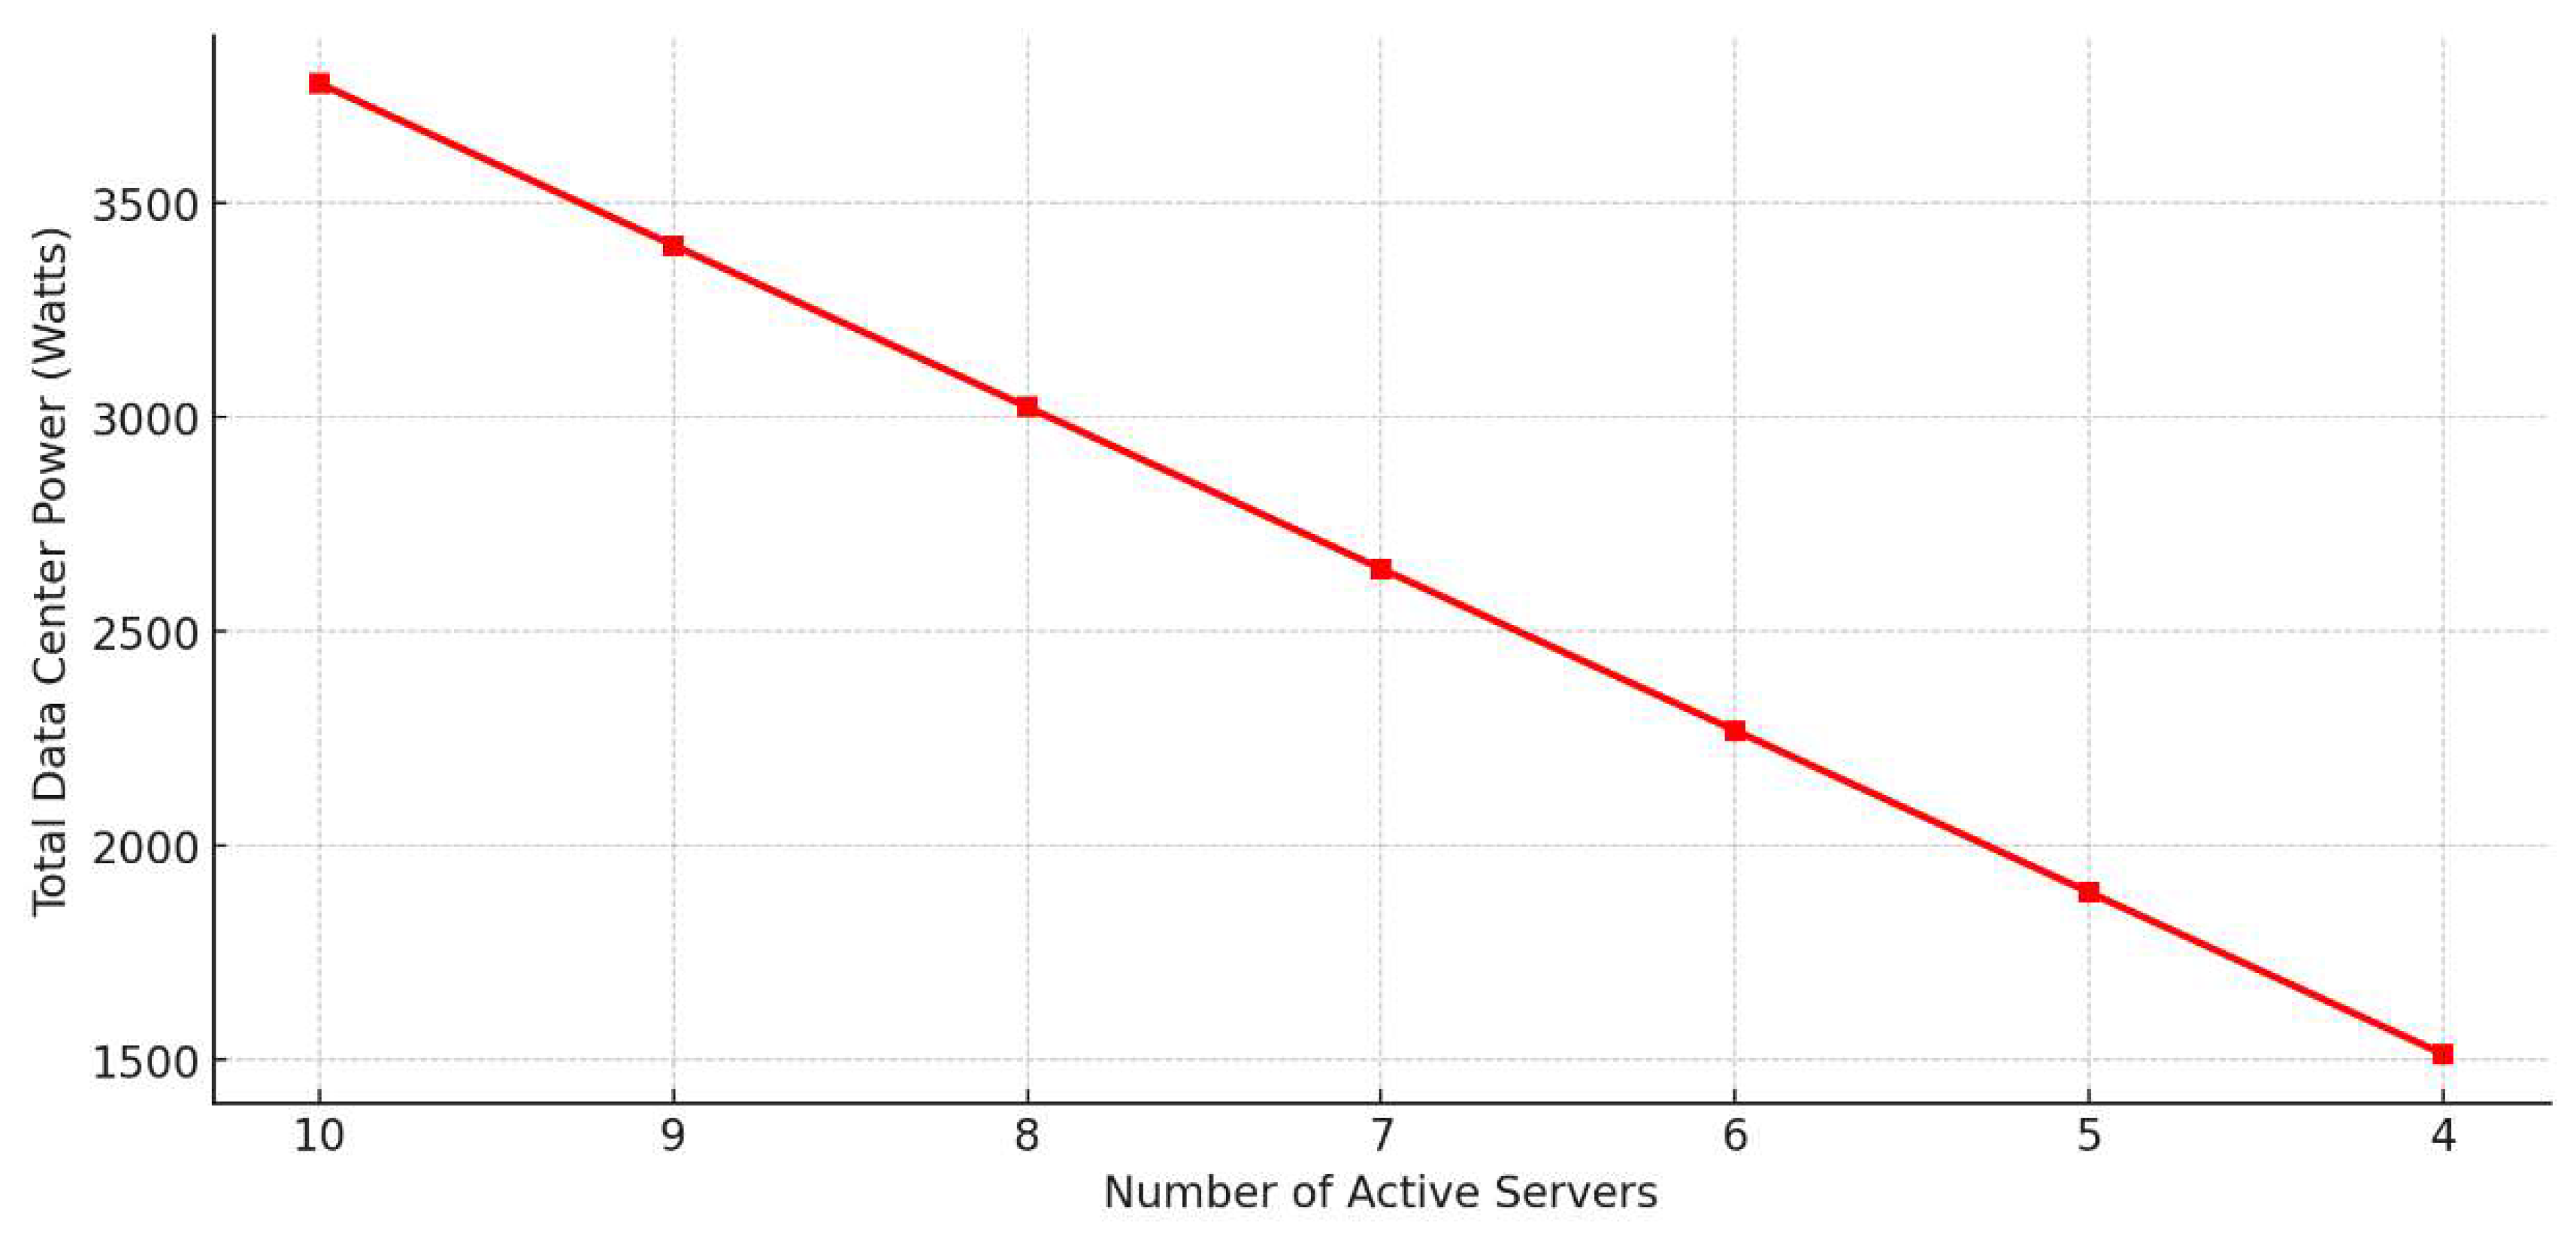
Figure 8.
Energy saving vs. Performance impact by technique.
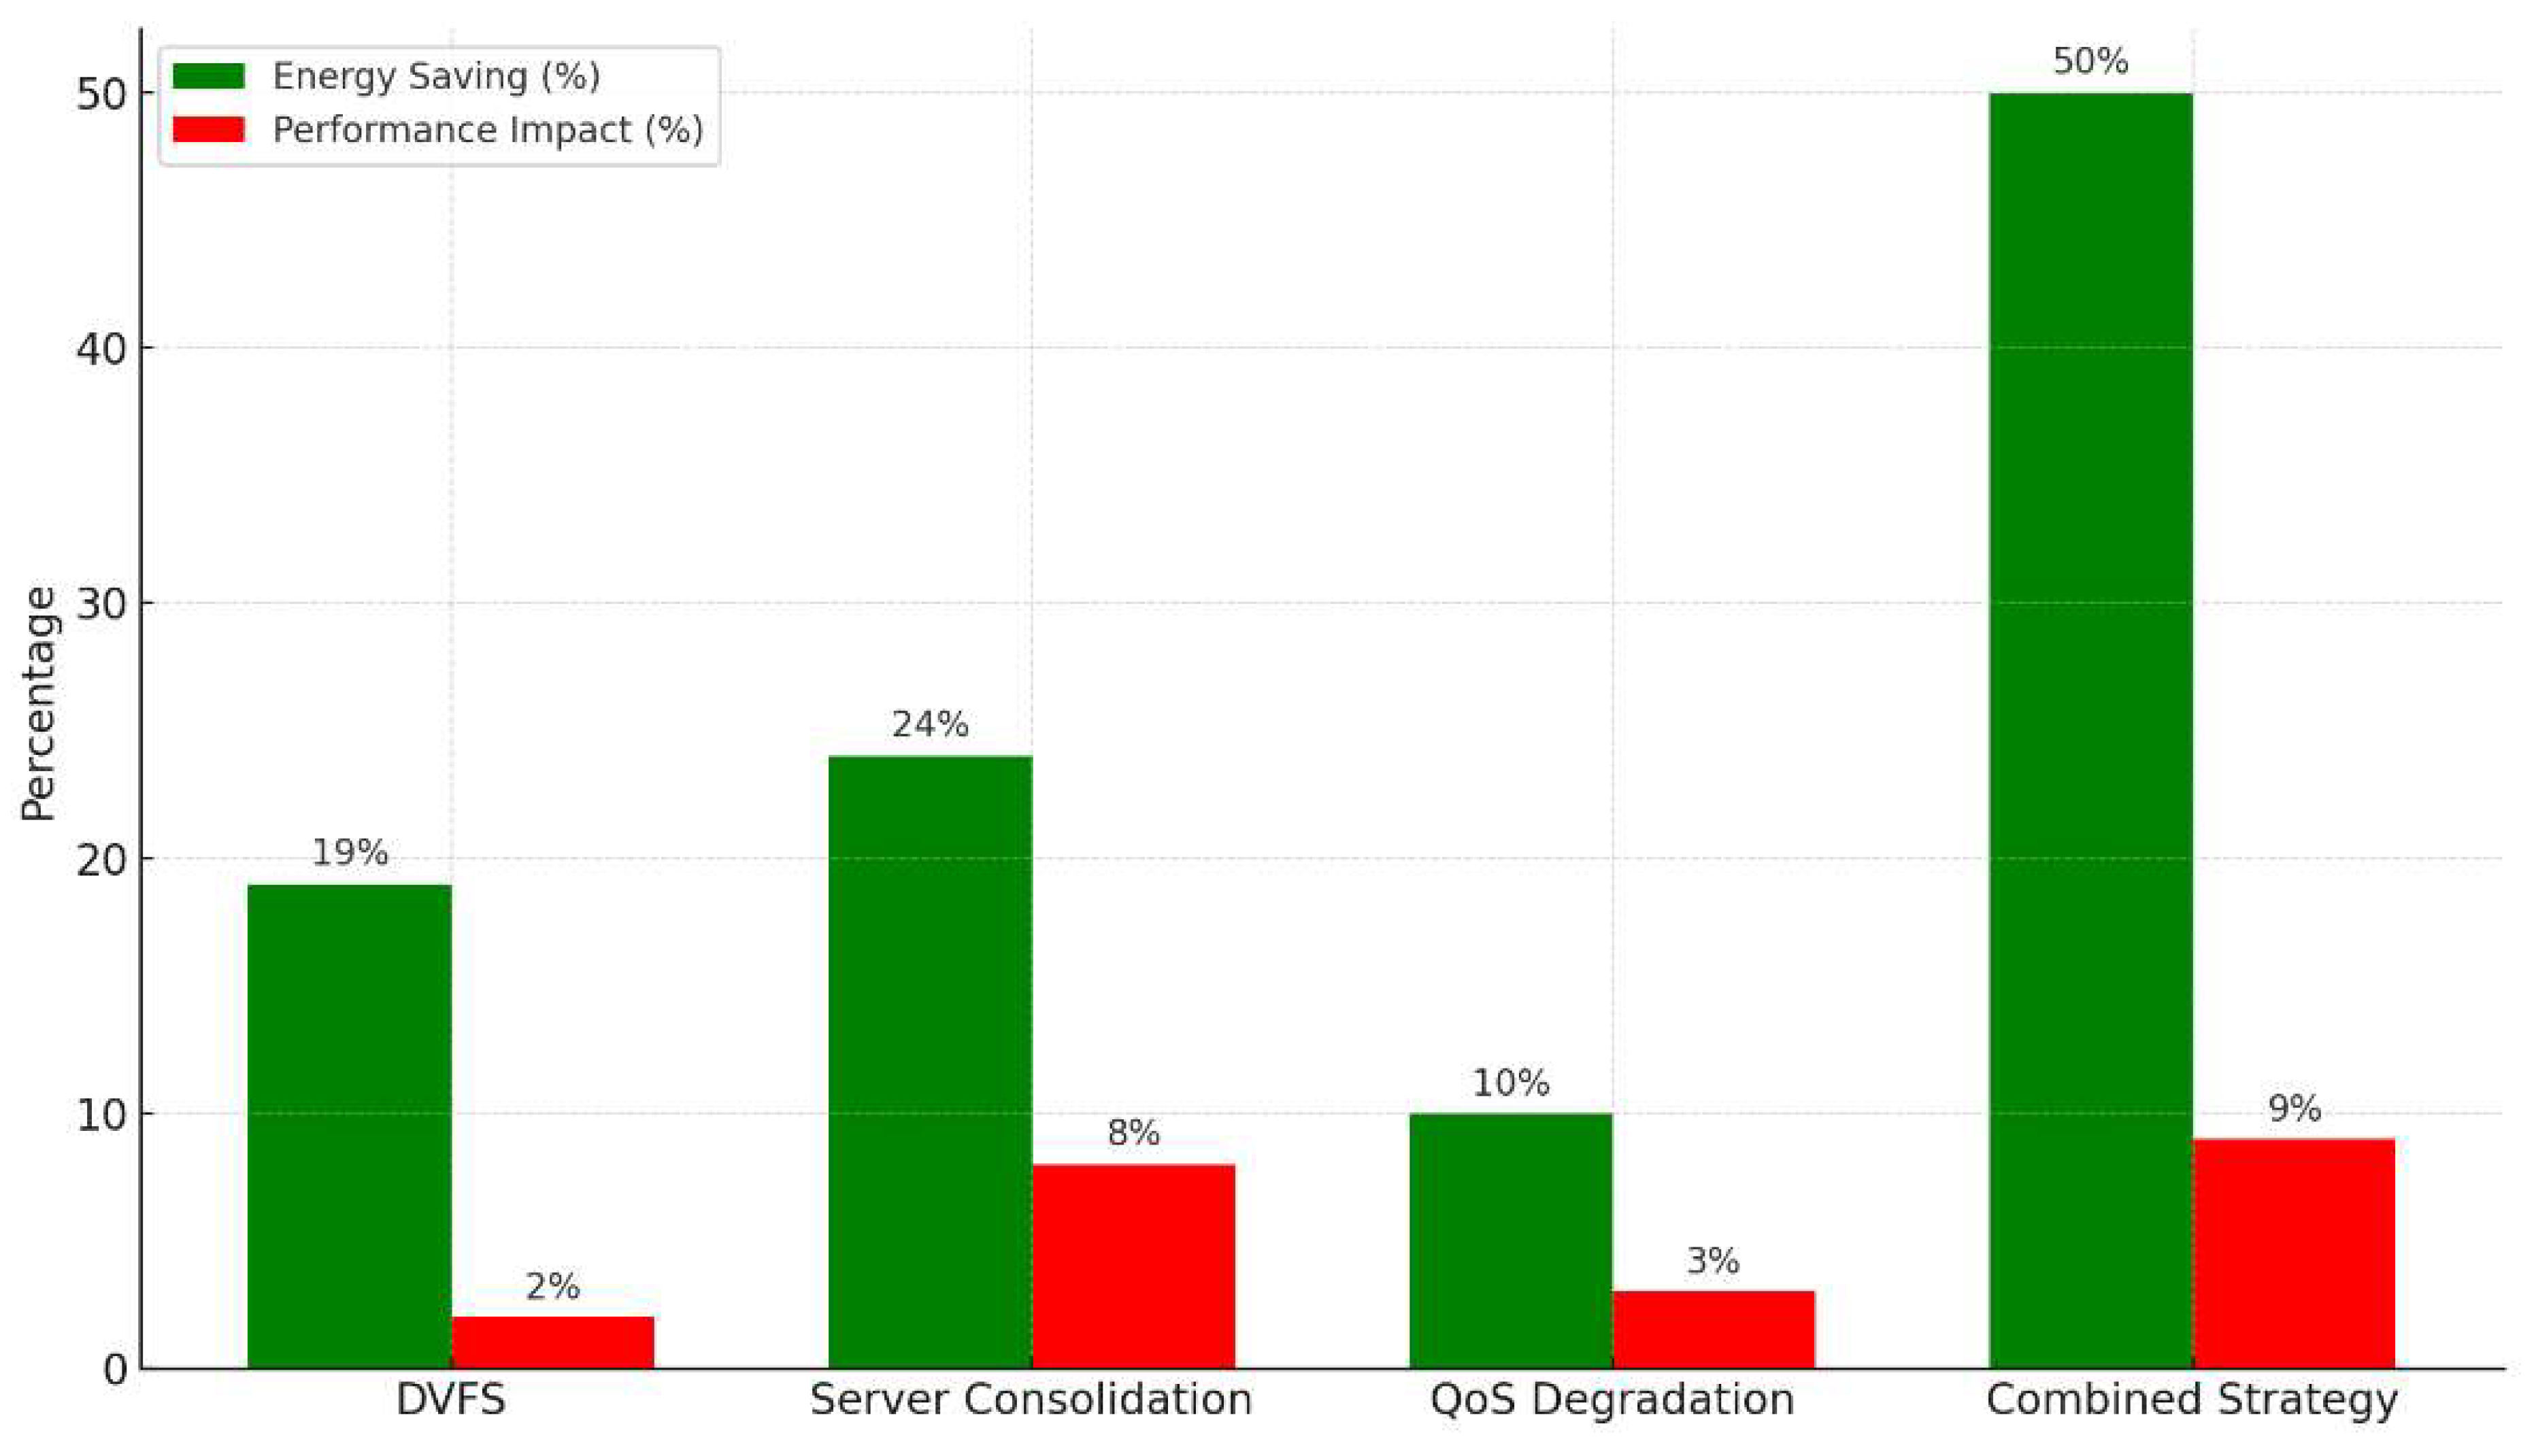
Figure 9.
Hourly power consumption under governance strategies.
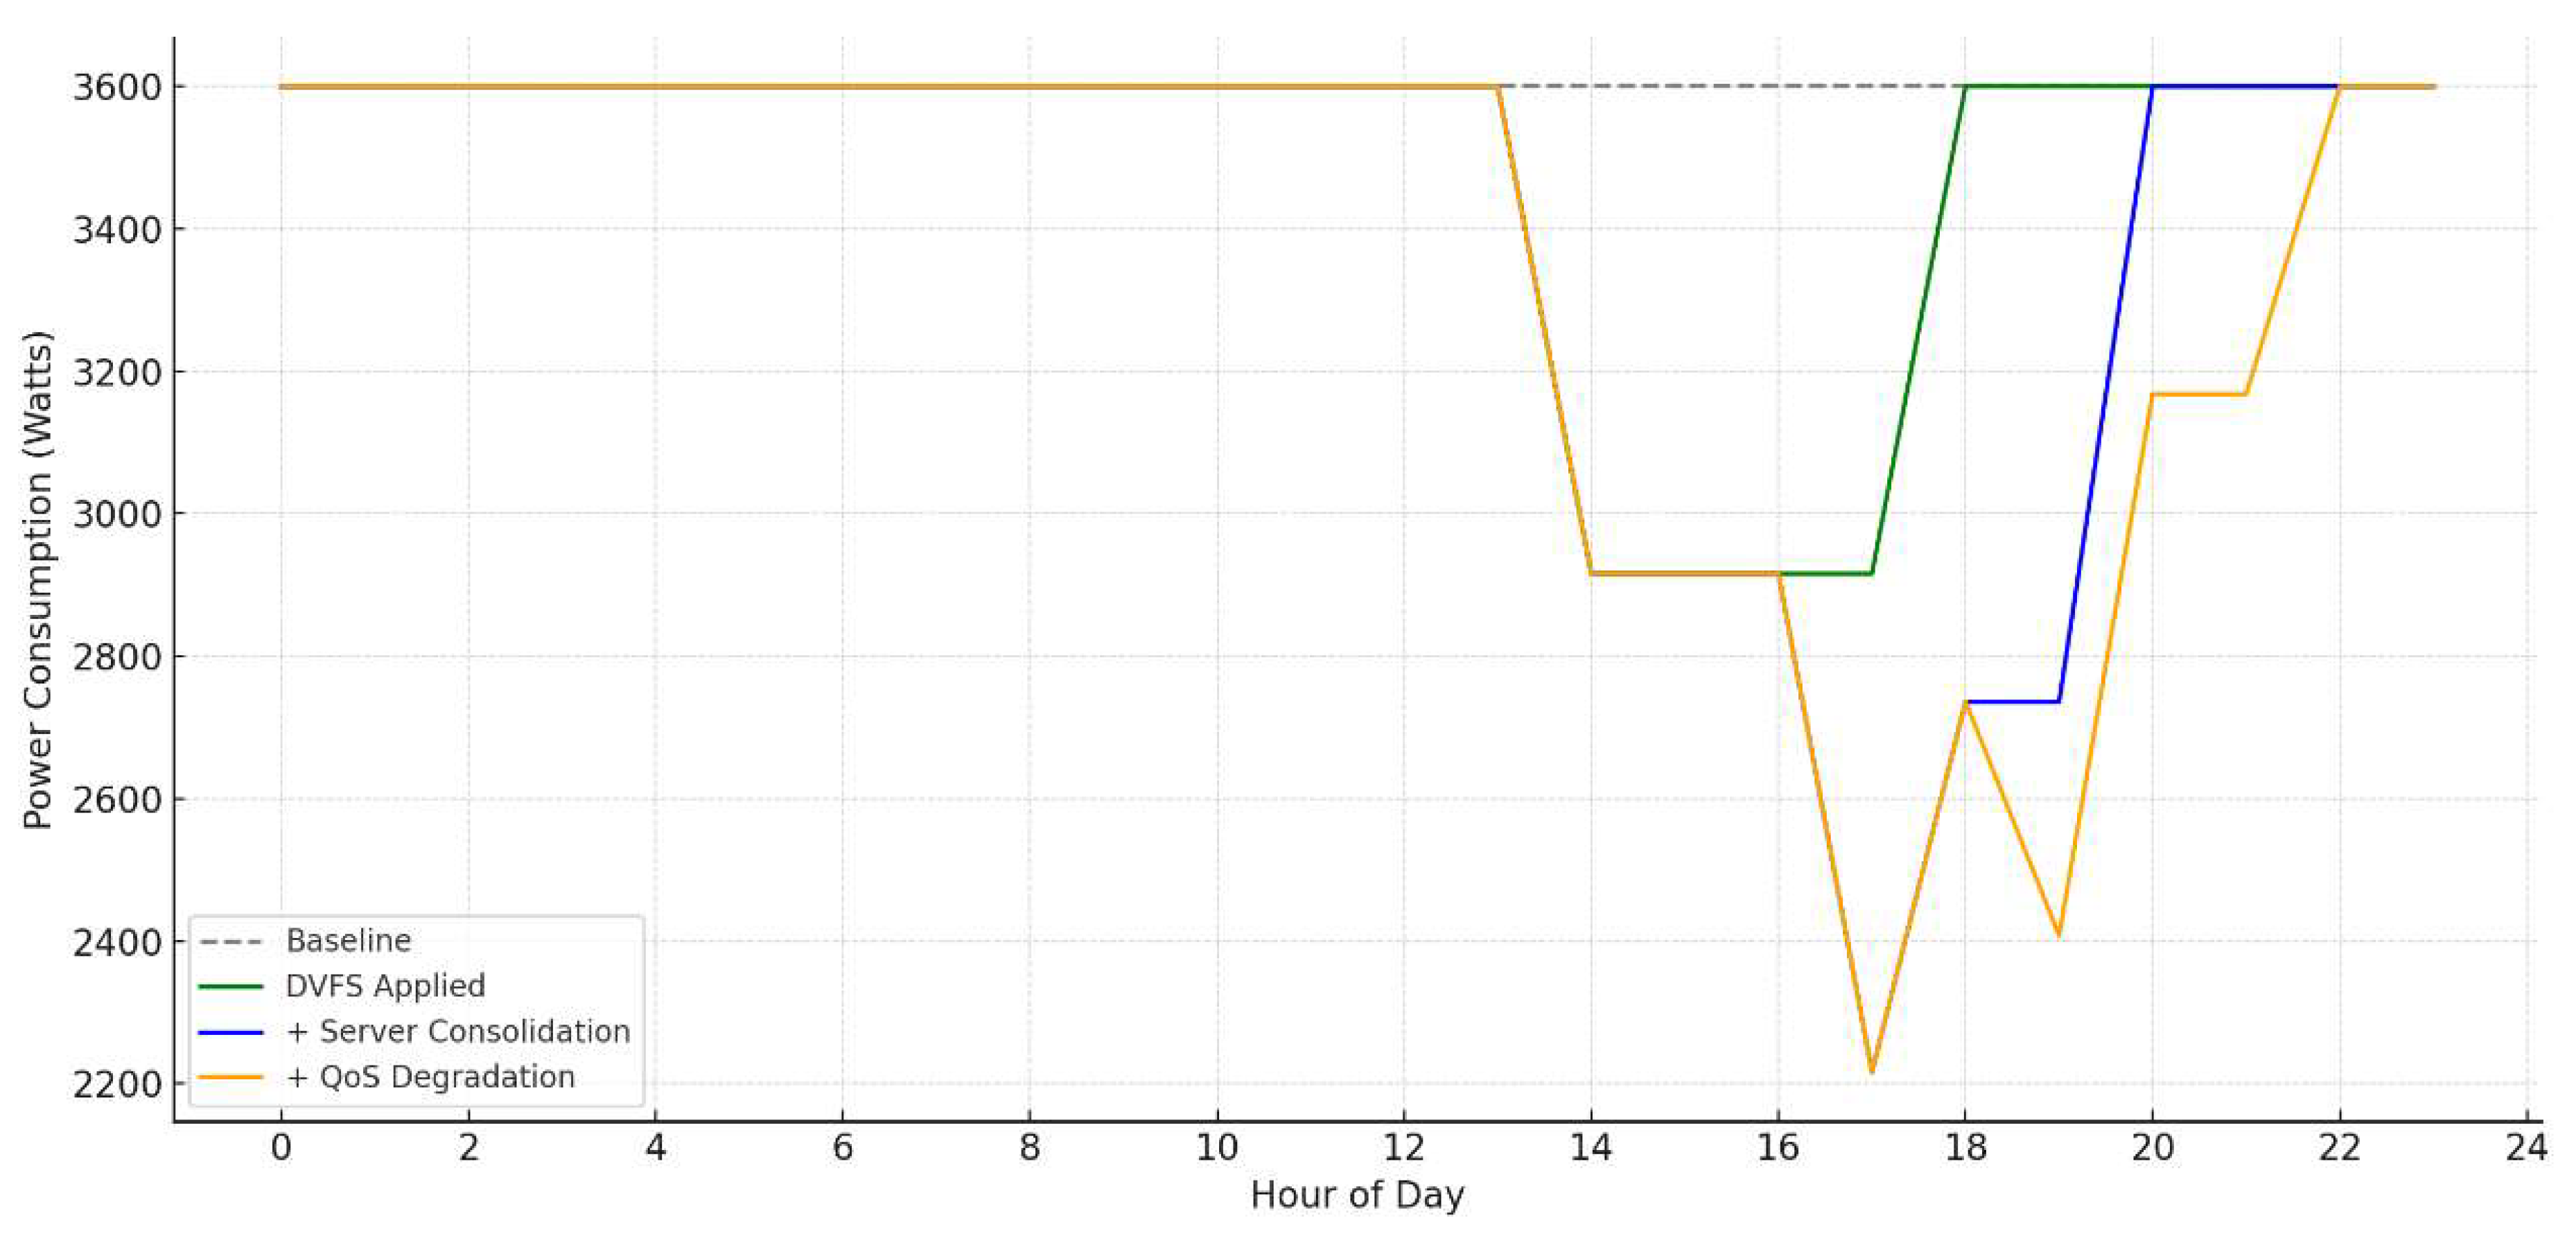
Figure 10.
Cumulative power reduction by governance strategies.
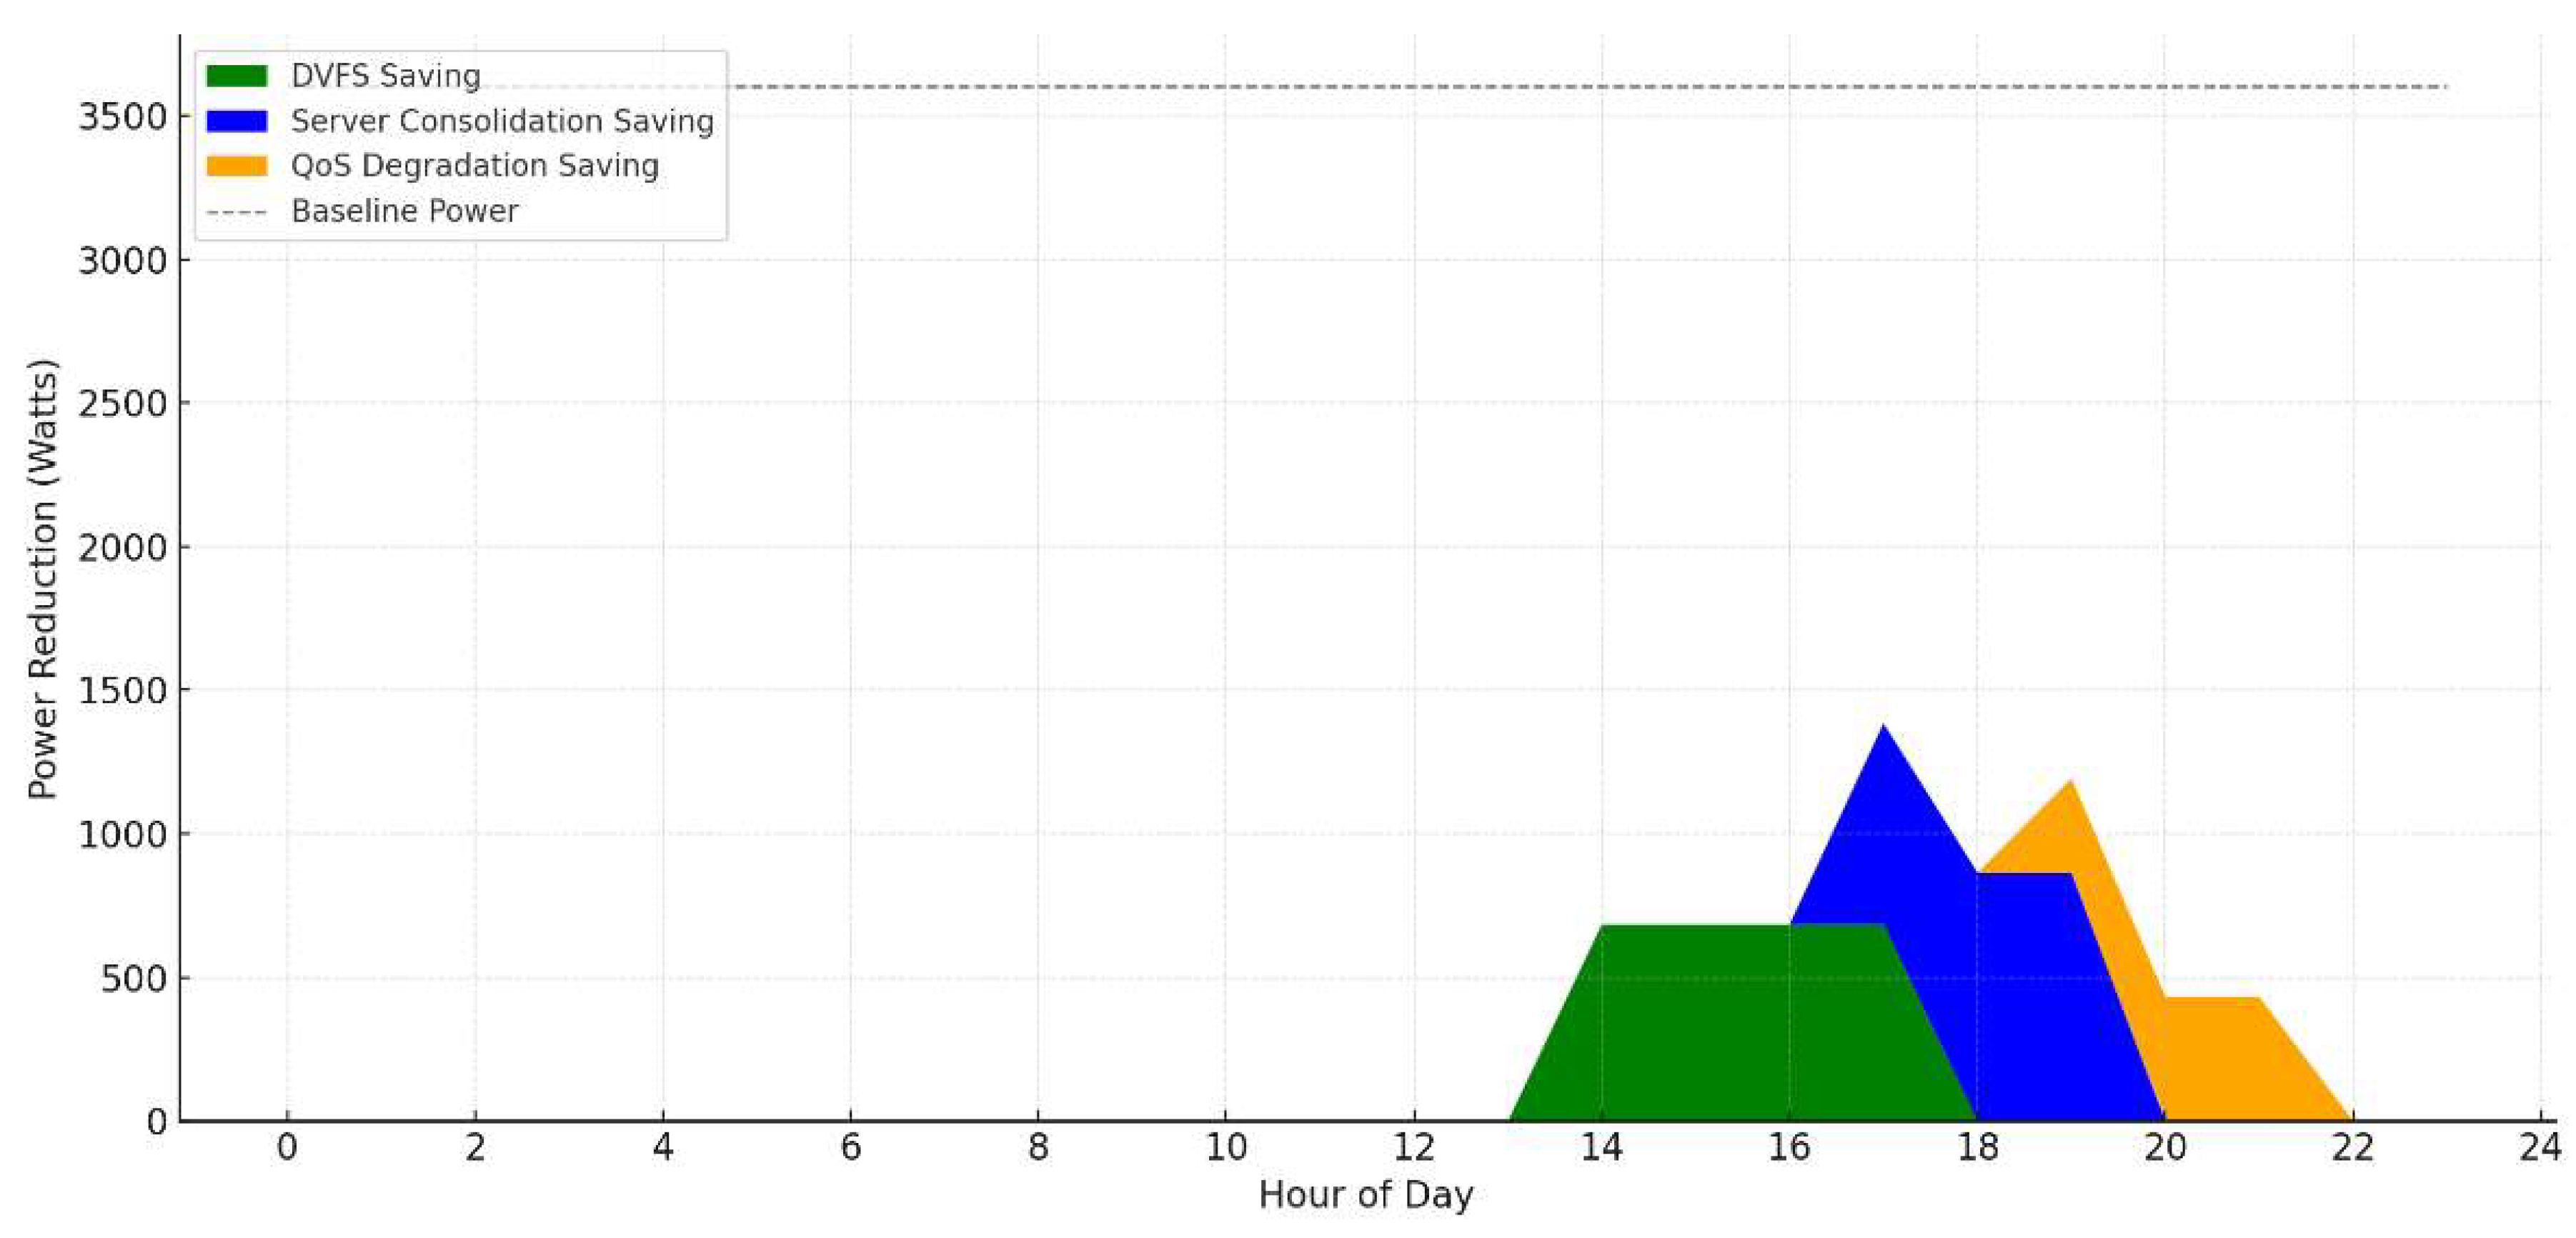
Figure 11.
Service Latency vs. Time under energy governance.
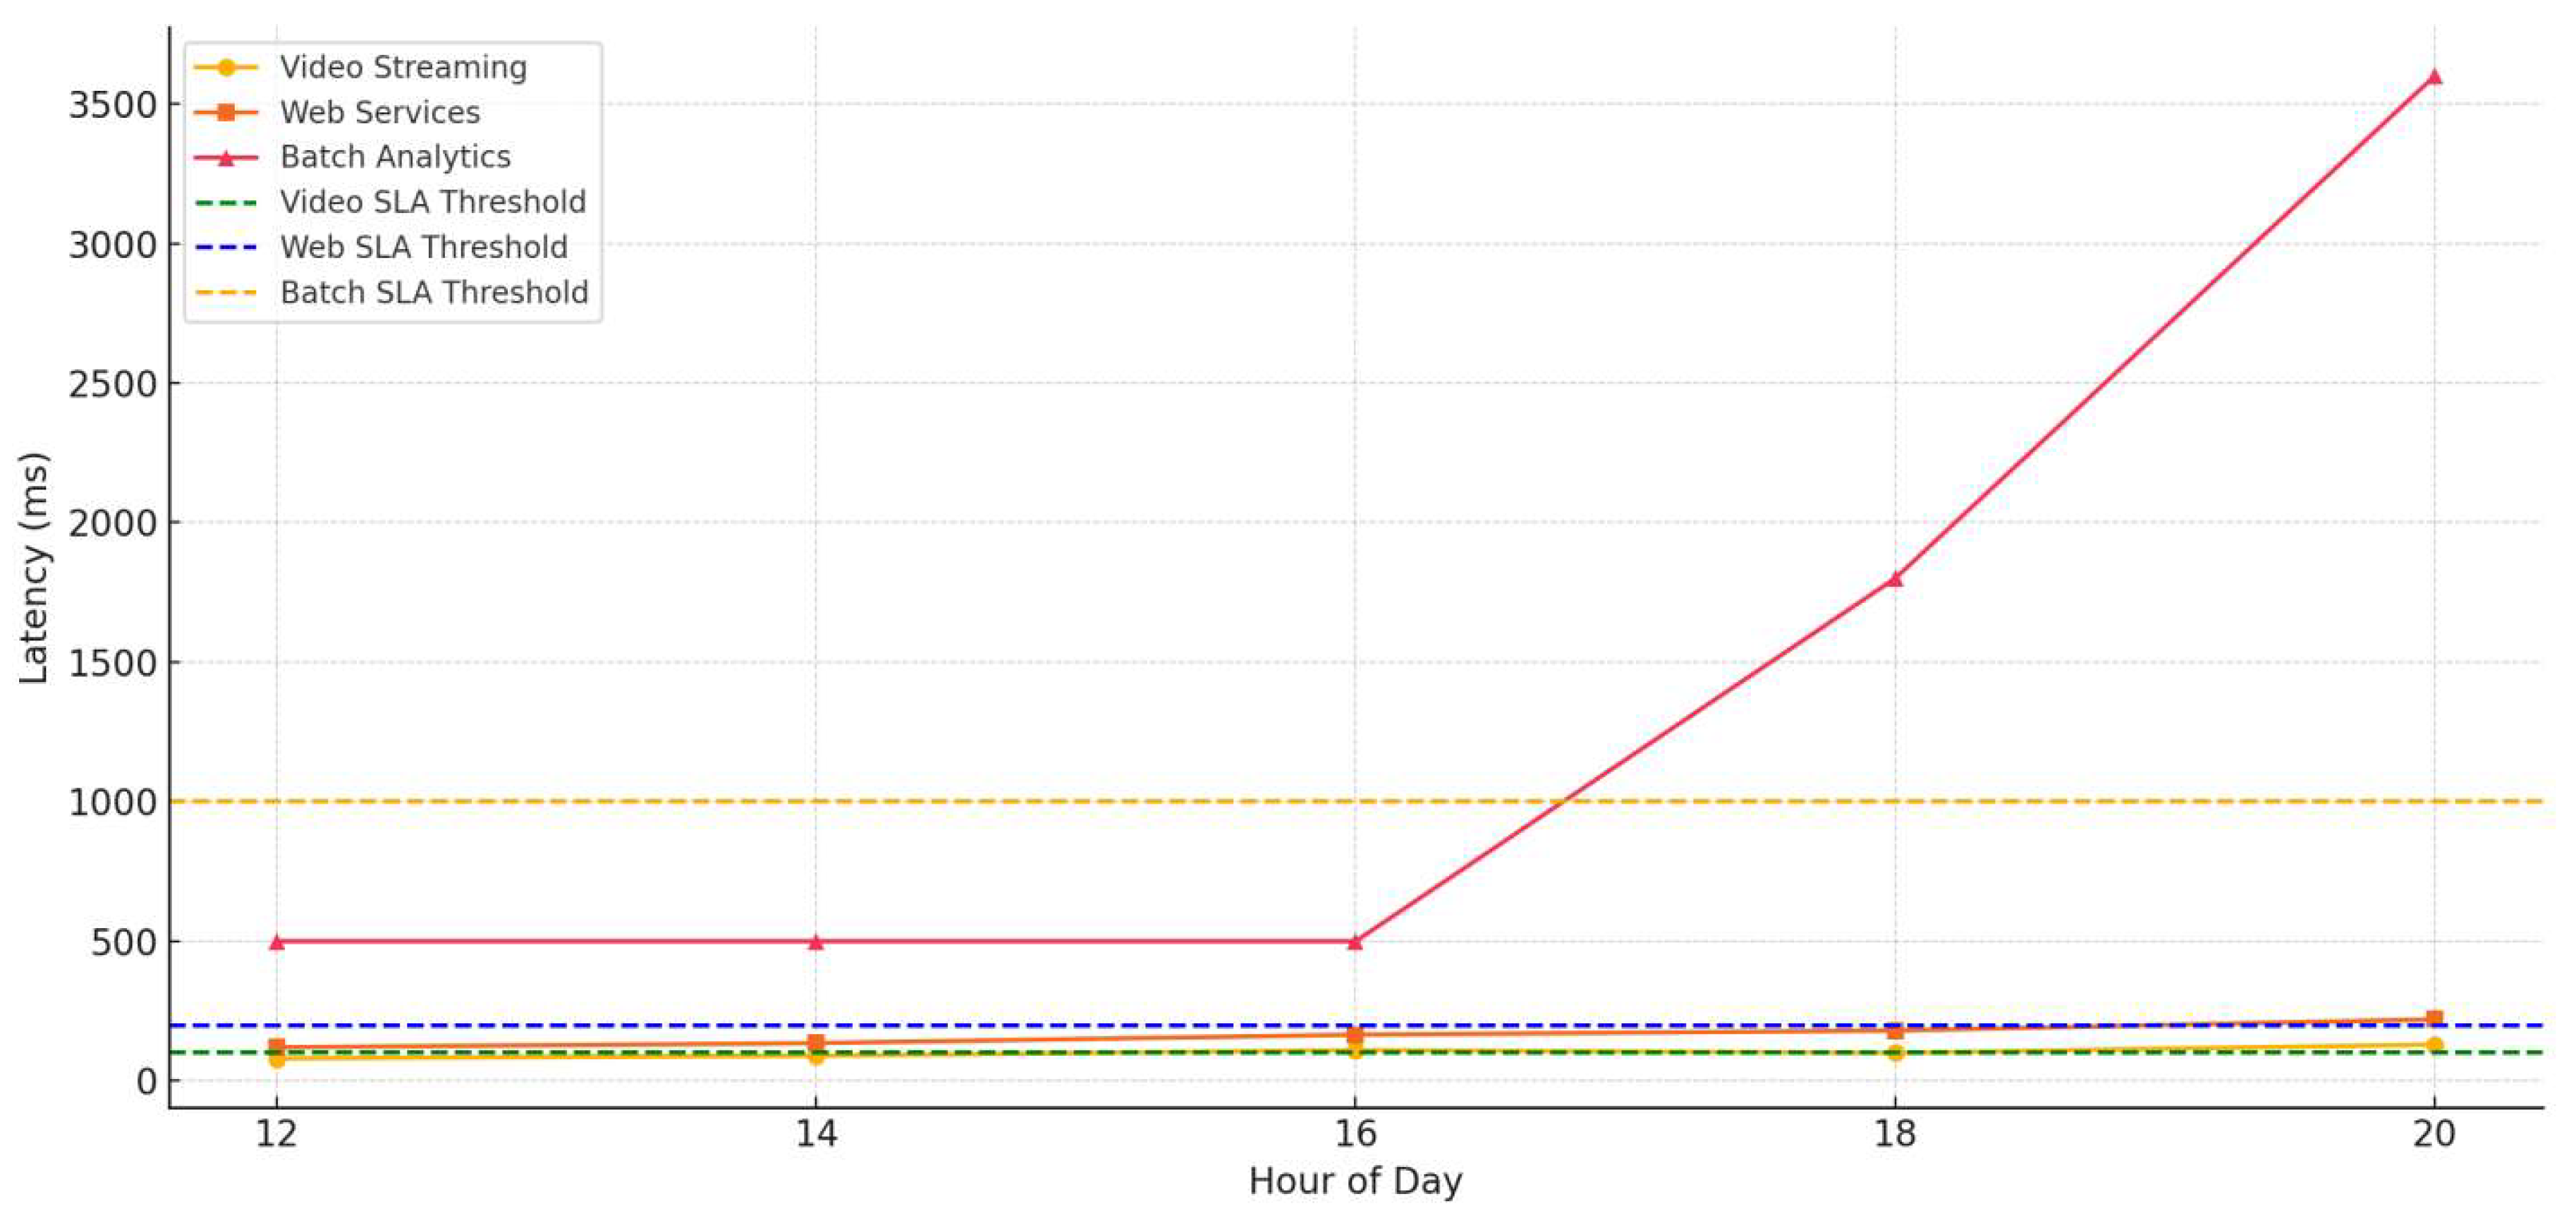
Figure 12.
Service Latency vs. Time under sever energy constraince.
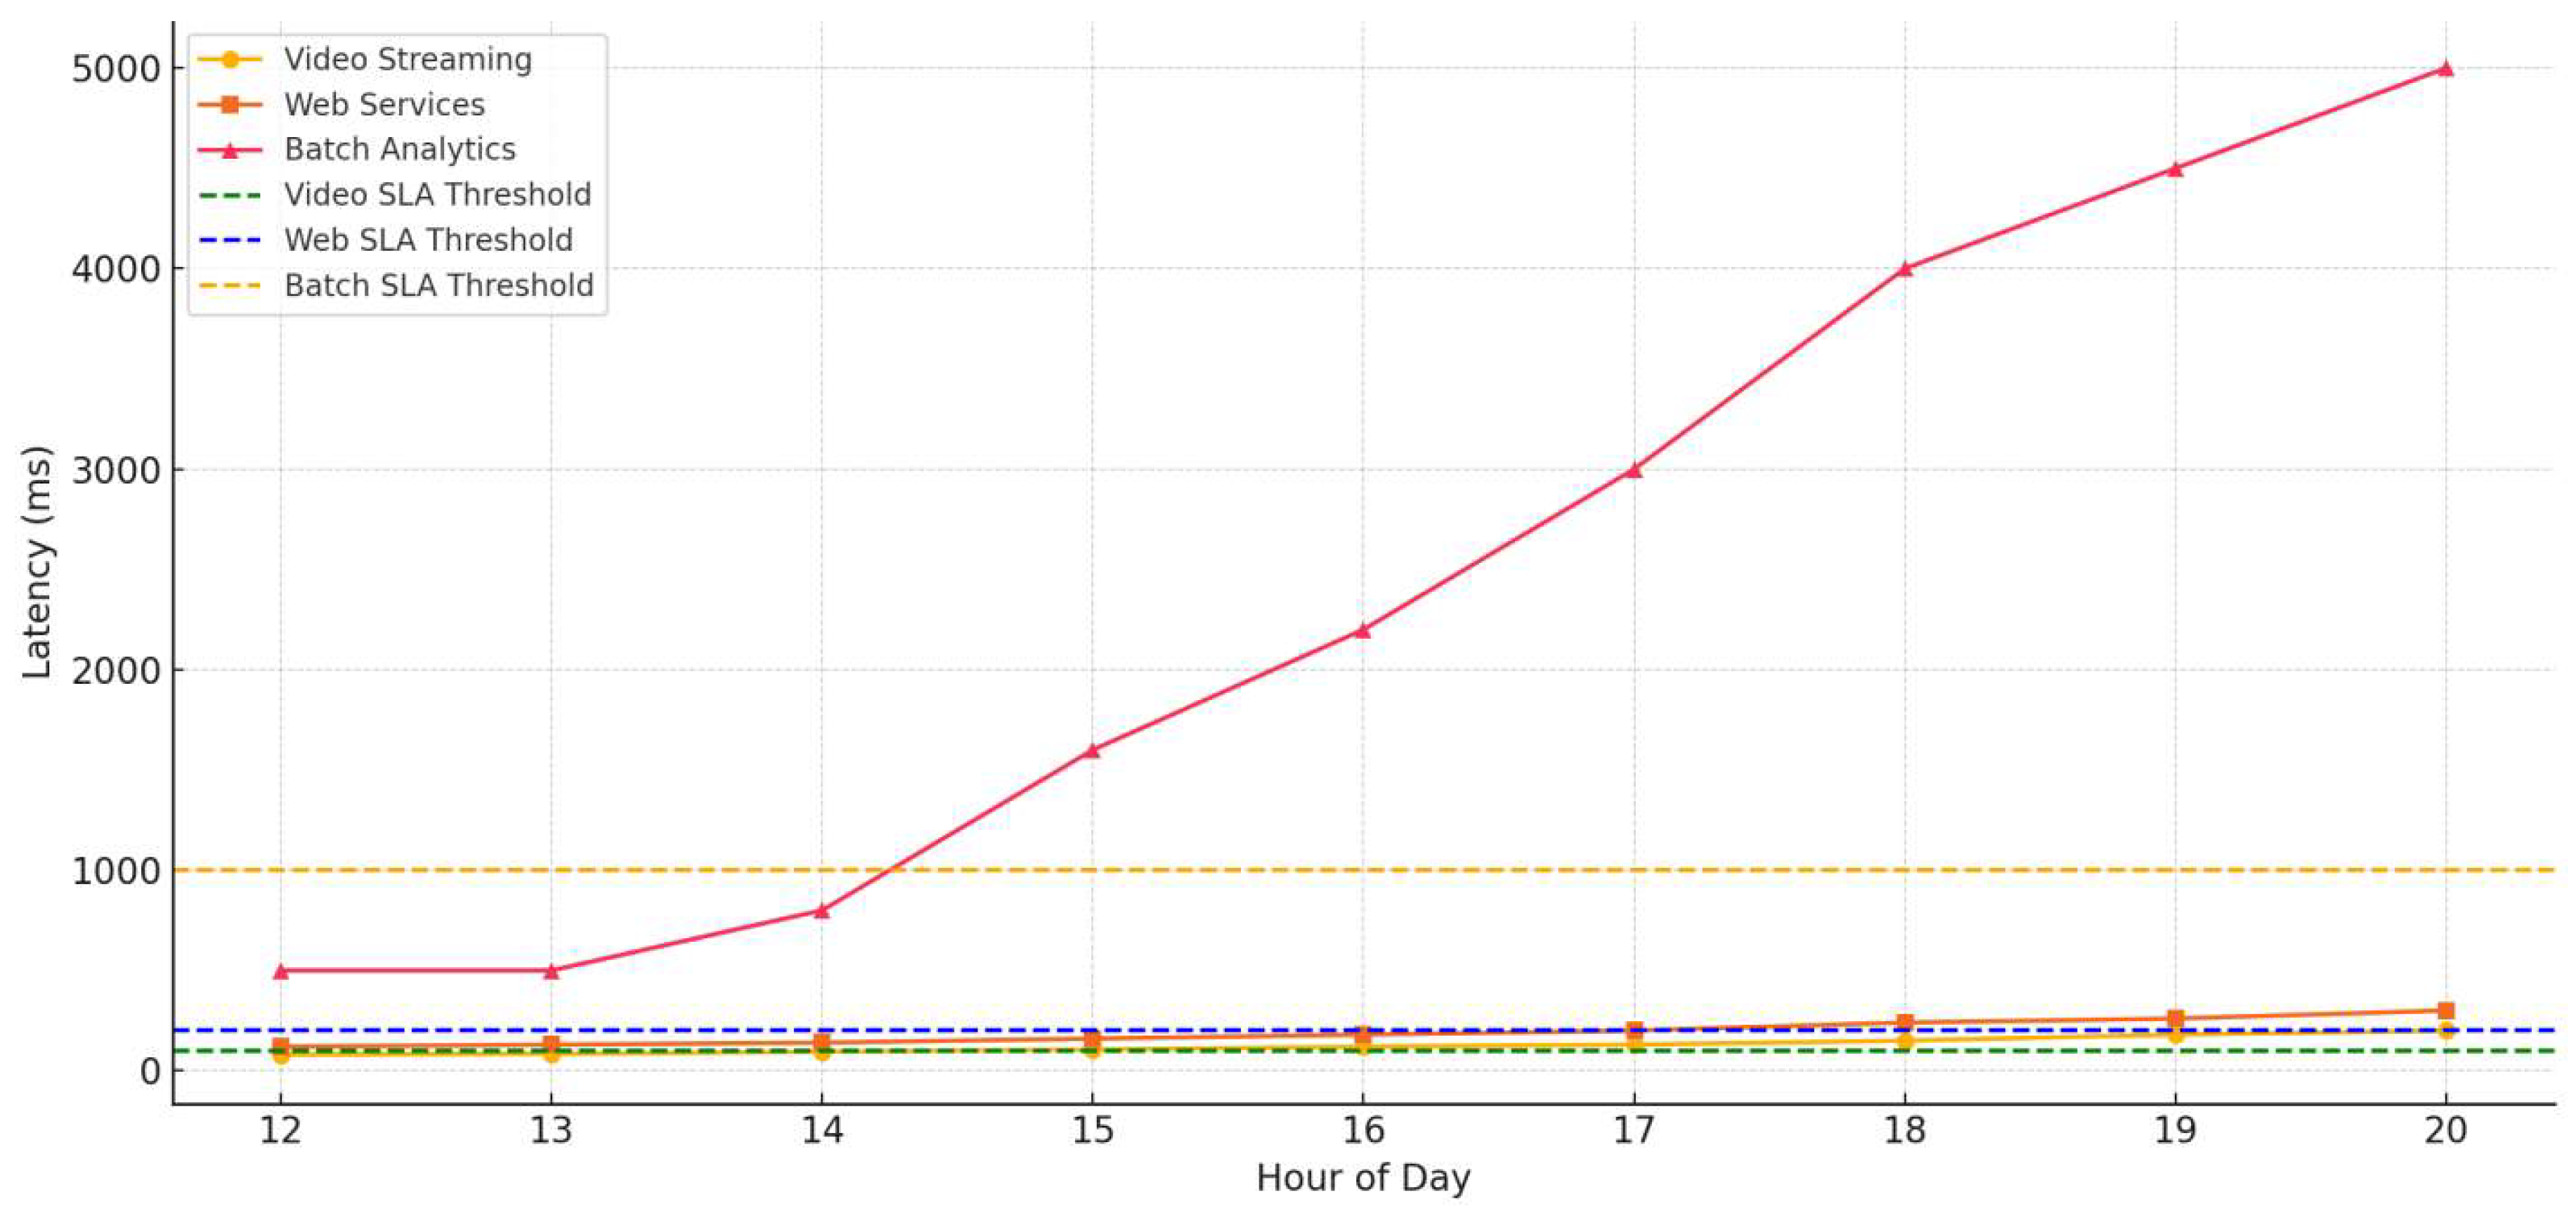
Figure 13.
Conceptual architecture of the proposed SDN-AI/ML.
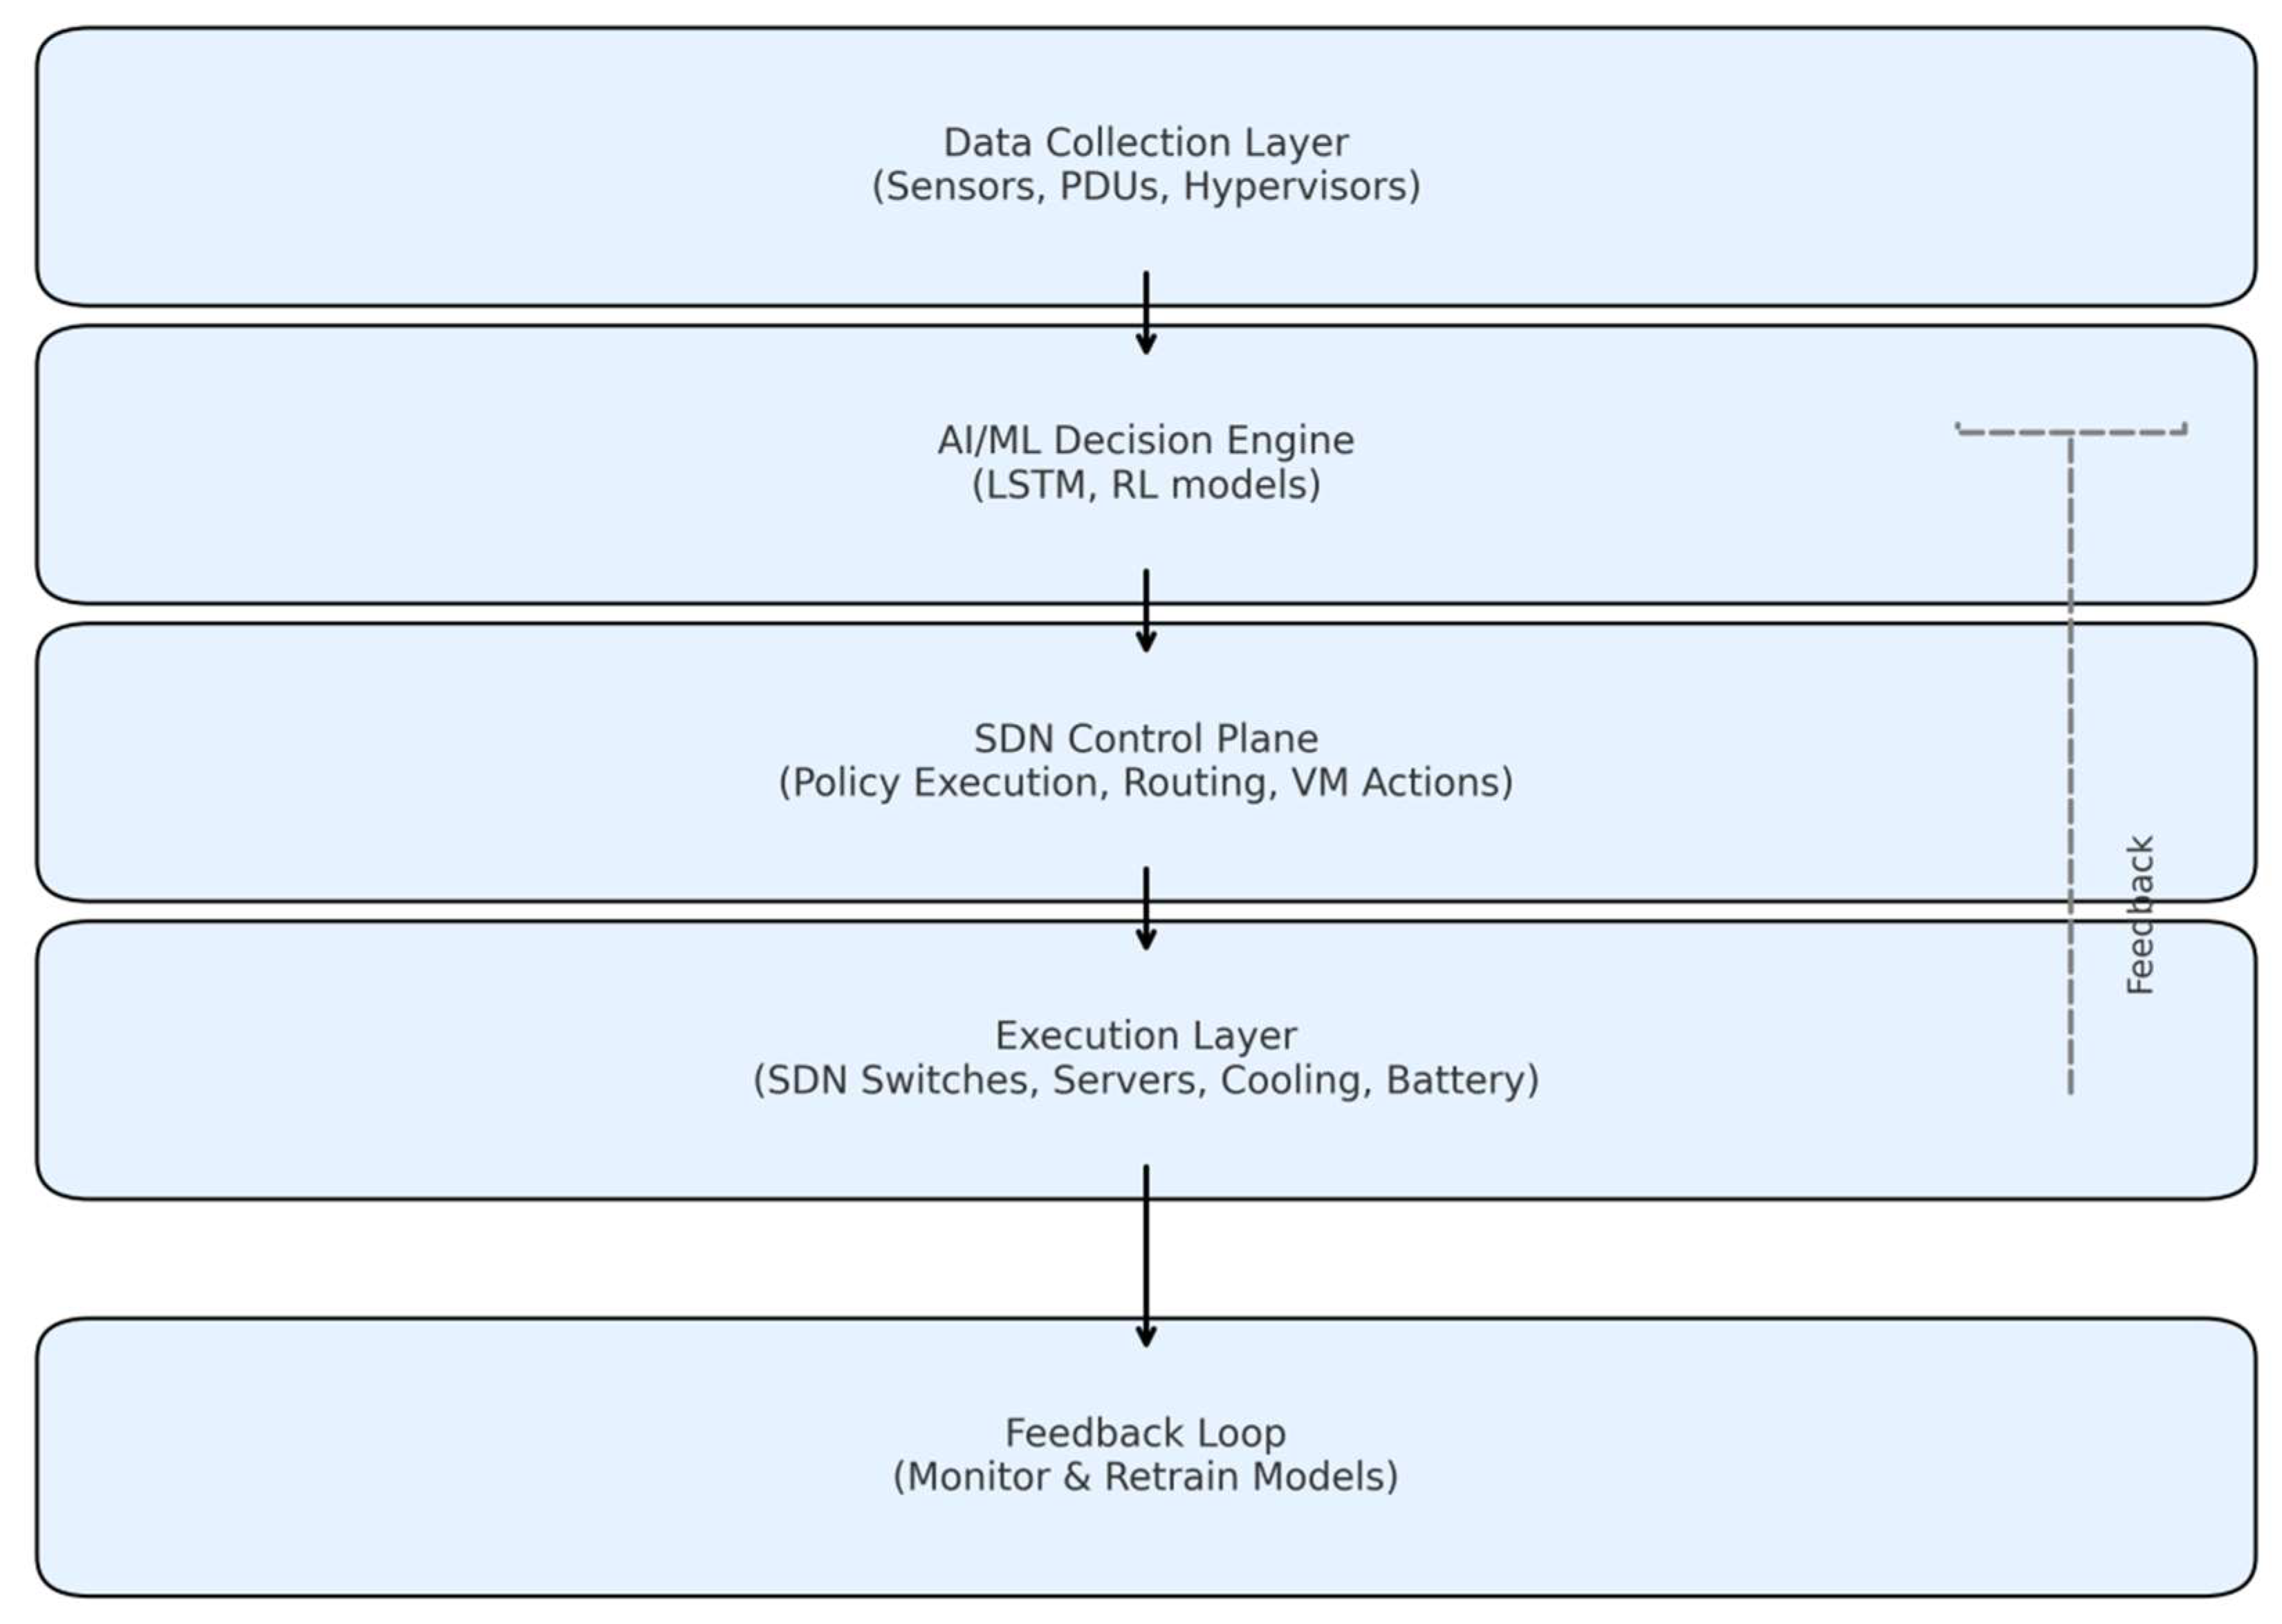

Table 1.
Solar System Sizing Calculations.
| Parameter | Value |
| Total Server Load | 12 × 300 W = 3600 W |
| Cooling Load | 0.4 × 3600 W = 1440 W |
| Total Avg. Power | 5040 W = 5.04 kW |
| Daily Energy Need | 5.04 kW × 24 h = 121 kWh |
| System Efficiency | η = 0.80 |
| Solar Hours (Erbil) | 5.5 h/day |
| Required PV Size | 121 / (5.5 × 0.80) ≈ 27.5 kW |
| Battery Storage (1 day, DoD margin) | 121 × 1.25 = 151.25 kWh |
| Inverter Sizing (20% margin) | 1.2 × 5.04 kW = 6.05 kW |
Table 2.
The average contribution of each technique.
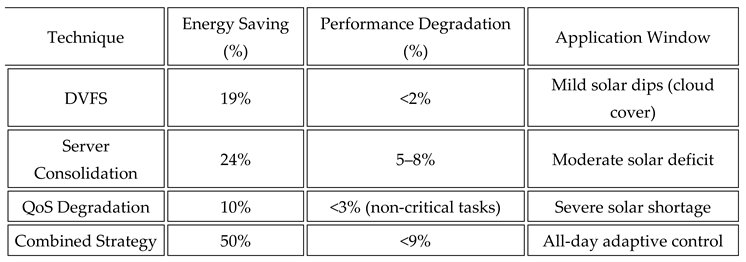 |
Table 3.
Features of data center services.
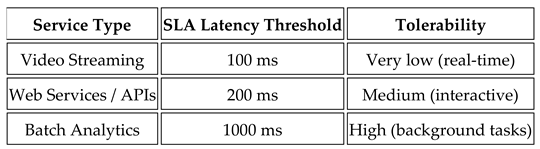 |
Table 4.
Energy levels effect on data center services performance.
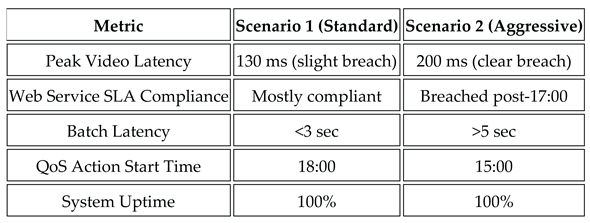 |
Table 5.
Estimated Gains from AI/ML + SDN Integration.
 |
Disclaimer/Publisher’s Note: The statements, opinions and data contained in all publications are solely those of the individual author(s) and contributor(s) and not of MDPI and/or the editor(s). MDPI and/or the editor(s) disclaim responsibility for any injury to people or property resulting from any ideas, methods, instructions or products referred to in the content. |
© 2025 by the authors. Licensee MDPI, Basel, Switzerland. This article is an open access article distributed under the terms and conditions of the Creative Commons Attribution (CC BY) license (http://creativecommons.org/licenses/by/4.0/).
Copyright: This open access article is published under a Creative Commons CC BY 4.0 license, which permit the free download, distribution, and reuse, provided that the author and preprint are cited in any reuse.


