
Submitted:
13 May 2025
Posted:
13 May 2025
You are already at the latest version
Abstract
Background and Objectives: Acute pancreatitis (AP) presents with variable severity, and early identification of patients at risk for poor outcomes remains challenging. Red cell distribution width (RDW) is a widely available marker with potential prognostic value. Materials and Methods: We analyzed 682 patients from the RO-API/BUC-API registry admitted with AP between 2015 and 2023. RDW measured at 24 ± 6 hours post-admission was assessed for associations with severity (per Revised Atlanta Classification) and in-hospital mortality. ROC analysis and logistic regression were applied. Results: Median RDW was significantly higher in non-survivors and patients with severe disease. RDW ≥13.85% predicted mortality (AUC = 0.67), and ≥14.35% predicted severe AP (AUC = 0.67). RDW remained an independent predictor after adjusting for age. Conclusions: RDW at 24 hours is a useful early biomarker for predicting severity and mortality in AP.
Keywords:
acute pancreatitis
; red cell distribution width
; prognosis
; severity
; mortality
; inflammation
1. Introduction
Acute pancreatitis (AP) is a pancreatic inflammatory disorder that manifests as acinar cell death, and local and systemic Inflammation, mainly determined by alcohol abuse and gallstones [1]. The global incidence of AP is estimated at 34 cases per 100,000 person-years, with the numbers continuing to rise, and even though the mortality rate has decreased from 1.6% to 0.8% over the past decade, this progress is still far from ideal [2]. Timely identification of patients at risk for developing a severe course of disease is critical, as early interventions, such as fluid resuscitation, close monitoring, and ICU-level care, may contribute to improved outcomes. Taking this into consideration, prompt recognition of patients at high risk of fatal outcomes and rapid intervention remain critical objectives. Indeed, this principle of early risk stratification is equally pertinent in other conditions, such as, for instance, chronic hepatitis C, where the identification of baseline predictive factors has been historically pursued to determine which patients are likely to obtain the best treatment outcomes [3].
According to the 2012 revised Atlanta classification, AP is categorized as mild, moderate-severe, and severe, based on the existence and, when it is present, persistence of organ failure beyond 24h, with a prognostic role regarding disease outcomes [4]. Even though the vast majority of patients have mild disease, approximately 20% will suffer from severe AP with a significant impact on morbidity and mortality [5].
This non-negligible percentage of patients suffering from severe AP has driven the search for simple, widely available biomarkers that can aid in early risk stratification. Several biomarkers and scoring systems have been evaluated for their clinical utility in predicting the severity and mortality associated with AP. However, traditional severity scoring systems such as Ranson, APACHE II, and BISAP either require 48-hour monitoring, multiple parameters, or complex calculations, making them difficult to implement for routine early triage in many settings [5,6]. Similar challenges related to complex risk models are recognized in other fields of medicine, prompting a preference for simpler, easier-to-apply, guideline-driven decision tools for risk assessment [7]. Despite their disadvantages, Ranson’s score and the Bedside Index for Severity in AP (BISAP) are commonly used prognostic tools, favored for their good correlation with clinical outcomes [6].
Besides scoring systems, biomarkers have been studied as potential tools for risk stratification in AP. Various single serum markers have also been investigated, with C-reactive protein (CRP) emerging as one of the most useful [8]. The ideal marker or prognostic score is expected to be simple, cheap, non-invasive, accurate, and quantitative. However, until present, no single serological biomarker has been found to accurately predict morbidity and mortality of AP at admission. One such parameter is red cell distribution width (RDW), a component of the standard complete blood count.
Red cell distribution width (RDW) is a parameter routinely identified in a complete blood count test that is simple, cheap, and quantitative. It measures the degree of size variability (also called anisocytosis) among peripheral red blood cells (RBCs) [9]. RDW is increasingly recognized as a marker of systemic inflammation and oxidative stress, both of which are central to the pathophysiology of AP [10,11,12]. Inflammatory cytokines such as interleukin-6 (IL-6) and tumor necrosis factor-alpha (TNF-α) interfere with erythropoiesis and iron metabolism, leading to increased heterogeneity in red cell morphology, thus generating elevated RDW values [10,11,13].
RDW has been previously shown to predict mortality in elderly patients, critically ill patients, and patients with acute or chronic pulmonary or cardiovascular diseases [9,14,15]. Moreover, RDW has been evaluated as a mortality predictor in AP in several studies [16,17,18]. However, recent studies are showing conflicting results regarding the role of RDW at admission for AP severity assessment and also for its association with other better-established prognostic scores or serum biomarkers [19].
Despite these literature inconsistencies, there is a trend in the literature that supports the inclusion of RDW as a useful, inexpensive, and rapidly available biomarker in the early prognostic evaluation of acute pancreatitis. This approach aligns with a wider shift toward integrating readily available biomarkers into prognostic models that can guide clinical decision-making [7]. In this study, we aimed to evaluate the role of RDW measured at 24 hours post-admission in predicting severity and in-hospital mortality in a large multicenter Romanian cohort of patients with AP, using data from the RO-API/BUC-API registry.
2. Materials and Methods
2.1. Setting
Data included in the RO-API/BUC-API registry were extracted from electronic health records of four large tertiary care teaching hospitals from Bucharest, Romania: University Emergency Hospital of Bucharest, Emergency Clinical Hospital of Bucharest, Elias University Emergency, and Fundeni Clinical Institute. Apart from the Fundeni Clinical Institute, all are acute care-oriented medical institutions. These centers cumulate approximately 3600 inpatient care beds, being the largest four hospitals in southern Romania.
2.2. Study Design and Statistical Analysis
We performed a retrospective, case-control study based on patients included in the RO-API/BUC-API registry. RO-API/BUC-API registry is a registry of cases of acute pancreatitis and acute on chronic pancreatitis discharged consecutively between 1st January 2015 and 31st December 2023. Details regarding handling data in the RO-API/BUC-API registry were previously published [20]. In addition to what was detailed in the previous paper, we have extended the registry to 3 new centers. All the data available in the registry follow strictly the hospitalization period.
For this study, we have extracted the cases that fulfilled the following inclusion criteria:
- Red cell distribution width at 24h (±6h) available.
- Hemoglobin at 24h (±6h) available.
- Data regarding outcome at discharge and severity classification at discharge according to the Revised Atlanta Classification (RAC) [4].
The exclusion criteria for this study were:
- Cases suffering of acute on acute-on-chronic pancreatitis.
- Hospitalization period less than 24h.
Additionally, for the patients who had multiple entries in the registry, we took into account only the most recent one, based on the individual’s social ID and month of admission.
All the blood samples in this study were withdrawn from the peripheral venous circulation of the patients after a fasting period of at least 6h and were analyzed with the Abbott Cell-Dyn 3700 Hematology Analyzer (Abbott Laboratories Inc., Chicago, IL, USA). All the probes were analyzed in less than 60 minutes after they were drawn from patients, as this is the protocol in all the centers that participated in the study.
We have extracted the following epidemiology data from the registry: sex, age, outcome at discharge (classified as survived/deceased), month of admission, and classification of severity based on RAC. Regarding the biomarkers, we used the following results at the 24h (±6h) timepoint after admission: hemoglobin and red distribution width. While hemoglobin was measured in g/dL, RDW was measured as a percentage.
Means and percentages were used to describe the population of this study. The Kolmogorov-Smirnov test was used to check for the normal distribution of the continuous variables. If the normality assumption was broken, then Mann-Whitney U was run to verify if there were any differences between categorical and continuous variables. Receiver Operating Curve (ROC) and area under the curve (AUC) were calculated to demonstrate if the independent variable can significantly discriminate between the outcomes. Where AUC proved valuable, optimal cut-off points for the biomarker were found with Young’s Index. If the biomarker had an AUC over 0.60, then the cut-off value was used to dichotomize the biomarker for ease of interpretation. Logistic regression was used to assess potential confounders in the prediction model. In this analysis, any comparisons were made only between survivors and deceased, respectively, between patients who had a severe course of disease and the rest. The level of significance of the p-value was set at <0.05 or any confidence interval at 95% (CI 95%) that lacked 1.00.
The RO-API/BUC-API registry was organized with Microsoft Excel 2019 (Microsoft Inc., Redmond, WA, USA). All the statistical tests were run with SPSS 39.0.0.0 (IBM Inc., Armonk, NY, USA). All the figures were drawn with SPSS 39.0.0.0 or Microsoft PowerPoint 2019.
2.3. Ethics
This study was approved by the University Emergency Hospital of Bucharest Ethics Committee under the umbrella of the Romanian Acute Pancreatitis Index, formerly known as Bucharest Acute Pancreatitis Index (RO-API/BUC-API) registry, approval no. 68629/19 on 18th October 2024. Written informed consent from the patient for using their electronic health record data for observational studies was obtained before admission. This study was conducted following the recommendations of the 1968 Helsinki Declaration, version updated in 2008, and the manuscript was written according to the principles stated in Strengthening the Reporting of Observational Studies in Epidemiology (STROBE) guidelines for case-report studies. The cases were handled in the RO-API/BUC-API registry in compliance with the European Union’s and Romanian laws regarding the privacy of data.
3. Results
3.1. Study Sample
Based on the inclusion and exclusion criteria, we found in the RO-API/BUC-API registry a total of 717 cases. After filtering for multiple cases from the same patient, we found that in this population, we had 682 unique patients that fit the aforementioned criteria. The youngest patient was 18 years old, while the oldest was 97 years old. The shortest hospitalization had 1 day, while the longest had 101 days. The lowest RDW recorded was 9.30, and the highest was 63.70. The minimum HGB was 5.30 while the maximum one was 21.50. The characteristics of our cohort are available in Table 1.
3.2. Mortality
Kolmogorov-Smirnov showed that RDW was not normally distributed (p < 0.01). Mann-Whitney U test showed an important difference between healed and deceased groups (U = 9602.00, p < 0.01). The AUC of RDW regarding mortality was 0.67 (p < 0.01, 95% CI [0.61,0.74]). The highest Younden’s index was 0.32, corresponding to a value of RDW equal to 13.85%, which has a sensitivity of 85.70% and a specificity of 46.20% in predicting mortality in AP. (Figure 1). Logistic regression showed that an RDW higher than or equal to the cut-off can predict mortality (OR = 5.14, 95% CI [2.39, 11.05], p < 0.01). After adjusting for potential confounders, RDW persisted to be an independent predictor for mortality (OR = 4.36, 95% CI [2.01, 9.44], p < 0.01) although age was the only confounder that seemed to interfere with the model (OR = 1.03, 95% CI [1.01, 1.05], p < 0.01).
3.3. Severity
Concerning severity prediction, in a Mann-Whitney U test, RDW showed an important difference between the healed and deceased groups (U = 9801.50, p < 0.01). An AUC of 0.67 (p < 0.01, 95% CI [0.61,0.72]) was obtained concerning a severe course of disease. The highest Younden’s index was 0.31, corresponding to a value of RDW equal to 14.35%, which had a 68.00% sensitivity and a 62.70% specificity for predicting a severe course of disease. (Figure 2) The logistic regression yielded an OR of 3.58, with a 95% CI of [2.27, 5.67], p < 0.01 for predicting a severe course of disease in patients with an RDW at 24h higher than or equal to the cut-off value. After adjusting for potential confounders, the test showed an OR of 3.28, with a 95% CI of [2.06, 5.23] with age being the only confounder to have interfered with the model (OR = 1.02, 95% CI [1.01, 1.03], p < 0.01). Table 2 summarizes the predictive abilities of RDW in AP.
4. Discussion
The results of our study demonstrate that an elevated RDW at 24 hours after admission is a good predictor of acute pancreatitis severity and in-hospital mortality. Patients who developed severe AP or fatal outcomes had significantly higher 24-hour RDW values. The biomarker achieved robust discrimination abilities for poor outcomes. The prognostic performance of 24-hour RDW in our study is comparable to many established scoring systems (e.g., Ranson, BISAP), underscoring its clinical relevance. In ROC analysis, 24-hour RDW achieved an area under the curve (AUC) of around 0.7 for predicting severe AP and mortality, which is in line with the literature [16,21]. RDW remained independently associated with outcomes, even after adjustment for other risk factors, thus suggesting its capacity to capture unique information about the individual risk profile.
Our findings corroborate a growing body of evidence identifying RDW as an important prognostic biomarker in AP. Early work by Senol et al. (2013) first reported that admission RDW was significantly higher in non-survivors, with an AUC of approximately 0.82 for predicting mortality [15]. Subsequent studies have found similar results, showing that patients with severe or fatal AP have higher RDW on admission than those with mild disease [12]. Wang et al. showed that an RDW cutoff of ~14.3% on admission predicted mortality with 88% sensitivity and 92% specificity (AUC 0.894) [16]. Moreover, a Portuguese cohort study by Gravito-Soares et al. found admission RDW to be one of the best single predictors of severe AP (AUC 0.960 at cutoff ~13.0, 92.7% sensitivity) outperforming traditionally used prediction scores, such as Ranson, BISAP, or Modified Marshall [21]. Notably, the same study also observed the ability of RDW to predict in-hospital mortality with an AUC of 0.84, similar to our findings [21]. The RDW thresholds for risk stratification have been consistently reported in a narrow range (~13–15%), similar to our identified cutoffs that fall in the same interval, emphasizing the reproducibility of RDW as a predictive biomarker, even in different populations.
Our study presents the prognostic value of RDW measured 24 hours after admission. In the study by Gravito-Soares et al., the authors found a marginal superiority of RDW at 24h compared to RDW at admission for mortality prediction (AUC 0.848 vs. 0.842) [21]. An important practical point is that 24-hour RDW is available earlier than certain scoring criteria (e.g., Ranson requires 48h), thus enabling a faster risk assessment during the critical first day. In fact, this timing aligns well with real-world settings where clinicians must decide on ICU transfer, aggressive interventions, or close monitoring within the first 24 hours. Noteworthy, a recent study suggested little added value of RDW at 24h compared to admission values. Yet, that study included only 16 severe cases, thus underpower being an issue as well as possible confounders such as aggressive hemodilution from fluid resuscitation [22]. In contrast, our large cohort study, along with others, clearly shows that 24-hour RDW holds significant value for severity prediction in AP. Moreover, a rise or persistently elevated RDW should prompt attention over an unmitigated inflammatory process.
Regarding the role of RDW added to other biomarkers/scores to enhance predictive ability, there have been several studies addressing the issue. Yao et al. found that an admission RDW ≥13.1% predicted persistent organ failure with ~82% sensitivity (AUC 0.85) and adding RDW to the BISAP score improved prognostic performance (raising BISAP’s AUC from 0.77 to 0.89) [23]. These results suggest an incremental value of RDW added to other biomarkers/scores. Similarly, composite indices like the RDW-to-serum calcium ratio have been proposed, which have achieved extremely high accuracy in some studies [21,24]. While the analysis of composite indices surpasses the scope of our analysis, the key finding of these studies is related to the added value of RDW alongside other markers for an even superior risk stratification ability than each marker/score taken individually. This points towards risk stratification models integrating RDW and other early markers for enhanced prediction of disease outcomes.
Despite a general uniformity of the data from the literature reporting on RDW in AP, conflicting results have been published by Yılmaz et al., who did not find RDW to be useful.[25] In a cohort of 264 patients, the authors observed no statistically significant difference in RDW between moderate and severe pancreatitis groups (classified by Ranson criteria, p=0.193). Instead, they found that the CRP/albumin ratio was a better predictive biomarker for discrimination between moderate and severe AP, based on Ranson criteria. Possibly, the contrast with our results and most other reports is based on the severity stratification using Ranson criteria rather than the RAC. Another possible bias might be related to the low number of severe cases, only 22%, and low mortality rates, thus underpowering the study for this more severe population.
From a clinical point of view, using 24-hour RDW offers several advantages. It is an inexpensive and readily available parameter since it is part of the routine complete blood count. Unlike specialized biomarkers or elaborate scoring systems, RDW requires no extra cost or calculation, making it highly attractive for resource-limited settings and busy emergency units. Our study specifically focused on the 24-hour value to address the need for early risk stratification in the setting of AP, with the recognition that the initial 24 hours of treatment can significantly influence patient status. In the real-world setting, clinicians often reassess patients after a day of hydration and supportive care, making the decisions about ICU transfer, invasive monitoring, or referral to specialized centers if the patient is deteriorating. Incorporating the 24-hour RDW into this reassessment could improve the identification of patients who are silently progressing to severe disease. Another practical utility of this marker is that RDW is objective and automatable, meaning it can be flagged in electronic records to alert clinicians when above a threshold, contrasting with multifactorial scores like APACHE-II or even BISAP, which require manual calculation and are time-consuming.
Another important result of our study relies on the role of RDW as a prognostic marker in AP through the demonstration of its independent predictive value even after adjusting for age and comorbidities. The negative predictive value of RDW <14.35% for severe disease and <13.85% for mortality supports its use as a bedside screening tool. Nevertheless, RDW performs even better when integrated into multimodal risk assessments, as suggested by He et al. [13], thus providing a more balanced clinical picture.
We consider that the present study has several notable strengths. It represents one of the largest series to date (n = 682) examining RDW in AP, and is multicentric, incorporating patients from several hospitals. This contributes to enhanced generalizability of our results, as our cohort encompassed a heterogeneous mix of etiologies (biliary, alcoholic, hypertriglyceridemia) and practice patterns. We performed adjusted analyses to account for potential confounders (such as age, comorbidities, or other lab abnormalities), demonstrating that RDW’s predictive power is not simply a reflection of other severity indicators. Similarly to other studies in the literature, we also report performance characteristics (AUC, sensitivity, specificity) with confidence intervals, allowing for direct comparisons with other reports. We provide a comprehensive picture of where RDW stands as a prognostic tool for AP through the integration of our results into the broad literature tackling this idea.
However, we have to acknowledge also the limitations of our study. First, the retrospective design and use of registry data carry the risk of missing data and potential biases. However, the registry’s prospective data collection ensured relatively complete data, and we applied strict inclusion criteria. Second, while multicenter, all hospitals were located in the same city (Bucharest) and the same healthcare system, which may limit generalizability to other regions or community hospital settings. Third, we focused on RDW at a fixed 24-hour time point. This timing was chosen to balance early assessment with stabilization of initial management, but it may not capture the very initial changes or later dynamics. Fourth, we did not control for all possible factors that influence RDW (e.g., nutritional status, other immune diseases), so residual confounders might be present. Finally, the predictive performance of RDW, while significant, is moderate (AUC ~0.7–0.77), and thus, we propose a complementary role for RDW alongside the existing prognostic tools, rather than using it as an individual risk assessment tool. Future prospective studies are warranted to validate our findings, ideally with serial RDW measurements and in combination with other biomarkers or scoring systems.
5. Conclusions
This multicenter cohort study demonstrates that RDW, measured 24 hours after hospital admission, is a significant and independent predictor of both disease severity and in-hospital mortality in patients with acute pancreatitis. Given its availability, objectivity, and low cost, RDW represents a practical tool that can complement existing risk assessment methods in the early phase of acute pancreatitis. Future prospective studies should further validate the role of RDW and evaluate it through integration into combined predictive models to enhance early risk stratification and improve patient outcomes in acute pancreatitis.
Author Contributions
L.N., R.B.M., M.R.P., C.M.P., C.G.T., A.S. and E.M.I. contributed to conceptualization. They also contributed to establishing the methodology of the study, validation of results, supervision of the project, and review with editing of the final draft. F.A.P., H.N., M.B., A.D.B., and C.V.T. contributed to data curation, formal analysis, and writing of the original draft of the manuscript.
Funding
Publication of this paper was supported by the University of Medicine and Pharmacy Carol Davila, through the institutional program “Publish not Perish”.
Institutional Review Board Statement
The study was conducted in accordance with the Declaration of Helsinki and approved by the Ethics Committee of the University Emergency Hospital of Bucharest under the umbrella of the Romanian Acute Pancreatitis Index, formerly known as Bucharest Acute Pancreatitis Index (RO-API/BUC-API) registry, approval no. 68629/19 on 18th October 2024.
Informed Consent Statement
Informed consent was obtained from all subjects involved in the study.
Data Availability Statement
Data generated by this research is available at the corresponding author upon reasonable request.
Acknowledgments
This work was supported by the European Research Executive Agency under the project TRAINING IN TRANSLATIONAL PROTOCOLS FOR MINIMAL INVASIVE DIAGNOSIS AND THERAPY IN PANCREATICO-BILIARY CANCERS—TRIP (HORIZON-WIDERA-2021-ACCESS-03:Twinning, grant agreement number: 101079210/2022) and by UEFISCDI, Ministry of Education, Romania, under the project TRAINING IN TRANSLATIONAL PROTOCOLS FOR MINIMAL INVASIVE DIAGNOSIS AND THERAPY IN PANCREATICO-BILIARY CANCERS—NEW-TRIP (PN-IV-P8-8.1-PRE-HE-ORG-2023-0069, grant agreement number: 23PHE⁄2023).
Conflicts of Interest
The authors declare no conflicts of interest.
References
- Lee, P.J.; Papachristou, G.I. New insights into acute pancreatitis. Nat Rev Gastroenterol Hepatol 2019, 16, 479–496. [Google Scholar] [CrossRef]
- Petrov, M.S.; Yadav, D. Global epidemiology and holistic prevention of pancreatitis. Nat Rev Gastroenterol Hepatol 2019, 16, 175–184. [Google Scholar] [CrossRef] [PubMed]
- Ghenea, A.E.; Ungureanu, A.M.; et al. Predictors of early and sustained virological response of viral hepatitis C. Rom J Morphol Embryol 2021, 61, 1185–1192. [Google Scholar] [CrossRef]
- Banks, P.A.; Bollen, T.L.; Dervenis, C.; et al. Classification of acute pancreatitis—2012: revision of the Atlanta classification and definitions by international consensus. Gut 2013, 62, 102–111. [Google Scholar] [CrossRef]
- Wang, X.; Cui, Z.; Zhang, J.; et al. Early Predictive Factors of Inhospital Mortality in Patients With Severe Acute Pancreatitis. Pancreas 2010, 39, 114–115. [Google Scholar] [CrossRef] [PubMed]
- Cho, J.H.; Kim, T.N.; Chung, H.H.; et al. Comparison of scoring systems in predicting the severity of acute pancreatitis. World J Gastroenterol 2015, 21, 2387–2394. [Google Scholar] [CrossRef]
- Cîrstea, I.M. OVERVIEW OF NON-VITAMIN K ORAL ANTICOAGULANTS. FARMACIA 2020, 68, 206–212. [Google Scholar] [CrossRef]
- Almeida, N.; Fernandes, A.; Casela, A. Predictors of Severity and In-Hospital Mortality for Acute Pancreatitis: Is There Any Role for C-Reactive Protein Determination in the First 24 Hours? GE Port J Gastroenterol 2015, 22, 187–189. [Google Scholar] [CrossRef]
- Patel, K.V.; Semba, R.D.; Ferrucci, L.; et al. Red Cell Distribution Width and Mortality in Older Adults: A Meta-analysis. J Gerontol A Biol Sci Med Sci 2010, 65A, 258–265. [Google Scholar] [CrossRef]
- Cheng, T.; Liu, B.-F.; Han, T.-Y.; et al. Efficiency of red cell distribution width in predicting severity and mortality of patients with acute pancreatitis: A protocol for systematic review and meta-analysis. Medicine (Baltimore) 2021, 100, e24658. [Google Scholar] [CrossRef]
- Yao, J.; Lv, G. Association between red cell distribution width and acute pancreatitis: a cross-sectional study. BMJ Open 2014, 4, e004721. [Google Scholar] [CrossRef] [PubMed]
- Prakash, A.; Shah, B.K.; Sherpa, A.D.; Singh, R. . The Prognostic Consequence of Red Cell Distribution Width in Acute Pancreatitis. J Univers Coll Med Sci 2023, 11, 18–21. [Google Scholar] [CrossRef]
- He, S.; Shao, Y.; Hu, T.; et al. Potential value of red blood cell distribution width in predicting in-hospital mortality in intensive care US population with acute pancreatitis: a propensity score matching analysis. Sci Rep 2023, 13, 12841. [Google Scholar] [CrossRef]
- Hu, Z.-D.; Chen, Y.; Zhang, L.; et al. Red blood cell distribution width is a potential index to assess the disease activity of systemic lupus erythematosus. Clin Chim Acta 2013, 425, 202–205. [Google Scholar] [CrossRef] [PubMed]
- Şenol, K.; Saylam, B.; Kocaay, F.; et al. Red cell distribution width as a predictor of mortality in acute pancreatitis. Am J Emerg Med 2013, 31, 687–689. [Google Scholar] [CrossRef]
- Wang, D.; Yang, J.; Zhang, J.; et al. Red cell distribution width predicts deaths in patients with acute pancreatitis. J Res Med Sci Off J Isfahan Univ Med Sci 2015, 20, 424–428. [Google Scholar]
- Goyal, H.; Awad, H.; Hu, Z.-D. Prognostic value of admission red blood cell distribution width in acute pancreatitis: a systematic review. Ann Transl Med 2017, 5, 342. [Google Scholar] [CrossRef]
- Li, Y.; Zhao, Y.; Feng, L.; et al. Comparison of the prognostic values of inflammation markers in patients with acute pancreatitis: a retrospective cohort study. BMJ Open 2017, 7, e013206. [Google Scholar] [CrossRef]
- Ye, J.-F.; Zhao, Y.-X.; Ju, J.; et al. Building and verifying a severity prediction model of acute pancreatitis (AP) based on BISAP, MEWS and routine test indexes. Clin Res Hepatol Gastroenterol 2017, 41, 585–591. [Google Scholar] [CrossRef] [PubMed]
- Gűnșahin, D.; Edu, A.V.; Pahomeanu, M.R.; et al. Alcoholic Acute Pancreatitis, a Retrospective Study about Clinical Risk Factors and Outcomes—A Seven-Year Experience of a Large Tertiary Center. Biomedicines 2024, 12, 1299. [Google Scholar] [CrossRef]
- Gravito-Soares, M.; Gravito-Soares, E.; Gomes, D.; et al. Red cell distribution width and red cell distribution width to total serum calcium ratio as major predictors of severity and mortality in acute pancreatitis. BMC Gastroenterol 2018, 18, 108. [Google Scholar] [CrossRef]
- Ancy, J.M.J.; Murali, R.; Kini, P.R.; et al. A study on the prognostic value of red cell distribution width to total serum calcium ratio in acute pancreatitis and comparison with Ranson’s and BISAP score - a prospective observational study from a tertiary care center in Chennai. Int J Adv Med 2024, 12, 44–49. [Google Scholar] [CrossRef]
- Lv, Y.-C.; Yao, Y.-H.; Zhang, J.; et al. Red cell distribution width: A predictor of the severity of hypertriglyceridemia-induced acute pancreatitis. World J Exp Med 2023, 13, 115–122. [Google Scholar] [CrossRef]
- Gupta, V.; Narang, S.S.; Gill, C.S.; et al. Red Cell Distribution Width and Ratio of Red Cell Distribution Width-to-Total Serum Calcium as Predictors of Outcome of Acute Pancreatitis. Int J Appl Basic Med Res 2023, 13, 5–9. [Google Scholar] [CrossRef]
- Yılmaz, E.M. Significance of Red Blood Cell Distribution Width and CRP/Albumin Levels in Predicting Prognosis of Acute Pancreatitis. Turk J Trauma Emerg Surg, Epub ahead of print. 2018. [Google Scholar] [CrossRef]
Figure 1.
ROC curve for RDW prediction of mortality.
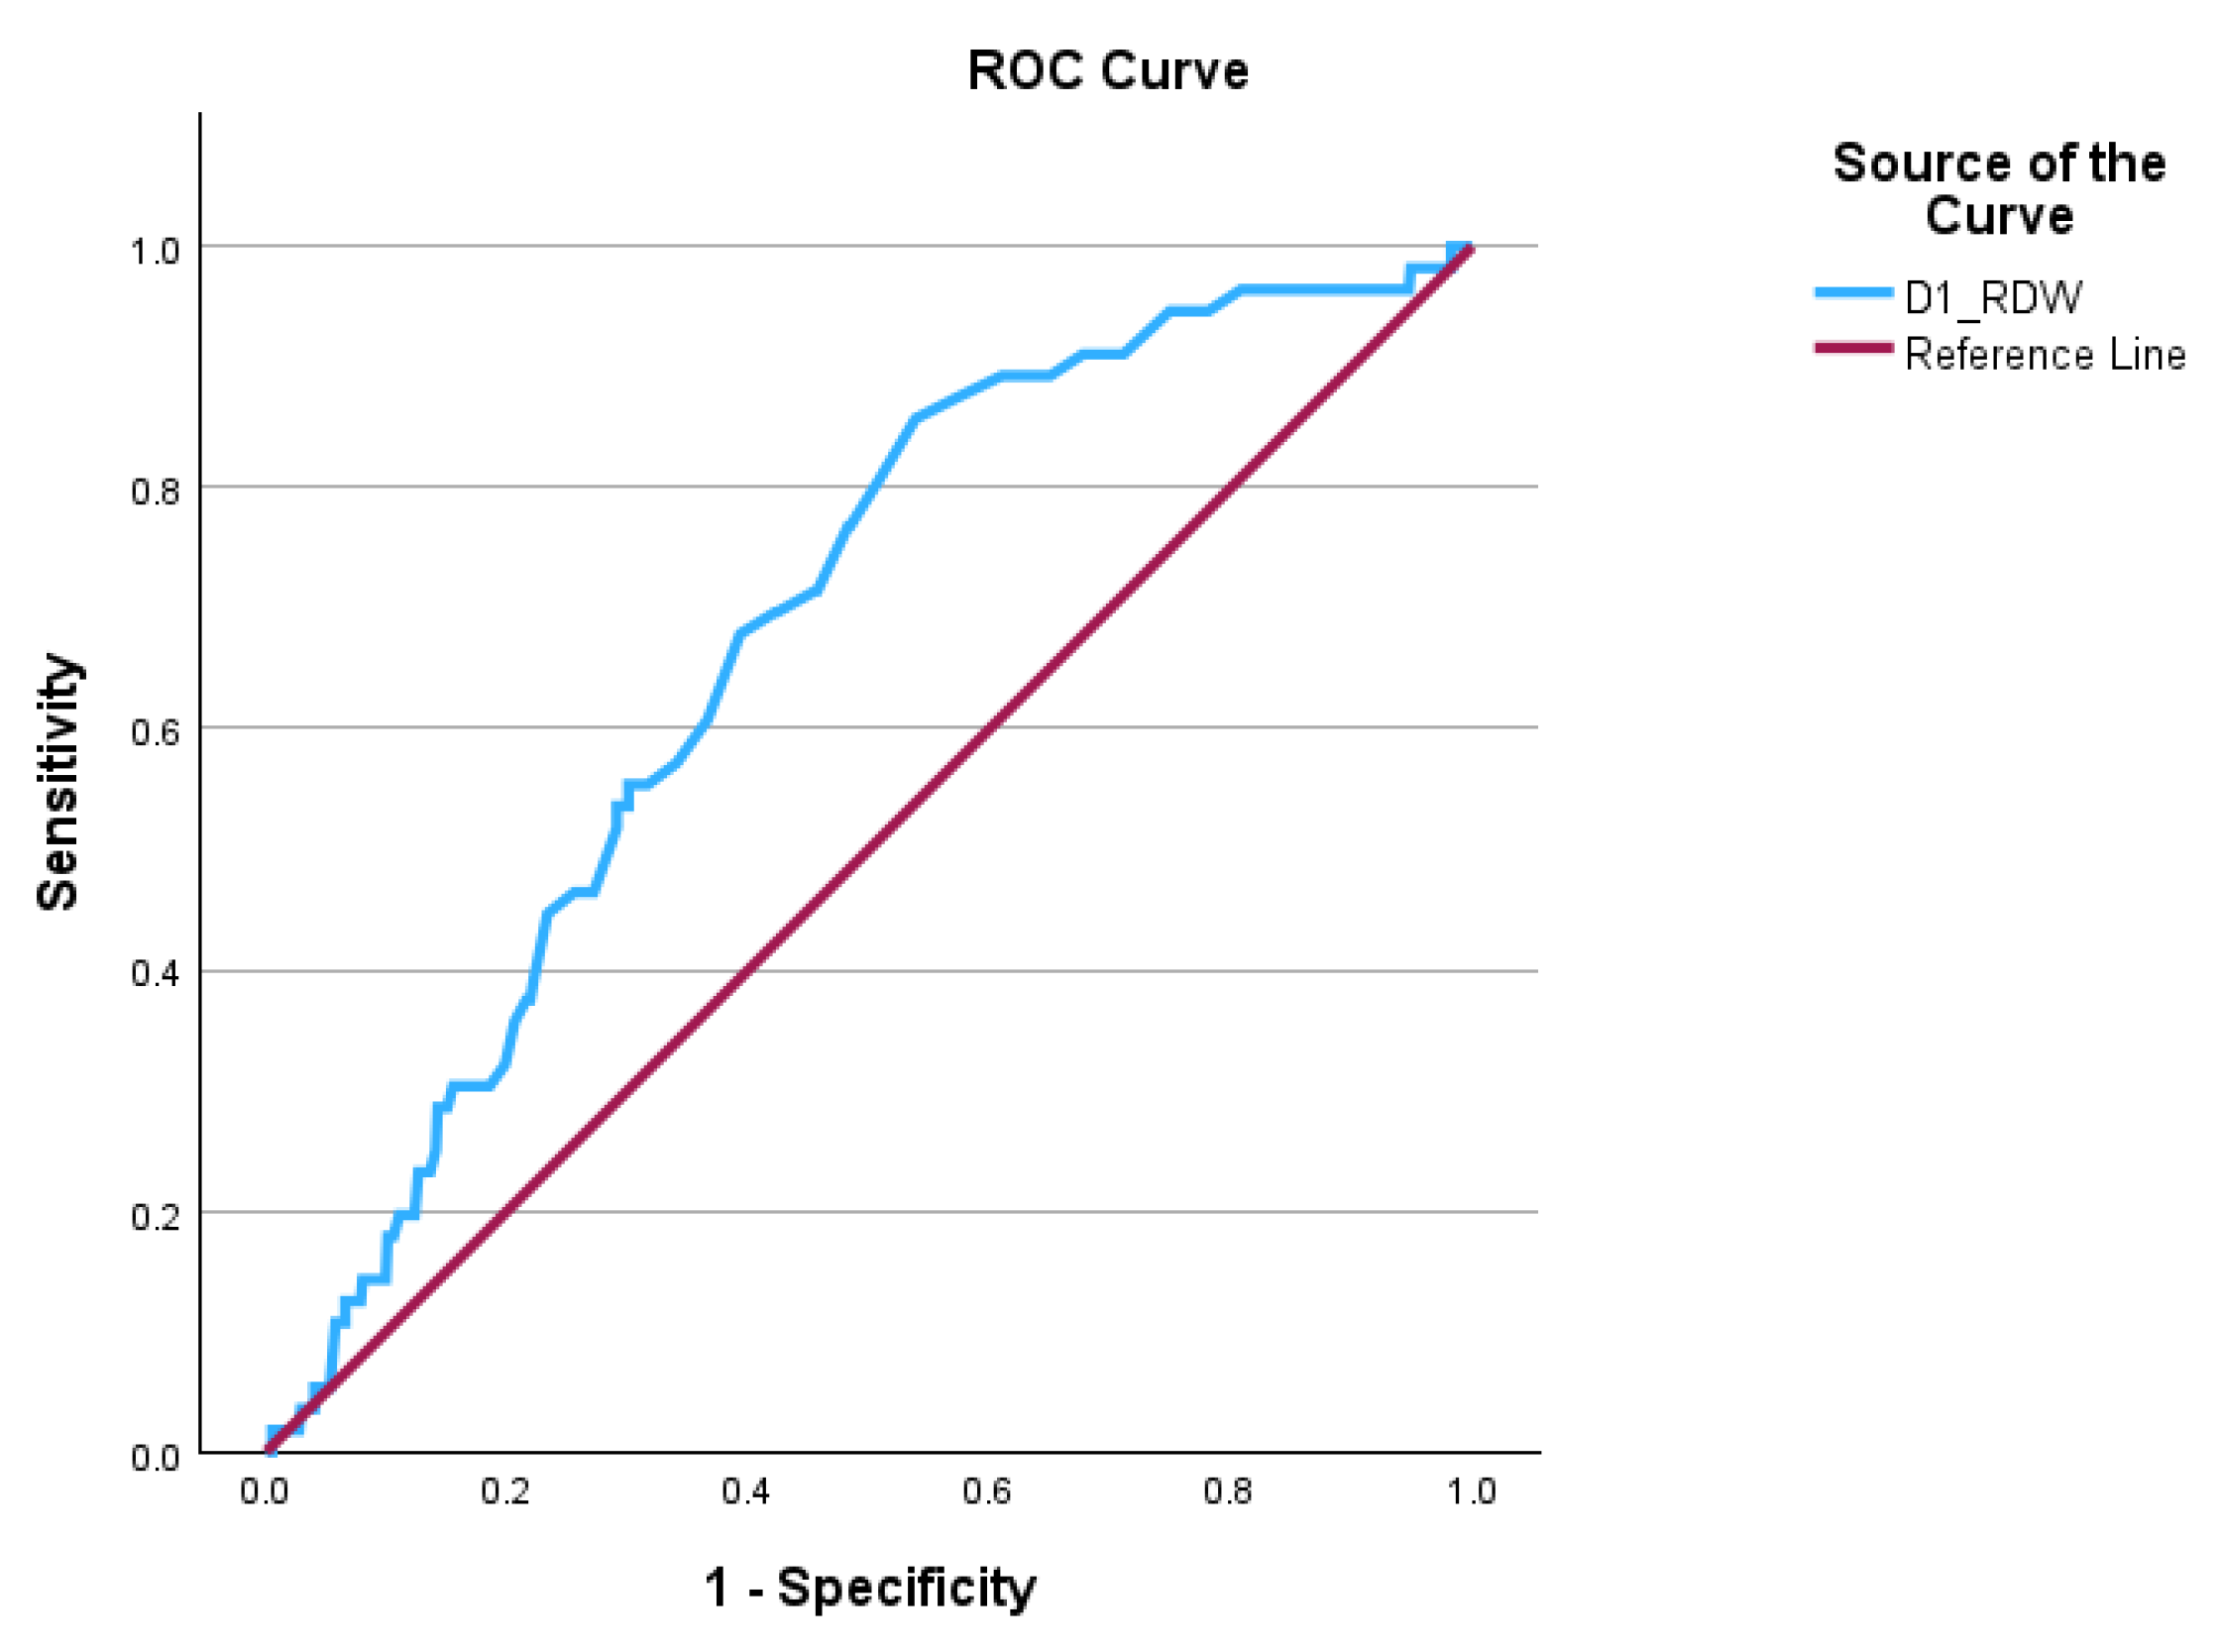

Table 1.
Demographics and disease characteristics of the cohort.
| Characteristic | n = 682 (%) |
| Sex, male | 397 (58.2%) |
| Outcome | |
| Healed | 545 (79.9%) |
| Stationary | 5 (0.7%) |
| Transfer | 27 (4.0%) |
| Discharge at will | 49 (7.2%) |
| Deceased | 56 (8.2%) |
| Severity | |
| Mild | 320 (46.9%) |
| Moderately severe | 265 (38.9%) |
| Severe | 97 (14.2%) |
| Days of hospitalization, median | 7.00 [IQR: 7.00 (12.00-5.00)] |
| Age, median | 58.00 [IQR: 25.00 (70.00-45.00)] |
| Red-cell width distribution (RDW), median | 14.10 [IQR: 1.90 (15.20-13.30)] |
| Hemoglobin (HGB), median | 13.10 [IQR: 2.90 (14.50-11.60)] |
Table 2.
Sensibility and specificity for disease severity and mortality prediction of 24-hour RDW values.
Table 2.
Sensibility and specificity for disease severity and mortality prediction of 24-hour RDW values.
| Outcome | AUC (95% CI) | Cut-off | Sensibility (%) | Specificity (%) | aOR (95% CI) |
| Mortality | 0.67 [0.61, 0.74] | 13.85 | 85.70 | 46.20 | 4.36 [2.01, 9.44] |
| Severity | 0.67 [0.61, 0.72] | 14.35 | 68.00 | 62.70 | 3.28 [2.06, 5.23] |
Disclaimer/Publisher’s Note: The statements, opinions and data contained in all publications are solely those of the individual author(s) and contributor(s) and not of MDPI and/or the editor(s). MDPI and/or the editor(s) disclaim responsibility for any injury to people or property resulting from any ideas, methods, instructions or products referred to in the content. |
© 2025 by the authors. Licensee MDPI, Basel, Switzerland. This article is an open access article distributed under the terms and conditions of the Creative Commons Attribution (CC BY) license (http://creativecommons.org/licenses/by/4.0/).
Copyright: This open access article is published under a Creative Commons CC BY 4.0 license, which permit the free download, distribution, and reuse, provided that the author and preprint are cited in any reuse.


