
Submitted:
12 May 2025
Posted:
13 May 2025
You are already at the latest version
Abstract
The emergence of generative AI is rapidly transforming education, especially learning assessment. This paper introduces a system that uses Google's NotebookLM to streamline the creation of assessment materials from diverse sources like PDFs, URLs, and YouTube videos. The developed system uses this AI tool to process these sources and generate content to be exported to Google Forms or Moodle via Google Apps Script. This innovative approach aims to address the increasing need for efficient test item generation while maintaining quality. The research also acknowledges the challenges of integrating AI in assessments, such as ensuring academic integrity and the validity of AI-generated content.
Keywords:
generative AI
; learning assessment
; automatic item generation
; Google NotebookLM
1. Introduction
Education, and in particular learning assessment,
is undergoing a period of profound transformation due to the emergence and
rapid advancement of artificial intelligence (AI), especially generative AI
(GenAI) [1–5] . Assessment is a critical
element in all learning systems, and the significant growth of digital
assessments in the last decade has led to an urgent need to generate more items
(test items) quickly and efficiently [6] .
Continuous improvements in computational power and advances in methodological
approaches, particularly in the field of natural language processing (NLP),
offer new opportunities and challenges for the automatic generation of items
for educational assessment [6–8] .
The concept of Automatic Item Generation (AIG) is
not new; it refers to a process, often algorithmic, for scalable item
development that can produce large numbers of items [6] .
Sources indicate that research on AIG for educational purposes has covered over
40 articles, focusing on key points such as the purpose of AIG, types of items
generated, types of inputs and approaches, and assessment methods [6] . Most of the studies reviewed in a mini-review
focus on the use of AIG for assessment purposes, including large-scale
assessments, opinion questions, formative or classroom assessments (such as
exam questions), and practice questions [6] .
Other studies have applied AIG to generate personality items and even for more
complex tasks such as stories and assessment passages [6] .
The advent of GenAI, defined as AI systems that
generate novel outputs rather than analyze existing data [9] , has intensified this potential. Advanced models
based on NLP and deep learning can process language and generate high-quality
text, images, and other content [4,7,9] .
Sources note that GenAI (such as ChatGPT) is reshaping educational landscapes,
enabling students to generate responses that closely mimic human-written
responses [5] . Large Language Models (LLMs), a
category of GenAI, have been identified as key tools that can be integrated
into the educational and assessment process [8,10] .
They can be used for a variety of assessment-related tasks, including test
planning, question creation, instruction preparation, test administration,
scoring, test analysis, interpretation, providing feedback, and recommending
study materials [8] .
A recent study specifically explored the
application of LLMs to generate customizable learning materials, including
automatically generating multiple-choice questions based on instructor-provided
learning outcomes [10] . This preliminary
experiment, conducted with undergraduate students, found that students found
GenAI-generated variants of learning materials engaging, with the most popular
feature being the automatically generated quiz-style tests that they used to assess
their understanding [10] . These findings
suggest potential for increasing student study time and supporting learning [10] .
However, integrating GenAI into assessment is not
without challenges and risks. One of the main concerns is the academic
integrity and authenticity of students' work, as it is difficult to distinguish
AI-generated content from that produced by students themselves [1,2,5,11,12] . LLMs have a tendency to invent
plausible and confident answers that seem credible at first glance, but that do
not stand up to detailed scrutiny, and may even invent references [2,12] . This misuse, where students use AI as a
substitute for critical thinking and research effort, can lead to an erosion of
academic integrity [12] . One study found that
while AIs perform well with general theoretical knowledge in control
engineering, they are still unable to solve complex practical problems
effectively and tend to resort to standard solutions that are not always
appropriate [12] . Furthermore, the responses
of generative AIs are not always consistent, even with identical commands, due
to their internal functioning and continuous updates [12] .
The era of GenAI calls for a rethinking of
traditional assessment methods, which often rely on memorization and
standardized tests, as these may not effectively measure higher-order skills
such as critical thinking, creativity, and problem-solving [1,5] . Sources suggest a shift toward assessments
that assess critical skills rather than rote knowledge, promoting scientific
reasoning and knowledge-based application [5,13] .
Generative AI need not threaten the validity or reliability of assessments;
rather, it can add fidelity and nuance to assisted assessments and facilitate a
greater focus on unaided assessments [14] .
Responsible use of GenAI becomes crucial in education, requiring pedagogically
appropriate interaction between learners and AI tools, with consideration for
human agency and higher-order thinking skills [11] .
It is essential to maintain a critical attitude and verify the results
generated by AI, recognizing that they are not infallible and their accuracy
depends on the quality of the data, algorithms, and clarity of the questions [12] .
Despite the potential, the sources identify several
gaps and areas requiring further research.
1. Lack of Guidelines and Validation: There are still no established guidelines for validating AI-generated assessments, nor standardized methodologies to ensure alignment with educational objectives [1,7].
2. Prevalence of Qualitative Studies and Small Samples: Most research is qualitative or case study-based with small samples, limiting the generalizability and robustness of conclusions [1,2,15].
3. Bias and Instructional Alignment: There are still issues of bias in training data and difficulties in ensuring that AI-created assessments actually measure the intended skills [5,7].
4. Lack of Empirical Data on Effectiveness and Impact: Many studies propose theoretical solutions or recommendations, but empirical data on effectiveness, long-term impact, and large-scale applicability are lacking [3,5,14].
5. Ethical and Academic Integrity Challenges: The adoption of generative AI raises new ethical and integrity issues, often only hinted at and not yet systematically addressed [2,3,5].
These gaps indicate the need for further empirical
research, development of guidelines, and rigorous validation to effectively
integrate generative AI into the automatic generation of assessment tests.
The research described here aims to contribute to
points 2 and 4.
2. Materials and Methods
2.1. The Developed System
In summary, the system works by ingesting diverse
data sources (PDFs, URLs, YouTube), utilizing Google NotebookLM to process and
understand this information, exporting the processed data to Google Sheets and,
then, through Google Apps Script, in two primary ways: directly for potential
use in Google Forms, or as XML file specifically designed for Moodle
integration.
Google NotebookLM is an innovative, AI-powered tool
designed to help users deeply understand and work with information from a
variety of sources. It moves beyond simple note-taking by leveraging advanced
artificial intelligence to analyze, summarize, and generate content based on
user-selected documents, web pages, YouTube videos, audio files, and pasted
text. At its core, NotebookLM harnesses the power of Google's cutting-edge
Gemini family of large language models. Initially built using Gemini 1.5, it
has since been enhanced with newer versions like Gemini 2.0 Flash and
experimental versions of Gemini 2.5 Pro, showcasing Google's commitment to
continuous improvement. These models are multimodal, meaning they can process
and understand various types of data, including text, code, images, audio, and
video. This allows NotebookLM to not only read and comprehend textual documents
but also to extract insights from visual and auditory content within the
provided sources. The true power of NotebookLM lies in its ability to elaborate
on and generate new content derived directly from the information sources the
user provides. Once sources are uploaded, the AI acts as an intelligent
research assistant. It can: generate summaries, answer questions contextually,
identify key topics and concepts, create study guides and briefing documents,
produce podcast-style audio overviews, facilitate deeper analysis, provide
citations.
Uploaded sources are easily managed, and users can
select which sources the AI should draw upon for generating responses. This
targeted approach ensures that the output is highly relevant to the user's
specific needs. Google NotebookLM acts as an active partner able to generate
new knowledge and content grounded in reliable sources.
This architecture strongly based on this Google AI
engine, enables the transformation of unstructured information from various
sources into structured formats suitable for educational purposes within the
Moodle learning environment. The use of Google Apps Script highlights the
potential for customizability and tailored data formatting for seamless
integration with Moodle.
The overall logic architecture of the developed
system is shown in Figure 1.
Breaking down this logic architecture step by step,
the modules and how they interact are clarified in the following.
First, the Input Sources. The system accepts
information from various input sources. In particular, Multiple PDF files can
be fed into the system. This suggests the system can extract text or data from
these documents. Moreover, the system can ingest information from web pages
specified by their URLs. This implies the ability to fetch content from the
internet. YouTube Videos may be input sources. The system can process video
content, potentially through transcription or by analyzing associated metadata.
Second. the Core Processing Module is Google
NotebookLM. The data from PDFs, URLs, and YouTube is fed into Google
NotebookLM. Google NotebookLM acts as a central processing unit. It likely uses
advanced AI and natural language processing (NLP) to understand, summarize, and
synthesize the information from the various input sources.
Third, Data Transformation and Export. The output
from Google NotebookLM is then directed towards two distinct paths. Path 1:
Google Sheets and Google Forms: an arrow points from Google NotebookLM to
Google Sheets. This suggests that NotebookLM can organize and export the
processed information into a structured spreadsheet format.
Subsequently, data may go from Google Sheets to
Google Forms. This implies that the data within the Google Sheet can be used to
automatically populate or create questions and options within a Google Form.
This could be useful for quizzes, surveys, or data collection. Path 2: Google
Apps Script and XML: from Google NotebookLM to Google Apps Script. Google Apps
Script is a powerful platform for automating tasks and extending Google
Workspace applications. This suggests that NotebookLM can trigger custom scripts
to further process or format the data. An arrow then leads from Google Apps
Script to an XML file. This indicates that the Google Apps Script is used to
transform the processed information into an XML (Extensible Markup Language)
format. XML is a standard markup language designed for encoding documents in a
format that is both human-readable and machine-readable.
Fourth, the final output on Moodle. An arrow points
from the XML file to Moodle. Moodle is a popular open-source learning
management system (LMS). This final step suggests that the XML file, generated
by the Google Apps Script, is specifically formatted for import into a Moodle
platform. This could be used to create learning materials, assessments, or
other educational content within Moodle.
2.2. The Course and the Tests
“Evaluation and Certification of Competences”
lessons held for the degree course in “Motor, Sports and Psychomotor Education
Sciences” at the University of Salerno.
The general objective of the lessons is to promote
knowledge related to the models of evaluation and certification of skills and
develop the ability to use them in real or simulated situations related to the
world of sport, school and training.
The topics considered in this study are the
following:
- Definitions of knowledge, skills, attitudes, context and competences.
- Assessment and evaluation of competences in the sports.
- Assessment and evaluation of competences at school.
- Peer assessment and evaluation.
- Certification of competences at school.
- European frameworks and laws for the certification of the competences.
These lessons cover topics that are introduced with
a gradual approach that makes them particularly accessible and do not require
particular prerequisites or prior knowledge to follow. The structure of each
lesson is a frontal lecture and a final test on the treated topic. The tests
have been created by using the generative artificial intelligence of Google
NotebookLM by elaborating as sources slides, handouts in pdf files and video
from Youtube. They have 15 questions each and they have been delivered as Moodle
quizzes or Google forms. The total number of created questions delivered to
participants is 90.
2.3. The People
The participants are students enrolled in the degree course in “Sciences of Motor
Activities, Sports and Psychomotor Education” at the University of Salerno who
follow the lessons of “Evaluation and Certification of Competences” which
is a third and final year course.
They have been engaged during the second semester
of the academic year 2024/25 from the end of February to the beginning of May. The
total number of students enrolled in the course is 139. About half of them
actually participated in the experiment.
2.4. The Qualitative and Quantitative Evaluation of the Tests
The effectiveness of the assessment tests produced
thanks to the use of artificial intelligence was evaluated at a quantitative
level through item analysis and at a qualitative level by collecting the
opinions of the participants through the administration of a questionnaire.
2.4.1. Item Analysis
Item analysis is a crucial process in psychometrics
and educational measurement aimed at evaluating the quality and effectiveness
of individual items within an assessment test to enhance its overall validity
and reliability [16] . This involves
calculating several key indices and indicators after test administration to a
representative sample. The Difficulty Index (p), representing the
proportion of respondents answering correctly, ideally ranges between 0.30 and
0.70 [17] , indicating an appropriately
challenging item. Discriminatory Power (D), often the difference in
success rates between high- and low-scoring groups, should be positive and
high, signifying the item's ability to differentiate between individuals with
varying levels of competence [18] . A related
measure, the Selectivity Index (IS) or point-biserial correlation,
quantifies the correlation between item response and total test score; values
above 0.30 are generally considered good, 0.20-0.30 fair, 0.10-0.20 marginal,
and below 0.10 warrant revision [17,18] . The
Reliability Index (IA), calculated as the product of the discrimination
index and the square root of item variance, estimates an item's contribution to
the test's internal consistency; higher values indicate a greater positive
impact on reliability [19] . To calibrate a
test and evaluate item effectiveness, these indices are jointly interpreted:
problematic items with low difficulty or discrimination, poor selectivity (IS
< 0.10), and low reliability (IA) should be revised or removed.
Items with high discriminatory power (D and IS > 0.30) are
valuable for differentiating competence levels. Optimizing the balance of item
difficulty and discrimination, while maximizing the overall reliability by
addressing items with low IA, leads to a well-calibrated test that
accurately and consistently measures the intended construct [16,19] .
2.4.2. The Questionnaire
At the end of the course, a questionnaire have been
delivered to the participants to collect their opinions about the tests.
Krosnick and Presser [11]
emphasized the importance of clear and concise question wording to avoid
ambiguity and ensure respondents understand the questions as intended. They
recommend using simple language and avoiding technical jargon. They also
suggest using a mix of close- and open-ended questions to capture both
quantitative and qualitative data. To collect opinions of users on their
e-learning experience, a questionnaire was defined inspired by the UEQ model [12] , and the TUXEL technique was used for user
experience evaluation in e-learning [13] .
These references provided insights into the
methodologies and findings related to user experience and satisfaction to
design a questionnaire to be delivered at the end of the course. Table 1 shows the delivered questions.

Table 1.
The questionnaire.
| Question | Possible Answers |
|---|---|
| Course of Study | Open text |
| Course Year | Number |
| Section B: General Test Evaluation | |
| B1. The overall quality of the test questions is high? | Rating scale: 1 = Totally disagree; 2 = Disagree; 3 = Neutral; 4 = Agree; 5 = Totally agree |
| B2. Were the questions relevant to the topics covered in the specified study material? | Rating scale: 1 = Totally disagree; 2 = Disagree; 3 = Neutral; 4 = Agree; 5 = Totally agree |
| B3. Did the test adequately cover the topics it was intended to assess? | Rating scale: 1 = Totally disagree; 2 = Disagree; 3 = Neutral; 4 = Agree; 5 = Totally agree |
| B4. Is the overall difficulty level of the test appropriate to your expected level of preparation? | Rating scale: 1 = Totally disagree; 2 = Disagree; 3 = Neutral; 4 = Agree; 5 = Totally agree |
| Section C: Specific Evaluation of Applications | |
| C1. Were the questions worded clear and easy to understand? | Rating scale: 1 = Totally disagree; 2 = Disagree; 3 = Neutral; 4 = Agree; 5 = Totally agree |
| C2. Were the questions unambiguous? | Rating scale: 1 = Totally disagree; 2 = Disagree; 3 = Neutral; 4 = Agree; 5 = Totally agree |
| C3. Were the questions worded grammatically correct? | Rating scale: 1 = Totally disagree; 2 = Disagree; 3 = Neutral; 4 = Agree; 5 = Totally agree |
| C4. Did the questions appear to be content-wise correct (contain no factual or conceptual errors)? | Rating scale: 1 = Totally disagree; 2 = Disagree; 3 = Neutral; 4 = Agree; 5 = Totally agree |
| C5. Were the questions "fair" (not tricky or based on excessively minor details)? | Rating scale: 1 = Totally disagree; 2 = Disagree; 3 = Neutral; 4 = Agree; 5 = Totally agree |
|
Section D: Specific Evaluation of Response Options The test included multiple choice questions, think about the answer options provided and evaluate the following aspects: |
|
| D1. Were the response options clearly worded? | Rating scale: 1 = Totally disagree; 2 = Disagree; 3 = Neutral; 4 = Agree; 5 = Totally agree |
| D2. Was the correct answer option clearly and unequivocally correct? | Rating scale: 1 = Totally disagree; 2 = Disagree; 3 = Neutral; 4 = Agree; 5 = Totally agree |
| D3. Were the incorrect response options (distractors) plausible but clearly incorrect? | Rating scale: 1 = Totally disagree; 2 = Disagree; 3 = Neutral; 4 = Agree; 5 = Totally agree |
| D4. Were the answer options grammatically consistent with the question? | Rating scale: 1 = Totally disagree; 2 = Disagree; 3 = Neutral; 4 = Agree; 5 = Totally agree |
| Section E: Identifying Specific ProblemsThis section is very important to help us identify specific problems. | |
| E1. Did you find cases where more than one answer seemed correct? | Yes / No |
| E2. Did you find any cases where no answer seemed correct? | Yes / No |
| Section F: Comparison and Final Comments | |
| F1. If you have taken tests on similar topics prepared by instructors before, how would you compare the overall quality of the questions on this AI-generated test to those prepared by humans? | Significantly worse / Slightly worse / Similar / Slightly better / Significantly better / Don't know / I have no terms of comparison |
| F2. Do you have any other comments, suggestions, or observations regarding the AI-generated quiz questions or answers that you would like to share? | Open text |
* These questions are not mandatory.
Many questions allowed the participants to express their opinions on a 5-level scale (1 = Totally disagree; 2 = Disagree; 3 = Neutral; 4 = Agree; 5 = Totally agree). Some of them are Yes/No questions. Some final questions allowed participants to leave comments and suggestions in an open text box.
3. Results
This section may be divided by subheadings. It should provide a concise and precise description of the experimental results, their interpretation, as well as the experimental conclusions that can be drawn.
3.1. The Effective Participants
Test n.1 was administered to 61 participants; Test n.2 was administered to 63 participants, Test n.3 to 69; Test n.4 to 60, Test n.5 to 65, and finally Test n.6 to 64. The average number of participants is 64.
3.2. Item Analysis Results
The four cited indexes have been calculated on each on the six tests. The results of these calculations are reported in the Table 1, Table 2, Table 3, Table 4, Table 5 and Table 6.
Table 1.
Item Analysis on the Test n.1 about the “Definitions of knowledge, skills, attitudes, context and competences”.
Table 1.
Item Analysis on the Test n.1 about the “Definitions of knowledge, skills, attitudes, context and competences”.
| TEST n.1 | Item 1.1 |
Item 1.2 |
Item 1.3 |
Item 1.4 |
Item 1.5 |
Item 1.6 |
Item 1.7 |
Item 1.8 |
Item 1.9 |
Item 1.10 |
Item 1.11 |
Item 1.12 |
Item 1.13 |
Item 1.14 |
Item 1.15 |
|---|---|---|---|---|---|---|---|---|---|---|---|---|---|---|---|
| Difficulty Index (p) |
0.56 | 0.75 | 0.80 | 0.67 | 0.87 | 0.52 | 0.85 | 0.54 | 0.59 | 0.54 | 0.93 | 0.92 | 0.84 | 0.59 | 0.61 |
| Discriminatory Power (D) | 0.99 | 0.74 | 0.63 | 0.88 | 0.46 | 1.00 | 0.50 | 0.99 | 0.97 | 0.99 | 0.25 | 0.30 | 0.55 | 0.97 | 0.95 |
| Selectivity Index (IS) |
0.25 | 0.35 | 0.30 | 0.65 | 0.20 | 0.75 | 0.15 | 0.55 | 0.40 | 0.15 | 0.20 | 0.10 | 0.30 | 0.50 | 0.20 |
| Reliability Index (IA) |
0.14 | 0.26 | 0.24 | 0.44 | 0.17 | 0.39 | 0.13 | 0.30 | 0.24 | 0.08 | 0.19 | 0.09 | 0.25 | 0.30 | 0.12 |
Table 2.
Item Analysis on the Test n.2 about the “Assessment and evaluation of competences in the sports”.
Table 2.
Item Analysis on the Test n.2 about the “Assessment and evaluation of competences in the sports”.
| TEST n.2 | Item 2.1 |
Item 2.2 |
Item 2.3 |
Item 2.4 |
Item 2.5 |
Item 2.6 |
Item 2.7 |
Item 2.8 |
Item 2.9 |
Item 2.10 |
Item 2.11 |
Item 2.12 |
Item 2.13 |
Item 2.14 |
Item 2.15 |
|---|---|---|---|---|---|---|---|---|---|---|---|---|---|---|---|
| Difficulty Index (p) |
1.00 | 0.95 | 0.81 | 0.44 | 0.68 | 0.68 | 0.95 | 0.63 | 0.71 | 0.44 | 0.94 | 0.92 | 0.83 | 0.98 | 0.97 |
| Discriminatory Power (D) | 0.00 | 0.18 | 0.62 | 0.99 | 0.87 | 0.87 | 0.18 | 0.93 | 0.82 | 0.99 | 0.24 | 0.29 | 0.58 | 0.06 | 0.12 |
| Selectivity Index (IS) |
0.00 | 0.14 | 0.33 | 0.62 | 0.33 | 0.76 | 0.05 | 0.43 | 0.43 | 0.24 | 0.14 | 0.05 | 0.24 | 0.05 | 0.05 |
| Reliability Index (IA) |
0.00 | 0.14 | 0.27 | 0.28 | 0.23 | 0.52 | 0.05 | 0.27 | 0.31 | 0.11 | 0.13 | 0.04 | 0.20 | 0.05 | 0.05 |
Table 3.
Item Analysis on the Test n.3 about the “Assessment and evaluation of competences at school”.
Table 3.
Item Analysis on the Test n.3 about the “Assessment and evaluation of competences at school”.
| TEST n.3 | Item 3.1 |
Item 3.2 |
Item 3.3 |
Item 3.4 |
Item 3.5 |
Item 3.6 |
Item 3.7 |
Item 3.8 |
Item 3.9 |
Item 3.10 |
Item 3.11 |
Item 3.12 |
Item 3.13 |
Item 3.14 |
Item 3.15 |
|---|---|---|---|---|---|---|---|---|---|---|---|---|---|---|---|
| Difficulty Index (p) |
0.90 | 0.93 | 0.99 | 0.38 | 0.87 | 0.33 | 0.83 | 0.67 | 0.88 | 0.99 | 0.78 | 0.67 | 0.97 | 0.80 | 0.86 |
| Discriminatory Power (D) | 0.36 | 0.27 | 0.06 | 0.94 | 0.45 | 0.89 | 0.57 | 0.89 | 0.41 | 0.06 | 0.68 | 0.89 | 0.11 | 0.65 | 0.50 |
| Selectivity Index (IS) |
0.13 | 0.13 | 0.04 | 0.48 | 0.22 | 0.39 | 0.17 | 0.48 | 0.17 | 0.04 | 0.30 | 0.43 | 0.04 | 0.26 | 0.26 |
| Reliability Index (IA) |
0.12 | 0.12 | 0.04 | 0.18 | 0.19 | 0.13 | 0.14 | 0.32 | 0.15 | 0.04 | 0.24 | 0.29 | 0.04 | 0.21 | 0.22 |
Table 4.
Item Analysis on the Test n.4 about the “Peer assessment and evaluation”.
| TEST n.4 | Item 4.1 |
Item 4.2 |
Item 4.3 |
Item 4.4 |
Item 4.5 |
Item 4.6 |
Item 4.7 |
Item 4.8 |
Item 4.9 |
Item 4.10 |
Item 4.11 |
Item 4.12 |
Item 4.13 |
Item 4.14 |
Item 4.15 |
|---|---|---|---|---|---|---|---|---|---|---|---|---|---|---|---|
| Difficulty Index (p) |
0.93 | 0.98 | 0.97 | 0.92 | 0.94 | 0.92 | 0.88 | 0.90 | 0.88 | 0.87 | 0.86 | 0.85 | 0.63 | 0.82 | 0.76 |
| Discriminatory Power (D) | 0.07 | 0.06 | 0.06 | 0.00 | 0.06 | 0.06 | 0.06 | 0.06 | 0.06 | 0.06 | 0.06 | 0.06 | 0.05 | 0.05 | 0.00 |
| Selectivity Index (IS) |
0.15 | 0.00 | 0.00 | 0.10 | 0.00 | 0.00 | 0.05 | 0.00 | 0.00 | 0.00 | 0.00 | 0.00 | 0.60 | 0.00 | 0.20 |
| Reliability Index (IA) |
0.14 | 0.00 | 0.00 | 0.09 | 0.00 | 0.00 | 0.04 | 0.00 | 0.00 | 0.00 | 0.00 | 0.00 | 0.38 | 0.00 | 0.15 |
Table 5.
Item Analysis on the Test n.5 about the “Certification of competences at school”.
| TEST n.5 | Item 5.1 |
Item 5.2 |
Item 5.3 |
Item 5.4 |
Item 5.5 |
Item 5.6 |
Item 5.7 |
Item 5.8 |
Item 5.9 |
Item 5.10 |
Item 5.11 |
Item 5.12 |
Item 5.13 |
Item 5.14 |
Item 5.15 |
|---|---|---|---|---|---|---|---|---|---|---|---|---|---|---|---|
| Difficulty Index (p) |
0.55 | 0.52 | 0.78 | 0.98 | 0.95 | 0.92 | 0.91 | 1.00 | 1.00 | 0.97 | 0.71 | 0.91 | 0.82 | 0.65 | 0.98 |
| Discriminatory Power (D) | 0.99 | 1.00 | 0.68 | 0.06 | 0.18 | 0.28 | 0.34 | 0.00 | 0.00 | 0.12 | 0.83 | 0.34 | 0.60 | 0.91 | 0.06 |
| Selectivity Index (IS) |
0.48 | 0.71 | 0.52 | 0.00 | 0.14 | 0.05 | 0.05 | 0.00 | 0.00 | -0.05 | 0.76 | 0.19 | 0.52 | 0.62 | 0.05 |
| Reliability Index (IA) |
0.26 | 0.37 | 0.41 | 0.00 | 0.14 | 0.04 | 0.04 | 0.00 | 0.00 | -0.05 | 0.54 | 0.17 | 0.43 | 0.40 | 0.05 |
Table 6.
Item Analysis on the Test n.6 about the “European frameworks and laws for the certification of the competences”.
Table 6.
Item Analysis on the Test n.6 about the “European frameworks and laws for the certification of the competences”.
| TEST n.6 | Item 6.1 |
Item 6.2 |
Item 6.3 |
Item 6.4 |
Item 6.6 |
Item 6.6 |
Item 6.7 |
Item 6.8 |
Item 6.9 |
Item 6.10 |
Item 6.11 |
Item 6.12 |
Item 6.13 |
Item 6.14 |
Item 6.16 |
|---|---|---|---|---|---|---|---|---|---|---|---|---|---|---|---|
| Difficulty Index (p) |
0.80 | 0.64 | 0.97 | 0.64 | 0.98 | 0.55 | 0.98 | 0.80 | 0.97 | 0.92 | 1.00 | 0.98 | 0.94 | 0.97 | 0.75 |
| Discriminatory Power (D) | 0.65 | 0.92 | 0.12 | 0.92 | 0.06 | 0.99 | 0.06 | 0.65 | 0.12 | 0.29 | 0.00 | 0.06 | 0.23 | 0.12 | 0.75 |
| Selectivity Index (IS) |
0.33 | 0.57 | 0.10 | 0.62 | 0.05 | 0.48 | 0.05 | 0.33 | 0.05 | 0.24 | 0.00 | 0.05 | 0.10 | 0.10 | 0.33 |
| Reliability Index (IA) |
0.27 | 0.37 | 0.09 | 0.40 | 0.05 | 0.26 | 0.05 | 0.27 | 0.05 | 0.22 | 0.00 | 0.05 | 0.09 | 0.09 | 0.25 |
3.3. Answers to the Questionnaire
The questionnaire to collect the opinions of the participants has been administered after le last test. Among the 64 participants, 55 are in progress and regularly enrolled in the third year of the degree course; 6 in the first year out of course and 3 in the second year out of course. The collected data are included in Table 7, Table 8 and Table 9.
Section F of the questionnaire was administered with the aim of collecting participants' opinions on the quality of the items in the tests. In particular, question F1 asked to refer to other tests prepared by the human teacher and to compare them with these prepared through generative AI. The opinions collected are presented in Table 8.
Finally, question F2 required an open-ended response through which participants could express their point of view and provide comments and suggestions regarding the items they answered. Since this is an open-text, the opinions collected were grouped into clusters that essentially refer to different needs. In particular, the needs are referred to a better contextualization of the question, an improvement of the formulation of the question or an improvement of the formulation of the answers. To these identified categories, two more are added that indicate that there is nothing to report or other aspects not precisely connected to the question asked in the questionnaire. The data collected are reported in Table 9.
4. Discussion
To interpret the tables effectively, the general reference values are considered [18].
Difficulty Index (p):
- > 0.70: too easy
- 0.30 - 0.70: optimal
- < 0.30: too difficult
Discriminatory Power (D): should be positive and high. Higher values indicate better discrimination between high and low achievers.
Selectivity Index (IS):
- > 0.30: Good
- 0.20 - 0.30: Fair
- 0.10 - 0.20: Marginal
- < 0.10: Poor, needs revision
Reliability Index (IA): higher values are desirable, indicating a greater contribution to the test's internal consistency.
Table 1 shows the item analysis on Test n.1 about “Definitions of knowledge, skills, attitudes, context, and competences”. The calculated indexes allow some reflections.
Difficulty Index (p) is in the range from 0.52 to 0.93. It means that most items are moderately easy to easy. Eight of them can be considered as optimal with values between 0.52 and 0.67. None of them is too difficult and seven of them are particularly easy.
Discriminatory Power (D) is generally high. One item as D=0.25, another one as D=0.30 and the rest of them is ranging from 0.46 to 1.00. This indicates good discrimination for most items.
Selectivity Index (IS) varies from 0.10 to 0.75. Nine items have marginal to poor selectivity. Seven of them show good selectivity with values greater than 0.30.
Reliability Index (IA) ranges from 0.08 to 0.44. Higher values are observed for items with better selectivity and discriminatory power. Items 1.10 (0.08) and 1.12 (0.09) have particularly low IA.
The test n.1 has some strong items with good discrimination and selectivity. However, several items, particularly 1.11, 1.12, and 1.13, are too easy and have poor selectivity and reliability indices, indicating they contribute little to the test's ability to measure the intended construct. These items should be revised or removed.
Table 2 shows the item analysis on Test n.2 about “Assessment and evaluation of competences in sports”.
Difficulty Index (p) is in the range from 0,44 to 1. It means that most items are very easy. 5 of them can be considered as optimal with values between 0,44 and 0,7. None of them is too difficult and 10 of them are particularly easy. This suggests a lack of challenging questions.
Discriminatory Power (D) is in the range from 0 to 0,99. It means that this index has significant variability. 6 of them can be considered as optimal with values grater than 0.7.
Selectivity Index (IS) is in the range from 0 to 0,76. 6 of them can be considered as optimal with values grater than 0.2. Most other items have poor selectivity, with several at or below 0.05.
Reliability Index (IA) is in the range from 0 to 0,52. 6 of them can be considered as optimal with values grater than 0.3. Other items has this index very low.
The test n.2 has serious issues. Many items are too easy and fail to discriminate effectively between students. The selectivity and reliability indices are generally poor. A major revision is needed to improve the test's validity and reliability.
Table 3 shows the item analysis on Test n.2 about “Assessment and evaluation of competences at school”.
Difficulty Index (p) is in the range from 0,33 to 0,99. It means that most items are quite easy. 4 of them can be considered as optimal with values between 0,33 and 0,7. None of them is too difficult and 11 of them are particularly easy.
Discriminatory Power (D) is in the range from 0,06 to 0,94. 4 of them can be considered as optimal with values greater than 0.7. The other ones have very low discriminatory power.
Selectivity Index (IS) is in the range from 0,04 to 0,48. 5 of them can be considered as optimal with values grater than 0.2. Many items fall into the marginal or poor categories.
Reliability Index (IA) is in the range from 0,04 to 0,32. 5 of them can be considered as optimal with values greater than 0.3.
The test n.3 also suffers from having many easy items and poor discrimination for several questions. Items 3.4, 3.6, 3.8 and 3.12 are reasonably good, but the test needs significant revision to improve its overall quality.
Table 4 shows the item analysis on Test n.4 about “Peer assessment and evaluation”.
Difficulty Index (p) is in the range from 0,63 to 0,98. It means that the test is extremely easy. Only 1 of them can be considered as optimal with values between 0,63 and 0,7. None of them is too difficult and 14 of them are particularly easy.
Discriminatory Power (D) is in the range from 0 to 0,07. Very low across the board, mostly at 0.06 or 0.00. This indicates that none of the items effectively differentiate between students.
Selectivity Index (IS) is in the range from 0 to 0,6. 1 of them can be considered as optimal with values greater than 0.3.
Reliability Index (IA) is in the range from 0 to 0,38. Only 1 of them can be considered as good with values greater than 0.3.
The Test n.4 is fundamentally flawed. The items are too easy and lack any discriminatory power. The selectivity and reliability indices are extremely poor, suggesting the test is not measuring the intended construct in a meaningful way. Complete revision or replacement is necessary.
Table 5 shows the item analysis on Test n.5 about “Certification of competences at school”.
Difficulty Index (p) is in the range from 0,52 to 1. It means that most items are moderately easy to easy. 3 of them can be considered as optimal with values between 0,52 and 0,7. None of them is too difficult and 12 of them are particularly easy.
Discriminatory Power (D) is in the range from 0 to 1. 4 of them can be considered as optimal with values greater than 0.7. Several items have very poor discrimination (0.00 to 0.18).
Selectivity Index (IS) is in the range from -0,05 to 0,76. 6 of them can be considered as optimal with values greater than 0.3. Several items have poor or even negative selectivity.
Reliability Index (IA) is in the range from -0,05 to 0,54. 6 of them can be considered as good with values greater than 0.3. Higher values align with items with better selectivity and discrimination.
The Test n.5 has a mix of good and bad items. While some items demonstrate strong discrimination and selectivity, many others are too easy and fail to differentiate between students. The negative values for IS and IA for item 5.10 are particularly concerning and indicate a problematic item. Substantial revision is needed.
Table 6 shows the item analysis on Test n.6 about “European frameworks and laws for the certification of the competences”.
Difficulty Index (p) is in the range from 0,55 to 1. It means that most items are moderately easy to easy. 3 of them can be considered as optimal with values between 0,55 and 0,7. None of them is too difficult and 12 of them are particularly easy.
Discriminatory Power (D) is in the range from 0 to 0,99. 4 of them can be considered as optimal with values greater than 0.7. Several items have very low discrimination (0.00 to 0.12).
Selectivity Index (IS) is in the range from 0 to 0,62. 6 of them can be considered as optimal with values greater than 0.3. Many items have poor selectivity.
Reliability Index (IA) is in the range from 0 to 0,4. 7 of them can be considered as optimal with values greater than 0.3. Higher values correspond to items with better selectivity and discrimination.
Similar to other tests, the Test n.6 has a tendency towards easy items and poor discrimination for many questions. Items 6.2 and 6.4 are relatively strong, but the test requires significant improvement to be a reliable and valid measure.
Across all six tests generated by the AI system, several common issues emerge.
First, they present overly easy items. Many tests contain a high proportion of items with a difficulty index above 0.80 or even 0.90. This indicates that the items are too easy for the test-takers, reducing their ability to differentiate between students with different levels of knowledge.
Second, they allow poor discrimination. A significant number of items exhibit low discriminatory power (D). This means they fail to effectively distinguish between high-achieving and low-achieving students.
Third, they show low selectivity and reliability. Many items have low selectivity (IS) and reliability indices (IA), indicating that they do not correlate well with the overall test score and contribute little to the internal consistency of the test.
The questionnaire results, detailed in Table 7, Table 8 and Table 9, provide a comprehensive view of student opinions on AI-generated tests. Overall, the feedback indicates a generally positive reception of the AI-generated test questions.
Table 7 presents the individual responses to the questionnaire sections B, C, D, and E, offering a granular view of student evaluations across various criteria. Notably, the average scores for questions B1 to D4 are generally high, with most averages above 4 on a 5-point scale, indicating that students largely agreed or totally agreed that the questions were of high quality, relevant, and clear. For instance, the average score for C3 (Were the questions worded grammatically correct?) is 4.53, suggesting strong agreement on the grammatical correctness of the questions.
However, there are some areas where students expressed less positive feedback. Questions related to the clarity and correctness of answer options (D1, D2, D3, and D4) received slightly lower average scores compared to the question quality. In particular, D3, (Were the incorrect response options (distractors) plausible but clearly incorrect?), has an average of 3.47, and D4 (Were the answer options grammatically consistent with the question?) has an average of 2.97. These scores suggest that students found some answer options less clear or consistent, highlighting a potential area for improvement in the AI's test generation.
Furthermore, the data from section E of the questionnaire in Table 7 shows that a few students reported issues with the questions. Specifically, 4 students found cases where more than one answer seemed correct, and 11 students found cases where no answer seemed correct. This indicates that while the majority of students did not encounter these problems (60 and 53 students answered "No" respectively), a non-negligible minority experienced issues with the correctness of the answers.
Table 8 summarizes students’ comparative evaluations of the AI-generated tests against human-prepared tests. A significant majority (46 out of 64) found the quality of the AI-generated questions to be similar to those prepared by human instructors. Additionally, 16 students rated the AI-generated tests as better than human-prepared tests (9 "slightly better" and 7 "significantly better"). This overall positive comparison suggests that students perceive AI as capable of generating test questions that are at least as good as, if not better than, those created by humans.
Table 9 presents a qualitative analysis of the open-ended responses from question F2, where students provided comments and suggestions. The most frequent comment, given by 48 students, was that the questions were "Good as it is," reinforcing the quantitative data indicating overall satisfaction. However, some students suggested areas for improvement, with 6 mentioning a need for better contextualization of the questions and 3 and 6 students suggesting improvements in the formulation of the questions and answers, respectively. These qualitative insights provide valuable direction for refining AI test generation.
These findings align with broader research trends in the application of AI in education. The emphasis on clear and concise question wording, as highlighted by Krosnick and Presser, is crucial in both human and AI-generated tests to ensure validity and reliability. Research on AI in assessment often points to the potential for AI to create consistent and objective evaluations [20]. The results from this questionnaire support this, with students generally agreeing on the quality and relevance of the AI-generated questions. However, the comments about answer clarity and correctness also echo concerns raised in the literature about the need for careful validation of AI-generated content to avoid errors or ambiguities [21].
5. Conclusions
In summary, generative AI offers revolutionary potential to transform assessment design by enabling rapid generation of assessment items and content, and supporting personalized approaches and higher-order skills assessment. However, challenges related to integrity, reliability of AI responses on complex problems, and lack of empirical research on classroom integration underscore the need for a critical and responsible approach. Areas that urgently require future research attention include large-scale implementation of AIG with GenAI, standardization of AI-generated item assessment, and in-depth exploration of the impact and effectiveness of LLMs in specific and complex assessment contexts. This period of rapid evolution requires continued effort to adapt and innovate in the field of educational assessment.
The student feedback on AI-generated tests is largely positive, indicating that AI can effectively create high-quality and relevant test questions. While there are areas for improvement, particularly in the clarity and correctness of answer options, the overall results suggest that AI is a valuable tool in educational assessment. This study contributes to the growing body of evidence supporting the use of AI to enhance and potentially improve the test creation process.
Despite this largely positive response, from the research conducted and in particular from the results of the item analysis, some recommendations emerge that should be taken into due consideration.
A substantial revision of the items is necessary, focusing on increasing the difficulty of many questions and improving their discriminatory power. Items with very low discrimination, selectivity, and reliability indices should be eliminated.
Additional research may be needed to understand why the AI model is generating so many easy and poorly discriminating items. Eventually, providing to the AI engine more details on how create better questions and related answers
By addressing these issues, the quality and effectiveness of the AI-generated tests can be significantly improved.
Informed Consent Statement
In accordance with the guidelines of the American Psychological Association (APA), participants were asked to give informed consent regarding the nature of the survey and its objectives exclusively for research purposes. Their participation was voluntary and was carried out by guaranteeing confidentiality and anonymity, since the data were collected in digital form without requesting the identity of the participants. Therefore, the da-ta were collected in compliance with the European Regulation on Data Protection (GDPR n.679/2016) since they involve EU citizens anonymously and do not identify the participants in any way and irreversibly.
Acknowledgments
Special thanks go to all the students enrolled in the degree course in “Sciences of Motor Activities, Sports and Psychomotor Education” at the University of Salerno who follow the lessons of “Evaluation and Certification of Competences” who participated in the research described in this paper.
Conflicts of Interest
No conflict of interest is connected to the survey conducted.
References
- Weng, X.; Xia, Q.; Gu, M.; Rajaram, K.; Chiu, T.K. Assessment and learning outcomes for generative AI in higher education: A scoping review on current research status and trends. Australasian Journal of Educational Technology 2024, 40, 37–55. [Google Scholar] [CrossRef]
- Wang, L.; Li, S.; Chen, Y. Early adaption of assessments using generative artificial intelligence and the impact on student learning: A case study. African Journal of Inter/Multidisciplinary Studies 2024, 6, 1–12. [Google Scholar] [CrossRef]
- Mao, J.; Chen, B.; Liu, J.C. Generative Artificial Intelligence in Education and Its Implications for Assessment. TechTrends 2024 68, 58–66. [CrossRef]
- Domenici, G. L’intelligenza artificiale generativa per l’innalzamento della qualità dell’istruzione e la fioritura del pensiero critico. Quale contributo? Journal of Educational, Cultural and Psychological Studies (ECPS) 2024, 30, 11–22. [Google Scholar] [CrossRef]
- Gundu, T. Strategies for e-Assessments in the Era of Generative Artificial Intelligence. Electronic Journal of e-Learning 2025, 22, 40–50. [Google Scholar] [CrossRef]
- Circi, R.; Hicks, J.; Sikali, E. Automatic item generation: foundations and machine learning-based approaches for assessments. Frontiers in Education 2023, 8, 858273. [Google Scholar] [CrossRef]
- Kaldaras, L.; Akaeze, H.O.; Reckase, M.D. Developing valid assessments in the era of generative artificial intelligence. Frontiers in Education 2024, 9, 1399377. [Google Scholar] [CrossRef]
- Paskova, A.A. Potentials of integrating generative artificial intelligence technologies into formative assessment processes in higher education. Vestnik Majkopskogo gosudarstvennogo tehnologičeskogo universiteta 2024, 16, 98–109. [Google Scholar] [CrossRef]
- Rauh, M.; Marchal, N.; Manzini, A.; Hendricks, L.A.; Comanescu, R.; Akbulut, C.; Stepleton, T.; Mateos-Garcia, J.; Bergman, S.; Kay, J.; Griffin, C.; Bariach, B.; Gabriel, I.; Rieser, V.; Isaac, W.; Weidinger, L. Gaps in the Safety Evaluation of Generative AI. Proceedings of the AAAI/ACM Conference on AI, Ethics, and Society 2024, 7, 1200–1217. [Google Scholar] [CrossRef]
- Vlado, T.; Popeska, M. Generative AI for customizable learning experiences. Sustainability 2024, 16, 3034. [Google Scholar] [CrossRef]
- 11. Salinas-Navarro, D.E.; Vilalta-Perdomo, E.; Michel-Villarreal, R.; Montesinos, L. Designing experiential learning activities with generative artificial intelligence tools for authentic assessment. Interactive Technology and Smart Education 2024, 2024. 21, 1179. [Google Scholar] [CrossRef]
- Barragán, A.J.; Aquino, A.; Enrique, J.M.; Segura, F.; Martínez, M.A.; Andújar, J.M. Evaluación de la inteligencia artificial generativa en el contexto de la automática: un análisis crítico. Jornadas de Automática 2024, 45. [Google Scholar] [CrossRef]
- Nguyen, H.; Hayward, J. Applying Generative Artificial Intelligence to Critiquing Science Assessments. Journal of Science Education and Technology 2025, 2025(34), 199–214. [Google Scholar] [CrossRef]
- Pearce, J.; Chiavaroli, N. Rethinking assessment in response to generative artificial intelligence. Medical Education 2023, 57, 889–891. [Google Scholar] [CrossRef]
- Pesovski, I.; Santos, R.; Henriques, R.; Trajkovik, V. Generative AI for Customizable Learning Experiences. Sustainability 2024, 16, 3034. [Google Scholar] [CrossRef]
- Trinchero, R. (2016). Costruire, valutare e certificare competenze [Building, evaluating and certifying competences]. Pearson.
- Ebel, R. L., Frisbie, D. A. (1991). Essentials of educational measurement. Prentice Hall.
- Trinchero, R. (2007). Manuale di analisi degli item [Item analysis manual]. FrancoAngeli.
- Nunnaly, J. C., Bernstein, I. H. (1994). Psychometric theory (3rd ed.). McGraw-Hill.
- Holmes, W.; Bialik, M.; Fadel, C. (2023). Artificial intelligence in education. Brookings Institution Press.
- Williamson, D. M., Mislevy, R. J., Bejar, I. I. (Eds.). (2012). Automated scoring of complex tasks in K-12 to postsecondary education: Theory and practice. Routledge.
Figure 1.
The logic architecture of the developed system.
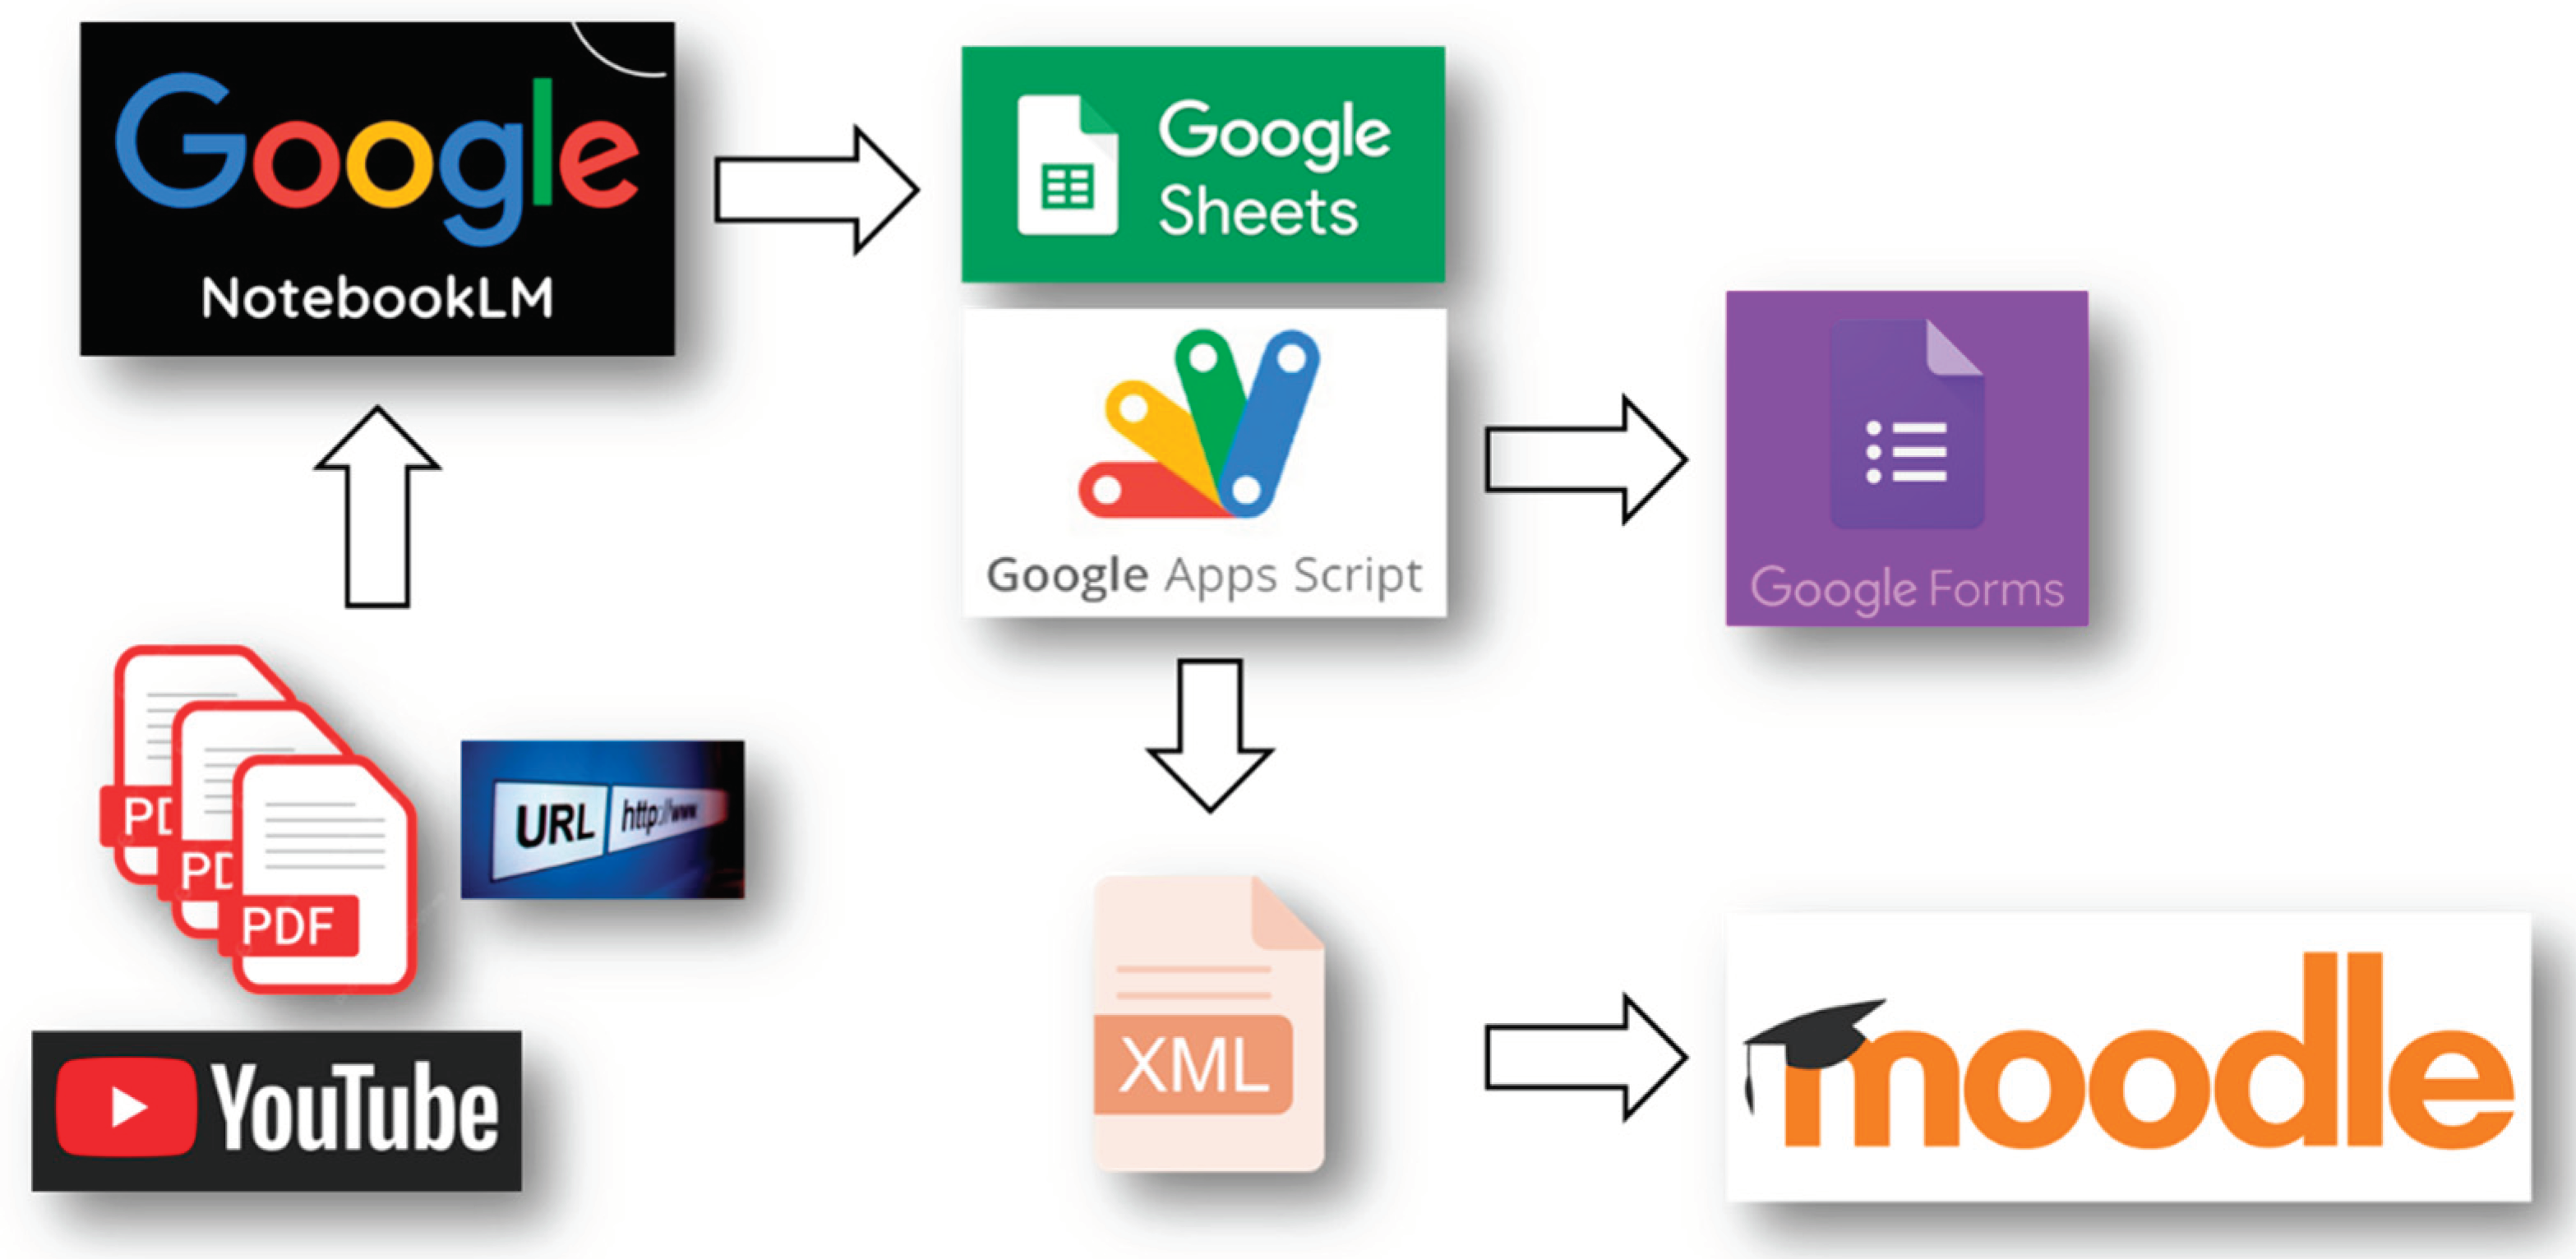
Table 7.
Answers to the sections B, C, D and E of the Questionnaire.
| B1 | B2 | B3 | B4 | C1 | C2 | C3 | C4 | C5 | D1 | D2 | D3 | D4 | E1 | E2 | |
|---|---|---|---|---|---|---|---|---|---|---|---|---|---|---|---|
| A1 | 4 | 5 | 4 | 4 | 4 | 4 | 4 | 5 | 4 | 4 | 3 | 5 | 4 | No | No |
| A2 | 4 | 4 | 5 | 3 | 5 | 4 | 4 | 4 | 5 | 4 | 3 | 5 | 4 | No | No |
| A3 | 4 | 5 | 4 | 5 | 4 | 5 | 4 | 4 | 5 | 2 | 2 | 5 | 5 | No | No |
| A4 | 5 | 4 | 5 | 3 | 4 | 5 | 4 | 4 | 5 | 2 | 5 | 3 | 4 | No | No |
| A5 | 4 | 5 | 4 | 4 | 4 | 5 | 4 | 4 | 3 | 5 | 5 | 4 | 5 | No | Yes |
| A6 | 4 | 5 | 5 | 4 | 4 | 5 | 5 | 4 | 5 | 3 | 5 | 5 | 5 | No | Yes |
| A7 | 4 | 4 | 5 | 3 | 5 | 4 | 4 | 5 | 5 | 5 | 5 | 2 | 5 | No | No |
| A8 | 3 | 3 | 5 | 5 | 5 | 5 | 4 | 5 | 5 | 3 | 2 | 4 | 5 | No | No |
| A9 | 4 | 4 | 5 | 3 | 5 | 4 | 5 | 4 | 4 | 4 | 2 | 1 | 4 | No | No |
| A10 | 5 | 3 | 4 | 3 | 5 | 4 | 4 | 5 | 5 | 5 | 5 | 4 | 4 | No | No |
| A11 | 4 | 3 | 4 | 5 | 4 | 5 | 4 | 4 | 5 | 2 | 2 | 1 | 5 | Yes | No |
| A12 | 5 | 5 | 4 | 3 | 4 | 5 | 5 | 4 | 4 | 5 | 3 | 4 | 4 | No | No |
| A13 | 4 | 4 | 5 | 5 | 4 | 5 | 5 | 5 | 5 | 3 | 3 | 2 | 5 | No | No |
| A14 | 5 | 3 | 5 | 5 | 4 | 5 | 5 | 4 | 4 | 2 | 4 | 4 | 5 | No | No |
| A15 | 4 | 3 | 5 | 3 | 5 | 4 | 5 | 5 | 3 | 3 | 2 | 5 | 4 | No | No |
| A16 | 5 | 3 | 4 | 5 | 4 | 4 | 5 | 4 | 3 | 2 | 4 | 2 | 4 | No | Yes |
| A17 | 5 | 4 | 5 | 4 | 5 | 4 | 4 | 5 | 5 | 3 | 2 | 3 | 4 | No | No |
| A18 | 5 | 5 | 5 | 3 | 4 | 4 | 5 | 4 | 5 | 2 | 2 | 4 | 5 | No | No |
| A19 | 4 | 3 | 4 | 5 | 4 | 4 | 5 | 5 | 4 | 3 | 3 | 2 | 5 | No | No |
| A20 | 3 | 5 | 5 | 4 | 4 | 4 | 4 | 5 | 5 | 3 | 2 | 2 | 4 | No | No |
| A21 | 5 | 5 | 5 | 5 | 5 | 4 | 4 | 5 | 3 | 4 | 2 | 3 | 4 | Yes | No |
| A22 | 3 | 3 | 4 | 3 | 4 | 5 | 4 | 5 | 3 | 5 | 5 | 3 | 4 | No | No |
| A23 | 4 | 4 | 5 | 3 | 4 | 5 | 4 | 5 | 4 | 4 | 5 | 5 | 5 | No | No |
| A24 | 5 | 4 | 4 | 5 | 4 | 5 | 4 | 4 | 3 | 3 | 5 | 2 | 4 | No | No |
| A25 | 4 | 4 | 4 | 5 | 5 | 5 | 4 | 5 | 5 | 5 | 2 | 3 | 5 | No | Yes |
| A26 | 5 | 3 | 4 | 4 | 5 | 4 | 5 | 4 | 5 | 4 | 5 | 1 | 5 | No | No |
| A27 | 5 | 3 | 4 | 5 | 4 | 5 | 4 | 4 | 3 | 3 | 2 | 2 | 4 | No | No |
| A28 | 5 | 5 | 4 | 3 | 5 | 5 | 4 | 4 | 3 | 5 | 2 | 2 | 4 | No | No |
| A29 | 4 | 3 | 4 | 3 | 5 | 5 | 5 | 4 | 4 | 5 | 5 | 3 | 5 | No | Yes |
| A30 | 4 | 3 | 5 | 4 | 5 | 4 | 4 | 4 | 3 | 3 | 3 | 4 | 5 | No | No |
| A31 | 3 | 5 | 5 | 4 | 4 | 5 | 5 | 4 | 3 | 2 | 2 | 3 | 5 | No | Yes |
| A32 | 3 | 3 | 4 | 3 | 5 | 4 | 4 | 5 | 4 | 5 | 4 | 5 | 5 | No | No |
| A33 | 4 | 3 | 5 | 4 | 5 | 4 | 4 | 5 | 4 | 2 | 2 | 2 | 4 | No | No |
| A34 | 3 | 3 | 4 | 5 | 4 | 4 | 5 | 5 | 3 | 2 | 5 | 1 | 5 | No | No |
| A35 | 2 | 5 | 4 | 5 | 5 | 4 | 5 | 5 | 3 | 5 | 5 | 5 | 5 | No | No |
| A36 | 3 | 5 | 4 | 3 | 5 | 4 | 5 | 5 | 4 | 3 | 4 | 5 | 4 | No | No |
| A37 | 4 | 5 | 5 | 5 | 4 | 5 | 5 | 4 | 3 | 3 | 3 | 1 | 5 | No | No |
| A38 | 5 | 5 | 5 | 4 | 5 | 5 | 4 | 5 | 5 | 3 | 4 | 5 | 4 | No | No |
| A39 | 5 | 3 | 4 | 4 | 4 | 5 | 4 | 5 | 4 | 2 | 4 | 3 | 5 | No | No |
| A40 | 4 | 5 | 5 | 3 | 5 | 5 | 5 | 4 | 5 | 5 | 5 | 1 | 4 | No | No |
| A41 | 5 | 5 | 5 | 5 | 4 | 5 | 5 | 4 | 5 | 4 | 3 | 2 | 4 | No | No |
| A42 | 5 | 4 | 5 | 5 | 4 | 5 | 4 | 4 | 4 | 2 | 2 | 2 | 4 | No | No |
| A43 | 5 | 4 | 4 | 3 | 4 | 4 | 4 | 5 | 3 | 2 | 3 | 2 | 5 | No | No |
| A44 | 4 | 4 | 4 | 5 | 5 | 5 | 4 | 5 | 5 | 5 | 2 | 3 | 5 | No | Yes |
| A45 | 5 | 3 | 5 | 4 | 5 | 5 | 4 | 4 | 5 | 5 | 4 | 4 | 5 | No | No |
| A46 | 4 | 3 | 4 | 5 | 5 | 5 | 4 | 4 | 5 | 5 | 3 | 1 | 4 | No | No |
| A47 | 5 | 5 | 5 | 5 | 5 | 4 | 5 | 4 | 3 | 2 | 5 | 1 | 5 | No | No |
| A48 | 4 | 5 | 4 | 4 | 5 | 4 | 4 | 4 | 4 | 2 | 4 | 1 | 5 | Yes | Yes |
| A49 | 5 | 4 | 5 | 3 | 4 | 4 | 5 | 5 | 5 | 5 | 4 | 4 | 4 | No | No |
| A50 | 4 | 3 | 5 | 4 | 4 | 4 | 5 | 4 | 5 | 2 | 2 | 4 | 5 | No | No |
| A51 | 5 | 4 | 5 | 4 | 4 | 4 | 4 | 5 | 5 | 4 | 5 | 1 | 5 | No | No |
| A52 | 4 | 3 | 5 | 4 | 5 | 5 | 5 | 4 | 5 | 3 | 3 | 1 | 5 | No | No |
| A53 | 5 | 4 | 4 | 5 | 5 | 4 | 4 | 5 | 3 | 5 | 2 | 2 | 4 | No | No |
| A54 | 4 | 5 | 4 | 3 | 4 | 5 | 5 | 5 | 3 | 3 | 2 | 1 | 5 | No | Yes |
| A55 | 5 | 5 | 5 | 4 | 5 | 5 | 4 | 5 | 5 | 3 | 4 | 5 | 4 | No | No |
| A56 | 4 | 3 | 4 | 3 | 4 | 4 | 4 | 4 | 3 | 3 | 2 | 3 | 4 | No | Yes |
| A57 | 5 | 4 | 5 | 3 | 5 | 5 | 5 | 5 | 3 | 2 | 3 | 2 | 4 | No | No |
| A58 | 4 | 5 | 5 | 5 | 5 | 4 | 5 | 4 | 3 | 5 | 4 | 4 | 5 | No | No |
| A59 | 5 | 5 | 5 | 5 | 5 | 5 | 4 | 4 | 5 | 5 | 5 | 2 | 4 | No | No |
| A60 | 5 | 3 | 5 | 5 | 4 | 4 | 5 | 5 | 3 | 3 | 5 | 5 | 4 | Yes | Yes |
| A61 | 5 | 5 | 5 | 4 | 4 | 5 | 5 | 5 | 4 | 4 | 5 | 2 | 5 | No | No |
| A62 | 4 | 5 | 5 | 5 | 4 | 5 | 4 | 5 | 4 | 2 | 4 | 5 | 4 | No | No |
| A63 | 5 | 4 | 4 | 3 | 4 | 4 | 4 | 5 | 3 | 5 | 3 | 4 | 5 | No | No |
| A64 | 3 | 3 | 5 | 3 | 4 | 5 | 5 | 4 | 3 | 4 | 5 | 3 | 5 | No | No |
| Min | 3 | 2 | 3 | 4 | 3 | 4 | 4 | 4 | 4 | 3 | 2 | 2 | 1 | ||
| Max | 5 | 5 | 5 | 5 | 5 | 5 | 5 | 5 | 5 | 5 | 5 | 5 | 5 | ||
| Ave | 3,19 | 4,28 | 4,02 | 4,56 | 4,03 | 4,47 | 4,53 | 4,44 | 4,50 | 4,05 | 3,48 | 3,47 | 2,97 | ||
| Number of Yes | 4 | 11 | |||||||||||||
| Number of No | 60 | 53 | |||||||||||||
Table 8.
Answers to the question F1 (“If you have taken tests on similar topics prepared by instructors before, how would you compare the overall quality of the questions on this AI-generated test to those prepared by humans?”) of the Questionnaire.
Table 8.
Answers to the question F1 (“If you have taken tests on similar topics prepared by instructors before, how would you compare the overall quality of the questions on this AI-generated test to those prepared by humans?”) of the Questionnaire.
| Answer | Count |
|---|---|
| Significantly worse | 0 |
| Slightly worse | 0 |
| Similar | 46 |
| Slightly better | 9 |
| Significantly better | 7 |
| Don't know | 2 |
| I have no terms of comparison | 0 |
Table 9.
Answers to the open question F2 (“Do you have any other comments, suggestions, or observations regarding the AI-generated quiz questions or answers that you would like to share?”) of the Questionnaire clustered on main issues.
Table 9.
Answers to the open question F2 (“Do you have any other comments, suggestions, or observations regarding the AI-generated quiz questions or answers that you would like to share?”) of the Questionnaire clustered on main issues.
| Opinion cluster | Count |
|---|---|
| Context missing | 6 |
| The question needs improvement | 3 |
| The answers need improvement | 6 |
| Good as it is | 48 |
| Other | 1 |
Disclaimer/Publisher’s Note: The statements, opinions and data contained in all publications are solely those of the individual author(s) and contributor(s) and not of MDPI and/or the editor(s). MDPI and/or the editor(s) disclaim responsibility for any injury to people or property resulting from any ideas, methods, instructions or products referred to in the content. |
© 2025 by the authors. Licensee MDPI, Basel, Switzerland. This article is an open access article distributed under the terms and conditions of the Creative Commons Attribution (CC BY) license (http://creativecommons.org/licenses/by/4.0/).
Copyright: This open access article is published under a Creative Commons CC BY 4.0 license, which permit the free download, distribution, and reuse, provided that the author and preprint are cited in any reuse.


