

Submitted:
10 May 2025
Posted:
12 May 2025
You are already at the latest version
Abstract
Bad dietary habits and sedentary lifestyles alter body composition, increasing disease risk. We conducted a prospective, comparative, longitudinal observational study among nursing students (n=72, 79.2% female, mean age 21.94 years) from Complutense University of Madrid. Data were collected at two periods: before exams (January 2024) and during exams (May 2024). Body composition was assessed via bioimpedance (Beurer BF 1000), dietary habits through modified Kidmed survey, and physical activity using IPAQ. During exam preparation, fat mass significantly increased (25.43% to 28.79%, p=0.016), muscle mass significantly decreased (39.70% to 36.20%, p<0.001), and visceral fat rose notably (2.34 to 3.52, p<0.001). Students exhibiting poor dietary quality increased (54.2% to 80.0%, p<0.001), vigorous physical activity dramatically decreased (84.7% to 11.1%, p<0.001), and sedentary time increased significantly (408.24 to 543.61 minutes/day, p<0.001). Our findings suggest dietary deterioration and reduced physical activity during exams adversely affect students’ body composition.
Keywords:
Body composition
; dietary habits
; physical activity
; stress
; bioimpedance
; students
; university students
; exams
1. Introduction
Thanks to healthy dietary habits, individuals are able to maintain a healthy lifestyle. These habits are closely linked to how we select, process, and consume food, as it must provide the essential nutrients required by our bodies to perform vital functions effectively [1,2]. Achieving a healthy diet depends on several factors, such as food processing methods, timing of meals, and the presence of stress and anxiety. Following a healthy eating pattern can help prevent various diseases, including hypertension, cancer, anemia, obesity, and osteoporosis [3].
From childhood, young individuals develop a set of habits that evolve throughout their lives based on lifestyle choices, which are influenced by culture, customs, and beliefs. These influences shape food preferences and behaviors, which may either support or undermine healthy practices [4,5]. Currently, the population increasingly consumes fast food—highly processed items rich in sugars and fats—and exhibits a more sedentary lifestyle, as most free time is spent engaging with screens, video games, and smartphones. This sedentary behavior has detrimental consequences for both physical and social well-being. Therefore, healthy eating must be accompanied by regular physical activity, performed daily to avoid physical inactivity and sedentarism[6].
Physical activity plays a crucial role in maintaining overall health. As the amount of physical exercise increases, the respiratory system improves, enhancing pulmonary capacity and reducing the likelihood of respiratory illnesses. Exercise also supports mental well-being, helping reduce stress and anxiety. Thus, engaging in physical activity is particularly important during exam periods, as it enhances concentration levels[7,8,9].
Stress is the body’s short-term response to threatening situations. Its onset often disrupts eating habits and physical activity. Stress manifests in two forms: organic and psychological. The latter includes academic stress, which is the focus of this study. Academic stress is defined as a physiological, emotional, cognitive, and behavioral activation in response to academic stimuli and demands[10]. University students are particularly at risk of adopting unhealthy lifestyles[4,11], as they regularly face numerous examinations that induce stress. This stress often stems from competitiveness, goal-setting (e.g., early employment, gaining entry to a desired academic program, managing multiple subjects), or unmet goals that lead to frustration. Academic overload also contributes, as students not only study but must attend internships, seminars, and complete coursework, further intensifying stress. Such accumulated stress can have long-term negative effects.
Body composition refers to the primary components that make up the human body: bone, water, muscle, fat, and visceral tissue. Visceral fat exceeding 12% indicates abdominal fat infiltration, a serious nutritional concern that increases the risk of cardiovascular and metabolic diseases if uncorrected. These components are assessed using bioimpedance analysis, which sends an electrical current through the body (from hand to hand or foot to foot). The time required for the current to travel across the body allows estimation of the amount and percentage of each component[10]. Poor diet and sedentary behavior can significantly disrupt body composition.
As previously described, students experience heightened stress during exam periods. This stress often results in poor lifestyle choices, including unhealthy eating (either excess or insufficient intake of unhealthy foods) and reduced physical activity (due to time constraints). These behavioral changes can negatively affect body composition and increase disease risk.
The aim of this study was to demonstrate how the stress and anxiety experienced by students during exam periods affect their body composition due to poor dietary choices and decreased physical activity. The findings may support the implementation of targeted interventions and raise awareness among young individuals about the importance of maintaining healthy lifestyle habits.
The main objective was to evaluate body composition among university students in relation to their dietary intake and physical activity levels before and during the exam period.
The hypothesis was that students’ body composition deteriorates during the exam period.
2. Materials and Methods
2.1. Study Desing and Population
This study was designed as a prospective, observational, comparative, and longitudinal investigation. The target population consisted of second-year undergraduate nursing students enrolled at the University Complutense of Madrid. Students were recruited through convenience sampling.
This study was approved by the Ethics and Research Committee of Puerta de Hierro University Hospital (ACT 244/23). Access to the study files was password-protected and restricted to the responsible researchers in accordance with current data protection regulations (BOE-A-2018, Regulation 2016). The study was also approved and registered at ClinicalTrials.gov with the identifier: NCT06717620.
2.1.1. Inclusion Criteria
- Age years
- Current enrollment in the second year of the nursing program
- Willingness to participate in both evaluation periods.
2.1.2. Exclusion Criteria
- The presence of any physical limitation that prevented bioimpedance measurement.
- Ongoing use of pharmacological treatments that could influence body composition.
- The inability to complete the second assessment (e.g., absence on the exam day).
2.2. Intervention
Participants were assessed at two time points: (1) prior to the start of the exam preparation period (January 2024), and (2) during the exam period, immediately following completion of a major exam (May 2024).
At each time point, the following data were collected:
Anthropometric and body composition measurements: Body weight (kg), height (cm), fat mass (%), muscle mass (kg), and visceral fat (score) were assessed using a validated bioimpedance device (Beurer BF 1000). Participants were instructed to remove footwear and metallic items and to follow standard pre-measurement conditions (e.g., fasting state, avoidance of intense physical activity 12 hours prior).
Dietary habits: Evaluated using a modified version of the Kidmed questionnaire, which assesses adherence to the Mediterranean diet. The questionnaire includes positive and negative dietary items with a scoring system that classifies diet quality into low ( points), medium (4–7 points), or optimal ( points).
Physical activity: Measured using the short form of the International Physical Activity Questionnaire (IPAQ-SF). Participants reported the frequency and duration of vigorous, moderate, and walking activities over the past 7 days. Total physical activity was calculated in MET-minutes/week and categorized as low, moderate, or high following standard IPAQ classification criteria (Figure 1).
Additional data on lifestyle behaviors (e.g., caffeine consumption, tobacco use, intake of cola or energy drinks) were also gathered via a structured survey.
2.3. Statistical Analysis
Descriptive statistics were used to summarize sociodemographic and clinical characteristics. Continuous variables were expressed as means and standard deviations, and categorical variables as absolute frequencies and percentages. Paired-sample t-tests were used for normally distributed continuous variables, while Wilcoxon signed-rank tests were applied to non-normally distributed data. Chi-square tests assessed differences in categorical variables. The statistical significance threshold was set at p<0.05. All analyses were performed using IBM SPSS Statistics for Windows, Version 29.0 (IBM Corp., Armonk, NY, USA).
3. Results
3.1. General Characteristics of the Population
In the first phase of data collection, conducted in January 2024 (non-exam period), 142 students who met the inclusion criteria participated in the study. Most participants were female (78.9%), with a mean age of 22.54 years. The mean body weight was 63.32 kg, with a mean BMI of 23.04. Regarding body composition, 42.3% of the students were categorized as having very high body fat, and 50.7% were within the normal muscle mass range.
Diet quality was classified as medium in 48.6% of participants and optimal in another 48.6%. Physical activity was high in 80.3% of the sample during this period (Table 1).
3.2. Comparative Results Between Pre-Exam and Exam Periods
In the second phase of the study, conducted in May 2024 (on the day of the nutrition exam), 72 students completed both data collection stages and were included in the comparative analysis (Figure 2). Of these, 79.2% were female, with a mean age of 21.94 years. (Table 2)
3.2.1. Significant Changes Between the Two Phases
- Fat mass increased from a mean of 25.43% pre-exams to 28.79% during the exam period (p=0.016).
- Muscle mass decreased from 39.70 kg to 36.20 kg (p<0.001)(Figure 2).
- Visceral fat rose from a mean of 2.34 to 3.52 (p<0.001).
- The percentage of students with very high body fat increased from 38.9% to 63.9%, and those with high muscle mass decreased from 36.1% to 8.3%.
3.2.2. Significant Changes Observed in Dietary Habits
- Students consuming a second piece of fruit daily decreased from 52.8% to 33.3% (p=0.018).
- Fast food consumption increased from 48.6% to 52.8% (p=0.024).
- The proportion of students skipping breakfast rose from 13.9% to 51.4% (p<0.001).
- Consumption of pastries for breakfast increased from 23.6% to 45.8% (p=0.005).
- Daily candy consumption increased from 6.9% to 29.2% (p=0.001).
- Optimal diet quality decreased from 45.8% to 20.0% (p<0.001), with a drop in mean Kidmed score from 7.55 to 5.45 points (p<0.001). (Figure 4)
3.2.3. Significant Changes Observed y Physical Activity
- Days of vigorous physical activity decreased from 3.10 to 0.72 days/week (p<0.001).
- Vigorous activity time dropped from 229.02 to 30.69 minutes/week (p<0.001).
- The proportion of students with low physical activity rose from 4.2% to 59.7% (p<0.001), while those with high physical activity dropped from 84.7% to 11.1%.
- Mean sitting time increased from 408.24 to 543.61 minutes/day (p<0.001) (Figure 5).
3.3. Impact of Diet Quality on Body Composition
3.4. Impact of Physical Activity on Body Composition
Similarly, students with low levels of physical activity had higher fat mass (30.31%), higher visceral fat (3.90), and lower muscle mass (35.25 kg) compared to their more active peers (Table 4).
4. Discussion
The most relevant findings of this study clearly demonstrate the relationship between dietary habits, physical activity, and body composition among university students. The results show that students with poor diet quality and low physical activity levels exhibited increased fat mass, reduced muscle mass, and elevated visceral fat. In particular, the increase in visceral fat observed in students with unhealthy lifestyle habits is concerning, as sustained high levels are associated with a higher risk of developing metabolic disorders such as T2D and cardiovascular diseases, including hypertension and dyslipidemia. Furthermore, the instrument used to assess physical activity in this study, the short form of the International Physical Activity Questionnaire (IPAQ-SF), has been validated in international research and is considered suitable for population-level surveillance. As highlighted by Mantilla Toloza and Gómez-Conesa (2007), the short version is especially recommended for regional and national prevalence studies due to its adequate reliability (r = 0.76; 95% CI: 0.73–0.77) and its practical application across diverse populations. Although the IPAQ-SF does not provide as detailed information as its longer counterpart, it effectively captures essential domains of physical activity—such as walking, moderate and vigorous activity, and sedentary time—which are particularly relevant during periods of lifestyle disruption, such as university exam sessions. Therefore, its inclusion in this study was both methodologically justified and operationally feasible given the academic setting and time constraints of the participants [12].
Another important observation is that body weight and BMI did not differ significantly between the two assessment periods. This can be explained by the balance between increased fat mass and decreased muscle mass. Although body weight remained relatively stable, the underlying body composition worsened, emphasizing that weight and BMI alone are not sufficient indicators of health status. Assessing fat and muscle mass provides a more accurate picture of metabolic and nutritional health.
Previous literature supports the notion that academic stress during examination periods negatively impacts students’ lifestyles[13,14,15]. Increased academic demands often lead to disrupted routines, poorer eating habits[11,16], and a reduction in physical activity levels. Students may skip meals, consume ultra-processed foods, or neglect regular exercise due to time constraints or psychological stress, which, over time, can adversely affect body composition[17] and overall health.[1,6,18]
These findings highlight the need to include stress management strategies within academic environments, such as mindfulness techniques, relaxation exercises, and structured study plans that allow time for self-care. Moreover, educational initiatives focused on promoting healthy eating and regular physical activity should be integrated into university curricula to raise awareness among students about the long-term consequences of unhealthy behaviors.
Despite limitations such as the dropout rate between the two assessment points, the study offers evidence of the detrimental effects of stress-related lifestyle changes on body composition. Although the internal validity of this study is limited due to the homogeneous sample (students from a single university), the external validity is notable, as similar behaviors and stress patterns are likely to affect student populations in other academic settings.
Ultimately, the negative impact of poor habits during exam preparation affects a large portion of the student population. Addressing this issue requires institutional efforts to promote lifestyle interventions aimed at preserving both physical and mental health during high-stress academic periods.
5. Conclusions
Poor dietary habits and a sedentary lifestyle contribute to the deterioration of body composition. Among university students, both diet quality and physical activity levels decline significantly during exam preparation periods, leading to increased fat mass, decreased muscle mass, and elevated visceral fat. These findings underscore the importance of promoting healthy behaviors, particularly during periods of academic stress, to prevent long-term health risks (Figure 8).
6. Limitations
- Limited and homogeneous sample: All participants were second-year nursing students from a single institution (University Complutense of Madrid), which restricts the external validity and generalizability of the findings to other academic disciplines or university contexts.
- Participant attrition: Of the initial 142 students, only 72 completed both stages of the study. This loss may introduce selection bias, as students experiencing higher stress or more unhealthy behaviors may have been less likely to complete the follow-up.
- Lack of objective stress measurement: Although academic stress is hypothesized as a key factor influencing lifestyle changes, no validated tool (e.g., Perceived Stress Scale or Academic Stress Inventory) was used to assess it. This limits the ability to quantify its specific impact.
- Self-reported data: Both dietary habits (Kidmed) and physical activity (IPAQ) were assessed using self-administered questionnaires, which may be subject to social desirability bias and recall errors.
- Observational study design: The study’s correlational and observational nature precludes causal inference. Therefore, it cannot be concluded with certainty that exam preparation or stress directly caused the observed changes in body composition.
7. Future Research Directions
- Incorporate validated stress measurement tools: Future studies should assess perceived stress levels using validated scales (e.g., PSS), allowing for direct correlation between stress and changes in health-related behaviors and outcomes.
- Expand to other academic disciplines and institutions: Replicating the study across different fields of study and universities would enhance the generalizability and robustness of the findings.
- Intervention-based studies: Experimental or quasi-experimental designs could assess the effectiveness of specific interventions (e.g., brief educational sessions, mindfulness, or physical activity programs) implemented during exam periods to mitigate negative outcomes.
- Extended longitudinal follow-up: Investigating whether the changes in body composition are transient or sustained over time could provide insight into their potential long-term health implications.
- Objective measurement of diet and physical activity: The use of accelerometers, 24-hour dietary recalls, or nutritional biomarkers could improve the accuracy and reliability of lifestyle data collection.
Author Contributions
For research articles with several authors, a short paragraph specifying their individual contributions must be provided. The following statements should be used “Conceptualization, F.G. and N.M.; methodology, N.M and I.O.; software, F.G.; validation, M.V., F.G. and M.P.; formal analysis, N.M.; investigation, N.M.; resources, M.V.; data curation, N.M.; writing—original draft preparation, N.M.; writing—review and editing, F.G.; visualization, F.G.; supervision, Z.G.; project administration, F.R.; funding acquisition, R.B. All authors have read and agreed to the published version of the manuscript.”, please turn to the CRediT taxonomy for the term explanation. Authorship must be limited to those who have contributed substantially to the work reported.
Funding
This research was funded through the funds of the IDIPHISA Foundation (Research Institute of the Puerta de Hierro University Hospital), with which the Infanta Cristina University Hospital in Madrid was affiliated, grant number XXXXXX.
Institutional Review Board Statement
This study was conducted in accordance with the Declaration of Helsinki and approved by the Ethics Committee Segovia—Arana Biomedical Research Institute of Universitary Hospital Puerta de Hierro (protocol code ACT 15.18) in 19 October 2018. The study was also approved and registered at ClinicalTrials.gov with the identifier: NCT06717620.
Informed Consent Statement
All students who participated in the study signed an informed consent form after reading an information sheet that clearly explained the objectives, procedures, and conditions of the study.
Data Availability Statement
The original contributions presented in this study are included in the article. Further inquiries can be directed to the corresponding author.
Acknowledgments
The authors wish to express their sincere gratitude to Noelia Muñoz-Rodríguez, Alejandra Martínez-Martínez, Nayra García-Lerma, and Erzsebeth Rostas-Albero for their generous and selfless support in the data collection process of this study.
Conflicts of Interest
The authors declare no conflicts of interest. The funders had no role in the design of the study; in the collection, analyses, or interpretation of data; in the writing of the manuscript; or in the decision to publish the results’.
Abbreviations
The following abbreviations are used in this manuscript:
| BMI | Body mass index |
| IPAQ | International Physical Activity Questionnaire |
| SD | Standart desviation |
| T2D | Type 2 diabetes |
Appendix A

Table A1.
Modified Kidmed Questionnaire: Adherence to the Mediterranean Diet in Childhood.
| Item | Adherence to the Mediterranean Diet | Points |
|---|---|---|
| 1 | I eat a dairy product for breakfast (milk, yogurt, etc.) | +1 |
| 2 | I eat a cereal or cereal-based product for breakfast (e.g., bread) | +1 |
| 3 | I skip breakfast | −1 |
| 4 | I eat industrial pastries, cookies, or cakes for breakfast | −1 |
| 5 | I consume one fruit or a natural juice every day | +1 |
| 6 | I consume a second piece of fruit every day | +1 |
| 7 | I eat fresh (e.g., salad) or cooked vegetables at least once a day | +1 |
| 8 | I eat fresh or cooked vegetables more than once a day | +1 |
| 9 | I eat 2 yogurts and/or 40 g of cheese daily | +1 |
| 10 | I eat fish at least 2–3 times a week | +1 |
| 11 | I go to a fast-food restaurant (e.g., burger place, pizzeria) or order food for delivery at least once a week | −1 |
| 12 | I like legumes (chickpeas, lentils, etc.) and eat them 2–3 times a week | +1 |
| 13 | I eat pasta or rice almost daily (5 or more times a week) | +1 |
| 14 | Olive oil is used at home | +1 |
| 15 | I frequently eat unsalted nuts (at least 2–3 times a week) | +1 |
| 16 | I eat sweets, candies, or ice cream several times a day | −1 |
| 17 | I snack daily between meals (e.g., chips, salty snacks, popcorn) | −1 |
| 18 | I drink sugary beverages, packaged juices, and/or milkshakes every day | −1 |
| 19 | I drink three or more glasses of water per day | +1 |
Table A2.
Physical Activity Classification Based on IPAQ Short Form.
| Level | Criteria |
|---|---|
| High | - Vigorous-intensity activity on at least 3 days, achieving a minimum of 1500 MET-min/week, or - 7 or more days of any combination of walking, moderate- or vigorous-intensity activities achieving a minimum of 3000 MET-min/week |
| Moderate | - 3 or more days of vigorous-intensity activity of at least 20 minutes/day, or - 5 or more days of moderate-intensity activity and/or walking of at least 30 minutes/day, or - 5 or more days of any combination of walking, moderate- or vigorous-intensity activities achieving a minimum of 600 MET-min/week |
| Low | - Does not meet criteria for high or moderate physical activity levels |
Table A3.
Body Fat Classification by Age and Sex (percentages).
| Age (years) | Low | Normal | High | Very High |
|---|---|---|---|---|
| Men | ||||
| 10–14 | <11% | 11–16% | 16.1–21% | >21% |
| 15–19 | <12% | 12–17% | 17.1–22% | >22% |
| 20–29 | <13% | 13–18% | 18.1–23% | >23% |
| 30–39 | <14% | 14–19% | 19.1–24% | >24% |
| 40–49 | <15% | 15–20% | 20.1–25% | >25% |
| 50–59 | <16% | 16–21% | 21.1–26% | >26% |
| 60–69 | <17% | 17–22% | 22.1–27% | >27% |
| 70+ | <18% | 18–23% | 23.1–28% | >28% |
| Women | ||||
| 10–14 | <16% | 16–21% | 21.1–26% | >26% |
| 15–19 | <17% | 17–22% | 22.1–27% | >27% |
| 20–29 | <18% | 18–23% | 23.1–28% | >28% |
| 30–39 | <19% | 19–24% | 24.1–29% | >29% |
| 40–49 | <20% | 20–25% | 25.1–30% | >30% |
| 50–59 | <21% | 21–26% | 26.1–31% | >31% |
| 60–69 | <22% | 22–27% | 27.1–32% | >32% |
| 70+ | <23% | 23–28% | 28.1–33% | >33% |
Table A4.
Muscle Mass Classification by Age and Sex (kg).
| Age (years) | Low | Normal | High |
|---|---|---|---|
| Men | |||
| 10–14 | <44 | 44–57 | >57 |
| 15–19 | <43 | 43–56 | >56 |
| 20–29 | <42 | 42–54 | >54 |
| 30–39 | <41 | 41–52 | >52 |
| 40–49 | <40 | 40–50 | >50 |
| 50–59 | <39 | 39–48 | >48 |
| 60–69 | <38 | 38–47 | >47 |
| 70+ | <37 | 37–46 | >46 |
| Women | |||
| 10–14 | <36 | 36–43 | >43 |
| 15–19 | <35 | 35–41 | >41 |
| 20–29 | <34 | 34–39 | >39 |
| 30–39 | <33 | 33–38 | >38 |
| 40–49 | <31 | 31–36 | >36 |
| 50–59 | <29 | 29–34 | >34 |
| 60–69 | <28 | 28–33 | >33 |
| 70+ | <27 | 27–32 | >32 |
References
- Ávila, J. El estrés, un problema de salud del mundo actual. Revista Con-Ciencia 2014, 2, 115–124. [Google Scholar]
- Slater, J.; Mudryj, A.N. Nurturing Future Generations: Household Food Practices of Canadian Children and Family Meal Participation. Canadian Journal of Dietetic Practice and Research 2016, 77, 113–118. [Google Scholar] [CrossRef] [PubMed]
- Dussaillant, C.; Echeverría, G.; Urquiaga, I.; Velasco, N.; Rigotti, A. Evidencia actual sobre los beneficios de la dieta mediterránea en salud. Revista médica de Chile 2016, 144, 990–997. [Google Scholar] [CrossRef] [PubMed]
- Maza Avila, F.J.; Caneda-Bermejo, M.C.; Vivas-Castillo, A.C. Hábitos alimenticios y sus efectos en la salud de los estudiantes universitarios. Una revisión sistemática de la literatura: Hábitos alimenticios y sus efectos en la salud de los estudiantes universitarios. Una revisión sistemática de la literatura. Psicogente 2022, 25, 1–31. [Google Scholar] [CrossRef]
- Warner, K.S.; Wäger, M. Building dynamic capabilities for digital transformation: An ongoing process of strategic renewal. Long Range Planning 2019, 52, 326–349. [Google Scholar] [CrossRef]
- Bach-Faig, A.; Berry, E.M.; Lairon, D.; Reguant, J.; Trichopoulou, A.; Dernini, S.; Medina, F.X.; Battino, M.; Belahsen, R.; Miranda, G.; et al. Mediterranean diet pyramid today. Science and cultural updates. Public Health Nutrition 2011, 14, 2274–2284. [Google Scholar] [CrossRef]
- Bouchard, C.; Shephard, R.J.; Stephens, T.; Sutton, J.R.; McPherson, B.D. Physical Activity, Fitness, and Health: The Model and Key Concepts. In Physical Activity, Fitness, and Health: International Proceedings and Consensus Statement; Bouchard, C., Shephard, R.J., Stephens, T., Eds.; Human Kinetics: Champaign, IL, 1994; pp. 77–88. [Google Scholar]
- Hallal, P.C.; Azevedo, M.R.; Reichert, F.F.; Siqueira, F.V.; Araújo, C.L.; Victora, C.G. Who, when, and how much? American Journal of Preventive Medicine 2005, 28, 156–161. [Google Scholar] [CrossRef] [PubMed]
- del Castillo, M.G.; Girela, D.L. (Eds.) Bases biológicas y fisiológicas del movimiento humano; Editorial Médica Panamericana: Madrid, 2002. [Google Scholar]
- García Almeida, J.M.; García García, C.; Vegas Aguilar, I.M.; Bellido Castañeda, V.; Bellido Guerrero, D. Morphofunctional assessment of patient nutritional status: a global approach. Nutrición Hospitalaria. [CrossRef]
- Christoph, M.J.; An, R. Effect of nutrition labels on dietary quality among college students: a systematic review and meta-analysis. Nutrition Reviews 2018, 76, 187–203. [Google Scholar] [CrossRef] [PubMed]
- Toloza, S.M.; Gómez-Conesa, A. El Cuestionario Internacional de Actividad Física: Un instrumento adecuado en el seguimiento de la actividad física poblacional. Revista Iberoamericana de Fisioterapia y Kinesiología 2007, 10, 48–52. [Google Scholar] [CrossRef]
- Arce, J.R.; Fajardo, H.M.M. Ansiedad y estrés: los enemigos invisibles de los estudiantes. https://ciencia.unam.mx/leer/1444/ansiedad-y-estres-los-enemigos-invisibles-de-los-estudiantes, 2023. Consultado el 10 de mayo de 2025.
- Gambini López, I.; Osorio Vidal, V.G.; Palomino Alca, J.T. El estrés académico en el aprendizaje de los estudiantes universitarios. Horizontes. Revista de Investigación en Ciencias de la Educación 2024, 8. [Google Scholar] [CrossRef]
- Medical News Today. Estrés o ansiedad: Diferencias, síntomas y alivio. https://www.medicalnewstoday.com/articles/es/estres-y-ansiedad, 2021. Consultado el 10 de mayo de 2025.
- Monteiro, C.A.; Cannon, G.; Moubarac, J.C.; Levy, R.B.; Louzada, M.L.C.; Jaime, P.C. The UN Decade of Nutrition, the NOVA food classification and the trouble with ultra-processing. Public Health Nutrition 2018, 21, 5–17. [Google Scholar] [CrossRef] [PubMed]
- Cárdenas Villota, J y Ortega Veloza, V.. Composición corporal y estilos de vida en estudiantes del programa Ciencias del Deporte. https://repository.udca.edu.co/handle/11158/1066, 2018. Consultado el 10 de mayo de 2025.
- Vizoso Gómez, C.M.; Arias Gundín, O. Estresores académicos percibidos por estudiantes universitarios y su relación con el burnout y el rendimiento académicos. Anuario de Psicología 2016, 46, 90–97. [Google Scholar] [CrossRef]
Figure 1.
Flowchart of the study design. The study involved 142 second-year nursing students who underwent two assessments: one before the exam period (January 2024) and another during the exam period (May 2024). Each assessment included measurements of body composition (via bioimpedance), dietary habits (Kidmed questionnaire), and physical activity levels (IPAQ-SF).
Figure 1.
Flowchart of the study design. The study involved 142 second-year nursing students who underwent two assessments: one before the exam period (January 2024) and another during the exam period (May 2024). Each assessment included measurements of body composition (via bioimpedance), dietary habits (Kidmed questionnaire), and physical activity levels (IPAQ-SF).
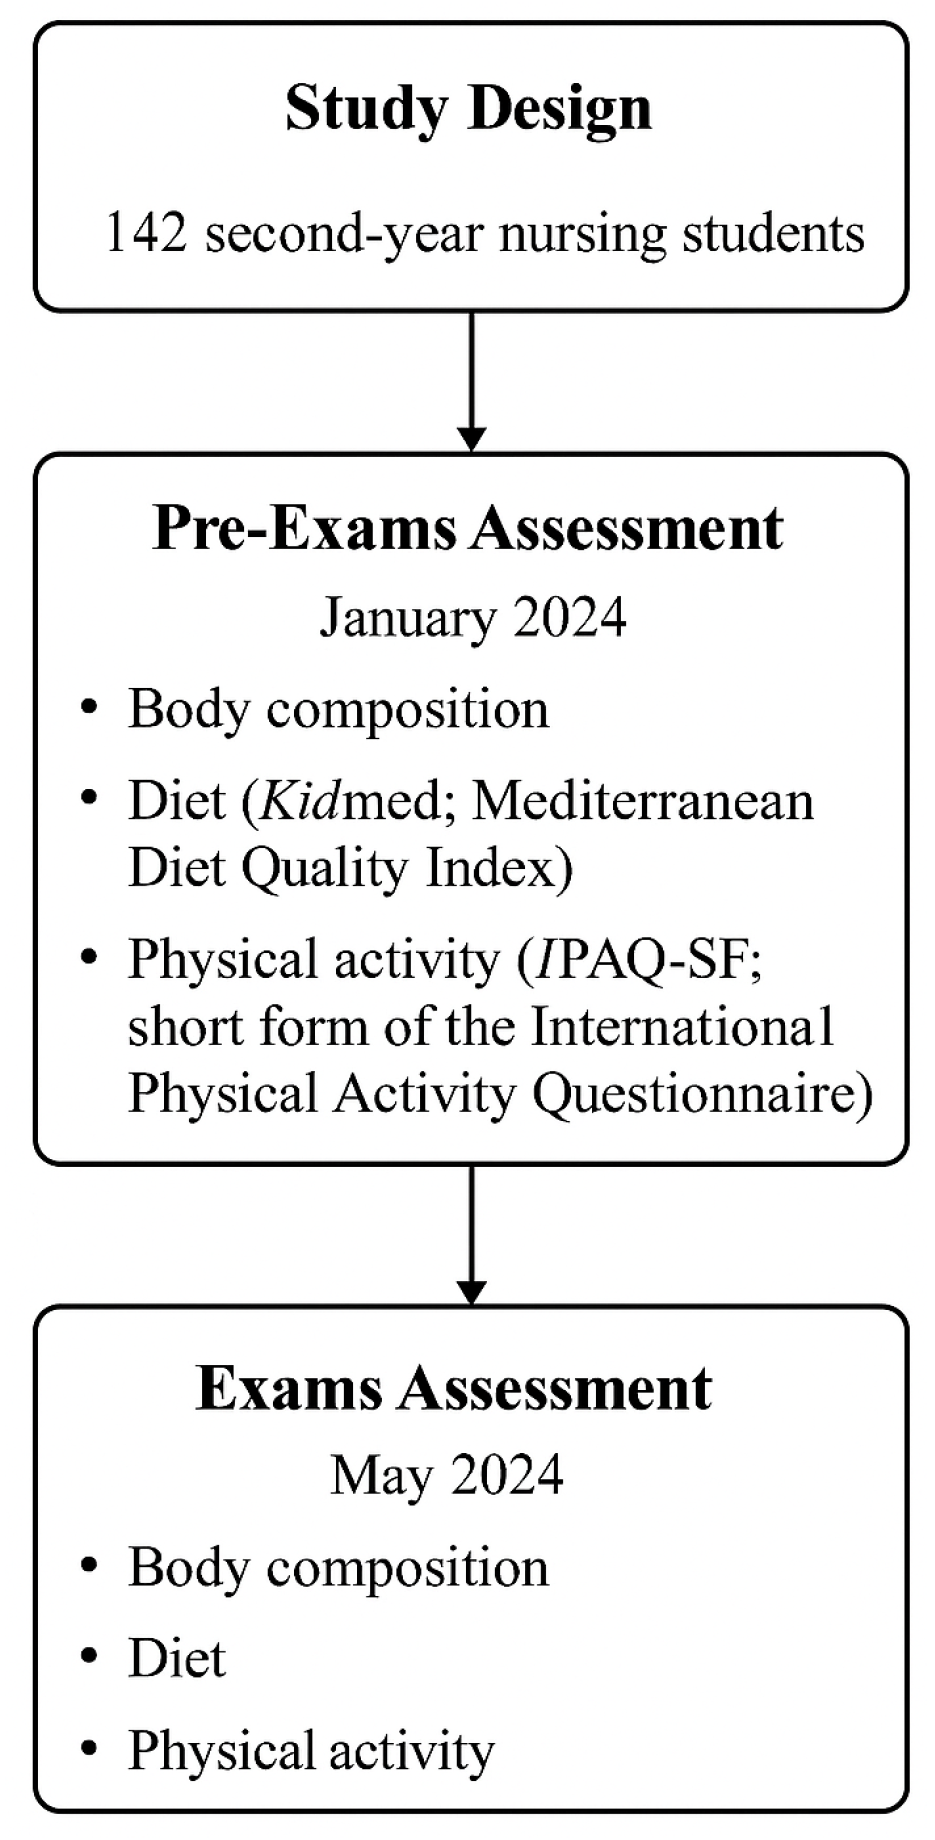
Figure 2.
Mean fat mass before and during the exam period with standard deviation error bars. The plot shows a clear increase in average fat mass during exams, indicating a general deterioration in body composition.
Figure 2.
Mean fat mass before and during the exam period with standard deviation error bars. The plot shows a clear increase in average fat mass during exams, indicating a general deterioration in body composition.
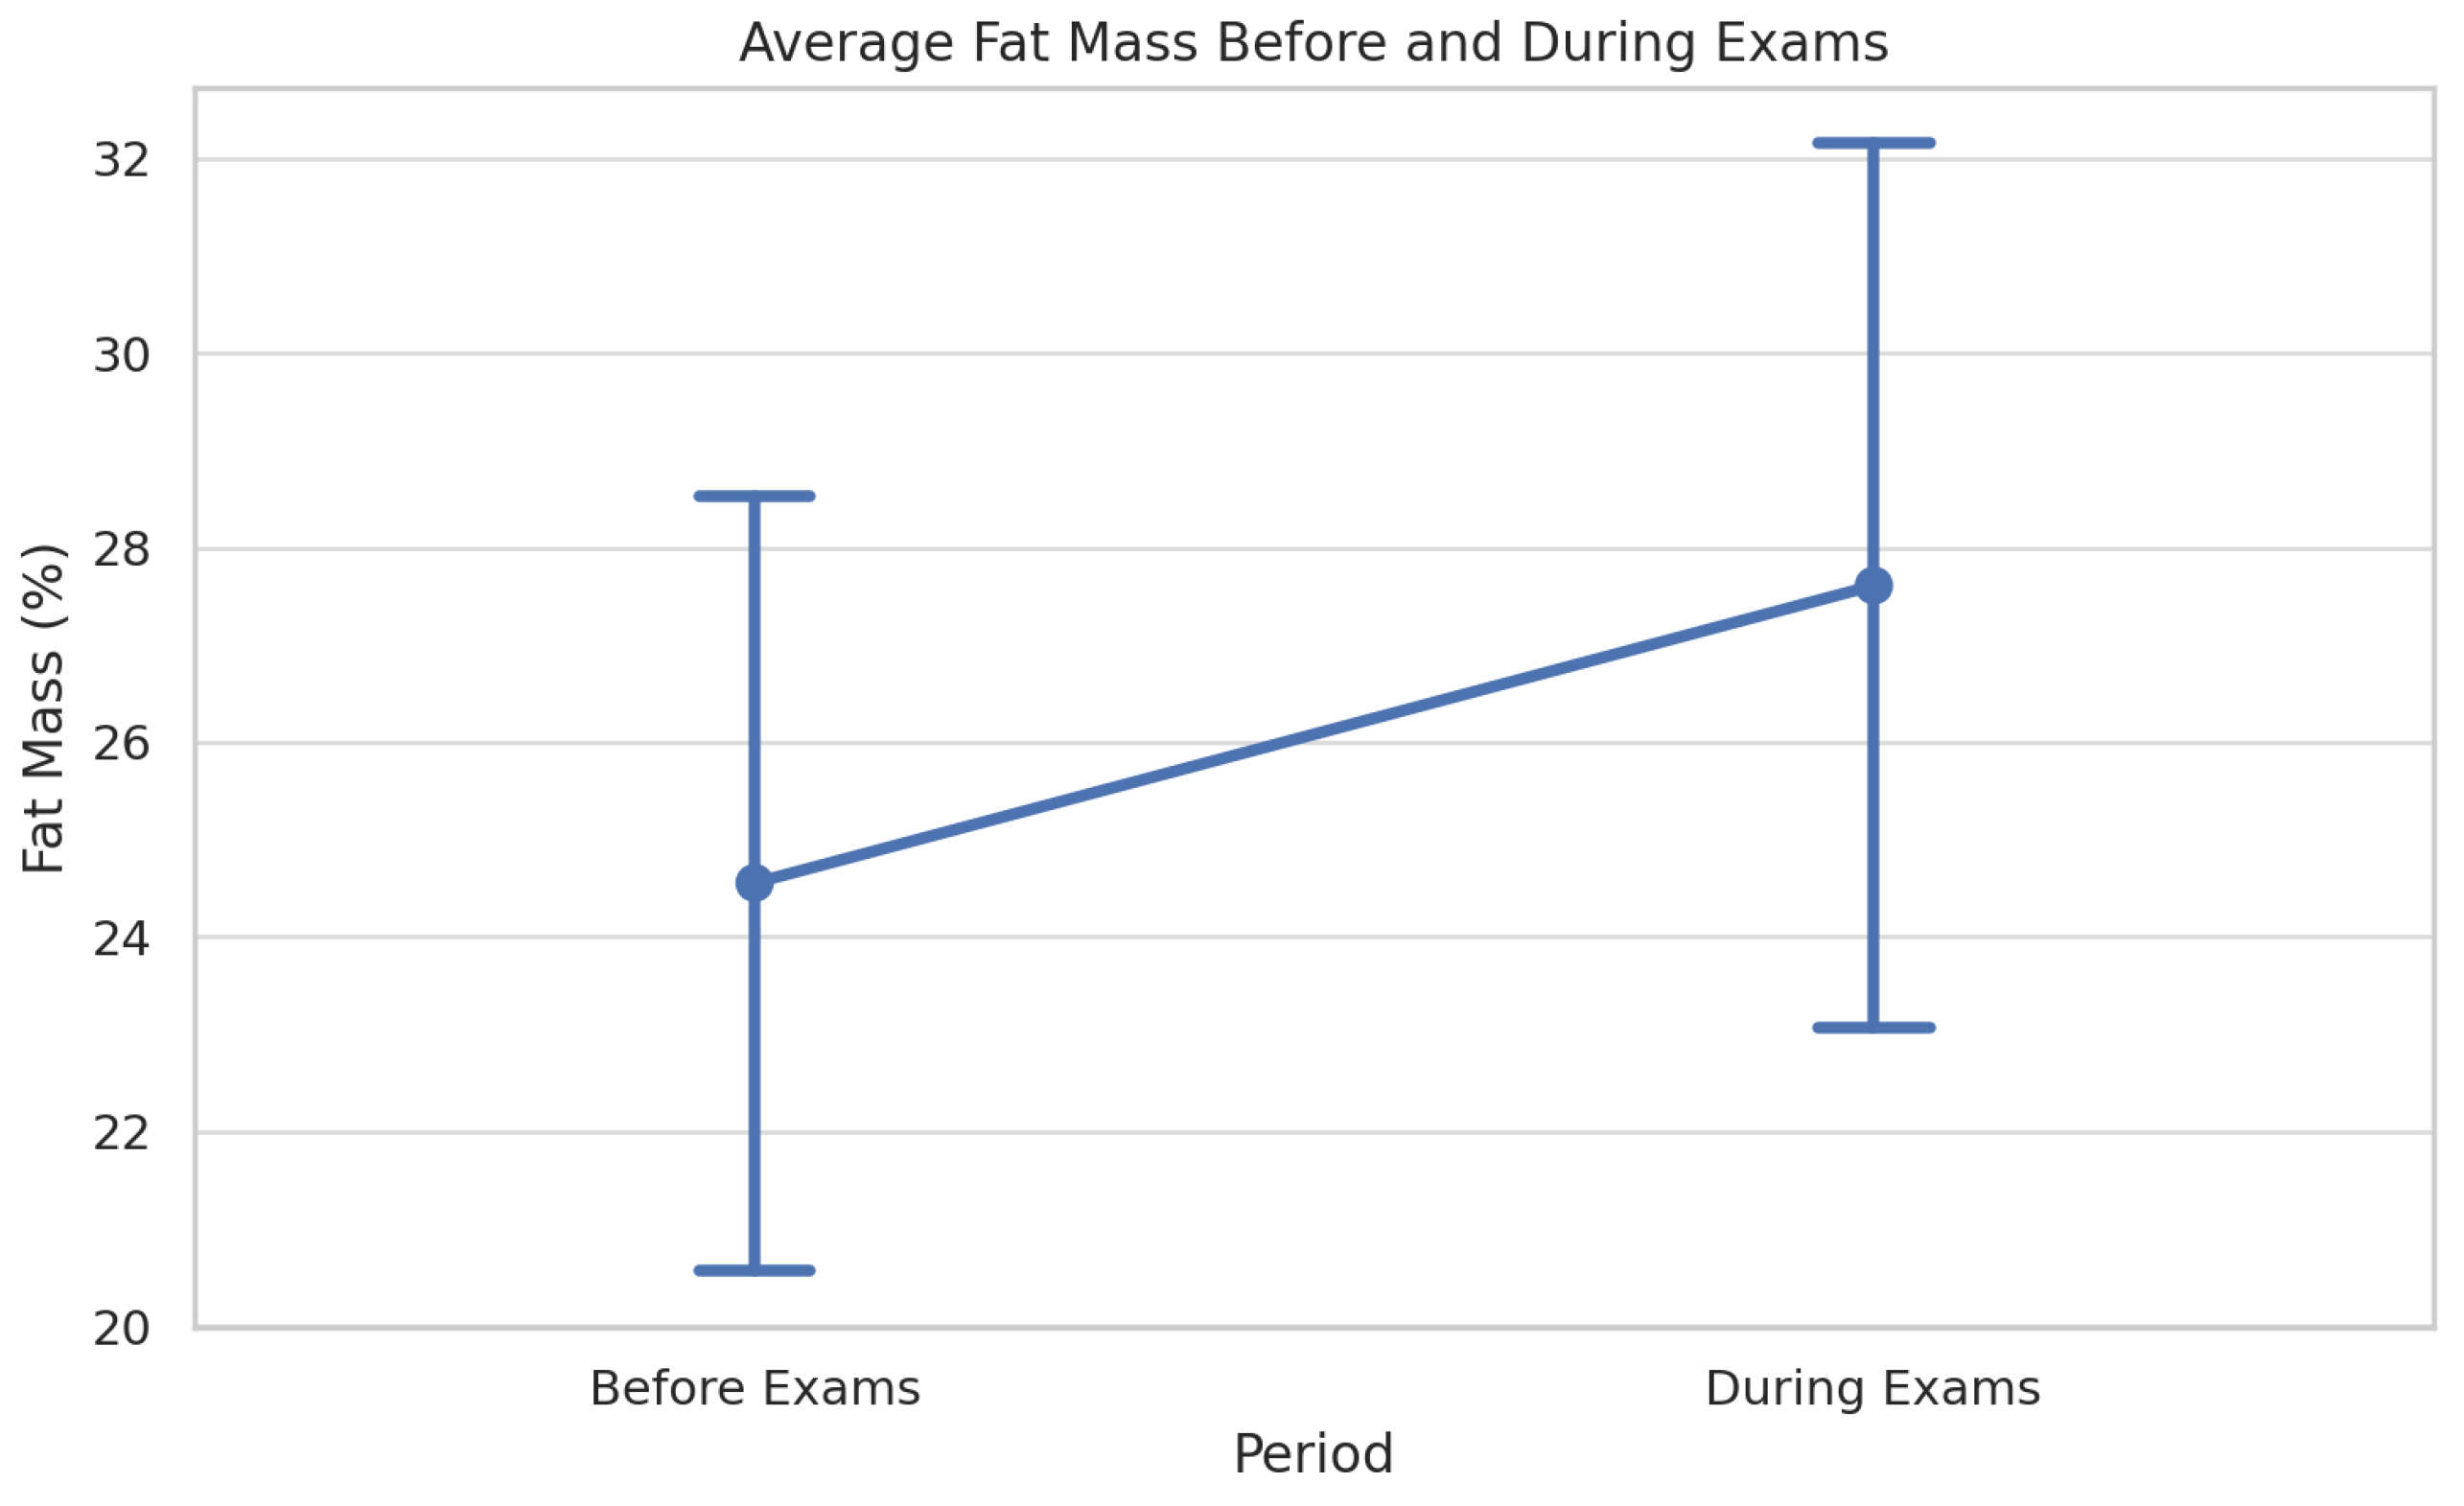
Figure 3.
Violin and box plot of fat mass distribution before and during exams, including individual trajectories for a subset of 10 students. The figure highlights both the shift in distribution and the within-subject variability associated with academic stress.
Figure 3.
Violin and box plot of fat mass distribution before and during exams, including individual trajectories for a subset of 10 students. The figure highlights both the shift in distribution and the within-subject variability associated with academic stress.
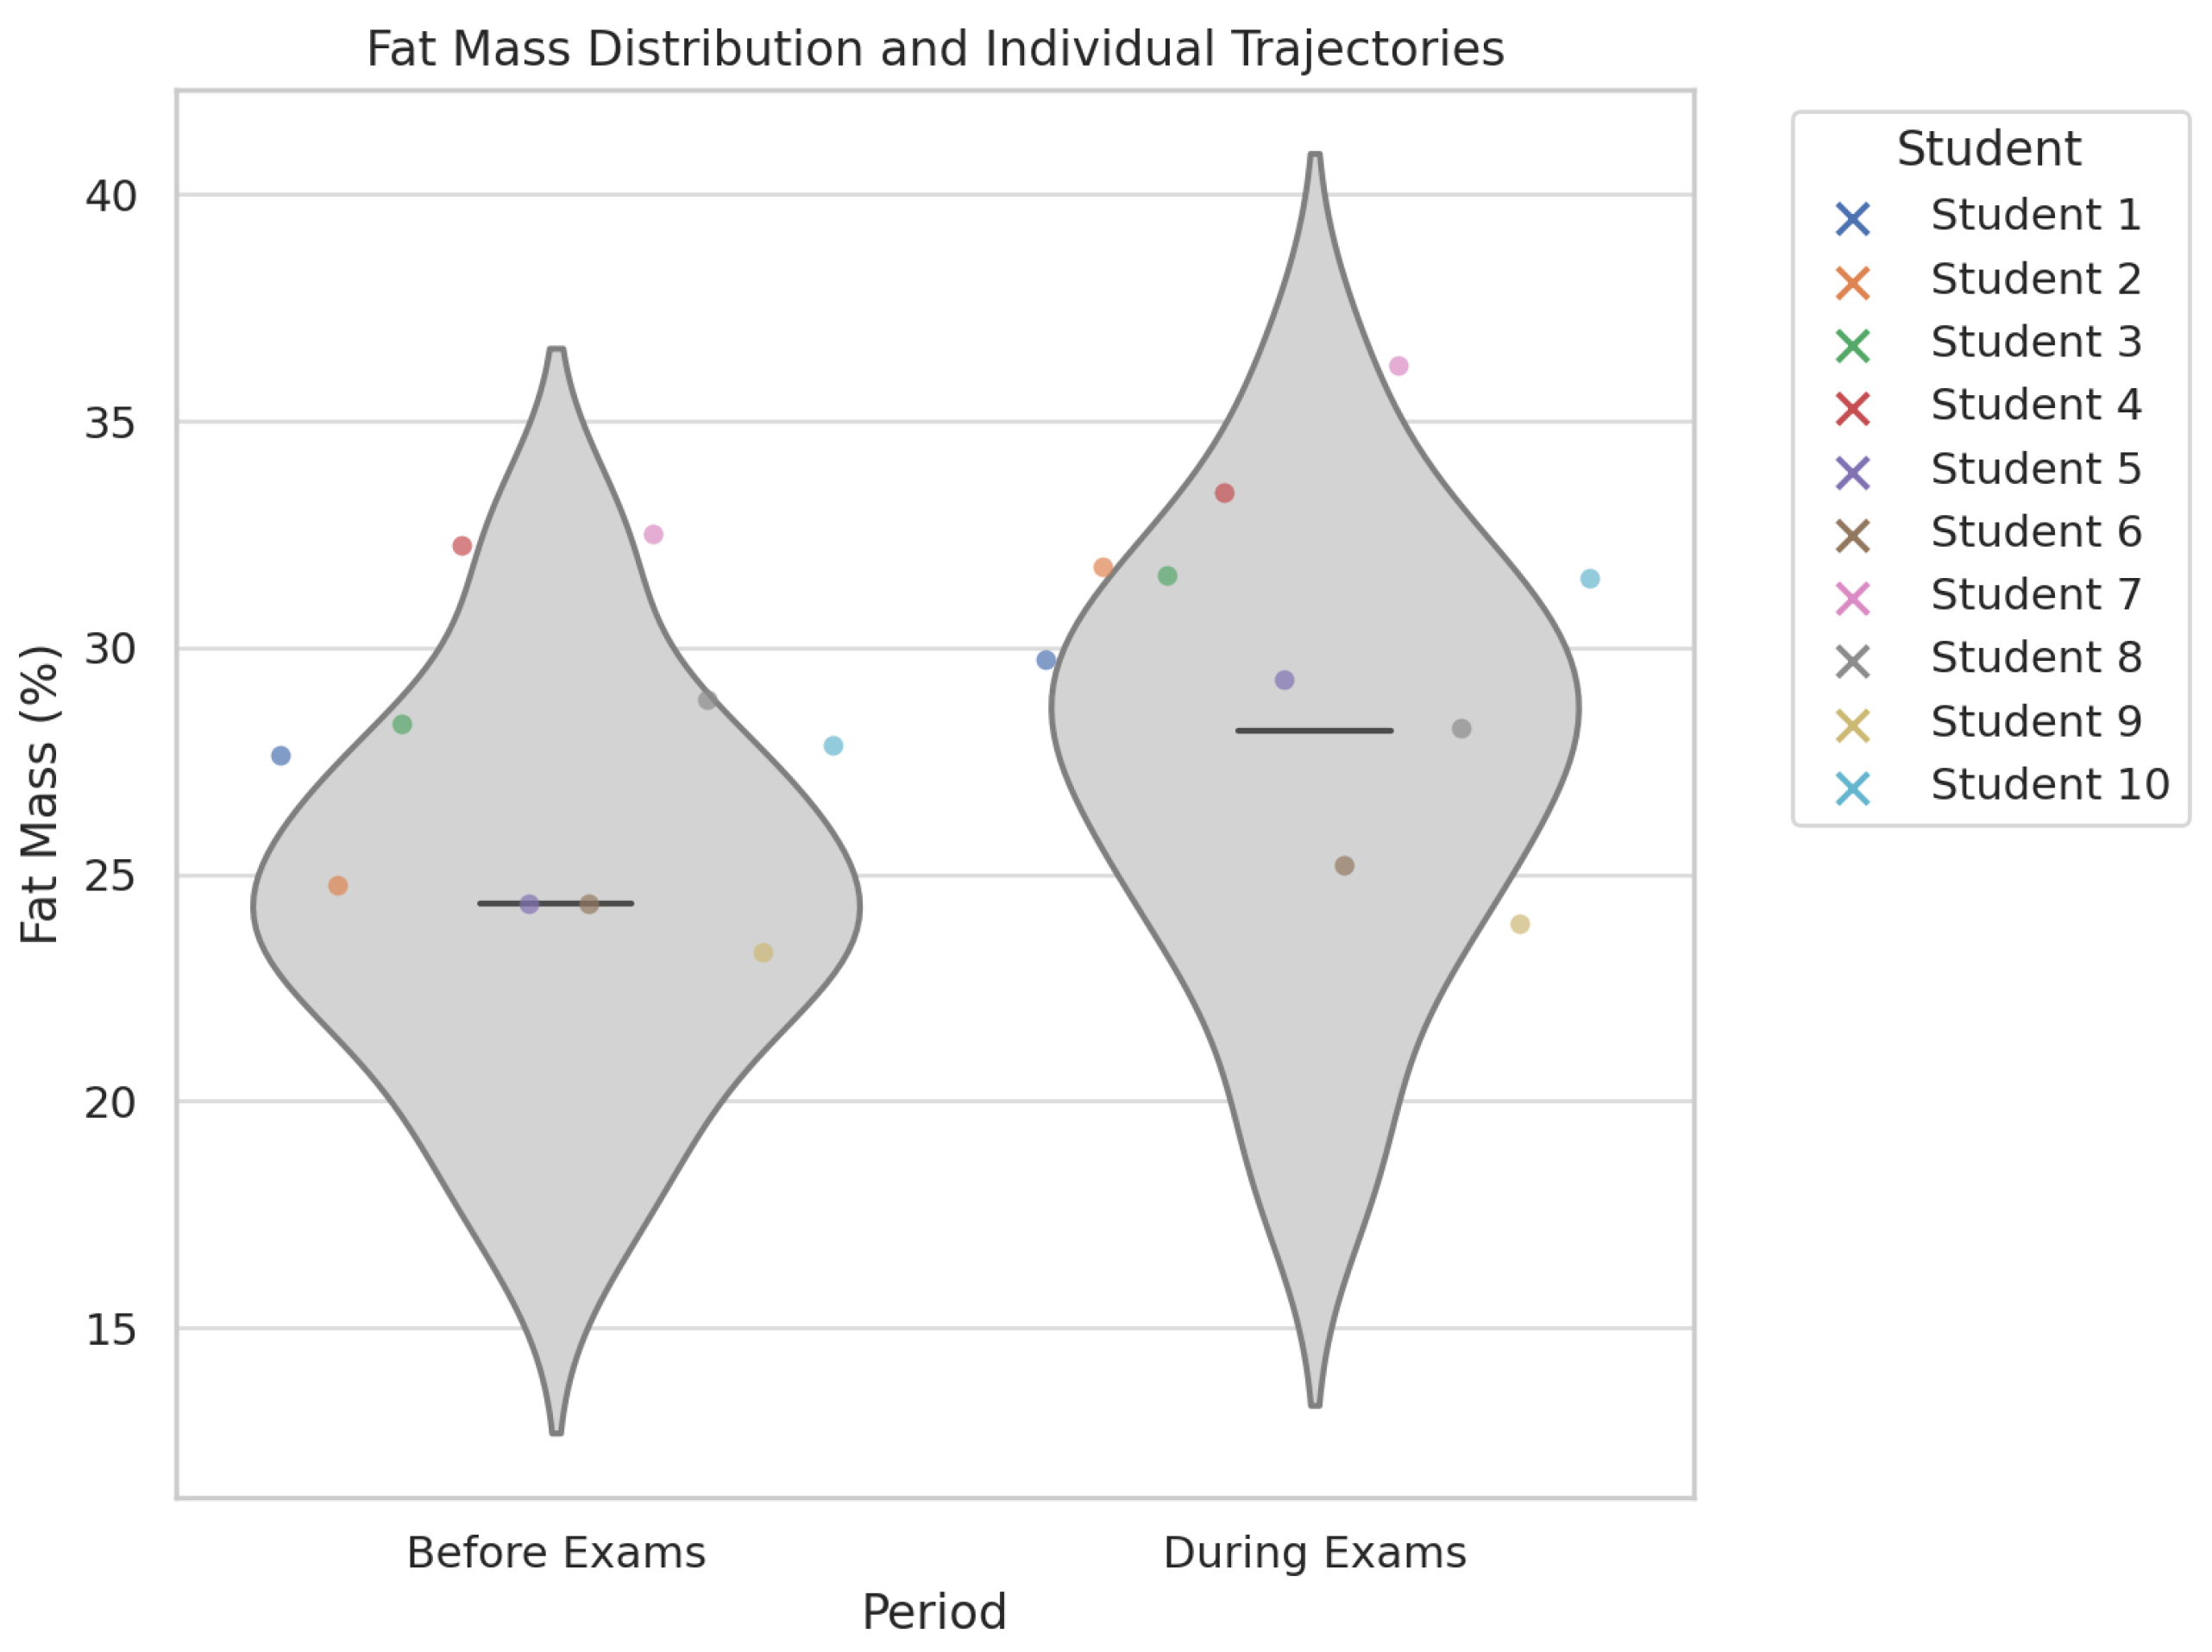
Figure 4.
Stacked bar chart showing the distribution of Mediterranean diet quality among students before and during the exam period. The figure illustrates a marked decline in diet quality during exams, with a substantial increase in the number of students classified as having low adherence to the Mediterranean diet.
Figure 4.
Stacked bar chart showing the distribution of Mediterranean diet quality among students before and during the exam period. The figure illustrates a marked decline in diet quality during exams, with a substantial increase in the number of students classified as having low adherence to the Mediterranean diet.
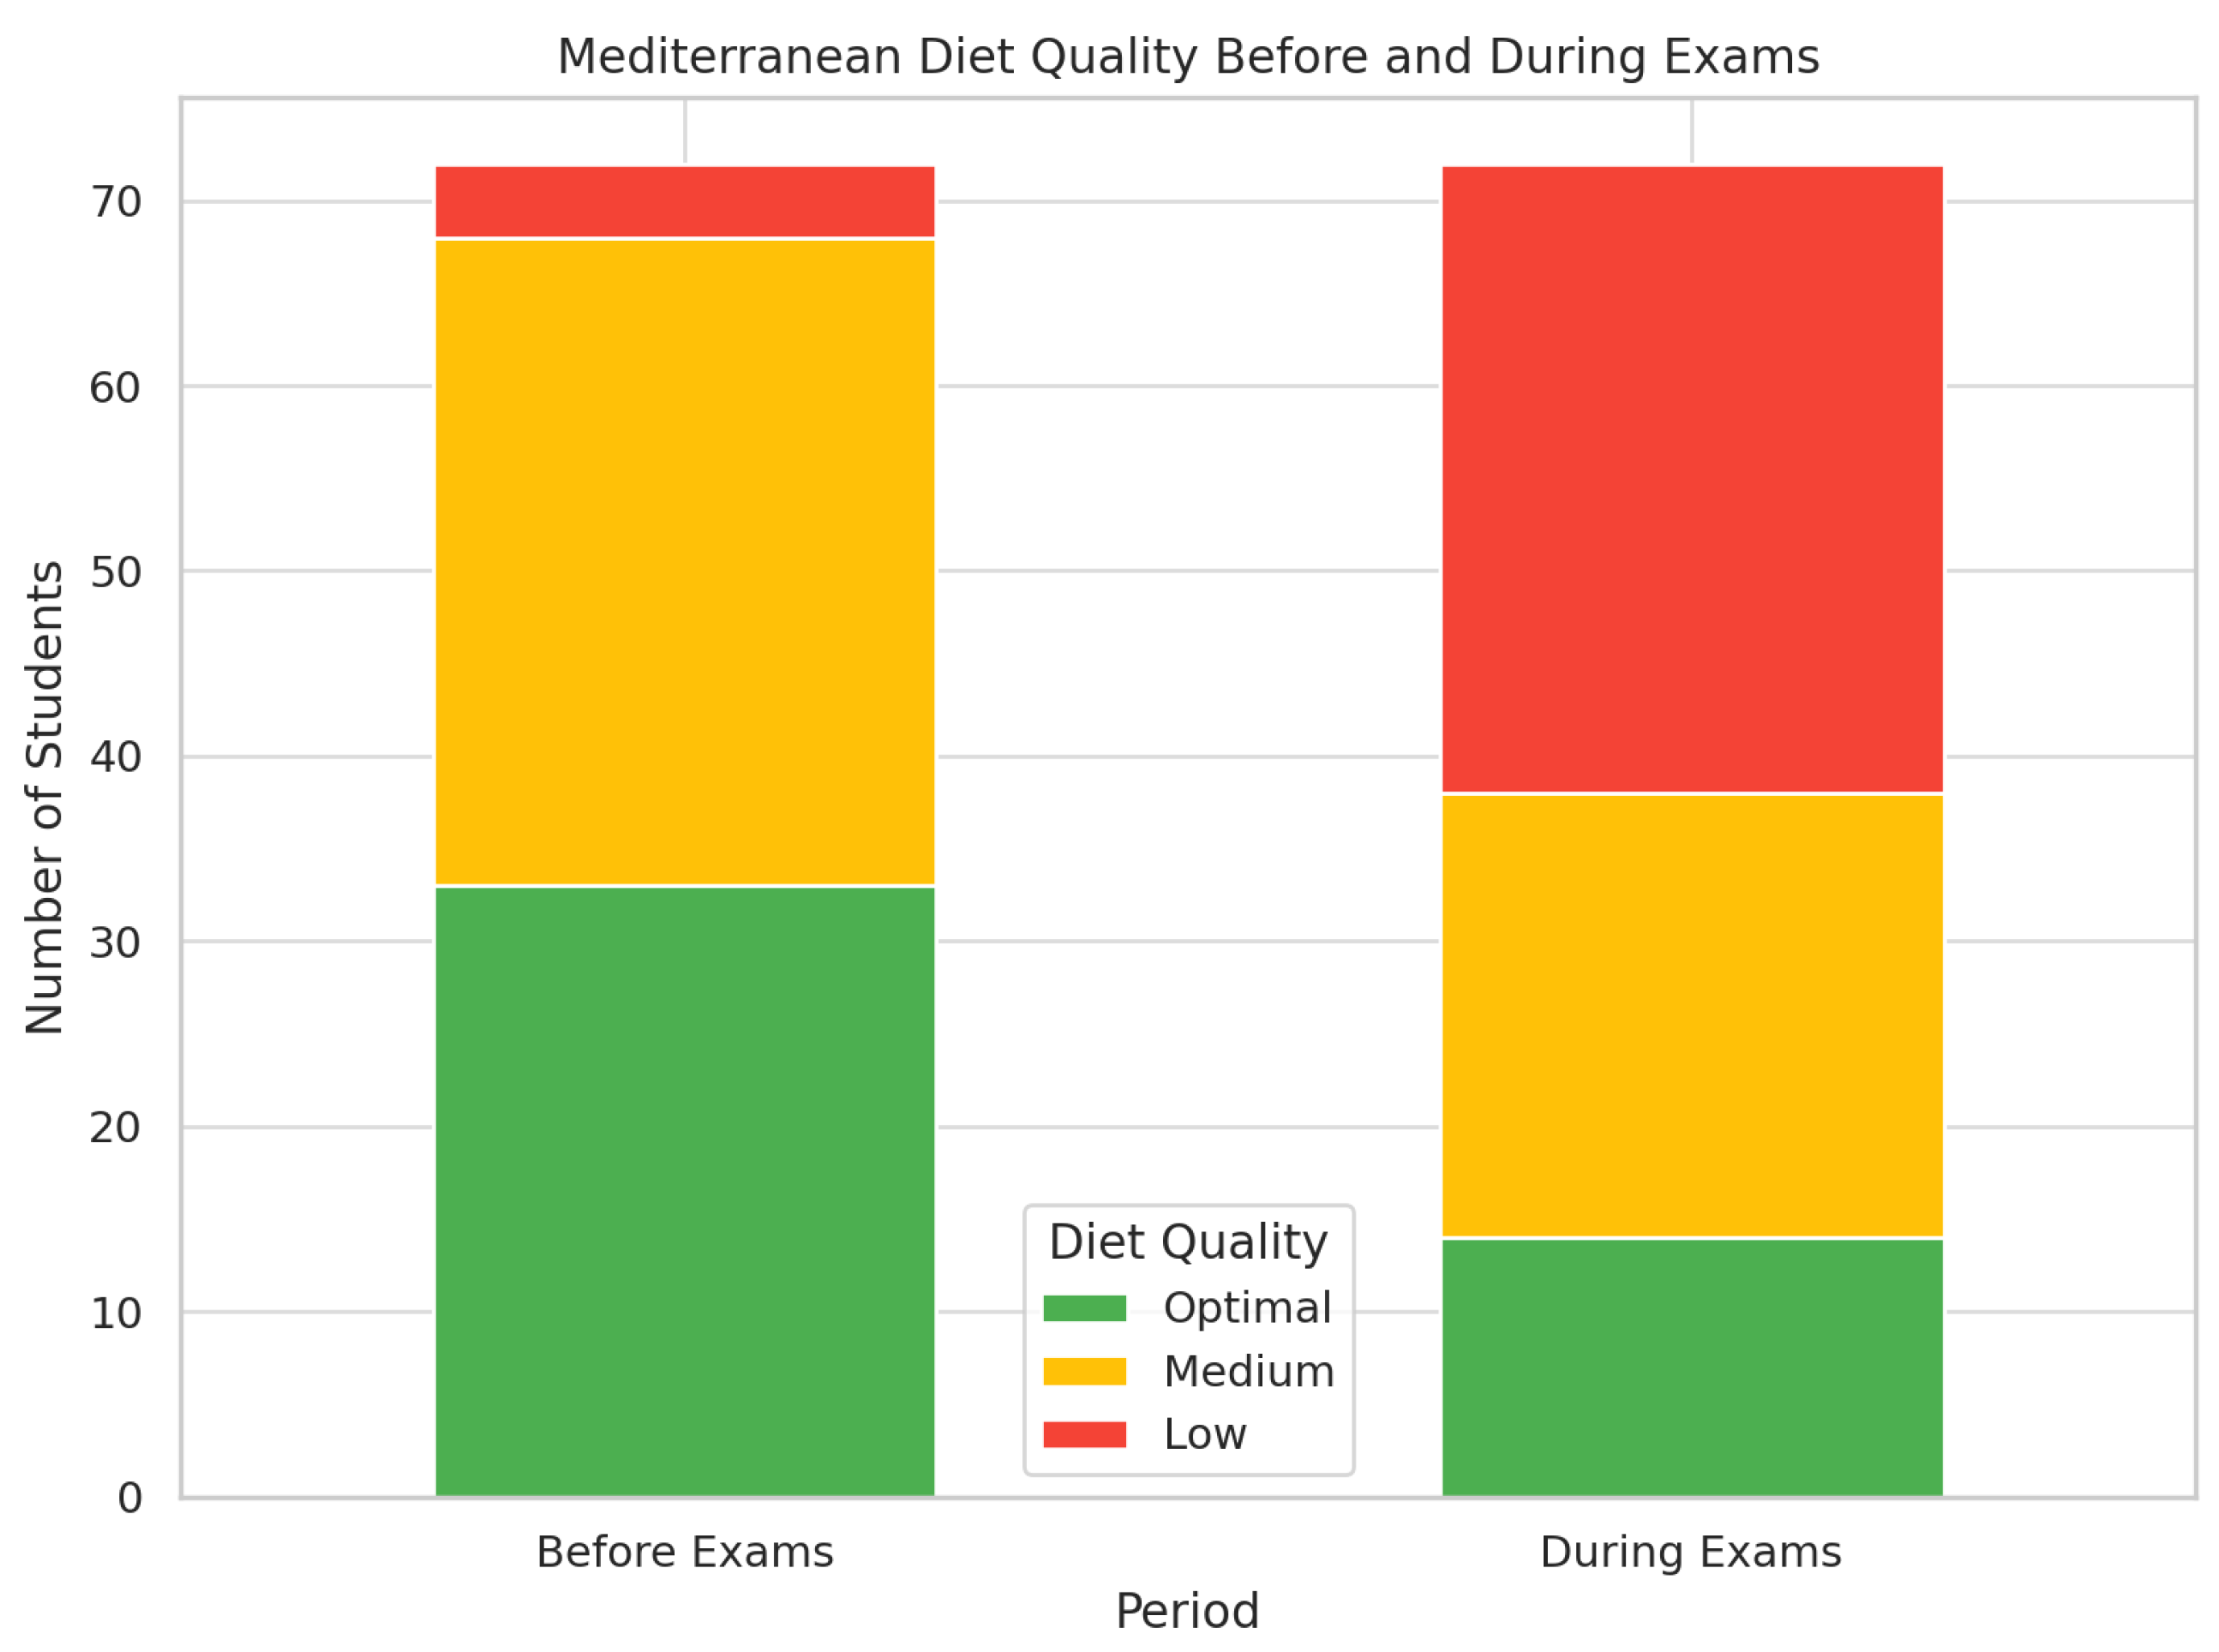
Figure 5.
Total weekly minutes of vigorous physical activity, sedentary time, and walking before and during the exam period. The figure illustrates a significant decline in physical activity and walking, alongside a marked increase in sedentary behavior during exams. Data are based on calculated totals from self-reported frequency and duration.
Figure 5.
Total weekly minutes of vigorous physical activity, sedentary time, and walking before and during the exam period. The figure illustrates a significant decline in physical activity and walking, alongside a marked increase in sedentary behavior during exams. Data are based on calculated totals from self-reported frequency and duration.
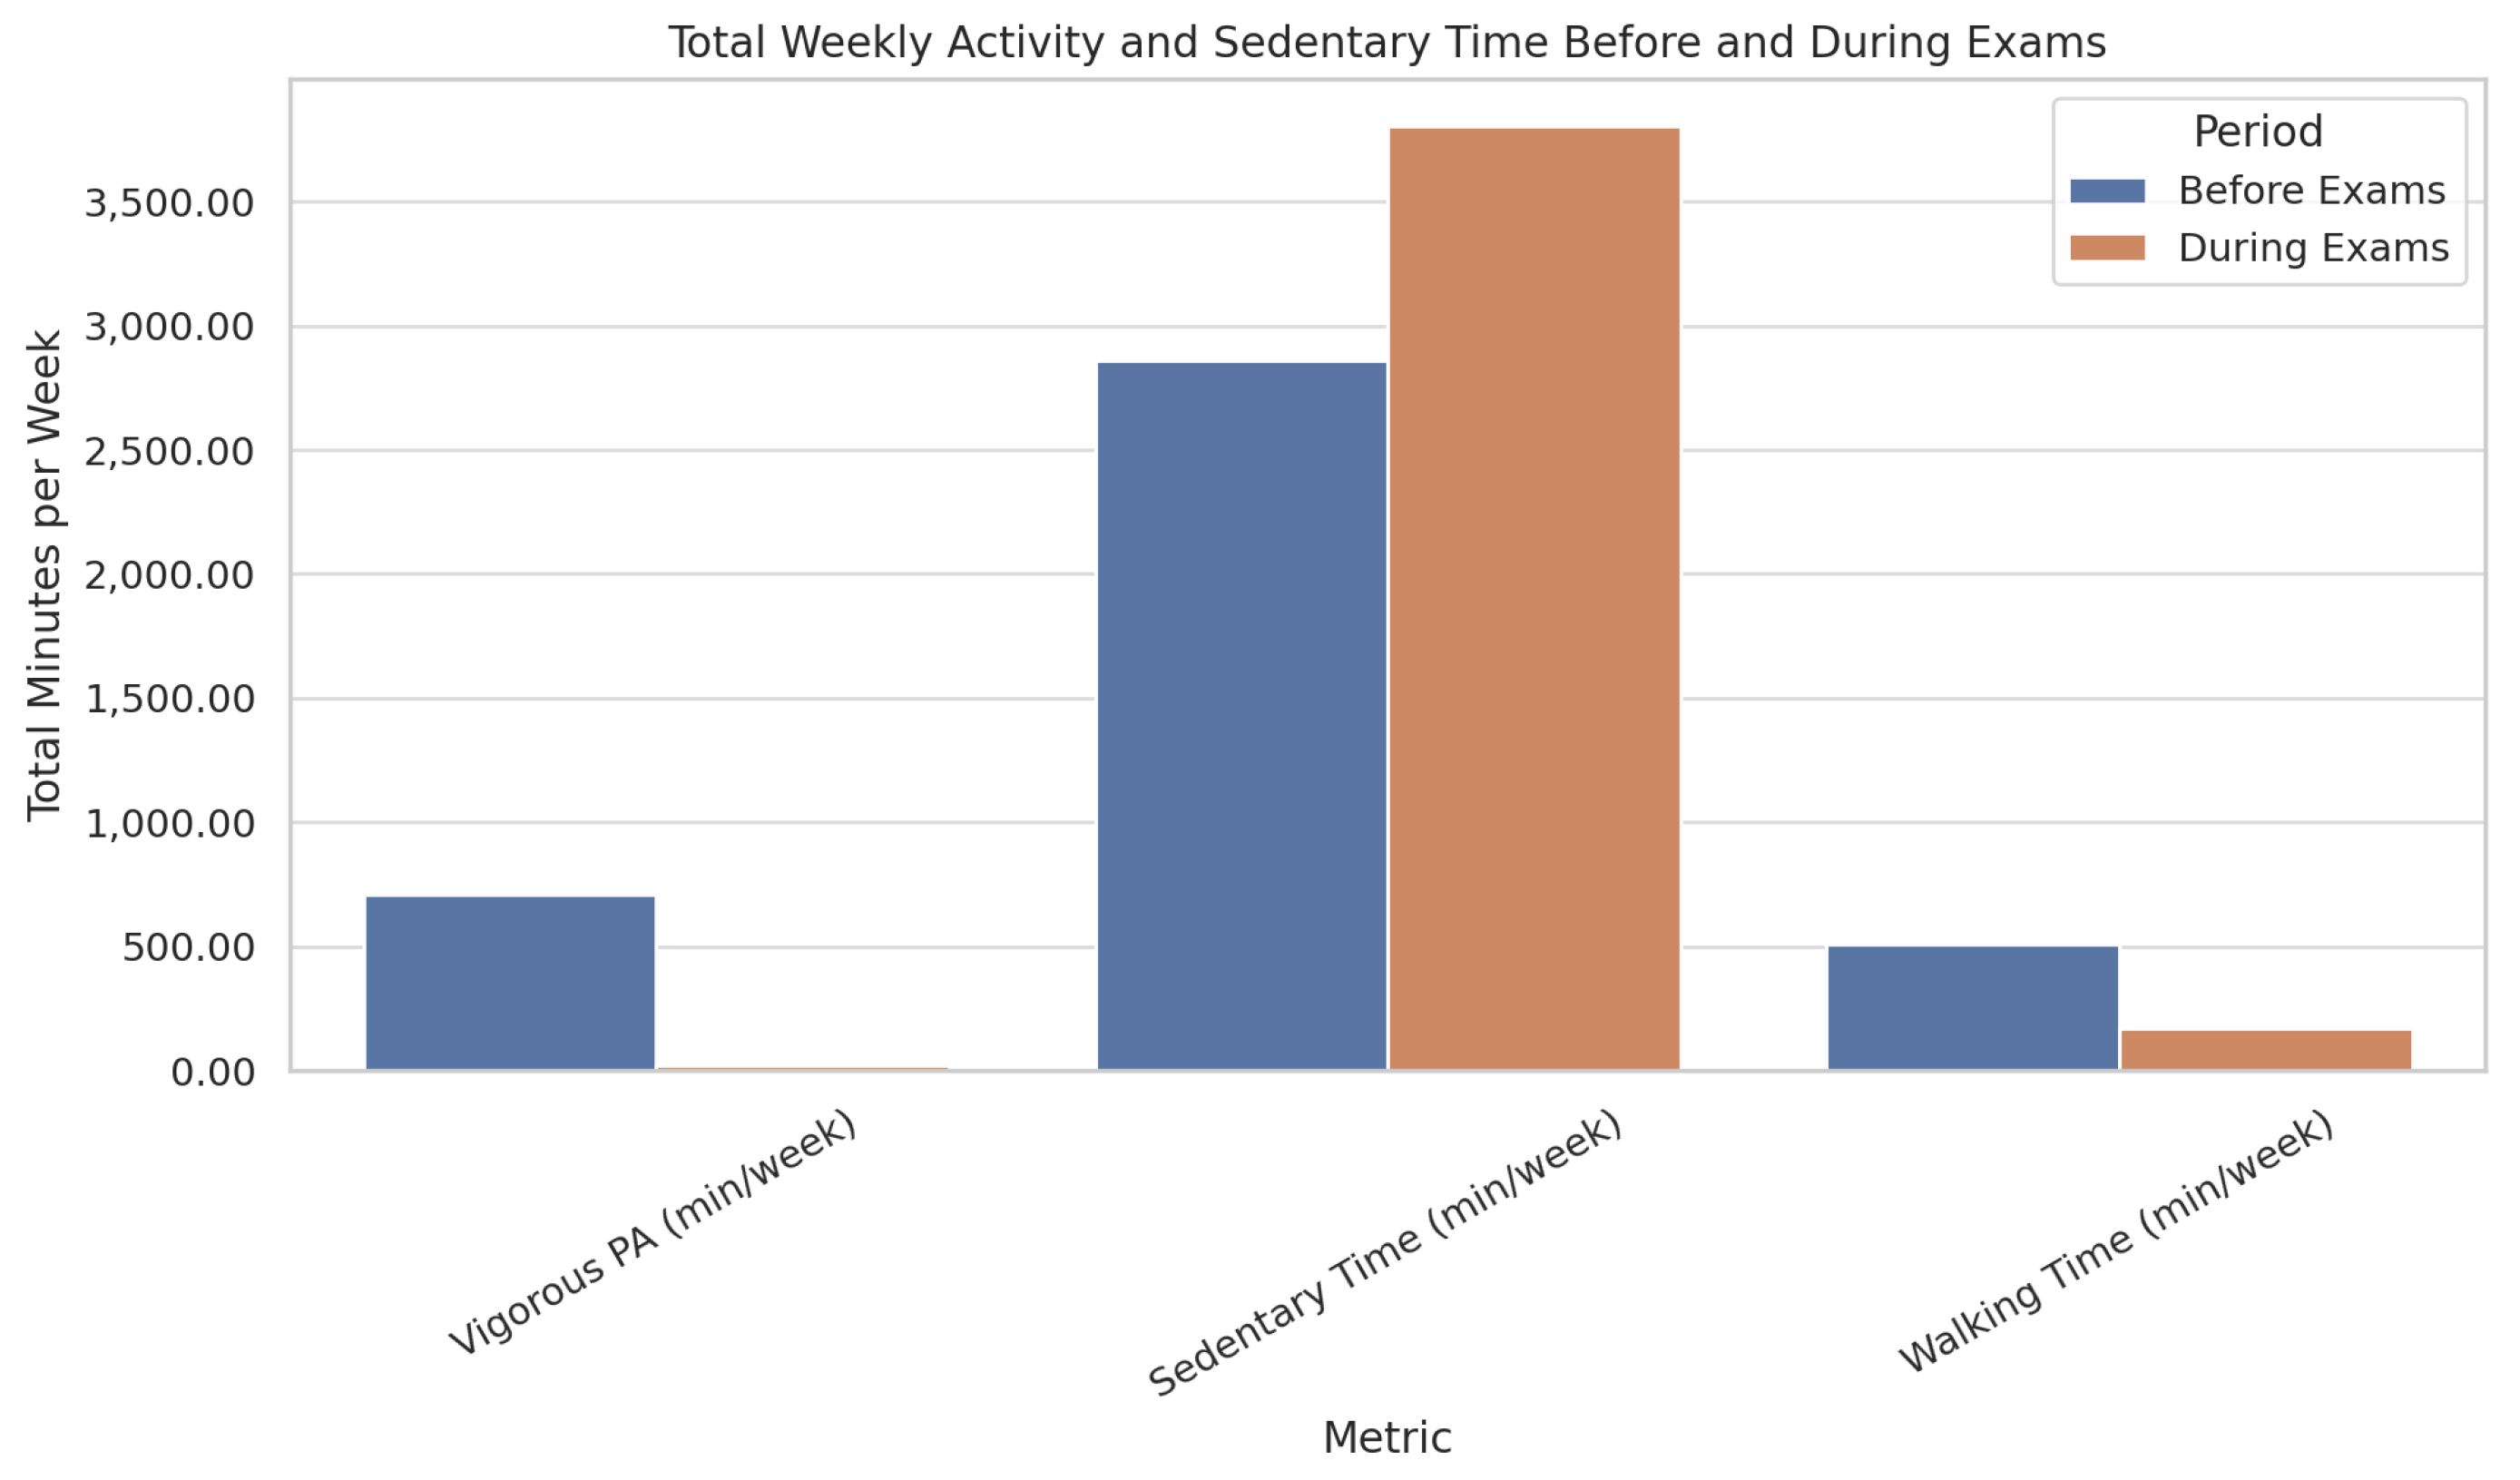
Figure 6.
Distribution of fat mass and muscle mass according to diet quality. The boxplots illustrate that students with lower diet quality (as classified by the modified Kidmed score) tend to have higher fat mass and lower muscle mass, reinforcing the association between nutritional habits and body composition.
Figure 6.
Distribution of fat mass and muscle mass according to diet quality. The boxplots illustrate that students with lower diet quality (as classified by the modified Kidmed score) tend to have higher fat mass and lower muscle mass, reinforcing the association between nutritional habits and body composition.
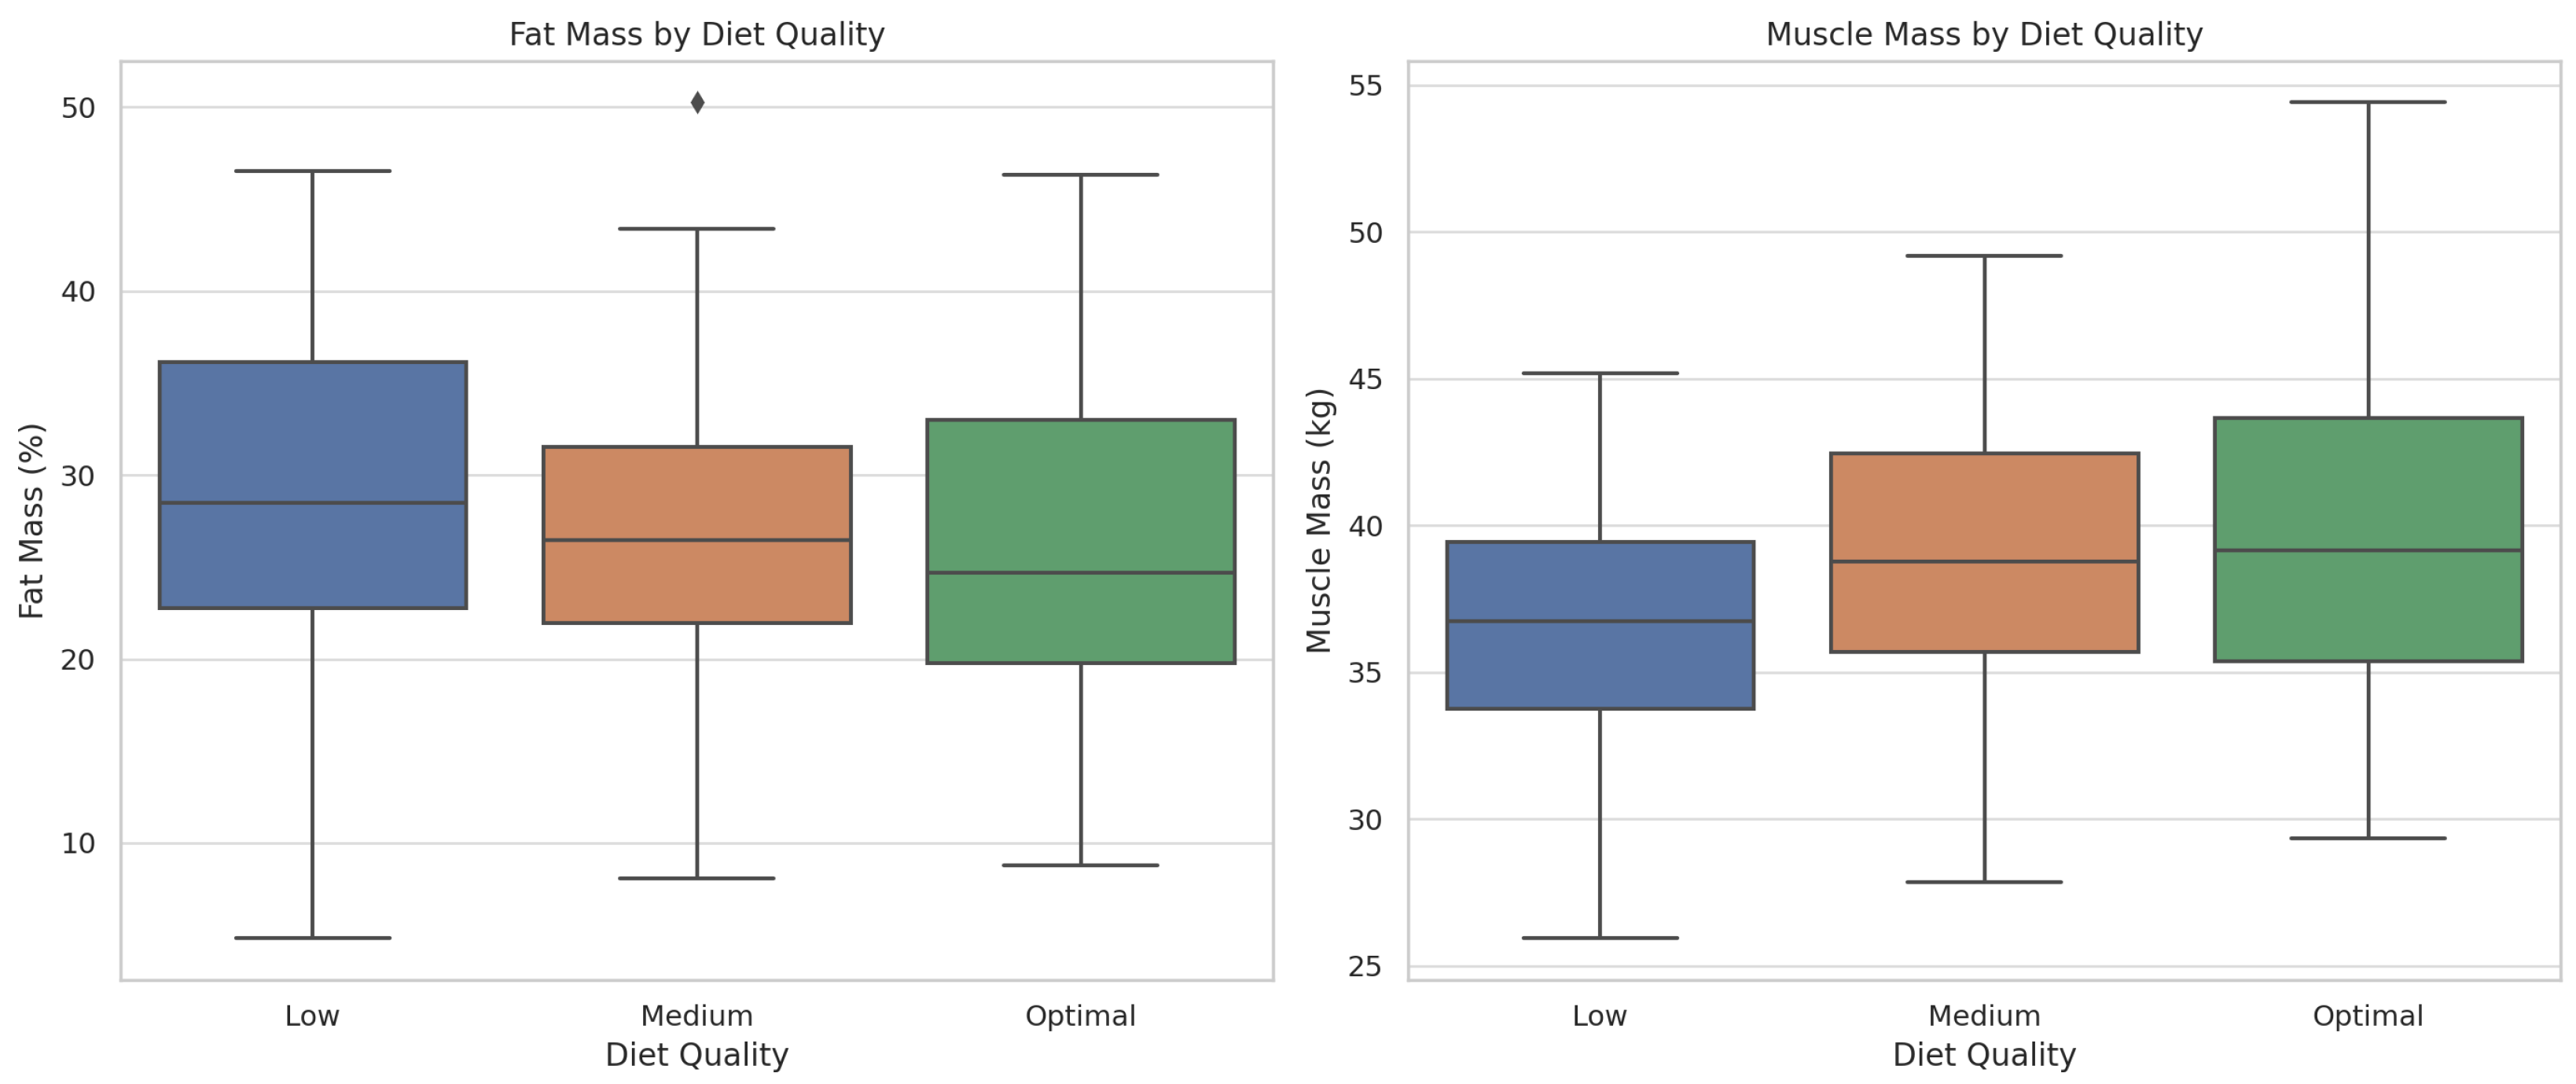
Figure 7.
Correlation matrix of key variables related to lifestyle and body composition. The heatmap displays Pearson correlation coefficients among Kidmed score, IPAQ physical activity score (MET-min/week), fat mass, muscle mass, visceral fat, and sedentary time. Strong inverse correlations are observed between Kidmed or IPAQ scores and fat-related measures, highlighting the impact of healthy habits on body composition.
Figure 7.
Correlation matrix of key variables related to lifestyle and body composition. The heatmap displays Pearson correlation coefficients among Kidmed score, IPAQ physical activity score (MET-min/week), fat mass, muscle mass, visceral fat, and sedentary time. Strong inverse correlations are observed between Kidmed or IPAQ scores and fat-related measures, highlighting the impact of healthy habits on body composition.
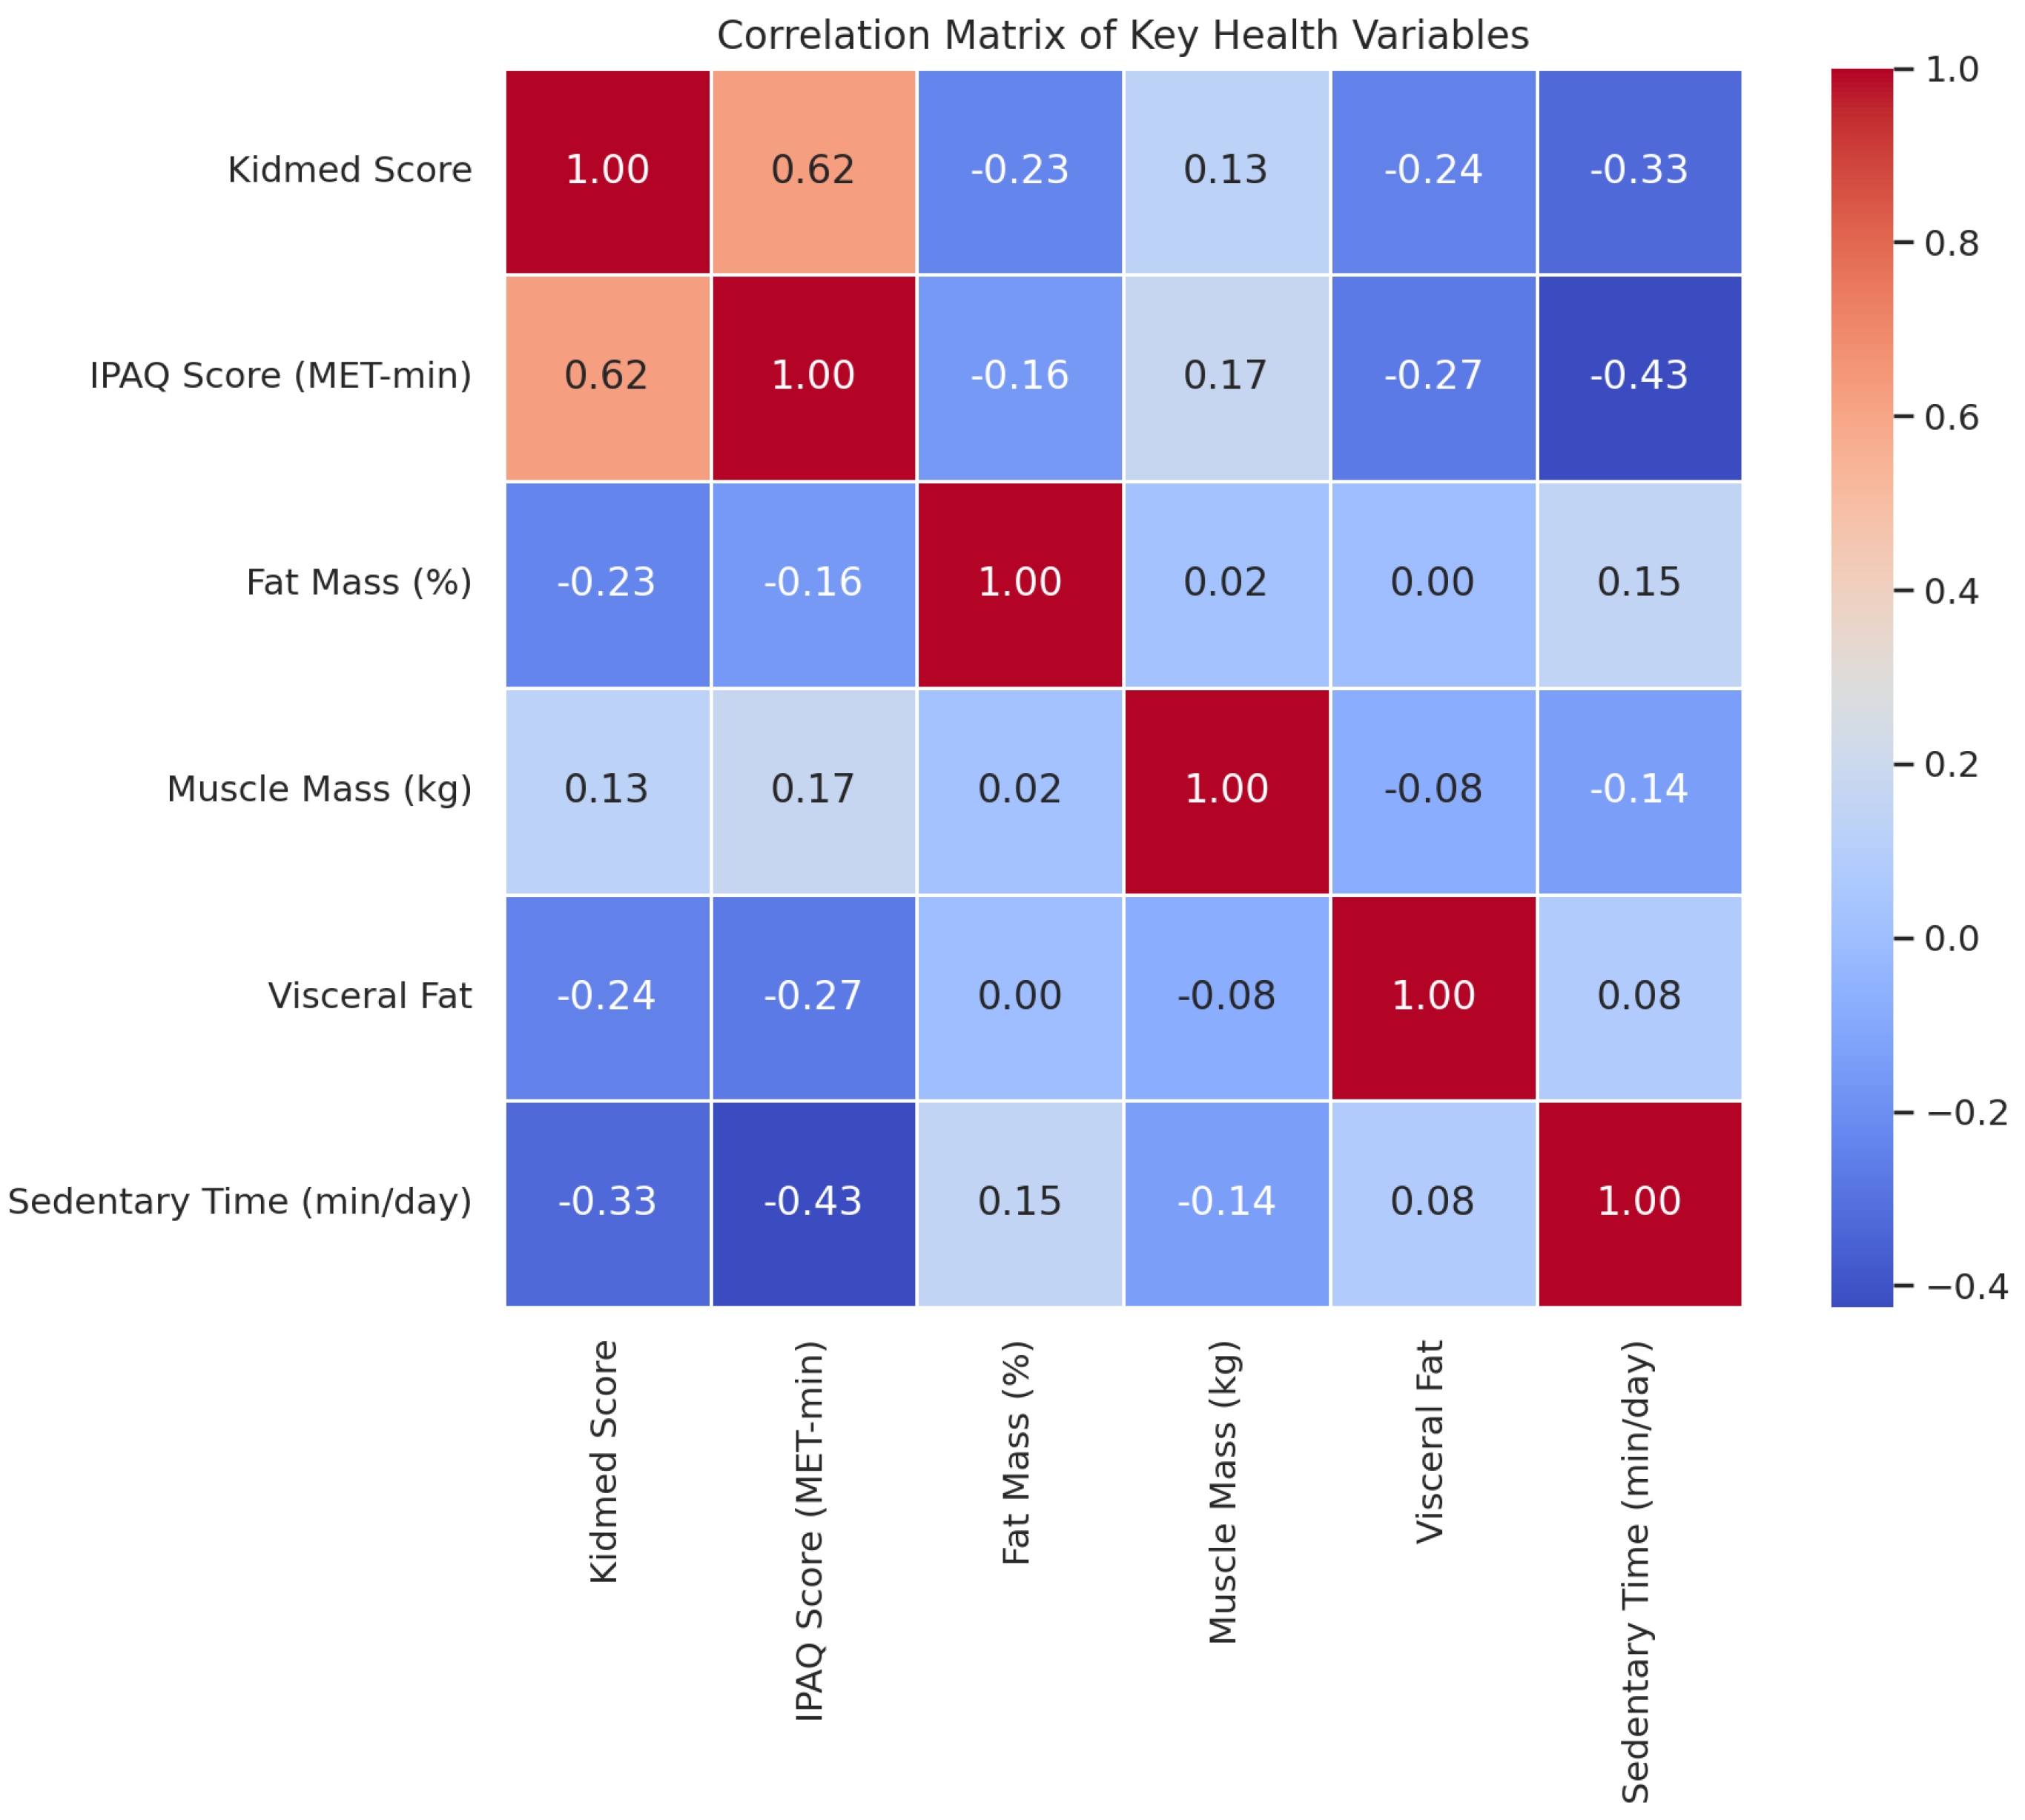
Figure 8.
Conceptual summary of the impact of exam periods on student health. The infographic illustrates how academic stress leads to unhealthy habits, including poor diet and physical inactivity, which subsequently result in increased fat mass and decreased muscle mass, reflecting adverse changes in body composition.
Figure 8.
Conceptual summary of the impact of exam periods on student health. The infographic illustrates how academic stress leads to unhealthy habits, including poor diet and physical inactivity, which subsequently result in increased fat mass and decreased muscle mass, reflecting adverse changes in body composition.
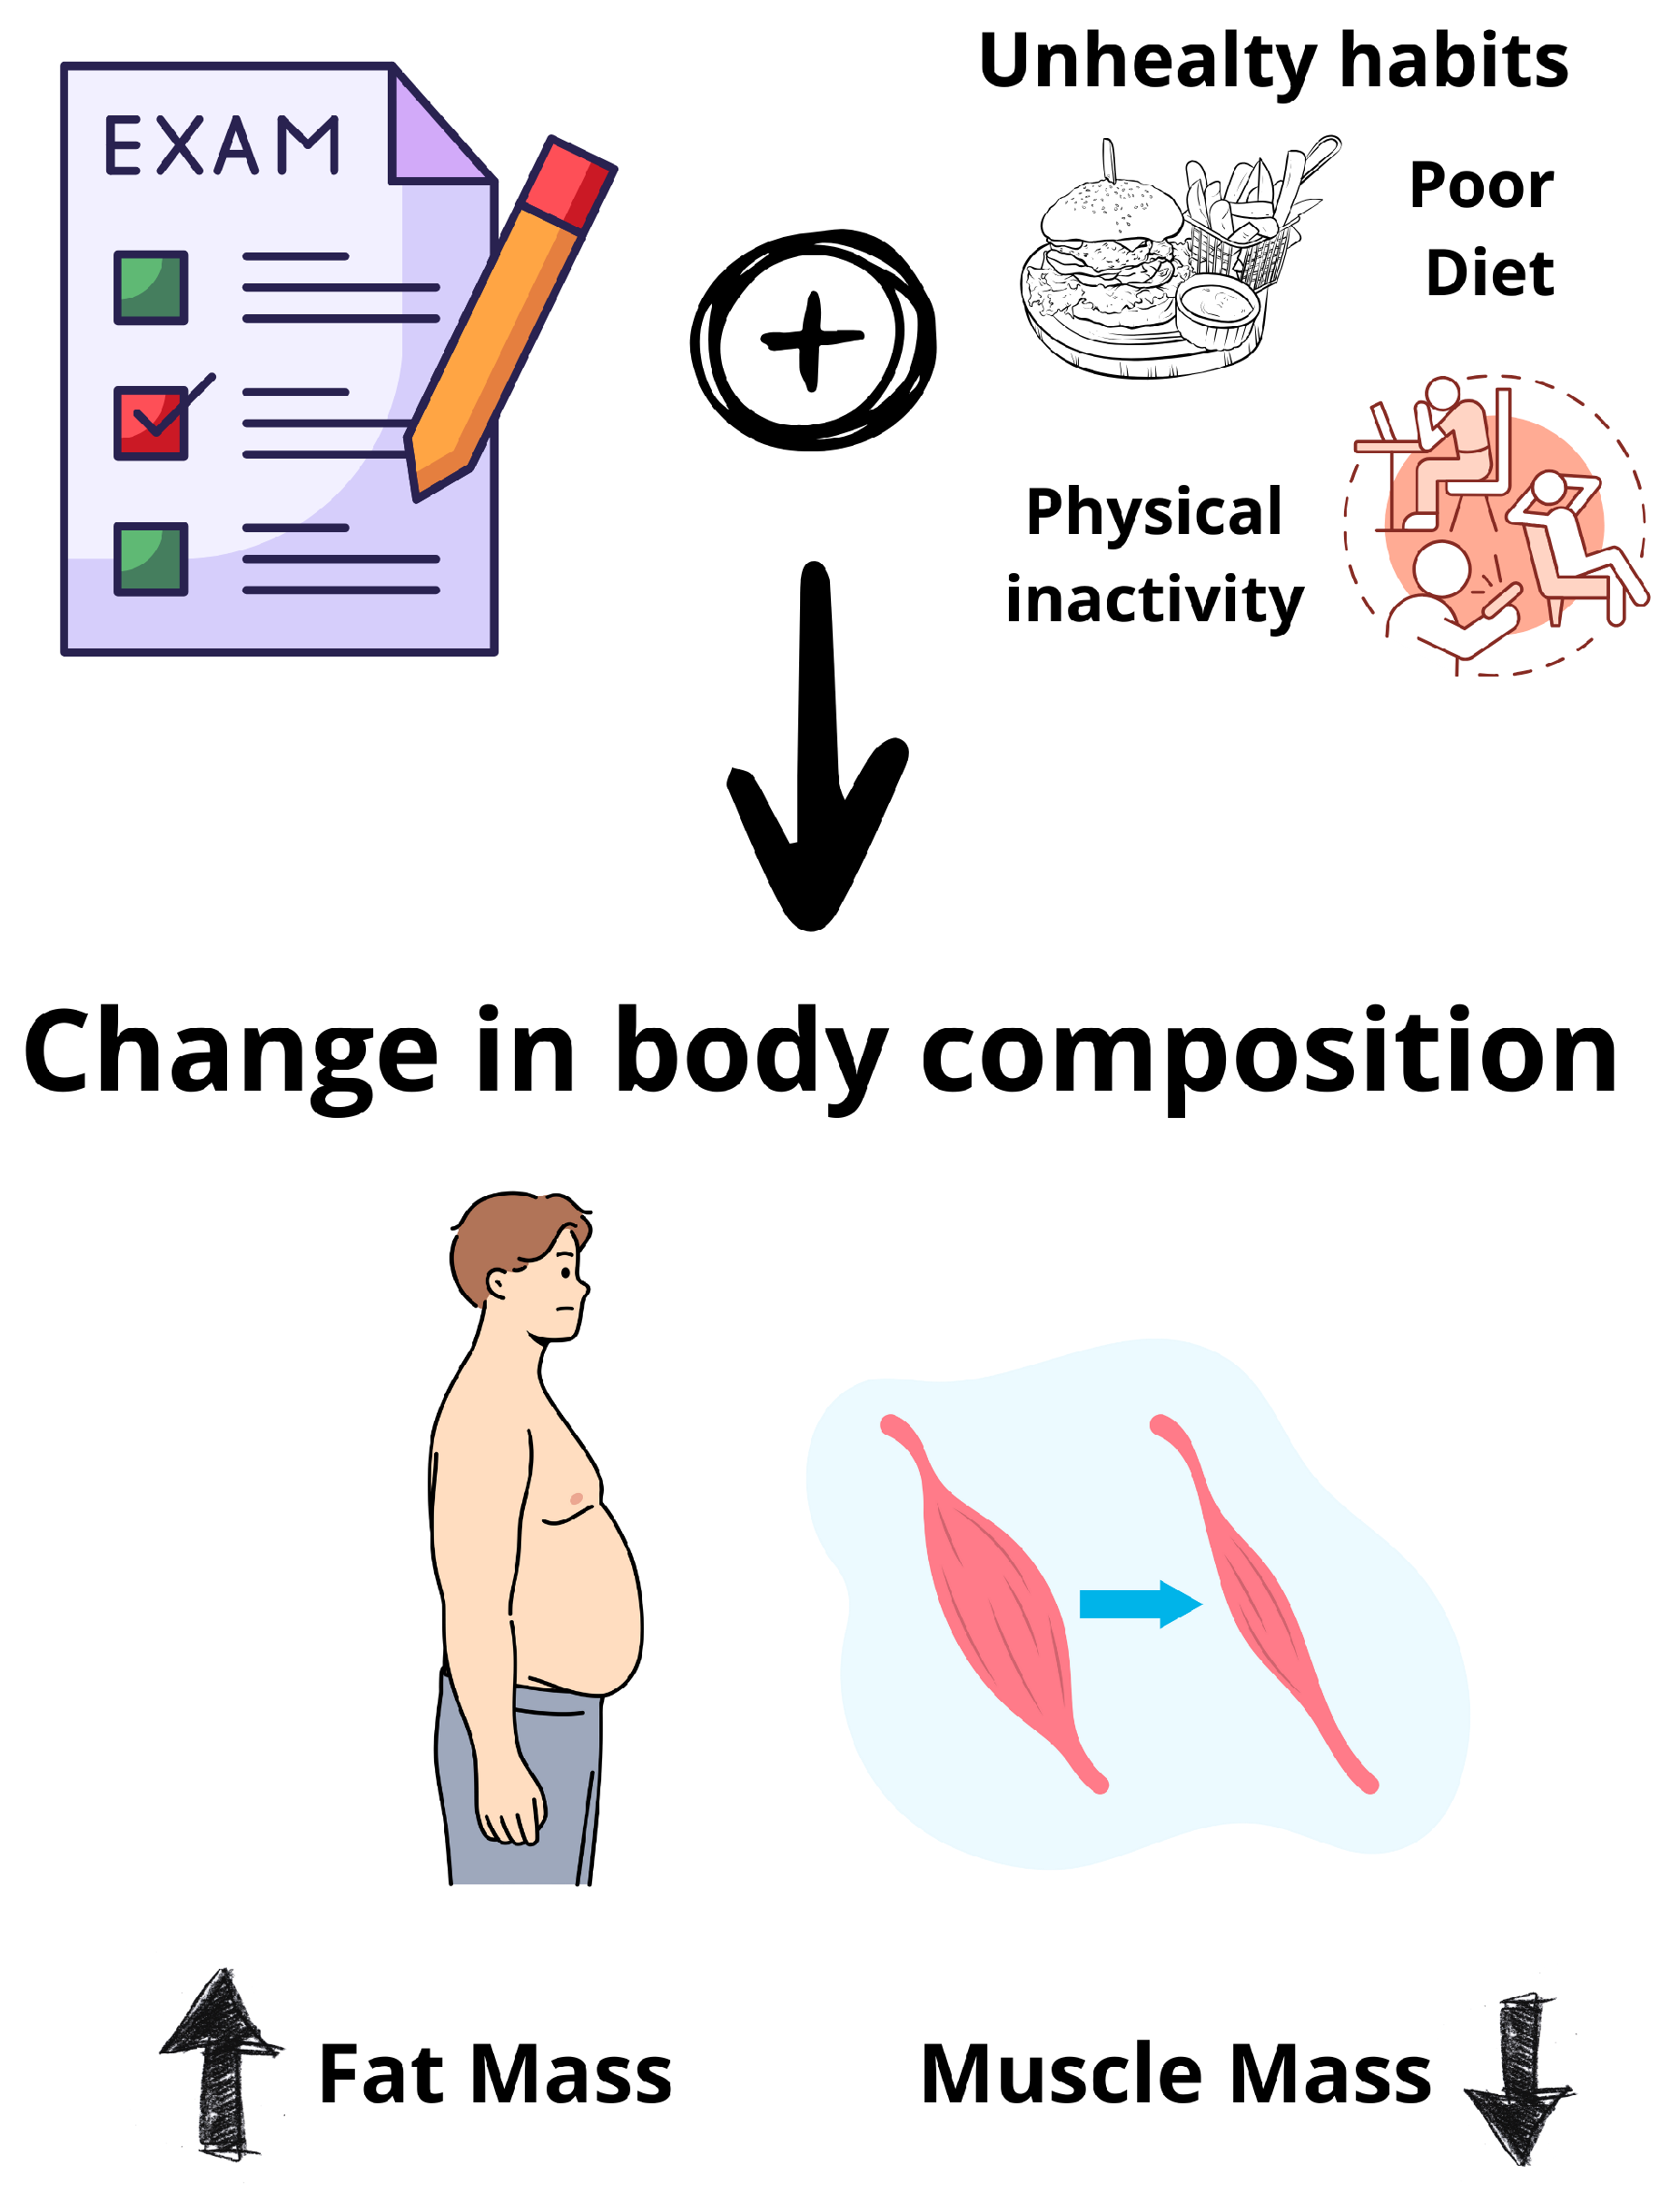
Table 1.
Demographic and clinical variables in the initial data collection phase before exam preparation.
Table 1.
Demographic and clinical variables in the initial data collection phase before exam preparation.
| n=142 | ||
|---|---|---|
| Age mean (SD) | 22.54 (7.38) | |
| Gender n(%) | Man | 30.00 (21.10) |
| Woman | 112 (78.90) | |
| Weight mean (SD) | 63.32 (10.79) | |
| Height mean (SD) | 165.89 (7.94) | |
| BMI mean (SD) | 23.04 (3.31) | |
| Fat mass mean (SD) | 26.07 (8.37) | |
| Body fat range n(%) | Low | 18.00 (12.70) |
| Moderate | 22.00 (15.50) | |
| High | 42.00 (29.60) | |
| Very high | 60.00 (42.30) | |
| Muscular Mass mean (SD) | 38.96 (5.37) | |
| Body muscular range n (%) | Low | 28.00 (19.70) |
| Moderate | 72.00 (50.70) | |
| High | 42.00 (29.60) | |
| Smoking habit n(%) | Yes | 28.00 (19.70) |
| No | 114.00 (80.30) | |
| Caffeine intake n(%) | Yes | 93.00 (65.50) |
| No | 49.00 (34.50) | |
| Daily cups of coffee consumption n(%) | Yes | 1.59 (0.76) |
| Cola drink consumption n(%) | Yes | 38.00 (26.80) |
| No | 104.00 (73.20) | |
| Energy drink consumption n(%) | Yes | 19.00 (13.40) |
| No | 123.00 (86.60) | |
| Fruit or juice consumption n(%) | Yes | 118.00 (83.10) |
| No | 24.00 (16.90) | |
| Intake of a second piece of fruit n(%) | Yes | 69.00 (48.60) |
| No | 73.00 (51.40) | |
| Daily intake of fresh or cooked vegetables (once per day) n(%) | Yes | 115.00 (81.00) |
| n=142 | ||
| No | 27.00 (19.00) | |
| Intake of fresh or cooked vegetables more than once daily n(%) | Yes | 73.00 (51.40) |
| No | 69.00 (48.60) | |
| Intake of fish 2–3 times per week n(%) | Yes | 84.00 (59.20) |
| No | 58.00 (40.80) | |
| Visits to fast food restaurants ( time per week) n(%) | Yes | 44.00 (31.00) |
| No | 98.00 (69.00) | |
| Legume intake more than once weekly n(%) | Yes | 127.00 (89.40) |
| No | 15.00 (10.60) | |
| Pasta or rice intake times per week | Yes | 55.00 (38.70) |
| No | 87.00 (61.30) | |
| Cereal or cereal-derived product consumption at breakfast n(%) | Yes | 106.00 (74.60) |
| No | 36.00 (25.40) | |
| Nut intake 2 to 3 times weekly n(%) | Yes | 81.00 (57.00) |
| No | 61.00 (43.00) | |
| Olive oil consumption n(%) | Yes | 150.00 (98.60) |
| No | 2.00 (1.40) | |
| Habitually skips breakfast n(%) | Yes | 19.00 (13.40) |
| No | 123.00 (86.60) | |
| Breakfast includes a dairy product n(%) | Yes | 115.00 (81.00) |
| No | 27.00 (19.00) | |
| Breakfast includes industrial pastries n(%) | Yes | 28.00 (19.70) |
| No | 114.00 (80.30) | |
| Intake of at least 2 yogurts daily n(%) | Yes | 66.00 (46.50) |
| No | 76.00 (53.50) | |
| Intake of sweets several times per day n(%) | Yes | 10.00 (7.00) |
| No | 132.00 (93.00) | |
| Nutritional score n(%) | Low quality | 4.00 (2.80) |
| Moderate quality | 69.00 (48.60) | |
| High quality | 69.00 (48.60) | |
| Days of vigorous physical activity, mean (SD) | 3.14 (1.40) | |
| Minutes of vigorous physical activity, mean (SD) | 253.49 (172.65) | |
| Days of moderate physical activity, mean (SD) | 2.91 (1.60) | |
| Minutes of moderate physical activity, mean (SD) | 189.79 (158.96) | |
| At least 10 consecutive minutes of walking in the past 7 days, mean (SD) | 6.32 (1.31) | |
| Minutes of walking per day, mean (SD) | 492 (404.31) | |
| Daily sitting time, mean (SD) | 394.51 (147.61) | |
| Exercise score n(%) | Low | 7.00 (4.90) |
| Moderate | 21.00 (14.80) | |
| High | 114.00 (80.30) |
Table 2.
Demographic and clinical variables in the second data collection phase, before and during exam preparation, with comparative analysis of results.
Table 2.
Demographic and clinical variables in the second data collection phase, before and during exam preparation, with comparative analysis of results.
| Before (n=72) | After (n=72) | p | ||
|---|---|---|---|---|
| Age mean (SD) | 21.94 (5.52) | 21.94 (5.52) | ||
| Gender n(%) | Man | 15.00 (20.80) | 15.00 (20.80) | |
| Woman | 57.00 (79.20) | 57.00 (79.20) | ||
| Weight mean (SD) | 64.14 (10.52) | 65.63 (11.96) | 0.489 | |
| Height mean (SD) | 165.83 (8.30) | 165.83 (8.30) | 1 | |
| BMI mean (SD) | 23.32 (3.45) | 24.10 (3.86) | 0.355 | |
| Fat mass mean (SD) | 25.43 (8.20) | 28.79 (8.35) | 0.016 | |
| Body fat range n(%) | Low | 18.00 (12.70) | 6.00 (8.30) | 0.028 |
| Moderate | 22.00 (15.50) | 6.00 (8.30) | ||
| High | 25.00 (29.60) | 14.00 (19.40) | ||
| Very high | 28.00 (38.90) | 46.00 (63.90) | ||
| Muscular Mass mean (SD) | 38.96 (5.37) | 39.70 (5.35) | ||
| Body muscular range n (%) | Low | 11.00 (15.30) | 35.00 (48.60) | <0.001 |
| Moderate | 35.00 (48.60) | 31.00 (43.10) | ||
| High | 26.00 (36.10) | 6.00 (8.30) | ||
| Smoking habit n(%) | Yes | 11.00 (15.30) | 11.00 (15.30) | 1 |
| No | 61.00 (84.70) | 61.00 (84.70) | ||
| Caffeine intake n(%) | Yes | 42.00 (58.30) | 45.00 (63.40) | 0.536 |
| No | 30.00 (41.70) | 26.00 (36.60) | ||
| Daily cups of coffee consumption n(%) | Yes | 1.60 (0.82) | 1.60 (0.82) | 1 |
| Cola drink consumption n(%) | Yes | 18.00 (25.00) | 22 (30.60) | 0.456 |
| No | 54.00 (75.00) | 50.00 (69.40) | ||
| Energy drink consumption n(%) | Yes | 8.00 (11.10) | 11.00 (15.30) | 0.460 |
| No | 64.00 (88.90) | 61.00 (84.70) | ||
| Fruit or juice consumption n(%) | Yes | 61.00 (84.70) | 59.00 (81.90) | 0.655 |
| No | 11.00 (15.30) | 13.00 (18.10) | ||
| Intake of a second piece of fruit n(%) | Yes | 38.00 (52.80) | 24.00 (33.30) | 0.018 |
| No | 34.00 (47.20) | 48.00 (66.70) | ||
| Daily intake of fresh or cooked vegetables (once per day) n(%) | Yes | 57.00 (79.20) | 49.00 (68.10) | 0.130 |
| No | 15.00 (20.80) | 23.00 (31.90) | ||
| Intake of fresh or cooked vegetables more than once daily n(%) | Yes | 31.00 (43.10) | 31.00 (43.10) | 1 |
| No | 41.00 (56.90) | 41.00 (56.90) | ||
| Intake of fish 2–3 times per week n(%) | Yes | 38.00 (52.80) | 35.00 (48.60) | 0.617 |
| No | 34.00 (47.20) | 37.00 (51.40) | ||
| Visits to fast food restaurants ( time per week) n(%) | Yes | 35.00 (48.60) | 38.00 (52.80) | 0.024 |
| No | 37.00 (51.40) | 34.00 (47.20) | ||
| Legume intake more than once weekly n(%) | Yes | 61.00 (84.70) | 57.00 (79.20) | 0.386 |
| No | 11.00 (15.30) | 15.00 (20.80) | ||
| Pasta or rice intake times per week | Yes | 29.00 (40.30) | 23.00 (31.90) | 0.298 |
| No | 43.00 (59.70) | 49.00 (68.10) | ||
| Cereal or cereal-derived product consumption at breakfast n(%) | Yes | 52.00 (72.20) | 53.00 (73.60) | 0.851 |
| No | 20.00 (27.80) | 19.00 (26.40) | ||
| Nut intake 2 to 3 times weekly n(%) | Yes | 39.00 (54.20) | 39.00 (54.20) | 1 |
| No | 33.00 (45.80) | 33.00 (45.80) | ||
| Olive oil consumption n(%) | Yes | 71.00 (98.60) | 68.00 (94.40) | 0.172 |
| No | 1.00 (1.40) | 4.00 (5.60) | ||
| Habitually skips breakfast n(%) | Yes | 10.00 (13.90) | 37.00 (51.40) | <0.001 |
| No | 62.00 (86.10) | 35.00 (48.60) | ||
| Breakfast includes a dairy product n(%) | Yes | 58.00 (80.60) | 53.00 (73.60) | 0.322 |
| No | 14.00 (19.40) | 19.00 (26.40) | ||
| Breakfast includes industrial pastries n(%) | Yes | 17.00 (23.60) | 33.00 (45.80) | 0.005 |
| No | 55.00 (76.40) | 39.00 (54.20) | ||
| Intake of at least 2 yogurts daily n(%) | Yes | 42.00 (58.30) | 40.00 (55.60) | 0.736 |
| No | 30.00 (41.70) | 32.00 (44.40) | ||
| Intake of sweets several times per day n(%) | Yes | 5.00 (6.90) | 21.00 (29.20) | 0.001 |
| No | 67.00 (93.10) | 51.00 (70.80) | ||
| Nutritional score n(%) | Low quality | 3.00 (4.20) | 17.00 (24.30) | <0.001 |
| Moderate quality | 36.00 (50.00) | 39.00 (55.70) | ||
| High quality | 33.00 (45.80) | 14.00 (20.00) | ||
| Overall dietary score n(%) | 7.55 (1.97) | 5.45 (2.14) | <0.001 | |
| Days of vigorous physical activity, mean (SD) | 3.10 (1.41) | 0.72 (1.07) | <0.001 | |
| Minutes of vigorous physical activity, mean (SD) | 229.02 (169.71) | 30.69 (60.25) | <0.001 | |
| Days of moderate physical activity, mean (SD) | 2.83 (1.63) | 1.15 (1.64) | <0.001 | |
| Minutes of moderate physical activity, mean (SD) | 196.17 (165.59) | 57.50 (125.03) | <0.001 | |
| At least 10 consecutive minutes of walking in the past 7 days, mean (SD) | 6.41 (1.11) | 3.79 (2.23) | <0.001 | |
| Minutes of walking per day, mean (SD) | 506.55 (391.85) | 168.83 (174.90) | <0.001 | |
| Daily sitting time minutes, mean (SD) | 408.24 (154.28) | 543.61 (237.48) | <0.001 | |
| Exercise score n(%) | Low | 3.00 (4.20) | 43.00 (59.70) | <0.001 |
| Moderate | 8.00 (11.10) | 21.00 (29.20) | ||
| High | 61.00 (84.70) | 8.00 (11.10) |
Table 3.
Relationship between diet quality and body composition.
| Fat | Visceral tissue | Muscle | |
|---|---|---|---|
| Low-quality diet (SD) | 30.10 (8.73) | 4.14 (2.51) | 35.16 (5.41) |
| Moderate-quality diet (SD) | 29.60 (7.35) | 3.57 (2.45) | 35.71 (3.94) |
| High-quality diet (SD) | 24.91 (10.29) | 2.78 (1.96) | 38.64 (5.16) |
Table 4.
Relationship between physical activity and body composition.
| Fat | Visceral tissue | Muscle | |
|---|---|---|---|
| Low-physical activity (SD) | 30.31 (7.72) | 3.90 (2.67) | 35.25 (4.51) |
| Moderate-physical activity (SD) | 26.40 (8.34) | 3.04 (1.77) | 37.81 (4.15) |
| Vigorous-physical activity (SD) | 26.95 (10.73) | 2.75 (1.58) | 37.33 (5.52) |
Disclaimer/Publisher’s Note: The statements, opinions and data contained in all publications are solely those of the individual author(s) and contributor(s) and not of MDPI and/or the editor(s). MDPI and/or the editor(s) disclaim responsibility for any injury to people or property resulting from any ideas, methods, instructions or products referred to in the content. |
© 2025 by the authors. Licensee MDPI, Basel, Switzerland. This article is an open access article distributed under the terms and conditions of the Creative Commons Attribution (CC BY) license (http://creativecommons.org/licenses/by/4.0/).
Copyright: This open access article is published under a Creative Commons CC BY 4.0 license, which permit the free download, distribution, and reuse, provided that the author and preprint are cited in any reuse.


