
Submitted:
13 February 2025
Posted:
13 February 2025
You are already at the latest version
Abstract
Dietary habits significantly influence students' health status, with overweight and obesity posing serious global challenges linked to chronic diseases like type 2 diabetes and cardiovascular conditions. Our cross-sectional study assessed overweight and obesity prevalence among students in Guarda, Portugal, analysing the nutritional and lifestyle habits of 2,083 students aged 6 to 58 years. The sample included 1,762 school children and 321 higher education adults, grouped into age intervals: 6–12, 12–19, 20–39, and 40–58 years. BMI analysis revealed obesity rates of 9.1% in children and 9.7% in adults, with younger children, particularly males, showing higher rates compared to older children. Increased physical activity and reduced sedentary time were correlated with a lower BMI. These findings underscore the critical need for public health interventions in schools to promote healthy diets and active lifestyles, aiming to reduce obesity rates and associated health risks.
Keywords:
overweight and obesity
; Body Mass Index
; student health status
; eating behaviours
; epidemiology
1. Introduction
The dietary and lifestyle habits of students play a fundamental role in their overall health and development [1]. There has been a marked decrease in physical activity levels among children and adolescents, partly due to increased screen time and sedentary behaviours [2,3]. Lifestyle changes among students need to be understood, in order to promote early interventions to prevent obesity and reduce the risk of having chronic diseases later in life [4].
Obesity and overweight are among the most significant public health challenges facing the modern world [5,6]. Defined by the World Health Organization (WHO) as an abnormal or excessive fat accumulation that may impair health, obesity is linked to numerous non-communicable diseases (NCDs), including type 2 diabetes, cardiovascular diseases, hypertension, and certain types of cancer [5,7]. The global burden of NCDs linked to obesity continues to increase, with recent forecasts predicting that, if trends persist, over 1.31 billion people worldwide will have diabetes by 2050 [8,9]. Type 2 diabetes has been increasing among children and adolescents and can lead to severe complications such as atherosclerotic cardiovascular disease, stroke, myocardial infarction, renal insufficiency, neuropathy, vasculopathy, or retinopathy leading to blindness [10,11]. Cardiovascular diseases, including heart disease and stroke, are also more prevalent among obese individuals, contributing to higher mortality rates [12]. The incidence of cardiovascular events is expected to more than double in the next decade in some countries [13,14]. The number of obesity-related cancer cases is projected to exceed 2 million globally by 2070 [15]. Obesity is also linked to various musculoskeletal disorders, including osteoarthritis, which can cause chronic pain and disability [16]. Additionally, obesity can lead to psychological problems, such as depression, anxiety, and low self-esteem, particularly among children and adolescents [17].
The commonness of obesity has reached alarming levels globally. According to the WHO, the prevalence of obesity has more than doubled since 1990. In 2022, more than 2.5 billion adults were overweight, and of these, over 890 million were obese. Similarly, in the same year, 37 million children under the age of five were overweight or obese [5]. In 2019, in Portugal, 17% of adults was classified as obese, a proportion slightly above the EU average of 16% [18]. According to the Childhood Obesity Surveillance Initiative (COSI) conducted in Portugal, although there has been a reversing trend in the prevalence of childhood obesity and overweight (-8.3% between 2008 and 2019), one in every three children is still overweight, and 10.6% are obese [19]. These trends indicate a public health crisis that requires urgent and comprehensive intervention.
Body Mass Index (BMI) is a widely recognized tool used to classify individuals' weight categories and assess potential health risks associated with body weight. It is a simple measure derived from a person’s weight relative to their height and it is typically used to categorize weight status, identifying if someone is underweight, normal weight, overweight, or obese [20]. Overall, BMI is an essential tool in public health for monitoring population weight trends and it serves as a valuable indicator for healthcare professionals to initiate discussions about nutrition, physical activity, and lifestyle choices that contribute to overall well-being [21].
Considering this evidence, our study focuses on the nutritional and lifestyle habits of students in the city of Guarda, Portugal, and estimates the prevalence of overweight and obesity among students. In addition, our research aims to identify contributing factors to obesity and propose effective strategies to combat this growing health concern. The findings will provide insights into the current state of student health in Guarda and allow to contemplate future public health initiatives aimed at reducing obesity rates and improving overall well-being.
2. Materials and Methods
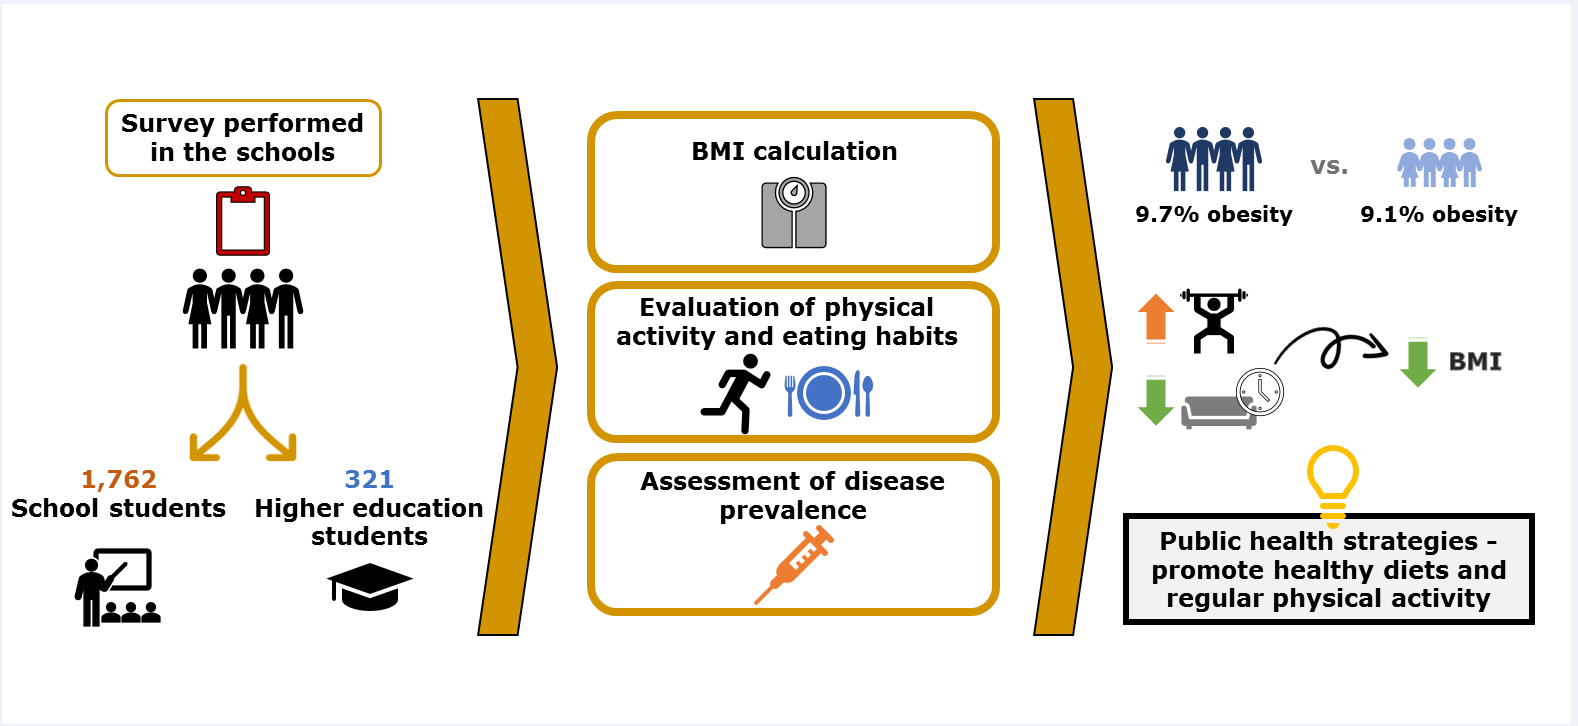
To assess the nutrition and associated behaviours among students from various educational levels (1st to 12th grade and higher education), a cross-sectional study (Figure 1) was conducted from January to July of 2024. The study focused on two groups of schools, namely, (1) Agrupamento de Escolas Afonso de Albuquerque and (2) Agrupamento de Escolas da Sé, and one higher education institution, (3) Instituto Politécnico da Guarda, located in Guarda, Portugal. Initially, a comprehensive survey was developed [22], which included questions related to demographics, physical activity, sleep, sedentarism, dietary habits, substance consumption and health status (Supplementary Figure S1). Ethical approval was obtained from the Ethical Commission of the XXX (Document no. 8/2024) on 21 May 2024.
A total of 3,599 surveys were distributed to the entire target population, the students in the two school groups, provided in both paper or online formats and with a prior request for parental permission to participate. Out of the 3,599 distributed surveys, 1,950 responses were received. After a meticulous validation process, 1,762 responses were deemed valid, resulting in a response rate of 54%, since the remaining participants did not have authorization from the parents to participate or did not complete the survey in its entirety. Regarding the higher education, a survey link was shared with 2,483 students. From this cohort, 321 students completed the survey, with a response rate of 13%. All responses to the survey were collected anonymously and kept confidential to ensure privacy of the participants and encourage honest and accurate reporting.
The collected data was separated in the following age groups: children and adolescents (from 6 to 19 years old) and adults (over 19 years old) [5]. The study was stratified in age intervals (5-12 years, 13-19 years, 20-39 years, 40-59 years). We defined overweight and obesity using the Body Mass Index (BMI) for each participant, which was calculated based on the reported height and weight, using the following formula:
BMI categories for adults were defined as: underweight (<18.5), normal weight (18.5–24.9), overweight (25–29.9), and obese (≥30, with further classes for obesity) (Table 1). For children and adolescents, BMI is age- and sex-specific, following WHO guidelines that use percentiles: healthy weight (15th–85th percentile), overweight (85th–97th percentile), obese (>97th percentile), and thinness (<15th percentile) [24,25]. This approach accounts for varying growth patterns and maturity rates.
As for the frequency of physical activity practice, it was classified as low if the individual exercises less than twice per week, as moderate if three to four times per week and heavy if more than five times per week, since the WHO recommends practising vigorous-intensity physical activity at least 3 days per week [27].
Statistical Analysis
Data collected from the surveys was organized and analysed using IBM SPSS Statistics version 29.0.0.0 for Windows. An exploratory analysis of the data was performed using frequency distributions, graphical representations, box plots and descriptive measures (mean, median, quartiles, standard deviation, minimum, maximum). The statistical analysis included the Fisher’s exact test, chi-square tests and Independent Samples t-test to examine associations between BMI, demographic factors, dietary habits and physical activity. When appropriate, the Relative Risk (RR) was used to quantify the probability of an event occurring in the exposed group compared to its probability in the non-exposed group. Mann-Whitney U test and the Spearman's Coefficient (SC) were applied for non-parametric and correlation analyses, respectively. Lastly, binary logistic regression was used to identify factors associated with BMI categories. The 95% Confidence Intervals (CI) was carried out in situations where it was considered relevant to the study. In the statistical analysis of the results, a significance level of 5% was considered.
3. Results and discussion
3.1. Demographic Data
Regarding children and adolescents, the results included 1545 individuals, of which 43.4% are male and 56.6% are female. This group includes 63.6% of children aged from 6 to 12 years old and 36.4% adolescents from 13 to 19 years old. 41.4% of answers are from the first cycle of education (1st to 4th grade), 17.4% belong to the second cycle (5th to 6th grade) and 18.1% to the third cycle (7th to 9th grade). 16.3% of the students are currently in high school (10th to 12th grade) and a percentage of 6.7% is enrolled in higher education.
We obtained data from a group of 217 adult students, from a higher education institution, that included 35% males and 65% females. From the participants, 93.5% belong to the age interval of 20 to 39 and 6.5% are 40 to 59 years old.
3.2. Prevalence of Overweight and Obesity Among Students
After the calculation of the BMI, we found that the prevalence of overweight among the children and adolescents is 17%, while 9.1% are obese (Figure 2a). A high percentage of students has a normal weight (70.1%). In Portugal, according to the COSI study, in 2021/2022, the prevalence of excess weight for children was 31.9%, from which 13.5% were obese [19]. Data from the COSI study in 33 countries from the European Region reveals a 29% prevalence of obesity in children aged 7 to 9 years old [28].
According to the collected data, 17.5% adults are overweight, while 8.3% suffer from class I obesity, 0.9% are class II obese and 0.5% have morbid obesity. It was observed that 68.7% of adult students fell within the normal weight range (Figure 2b). A study with European college students from the Western Balkans describes a prevalence of 12% of overweight and 2.3% obesity [29]. According to the WHO European obesity report from 2022, obesity affects almost 60% of adults [30].
3.3. Weight Status According To Sociodemographic Characteristics And Life Habits Of The Students
A dependency was found between sex and the weight classification (P < 0.001), according to Fisher’s exact test. Following this information, Table 2 represents the prevalence of some characteristics and life habits in females and males aged from 6 to 19 years old, in relation to their weight status, according to the BMI. In male children and adolescents, variations in BMI classification are observed across different age groups, showing a statistically significant relationship between BMI and age. Boys aged 6 to 12 show a higher prevalence of overweight and obesity, at 33.4%, compared to boys aged 13 to 19, who show a prevalence of 25.8% (P = 0.05). A similar trend is seen among female children, where 27.4% of girls aged 6 to 12 are overweight or obese, whereas this prevalence decreases to 15.0% in girls aged 13 to 19 (P < 0.001). Furthermore, an Independent Samples t Test confirmed that overweight/obese children tend to be younger in both male (P < 0.001; t(472.223) = 2.732) and female students (P < 0.001; t(376.01) = 5.171). Accordingly, data from the WHO in Europe 2022 reveals that one in three school-aged children are overweight or obese, while in 10-19 years the prevalence decreases to one in four [30]. These findings suggest that younger children are more susceptible to higher BMI, which is worrying, potentially due to variations in physical activity levels [31]. Younger children may not be as involved in structured physical activity as adolescents, who possibly participate in school sports and extracurricular activities more often. In fact, we found a statistically significant positive and weak relationship between age and frequency of physical activity for both sexes (female: SC=0.095, P = 0.005; male: SC=0.340, P < 0.001), this indicates that adolescents practice more exercise than younger children.
The frequency of weekly physical activity also shows a correlation with BMI classification (male: P = 0.031; female: P = 0.002). The Mann-Whitney Test confirmed that males with low physical activity have a higher prevalence of overweight/obesity (34.3%) compared to those with moderate (32.3%) and heavy physical activity (22.4%) (U = 42 954.5; P = 0.024). Similarly, females with low physical activity had a 26.3% prevalence of overweight/obesity, while those with moderate and heavy physical activity had 19.3% and 11.9% respectively (U = 57 423.5; P = 0.002). This suggests that higher physical activity levels are associated with lower rates of overweight and obesity in both sexes, which is in accordance with previous studies. A systematic review of longitudinal studies found that individuals with higher physical activity levels had a significantly reduced risk of developing obesity compared to those with lower activity levels, with a lower risk of developing coronary heart disease or diabetes [32]. The Rotterdam Study, a large-scale study involving middle-aged and elderly adults, found that higher levels of physical activity significantly reduce the risk of cardiovascular disease associated with overweight and obesity [33]. The results suggest that female children that are overweight/obese spend more time sitting down during the week, (SC= 0.067, P = 0.049), which is consistent with what was mentioned above, since spending more time sitting down logically implies less physical activity.
However, among the individuals who have a low frequency of physical activity, a substantial proportion maintains a healthy weight. We need to consider the interaction with other factors, such as genetic predisposition or metabolic rates.
Regarding disease incidence, there is an association between the weight status and having been diagnosed with diseases in males (P = 0.035). According to our following tests, the incidence of health conditions among overweight or obese boys is 1.27 times higher than the incidence of health conditions among boys with a normal weight (RR = 1.27; 95% CI: 1.0 – 1.6). A relationship between obesity and health complications has been intensively described before. Studies show that obese children are more likely to be diagnosed with diseases such as mental disorders, gastrointestinal disorders, metabolic syndrome, insulin resistance and non-alcoholic fatty liver disease [34,35,36]. Another study showed that children who are morbidly obese have even higher prevalence of diabetes/prediabetes and use more medications for asthma than obese children [37].
Lastly, we found an association between the consumption of food supplements and the weight status in male children (P = 0.036). Further tests determined that the incidence of overweight/obesity among boys who consume supplements is 1.4 times higher than the incidence of overweight/obesity among those who do not consume supplements (RR = 1.4; 95% CI: 1.1 – 1.9). A possible explanation could be the inappropriate usage of these products, coming from the parents’ erroneous assumption that the children need to take supplements to boost their growth, when in fact they don´t need them. Inappropriate usage of supplements may increase a child's calorie consumption without making up for real nutritional needs, which might result in weight gain. However, since the numbers found do not imply a direct cause-and-effect relationship, it is also possible that obese or overweight students are taking supplements to aid in weight loss, which could explain the higher incidence [38].
For other variables, there were no relations with the weight status of the children. Therefore, there was no significant relationship between the sleep and the weight status of children. However, the descriptive data analysis suggests that the people that sleep less tend to be overweight, with 44.4% of the males who sleep less than 6 hours per day being overweight or obese, compared to 30.5% who sleep 6 hours or more. For females, the percentages were, respectively, 25.0% and 22.2%. A study analysed data from the National Health Interview Survey in the US and stated that individuals who sleep less than the recommended 7-8 hours per night have significantly higher odds of being overweight or obese, increasing in the past years. Short sleepers (5-6 hours per night) had a 57% greater risk of obesity, while very short sleepers (less than 5 hours per night) were twice as likely to be obese compared to those who get adequate sleep [39]. Although no significant relationship was found between sleep duration and the weight, it is important to consider that we did not evaluate directly the sleep quality. Research suggests that the quality of sleep plays a significant role in weight management, disrupting the metabolism and increasing appetite which might lead to weight gain and obesity [40].
The characteristics of adult students were categorized similarly (Table 3). Among males aged 20-39, 30.0% were overweight/obese, compared to 24.1% of females in the same age group. The sample size for the 40-59 years old group was not relevant.
A relationship between smoking and weight was found in women (P = 0.002). The incidence of obese woman is much higher in the smoking group (48.1%) than in the no smokers’ group (18.4%). The relative risk of being obese/overweight in the group of women who smoke is 2.6 times the risk in the group of non-smokers (RR = 2.6; 95% CI: 1.5 – 4.5). Studies suggest that the relationship between smoking and obesity may vary with age and smoking intensity. Younger or heavy smokers tend to show higher rates of obesity, while older or light smokers are more likely to exhibit lower BMIs, often attributed to the appetite-suppressing effects of nicotine [41,42]. However, given the small sample size of the smoking group in our study (only 27 smokers out of 141 women), this estimate lacks precision, and no definitive conclusions can be drawn. Larger studies are needed to clarify these results.
Alcohol consumption was significantly associated with the weight status among adult males, with 46.9% of those who consumed alcohol being overweight/obese compared to 22.7% of non-drinkers (P = 0.047). This association suggests that alcohol consumption may be a significant risk factor for overweight and obesity. However, previous research seems to lack consensus on this relationship. A review about alcohol and obesity stated that moderate alcohol consumption does not appear to be a significant risk factor for obesity, while heavy drinking and changes in alcohol consumption patterns can possibly contribute to weight gain and obesity. However, long-term effects and gender-specific responses are not yet well understood [43]. In another study of the Irish population, the individuals who drank heavily were more likely to be obese (high BMI and large waist circumference (WC)), but binge drinkers were more likely to have a larger WC and frequent alcohol consumers were less likely to be obese, suggesting a complex relationship between alcohol use and body weight [44].
The last variable that showed a significant relationship with the weight status was the consumption of supplements for memory enhancement in males. Among male students who use this kind of supplementation, 61.5% are overweight or obese (P = 0.024). However, even though the difference seems to be large, the small number of participants using memory aid supplements (13 men and 26 women) does not allow us to draw conclusions about this relationship
The findings highlight critical relationships between weight status and several factors, such as age, physical activity, and lifestyle habits. Younger children, especially boys, demonstrate higher rates of overweight and obesity. Physical activity is strongly associated with healthier BMI in both male and female children, reinforcing the need for an active lifestyle. Although correlations with supplement intake, smoking, and alcohol consumption were observed, the limited sample sizes in some categories limit the conclusions.
Other factors should be considered when evaluating a population’s habits and health outcomes. The socioeconomic status, for example, is one of the factors that can influence dietary habits (for example, higher consumption of more affordable energy dense foods) and access to physical activity resources, possibly influencing behaviours and, consequently, the prevalence of obesity and overweight [45]. Furthermore, psychological variables like academic stress (which can lead to depression and anxiety) may have an indirect impact on weight, by influencing certain behaviours like the practise of regular exercise or affecting sleep [46].
It is important to sensitise parents, in an educational way, about the importance of balanced diets and regular physical activity for their children. Schools should implement programs that encourage active play and provide nutritious meals, promoting healthier habits from a young age. Furthermore, community-based programs that provide access to nutritious foods and exercise opportunities could enhance children's health outcomes and support the fight against the rising incidence of childhood obesity.
3.4. Food Habits of the Student Community
We then analysed the frequency of food consumption among children and adults, identifying notable trends. Regarding children (Figure 3a), in the cereal, sugar and sweets category, the preferred foods are white bread, breakfast cereals and cookies, with a median consumption of about 2 to 4 days per week. The consumption of bread shows a wide distribution among children. Whole wheat bread is less consumed than white bread, with a lower distribution, showing that a higher percentage of children does not consume this type of bread. In western diets, it is an often practice to consume bread in breakfast, sandwiches, snacks, and other. However, whole wheat bread should be chosen over white bread for its content in whole grains, which have been associated with lower BMI [47].
Whole grains, being a source of fibres, vitamins, minerals, phenolic compounds and other important components, have been related to health benefits and improvement of insulin sensitivity [48]. Cakes and salted snacks are consumed moderately by most children, with a median of 1 to 3 days per month. Perhaps they are associated with special occasions, and they are considered unhealthy foods, leading to a limited consumption. Salted snacks show a few outliers with more frequent consumption, which could be of concern regarding unhealthy eating habits. Honey has the lower frequency (median at less than once per month), suggesting it might not be such a common ingredient in children’s diets.
Regarding fruit and vegetables, fruits and soups are being consumed regularly, up to 2 times in the same day. Some outliers can be noticed in the fruit category, showing that some children still do not include fruits in their diets. Natural fruit juices are consumed less often by children, which could possibly reflect the growing awareness among parents of the higher sugar content of these fruit products or due to the increased time and effort that the preparation of these juices requires. The World Health Organization recommends a daily intake of at least 400 g (5 portions) of fruit and vegetables, in order to prevent noncommunicable diseases (NCDs), such as diabetes, cancer, heart disease and stroke [26,49].
In the meat section, it is noticeable that the consumption of red and white meat is consistent, given the median of about 2 to 4 times per week, but 50% of the participants eat each one less/more than 2 to 4 times per week. This could mean that the meals include a balance between the two types of meat, however, there is a wider distribution for the red meat, with more children consuming less but also more often. Given the health risks associated with the higher levels of saturated fats in these products, consumption of red meat needs to be moderated, having been linked to a higher risk of cardiovascular disease development [50]. The more consistent consumption pattern of white meats, may reflect an inclination of the parents towards healthier and leaner proteins, recommended by nutritional guidelines [51]. Processed meats have a slightly lower consumption with 50% of participants doing so between one to three days per month, and 1 day per week (median), which is positive, given the known health risks associated with processed meats, such as their high sodium and saturated fat content and the presence of preservatives like nitrates, which have been linked to increased risk of breast, colorectal, colon, rectal and lung cancers [52]. Consuming less than 500 g of red meat per week and no to little processed meat is advised by the World Cancer Research Fund (WCRF) [53]. The UK Scientific Advisory Committee on Nutrition (SACN)’s advised for the consumption of red and processed meat fewer than 70 g per day [54].
While fish seems to be present in the diets of children, it is not consumed as frequently as meat. Clearly, there is a general tendency to prioritize meat consumption over fish. Fatty and lean fish are consumed in a median of once per week, with 50% of participants doing so less than once per week. Both types of fish should be included in the diets of children, particularly, fatty fish, including salmon and mackerel. These fishes are rich in omega-3 fatty acids, essential for brain development and health [55,56]. Shellfish has the lowest consumption frequency, with most children consuming it less than once per month, possibly due to the high costs of this type of food, availability questions or even the distinctive and strong taste that might not be too appealing for younger palates.
Eggs are generally consumed around 2 to 4 days of the week by most children, with a narrow distribution, which is in accordance with European recommendations for moderate egg consumption by children [57].
Milk and yogurt stand out as the most frequently consumed dairy products. Milk has a median consumption of once per day, having a significant role in children’s diets. Daily intake is recommended by European guidelines for a healthy diet [58] as a source of calcium and protein. The consumption of cheeses is far less frequent, and soy alternatives show almost no consumption. Plant-based dairy alternatives are not yet widely adopted by children, most likely being consumed more often in households with specific restrictions.
While sugary sodas and juices are present in children’s diets, their consumption is moderate, with a median of 1 to 3 days per month, which suggests an awareness of their health impacts. Outliers indicate that a small part of the community can be consuming these drinks as often as in a daily dose, which is concerning due to their sugar content. Given the extensively studied relationship between free sugars intake and obesity and dental caries. The WHO recommends a reduction of the consumption of these sugars, to less than 10% of the total energy intake, if possible, under 5% of the total energy intake, for children and adults [59]. The consumption of light juices and sodas is even less frequent, with some outliers that could indicate the presence of some concerns and awareness about sugar intake.
The total distribution of tea and infusions consumption, which ranges from once a month to every day, suggests that they occasionally drink them, maybe as a result of their health benefits. Coffee and coffee substitutes show no significant consumption among children, as expected and recommended. Caffeine is not advised for children consumption, since their potential negative effects in younger populations are yet unknown [60].
Fast-food showed a relatively low median, with consumption frequency of one to three times per month, with 50% of participants doing so less times, indicating that it is viewed as occasional treat instead of a regular meal option. However, some outliers are concerning, with some children possibly consuming fast food on a daily basis. Fast-food meals have a higher content of solid fat (23.9% of total energy) than foods from retail stores (17.6%) or schools (20.9%) [61]. Also, the consumption of these foods is also often associated with consumption of sweetened beverages and lower intake of vegetables, fruit and milk, increasing total energy intake and leading to a poor-quality diet [62,63]. Some families may rely on this type of meals due to their convenience, accessibility and socioeconomic factors [64].
The trends for adults are very similar, with a few exceptions (Figure 3b). Regarding the first food group, the adults eat breakfast cereal, cookies and other sweets slightly less frequently than children’s students. Given that these products are frequently more closely linked to children and are widely promoted to younger audiences, this outcome is to be expected. Adults may also avoid these snacks, since they can be more conscious of their dietary choices.
Regarding vegetables and fruits, adult students seem to consume all the categories (fruit, soup, fruit natural juices and cooked vegetables) slightly less often than the children. Adults might be more likely to choose quicker and less nutritious options due to time constraints, while children may have more balanced meals with more structured mealtimes at school or home. Additionally, schools and parents tend to promote the consumption of fruits and vegetables as part of healthy eating habits for children, while adults may not receive the same external encouragement or monitoring. Socioeconomic factors could also play a role, limiting the access to fresh produce for some adult students.
Adults consume eggs at a more varied frequency than children, ranging from daily intake to no consumption, perhaps due to some dietary restrictions. The median frequency of consumption of light sodas and juices is slightly higher in adults, who may choose these beverages as an effort to manage weight or reduce sugar intake, which typically is not often a concern of children.
The consumption of coffee among adults is frequent, with a median of 4 to 6 days per week. The frequency has a high diversity, with 75% students drinking from zero to one time per day. However, coffee is a regular part of the daily routine of adults, with 25% of the students drinking coffee every day, from one to two or more times per day. Coffee, as a major source of caffeine, is well-known for its stimulating effects that help with concentration, fatigue management and alertness, which are particularly important for students in their demanding studying schedules. Coffee also has a role in adults’ social and work environments, often being a central part of routine and social gatherings, which is a particularly common practice in Portugal. Improving of attentiveness and the taste of caffeine products are the main reasons for their consumption in the country [65]. Adding to the energy related benefits of coffee, moderate consumption as health benefits giving its content in antioxidants, which has been linked with a reduced risk of diseases such as Parkinson and Alzheimer [66]. However, high caffeine intake has been associated in students with negative health effects, such as depression, anxiety and sleep issues [67].
Statistically, we did not find any relevant associations between the consumption of certain groups of food and the weight status of the students (Supplementary Figures S2 and S3). Cooked vegetables show a P-value of 0.029 for children and 0.016 for adults. Adding cooked vegetables to meals may significantly increase the daily vegetable intake of the individuals, beyond other vegetable sources such as soup. Vegetables are a good source of essential vitamins, minerals, and fibre, which promote satiety and help regulate caloric intake, which can help maintaining a healthy body weight [68]. However, other foods within these two food groups did not show significant differences between the weight groups, indicating the absence of a consistent trend across them. We also found a significance for coffee (P = 0.003) and for tea and infusions (P = 0.034) in the case of children, however, these beverages are not often consumed by them, particularly coffee, which limits the relevance of this finding. For the adults, we also found a significance for coffee consumption (P < 0.001). An association between a higher BMI and the consumption frequency of coffee (Spearman’s correlation coefficient = 0.260; P < 0.001) has been observed. The literature did not provide any evidence of an association between caffeine consumption and weight changes. We should consider examining whether individuals drink their coffee with sugar or not, as this could lead to an increase in daily caloric intake, which can be a possible explanation for weight gain related to coffee consumption. A study about coffee intake inversely associated an increase in intake of unsweetened caffeinated and decaffeinated coffee with weight gain [69].
Lastly, there is significance for the adults in the soy alternatives (P = 0.030), but the consumption of these foods is not significant for this group. While these few values show significance, they are not enough to suggest meaningful associations between food consumption and the weight status of the students.
3.5. Disease Incidence In The Student Community
Lastly, we analysed the incidence of diseases in the student community, through questioning the students if they have ever been diagnosed with any disease. Firstly, we found that 66% of the children have never been diagnosed with health problems before, and 34% have been diagnosed with at least one (Table 4). These results are a positive indicator of general health in the community. The most prevalent diseases found among the community of children and adolescent students were allergic (18.1%), pulmonary (8.2%), skin (7.9%), gastrointestinal (3.4%) and mental diseases (2.4%). Furthermore, we found no significant association between the diagnosis of any of the diseases and the weight status (Supplementary Figures S4-S8). An association between the age and the diagnosis of diseases was observed, with older children having a higher disease incidence than younger ones (U = 201381.5; Z = -8.019; P <0.001).
Regarding adult students, 55.8% has been diagnosed with one or more diseases before, while 44.2% has not. The most common diseases among this group, similarly to the children, are allergic (32.7%), pulmonary (11.1%), skin (10.1%), mental (9.2%) and gastrointestinal diseases (7.8%). In this case, we found a significant relationship between the weight status and the diagnosis of pulmonary diseases (P = 0.03) (Supplementary Figures S9-S13). When we calculate the relative risk, we can observe that the incidence of pulmonary diseases in the overweight/obese group is 2.3 higher than the underweight/normal group. A higher BMI is associated with reduced lung volume, which can manifest as a restrictive ventilatory pattern on spirometry, including reductions in expiratory reserve volume and functional residual capacity. Obese individuals may also experience decreased vital capacity, total lung capacity, and altered expiratory flow rates due to increased residual volume and airway resistance. Clinically, these patients tend to have a higher respiratory rate, leading to increased oxygen consumption [70].
An allergy epidemic has been blooming, with increased prevalence of atopic diseases such as allergic rhinitis, asthma, food allergies, conjunctivitis and atopic dermatitis, attributed to factors like diet, the hygiene hypothesis (reduced exposure to microbes early in life), air pollution, climate change and urbanization [71]. A cross-sectional study from primary schools in Belgium 2019 describes a prevalence of allergic rhinitis of 29.3%, with asthma being the most significant related comorbidity [72]. According to Asher M. et al. (2020), asthma is the most frequent chronic disease among children, worldwide. A systematic review from 2023 describes that prenatal and early-life exposure to traffic-related air pollution can significantly increase the risk of allergic rhinitis in children [73]. This explains why the allergic, pulmonary and skin diseases stand out in our study, with environmental pollutants probably playing an important role.
3.6. Logistic Regression Model
Lastly, we performed a binary logistic regression model to analyse all the variables in our study in relation to the BMI, separately for children and adults. The pre-requisites for performing the model were verified in both cases, and no multicollinearity was found between the independent variables, meaning that the variables used in the model are not highly correlated. Additionally, no outliers were identified in the model and there is a sufficient number of records per variable. The model performed 5 steps for the children’s data and 6 for adults.
The analysis used the Forward method, revealing low R2 values (Table S1), which indicates moderate predictive capacity. In our case, this may not be critical, as our primary objective is to identify associations between dependent and independent variables rather than to make precise predictions.
The Hosmer-Lemeshow test indicated that the model is adequate, in both cases, with a significance value of 0.267 for children and 0.365 for adults, which is higher than the significance level of 0.05. This suggests that the model satisfactorily explains the dependent variable (obesity/overweight) with the independent variables.
In line with our previous analysis, the model presented some significant relationships. Regarding children (Table 5), the likelihood of overweight/obesity decreases with age (B = -0.137) indicating 12.8% of reduction in the odds if obesity per year (Exp(B) = 0.872). The amount of sleep was associated with a lower probability of obesity (B = -0.561). Sleeping more hours reduces the likelihood of obesity by 42.9% (Exp(B) = 0.571). A positive coefficient (B = 0.288) suggests that more time sitting down during the weekend increases the probability of obesity, with a 33.4% increase in the likelihood of obesity for more sitting hours during the weekend (Exp(B) = 1.334).
Lastly, females have a 43.8% reduction in the odds of being obese, compared to males (B = -0.576; Exp(B) = 0.562). In the past, data from Poland revealed a greater prevalence of obesity in boys than girls [74]. Another study with national Canadian data observed a higher prevalence of obesity in boys compared with girls aged 3–19 [75]. According to Shah et al., some biological variations in the body of girls and boys could explain this difference: girls tend to have greater fat mass and lower fat-free mass (e.g., muscle), which affects energy requirements, with girls requiring fewer calories than boys, thus reducing the risk of excess weight gain; girls have higher levels of leptin, a hormone that suppresses appetite and promotes energy utilization, while boys have higher levels of androgens, which suppress leptin production, leading to potentially higher appetite; some studies suggest that brown adipose tissue, which helps burn calories, is more prevalent in females [76].
In the case of adults, the significance found for soy alternatives and coffee substitutes (Table 5) does not seem relevant, as previously we observed a low consumption of these products. A positive coefficient (B = 0.329) suggests that consuming light sodas increases the likelihood of obesity by 39% (Exp(B) = 1.390). Although these beverages contain less sugar, their consumption could potentially be associated with other unhealthy habits, such as the consumption of fast-foods or regularly alternating between sugary and light beverages. For coffee, we found that a higher consumption increases the likelihood of obesity by 29.5% (B = 0.258; Exp(B) = 1.295). In the case of tea and infusions, their consumption is associated with a 35.9% increase in the likelihood of obesity (B = 0.307; Exp(B) = 1.359). As we previously suggested, these associations could be related to the addition of sugar to these beverages, which needs to be further analysed.
4. Limitations and Future Perspectives
Although our study provides valuable insights into the health and nutritional status of a group of students, it is important to acknowledge some limitations. First, the cross-sectional design limits our ability to establish causality between nutritional and lifestyle habits and obesity. Since the data is collected at a single point in time, we cannot analyse changes over time or determine the direction of relationships. Additionally, the use of self-reported data introduces potential biases, since participants might overestimate or underestimate their responses due to social constraint or inaccurate memory, which can affect the validity of our findings. Some participants may feel uncomfortable disclosing information about sensitive topics, such as weight, dietary habits and consumption of substances, especially the younger individuals. Furthermore, using a single measure like BMI does not allow us to fully evaluate the health status of the participants, since it does not account for body fat and muscle and, in the case of adults, for sex and age.
While the initial number of surveys was high, not all of them were answered, which may affect the results, as the people who chose not to participate may differ significantly from those who did. The fact that a part of the surveys was delivered in paper also complicates the process, since it is impossible to make the answers mandatory similarly to the online version, leading to a lack of some information and to incomplete data. Also, our study is geographically focused on students from the city of Guarda, Portugal, which may limit the applicability of our findings to other regions with different socioeconomic, cultural, and environmental contexts.
As the next steps, performing longitudinal studies could be a good approach to try to establish a relationship between nutritional and lifestyle habits and obesity, identifying trends and changes over time. The accuracy of the data can be improved by using equipment like accelerometers to measure physical activity [77], and therefore obtain more objective measurements. Other geographic areas with different socioeconomic and cultural aspects should also be studied and compared. Incorporating new technologies, such as mobile health apps and online platforms can be helpful for monitoring behaviours.
5. Conclusions
The findings of our study indicate a complex relationship between BMI and several factors, such as age, physical activity, sex and dietary habits among the students. According to our survey, the younger students, particularly boys, have a higher rate of overweight and obesity, which highlights the need for an early intervention. Higher physical activity and reduced sedentary behaviours were associated to a healthier BMI, which emphasizes the need for promoting a more active lifestyle in schools. Despite the limitations of the study, it is undeniable that public health strategies to prevent obesity are needed, educating the community for improved dietary habits and providing them with access to physical activity resources. In the future, broader longitudinal studies are essential to provide a better insight into the lifestyle of these students and the factors affecting their health outcomes.
Supplementary Materials
The following supporting information can be downloaded at the website of this paper posted on Preprints.org, Figure S1: Survey for the student community; Figure S2: Comparison of consumption of different food groups by weight status of children using Mann-Whitney U test; Figure S3: Comparison of consumption of different food groups by weight status of adults using Mann-Whitney U test; Figure S4: Chi-Square test results for the association between allergic diseases and BMI in children; Figure S5: Chi-Square test results for the association between pulmonary diseases and BMI in children; Figure S6: Chi-Square test results for the association between skin diseases and BMI in children; Figure S7: Chi-Square test results for the association between gastrointestinal diseases and BMI in children; Figure S8: Chi-Square test results for the association between mental diseases and BMI in children; Figure S9: Chi-Square test results for the association between allergic diseases and BMI in adults; Figure S10: Chi-Square test results for the association between pulmonary diseases and BMI in adults; Figure S11: Chi-Square test results for the association between gastrointestinal diseases and BMI in adults; Figure S12: Chi-Square test results for the association between mental diseases and BMI in adults; Figure S13: Chi-Square test results for the association between skin diseases and BMI in adults.
Author Contributions
Conceptualization, L.R.S.; Formal analysis, F.C. and C.F.; Funding acquisition, L.R.S.; Investigation, F.C., S.S.T. and A.V., Project administration, L.R.S.; Writing – original draft, F.C.; Writing – review & editing, R.A.L., A.R.T.S.A., C.F. and L.R.S.
Funding
This work was supported by project PRR-C05-i03-I-000143 (RedFruit4Health), and by Fundação La Caixa and Fundação para a Ciência e Tecnologia (FCT) under the Programa Promove Project PD21-00023 (PharmaStar).
Institutional Review Board Statement
The study was conducted in accordance with the Declaration of Helsinki and the principles of the General Data Protection Regulation (GDPR), and approved by the Ethical Commission of the Polytechnic Institute of Guarda (Document no. 8/2024) on 21 May 2024.
Data Availability Statement
The original contributions presented in the study are included in the article, further inquiries can be directed to the corresponding author.
Conflicts of Interest
The authors declare no conflicts of interest.
References
- Story, M.; Nanney, M.S.; Schwartz, M.B. Schools and Obesity Prevention: Creating School Environments and Policies to Promote Healthy Eating and Physical Activity. Milbank Q 2009, 87, 71–100. [CrossRef]
- Malik, V.S.; Willett, W.C.; Hu, F.B. Global Obesity: Trends, Risk Factors and Policy Implications. Nat Rev Endocrinol 2013, 9, 13–27. [CrossRef]
- Swinburn, B.A.; Sacks, G.; Hall, K.D.; McPherson, K.; Finegood, D.T.; Moodie, M.L.; Gortmaker, S.L. The Global Obesity Pandemic: Shaped by Global Drivers and Local Environments. The Lancet 2011, 378, 804–814. [CrossRef]
- Jacob, C.M.; Hardy-Johnson, P.L.; Inskip, H.M.; Morris, T.; Parsons, C.M.; Barrett, M.; Hanson, M.; Woods-Townsend, K.; Baird, J. A Systematic Review and Meta-Analysis of School-Based Interventions with Health Education to Reduce Body Mass Index in Adolescents Aged 10 to 19 Years. International Journal of Behavioral Nutrition and Physical Activity 2021, 18.
- World Health Organization Obesity and Overweight Available online: https://www.who.int/news-room/fact-sheets/detail/obesity-and-overweight (accessed on 23 July 2024).
- Hruby, A.; Hu, F.B. The Epidemiology of Obesity: A Big Picture. Pharmacoeconomics 2015, 33, 673–689. [CrossRef]
- Guh, D.P.; Zhang, W.; Bansback, N.; Amarsi, Z.; Birmingham, C.L.; Anis, A.H. The Incidence of Co-Morbidities Related to Obesity and Overweight: A Systematic Review and Meta-Analysis. BMC Public Health 2009, 9, 88. [CrossRef]
- Ong, K.L.; Stafford, L.K.; McLaughlin, S.A.; Boyko, E.J.; Vollset, S.E.; Smith, A.E.; Dalton, B.E.; Duprey, J.; Cruz, J.A.; Hagins, H.; et al. Global, Regional, and National Burden of Diabetes from 1990 to 2021, with Projections of Prevalence to 2050: A Systematic Analysis for the Global Burden of Disease Study 2021. The Lancet 2023, 402, 203–234. [CrossRef]
- Vollset, S.E.; Ababneh, H.S.; Abate, Y.H.; Abbafati, C.; Abbasgholizadeh, R.; Abbasian, M.; Abbastabar, H.; Abd Al Magied, A.H.A.; Abd ElHafeez, S.; Abdelkader, A.; et al. Burden of Disease Scenarios for 204 Countries and Territories, 2022–2050: A Forecasting Analysis for the Global Burden of Disease Study 2021. The Lancet 2024, 403, 2204–2256. [CrossRef]
- Hannon, T.S.; Rao, G.; Arslanian, S.A. Childhood Obesity and Type 2 Diabetes Mellitus. Pediatrics 2005, 116, 473–480. [CrossRef]
- Khan, M.A.B.; Hashim, M.J.; King, J.K.; Govender, R.D.; Mustafa, H.; Al Kaabi, J. Epidemiology of Type 2 Diabetes – Global Burden of Disease and Forecasted Trends. J Epidemiol Glob Health 2019, 10, 107. [CrossRef]
- Liu, Z.; Peng, Y.; Zhao, W.; Zhu, Y.; Wu, M.; Huang, H.; Peng, K.; Zhang, L.; Chen, S.; Peng, X.; et al. Obesity Increases Cardiovascular Mortality in Patients with HFmrEF. Front Cardiovasc Med 2022, 9. [CrossRef]
- Marquina, C.; Talic, S.; Vargas-Torres, S.; Petrova, M.; Abushanab, D.; Owen, A.; Lybrand, S.; Thomson, D.; Liew, D.; Zomer, E.; et al. Future Burden of Cardiovascular Disease in Australia: Impact on Health and Economic Outcomes between 2020 and 2029. Eur J Prev Cardiol 2022, 29, 1212–1219. [CrossRef]
- Mohebi, R.; Chen, C.; Ibrahim, N.E.; McCarthy, C.P.; Gaggin, H.K.; Singer, D.E.; Hyle, E.P.; Wasfy, J.H.; Januzzi, J.L. Cardiovascular Disease Projections in the United States Based on the 2020 Census Estimates. J Am Coll Cardiol 2022, 80, 565–578. [CrossRef]
- Soerjomataram, I.; Bray, F. Planning for Tomorrow: Global Cancer Incidence and the Role of Prevention 2020–2070. Nat Rev Clin Oncol 2021, 18, 663–672. [CrossRef]
- Batsis, J.A.; Zbehlik, A.J.; Barre, L.K.; Bynum, J.P.W.; Pidgeon, D.; Bartels, S.J. Impact of Obesity on Disability, Function, and Physical Activity: Data from the Osteoarthritis Initiative. Scand J Rheumatol 2015, 44, 495–502. [CrossRef]
- Puhl, R.M.; Heuer, C.A. Obesity Stigma: Important Considerations for Public Health. Am J Public Health 2010, 100, 1019–1028. [CrossRef]
- OECD/European Observatory on Health Systems and Policies Portugal: Country Health Profile 2023, State of Health in the EU; Brussels, 2023.
- Rito, A.; Mendes, S.; Figueira, I.; Faria, M. do C.; Carvalho, R.; Santos, T.; Cardoso, S.; Feliciano, E.; Silvério, R.; Sofia Sancho, T.; et al. Childhood Obesity Surveillance Initiative: COSI Portugal 2022; 2023.
- National Hearth, L. and B.I. Assessing Your Weight and Health Risk. 2024.
- Flegal, K.M.; Kit, B.K.; Orpana, H.; Graubard, B.I. Association of All-Cause Mortality With Overweight and Obesity Using Standard Body Mass Index Categories. JAMA 2013, 309, 71. [CrossRef]
- IAN-AF Questionário de Propensão Alimentar - QPA1; 2017.
- Keys, A.; Fidanza, F.; Karvonen, M.J.; Kimura, N.; Taylor, H.L. Indices of Relative Weight and Obesity. Int J Epidemiol 2014, 43, 655–665. [CrossRef]
- de Onis, M. Development of a WHO Growth Reference for School-Aged Children and Adolescents. Bull World Health Organ 2007, 85, 660–667. [CrossRef]
- World Health Organization Body Mass Index-for-Age (BMI-for-Age) Available online: https://www.who.int/toolkits/child-growth-standards/standards/body-mass-index-for-age-bmi-for-age (accessed on 31 July 2024).
- World Health Organization A Healthy Lifestyle - WHO Recommendations Available online: https://www.who.int/europe/news-room/fact-sheets/item/a-healthy-lifestyle---who-recommendations (accessed on 31 July 2024).
- World Health Organization WHO Guidelines on Physical Activity and Sedentary Behaviour Available online: https://www.ncbi.nlm.nih.gov/books/NBK566046/ (accessed on 4 November 2024).
- WHO European Childhood Obesity Surveillance Initiative (COSI).
- Ilić, M.; Pang, H.; Vlaški, T.; Grujičić, M.; Novaković, B. Prevalence and Associated Factors of Overweight and Obesity among Medical Students from the Western Balkans (South-East Europe Region). BMC Public Health 2024, 24, 29. [CrossRef]
- WHO European REGIONAL OBESITY REPORT 2022; 2022; ISBN 9789289057738.
- Ługowska, K.; Kolanowski, W.; Trafialek, J. The Impact of Physical Activity at School on Children’s Body Mass during 2 Years of Observation. Int J Environ Res Public Health 2022, 19. [CrossRef]
- Cleven, L.; Krell-Roesch, J.; Nigg, C.R.; Woll, A. The Association between Physical Activity with Incident Obesity, Coronary Heart Disease, Diabetes and Hypertension in Adults: A Systematic Review of Longitudinal Studies Published after 2012. BMC Public Health 2020, 20, 726. [CrossRef]
- Koolhaas, C.M.; Dhana, K.; Schoufour, J.D.; Ikram, M.A.; Kavousi, M.; Franco, O.H. Impact of Physical Activity on the Association of Overweight and Obesity with Cardiovascular Disease: The Rotterdam Study. Eur J Prev Cardiol 2017, 24, 934–941. [CrossRef]
- El-Koofy, N.M.; Anwar, G.M.; El-Raziky, M.S.; El-Hennawy, A.M.; El-Mougy, F.M.; El-Karaksy, H.; Hassanin, F.M.; Helmy, H.M. The Association of Metabolic Syndrome, Insulin Resistance and Non-Alcoholic Fatty Liver Disease in Overweight/Obese Children. Saudi Journal of Gastroenterology 2012, 18, 44–49. [CrossRef]
- Rajindrajith, S.; Devanarayana, N.M.; Benninga, M.A. Obesity and Functional Gastrointestinal Diseases in Children. J Neurogastroenterol Motil 2014, 20, 414–416. [CrossRef]
- Vila, G. Mental Disorders in Obese Children and Adolescents. Psychosom Med 2004, 66, 387–394. [CrossRef]
- Propst, M.; Colvin, C.; Griffin, R.L.; Sunil, B.; Harmon, C.M.; Yannam, G.; Johnson, J.E.; Smith, C.B.; Lucas, A.P.; Diaz, B.T.; et al. Diabetes and Prediabetes Are Significantly Higher in Morbidly Obese Children Compared With Obese Children. Endocrine Practice 2015, 21, 1046–1053. [CrossRef]
- Hall, N.Y.; Hetti Pathirannahalage, D.M.; Mihalopoulos, C.; Austin, S.B.; Le, L. Global Prevalence of Adolescent Use of Nonprescription Weight-Loss Products: A Systematic Review and Meta-Analysis. JAMA Netw Open 2024, 7, E2350940. [CrossRef]
- Jean-Louis, G.; Williams, N.J.; Sarpong, D.; Pandey, A.; Youngstedt, S.; Zizi, F.; Ogedegbe, G. Associations between Inadequate Sleep and Obesity in the US Adult Population: Analysis of the National Health Interview Survey (1977–2009). BMC Public Health 2014, 14, 290. [CrossRef]
- Huang, H.; Yu, T.; Liu, C.; Yang, J.; Yu, J. Poor Sleep Quality and Overweight/Obesity in Healthcare Professionals: A Cross-Sectional Study. Front Public Health 2024, 12. [CrossRef]
- Dare, S.; Mackay, D.F.; Pell, J.P. Relationship between Smoking and Obesity: A Cross-Sectional Study of 499,504 Middle-Aged Adults in the UK General Population. PLoS One 2015, 10, e0123579. [CrossRef]
- Chao, A.M.; Wadden, T.A.; Ashare, R.L.; Loughead, J.; Schmidt, H.D. Tobacco Smoking, Eating Behaviors, and Body Weight: A Review. Curr Addict Rep 2019, 6, 191–199. [CrossRef]
- Traversy, G.; Chaput, J.-P. Alcohol Consumption and Obesity: An Update. Curr Obes Rep 2015, 4, 122–130. [CrossRef]
- AlKalbani, S.R.; Murrin, C. The Association between Alcohol Intake and Obesity in a Sample of the Irish Adult Population, a Cross-Sectional Study. BMC Public Health 2023, 23, 2075. [CrossRef]
- Lee, A.; Cardel, M.; T Donahoo, W. Social and Environmental Factors Influencing Obesity Available online: https://www.ncbi.nlm.nih.gov/books/NBK278977/ (accessed on 30 August 2024).
- Zhu, X.; Haegele, J.A.; Liu, H.; Yu, F. Academic Stress, Physical Activity, Sleep, and Mental Health among Chinese Adolescents. Int J Environ Res Public Health 2021, 18. [CrossRef]
- Giacco, R.; Della Pepa, G.; Luongo, D.; Riccardi, G. Whole Grain Intake in Relation to Body Weight: From Epidemiological Evidence to Clinical Trials. Nutrition, Metabolism and Cardiovascular Diseases 2011, 21, 901–908.
- Askari, G.; Heidari-Beni, M.; Broujeni, M.B.; Ebneshahidi, A.; Amini, M.; Ghisvand, R.; Iraj, B. Effect of Whole Wheat Bread and White Bread Consumption on Pre-Diabetes Patient. Pak J Med Sci 2013, 29, 275–279. [CrossRef]
- WHO Technical Report Series Diet, Nutrition and the Prevention of Chronic Diseases: Report of a Joint WHO/FAO Expert Consultation; World Health Organization, Ed.; World Health Organization: Geneva, 2003; Vol. 916; ISBN 924120916X.
- Shi, W.; Huang, X.; Schooling, C.M.; Zhao, J. V Red Meat Consumption, Cardiovascular Diseases, and Diabetes: A Systematic Review and Meta-Analysis. Eur Heart J 2023, 44, 2626–2635. [CrossRef]
- Vanessa Candeias; Emília Nunes; Cecília Morais; Manuela Cabral; Pedro Ribeiro da Silva Princípios Para Uma Alimentação Saudável: Ministério Da Saúde. 2005.
- Farvid, M.S.; Sidahmed, E.; Spence, N.D.; Mante Angua, K.; Rosner, B.A.; Barnett, J.B. Consumption of Red Meat and Processed Meat and Cancer Incidence: A Systematic Review and Meta-Analysis of Prospective Studies. Eur J Epidemiol 2021, 36, 937–951. [CrossRef]
- World Cancer Research Fund; American Institute for Cancer Research Food, Nutrition, Physical Activity, and the Prevention of Cancer: A Global Perspective; American Institute for Cancer Research: Washington DC: AICR, 2007; ISBN 978-0-9722522-2-5.
- Scientific Advisory Committee on Nutrition Iron and Health; Stationery Office: London, 2010; ISBN 9780117069923.
- Lyall, K.; Westlake, M.; Musci, R.J.; Gachigi, K.; Barrett, E.S.; Bastain, T.M.; Bush, N.R.; Buss, C.; Camargo, C.A.; Croen, L.A.; et al. Association of Maternal Fish Consumption and ω-3 Supplement Use during Pregnancy with Child Autism-Related Outcomes: Results from a Cohort Consortium Analysis. American Journal of Clinical Nutrition 2024, 120, 583–592. [CrossRef]
- Witte, A.V.; Kerti, L.; Hermannstädter, H.M.; Fiebach, J.B.; Schreiber, S.J.; Schuchardt, J.P.; Hahn, A.; Flöel, A. Long-Chain Omega-3 Fatty Acids Improve Brain Function and Structure in Older Adults. Cerebral Cortex 2014, 24, 3059–3068. [CrossRef]
- European Commission Food-Based Dietary Guidelines Recommendations for Eggs Available online: https://knowledge4policy.ec.europa.eu/health-promotion-knowledge-gateway/food-based-dietary-guidelines-europe-table-10_en (accessed on 8 October 2024).
- European Commission Food-Based Dietary Guidelines Recommendations for Milk and Dairy Products Available online: https://knowledge4policy.ec.europa.eu/health-promotion-knowledge-gateway/food-based-dietary-guidelines-europe-table-7_en (accessed on 8 October 2024).
- World Health Organization Guideline: Sugars Intake for Adults and Children; Genova, 2015.
- Branum, A.M.; Rossen, L.M.; Schoendorf, K.C. Trends in Caffeine Intake among US Children and Adolescents. Pediatrics 2014, 133, 386–393. [CrossRef]
- Poti, J.M.; Duffey, K.J.; Popkin, B.M. The Association of Fast Food Consumption with Poor Dietary Outcomes and Obesity among Children: Is It the Fast Food or the Remainder of the Diet? American Journal of Clinical Nutrition 2014, 99, 162–171. [CrossRef]
- Paeratakul, S.; Ferdinand, D.P.; Champagne, C.M.; Ryan, D.H.; Bray, G.A. Fast-Food Consumption among US Adults and Children: Dietary and Nutrient Intake Profile. J Am Diet Assoc 2003, 103, 1332–1338. [CrossRef]
- Sebastian, R.S.; Wilkinson Enns, C.; Goldman, J.D. US Adolescents and MyPyramid: Associations between Fast-Food Consumption and Lower Likelihood of Meeting Recommendations. J Am Diet Assoc 2009, 109, 226–235. [CrossRef]
- Jekanowski, M.D.; Binkley, J.K.; Eales, J. Convenience, Accessibility, and the Demand for Fast Food; 2001; Vol. 26.
- Peixoto, J.M. Characterization of Caffeine Consumption in the Portuguese Population and Its Relationship with Psychological Well-Being, Universidade Católica: Porto, 2020.
- Ikram, M.; Park, T.J.; Ali, T.; Kim, M.O. Antioxidant and Neuroprotective Effects of Caffeine against Alzheimer’s and Parkinson’s Disease: Insight into the Role of Nrf-2 and A2AR Signaling. Antioxidants 2020, 9, 1–21.
- Jin, M.-J.; Yoon, C.-H.; Ko, H.-J.; Kim, H.-M.; Kim, A.-S.; Moon, H.-N.; Jung, S.-P. The Relationship of Caffeine Intake with Depression, Anxiety, Stress, and Sleep in Korean Adolescents. Korean J Fam Med 2016, 37, 111. [CrossRef]
- Tohill, B.C.; oint FAO/WHO Workshop on Fruit and Vegetables for Health Dietary Intake of Fruit and Vegetables and Management of Body Weight; Kobe, 2005.
- Henn, M.; Glenn, A.J.; Willett, W.C.; Martínez-González, M.A.; Sun, Q.; Hu, F.B. Changes in Coffee Intake, Added Sugar and Long-Term Weight Gain - Results from Three Large Prospective US Cohort Studies. American Journal of Clinical Nutrition 2023, 118, 1164–1171. [CrossRef]
- Ayalon, I.; Bodilly, L.; Kaplan, J. The Impact of Obesity on Critical Illnesses. Shock 2021, 56, 691–700.
- Edwards-Salmon, S.E.; Padmanabhan, S.L.; Kuruvilla, M.; Levy, J.M. Increasing Prevalence of Allergic Disease and Its Impact on Current Practice. Curr Otorhinolaryngol Rep 2022, 10, 278–284.
- Sultész, M.; Horváth, A.; Molnár, D.; Katona, G.; Mezei, G.; Hirschberg, A.; Gálffy, G. Prevalence of Allergic Rhinitis, Related Comorbidities and Risk Factors in Schoolchildren. Allergy, Asthma and Clinical Immunology 2020, 16. [CrossRef]
- Liu, L.; Ma, J.; Peng, S.; Xie, L. Prenatal and Early-Life Exposure to Traffic-Related Air Pollution and Allergic Rhinitis in Children: A Systematic Literature Review. PLoS One 2023, 18. [CrossRef]
- Kowal, M.; Woronkowicz, A.; Kryst, Ł.; Sobiecki, J.; Pilecki, M.W. Sex Differences in Prevalence of Overweight and Obesity, and in Extent of Overweight Index, in Children and Adolescents (3-18 Years) from Kraków, Poland in 1983, 2000 and 2010. Public Health Nutr 2016, 19, 1035–1046. [CrossRef]
- Rodd, C.; Sharma, A.K. Recent Trends in the Prevalence of Overweight and Obesity among Canadian Children. CMAJ 2016, 188, E313–E320. [CrossRef]
- Shah, B.; Tombeau Cost, K.; Fuller, A.; Birken, C.S.; Anderson, L.N. Sex and Gender Differences in Childhood Obesity: Contributing to the Research Agenda. BMJ Nutr Prev Health 2020, 3, 387–390. [CrossRef]
- Arvidsson, D.; Fridolfsson, J.; Börjesson, M. Measurement of Physical Activity in Clinical Practice Using Accelerometers. J Intern Med 2019, 286, 137–153. [CrossRef]
Figure 1.
Cross-sectional study design.
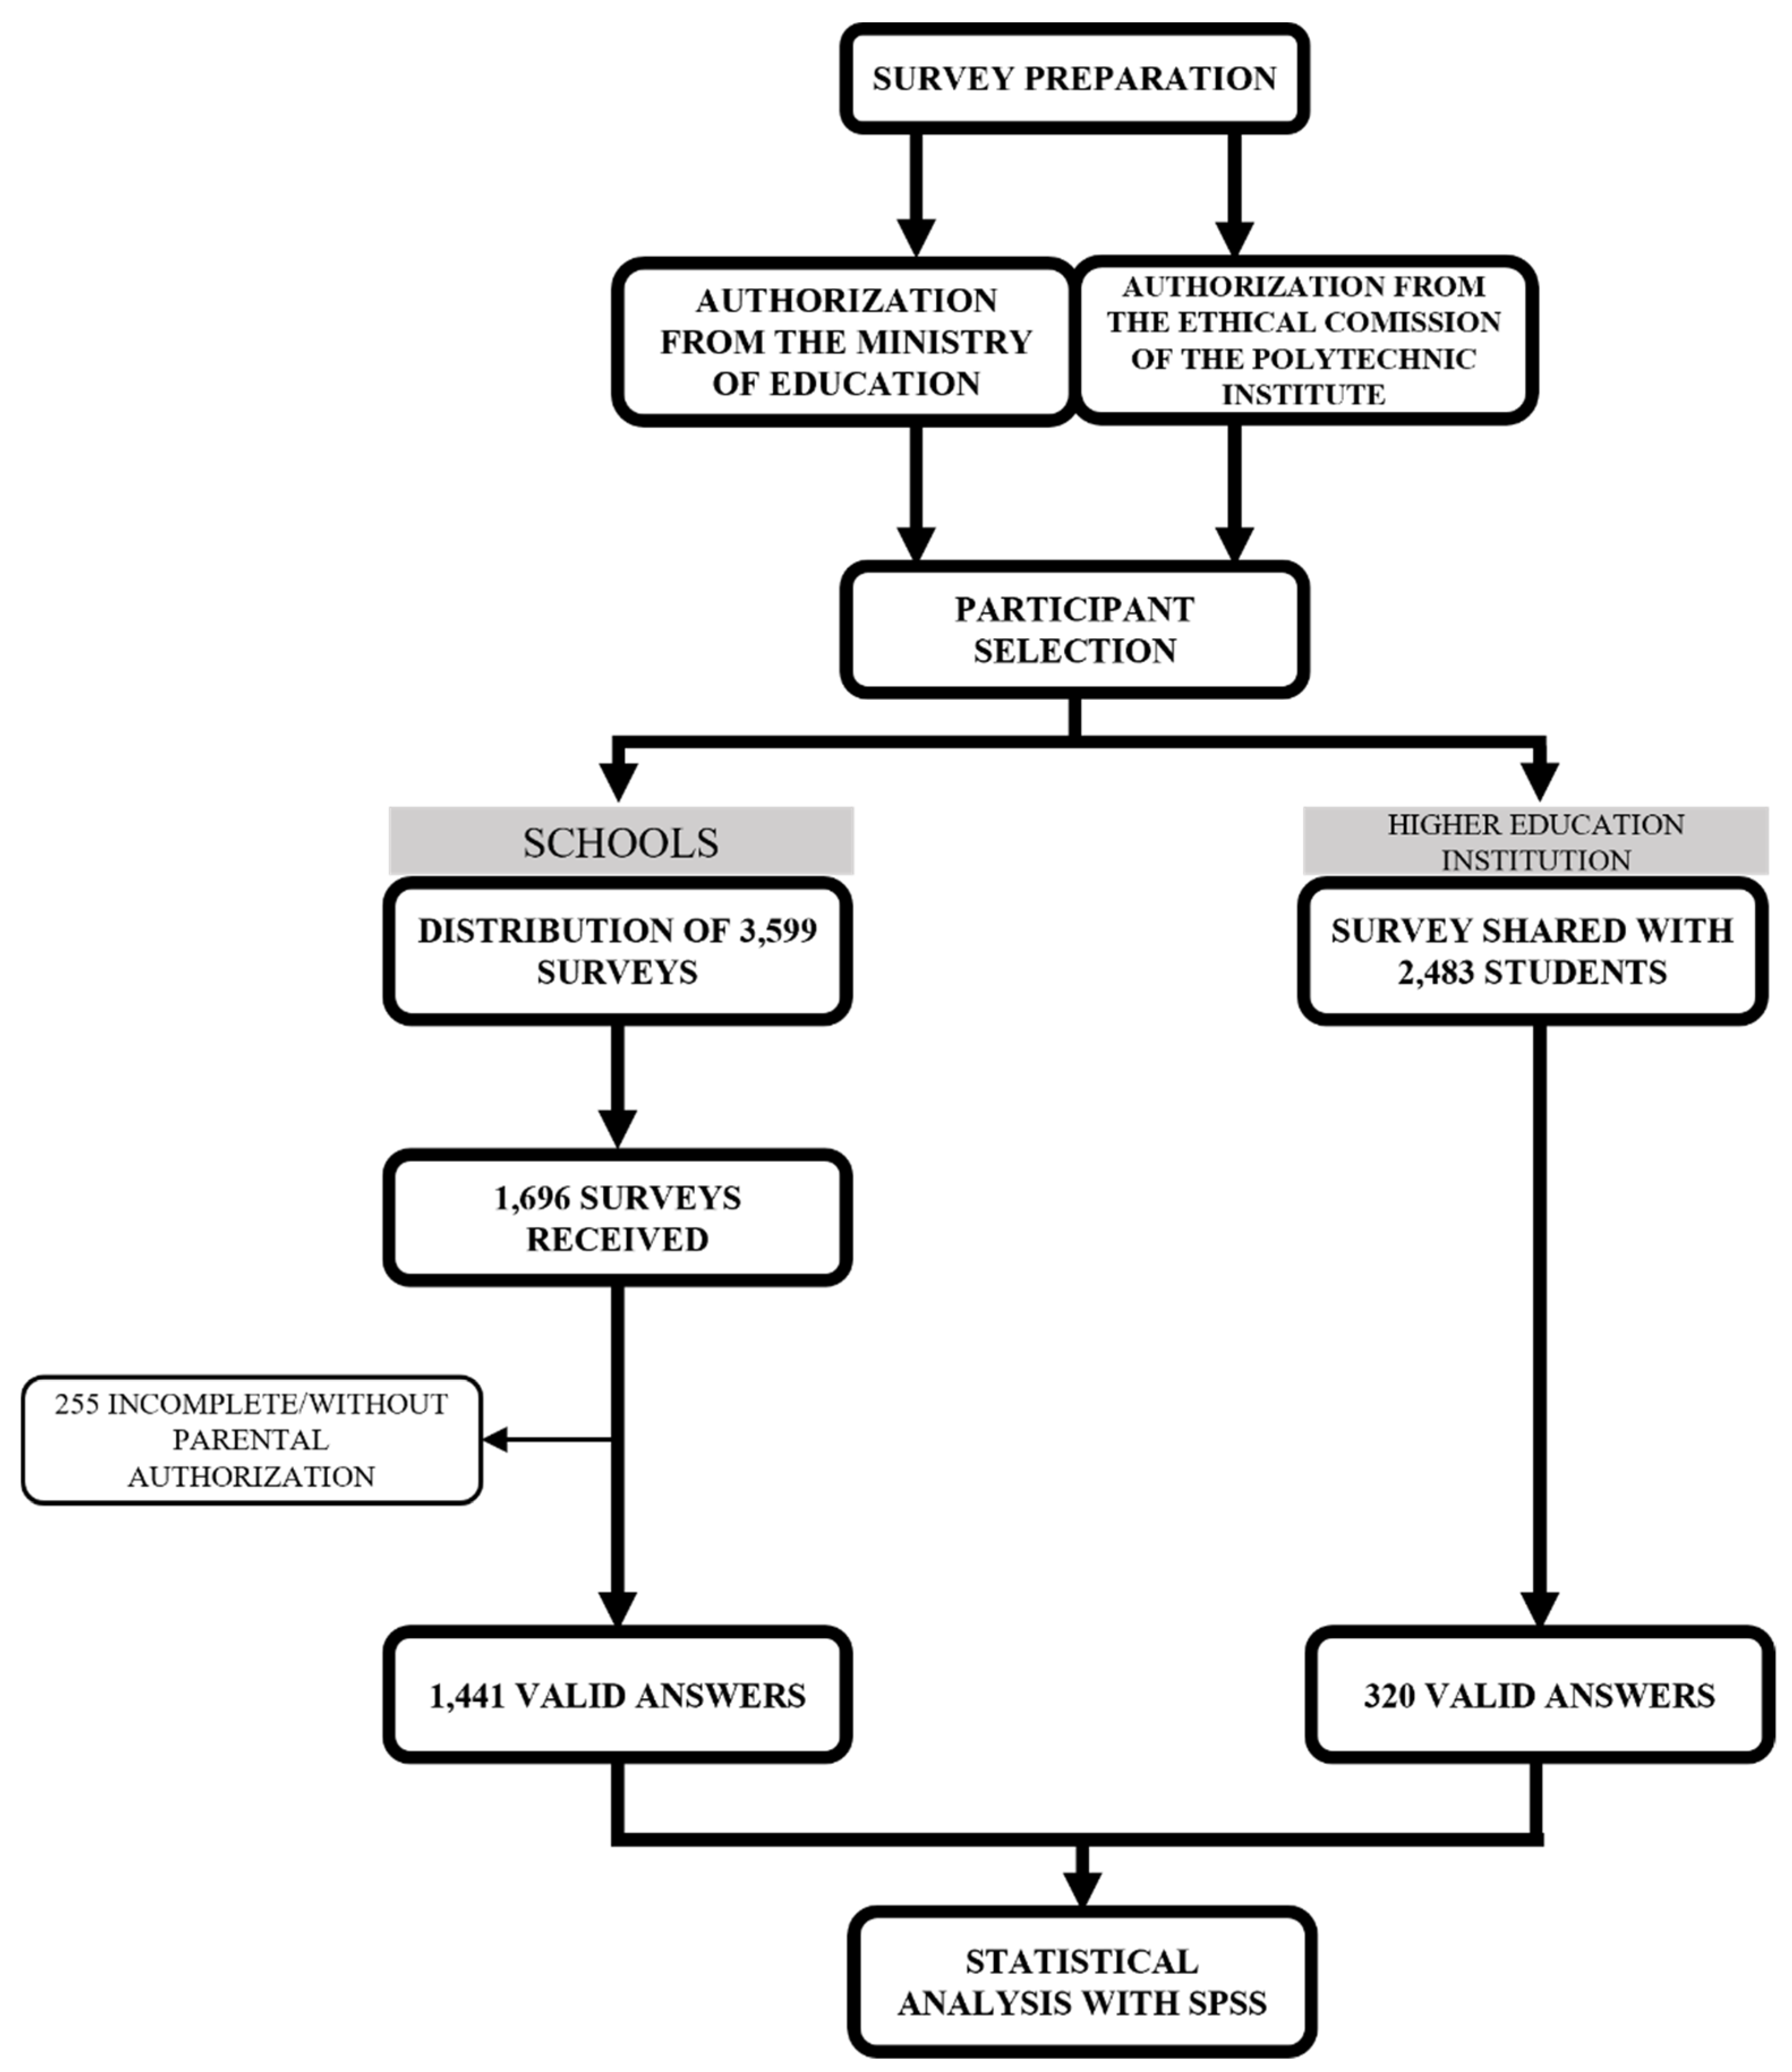
Figure 2.
Weight status of child (a) and adult (b) students.
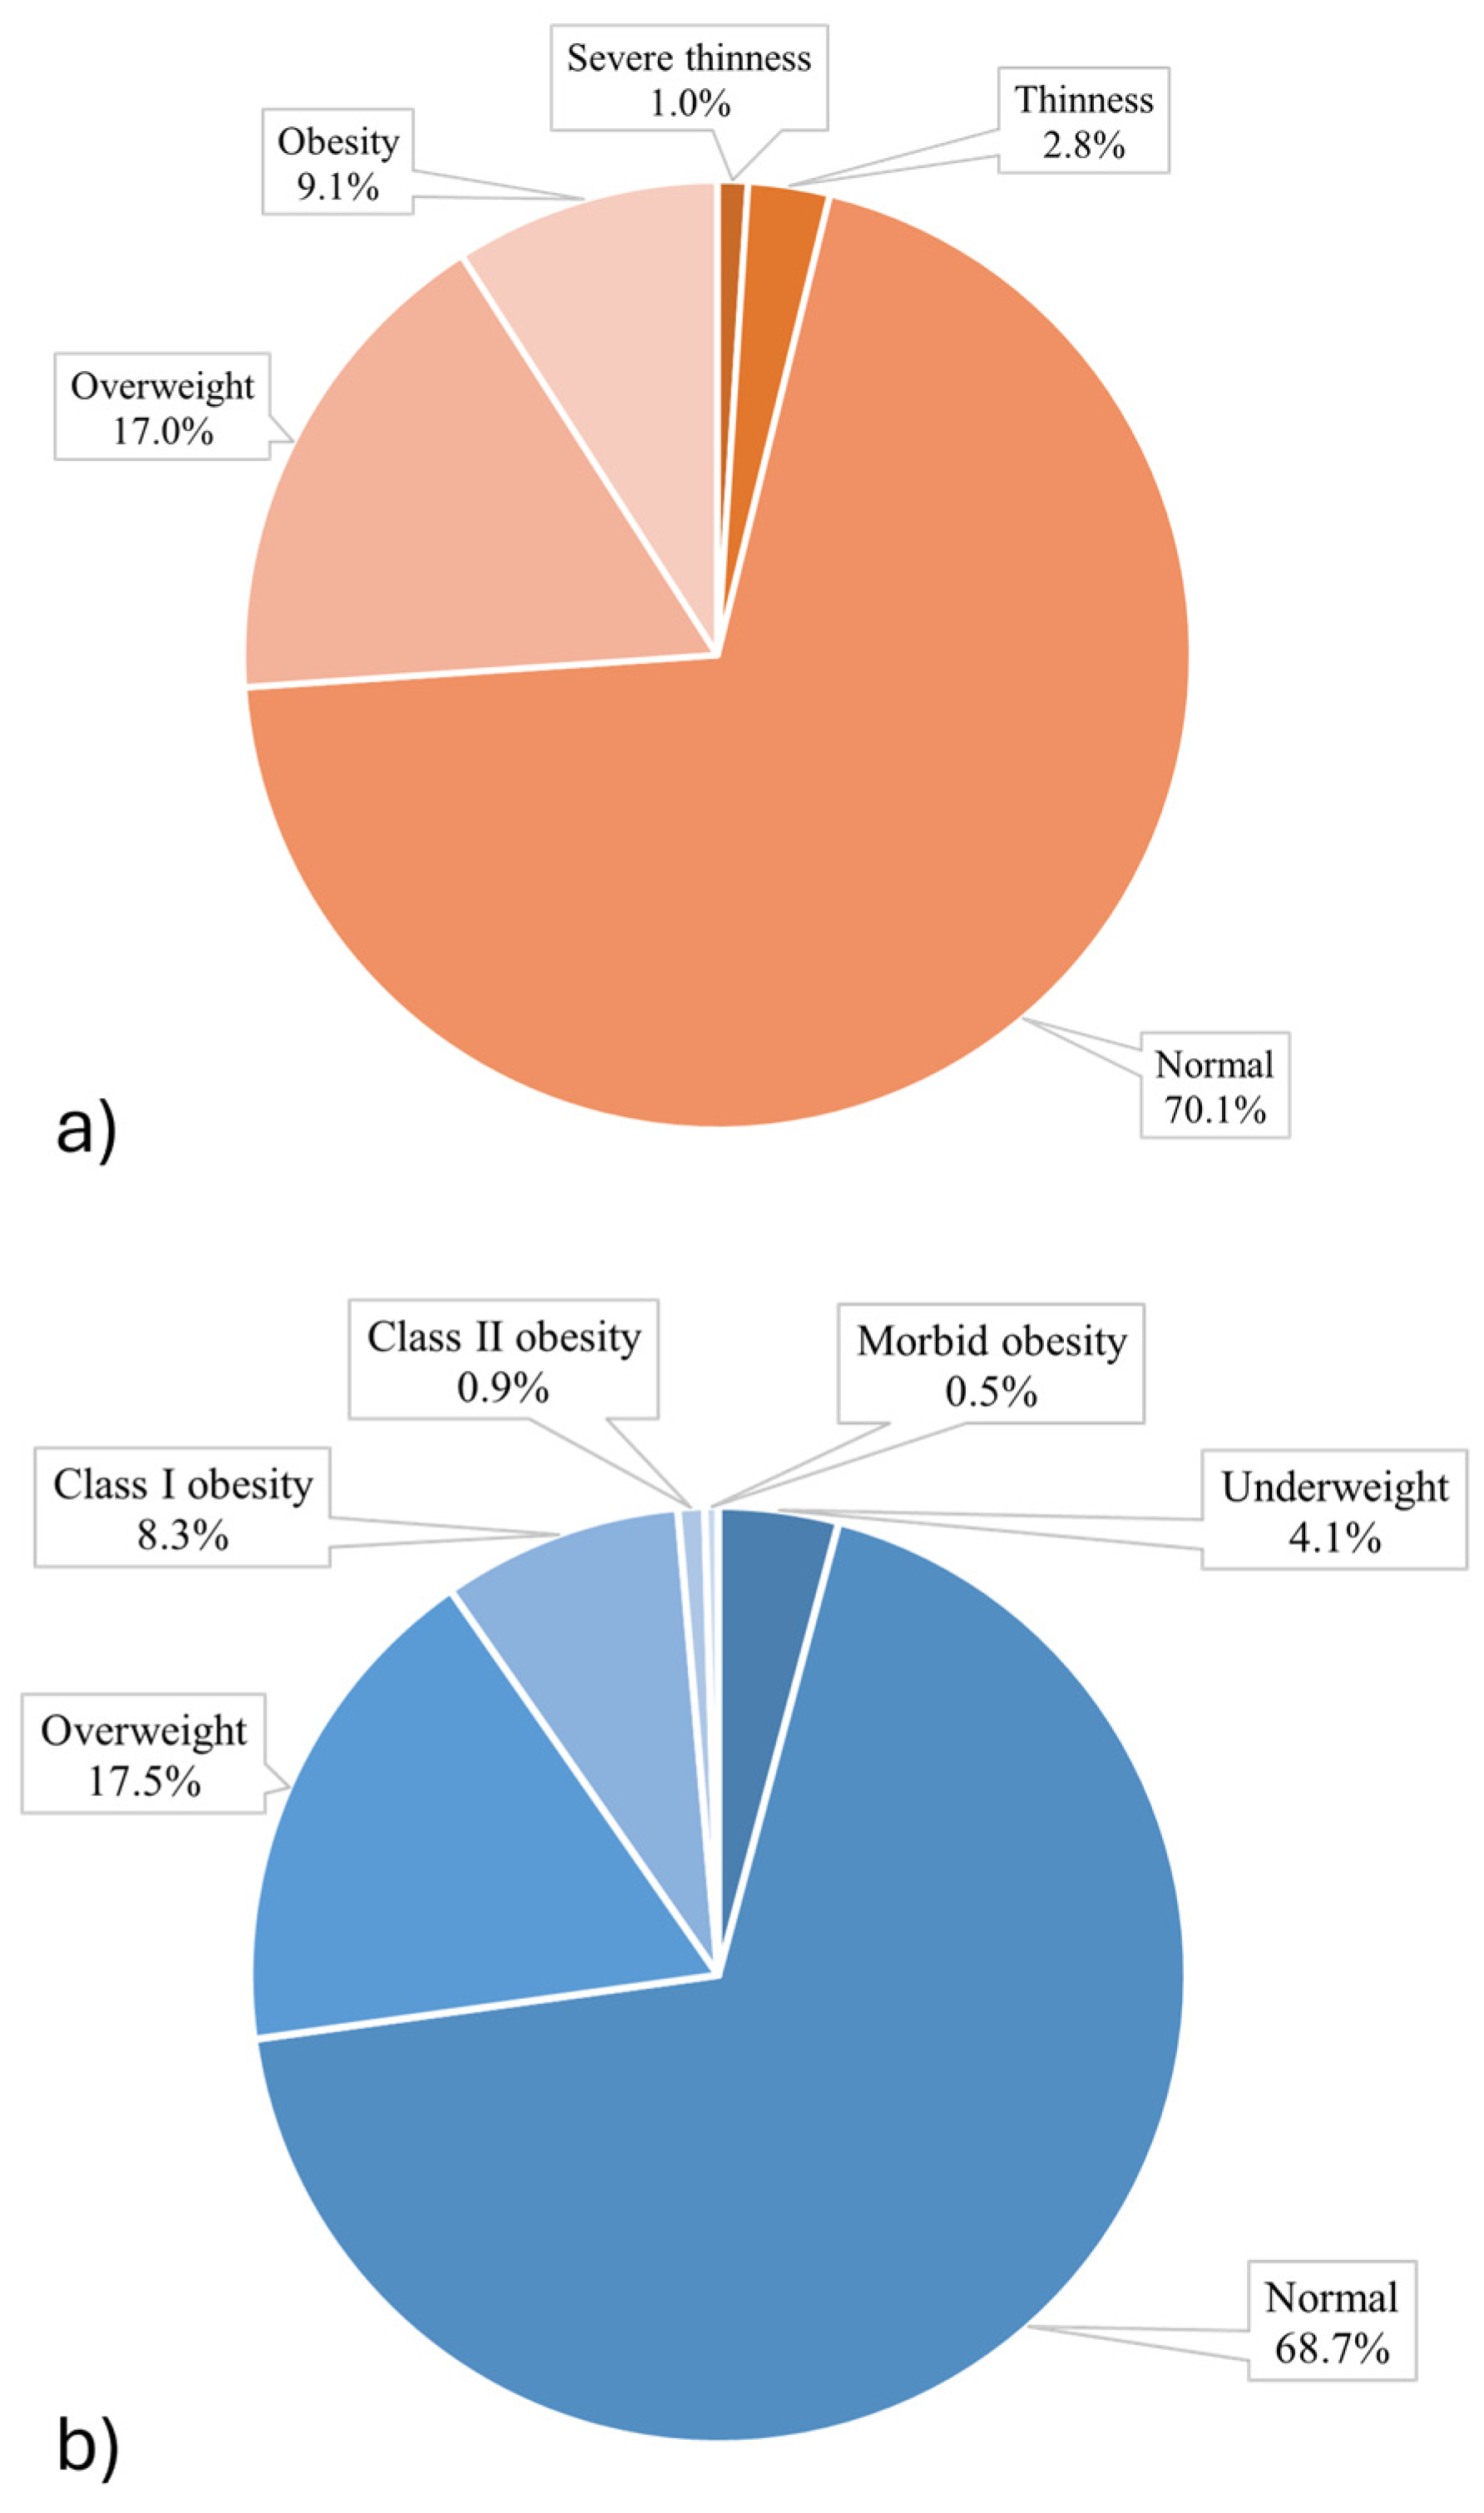
Figure 3.
Consumption frequency of different groups of food by children (a) and adults (b). 1 – never; 2 – less than once per month; 3 – one to three days per month; 4 – one day per week; 5 – two to four days per week; 6 – four to six days per month; 7 – once per day; 8 – twice or more per day.
Figure 3.
Consumption frequency of different groups of food by children (a) and adults (b). 1 – never; 2 – less than once per month; 3 – one to three days per month; 4 – one day per week; 5 – two to four days per week; 6 – four to six days per month; 7 – once per day; 8 – twice or more per day.
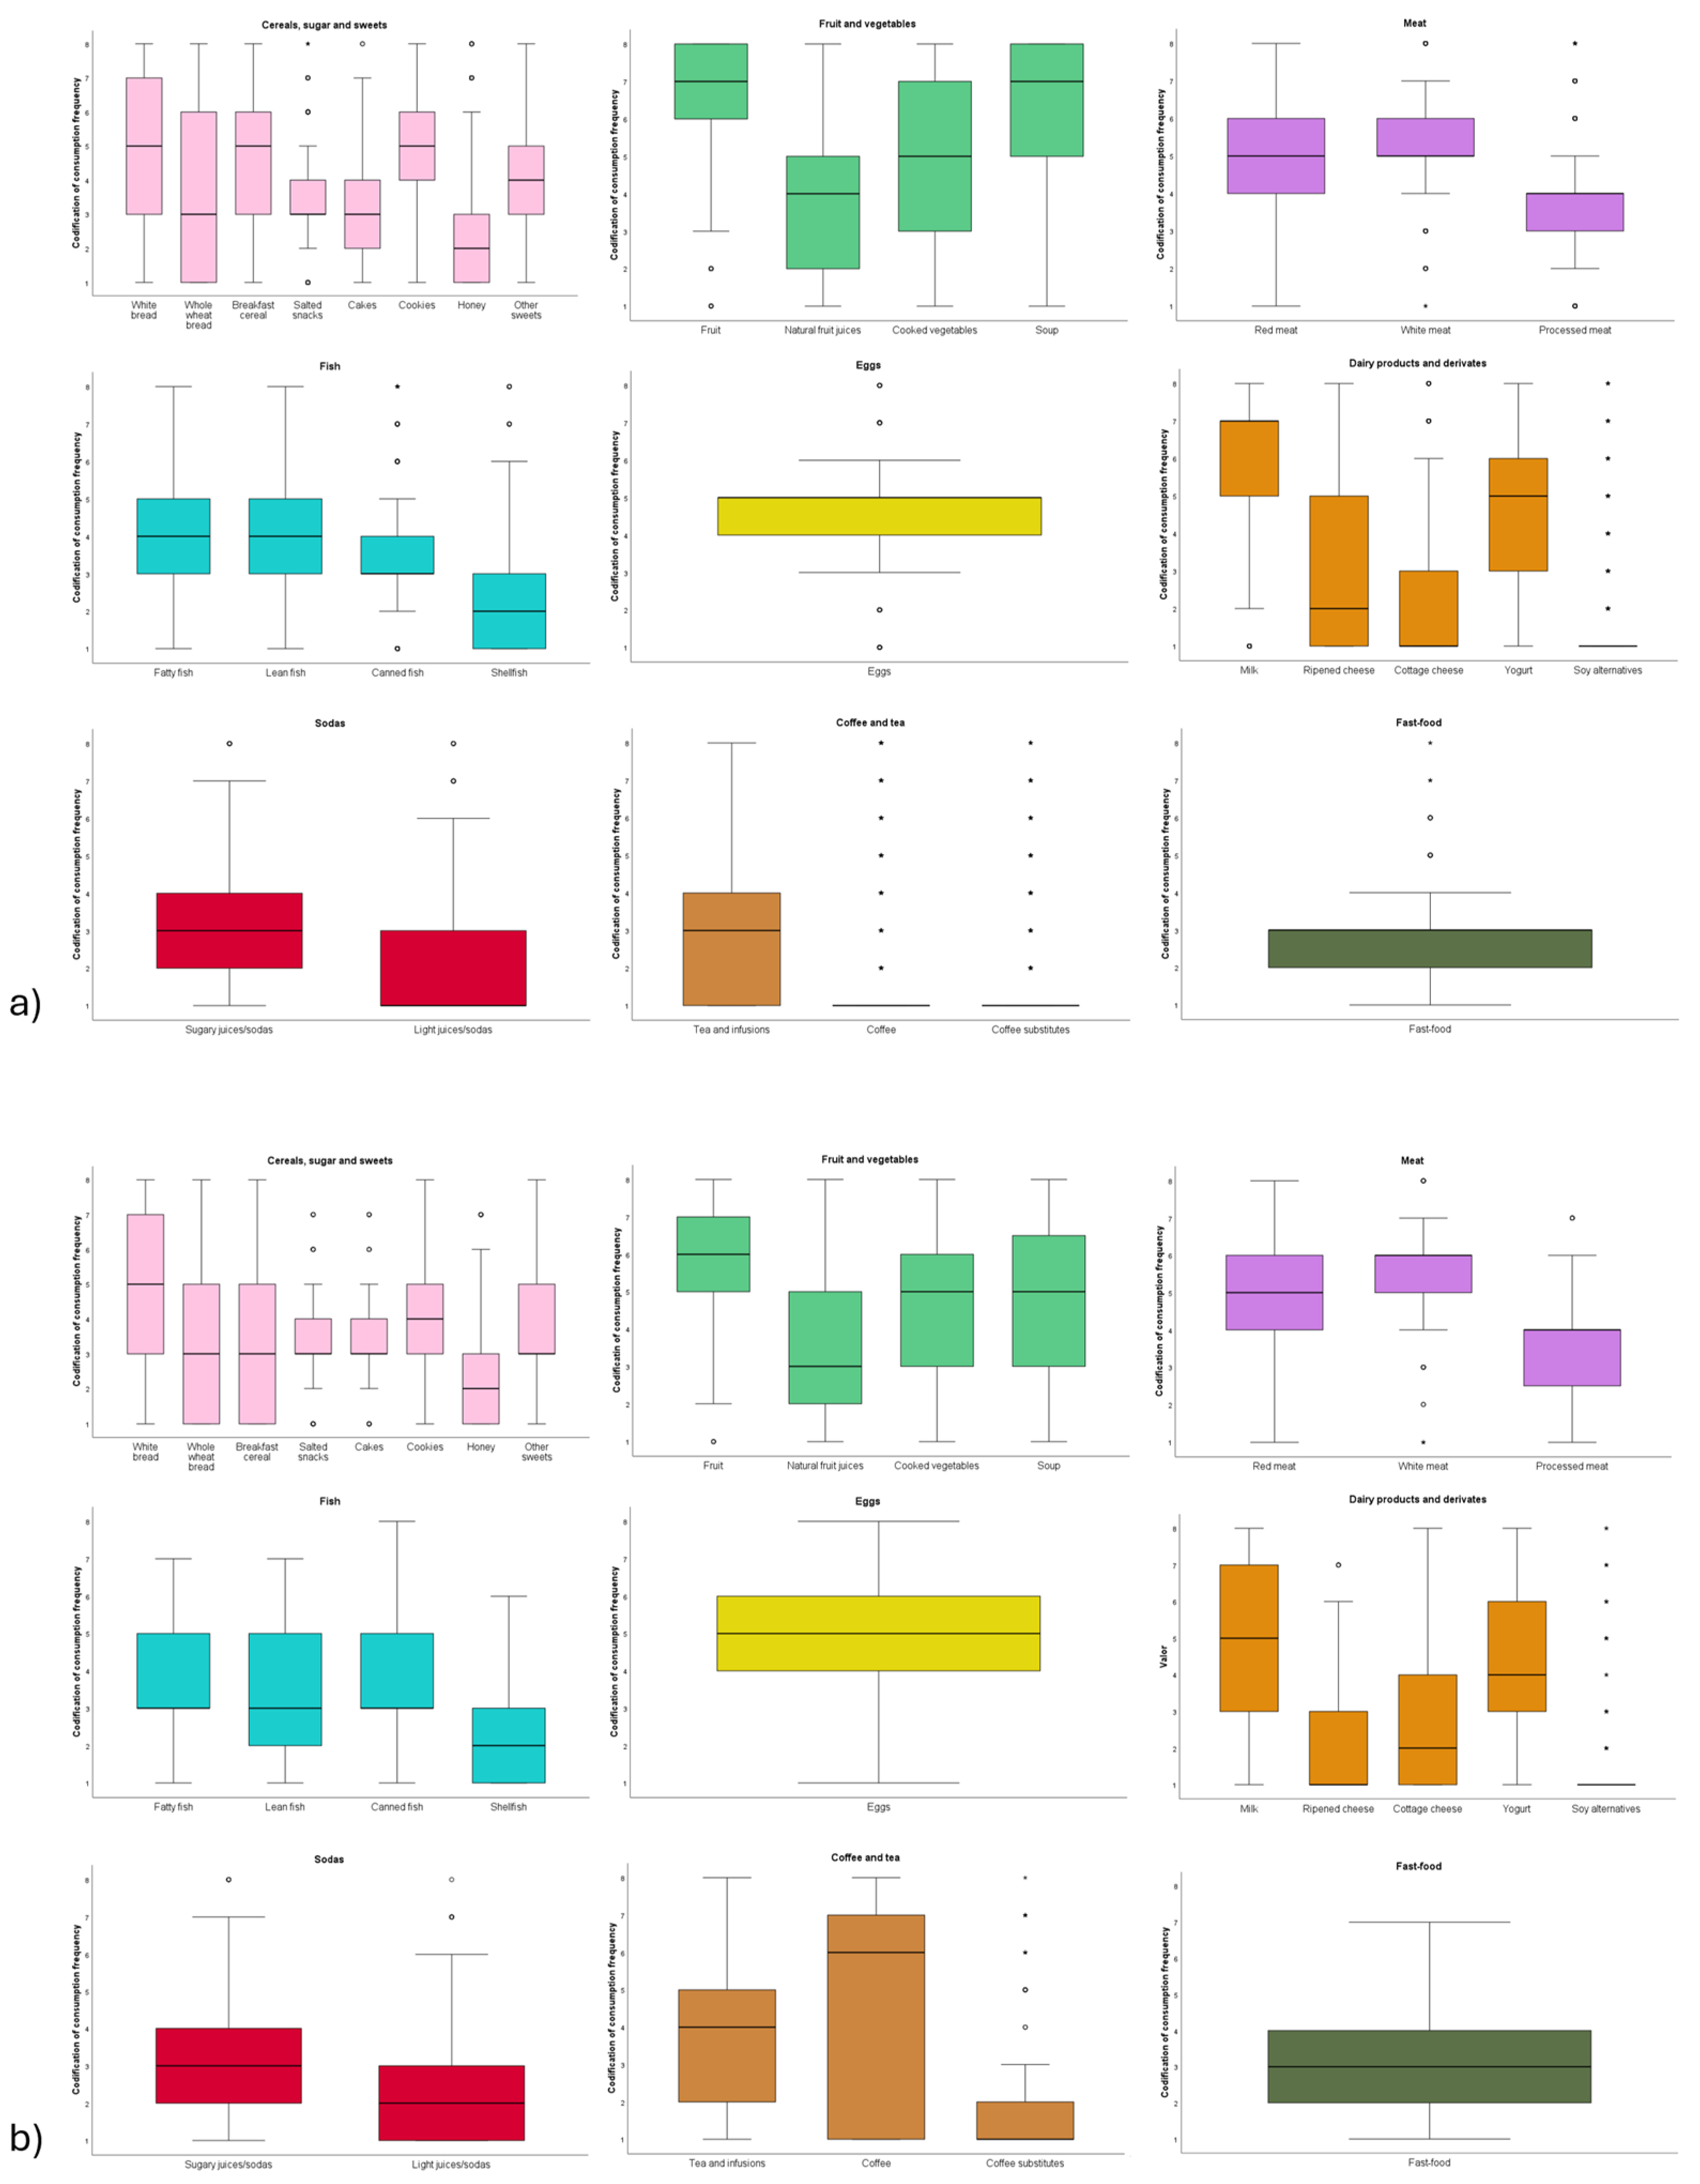

Table 1.
WHO weight classification according to BMI values [26].
Table 1.
WHO weight classification according to BMI values [26].
| BMI | Weight classification | |
| < 18.5 | Underweight | |
| 18.5 – 24.9 | Normal weight | |
| 25.0 – 29.9 | Overweight | |
| 30.0 – 34.9 | Obesity class I | Obese |
| 35.0 – 39.9 | Obesity class II | |
| ≥ 40 | Obesity class III (morbid) | |
Table 2.
Characteristics and habits of children and adolescent students, categorized by weight status and separated by sex.
Table 2.
Characteristics and habits of children and adolescent students, categorized by weight status and separated by sex.
| Male BMI classification(n=670) | Female BMI classification(n=875) | ||||||||||
| Underweight/Normal weight | Overweight/Obesity | P-value | Underweight/Normal weight | Overweight/Obesity | P-Value | ||||||
| n | % (CI) | n | % (CI) | n | % (CI) | n | % (CI) | ||||
| Age in years | 6 - 12 | 299 | 66.6(62.1-70.8) | 150 | 33.4(29.2-37.9) | 0.050 | 387 | 72.6(68.7-76.3) | 146 | 27.4(23.7-31.3) | <0.001 |
| 13 - 19 | 164 | 74.2(68.2-79.6) | 57 | 25.8(20.4-31.8) | 292 | 85.4(81.3-88.8) | 50 | 14.6(11.2-18.7) | |||
| Frequency of weekly physical activity | Low | 188 | 65.7(60.1-71.1) | 98 | 34.3(28.9-39.9) | 0.031 | 368 | 73.7(69.8-77.5) | 131 | 26.3(22.5-30.2) | 0.002 |
| Moderate | 157 | 67.7(61.5-73.4) | 75 | 32.3(26.6-38.5) | 222 | 80.7(75.8-85.1) | 53 | 19.3(14.9-24.2) | |||
| Heavy | 118 | 77.6(70.5-83.7) | 34 | 22.4(16.3-29.5) | 89 | 88.1(80.8-93.3) | 12 | 11.9(6.7-19.2) | |||
| Hours of sleep per day | < 6 | 10 | 55.6(33.2-76.3) | 8 | 44.4(23.7-66.8) | 0.207 | 36 | 75.0(61.5-85.5) | 12 | 25.0(14.5-38.5) | 0.721 |
| ≥ 6 | 453 | 69.5(65.9-72.9) | 199 | 30.5(27.17-34.1) | 643 | 77.8(74.8-80.5) | 184 | 22.2(19.5-25.2) | |||
| Hours spent sitting down, daily during the week | < 6 | 150 | 70.1(63.7-75.9) | 64 | 29.9(24.1-36.3) | 0.721 | 181 | 73.3(67.5-78.5) | 66 | 26.7(21.5-32.5) | 0.059 |
| ≥ 6 | 313 | 68,6(64.3-72.8) | 143 | 31.4(27.2-35.7) | 498 | 79.3(76.0-82.3) | 130 | 20.7(17.7-24.0) | |||
| Hours spent sitting down, daily during the weekend | < 6 | 322 | 70.5(66.2-74.5) | 135 | 29.5(25.5-33.8) | 0.282 | 461 | 78.1(74.5-81.2) | 130 | 22.0(18-8-25.5) | 0.729 |
| ≥ 6 | 141 | 66.2(59.7-72.3) | 72 | 33.8(27.7-40.3) | 218 | 76.8(71.6-81.4) | 66 | 23.2(18.6-28.4) | |||
| Number of daily meals | ≤ 3 | 50 | 64.9(53.9-74.9) | 27 | 35.1(25.1-46.1) | 0.432 | 95 | 81.2(73.4-87.5) | 22 | 18.8(12.5-26.6) | 0.343 |
| > 3 | 413 | 69.6(65.9-73.2) | 180 | 30.4(26.8-34.1) | 584 | 77.0(74.0-79.9) | 174 | 23.0(20.1-26.0) | |||
| Diagnosed with disease(s) | Yes | 148 | 63.8(57.5-69.8) | 84 | 36.2(30.2-42.5) | 0.035 | 229 | 78.2(73.2-82.6) | 64 | 21.8(17.4-26.8) | 0.797 |
| No | 315 | 71.9(67.5-76.0) | 123 | 28.1(24.0-32.4) | 450 | 77.3(73.8-80.6) | 132 | 22.7(19.4-26.2) | |||
| Medication | Yes | 66 | 70.2(60.5-78.7) | 28 | 29.8(21.3-39.5) | 0.904 | 90 | 79.6(71.5-86.3) | 23 | 20.4(13.7-28.5) | 0.630 |
| No | 397 | 68.9(65.1-72.6) | 179 | 31.1(27.4-34.9) | 589 | 77.3(74.2-80.2) | 173 | 22.7(19.8-25.8) | |||
| Dietary supplementation | Yes | 45 | 58.4(47.3-69.0) | 32 | 41.6(31.0-52.7) | 0.036 | 66 | 77.6(68.1-85.5) | 19 | 22.4(14.5-32.0) | 1.000 |
| No | 418 | 70.5(66.7-74.1) | 175 | 29.5(25.9-33.3) | 613 | 77.6(74.6-80.4) | 177 | 22.4(19.6-25.4) | |||
Table 3.
Characteristics and habits of adult students, categorized by weight status and separated by sex.
Table 3.
Characteristics and habits of adult students, categorized by weight status and separated by sex.
| Male BMI classification(n=76) | Female BMI classification(n=141) | ||||||||||
| Underweight/Normal weight | Overweight/Obesity | P-value | Underweight/Normal weight | Overweight/Obesity | P-Value | ||||||
| n | % (C.I.) | n | % (C.I.) | n | % (C.I.) | n | % (C.I.) | ||||
| Age in years | 20 - 39 | 49 | 70.0(58.6-79.8) | 21 | 30.0(20.2-41.4) | 0.087 | 101 | 75.9(68.2-82.6) | 32 | 24.1(17.4-31.8) | 1.000 |
| 40 - 58 | 2 | 33.3(7.70-71.4) | 4 | 66.7(28.6-92.3) | 6 | 75.0(40.8-94.4) | 2 | 25.0(5.6-59.2) | |||
| Frequency of weekly physical activity | Low | 29 | 64.4(49.9-77.2) | 16 | 35.6(22.8-50.1) | 0.647 | 68 | 74.7(65.1-82.8) | 23 | 25.3(17.2-34.9) | 0.894 |
| Moderate | 13 | 76.5(53.3-91.5) | 4 | 23.5(8.5-46.7) | 20 | 76.9(58.5-89.7) | 6 | 23.1(10.3-41.5) | |||
| Heavy | 9 | 64.3(38.5-84.9) | 5 | 35.7(15.1-61.5) | 19 | 79.2(60.2-91.6) | 5 | 20.8(8.4-39.8) | |||
| Hours of sleep per day | < 6 | 11 | 64.7(41.1-83.7) | 6 | 35.3(16.3-58.9) | 1.000 | 19 | 82.6(63.8-93.8) | 4 | 17.4(6.2-36.2) | 0.595 |
| ≥ 6 | 40 | 67.8(55.2-78.6) | 19 | 32.2(21.4-44.8) | 88 | 74.6(66.2-81.8) | 30 | 25.4(18.2-33.8) | |||
| Hours spent sitting down, daily, during the week | < 6 | 24 | 68.6(52.2-82.0) | 11 | 31.4(18.0-47.8) | 1.000 | 42 | 77.8(65.4-87.2) | 12 | 22.2(18.2-34.6) | 0.840 |
| ≥ 6 | 27 | 65.9(50.7-78.9) | 14 | 34.1(21.1-49.3) | 65 | 74.7(64.9-82.9) | 22 | 25.3(17.1-35.1) | |||
| Hours spent sitting down, daily, during the weekend | < 6 | 36 | 67.9(54.7-79.3) | 17 | 32.1(20.7-45.3) | 1.000 | 65 | 77.4(67.6-85.3) | 19 | 22.6(14.7-32.4) | 0.690 |
| ≥ 6 | 15 | 65.2(44.9-82.0) | 8 | 34.8(18.0-55.1) | 42 | 73.7(61.3-83.7) | 15 | 26.3(16.3-38.7) | |||
| Number of daily meals | ≤ 3 | 24 | 68.6(52.2-82.0) | 11 | 31.4(18.0-47.8) | 1.000 | 35 | 67.3(53.9-78.9) | 17 | 32.7(21.1-46.1) | 0.102 |
| > 3 | 27 | 65.9(50.7-78.9) | 14 | 34.1(21.1-49.3) | 72 | 80.9(71.8-88.0) | 17 | 19.1(12.0-28.2) | |||
| Smoking | Yes | 13 | 76.5(53.3-91.5) | 4 | 23.5(8.5-46.7) | 0.398 | 14 | 51.9(33.6-69.7) | 13 | 48.1(30.3-66.4) | 0.002 |
| No | 38 | 64.4(51.7-75.7) | 21 | 35.6(24.3-48.3) | 93 | 81.6(73.7-87.9) | 21 | 18.4(12.1-26.3) | |||
| Alcohol consumption | Yes | 17 | 53.1(36.2-69.5) | 15 | 46.9(30.5-63.8) | 0.047 | 15 | 65.2(44.9-82.0) | 8 | 34.8(18.0-55.1) | 0.194 |
| No | 34 | 77.3(63.4-87.7) | 10 | 22.7(12.3-36.6) | 92 | 78.0(69.9-84.7) | 26 | 22.0(15.3-30.1) | |||
| Opioids consumption | Yes | 3 | 75.0(28.4-97.2) | 1 | 25.0(2.8-71.6) | 1.000 | 0 | 0 | 0 | 0 | 1.000 |
| No | 48 | 66.7(55.3-76.7) | 24 | 33.3(23.3-44.7) | 107 | 75.9(68.3-82.4) | 34 | 24.1(17.6-31.7) | |||
| Diagnosed with disease(s) | Yes | 23 | 65.7(49.2-79.7) | 12 | 34.3(20.3-50.8) | 1.000 | 65 | 75.6(65.8-83.7) | 21 | 24.4(16.3-34.2) | 1.000 |
| No | 28 | 68.3(53.2-80.9) | 13 | 31.7(19.1-46.8) | 42 | 76.4(64.6-86.1) | 13 | 23.6(13.9-36.0) | |||
| Medication | Yes | 4 | 50.0(19.9-80.1) | 4 | 50.0(19.9-80.1) | 0.427 | 35 | 71.4(57.8-82.6) | 14 | 28.6(17.4-42.2) | 0.411 |
| No | 47 | 69.1(57.5-79.1) | 21 | 30.9(20.9-42.5) | 72 | 78.3(69.0-85.7) | 20 | 21.7(14.3-31.0) | |||
| Dietary supplementation | Yes | 10 | 76.9(50.3-93.0) | 3 | 23.1(7.0-49.7) | 0.526 | 23 | 79.3(62.2-90.9) | 6 | 20.7(9.1-37.8) | 0.808 |
| No | 41 | 65.1(52.8-76.0) | 22 | 34.9(24.0-47.2) | 84 | 75.0(66.4-82.3) | 28 | 25.0(17.7-33.6) | |||
| Memory enhancement supplementation | Yes | 5 | 38.5(16.5-65.0) | 8 | 61.5(35.0-83.5) | 0.024 | 16 | 61.5(42.4-78.2) | 10 | 38.5(21.8-57.6) | 0.075 |
| No | 46 | 73.0(61.2-82.8) | 17 | 27.0(17.2-38.8) | 91 | 79.1(71.0-85.8) | 24 | 20.9(14.2-29.0) | |||
Table 4.
Incidence of diseases in children and adult students.
| Children | Adults | ||||
| Number of students | Percentage | Number of students | Percentage | ||
| Diagnosed with diseases(s) | Yes | 525 | 34.0% | 121 | 55.8% |
| No | 1020 | 66.0% | 96 | 44.2% | |
| Diagnosis | Allergic diseases | 279 | 18.1% | 71 | 32.7% |
| Pulmonary diseases | 126 | 8.2% | 24 | 11.1% | |
| Skin diseases | 122 | 7.9% | 22 | 10.1% | |
| Gastrointestinal diseases | 52 | 3.4% | 17 | 7.8% | |
| Mental diseases | 37 | 2.4% | 20 | 9.2% | |
| Heart diseases | 29 | 1.9% | 6 | 2.8% | |
| Blood diseases | 26 | 1.7% | 5 | 2.3% | |
| Kidney diseases | 23 | 1.5% | 8 | 3.7% | |
| Bone diseases | 21 | 1.4% | 5 | 2.3% | |
| Metabolic diseases | 15 | 1.0% | 7 | 3.2% | |
| Hypertension | 11 | 0.7% | 11 | 5.1% | |
| Type 1 Diabetes | 5 | 0.3% | 1 | 0.5% | |
| Dyslipidaemia | 5 | 0.3% | 3 | 1.4% | |
| Cancer | 1 | 0.1% | 1 | 0.5% | |
| Stroke | 1 | 0.1% | 2 | 0.9% | |
| Type 2 Diabetes | 0 | 0.0% | 0 | 0.0% | |
Table 5.
Logistic regression results for significant variables in Step 5 and Step 6, for children’s and adults’ data, respectively.
Table 5.
Logistic regression results for significant variables in Step 5 and Step 6, for children’s and adults’ data, respectively.
| B | S.E. | Wald | df | Sig. | Exp(B) | 9.5% C.I. for EXP(B) | |||
| Lower | Upper | ||||||||
| Children | |||||||||
| Step 5 | Age | -0.137 | 0.026 | 27.127 | 1 | <0.001 | 0.872 | 0.829 | 0.918 |
| Time of sleep per day | -0.561 | 0.144 | 15.071 | 1 | <0.001 | 0.571 | 0.430 | 0.758 | |
| Hours spent sitting down, daily, during the weekend | 0.288 | 0.090 | 10.369 | 1 | 0.001 | 1.334 | 1.119 | 1.590 | |
| Cookies | -0.168 | 0.050 | 11.264 | 1 | <0.001 | 0.845 | 0.767 | 0.933 | |
| Sex* | -0.576 | 0.160 | 12.907 | 1 | <0.001 | 0.562 | 0.410 | 0.770 | |
| Constant | 2.704 | 0.736 | 13.489 | 1 | <0.001 | 14.934 | |||
| Adults | |||||||||
| Step 6 | Cookies | 0.307 | 0.128 | 5.703 | 1 | 0.017 | 1.359 | 1.057 | 1.748 |
| Soy alternatives | -0.840 | 0.329 | 6.534 | 1 | 0.011 | 0.432 | 0.227 | 0.822 | |
| Light sodas | 0.329 | 0.136 | 5.850 | 1 | 0.016 | 1.390 | 1.064 | 1.815 | |
| Tea and infusions | 0.307 | 0.115 | 7.094 | 1 | 0.008 | 1.359 | 1.084 | 1.702 | |
| Coffee | 0.258 | 0.082 | 9.867 | 1 | 0.002 | 1.295 | 1.102 | 1.521 | |
| Coffee substitutes | -0.320 | 0.131 | 5.981 | 1 | 0.014 | 0.726 | 0.562 | 0.938 | |
| Constant | -3.894 | 0.991 | 15.443 | 1 | <0.001 | 0.020 | |||
*1=Male;2=Female; B = regression coefficient; S.E. = standard error; Wald = Wald chi-square test; df = degrees of freedom; Sig. = significance level; Exp(B) = odds ratio; C.I. = confidence interval.
Disclaimer/Publisher’s Note: The statements, opinions and data contained in all publications are solely those of the individual author(s) and contributor(s) and not of MDPI and/or the editor(s). MDPI and/or the editor(s) disclaim responsibility for any injury to people or property resulting from any ideas, methods, instructions or products referred to in the content. |
© 2025 by the authors. Licensee MDPI, Basel, Switzerland. This article is an open access article distributed under the terms and conditions of the Creative Commons Attribution (CC BY) license (http://creativecommons.org/licenses/by/4.0/).
Copyright: This open access article is published under a Creative Commons CC BY 4.0 license, which permit the free download, distribution, and reuse, provided that the author and preprint are cited in any reuse.


