
Submitted:
20 August 2025
Posted:
21 August 2025
You are already at the latest version
Abstract
Background/Objectives: Childhood obesity in Chile, particularly in southern regions, is driven by unhealthy eating habits, physical inactivity, and socioeconomic inequali-ties. Adherence to the Mediterranean diet has been linked to metabolic, cardiovascular, and psychosocial benefits in children, while Health-Related Quality of Life (HRQoL) is a key indicator of well-being. This study aimed to describe and analyze adherence to the Mediterranean diet and HRQoL in Chilean schoolchildren, and to assess the psy-chometric performance of the KIDSCREEN-27 in this context. Methods: A cross-sectional study was conducted with 356 schoolchildren (52% boys; 7–14 years) from municipal, subsidized, and private schools in Valdivia, Los Ríos Region. Adher-ence was assessed using the KIDMED questionnaire, and HRQoL with the KID-SCREEN-27. Exploratory and confirmatory factor analyses produced an adapted 20-item version (KIDSCREEN-20). Reliability was estimated with Cronbach’s alpha, and associations with sociodemographic variables were analyzed using Kendall’s Tau-C, Goodman–Kruskal’s Gamma, and Chi-square tests. Results: The KID-SCREEN-20 showed high internal consistency (α=0.876) and excellent fit indices (χ²/df=1.15, RMSEA=0.021, CFI=0.998). No significant associations were found between HRQoL or KIDMED scores and age, grade, type of school, or area of residence. A weak, non-practically relevant association was observed between HRQoL and sex (p=0.023). Conclusions: Adherence to the Mediterranean diet and HRQoL in this sample were not influenced by sociodemographic factors, suggesting that equitable access to re-sources and inclusive school programs may reduce disparities. The adapted KID-SCREEN-20, derived from factor analyses, showed high reliability and strong psycho-metric properties, supporting its potential use in future research in similar contexts.
Keywords:
nutritional quality
; quality of life
; physical activity and health
; mood and feelings
; family and leisure time
; time with friends
; school life
1. Introduction
Childhood obesity is a priority public health issue in Chile, with a particularly marked upward trend in the southern regions of the country. This situation can be explained by the interaction of factors such as poor diet, physical inactivity, and structural conditions in the school and family environment, all of which are closely linked to socioeconomic inequalities that negatively affect healthy lifestyles in childhood [1]. According to the 2024 Nutritional Map of the National School Assistance and Scholarship Board (JUNAEB), 50.9% of schoolchildren are malnourished due to excess, with 6% classified as severely obese and only 43.4% with a nutritional status appropriate for their age [2].
Excess weight in school-age children is associated with an increased risk of developing chronic noncommunicable diseases, such as type 2 diabetes, high blood pressure, and dyslipidemia [3]. The World Health Organization (WHO) has warned about the physical and psychosocial consequences of childhood obesity, including social discrimination, low self-esteem, and a lower quality of life [4].
The food environment in Chile encourages unhealthy habits from an early age. The high availability and frequent consumption of ultra-processed foods, such as sugary drinks, cookies, refined cereals, and high-sodium snacks, is a constant in both homes and educational establishments [5,6]. These products are a regular part of school snacks, contributing significantly to daily caloric excess and the creation of an obesogenic environment that is difficult to reverse without structural interventions [7].
In addition, ultra-processed foods are characterized by their low nutritional density and high palatability, which can alter satiety mechanisms and promote overeating [8]. Regular consumption of these foods has been linked to an increased risk of obesity, dyslipidemia, and metabolic disorders such as insulin resistance [9,10]. According to the NOVA classification, these products correspond to industrial formulations that incorporate ingredients used exclusively for technological purposes, progressively displacing fresh and minimally processed foods into dietary patterns [10].
Despite the implementation of school policies such as Food-Based Dietary Guidelines and healthy kiosks, student adherence remains low. In Santiago, only 20% of schoolchildren comply with at least three of the recommendations established in the FBG, and more than 90% do not reach the minimum recommended daily intake of vegetables [11]. This limited effectiveness is exacerbated by persistent structural barriers, including the low priority given to health education in the curriculum, the lack of institutional leadership, and insufficient resources for effective implementation [12].
The Mediterranean diet has been shown to have protective effects in the Chilean school population. Greater adherence to this dietary pattern has been associated with metabolic and cardiovascular benefits, as well as a better perceived quality of life [13,14]. However, maintaining sustained adherence remains a challenge, particularly in vulnerable urban contexts and rural areas in the south of the country [6].
From a physiological perspective, the Mediterranean diet is characterized by its high content of antioxidant and anti-inflammatory compounds, such as polyphenols, monounsaturated fatty acids, and omega-3, which modulate inflammatory pathways, reduce pro-inflammatory cytokines, and improve endogenous antioxidant capacity [15,16]. In children and adolescents, greater adherence to this dietary pattern has been associated with lower systemic inflammation, a better metabolic profile, and reduced insulin resistance, especially in the presence of obesity or risk of metabolic syndrome [17,18].
Health-related quality of life (HRQoL) is a multidimensional construct that encompasses physical, emotional, social, and academic domains, and its analysis in children has become increasingly relevant in public health [19,20]. Various studies have shown that a balanced diet, based on adequate consumption of fruits, vegetables, legumes, and good-quality fats, is associated with higher levels of general well-being, better self-esteem, and more positive mental health [21,22].
Micronutrients such as iron, zinc, B vitamins, and omega-3 fatty acids have been shown to be directly associated with cognitive function, neurological development, and emotional regulation in children [23]. In fact, a recent review concludes that supplementation with iron and multiple micronutrients improves cognitive abilities in malnourished preschool children, while fish consumption (rich in omega-3) benefits cognitive development even in well-nourished children [24]. In addition, studies in adolescents have found that high blood iron levels are associated with better sustained attention and cognitive performance [25]. On the other hand, the most recent evidence indicates that omega-3 fatty acids, particularly EPA and DHA, contribute to neuronal development, reduce neuroinflammation, and promote executive function, although their effects vary depending on the stage of development [23].
Several studies have reported that childhood obesity is associated with lower perceived well-being, higher levels of anxiety, and impaired HRQoL [26,27]. In contrast, a balanced diet has been shown to have positive effects on variables such as mood, perceived energy, and body satisfaction [28,29]. Among Chilean schoolchildren, lower levels of HRQoL have been observed more frequently in girls and in contexts of high social vulnerability, reinforcing the need to design differentiated strategies according to gender and sociocultural environment to address these gaps [30,31].
The school environment is a strategic space for promoting healthy habits in children. However, it faces significant structural limitations that hinder the implementation of sustained interventions over time [32]. Among the main factors identified are the low number of hours allocated to physical education [33], the lack of teacher training in nutrition [34], and the limited integration of health-related content into the curriculum [35].
According to the Chile’s 2022 Report Card on Physical Activity for Children and Adolescents, the school environment in Chile has been rated poorly in terms of its contribution to the physical activity of children and adolescents, obtaining only a “C” on the international scale and a 4.0 on the national scale [36]. This report warns that, despite advances in public policy, significant gaps remain in infrastructure, implementation, and equitable access to opportunities for physical activity, especially in vulnerable school settings.
Organizations such as the US Preventive Services Task Force suggest that effective school interventions for obesity prevention require at least 26 hours of direct contact [37], a difficult goal to achieve in school systems with overloaded curricula. Therefore, it is recommended to combine school actions with family and community strategies, adapted to the territorial and sociocultural realities of students [38].
The post-pandemic context has intensified inequalities in school health. During the COVID-19 lockdown, there was an increase in sedentary lifestyles, excessive screen use, and deterioration of eating habits among Chilean schoolchildren, with a greater impact on lower socioeconomic sectors [39,40]. This had negative effects on HRQoL, self-esteem, and emotional well-being [41,42].
It is now recognized that the most effective interventions against childhood obesity integrate biological, psychological, and social factors. Those that combine family, school, and community components have proven to be more effective in reducing BMI, improving eating habits, and increasing HRQoL. In this vein, evidence shows that multicomponent strategies focused on physical activity, nutrition education, and a biopsychosocial approach achieve clinically significant reductions in BMI and zBMI, without adverse effects or increased inequalities, while promoting adherence and child well-being [43,44].
In Chile, it has been shown that factors such as age, gender, and motivation directly influence the lifestyles of schoolchildren [30]. Internationally, it is suggested that nutritional interventions should be culturally and regionally adapted, especially in contexts in the Global South (45).
In this context, coordination between school strategies and family actions is essential to achieve sustained behavioral changes in nutrition and well-being. Multifaceted interventions that integrate nutrition education, psychosocial support, and environmental improvements have been shown to reduce BMI and improve health-related quality of life, both in Chile and internationally [46,47].
Although Chile has implemented public policies aimed at improving physical activity levels in children, the 2022 Report Card shows that these efforts have not led to widespread behavioral changes. The report attributes this to the ongoing fragmentation and lack of coordination across initiatives, limiting their long-term impact and reach [36].
Considering the high prevalence of childhood obesity, low levels of adherence to healthy eating guidelines, and deficits in HRQoL observed in Chilean schoolchildren, it is necessary to generate contextualized evidence to guide future educational and health strategies.
From a conceptual perspective, this study is based on the dynamic interaction between the food environment, consumption habits, nutritional status, and perception of well-being among schoolchildren, considering the modulating influence of the school and family environment.
Given the limited knowledge about dietary habits and HRQoL in Chilean schoolchildren, especially in southern regions of the country, the objective of this study was to describe and analyze levels of adherence to healthy dietary patterns and perceptions of HRQoL in children aged 7 to 14 years who attend municipal, subsidized, and private schools. The results will generate contextualized evidence to guide the design of more effective and culturally relevant educational and health policies.
2. Materials and Methods
2.1. Participants
The study was conducted in the Los Ríos Region, located in southern Chile, with the aim of describing and analyzing levels of adherence to healthy eating patterns and perceptions of HRQoL in the school population. A total of 356 students participated (52% male and 48% female), aged between 7 and 14 years. The sample included schoolchildren from rural and urban areas, belonging to the three types of educational institutions recognized in Chile: municipal (public), subsidized (semi-public), and private.
The students were in grades 3 to 6 of basic education, according to the Chilean educational system, and were selected through non-probabilistic convenience sampling, with the aim of ensuring territorial representation and representation by type of school. The inclusion criteria considered current enrollment in one of the participating schools, belonging to the target age and grade range, and not presenting cognitive or physical conditions that would hinder the understanding or application of the instruments.
2.2. Context
Chile is currently classified as a high-income country by the World Bank [48] and is highly urbanized: according to estimates by the National Institute of Statistics (INE), more than 88% of its population, which will exceed 20 million inhabitants in 2025, resides in urban areas, mainly concentrated in the Santiago Metropolitan Region [49]. Its cultural identity combines indigenous roots (Mapuche, Aymara, and other native peoples) and a strong European heritage, with Spanish as the common language [50]. Despite advances in health, education, and economic growth, Chile continues to have high levels of social inequality, which significantly affect the well-being and development opportunities of children and adolescents [51].
According to the Köppen–Geiger climate classification, Chile is predominantly characterized by a Mediterranean climate [52,53]. This climatic condition, together with local agricultural production, has historically favored eating patterns that share characteristics with the Mediterranean diet, such as high consumption of fruits, vegetables, and legumes. Given the evidence of its protective effects on metabolic and cardiovascular health in children, adherence to this dietary pattern is relevant for nutritional surveillance in the school population [13,14].
2.3. Instruments
Two validated instruments were used to collect the information. The first was the KIDMED questionnaire [54], consisting of 16 items that assess the nutritional quality of the Mediterranean Diet, including the consumption of fruits, vegetables, cereals, dairy products, fast food, and sweets. Each favorable response adds +1 point, while unfavorable responses subtract −1, resulting in a total score between 0 and 12. This is interpreted as: ≥8 points (optimal adherence), 4–7 (needs improvement), and ≤3 (very low adherence). The instrument has been previously used in the Chilean adolescent population, showing adequate applicability for assessing dietary habits in this age group [55].
The second instrument used was the KIDSCREEN-27 questionnaire [56], which assesses HRQoL in children and adolescents across five dimensions: physical well-being, psychological well-being, autonomy and relationship with parents, social support, and school environment. Each item is answered using a 5-point Likert scale: never, almost never, sometimes, almost always, and always. The questionnaire was self-administered in digital format, after informed consent was obtained, without collecting identifiable information. In Chile, the instrument has been adapted and validated, demonstrating high reliability (α = 0.89) and adequate psychometric validity [57]. Presented in 5 groups of items: Physical Activity and Health (PAH), Mood and Feelings (MAF), Family and Leisure Time (FLT), Time with Friends (TWF), and School Life (SCL).
2.4. Data Analysis and Processing Procedures
The research aim established in the previous section has been accompanied by two types of hypotheses, which are detailed below.
Hypothesis of the factors:
H1:
The KIDSCREEN-27 scale has a factorial structure composed of five dimensions—Physical Activity and Health (PAH), Mood and Feelings (MAF), Family and Leisure Time (FLT), Time with Friends (TWF), and School Life (SCL)—that fits the theoretical model well, showing acceptable fit indices in both exploratory and confirmatory factor analysis in schoolchildren in Valdivia, Chile.
H01:
The factor structure of the KIDSCREEN-27 scale does not fit the theoretical model of five dimensions, showing significant differences in factor configuration or inadequate fit indices in exploratory and/or confirmatory factor analysis in schoolchildren in Valdivia, Chile.
Hypothesis of the correlations:
H2:
(Alternative hypothesis): There is a significant correlation between the sociodemographic variable and KIDSCREEN-27 scale, such that KIDSCREEN-27 scores would vary as individuals’ sociodemographic variables vary, in schoolchildren in Valdivia, Chile.
H02:
(Null hypothesis): There is no significant correlation between the sociodemographic variable and the KIDSCREEN-27 scale, in schoolchildren in Valdivia, Chile.
H3:
(Alternative hypothesis): There is a significant correlation between the sociodemographic variable and KIDMED Level values, such that KIDMED Level scores would vary as individuals’ sociodemographic variables vary, in schoolchildren in Valdivia, Chile.
H03:
(Null hypothesis): There is no significant correlation between the sociodemographic variable and the KIDMED Level values, in schoolchildren in Valdivia, Chile.
Using SPSS version 23 software (IBM, New York, NY, USA), the 27 items of the KIDSCREEN-27 were analyzed by evaluating their psychometric properties [57,58]. First, a univariate descriptive statistical analysis was executed, focusing on variance (>0), skewness (|≤1|), and kurtosis (|≤1|) [59]. We find it necessary to give a slack of decimal points over 1, especially to the kurtosis in which we will allow a maximum of 1.8 [60].
To measure confidence levels, the authors applied the measurement of sampling adequacy (MSA) by anti-image correlation matrix [61], and Kaiser–Meyer–Olkin (KMO) measure of sampling adequacy. Furthermore, the authors used Bartlett’s test of sphericity to identify items that belonged to factors within the scale as a form of exploratory factor analysis (EFA) with extraction method unweighted least squares (ULS), and rotation method Oblimin with Kaiser normalization [62], identifying through EFA the underlying structure of the data at the factor level, as a preliminary step to conducting a more structured analysis.
The authors then analyzed the exploratory factors using confirmatory factor analysis (CFA) developed with FACTOR version 12.01.02 software (Rovira i Virgili University, Tarragona, Spain) [63], with polychoric correlation using Hull’s method and Robust Unweighted Least Squares (RULS) [64] and Rotation Normalized Direct Oblimin, revising the Measure of Sampling Adequacy (MSA) [65], and choosing a set of factors that feature high communalities, strong factor loadings relative to the sample size, and a minimal number of items per factor (MIF) [66,67,68]. Reporting the indicators detailed in Table 1 [67]: Chi-square ratio/degree of freedom (χ2/df), root mean square error of approximation (RMSEA), adjusted goodness-of-fit index (AGFI), goodness-of-fit index (GFI), comparative fit index (CFI), non-normed fit index (NNFI), and root mean square root of residuals (RMSR) [69]. Thus, the CFA, based on the results of the EFA, makes it possible to confirm whether a theoretical factor structure fits the data well, verifying whether the proposed theoretical model of factors has empirical validity.
In addition, the internal reliability of the resulting instrument will be validated by calculating Cronbach’s Alpha using SPSS 23 software [70,71].
Finally, once the empirical validity of the factors has been proven by the CFA, the resulting score of the KIDSCREEN-27 questionnaire will be obtained, to be analyzed in contrast with some relevant sample characteristics, identifying possible differences that affect socially responsible behavior results. Thus, the weighted health-related quality of life levels, given the latent factors, resulting from the evaluation of the students, will be analyzed by means of cross-tabulations between social responsibility and the variables: Sex (SEX), Age (AGE), Grade (GRD), Living Area (LIA), Kind of School (KOS), and KIDMED Level (KML), using Kendall’s Tau-C and Goodman–Kruskal’s Gamma tests to measure their symmetrical association, where values close to 1 indicate a positive association, values close to –1 indicate a negative association, and values close to 0 indicate neither a positive nor a negative association [72,73]. In extreme situations, this set of symmetrical tests will be reinforced by Chi-Square tests between these specific variables.
2.5. Ethical Procedures
The study was carried out in accordance with the ethical principles outlined in the Declaration of Helsinki for research involving human subjects. Written informed consent was obtained from parents, mothers, or legal guardians, along with assent from the participating students (see Informed Consent Statement). As this was a non-interventional observational study based on anonymous and non-invasive questionnaires, approval by a formal ethics committee, in accordance with the institutional regulations in force at the time of data collection.
3. Results
3.1. Sample Characterization
The nutritional quality of the diet scale (KIDMED) [54,55] and health-related quality of life (HRQoL) factorial scale for schoolchildren (KIDSCREEN-27) [56,57] were applied in the first academic semester 2025 to a set of 356 effective participants (≥200, overcoming small sample sizes for factorial analysis) [74], school students from the Valdivia City in Los Rios Region of Chile, a territory with one of the highest rates of malnutrition due to excess in the country (55.3%) and a low proportion of schoolchildren with normal weight (40.9%). This profile is influenced by marked rurality, traditional dietary patterns rich in calorie-dense foods, and socioeconomic vulnerability, factors that collectively increase the risk of childhood overweight and obesity. [2]. The 356 participants are characterized as shown in Table 2.
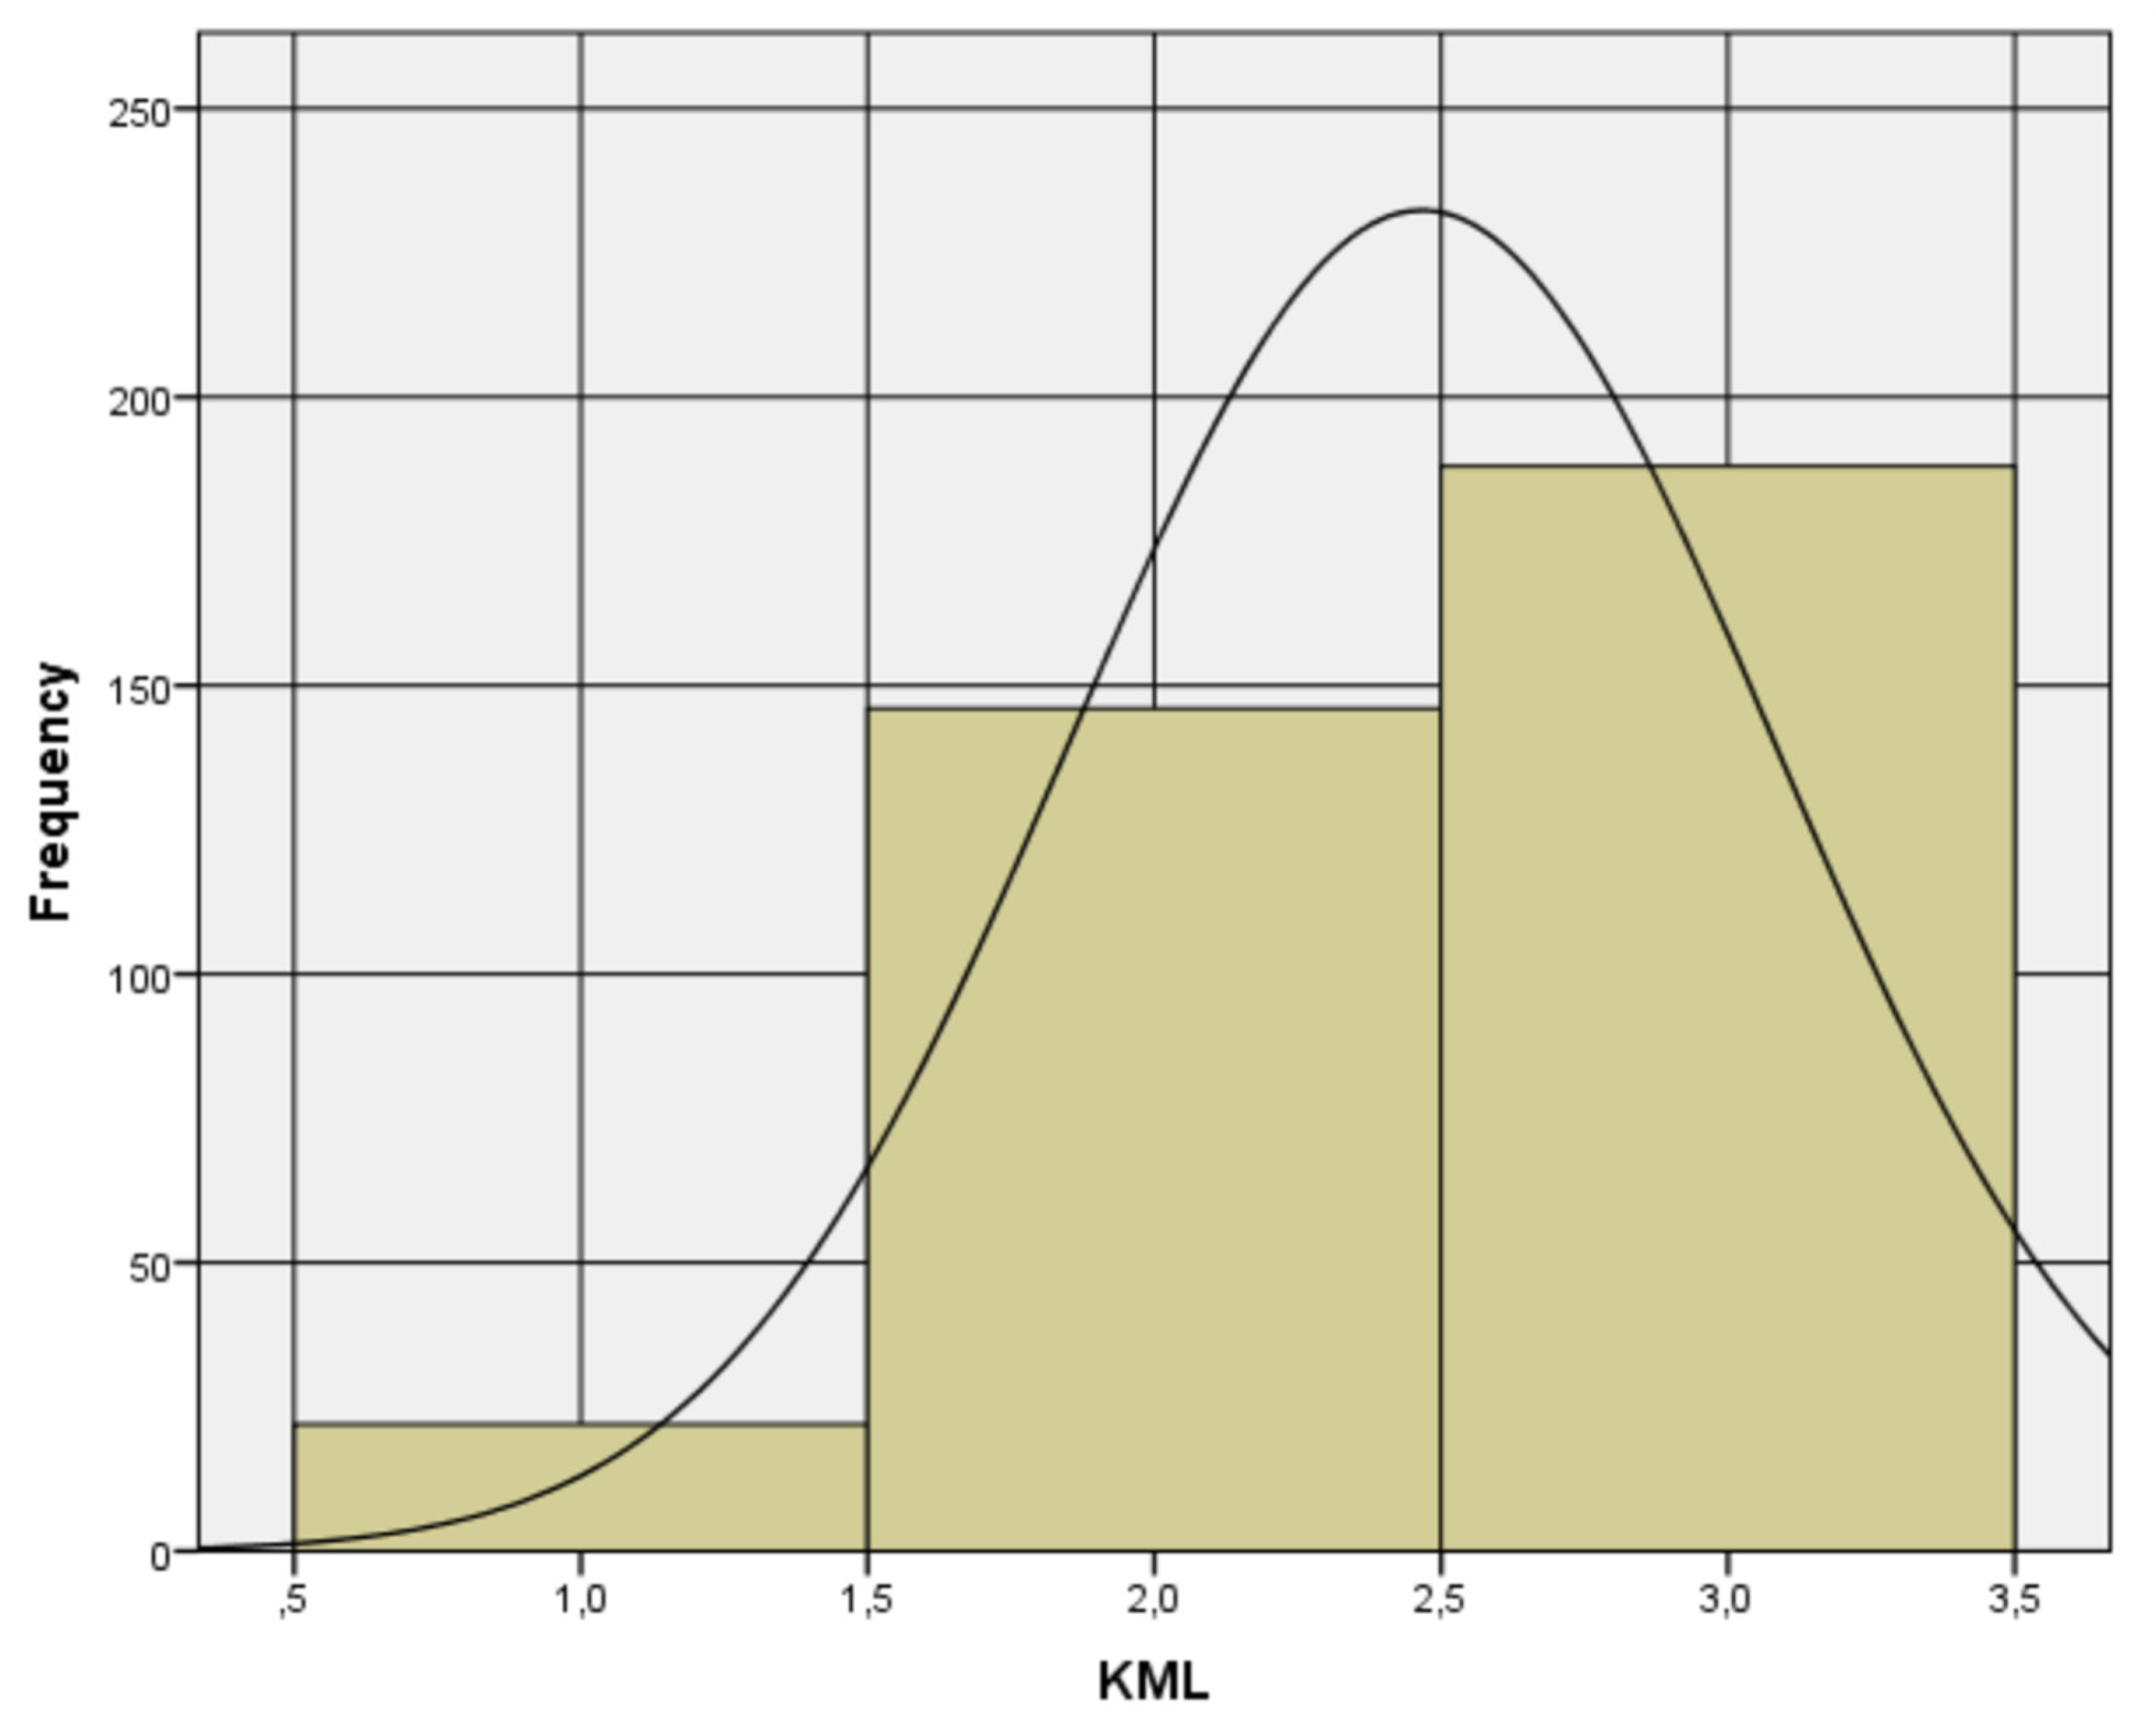
In the case of KIDMED by levels (very low dietary quality, intermediate dietary quality, and optimal dietary quality), called variable KML, the result with 356 valid cases, a mean of 2.47, and good univariate parameters of variance (0.374 > 0), skewness (|−0.690| ≤ 1), and kurtosis (|−0.482| ≤ 1).
Figure 1.
Histogram of KML variable.
3.2. Validation by Exploratory and Confirmatory Factor Analysis
First, the possible prevalence of the factors identified by Molina et al. [57] in Chile was investigated. These five original factors address health-related quality of life patterns and perceptions in: Physical Activity and Health (PAH), Mood and Feelings (MAF), Family and Leisure Time (FLT), Time with Friends (TWF), and School Life (SCL). When performing the univariate descriptive statistical analysis, none of the ordinal variables showed a variance of zero, indicating that they all contribute to the common variance. And the variables present adequate skewness and kurtosis, as detailed in Table 3.
Thus, 27 reported items can be considered in the exploratory factor analysis (EFA) of the KIDSCREEN-27 questionnaire [56,57]. MAF1, MAF2, MAF3, MAF7, FLT1, FLT2, FLT4 are lost for loading less than 0.40; therefore, a final exploratory readjustment with 20 variables is performed (See Figure 2). This reduced set of 20 items constitutes the adapted KIDSCREEN-20 version for the present study, obtained through item elimination based on factor loadings <0.40 following the exploratory factor analysis. This adaptation was developed exclusively for this research and does not correspond to an officially standardized version by the original authors.
Table 4 shows the result of the exploratory factor analysis preserving 20 variables (items) with Cronbach’s Alpha 0.876 (>0.8) and determining with SPSS 23 a KMO of 0.875 and Bartlett’s test with a Chi-square of 2387.848 with 190 degrees of freedom and a significance level of 0.000 for the five factors of the KIDSCREEN instrument. We obtained 47.046% of the variance explained. Although these results are viewed positively, it is noted that factor 5 does not meet the suggested minimum number of items per factor (≥3) [66,68,74], which prompts us to explore a new option for variable reduction.
The authors also performed a confirmatory factor analysis (CFA) on the data set composed of 20 variables, using FACTOR software. The Measure of Sampling Adequacy (MSA) [65] no suggests eliminating items with confidence intervals at 90% and minimum values of more than 0.5.
Then, the CFA applied for a sample of 356 obtained a good KMO (Kaiser–Meyer–Olkin) equal to 0.87493 (>0.8) and Bartlett’s test of sphericity equal to 3226.8 with 190 degrees of freedom and a significance level of 0.000010. Those results are significant and good enough to present the adequacy of the polychoric correlation matrix (see Table 5). The authors then reduced the KIDSCREEN-27 questionnaire in terms of its latent variables into five factors (see Table 5), using the Hull method, implemented by performing an adequacy of the polychoric correlation matrix.
Table 6 sets out the proposed model results for the χ2/df, RMSEA, AGFI, GFI, CFI, NNFI (TLI), and RMSR indicators by FACTOR software with a good fit.
Finally, Table 7 shows the instrument’s internal reliability by SPSS 23 software, with a total Cronbach’s Alpha of 87.6% for the set of 20 items, and Figure 3 presents a histogram of the resulting scale with 356 valid cases, a mean 3.94, and good univariate parameters of variance (0.675 > 0), skewness (|-0.401| ≤ 1), and kurtosis (|−0.390| ≤ 1).
Consequently, it is possible to assert that the proposed theoretical model of the factors has empirical validity.
3.3. Resulting Scale Analysis
The resulting scale with 20 items (KIDSCREEN-20) and KIDMED Level (KML) are analyzed using means of cross-tables with the variables: Sex (SEX), Age (AGE), Grade (GRD), Living Area (LIA), Kind of School (KOS), and cross-table between KIDSCREEN-20 and KIDMED Level (KML), using Kendall’s Tau-C and Goodman–Kruskal’s Gamma tests to measure their symmetrical association [72,73]. As an outcome of this analysis, the resulting scale does not present statistically significant differences for the diverse values of the characterization variables in the sample studied (See Table 8).
Although the p-value is less than 0.05, the value of the statistic indicates a weak relationship that cannot be confirmed. For further details, the Pearson Chi-Square Tests for two specific cross tables are reported (see Table 9).
These results reinforce the lack of evidence to establish an association between these pairs of variables. (see Figure 4).
To conclude Section 3, statistical analyses allowed us to test the proposed hypotheses. Regarding the factor structure, the null hypothesis (H01), which proposed that the KIDSCREEN-27 did not fit the theoretical five-dimensional model, was rejected, while the alternative hypothesis (H1) was accepted. Exploratory and confirmatory analyses showed adequate fit indices and high internal reliability (α = 0.876), thus validating the adapted 20-item version for the study population.
Regarding the correlation hypotheses, no statistically significant differences were found between the KIDSCREEN-20 and KIDMED scores and the sociodemographic variables considered (gender, age, grade, area of residence, and type of school). The only exception was a weak association between KIDS-CREEN-20 and gender (p = 0.023), the magnitude of which does not allow for practical relevance to be attributed. These findings indicate that, in the sample analyzed, health-related quality of life and adherence to the Mediterranean diet were not conditioned by the sociodemographic characteristics evaluated.
4. Discussion
This study provides unprecedented evidence on the relationship between adherence to the Mediterranean diet, assessed using the KIDMED questionnaire, and HRQoL in schoolchildren in Valdivia, Los Ríos Region, one of the areas with the highest prevalence of malnutrition due to excess in Chile. This region, which has consistently ranked among the three most affected, has sociocultural and geographical conditions characterized by marked rurality, traditional high-calorie dietary patterns, and high levels of socioeconomic vulnerability [2]. In this context, documenting a pattern of homogeneity in both adherence to the Mediterranean diet and HRQoL, despite these conditions, constitutes a substantial contribution to the international literature, providing a unique case from Latin America that challenges the global trend that usually reports marked gaps by sex, age, or socioeconomic level and offering an empirical framework that can be replicated in comparable contexts. that challenges the global trend that usually reports marked gaps by sex, age, or socioeconomic status and offering an empirical framework that can be replicated in comparable contexts.
This study represents, to our knowledge, the first joint assessment in the Chilean school population that integrates adherence to the Mediterranean diet and HRQoL with a psychometric analysis adapted from KIDSCREEN. The full version of KIDSCREEN-27 was applied; however, exploratory and confirmatory factor analyses showed that seven items had low factor loadings and did not contribute substantially to the structure of the instrument in this sample. Therefore, an adapted version of 20 items (KIDSCREEN-20) was used, which showed excellent internal reliability (α = 0.876) and optimal model fit indices (χ2/df = 1.15, RMSEA = 0.021, CFI = 0.998, NNFI = 0.996), which supports the psychometric soundness of the measurements. It is important to emphasize that this adjustment does not correspond to a formal validation process for a new instrument, but rather to a specific statistical adaptation to optimize measurement in the specific context of this research.
No statistically significant associations were identified between HRQoL or adherence to the Mediterranean diet and sociodemographic variables, except for a weak relationship between HRQoL and gender (Tau-C = 0.128; Gamma = 0.192; p = 0.023), which is not clinically relevant. This pattern of homogeneity contrasts with national and international evidence, which usually reports significant differences in dietary quality and child health indicators based on social determinants such as socioeconomic status, area of residence, or family eating practices [75,76,77], as well as higher levels of motivation toward physical activity in males [30,78] and, in some cases, differences in adherence to healthy eating patterns according to sex.
The global literature indicates that adherence to the Mediterranean diet and HRQoL tend to be positively associated, albeit modestly and with high heterogeneity, in children and adolescents [79]. However, recent studies in diverse contexts, such as those by Conesa-Milian et al. [80] and Yurtdaş Depboylu et al. [81], have documented no differences by sex or age, supporting the idea that the lack of gaps is not unique to our context. Multinational research has agreed that socioeconomic status, availability, and access to healthy foods strongly influence adherence [82], supporting the hypothesis that, in environments with relatively homogeneous resources and opportunities, sociodemographic differences tend to diminish.
Although international evidence consistently shows that socioeconomic status influences diet quality and child well-being, no significant differences were observed in our sample of schoolchildren in Valdivia, suggesting a relatively homogeneous context that mitigates these gaps. This pattern has also been documented in other Latin American countries with comparable socioeconomic and nutritional conditions. A notable example is Brazil’s National School Feeding Program (PNAE), which offers menus with fresh foods, restricts ultra-processed foods and sugary drinks, and whose high coverage is associated with higher consumption of healthy foods and lower consumption of unhealthy foods [83,84]. Similarly, the Qali Warma program in Peru has improved dietary patterns and nutritional status in rural areas in extreme poverty, compared to urban areas without this benefit [85]. Overall, it is estimated that more than 80 million children in the region receive school meals, reinforcing the role of these programs as key tools for reducing inequalities and guaranteeing the right to adequate food [86].
These findings are consistent with international evidence, where the meta-analysis by López-Gil et al. [79] confirms that greater adherence to the Mediterranean diet is modestly but consistently associated with better HRQoL in children and adolescents, although with variability between contexts. Studies in Spain [80] and in Mediterranean countries such as Turkey, Italy, and Lebanon [87] show that even in regions culturally linked to this pattern, availability and cost remain significant barriers. Overall, our results suggest that when access to healthy foods is equitable and inclusive school policies are implemented, sociodemographic differences tend to diminish, creating scenarios that can serve as a reference for international strategies to promote child health and well-being.
This logic is also reflected in physical literacy and motivation toward physical activity. In Chilean schoolchildren assessed with the CAPL-2, Muñoz-Urtubia et al. [30] found significant differences in favor of boys, while Jekauc et al. [78] showed in European adolescents that motivational gaps widen with age, influenced by gender stereotypes, less social support, and cultural barriers. The absence of gaps in our sample could be linked to the homogeneity of opportunities and resources in the territory, together with inclusive school and community programs. In Los Ríos, the National School Physical Activity Plan has increased practice time, improved infrastructure, and promoted recreational and competitive activities [88], while the “Crecer en Movimiento” program promotes physical fitness and participation from ages 2 to 18, with an explicit focus on equity [89]. Previous evidence supports that these inclusive interventions reduce gender differences and promote comparable improvements in physical fitness [90].
Internationally, Kretschmer et al. [91] reported that boys engage in more moderate-to-vigorous physical activity than girls, while Boujelbane et al. [92] documented greater adherence to the Mediterranean diet among girls. Other factors, such as school age and type of school, also have an impact: students in lower grades have better eating habits, possibly due to greater family supervision, while in higher grades, autonomy and peer influence tend to deteriorate diet [93,94]. In addition, the administrative dependence of the school influences: on average, private schools show better health indicators, such as lower BMI and blood pressure, probably due to greater availability of resources [95,96]. However, in contexts with universal free school meals, nutritional quality may be higher due to strict standards and equitable access [97].
The absence of significant associations in this study could be explained by the combination of a relatively homogeneous distribution of opportunities and resources [98], low internal variability in adherence and HRQoL, which limits the ability to detect associations, and the influence of proximal determinants such as health literacy among children and families, including aspects of the food environment indirectly assessed by KIDMED, which promote healthy habits beyond sociodemographic differences [99,100]. Previous research, such as that by Kaniyagundi Podiya et al. [101] and Valstad Aasan et al. [102], has shown that positive school environments are associated with greater emotional well-being and less stress. Conversely, a lack of quality time at home or the absence of adequate recreational activities, as pointed out by Badri et al. [103], is linked to lower scores in family well-being and leisure time. Although this analysis was not a central objective, consistency with these findings reinforces the need to incorporate actions that strengthen interpersonal relationships and the school climate into child well-being strategies.
In summary, our results support the initial hypothesis of no marked gaps in contexts with high socioeconomic homogeneity and access to inclusive programs, suggesting that the school and community environment can modulate the impact of sociodemographic variables on the Mediterranean diet and HRQoL. Maintaining and strengthening these initiatives, adapting them to age-specific needs and incorporating gender-differentiated strategies where relevant, is key to preserving and improving child well-being [104,105]. Evidence shows that, with adequate nutrition education and school environments that promote healthy habits, any child can achieve a quality diet and a good level of well-being. Inclusive programs adapted to the context have been shown to improve fruit and vegetable consumption [106,107], promote healthy weight, and increase school attendance [108], underscoring the importance of combining universal approaches with locally adapted actions to ensure equal opportunities in health and well-being.
4.1. Strengths and Limitations of the Study
This study stands out for its territorial anchoring in a priority health region, the joint assessment of adherence to the Mediterranean diet and HRQoL, and the use of an adapted version of the KIDSCREEN-27 obtained from an exploratory factor analysis, which reduced the original version by seven items and presented excellent adjustment indices and high internal reliability. Its limitations include the cross-sectional design, convenience sampling, the self-report nature of the questionnaires, and a sample size that may be insufficient to detect small-magnitude associations. Although the reduction in items could limit comparability with other studies using the full version, the psychometric robustness obtained in this analysis partly mitigates this concern.
4.2. Practical Recommendations
The absence of significant differences in adherence to the Mediterranean diet and HRQoL according to age, type of establishment, or socioeconomic status suggests that, in contexts with a more equitable distribution of opportunities and resources, school feeding programs can contribute to homogenizing children’s diets and well-being. This finding is consistent with experiences in Latin America, such as the PNAE in Brazil and Qali Warma in Peru, which have improved dietary quality and reduced inequalities through the universal provision of healthy and culturally relevant foods, along with restrictions on ultra-processed foods. In Chile, these results support strengthening JUNAEB’s School Feeding Program by incorporating culturally adapted Mediterranean diet criteria and integrating nutrition education and physical activity. It is proposed to reinforce practical food literacy in the curriculum, expand the supply of fresh foods, and prioritize local and seasonal products, complemented by intersectoral interventions that bring together schools, families, and communities. Finally, it is recommended to implement continuous monitoring mechanisms to adjust, based on evidence, both dietary quality and HRQoL, ensuring inclusive programs that integrate education, physical activity, and improvements in the food environment, with special attention to higher grades and groups with greater barriers.
4.3. Future Research Directions
Future studies should delve deeper into differences in HRQoL and adherence to the Mediterranean diet according to gender, as well as compare rural and urban contexts using larger and more representative samples. It is important to incorporate the measurement of health literacy in both students and caregivers, evaluating its role as a possible mediator or moderator in the relationship between diet and well-being. It is also recommended to expand the scope to other regions through probabilistic sampling, conduct longitudinal follow-ups, and apply multilevel analyses that integrate variables associated with the food environment. The evaluation of multicomponent interventions that combine health literacy, environmental modifications, and family participation should include both clinical and psychosocial outcomes to generate solid evidence to guide policies and programs that promote equity and child well-being.
5. Conclusions
Among schoolchildren in Valdivia (Chile), adherence to the Mediterranean diet and HRQoL did not vary significantly according to age, type of school, or area of residence. Only a weak association between HRQoL and gender was observed, with no practical relevance. This pattern, which is uncommon compared to international evidence, suggests that a more equitable distribution of opportunities and resources could mitigate the inequalities commonly observed in children’s health and nutrition. The KIDSCREEN-20, obtained through exploratory and confirmatory factor analysis based on the original version, showed high reliability and psychometric robustness, which supports its potential use in future research in similar contexts. Confirming this pattern through longitudinal studies will allow for a better understanding of its determinants and guide more effective public policies to promote school health and well-being, considering successful experiences in other Latin American countries.
Supplementary Materials
The following supporting information can be downloaded at the website of this paper posted on Preprints.org, Table S1: HRQoL_Valdivia.csv.
Author Contributions
Conceptualization, S.P.-T. and N.M.-U.; methodology, S.P.-T, A.V.-M., and N.C.-B.; validation, S.P.-T., N.C.-B., and A.V.-.M.; formal analysis, A.V.-M., G.S.-S., and P.L-C.; investigation, S.P.-T., and N.M.-U.; resources, S.P.-T. and N.M.-U.; data curation, A.V.-M., G.S.-S., and P.L-C.; writing—original draft preparation, S.P.-T., S.V.-R., and N.M.-U.; writing—review and editing, S.P.-T., A.V.-M., N.C.-B. and N.M.-U.; visualization, G.S.-S., and P.L.-C.; supervision, S.P.-T., and A.V.-M.; project administration, S.P.-T.; funding acquisition, S.P.-T., A.V.-M., G.S.-S., N.C.-B, P.L-C., and S.V.-R. All authors have read and agreed to the published version of the manuscript.
Funding
This research was funded by Funded by Fondecyt Regular Project No. 1240883 and the Project INID210009 of the Vicerectory of Research, Development and Artistic Creation of the Universidad Austral de Chile, and the APC was funded directly or through publication incentives by Pontificia Universidad Católica de Valparaíso (Code APC2025), Universidad Arturo Prat (Code APC2025), Universidad Autónoma de Chile (Code APC2025), Universidad Bernardo O’Higgins (Code APC2025), Universidad Católica de la Santísima Concepción (Code APC2025), Universidad Central de Chile (Code APC2025), and Universidad de Las Américas (Code APC2025).
Institutional Review Board Statement
The study was conducted in accordance with the Declaration of Helsinki and approved by Ethics Committee of the Universidad Austral de Chile (protocol code IRI 14 - 2024, on 25 April 2024).
Informed Consent Statement
Informed consent was obtained from all subjects involved in the study.
Data Availability Statement
Available in Supplementary Materials.
Conflicts of Interest
The authors declare no conflicts of interest.
References
- Vega-Salas, M.J.; Caro, P.; Johnson, L.; Armstrong, M.E.G.; Papadaki, A. Socioeconomic inequalities in physical activity and sedentary behaviour among the Chilean population: A systematic review of observational studies. Int. J. Environ. Res. Public Health 2021, 18, 9722. [Google Scholar] [CrossRef]
- Junta Nacional de Auxilio Escolar y Becas (JUNAEB). Mapa Nutricional 2024: Resultados Abril de 2025; JUNAEB: Santiago, Chile, 2025; Available online: https://www.junaeb.cl/wp-content/uploads/2025/04/INFORME-MN_2024-1.pdf (accessed on 12 August 2025).
- World Health Organization. Global Action Plan on Physical Activity 2018–2030: More Active People for a Healthier World; WHO: Geneva, Switzerland, 2018; Available online: https://www.who.int/publications/i/item/9789241514187 (accessed on 12 August 2025).
- Organización Mundial de la Salud (OMS). Obesidad y Sobrepeso 2022. Available online: https://www.who.int/es/news-room/fact-sheets/detail/obesity-and-overweight (accessed on 12 August 2025).
- Marti, A.; Calvo, C.; Martínez, A. Consumo de alimentos ultraprocesados y obesidad: Una revisión sistemática. Nutr. Hosp. 2021, 38, 177–185. [Google Scholar] [CrossRef]
- Infante-Grandón, M.; Cerda, C.; León, M. Hábitos de vida saludable en estudiantes del sur de Chile. Rev. Latinoam. Cienc. Soc. Niñez Juventud 2022, 20, 1–25. [Google Scholar] [CrossRef]
- Kininmonth, A.R.; Schrempft, S.; Smith, A.; et al. Associations between the home environment and childhood weight change: A cross-lagged panel analysis. Int. J. Obes. 2022, 46, 1678–1685. [Google Scholar] [CrossRef]
- Rauber, F.; Steele, E.M.; Louzada, M.L.; Millett, C.; Monteiro, C.A.; Levy, R.B. Ultra-processed food consumption and indicators of obesity in the United Kingdom population (2008–2016). Nutrients 2019, 11, 1906. [Google Scholar] [CrossRef]
- Pagliai, G.; Dinu, M.; Madarena, M.P.; Bonaccio, M.; Iacoviello, L.; Sofi, F. Consumption of ultra-processed foods and health status: A systematic review and meta-analysis. Br. J. Nutr. 2021, 125, 308–318. [Google Scholar] [CrossRef]
- Monteiro, C.A.; Cannon, G.; Levy, R.B.; Moubarac, J.-C.; Jaime, P.; Martins, A.P.B.; et al. Ultra-processed foods: What they are and how to identify them. Public Health Nutr. 2019, 22, 936–941. [Google Scholar] [CrossRef]
- Fernandes, A.C.; Araneda, J.; Dourado, D.Q.; et al. Diet quality of Chilean schoolchildren: How is it linked to adherence to dietary guidelines? PLoS ONE 2025, 20, e0318206. [Google Scholar] [CrossRef]
- Ausenhus, C.; Gold, J.M.; Perry, C.K.; et al. Factors impacting implementation of nutrition and physical activity policies in rural schools. BMC Public Health 2023, 23, 308. [Google Scholar] [CrossRef] [PubMed]
- Bulló, M.; Lamuela-Raventós, R.; Salas-Salvadó, J. Mediterranean diet and oxidation: Nuts and olive oil as important sources of fat and antioxidants. Curr. Top. Med. Chem. 2011, 11, 1797–1810. [Google Scholar] [CrossRef] [PubMed]
- Delgado-Floody, P.; Alvarez, C.; Caamaño-Navarrete, F.; Jerez-Mayorga, D.; Latorre-Román, P. Influence of Mediterranean diet adherence, physical activity patterns, and weight status on cardiovascular response to cardiorespiratory fitness test in Chilean school children. Nutrition 2020, 71, 110621. [Google Scholar] [CrossRef]
- Billingsley, H.E.; Carbone, S. The antioxidant potential of the Mediterranean diet in patients at high cardiovascular risk: An in-depth review of the PREDIMED. Nutr. Diabetes 2018, 8, 13. [Google Scholar] [CrossRef]
- Di Daniele, N.; Noce, A.; Vidiri, M.F.; Moriconi, E.; Marrone, G.; Annicchiarico-Petruzzelli, M.; et al. Impact of Mediterranean diet on metabolic syndrome, cancer and longevity. Oncotarget 2016, 8, 8947–8979. [Google Scholar] [CrossRef] [PubMed]
- Augimeri, G.; Galluccio, A.; Caparello, G.; Avolio, E.; La Russa, D.; De Rose, D.; et al. Potential antioxidant and anti-inflammatory properties of serum from healthy adolescents with optimal Mediterranean diet adherence: Findings from DIMENU cross-sectional study. Antioxidants 2021, 10, 1172. [Google Scholar] [CrossRef] [PubMed]
- Velázquez-López, L.; Santiago-Díaz, G.; Nava-Hernández, J.; Muñoz-Torres, A.V.; Medina-Bravo, P.; Torres-Tamayo, M. Mediterranean-style diet reduces metabolic syndrome components in obese children and adolescents with obesity. BMC Pediatr. 2014, 14, 175. [Google Scholar] [CrossRef]
- Ravens-Sieberer, U.; Gosch, A.; Rajmil, L.; Erhart, M.; Bruil, J.; Duer, W.; et al. KIDSCREEN-52 quality-of-life measure for children and adolescents. Expert Rev. Pharmacoecon. Outcomes Res. 2005, 5, 353–364. [Google Scholar] [CrossRef] [PubMed]
- Ravens-Sieberer, U.; Erhart, M.; Rajmil, L.; Herdman, M.; Auquier, P.; Bruil, J.; et al. Reliability, construct and criterion validity of the KIDSCREEN-10 score: A short measure for children and adolescents’ well-being and health-related quality of life. Qual. Life Res. 2010, 19, 1487–1500. [Google Scholar] [CrossRef] [PubMed]
- Bulló, M.; Lamuela-Raventós, R.; Salas-Salvadó, J. Mediterranean diet and oxidation: Nuts and olive oil as important sources of fat and antioxidants. Curr. Top. Med. Chem. 2011, 11, 1797–1810. [Google Scholar] [CrossRef] [PubMed]
- Santos, B.; Monteiro, D.; Silva, F.M.; Flores, G.; Bento, T.; Duarte-Mendes, P. Objectively measured physical activity and sedentary behaviour on cardiovascular risk and health-related quality of life in adults: A systematic review. Healthcare 2024, 12, 1866. [Google Scholar] [CrossRef] [PubMed]
- Puri, S.; et al. Nutrition and cognitive health: A life course approach. Front. Public Health 2023, 11, 1023907. [Google Scholar] [CrossRef]
- Roberts, M.; et al. The effects of nutritional interventions on the cognitive development of preschool-age children: A systematic review. Nutrients 2022, 14, 532. [Google Scholar] [CrossRef]
- Rahi, B.; et al. Impact of nutritional minerals biomarkers on cognitive performance among Bangladeshi rural adolescents. Nutrients 2024, 16, 3865. [Google Scholar] [CrossRef]
- Pinhas-Hamiel, O.; Singer, S.; Pilpel, N.; Fradkin, A.; Modan, D.; Reichman, B. Health-related quality of life among children and adolescents: Associations with obesity. Int. J. Obes. 2006, 30, 267–272. [Google Scholar] [CrossRef]
- Van der Voorn, B.; Camfferman, R.; Seidell, J.C.; Halberstadt, J. Health-related quality of life in children under treatment for overweight, obesity or severe obesity: A cross-sectional study in the Netherlands. BMC Pediatr. 2023, 23, 167. [Google Scholar] [CrossRef]
- Van den Eynde, E.; Camfferman, R.; Putten, L.R.; et al. Changes in the health-related quality of life and weight status of children with overweight or obesity aged 7 to 13 years after participating in a 10-week lifestyle intervention. Child Obes. 2020, 16, 412–420. [Google Scholar] [CrossRef]
- Bustos-Barahona, R.; Delgado-Floody, P.; Martínez-Salazar, C. Lifestyle associated with physical fitness related to health and cardiometabolic risk factors in Chilean schoolchildren. Endocrinol. Diabetes Nutr. 2020, 67, 586–593. [Google Scholar] [CrossRef] [PubMed]
- Muñoz-Urtubia, N.; Vega-Muñoz, A.; Salazar-Sepúlveda, G.; Contreras-Barraza, N.; Mendoza-Muñoz, M.; Ureta-Paredes, W.; Carabantes-Silva, R. Relationship between body composition and physical literacy in Chilean children (10 to 16 years): An assessment using CAPL-2. J. Clin. Med. 2024, 13, 7027. [Google Scholar] [CrossRef]
- Hernández-Mosqueira, C.; Castillo Quezada, H.; Peña-Troncoso, S.; et al. Valoración del estado nutricional y la condición física de estudiantes de educación básica de Chile. Nutr. Hosp. 2020, 37, 1178–1186. [Google Scholar] [CrossRef]
- McNeely, A.; MacMillan Uribe, A.; De Mello, G.T.; Herrero-Loza, A.; Ali, M.; Nguyen, K.; et al. Educators’ perceived barriers and facilitators to implementing a school-based nutrition, physical activity, and civic engagement intervention: A qualitative analysis. Front. Public Health 2025, 13, 1616483. [Google Scholar] [CrossRef] [PubMed]
- Parrish, A.M.; Trost, S.G.; Howard, S.J.; Batterham, M.; Cliff, D.; Salmon, J.; et al. Evaluation of an intervention to reduce adolescent sitting time during the school day: The ‘Stand Up for Health’ randomised controlled trial. J. Sci. Med. Sport 2018, 21, 1244–1249. [Google Scholar] [CrossRef]
- Ausenhus, C.; Gold, J.M.; Perry, C.K.; Kozak, A.T.; Wang, M.L.; Jang, S.H.; et al. Factors impacting implementation of nutrition and physical activity policies in rural schools. BMC Public Health 2023, 23, 308. [Google Scholar] [CrossRef]
- Mazzoli, E.; Koorts, H.; Salmon, J.; Pesce, C.; May, T.; Teo, W.P.; et al. Feasibility of breaking up sitting time in mainstream and special schools with a cognitively challenging motor task. J. Sport Health Sci. 2019, 8, 137–148. [Google Scholar] [CrossRef] [PubMed]
- Aguilar-Farias, N.; Miranda-Marquez, S.; Toledo-Vargas, M.; Sadarangani, K.P.; Ibarra-Mora, J.; Martino-Fuentealba, P.; et al. Results from Chile’s 2022 report card on physical activity for children and adolescents. J. Exerc. Sci. Fit. 2024, 22, 390–396. [Google Scholar] [CrossRef] [PubMed]
- U. S. Preventive Services Task Force. Screening for obesity in children and adolescents: US Preventive Services Task Force recommendation statement. JAMA 2017, 317, 2417–2426. [Google Scholar] [CrossRef]
- Community Preventive Services Task Force. Obesity Prevention and Control: School-Based Programs; Community Preventive Services Task Force: Atlanta, GA, USA, 2013; Available online: https://www.thecommunityguide.org/sites/default/files/assets/Obesity-School-based-Programs.pdf (accessed on 12 August 2025).
- Aguilar-Farias, N.; Toledo-Vargas, M.; Miranda-Marquez, S.; Cortinez-O’Ryan, A.; Cristi-Montero, C.; Rodriguez-Rodriguez, F.; Martino-Fuentealba, P.; Okely, A.D.; Del Pozo Cruz, B. Sociodemographic predictors of changes in physical activity, screen time, and sleep among toddlers and preschoolers in Chile during the COVID-19 pandemic. Int. J. Environ. Res. Public Health 2020, 18, 176. [Google Scholar] [CrossRef]
- Imran, N.; Zeshan, M.; Pervaiz, Z. Mental health considerations for children & adolescents in COVID-19 pandemic. Pak. J. Med. Sci. 2020, 36, (COVID19–S4). [Google Scholar] [CrossRef]
- Izquierdo, S.; Granese, M.; Maira, A. Efectos de la Pandemia en el Bienestar Socioemocional de los Niños y Adolescentes en Chile y el Mundo; Documento de trabajo CEP N°647; Centro de Estudios Públicos: Santiago, Chile, 2023; Available online: https://static.cepchile.cl/uploads/cepchile/2023/03/pder647_granese_etal.pdf (accessed on 12 August 2025).
- Sahoo, K.; Sahoo, B.; Choudhury, A.K.; Sofi, N.Y.; Kumar, R.; Bhadoria, A.S. Childhood obesity: Causes and consequences. J. Fam. Med. Prim. Care 2015, 4, 187–192. [Google Scholar] [CrossRef]
- Brown, T.; Moore, T.H.; Hooper, L.; Gao, Y.; Zayegh, A.; Ijaz, S.; et al. Interventions for preventing obesity in children. Cochrane Database Syst. Rev. 2019, 7, CD001871. [Google Scholar] [CrossRef]
- Muñoz-Urtubia, N.; Vega-Muñoz, A.; Salazar-Sepúlveda, G.; García-Gordillo, M.Á.; Carmelo-Adsuar, J. Physical activity-based interventions for reducing body mass index in children aged 6–12 years: A systematic review. Front. Pediatr. 2025, 13, 1449436. [Google Scholar] [CrossRef]
- Long, K.Z.; Beckmann, J.; Lang, C.; Seelig, H.; Nqweniso, S.; Probst-Hensch, N.; et al. Impact of a school-based health intervention program on body composition among South African primary schoolchildren: Results from the KaziAfya cluster-randomized controlled trial. BMC Med. 2022, 20, 27. [Google Scholar] [CrossRef] [PubMed]
- Espejo, J.P.; Tumani, M.F.; Aguirre, C.; Sanchez, J.; Parada, A. Educación alimentaria nutricional: Estrategias para mejorar la adherencia al plan dietoterapéutico. Rev. Chil. Nutr. 2022, 49, 391–401. [Google Scholar] [CrossRef]
- Verjans-Janssen, S.R.B.; van de Kolk, I.; Van Kann, D.H.H.; Kremers, S.P.J.; Gerards, S.M.P.L. Effectiveness of school-based physical activity and nutrition interventions with direct parental involvement on children’s BMI and energy balance-related behaviors: A systematic review. PLoS ONE 2018, 13, e0204560. [Google Scholar] [CrossRef]
- World Bank. New World Bank Country Classifications by Income Level: 2023–2024; The World Bank: Washington, DC, USA, 2023; Available online: https://blogs.worldbank.org/en/opendata/world-bank-country-classifications-by-income-level-for-2024-2025 (accessed on 24 July 2025).
- Instituto Nacional de Estadísticas (INE). Proyecciones y Estimaciones de Población Total País, Urbano-Rural y Regional, 2002–2035 (Base 2017); INE: Santiago, Chile, 2024; Available online: https://www.ine.gob.cl (accessed on 24 July 2025).
- Universidad Diego Portales. Informe Anual sobre Derechos Humanos en Chile 2024; Centro de Derechos Humanos, Facultad de Derecho UDP: Santiago, Chile, 2024; Available online: https://derechoshumanos.udp.cl/cms/wp-content/uploads/2024/11/INFORME-ANUAL-DDHH-UDP-2024-COMPLETO.pdf (accessed on 24 July 2025).
- OECD. OECD Economic Surveys: Chile 2022; OECD Publishing: Paris, France, 2022; Available online: https://www.oecd.org/en/publications/oecd-economic-surveys-chile-2022_311ec37e-en.html (accessed on 24 July 2025).
- Kottek, M.; Grieser, J.; Beck, C.; Rudolf, B.; Rubel, F. World map of the Köppen–Geiger climate classification updated. Meteorol. Z. 2006, 15, 259–263. [Google Scholar] [CrossRef] [PubMed]
- Biblioteca del Congreso Nacional de Chile (BCN). Clima y Vegetación. Chile Nuestro País; BCN: Santiago, Chile. Available online: https://www.bcn.cl/siit/nuestropais/clima.htm (accessed on 13 August 2025).
- Altavilla, C.; Caballero-Pérez, P. An update of the KIDMED questionnaire, a Mediterranean Diet Quality Index in children and adolescents. Public Health Nutr. 2019, 22, 2543–2547. [Google Scholar] [CrossRef]
- Zapata, D.F.; Granfeldt, M.G.; Mosso, C.C.; Sáez, C.K.; Muñoz, R.S. Evaluación nutricional y adherencia a la dieta mediterránea de adolescentes chilenos que residen en hogares de familias hospedadoras. Rev. Chil. Nutr. 2016, 43, 105–112. [Google Scholar] [CrossRef]
- Ravens-Sieberer, U.; Auquier, P.; Erhart, M.; Gosch, A.; Rajmil, L.; Bruil, J.; et al. The KIDSCREEN-27 quality of life measure for children and adolescents: Psychometric results from a cross-cultural survey in 13 European countries. Qual. Life Res. 2007, 16, 1347–1356. [Google Scholar] [CrossRef]
- Molina, G.T.; Montaño, E.R.; González, A.E.; Sepúlveda, P.R.; Hidalgo-Rasmussen, C.; Martínez, V.N.; et al. Propiedades psicométricas del cuestionario de calidad de vida relacionada con la salud KIDSCREEN-27 en adolescentes chilenos. Rev. Med. Chil. 2014, 142, 1415–1423. [Google Scholar] [CrossRef]
- Hughes, D.J. Psychometric validity. In The Wiley Handbook of Psychometric Testing; Irwing, P., Booth, T., Hughes, D.J., Eds.; Wiley: Chichester, UK, 2018; pp. 751–779. [Google Scholar] [CrossRef]
- Ferrando, P.J.; Lorenzo-Seva, U.; Hernández-Dorado, A.; Muñiz, J. Decalogue for the factor analysis of test items. Psicothema 2022, 34, 7–17. [Google Scholar] [CrossRef] [PubMed]
- Ho, A.D.; Yu, C.C. Descriptive statistics for modern test score distributions: Skewness, kurtosis, discreteness, and ceiling effects. Educ. Psychol. Meas. 2015, 75, 365–388. [Google Scholar] [CrossRef] [PubMed]
- Kaiser, H.F.; Cerny, B.A. Factor analysis of the image correlation matrix. Educ. Psychol. Meas. 1979, 39, 711–714. [Google Scholar] [CrossRef]
- Lloret-Segura, S.; Ferreres-Traver, A.; Hernández-Baeza, A.; Tomás-Marco, I. Exploratory item factor analysis: A practical guide revised and updated. An. Psicol. 2014, 30, 1151–1169. [Google Scholar] [CrossRef]
- Ferrando, P.J.; Lorenzo-Seva, U. Program FACTOR at 10: Origins, development and future directions. Psicothema 2017, 29, 236–240. [Google Scholar] [CrossRef]
- Yang-Wallentin, F.; Jöreskog, K.G.; Luo, H. Confirmatory factor analysis of ordinal variables with misspecified models. Struct. Equ. Model. 2010, 17, 392–423. [Google Scholar] [CrossRef]
- Lorenzo-Seva, U.; Ferrando, P.J. MSA: The forgotten index for identifying inappropriate items before computing exploratory item factor analysis. Methodology 2021, 17, 296–306. [Google Scholar] [CrossRef]
- Velicer, W.F.; Fava, J.L. Affects of variable and subject sampling on factor pattern recovery. Psychol. Methods 1998, 3, 231–251. [Google Scholar] [CrossRef]
- Lorenzo-Seva, U.; Timmerman, M.E.; Kiers, H.A.L. The Hull method for selecting the number of common factors. Multivar. Behav. Res. 2011, 46, 340–364. [Google Scholar] [CrossRef]
- Kyriazos, T.A. Applied psychometrics: Sample size and sample power considerations in factor analysis (EFA, CFA) and SEM in general. Psychology 2018, 9, 2207–2230. [Google Scholar] [CrossRef]
- Sun, J. Assessing goodness of fit in confirmatory factor analysis. Meas. Eval. Couns. Dev. 2005, 37, 240–256. [Google Scholar] [CrossRef]
- Schermelleh-Engel, K.; Moosbrugger, H.; Müller, H. Evaluating the fit of structural equation models: Tests of significance and descriptive goodness-of-fit measures. Methods Psychol. Res. 2003, 8, 23–74. Available online: https://www.stats.ox.ac.uk/~snijders/mpr_Schermelleh.pdf (accessed on 12 August 2025).
- Kalkan, Ö.K.; Kelecioğlu, H. The effect of sample size on parametric and nonparametric factor analytical methods. Educ. Sci. Theory Pract. 2016, 16, 153–171. [Google Scholar] [CrossRef]
- Somers, R.H. A new asymmetric measure of association for ordinal variables. Am. Sociol. Rev. 1962, 27, 799–811. [Google Scholar] [CrossRef]
- Svensson, E. Guidelines to statistical evaluation of data from rating scales and questionnaires. J. Rehabil. Med. 2000, 32, 1–7. [Google Scholar] [CrossRef]
- Wolf, E.J.; Harrington, K.M.; Clark, S.L.; Miller, M.W. Sample size requirements for structural equation models: An evaluation of power, bias, and solution propriety. Educ. Psychol. Meas. 2013, 73, 913–934. [Google Scholar] [CrossRef] [PubMed]
- Gassmann, F.; de Groot, R.; Dietrich, S.; Timar, E.; Jaccoud, F.; Giuberti, L.; et al. Determinants and drivers of young children’s diets in Latin America and the Caribbean: Findings from a regional analysis. PLOS Glob. Public Health 2022, 2, e0000260. [Google Scholar] [CrossRef] [PubMed]
- Ayala, G.X.; Monge-Rojas, R.; King, A.C.; Hunter, R.; Berge, J.M. The social environment and childhood obesity: Implications for research and practice in the United States and countries in Latin America. Obes. Rev. 2021, 22 (Suppl 3), e13246. [Google Scholar] [CrossRef]
- Herrera, J.C.; Lira, M.; Kain, J. Vulnerabilidad socioeconómica y obesidad en escolares chilenos de primero básico: Comparación entre los años 2009 y 2013. Rev. Chil. Pediatr. 2017, 88, 736–743. [Google Scholar] [CrossRef]
- Jekauc, D.; Reimers, A.K.; Wagner, M.O.; Woll, A. Physical activity in sports clubs of children and adolescents in Germany: Results from a nationwide representative survey. J. Public Health 2013, 21, 505–513. [Google Scholar] [CrossRef]
- López-Gil, J.F.; López-Bueno, R.; Sillero-Quintana, M.; Pardhan, S.; Yuste Lucas, J.L.; Cavero-Redondo, I. Mediterranean diet and health-related quality of life in children and adolescents: A systematic review and meta-analysis. Eur. J. Pediatr. 2025, 184, 1–14. [Google Scholar] [CrossRef]
- Conesa-Milian, L.; Fernández-García, J.C.; Vicente-Herrero, M.T.; Morales-Gil, I.M.; Segura-Fragoso, A.; Planelles-Ramos, M.V.; et al. Adherence to the Mediterranean diet and its association with anthropometric and lifestyle factors in Spanish adolescents: A cross-sectional study. Nutrients 2025, 17, 331. [Google Scholar] [CrossRef] [PubMed]
- Yurtdaş Depboylu, A.; Arslan, S.; Arikan Durmaz, S. Factors affecting Mediterranean diet adherence in adolescents: Age, physical activity, and sleep quality. Nutrition 2023, 112, 112144. [Google Scholar] [CrossRef]
- Yesildemir, O.; Bayram, M.; Alarcón, J.A.; Yildiz, E.; Tur, J.A.; Turkmen, M.; et al. Socioeconomic determinants of adherence to the Mediterranean diet among children and adolescents: A multi-country study. Nutrients 2025, 17, 120. [Google Scholar] [CrossRef]
- Froelich, B.D.M.; de Souza, A.C.N.; Rodrigues, P.R.M.; Cunha, D.B.; Muraro, A.P. Adherence to school meals and co-occurrence of the healthy and unhealthy food markers among Brazilian adolescents. Cien. Saude Colet. 2023, 28, 1927–1936. [Google Scholar] [CrossRef] [PubMed]
- Da Silva, E.A.; Pedrozo, E.A.; Da Silva, T.N. The PNAE (National School Feeding Program) activity system and its mediations. Front. Environ. Sci. 2023, 10, 981932. [Google Scholar] [CrossRef]
- López-Toledo, S.; Canals-Sans, J.; Ballonga-Paretas, C.; Arija-Val, V. Estado nutricional de escolares peruanos según nivel socioeconómico. Proyecto INCOS. Rev. Esp. Nutr. Comunitaria 2020, 26, 1–10. [Google Scholar] [CrossRef]
- Comisión Económica para América Latina y el Caribe (CEPAL). Malnutrición en Niños y Niñas en América Latina y el Caribe. CEPAL: Santiago, Chile, 2018. Available online: https://www.cepal.org/es/enfoques/malnutricion-ninos-ninas-america-latina-caribe (accessed on 12 August 2025).
- Ministerio de Educación de Chile. Plan Nacional de Actividad Física Escolar; MINEDUC: Santiago, Chile, 2019. [Google Scholar]
- Castro Rojas, G.; Hurtado Almonacid, J.; Páez Herrera, J. Inactividad física en niñas: Percepciones de los niños, niñas y docentes sobre el programa “Crecer en Movimiento” en Chile. LATAM Rev. Lat. Cienc. Soc. Humanid. 2025, 6, 2148–2166. [Google Scholar] [CrossRef]
- Bahamonde, C.; Carmona, C.; Albornoz, J.; Hernández-García, R.; Torres-Luque, G. Efecto de un programa de actividades deportivas extraescolares en jóvenes chilenos. Retos 2019, 35, 261–266. [Google Scholar] [CrossRef]
- Kretschmer, L.; Salali, G.D.; Andersen, L.B.; Hallal, P.C.; Northstone, K.; Sardinha, L.B.; et al. Gender differences in the distribution of children’s physical activity: Evidence from nine countries. Int. J. Behav. Nutr. Phys. Act. 2023, 20, 103. [Google Scholar] [CrossRef]
- Boujelbane, M.A.; Ammar, A.; Salem, A.; Kerkeni, M.; Trabelsi, K.; Bouaziz, B.; et al. Gender-specific insights into adherence to Mediterranean diet and lifestyle: Analysis of 4,000 responses from the MEDIET4ALL project. Front. Nutr. 2025, 12, 1570904. [Google Scholar] [CrossRef]
- Nagata, J.M.; Helmer, C.K.; Wong, J.; Diep, T.; Domingue, S.K.; Do, R.; et al. Social epidemiology of early adolescent nutrition. Pediatr. Res. Epub ahead of print. 2025. [Google Scholar] [CrossRef] [PubMed]
- Peral-Suárez, Á.; Haycraft, E.; Blyth, F.; Holley, C.E.; Pearson, N. Dietary habits across the primary-secondary school transition: A systematic review. Appetite 2024, 201, 107612. [Google Scholar] [CrossRef]
- Afe, J.E.; Ubajaka, C.F.; Okoye, A.C. Nutritional status of adolescents in public and private secondary schools in Asaba, Delta State, Nigeria. Eur. J. Nutr. Food Saf. 2023, 15, 109–124. [Google Scholar] [CrossRef]
- Sezer, F.E.; Alpat Yavaş, İ.; Saleki, N.; Bakırhan, H.; Pehlivan, M. Diet quality and snack preferences of Turkish adolescents in private and public schools. Front. Public Health 2024, 12, 1365355. [Google Scholar] [CrossRef] [PubMed]
- Cohen, J.F.; Hecht, A.A.; McLoughlin, G.M.; Turner, L.; Schwartz, M.B. Universal school meals and associations with student participation, attendance, academic performance, diet quality, food security, and body mass index: A systematic review. Nutrients 2021, 13, 911. [Google Scholar] [CrossRef]
- Chalhoub, T.M.; Mackenzie, E.; Siette, J. “Establishing healthy habits and lifestyles early is very important”: Parental views of brain health literacy on dementia prevention in preschool and primary school children. Front. Public Health 2024, 12, 1401806. [Google Scholar] [CrossRef]
- Csima, M.; Podráczky, J.; Keresztes, V.; Soós, E.; Fináncz, J. The role of parental health literacy in establishing health-promoting habits in early childhood. Children 2024, 11, 576. [Google Scholar] [CrossRef]
- de Buhr, E.; Tannen, A. Parental health literacy and health knowledge, behaviours and outcomes in children: A cross-sectional survey. BMC Public Health 2020, 20, 1096. [Google Scholar] [CrossRef]
- Kaniyagundi Podiya, J.; Navaneetham, J.; Bhola, P. Influences of school climate on emotional health and academic achievement of school-going adolescents in India: A systematic review. BMC Public Health 2025, 25, 54. [Google Scholar] [CrossRef]
- Valstad Aasan, B.E.; Lillefjell, M.; Krokstad, S.; Sylte, M.; Sund, E.R. The relative importance of family, school, and leisure activities for the mental wellbeing of adolescents: The Young-HUNT study in Norway. Societies 2023, 13, 93. [Google Scholar] [CrossRef]
- Badri, M.; Al Nuaimi, A.; Guang, Y.; Al Sheryani, Y.; Al Rashedi, A. The effects of home and school on children’s happiness: A structural equation model. Int. J. Child Care Educ. Policy 2018, 12, 17. [Google Scholar] [CrossRef]
- Bauman, A.E.; Reis, R.S.; Sallis, J.F.; Wells, J.C.; Loos, R.J.; Martin, B.W. Correlates of physical activity: Why are some people physically active and others not? Lancet 2012, 380, 258–271. [Google Scholar] [CrossRef]
- World Health Organization. Global Action Plan on Physical Activity 2018–2030: More Active People for a Healthier World; WHO: Geneva, Switzerland, 2018; Available online: https://www.who.int/publications/i/item/9789241514187 (accessed on 12 August 2025).
- Karpouzis, F.; Anastasiou, K.; Lindberg, R.; Walsh, A.; Shah, S.; Ball, K. Effectiveness of school-based nutrition education programs that include environmental sustainability components, on fruit and vegetable consumption of 5–12 year old children: A systematic review. J. Nutr. Educ. Behav. 2025, 57, 627–642. [Google Scholar] [CrossRef] [PubMed]
- de Medeiros, G.C.B.; de Azevedo, K.P.M.; Garcia, D.; Segundo, V.H.O.; de Sousa Mata, A.N.; Fernandes, A.K.P.; et al. Effect of school-based food and nutrition education interventions on the food consumption of adolescents: A systematic review and meta-analysis. Int. J. Environ. Res. Public Health 2022, 19, 10522. [Google Scholar] [CrossRef] [PubMed]
- Wang, D.; Shinde, S.; Young, T.; Fawzi, W.W. Impacts of school feeding on educational and health outcomes of school-age children and adolescents in low- and middle-income countries: A systematic review and meta-analysis. J. Glob. Health 2021, 11, 04051. [Google Scholar] [CrossRef] [PubMed]
Figure 2.
Scree plot.
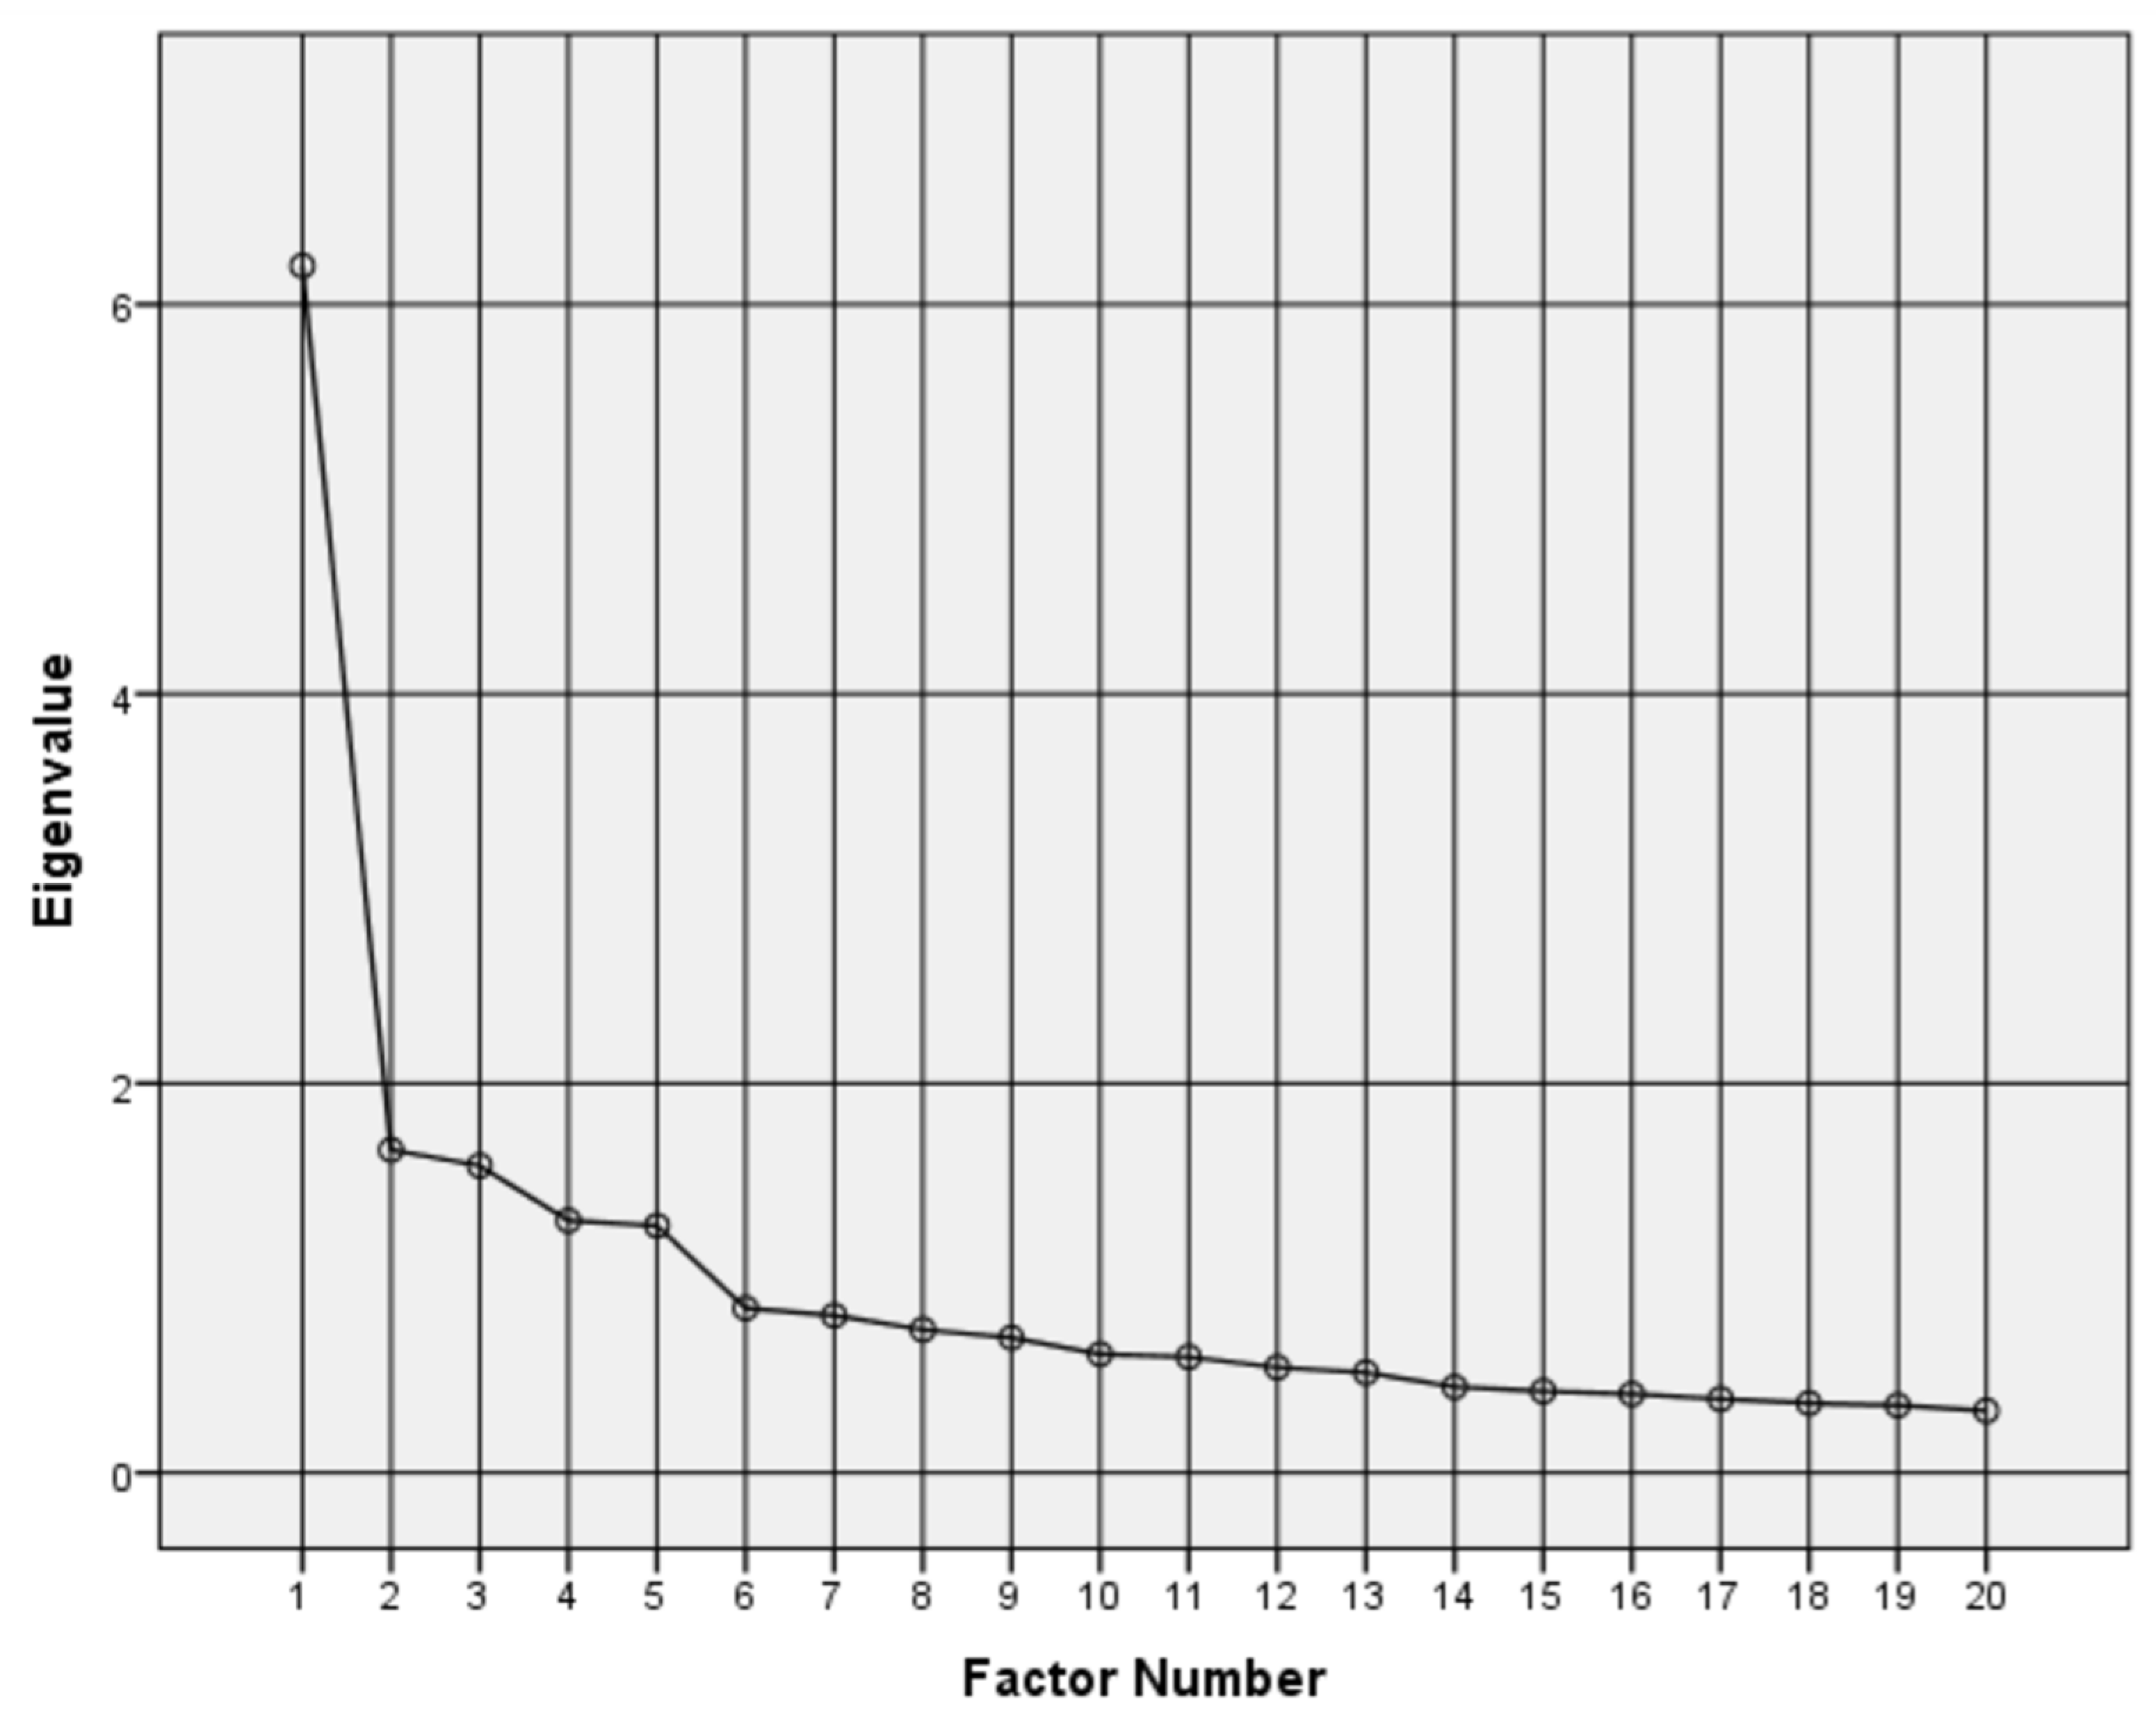
Figure 3.
Histogram of KIDSCREEN-20 scale.
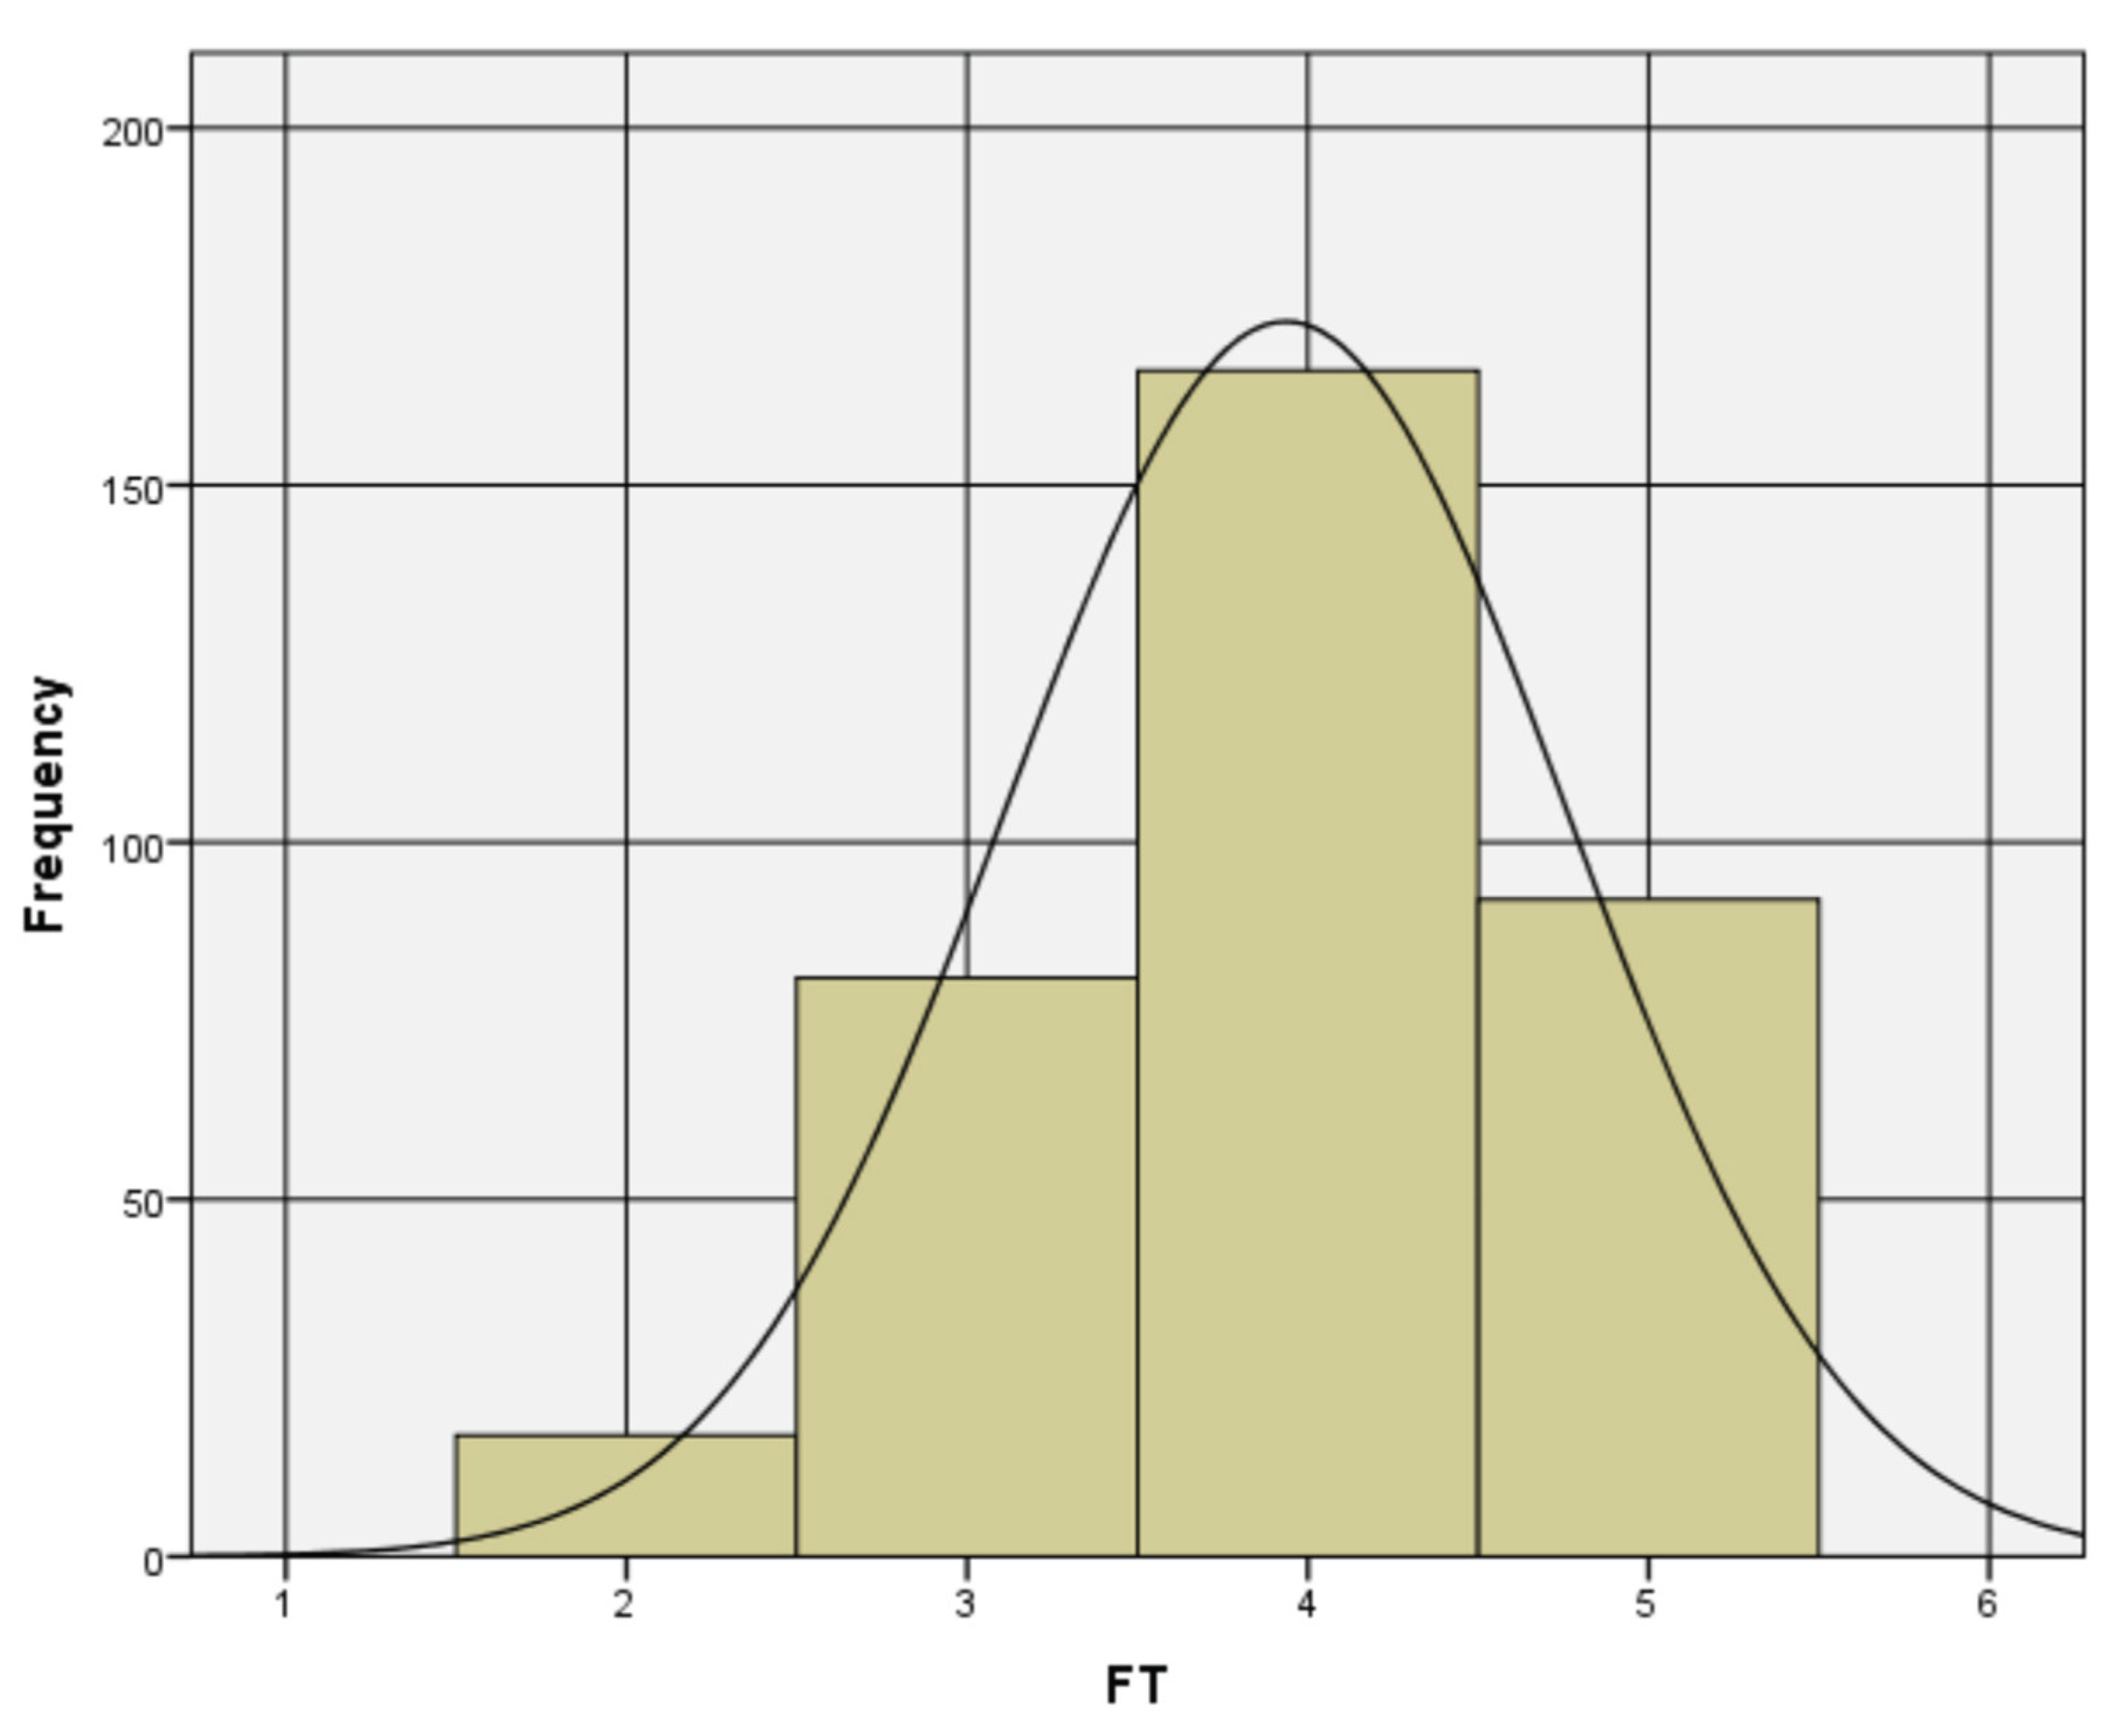
Figure 4.
Correlations between (4a) KIDSCREEN-20 – SEX, and (4b) KML – LIA.
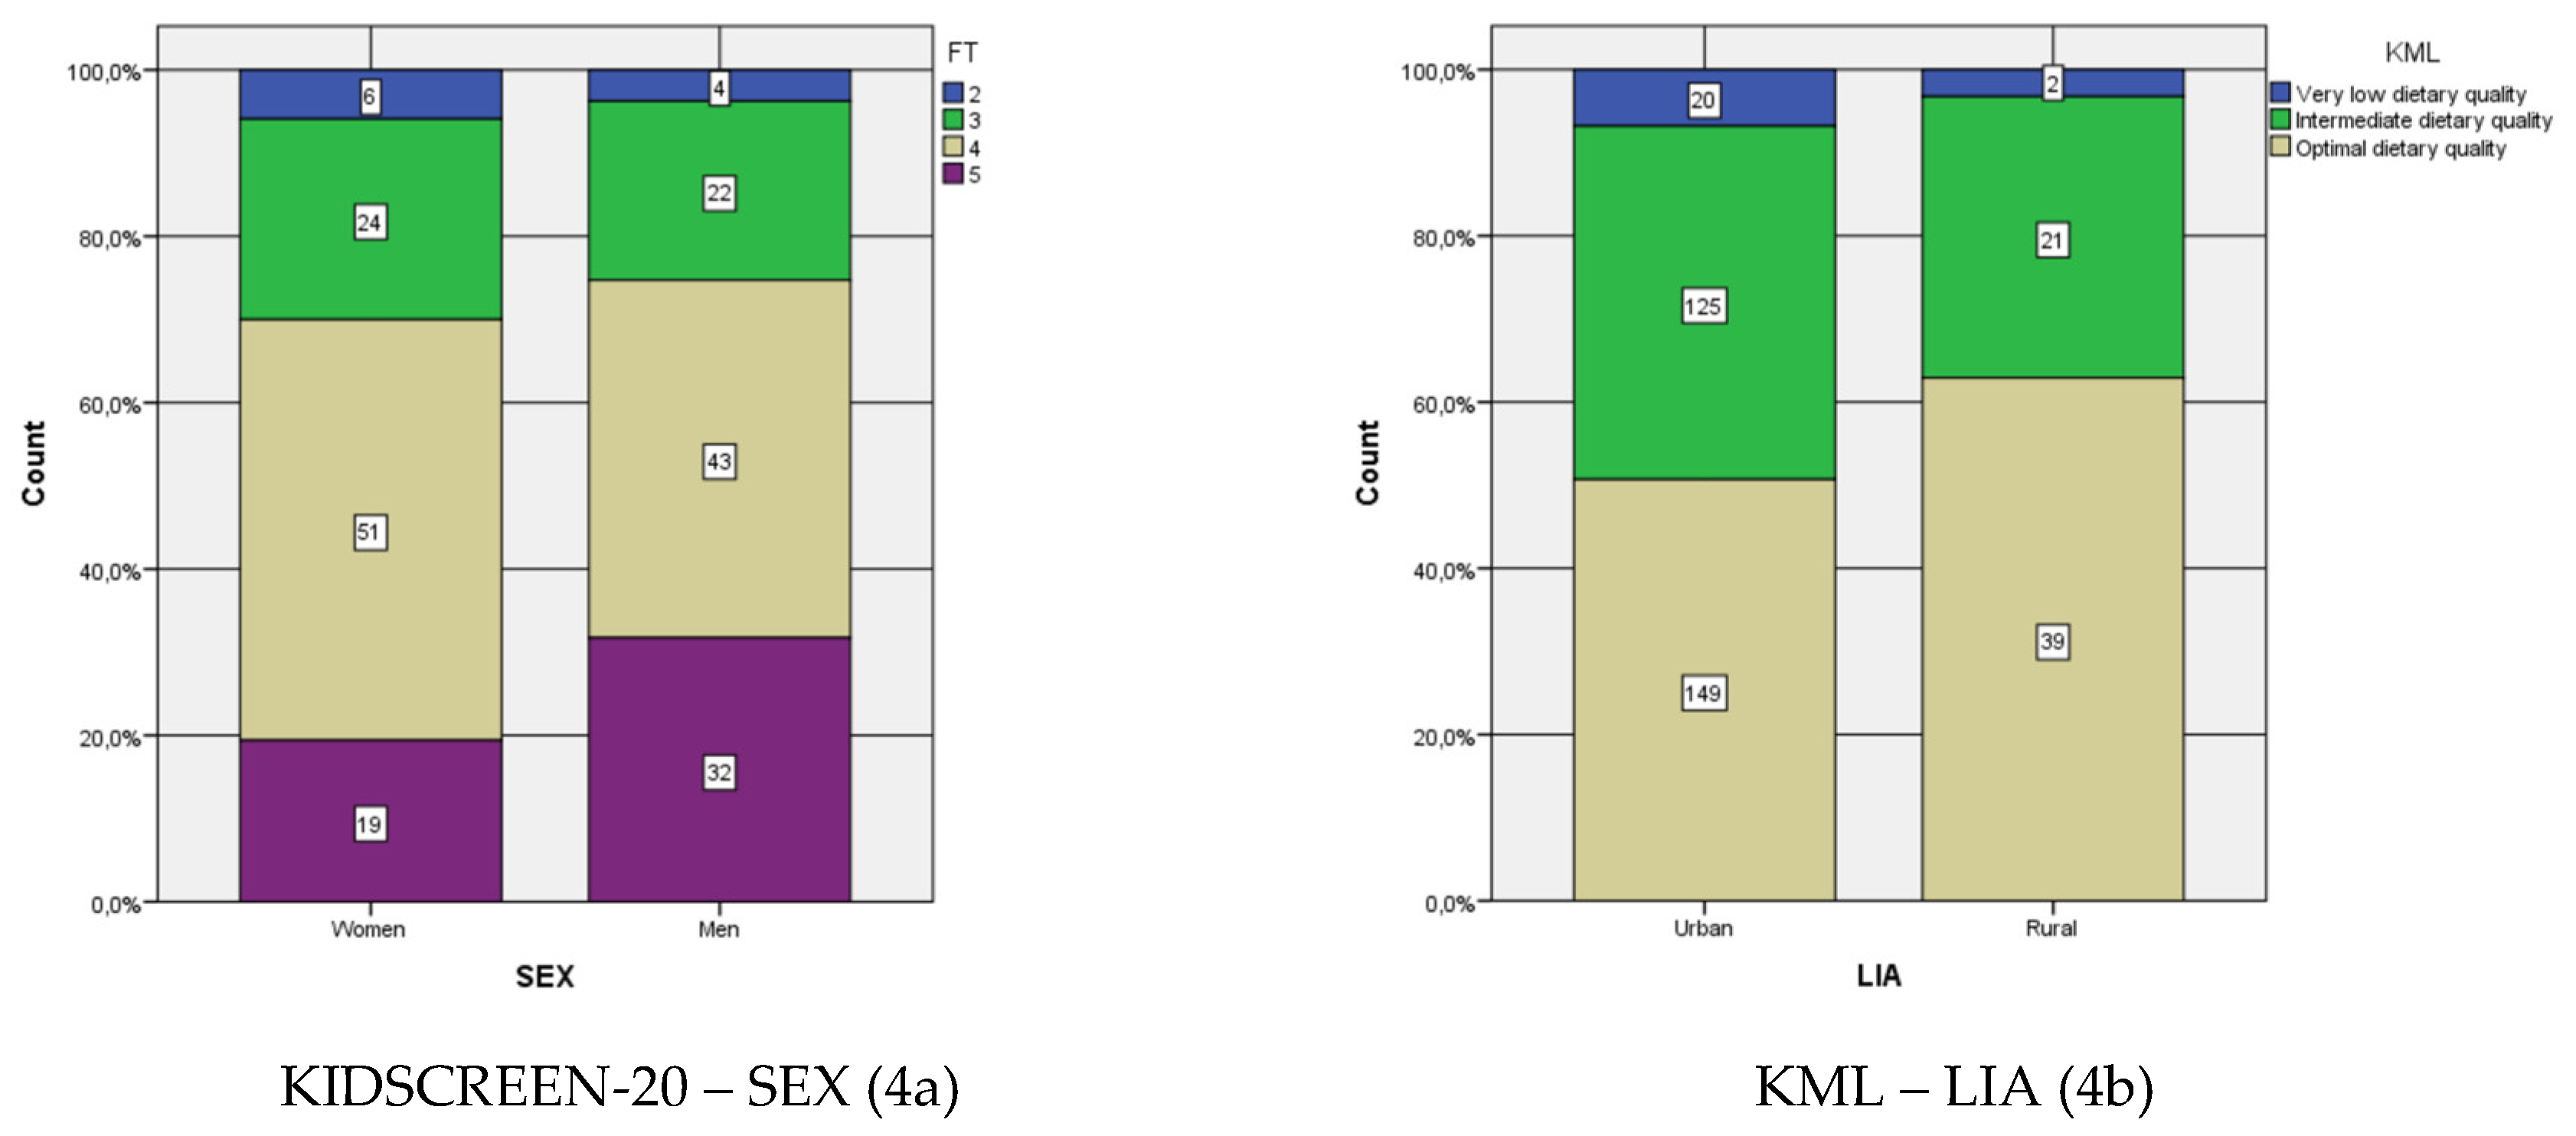

Table 1.
Validation and reliability parameters.
| Sample | Cronbach’s alpha | Level | MIF | χ2/df | RMSEA | AGFI | GFI | CFI | NNFI | RMSR |
|---|---|---|---|---|---|---|---|---|---|---|
| ≥200 | ≥0.70 ≤0.90 |
Good fit | NR | ≥0 | ≤0.05 | ≥0.90 | ≥0.95 | ≥0.97 | ≥0.97 | <0.05 ++ |
| ≤2 | ≤1.00 | ≤1.00 | ≤1.00 | ≤1.00 | ||||||
| Acceptable fit | ≥3 | >2 | >0.05 | ≥0.85 | ≥0.90 | ≥0.95 | ≥0.95 | ≥0.05 | ||
| ≤3 | ≤0.08 | <0.90 | <0.95 | <0.97 | <0.97 | ≤0.08 ++ |
NR: not reported. ++ indicated in Kalkan et al., 2016 [71].
Table 2.
Participant sample characterization.
| Sociodemographic variables | Level | N | n% |
| Sex | Women | 170 | 48% |
| Men | 186 | 52% | |
| Age (years old) | 7 | 1 | 0% |
| 8 | 22 | 6% | |
| 9 | 87 | 24% | |
| 10 | 118 | 33% | |
| 11 | 99 | 28% | |
| 12 | 25 | 7% | |
| 13 | 1 | 0% | |
| 14 | 3 | 1% | |
| Grade | 3° | 60 | 17% |
| 4° | 126 | 35% | |
| 5° | 123 | 35% | |
| 6° | 47 | 13% | |
| Living Area | Urban | 294 | 83% |
| Rural | 62 | 17% | |
| Kind of school | Municipal | 134 | 38% |
| Subsidized | 78 | 22% | |
| Private | 144 | 40% |
Table 3.
Univariate descriptive statistical analysis.
| Variables | N | Mean | Variance | Skewness | Kurtosis | ||
|---|---|---|---|---|---|---|---|
| Statistic | Statistic | Statistic | Statistic | Std. Error | Statistic | Std. Error | |
| PAH1 * | 356 | 3.70 | 1.119 * | -0.475 * | 0.129 | -0.383 * | 0.258 |
| PAH2 * | 356 | 3.56 | 1.542 * | -0.362 * | 0.129 | -1.063 * | 0.258 |
| PAH3 * | 356 | 3.79 | 1.506 * | -0.701 * | 0.129 | -0.592 * | 0.258 |
| PAH4 * | 356 | 3.85 | 1.528 * | -0.756 * | 0.129 | -0.546 * | 0.258 |
| PAH5 * | 356 | 3.74 | 1.320 * | -0.563 * | 0.129 | -0.586 * | 0.258 |
| MAF1 * | 356 | 4.03 | 1.529 * | -1.039 * | 0.129 | -0.155 * | 0.258 |
| MAF2 * | 356 | 3.72 | 1.135 * | -0.683 * | 0.129 | 0.032 * | 0.258 |
| MAF3 * | 356 | 4.01 | 1.223 * | -1.017 * | 0.129 | 0.266 * | 0.258 |
| MAF4 * | 356 | 3.18 | 1.590 * | -0.190 * | 0.129 | -0.892 * | 0.258 |
| MAF5 * | 356 | 3.46 | 1.759 * | -0.398 * | 0.129 | -0.936 * | 0.258 |
| MAF6 * | 356 | 3.53 | 1.771 * | -0.456 * | 0.129 | -0.921 * | 0.258 |
| MAF7 * | 356 | 3.85 | 1.714 * | -0.902 * | 0.129 | -0.368 * | 0.258 |
| FLT1 * | 356 | 3.70 | 1.511 * | -0.643 * | 0.129 | -0.534 * | 0.258 |
| FLT2 * | 356 | 3.65 | 1.536 * | -0.496 * | 0.129 | -0.882 * | 0.258 |
| FLT3 * | 356 | 3.84 | 1.367 * | -0.733 * | 0.129 | -0.385 * | 0.258 |
| FLT4 * | 356 | 4.16 | 1.346 * | -1.317 * | 0.129 | 0.754 * | 0.258 |
| FLT5 * | 356 | 4.12 | 1.346 * | -1.195 * | 0.129 | 0.453 * | 0.258 |
| FLT6 * | 356 | 3.25 | 1.940 * | -0.240 * | 0.129 | -1.174 * | 0.258 |
| FLT7 * | 356 | 3.42 | 2.014 * | -0.375 * | 0.129 | -1.172 * | 0.258 |
| TWF1 * | 356 | 4.10 | 1.242 * | -1.222 * | 0.129 | 0.766 * | 0.258 |
| TWF2 * | 356 | 4.25 | 1.101 * | -1.368 * | 0.129 | 1.133 * | 0.258 |
| TWF3 * | 356 | 4.03 | 1.250 * | -1.004 * | 0.129 | 0.220 * | 0.258 |
| TWF4 * | 356 | 3.88 | 1.433 * | -0.831 * | 0.129 | -0.241 * | 0.258 |
| SCL1 * | 356 | 3.81 | 1.364 * | -0.663 * | 0.129 | -0.618 * | 0.258 |
| SCL2 * | 356 | 3.80 | 1.054 * | -0.541 * | 0.129 | -0.380 * | 0.258 |
| SCL3 * | 356 | 3.98 | 0.943 * | -0.777 * | 0.129 | -0.004 * | 0.258 |
| SCL4 * | 356 | 4.21 | 1.046 * | -1.227 * | 0.129 | 0.699 * | 0.258 |
| Valid N (listwise) | 356 | ||||||
* Variables that satisfy the pre-established parameters of standard deviation, skewness, and kurtosis.
Table 4.
Exploratory factor analysis for five factors.
| KMO and Bartlett’s Test | |||||
| Kaiser–Meyer–Olkin Measure of Sampling Adequacy. | 0.875 | ||||
| Bartlett’s Test of Sphericity | Approx. Chi-Square | 2387.848 | |||
| Degree of freedom | 190 | ||||
| Significance | 0.000 | ||||
| Pattern Matrix a | |||||
| ID | Factor 1 | Factor 2 | Factor 3 | Factor 4 | Factor 5 |
| PAH1 | 0.451 | ||||
| PAH2 | 0.547 | ||||
| PAH3 | 0.639 | ||||
| PAH4 | 0.512 | ||||
| PAH5 | 0.518 | ||||
| MAF4 | 0.814 | ||||
| MAF5 | 0.748 | ||||
| MAF6 | 0.647 | ||||
| FLT3 | 0.425 | ||||
| FLT5 | 0.413 | ||||
| FLT6 | 0.671 | ||||
| FLT7 | 0.670 | ||||
| TWF1 | 0.675 | ||||
| TWF2 | 0.756 | ||||
| TWF3 | 0.635 | ||||
| TWF4 | 0.654 | ||||
| SCL1 | 0.431 | ||||
| SCL2 | -0.579 | ||||
| SCL3 | -0.724 | ||||
| SCL4 | -0.552 | ||||
| Eigenvalue | 5.683 | 1.178 | 1.049 | 0.775 | 0.725 |
| % of Variance | 28.413 | 5.891 | 5.243 | 3.874 | 3.625 |
| Cumulative % | 28.413 | 34.303 | 39.547 | 43.421 | 47.046 |
| Factor Correlation Matrix b | |||||
| Factor | 1 | 2 | 3 | 4 | 5 |
| 1 | 1.000 | 0.370 | 0.341 | 0.426 | -0.421 |
| 2 | 0.370 | 1.000 | 0.367 | 0.261 | -0.329 |
| 3 | 0.341 | 0.367 | 1.000 | 0.349 | -0.398 |
| 4 | 0.426 | 0.261 | 0.349 | 1.000 | -0.354 |
| 5 | -0.421 | -0.329 | -0.398 | -0.354 | 1.000 |
a Extraction Method: Unweighted Least Squares. Rotation Method: Oblimin with Kaiser Normalization. Rotation converged in 9 iterations. b Extraction Method: Unweighted Least Squares. Rotation Method: Oblimin with Kaiser Normalization.
Table 5.
Confirmatory factor analysis for five factors.
| KMO and Bartlett’s Test | ||||||||
| Kaiser–Meyer–Olkin Measure of Sampling Adequacy. (confidence interval 90%) | 0.875 (0.791; 0.862) | |||||||
| Bartlett’s Test of Sphericity | Approx. Chi-Square | 3226.8 | ||||||
| Degree of freedom | 190 | |||||||
| Significance | 0.000010 | |||||||
| Rotated Loading Matrix | ||||||||
| Variable (Item) | Factor 1 (F1) | Factor 2 (F2) | Factor 3 (F3) | Factor 4 (F4) | Factor 5 (F5) | |||
| Factor Name | ||||||||
| PAH1 | 0.487 | |||||||
| PAH2 | 0.570 | |||||||
| PAH3 | 0.680 | |||||||
| PAH4 | 0.568 | |||||||
| PAH5 | 0.561 | |||||||
| MAF4 | 0.859 | |||||||
| MAF5 | 0.782 | |||||||
| MAF6 | 0.696 | |||||||
| FLT3 | 0.478 | |||||||
| FLT5 | 0.494 | |||||||
| FLT6 | 0.690 | |||||||
| FLT7 | 0.705 | |||||||
| TWF1 | 0.702 | |||||||
| TWF2 | 0.777 | |||||||
| TWF3 | 0.657 | |||||||
| TWF4 | 0.707 | |||||||
| SCL1 | 0.437 | |||||||
| SCL2 | 0.608 | |||||||
| SCL3 | 0.764 | |||||||
| SCL4 | 0.638 | |||||||
| Explained Variance | 0.359 | 0.085 | 0.082 | 0.066 | 0.063 | |||
| Cumulative Variance | 0.359 | 0.443 | 0.523 | 0.591 | 0.654 | |||
| Eigenvalue | 7.169 | 1.689 | 1.637 | 1318 | 1.260 | |||
| % Eigenvalue | 54.838% | 12.920% | 12.522% | 10.082% | 9.638% | |||
| Inter Factor Correlation Matrix | ||||||||
| Factor | F1 | F2 | F3 | F4 | F5 | |||
| F1 | 1.000 | |||||||
| F2 | 0.427 | 1.000 | ||||||
| F3 | 0.430 | 0.366 | 1.000 | |||||
| F4 | 0.356 | 0.435 | 0.361 | 1.000 | ||||
| F5 | 0.382 | 0.344 | 0.262 | 0.379 | 1.000 | |||
Table 6.
Validation and reliability reported in previous articles and parameters.
| Article | Country | Sample | Method | Factors | MIF | χ2/df | RMSEA | AGFI | GFI | CFI | NNFI | RMSR |
|---|---|---|---|---|---|---|---|---|---|---|---|---|
| Proposed Model | Chile | 356 | EFA/CFA | 5 | 3 | 1.15 **,+ | 0.021 ** | 0.989 ** | 0.994 ** | 0.998 ** | 0.996 ** | 0.031 ** |
| Schermelleh-Engel et al. [44] | Parameters | ≥200 | Good fit |
- | NR | ≥0 ≤2 |
≤0.05 | ≥0.90 ≤1.00 |
≥0.95 ≤1.00 |
≥0.97 ≤1.00 |
≥0.97 ≤1.00 |
<0.05 ++ |
| Acceptable fit | - | ≥3 | >2 3 |
>0.05 ≤0.08 |
≥0.85 <0.90 |
≥0.90 <0.95 |
≥0.95 <0.97 |
≥0.95 <0.97 |
≥0.05 ≤0.08 ++ |
NR: not reported. ** Good fit; * acceptable fit. + Robust Mean and Variance-Adjusted Chi Square. ++ indicated in Kalkan et al. [71].
Table 7.
Reliability statistics.
| Scale | Valid cases | Number of Items | Cronbach’s Alpha |
|---|---|---|---|
| Factor 1 | 356 | 5 | 0.836** |
| Factor 2 | 356 | 3 | 0.725* |
| Factor 3 | 356 | 4 | 0.731* |
| Factor 4 | 356 | 5 | 0.713* |
| Factor 5 | 356 | 3 | 0.781* |
| KIDSCREEN-20 | 356 | 20 | 0.876** |
* Cronbach’s Alpha >0.7, ** Cronbach’s Alpha >0.8.
Table 8.
Cross tables (symmetric measures).
| Cross-Table | Test | Value | Asymptotic Standardized Error a | Approximate T b | Approximate Significance | |
|---|---|---|---|---|---|---|
| KIDSCREEN-20 * SEX | Ordinal per ordinal | Kendall’s Tau-C | 0.128 | 0.056 | 2.266 | 0,023 * |
| Gamma | 0.192 | 0.084 | 2.266 | 0,023 * | ||
| N of valid cases | 356 | |||||
| KIDSCREEN-20 * AGE | Ordinal per ordinal | Kendall’s Tau-C | -0.034 | 0.041 | -0.832 | 0,405 |
| Gamma | -0.052 | 0.063 | -0.832 | 0,405 | ||
| N of valid cases | 356 | |||||
| KIDSCREEN-20 * GRD | Ordinal per ordinal | Kendall’s Tau-C | -0.012 | 0.038 | -0.307 | 0,759 |
| Gamma | -0.019 | 0.061 | -0.307 | 0,759 | ||
| N of valid cases | 356 | |||||
| KIDSCREEN-20 * LIA | Ordinal per ordinal | Kendall’s Tau-C | 0.000 | 0.042 | -0.003 | 0,998 |
| Gamma | 0.000 | 0.112 | -0.003 | 0,998 | ||
| N of valid cases | 356 | |||||
| KIDSCREEN-20 * KOS | Ordinal per ordinal | Kendall’s Tau-C | 0.010 | 0.044 | 0.226 | 0,822 |
| Gamma | 0.015 | 0.068 | 0.226 | 0,822 | ||
| N of valid cases | 356 | |||||
| KML * SEX | Ordinal per ordinal | Kendall’s Tau-C | 0.016 | 0.054 | 0.297 | 0,766 |
| Gamma | 0.029 | 0.099 | 0.297 | 0,766 | ||
| N of valid cases | 356 | |||||
| KML * AGE | Ordinal per ordinal | Kendall’s Tau-C | 0.031 | 0.046 | 0.691 | 0,489 |
| Gamma | 0.051 | 0.074 | 0.691 | 0,489 | ||
| N of valid cases | 356 | |||||
| KML * GRD | Ordinal per ordinal | Kendall’s Tau-C | 0.022 | 0.047 | 0.482 | 0,630 |
| Gamma | 0.038 | 0.079 | 0.482 | 0,630 | ||
| N of valid cases | 356 | |||||
| KML * LIA | Ordinal per ordinal | Kendall’s Tau-C | 0.076 | 0.040 | 1.910 | 0,056 |
| Gamma | 0.246 | 0.128 | 1.910 | 0,056 | ||
| N of valid cases | 356 | |||||
| KML * KOS | Ordinal per ordinal | Kendall’s Tau-C | 0.039 | 0.045 | 0.882 | 0,378 |
| Gamma | 0.074 | 0.083 | 0.882 | 0,378 | ||
| N of valid cases | 356 | |||||
| KIDSCREEN-20 * KML | Ordinal per ordinal | Kendall’s Tau-C | -0.002 | 0.043 | -0.039 | 0,969 |
| Gamma | -0.003 | 0.078 | -0.039 | 0,969 | ||
| N of valid cases | 356 | |||||
a The null hypothesis is not assumed. b Use of the asymptotic standard error that presupposes the null hypothesis. * p-value < 0.05, ** p-value < 0.01.
Table 9.
Pearson Chi-Square Tests by specific cases.
| Variable 1 | Variable 2 | N of valid cases | Expected counts less than 5 (%). | Test validity |
Value | df | Asymp. Sig. (2-sided) |
|---|---|---|---|---|---|---|---|
| KIDSCREEN-20 | SEX | 356 | 0.0% * | Yes | 7.402 | 3 | 0.060 |
| KML | LIA | 356 | 16.7% * | Yes | 3.442 | 2 | 0.179 |
* % Expected counts less than 5 ≤ 20%, ** p-value < 0.05, *** p-value < 0.01.
Disclaimer/Publisher’s Note: The statements, opinions and data contained in all publications are solely those of the individual author(s) and contributor(s) and not of MDPI and/or the editor(s). MDPI and/or the editor(s) disclaim responsibility for any injury to people or property resulting from any ideas, methods, instructions or products referred to in the content. |
© 2025 by the authors. Licensee MDPI, Basel, Switzerland. This article is an open access article distributed under the terms and conditions of the Creative Commons Attribution (CC BY) license (http://creativecommons.org/licenses/by/4.0/).
Copyright: This open access article is published under a Creative Commons CC BY 4.0 license, which permit the free download, distribution, and reuse, provided that the author and preprint are cited in any reuse.


