
Submitted:
11 May 2025
Posted:
13 May 2025
You are already at the latest version
Abstract
The present study investigated the validity of the Italian version of the Prejudice towards People with Mental Illness scale (PPMI-IT) in measuring biases toward individuals with mental health issues. The original instrument was translated and back translated from english into italian. A sample of 455 italian-speaking participants (65% female; Mage= 33.39; SD=13.21) was utilized to conduct exploratory and confirmatory factor analyses, confirming a four-factor structure (Fear - Avoidance, Malevolence, Authoritarianism, Unpredictability). Factor loadings indicated that each dimension was well represented, supporting the construct validity of the scale. Model fit indices, including Chi-Square (χ² = 782.54, df = 296.00, χ²/df = 2.64), RMSEA (0.06, 90% CI: 0.060–0.07), CFI (0.93), TLI (0.91), and SRMR (0.06), suggest an excellent model fit. Furthermore, the analysis of correlations and the Heterotrait-Monotrait (HTMT) ratio provides evidence supporting the discriminant validity of the PPMI scale from Social Desirability. These findings confirm that the PPMI scale is a valid and reliable tool for assessing biases toward individuals with mental health issues, making it suitable for academic research, clinical interventions, and public policy contexts.
Keywords:
PPMI
; Prejudice
; Mental Illness
; Mental Health
1. Introduction
Criticisms in the measurement of prejudice
Prejudice is a complex social phenomenon that significantly impacts individuals and communities, influencing attitudes, behaviors, and societal structures. Studying prejudice is essential for addressing issues of discrimination and inequality, promoting inclusion, and improving interpersonal and group dynamics. However, examining prejudice poses several challenges due to its multifaceted nature and the factors influencing its expression and measurement.
Prejudice often operates on both explicit and implicit levels. While explicit prejudice refers to consciously held biases, implicit prejudice involves unconscious attitudes and stereotypes. These dual levels require different approaches to measurement and interpretation.
As a consequence, studies addressing prejudice toward individuals with mental health conditions suffer from theoretical, conceptual, and psychometric challenges.
To bridge these gaps, Kenny et al. (2018) introduced the Prejudice toward People with Mental Illness (PPMI) scale, offering a refined framework that integrates stigma and prejudice research. Stigma includes elements like stereotypes and discrimination, yet prejudice, often defined as a negative attitude, remains underexplored and poorly measured in this context.
Numerous scales have been developed to assess stigma toward individuals with mental illness, many of which include items designed to measure prejudice. Researchers have highlighted the importance of construct validity, which ensures that a scale accurately measures the intended psychological construct and aligns with its theoretical antecedents and consequences (Evans-Lacko et al., 2010). Despite these concerns, many existing scales fail to clearly define the constructs they measure and often combine elements like beliefs, attitudes, and stereotypes about mental illness (Wahl, 2018; Högberg et al., 2008).
For instance, some scales do not distinguish between awareness of stereotypes and approval of them, and their items tend to focus on multiple aspects of mental illness, such as the person, the illness, or the treatment, without addressing the evaluative component central to prejudice. This lack of clarity impedes the connection between these measures and discriminatory behavior. Moreover, many scales suffer from methodological issues, such as double-barreled items (questions that combine two ideas), and often fail to account for response biases, such as acquiescence, which can distort results (Hirai & Clum, 2000).
Furthermore, many scales do not adequately address social desirability bias, which can influence how individuals report their attitudes. This is particularly problematic when measuring negative attitudes toward people with mental illness, as individuals may be hesitant to express prejudiced views due to social expectations. To mitigate this, researchers frequently construct balanced scales with an equal number of positively and negatively keyed items (Matousian & Otto, 2023; Chirico & Rizzo, 2024; Sibley & Duckitt, 2008; Rizzo et al., 2025).
Individuals often modify their responses to align with socially acceptable norms, a phenomenon known as social desirability bias. This is particularly problematic when studying prejudice, as respondents may underreport biases or discriminatory behaviors due to fear of judgment or repercussions (Bell & Bishai, 2021).
The national context
The research on stigma related to mental illness in Italy highlights a complex panorama where qualitative methods, such as narrative reviews and structured tools like questionnaires and interviews, emerge as key approaches to understanding and addressing the issue.
Narrative reviews broadly explore perceptions and attitudes toward mental illness, synthesizing available evidence. These studies, often based on data from clinical and community contexts, underline how stigma is rooted in cultural, social, and professional factors. The qualitative approach revealed that educational interventions targeting mental health awareness among young people reveal the effectiveness of initiatives aimed at reducing prejudice and promoting positive attitudes (Morris et al., 2012; Baker et al., 2005). However, these studies are not based on the psychometric approach and lack of specific instruments and measures, despite being conducted in Italy.
Studies employing qualitative structured tools, such as tailored questionnaires and interviews, provide a more detailed understanding of personal and professional experiences. Some studies based on interview techniques with healthcare workers and caregivers highlight the weight of perceived and internalized stigma, both in hospital and family settings. Ad hoc questionnaires, used to measure implicit and explicit attitudes, demonstrate how stigma affects clinical decisions and the quality of relationships between patients and medical staff (Bonnington & Rose, 2014; Kassam et al., 2010), but without providing validity tests.
A central theme in national literature is also the comparison between the perception of stigma associated with traditional mental illnesses, such as bipolar or psychotic disorders, and more recent conditions, like substance use disorders (Rizzo et al., 2025). Studies conducted in Italy use mixed methodologies to analyze these aspects, revealing that terminology and labeling models play a crucial role in perpetuating or mitigating prejudice (Polari et al., 2024; Barello et al., 2024). In this case, the fact that the researchers had to independently construct measures highlights once again that a tool in the Italian language is not available.
Present study aim
An Italian version of the PPMI scale is hence necessary, because no comparable instrument exists in the Italian context to measure prejudice toward individuals with mental health issues. The present study fills a critical gap by providing a validated and culturally adapted tool that addresses this need.
We aim to conduct an extensive validation process, including descriptive statistics, reliability analysis, exploratory factor analysis (EFA), confirmatory factor analysis (CFA), construct validity, and discriminant validity assessments.
These comprehensive analyses would ensure that the Italian version of the PPMI scale is psychometrically robust and culturally relevant, providing researchers and practitioners with a valuable tool to assess and address mental health stigma in the Italian context.
2. Materials and Methods
- Sample
To validate a scale comprising 28 items in the general population, it is recommended to recruit a sample size following the rule of thumb of 5–10 participants per item (Whitehead et al., 2016). This approach ensures sufficient statistical power for exploratory and confirmatory factor analyses. Accordingly, a minimum sample size of 140 participants is required, while an ideal sample size would be 280 participants. A total of 455 individuals participated in the study (131 males, 316 females, and 8 non-binary), aged between 18 and 75 years (65% female; Mage= 33.39; SD=13.21). Of the sample, 40.2% reported being employed, 32.3% were students, and 18.2% were both studying and working.
- Procedure
The tests were selected and organized in accordance with conventionally accepted ethical standards, with participants provided with informed consent and preliminary information about the study. Participation was voluntary and anonymous. The tests were administered via Google Forms during the period from February to June 2023. The link was promoted through social media platforms such as Instagram, Facebook, Twitch, Telegram groups, and WhatsApp.
Participants were also asked to provide demographic information such as age, gender (including perceived gender), and life activity (work, study, etc.), as well as whether they had ever received a psychiatric diagnosis or knew someone with a mental disorder. This information was collected to identify potential differences in prejudice measurement.
- Ethical Approval
The research followed the Ethical Guidelines of the Helsinki Declaration, the Ethical Guidelines for Internet Research (NESH), and was approved by the Ethical Committee of the Polish Society of Distaster Medicine (protocol n. 16.01.2023.IRB).
- Materials
The Prejudice towards People with Mental Illness (PPMI) scale
The PPMI scale consists of 28 items and uses a 9-point scale ranging from 0 (strongly disagree) to 8 (strongly agree). Kenny et al. (2018) designed and validated the scale by identifying four dimensions (Table 1) that underlie prejudice toward people with mental illnesses: 1) Fear and Avoidance, which assess fear and the tendency to avoid establishing an approach or relationship with people suffering from mental disorders; 2) Malevolence, which assess feelings of contempt and antipathy toward people with mental disorders; 3) Authoritarianism, which assess the tendency to restrict the freedom of people with mental disorders; 4) Unpredictability, which assess beliefs about the predictability or unpredictability of behaviors exhibited by people with mental disorders.
- Back translation
Following the guidelines from Tyupa (2011), an external individual, proficient in English, was contacted to assist with the translation of the scale. The original version of the scale was not provided to them. A comparison revealed that out of a total of 352 words, only 15 differed (representing just 4.2% of the total), while 95.74% of the words were identical. The entire procedure is detailed in the Appendixes A–C. The scale showed a readability score (Flesch Reading Ease) of 60, suggesting its applicability to the general population.
- Balanced Inventory of Desirable Responding-Italian version (BIDR-6)
The BIDR-6 questionnaire was translated and adapted to the Italian context through the back translation method by two independent researchers with the support of a native English speaker. A 6-point Likert scale was prepared, ranging from 1 (strongly disagree) to 6 (strongly agree), without a neutral midpoint to force respondents to express judgments about themselves.
The BIDR-6 consists of 16 items, aimed at investigating two dimensions: (1) Self-Deceptive Enhancement, i.e., the dynamics of self-deception; (2) Impression Management, i.e., the process through which individuals attempt to manipulate the impression they leave on others, related to social desirability (Fischer & Fick, 1993).
- Reliability of the Scale
Kenny and colleagues (2018) reported the following Cronbach’s alpha scores for the four subscales: Fear/Avoidance (α = .89), Malevolence (α = .73), Authoritarianism (α = .72), and Unpredictability (α = .86). The subdimensions were moderately to strongly intercorrelated, with the strongest correlation between fear/avoidance and authoritarianism (r = .64), and the weakest between malevolence and unpredictability (r = .31).
In the present study, the alpha values for the same dimensions of PPMI-IT are: Fear/Avoidance (α = .89), Malevolence (α = .80), Authoritarianism (α = .85), and Unpredictability (α = .85). Thus, greater reliability is observed in this study for the subscales regarding Fear/Avoidance, Malevolence, and Authoritarianism (Table 2).
3. Results
- Descriptive statistics
Table 3 shows the normative values obtained in the general sample for all the analyzed variables. The subscales demonstrated good reliability and validity, and in this case, also a normal distribution, with skewness and kurtosis values ranging between +1 and -1. The malevolence scale is an exception, as it shows distribution values slightly above the norm.
- Exploratory Factor Analysis
The Kaiser-Meyer-Olkin (KMO) Measure of Sampling Adequacy yielded a value of 0.927, indicating excellent suitability of the data for factor analysis, with a high degree of common variance among the variables. Bartlett's Test of Sphericity produced a Chi-Square value of 7219.182 with 378 degrees of freedom, and a p-value of 0.000, confirming statistical significance. This demonstrates that the correlation matrix is not an identity matrix and that there are significant relationships among the variables, validating the appropriateness of factor analysis.
The scree plot above shows the explained variance for each factor (Figure 1). It helps to determine the number of factors to retain by looking for the point where the explained variance starts to level off (the "elbow" point).
The "Total Variance Explained" Table 4 presents the results of a Principal Component Analysis (PCA), detailing how much of the total variance in the dataset is accounted for by each principal component. The Initial Eigenvalues show that the first component has an eigenvalue of 10.563, explaining 37.725% of the total variance. This means that the first component, associated with "Fear - avoidance”, captures a significant portion of the data's variability. The second component, "Malevolence", has an eigenvalue of 2.350 and accounts for an additional 8.393% of the variance, bringing the cumulative explained variance to 46.119%. The third component, "Authoritarianism", with an eigenvalue of 1.817, explains 6.489% more, and the fourth component, "Unpredictability", adds 5.220%, culminating in a cumulative explained variance of 57.828% for all four components.
The Extraction Sums of Squared Loadings mirror the initial eigenvalues because PCA was used as the extraction method, indicating that these components were retained for further analysis. The Rotation Sums of Squared Loadings provide adjusted eigenvalues after rotation, which aims to achieve a more interpretable factor structure by redistributing the explained variance among the components (e.g., the first component's eigenvalue adjusts to 8.999). It's important to note, as per footnote 'a', that when components are correlated, the sums of squared loadings cannot be simply added to determine the total variance explained. This adjustment reflects the interrelationships among the components and enhances the interpretability of the factors representing key constructs in the data.
- Confirmatory Factor Analysis
Here is the path diagram for the CFA of the PPMI scale (Figure 2), showing how the four areas (Fear-Avoidance, Malevolence, Authoritarianism, Unpredictability) load onto a single latent factor (PPMI). The diagram includes the loading values for each observed variable, providing a clear visual representation of the factor model. The points represent the variables, and the arrows indicate the direction and magnitude of each variable's loading on the factors.
The structural equation model (SEM) diagram depicts relationships among four latent constructs labeled "FEA" (likely representing Fear-Avoidance), "MAL" (Malevolence), "AUT" (Authoritarianism), and "UNP" (Unpredictability). Each construct is represented by a circular node, with double-headed arrows between them indicating correlations. The correlations are strong, with values such as 0.67 between FEA and MAL, 0.80 between MAL and AUT, 0.64 between FEA and AUT, and 0.72 between AUT and UNP, reflecting interconnectedness among these prejudices.
The constructs are linked to observed variables (items labeled P1, P2, etc.) with single-headed arrows showing factor loadings. These loadings indicate the degree to which each item is associated with its latent construct, with values around 0.6–0.8, showing moderate to strong relationships. Some loadings are lower, such as 0.50 or 0.40, which suggests weaker associations for certain items. Additionally, error terms for each observed variable (seen as circular arrows looping back) provide a sense of measurement error, capturing the variability in responses not explained by the latent construct. This diagram overall reflects a confirmatory factor analysis structure, validating how well each item aligns with its designated latent construct and illustrating the interrelationships among these psychological factors.
The baseline chi-square (7,093.36, df = 351) serves as a reference for incremental fit indices like CFI and TLI. The Akaike Information Criterion (AIC) and Bayesian Information Criterion (BIC) values (47,433.28 and 47,771.15, respectively) evaluate model parsimony, with lower values indicating better fit, but their interpretation is relative to alternative models. The log-likelihood values (-23,634.64 for the model and -23,243.37 for the unrestricted model) are useful for comparing nested models, highlighting the relative fit of the tested model. Lastly, the RMSEA "not-close fit" tests evaluate whether the model fit is not close, with significant p-values (e.g., 3.34 × 10⁻¹¹ for the H₀ = 0.08) supporting good fit. These measures complement the primary indices and reinforce the overall reliability of the model.
- Discriminant validity
The correlations between the PPMI subscales (Fear/Avoidance, Malevolence, Authoritarianism, and Unpredictability) and BIDR Self-Deceptive Enhancement (SDE) and Impression Management (IM) were generally low to moderate. Specifically, PPMI subscales showed significant but moderate correlations with SDE ( r ranging from 0.258 to 0.307, p<0.001), suggesting a moderate association but not strong enough to indicate overlap in constructs. In contrast, the correlations with IM were weaker (r ranging from -0.002 to 0.098), with only one significant association for Authoritarianism (r = 0.098, p = 0.037). These weak correlations with IM suggest minimal influence of socially desirable responding on the PPMI subscales, further supporting discriminant validity.
To complement these findings, the Heterotrait-Monotrait Ratio (HTMT) was calculated, with the following formula:
The average monotrait correlations (within PPMI subscales) were 0.285, while the average heterotrait correlations (between PPMI subscales and BIDR components) were 0.062. The resulting HTMT ratio was 0.22, which is well below the recommended threshold of 0.85, indicating strong discriminant validity.
4. Discussions
The present study on the validity of the PPMI-IT scale is consistent with and expands upon existing literature, particularly the work by Kenny et al. (2018). Kenny et al.'s original study identified four dimensions of prejudice—Fear/Avoidance, Malevolence, Authoritarianism, and Unpredictability—underpinning biases toward individuals with mental illnesses. This study validated the translated Italian version (PPMI-IT) and confirmed its four-factor structure using both exploratory and confirmatory factor analyses, which align with Kenny et al.'s findings.
The reliability analysis revealed higher Cronbach’s alpha values for the PPMI-IT subscales (e.g., Fear/Avoidance α = 0.91 vs. 0.89 in the original, Malevolence α = 0.80 vs. 0.73), indicating improved internal consistency. These results suggest that the Italian adaptation retains and possibly enhances the scale's psychometric properties, particularly for constructs such as Malevolence and Authoritarianism, which were weaker in the original version. The exploratory factor analysis demonstrated excellent sampling adequacy (KMO = 0.927), and Bartlett’s test confirmed the suitability of the data for factor analysis, supporting the robustness of the four-factor model.
The confirmatory factor analysis showed strong fit indices (e.g., RMSEA = 0.060, CFI = 0.928, TLI = 0.914, SRMR = 0.060), consistent with Kenny et al.’s validation. The intercorrelations between the subscales (e.g., Fear/Avoidance and Authoritarianism, r=0.64r = 0.64r=0.64) were also comparable to those reported by Kenny et al., further supporting the coherence of the theoretical structure. These results validate the scale’s construct validity while confirming its applicability in a new cultural context.
Discriminant validity findings also align with theoretical expectations. The moderate correlations between PPMI subscales and Self-Deceptive Enhancement (SDE) (ranging from r=0.258r = 0.258r=0.258 to r=0.307r = 0.307r=0.307) and the weaker, mostly non-significant correlations with Impression Management (IM) (r=−0.002r = -0.002r=−0.002 to r=0.098r = 0.098r=0.098) suggest the scale effectively measures prejudice constructs distinct from socially desirable responding. The calculated HTMT ratio of 0.22 is well below the threshold of 0.85, further confirming discriminant validity. This aligns with the original validation, reinforcing the scale's ability to measure distinct constructs.
Understanding social desirability is crucial for interpreting findings. For example, a low reported incidence of prejudice in a study may not reflect societal progress but rather an increased awareness of social norms discouraging prejudiced responses.
This result is surprising, since traditional self-report measures are limited in their ability to capture unconscious biases. For this reason, tools like the Implicit Association Test (IAT) and physiological measures (e.g., galvanic skin response, fMRI) are increasingly used and preferred, but these methods are resource-intensive and not immune to criticism regarding validity.
In conclusion, the results of this study are consistent with existing literature, demonstrating that the PPMI-IT scale is a valid and reliable instrument for measuring prejudice toward individuals with mental illnesses in the Italian context. The findings contribute to the growing body of research on stigma and provide a robust tool for cross-cultural comparisons and interventions targeting mental health stigma.
- Limitations
While the present study provides strong evidence for the validity and reliability of the PPMI scale, several limitations should be noted.
First, the study relies on self-reported data, which may introduce biases such as social desirability or self-deceptive enhancement, despite efforts to assess these influences through the BIDR scales. Although the correlations and HTMT ratio indicated discriminant validity, the association with Self-Deceptive Enhancement suggests the potential role of social desirability that deserves further investigation.
Second, the sample, although sufficiently wide, may not be fully representative of the general population, as it was not stratified by demographic or cultural factors that could influence biases toward individuals with mental health issues. Future research should examine the PPMI scale across diverse cultural and socioeconomic groups to establish its broader applicability and cross-cultural validity.
Lastly, while the model fit indices demonstrate an excellent fit, the reliance on confirmatory factor analysis (CFA) assumes that the hypothesized structure is correct without exploring alternative models. Future studies could use alternative methods, such as exploratory structural equation modeling (ESEM), to confirm whether the four-factor structure is optimal or if refinements are necessary.
Despite these limitations, the study significantly contributes to validating a scale capable of measuring biases toward individuals with mental health issues.
5. Conclusions
The analysis conducted confirms the validity of the Italian PPMI and its usefulness in measuring prejudices towards individuals with mental health issues. The four-factor structure is robustly supported by the data, indicating that the scale effectively and distinctly covers various aspects of mental health prejudice. The fit indices demonstrate excellent adherence to theoretical expectations, suggesting that the scale performs well within the Italian context.
Moreover, the analysis of correlations and the Heterotrait-Monotrait (HTMT) ratio provide strong evidence confirming the discriminant validity of the PPMI scale against Social Desirability. This demonstrates that the measurements taken with the PPMI scale are not significantly influenced by individuals' tendencies to respond in a socially desirable manner, thus making the data more reliable and truthful.
Therefore, it can be stated that the PPMI scale is a valid and reliable tool for research and clinical application in the field of mental health. This tool allows researchers and clinicians to identify and quantify levels of prejudice towards mental health in a specific and detailed manner, facilitating targeted interventions and informing public policies to effectively counter the stigma associated with mental illness.
The validation of the PPMI scale thus provides a valuable resource for better understanding how prejudices impact the treatment and perception of individuals with mental disorders in Italian society. The use of this tool can significantly improve intervention strategies, increasing cultural sensitivity and competence in healthcare and social services, thereby reducing barriers to treatment and improving outcomes for affected individuals.
Author Contributions
Conceptualization, AR and FB.; methodology, FC, HK, DAA; software, YR.; validation, VC, MC, and IF; formal analysis, AR, FB, YR; investigation, FB; resources, FC; data curation, AR; writing—original draft preparation, AR; writing—review and editing, FB, YR, HK, FC; visualization, VC, MC, and IF; supervision, AR; project administration, AR; funding acquisition, AR. All authors have read and agreed to the published version of the manuscript.
Funding
This research received no external funding.
Institutional Review Board Statement
The research followed the Ethical Guidelines of the Helsinki Declaration, the Ethical Guidelines for Internet Research (NESH), and was approved by the Ethical Committee of the Polish Society of Distaster Medicine (protocol n. 16.01.2023.IRB).
Informed Consent Statement
Informed consent was obtained from all subjects involved in the study.
Data Availability Statement
Access to the data is available upon reasonable request. For further inquiries, please contact amrizzo@unime.it.
Acknowledgments
None
Conflicts of Interest
The authors declare no conflicts of interest.
Abbreviations
The following abbreviations are used in this manuscript:
| MDPI | Multidisciplinary Digital Publishing Institute |
| DOAJ | Directory of open access journals |
| TLA | Three letter acronym |
| LD | Linear dichroism |
Appendix A
“The Prejudice towards People with Mental Illness (PPMI) scale”
Original Version by Kenny et al.
-
Fear/Avoidance
- I would find it hard to talk to someone who has a mental illness
- I would be less likely to become romantically involved with someone if I knew they were mentally ill
- It is best to avoid people who have mental illness
- I would feel unsafe being around someone who is mentally ill
- I would be just as happy to invite a person with mental illness into my home as I would anyone else*
- I would feel relaxed if I had to talk to someone who was mentally ill*
- I am not scared of people with mental illness*
- In general, it is easy to interact with someone who has mental illness*
-
Malevolence
- 9.
- People who are mentally ill are avoiding the difficulties of everyday life
- 10.
- People with mental illness should support themselves and not expect handouts
- 11.
- People who develop mental illness are genetically inferior to other people
- 12.
- People with mental illness do not deserve our sympathy
- 13.
- We, as a society, should be spending much more money on helping people with mental illness*
- 14.
- People who become mentally ill are not failures in life*
- 15.
- We need to support and care for people who become mentally ill*
- 16.
- Under certain circumstances, anyone can experience mental illness*
-
Authoritarianism
- 17.
- People who are mentally ill need to be controlled by any means necessary
- 18.
- Those who have serious mental illness should not be allowed to have children
- 19.
- People who are mentally ill should be forced to have treatment
- 20.
- People who are mentally ill should be free to make their own decisions*
- 21.
- People who are mentally ill should be allowed to live their life any way they want*
- 22.
- Society does not have a right to limit the freedom of people with mental illness*
-
Unpredictability
- 23.
- The behaviour of people with mental illness is unpredictable
- 24.
- People with mental illness often do unexpected things
- 25.
- In general, you cannot predict how people with mental illness will behave
- 26.
- The behaviour of people with mental illness is just as predictable as that of people who are mentally healthy*
- 27.
- People with mental illness behave in ways that are foreseeable*
- 28.
- I usually find people with mental illness to be consistent in their behaviour*
* = item was reverse-scored. Scala a 9 punti che va da − 4 (molto in disaccordo) a + 4 (molto d'accordo)
Fonte: Kenny, A., Bizumic, B., & Griffiths, K. M. (2018). The Prejudice towards People
with Mental Illness (PPMI) scale: structure and validity. BMC psychiatry, 18, 1-13.
Appendix B
“Scala sul pregiudizio verso le persone con malattie mentali”
Translation (from English into Italian) by © The Authors
-
Paura/Evitamento
- Mi verrebbe difficile parlare con qualcuno che ha una malattia mentale
- 2. Sarebbe meno facile essere coinvolto sentimentalmente con qualcuno se sapessi che ha una malattia mentale
- È meglio evitare persone con problemi mentali
- Non mi sentirei al sicuro accanto a qualcuno che ha una malattia mentale
- Sarei felice di invitare a casa mia una persona con una malattia mentale come lo sarei con chiunque altro
- Mi sentirei rilassato se dovessi parlare con qualcuno che ha una malattia mentale
- Non ho paura delle persone con malattie mentali
- In generale, è facile interagire con qualcuno che ha una malattia mentale
-
Malevolenza
- 9.
- Le persone che sono malate di mente stanno evitando le difficoltà della vita quotidiana
- 10.
- Le persone con malattie mentali dovrebbero aiutarsi da sè senza aspettarsi aiuto
- 11.
- Le persone che sviluppano malattie mentali sono geneticamente inferiori alle altre persone
- 12.
- Le persone con malattia mentale non meritano la nostra simpatia
- 13.
- Noi, come società, dovremmo spendere molti più soldi per aiutare le persone con malattie mentali
- 14.
- Le persone che si ammalano di mente non sono falliti nella vita
- 15.
- Dobbiamo sostenere e prenderci cura delle persone che si sviluppano una malattia mentale
- 16.
- In determinate circostanze, chiunque può sperimentare una malattia mentale
-
Autoritarismo
- 17.
- Le persone che sono malate di mente devono essere controllate con ogni mezzo necessario
- 18.
- Chi ha una grave malattia mentale non dovrebbero essere autorizzato ad avere figli
- 19.
- Le persone con malattia mentale dovrebbero essere costrette a farsi curare
- 20.
- Le persone con malattia mentale dovrebbero essere libere di poter prendere decisioni
- 21.
- Le persone con malattia mentale dovrebbero poter vivere la loro vita come vogliono
- 22.
- La società non ha il diritto di limitare la libertà delle persone con malattie mentali
-
Imprevedibilità
- 23.
- Il comportamento delle persone con malattie mentali è imprevedibile
- 24.
- Le persone con malattie mentali spesso fanno cose inaspettate
- 25.
- In generale, non è possibile prevedere come si comporteranno le persone con malattie mentali
- 26.
- Il comportamento delle persone con malattie mentali è altrettanto prevedibile di quello delle persone mentalmente sane
- 27.
- Le persone con malattie mentali si comportano in modi prevedibili
- 28.
- Di solito trovo che le persone con malattie mentali siano coerenti nel loro comportamento
- © Bruno & Rizzo, 2024
Appendix C
“Prejudice Towards People with Mental Ilness Scale”
Back translation (from Italian into English) by © The Authors
-
Fear/Avoidance
- I would find hard to talk someone who has a Mental illness
- I would be less likely to become romantically involved with someone who has a Mental illness
- It is best to avoid people who have mental illness
- I would feel unsafe being around someone who has a mental illness
- I would be just as happy to invite a person with Mental illness into my home as I would anyone else
- I would feel relaxed if I had to talk to someone who has a Mental illness
- I am not scared of people with mental illness
- In general, it is easy to interact with someone who has mental illness
-
Malevolence
- 9.
- People who have mental illness are avoiding the difficulties of everyday lite
- 10.
- People with mental Illness should support themselves and not expect handout
- 11.
- People who develop mental illness are genetically inferior to other people
- 12.
- People with mental Illness do not deserve our sympathy
- 13.
- We, as a society, should be spending much more money on helping people with mental illness
- 14.
- People who become with Mental illness are not failures in life
- 15.
- We need to support and care for people who become with mental illness
- 16.
- Under certain circumstances, anyone can experience mental illness
-
Authoritarianism
- 17.
- People who have mental illness need to be controlled by any means necessary
- 18.
- Those who have serious mental illness should not be allowed to have children
- 19.
- People who have mental illness should be forced to have treatment
- 20.
- People who have mental illness should be free to make their own decisions
- 21.
- People who have mental illness should be allowed to live their life any way they want
- 22.
- Society does not have a right to limit freedom of people with mental illness
-
Impredictability
- 23.
- The behavior of people with mental illness is unpredictable
- 24.
- People with mental illness often do unexpected things
- 25.
- In general, you cannot predict how people with mental illness will behave
- 26.
- The behavior of people with mental illness is just as predictable as that of people who are mentally healthy
- 27.
- People with mental illness behave in foreseeable ways
- 28.
- I usually find people with mental illness to be consistent in their behavior
References
- Baker JA, Richards DA, Campbell M. Nursing attitudes towards acute mental health care: development of a measurement tool. J Adv Nurs. 2005. [CrossRef]
- Bell SO, Bishai D. Can you repeat the question? Paradata as a lens to understand respondent experience answering cognitively demanding, sensitive questions. PLoS One. 2021 Jun 7;16(6):e0252512. PMID: 34097702; PMCID: PMC8183984. [CrossRef]
- Bonnington O., Rose D. (2014). Exploring stigmatisation among people diagnosed with either bipolar disorder or borderline personality disorder: A critical realist analysis. Social Science & Medicine.
- Chirico, F., & Rizzo, A. (2024). Tackling mental health disorders, burnout, workplace violence, post-traumatic stress disorders amidst climate change, and new global challenges: The crucial role of emotional management education. Advances in Medicine, Psychology, and Public Health, 2(1), 5-7.
- Evans-Lacko, S., Little, K., Meltzer, H., Rose, D., Rhydderch, D., Henderson, C., et al. (2010). Development and psychometric properties of the mental health knowledge schedule. Canadian Journal of Psychiatry, 55, 440-448. [CrossRef]
- Fischer DG, Fick C. Measuring social desirability: short forms of the Marlowe Crowne social desirability scale. Educ Psychol Meas. 1993;53:417–24. [CrossRef]
- Hirai, M., & Clum, G. A. (2000). Development, reliability, and validity of the beliefs toward mental illness scale. Journal of Psychopathology and Behavioral Assessment, 22, 221-236. [CrossRef]
- Högberg, T., Magnusson, A., Ewertzon, M., & Lützén, K. (2008). Attitudes towards mental illness in Sweden: Adaptation and development of the community attitudes towards mental illness questionnaire. International Journal of Mental Health Nursing, 17, 302-310. [CrossRef]
- Kassam A, Glozier N, Leese M, Henderson C, Thornicroft G. Development and responsiveness of a scale to measure clinicians’ attitudes to people with mental illness (medical student version). Acta Psychiatr Scand. 2010. [CrossRef]
- Kassam A, Glozier N, Leese M, Henderson C, Thornicroft G. Development and responsiveness of a scale to measure clinicians’ attitudes to people with mental illness (medical student version). Acta Psychiatr Scand. 2010; 122:153–61. [CrossRef]
- Kenny, A., Bizumic, B., & Griffiths, K. M., The Prejudice towards People with Mental Illness (PPMI) scale: structure and validity. BMC psychiatry, 2018. [CrossRef]
- Matousian, N., & Otto, K. (2023). How to measure mental illness stigma at work: Development and validation of the workplace mental illness stigma scale. Frontiers in Psychiatry, 14. [CrossRef]
- Morris R, Scott PA, Cocoman A, Chambers M, Guise V, Välimäki M, et al. Is the community attitudes towards the mentally ill scale valid for use in the investigation of European nurses’ attitudes towards the mentally ill? A confirmatory factor analytic approach. J Adv Nurs. 2012;68:460–70. [CrossRef]
- Rizzo, A., Calandi, L., Faranda, M., Rosano, M. G., & Vinci, E. (2024). The Link Between Stigmatization, Mental Health, Disability, and Quality of Life. Authorea Preprints.
- Rizzo, A., Calandi, L., Faranda, M., Rosano, M. G., Carlotta, V., & Vinci, E. (2025). Stigma against mental illness and mental health: The role of social media. Adv Med Psychol Public Health, 2(2), 125-130.
- Sibley, C. G., & Duckitt, J. (2008). Personality and prejudice: A meta-analysis and theoretical review. Personality and Social Psychology Review, 12, 248-279. [CrossRef]
- Tyupa, S. (2011). A theoretical framework for back-translation as a quality assessment tool. New Voices in Translation Studies, 7(1), 35-46.
- Veltro F., Raimondo A., Porzio C., Nugnes T., Ciampone V., A survey on the prejudice and the stereotypes of mental illness in two communities with or without psychiatric Residential Facilities, 2005. [CrossRef]
- Wahl, O. F. (1999). Mental health consumers' experience of stigma. Schizophrenia Bulletin. [CrossRef]
- Whitehead AL, Julious SA, Cooper CL, Campbell MJ. Estimating the sample size for a pilot randomised trial to minimise the overall trial sample size for the external pilot and main trial for a continuous outcome variable. Statistical methods in medical research. 2016 Jun;25(3):1057-73. [CrossRef]
Figure 1.
Exploratory Factor Analysis scree plot.
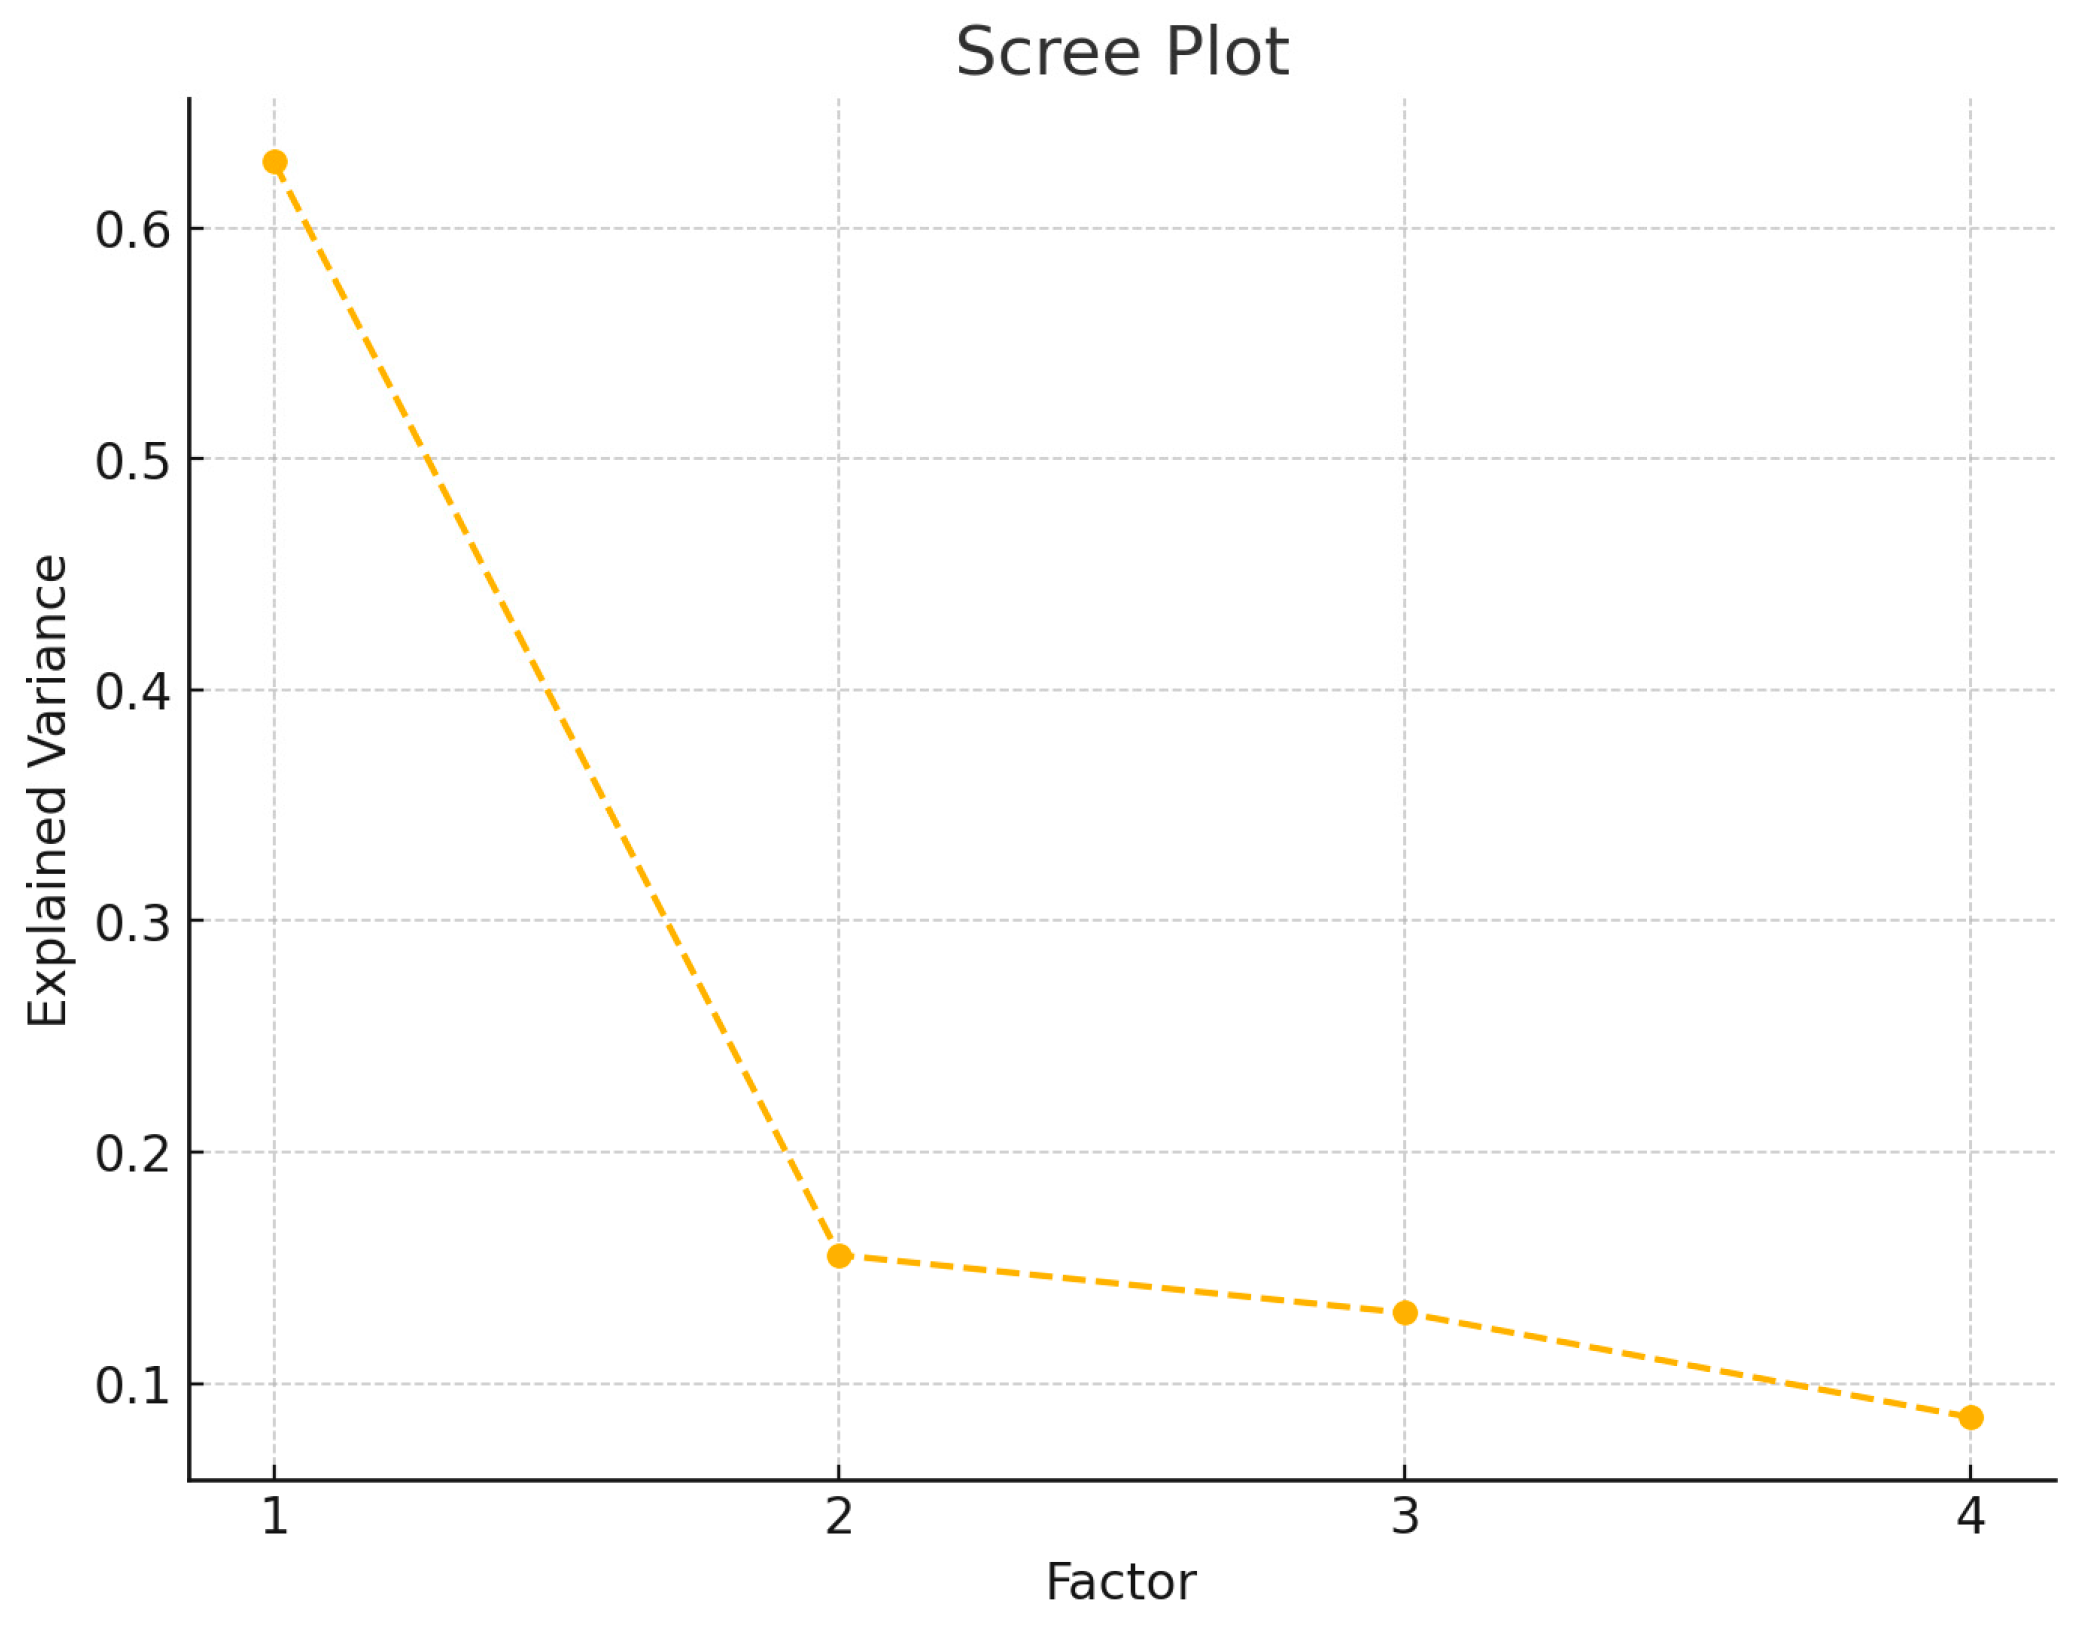
Figure 2.
path diagram for the CFA of the PPMI scale.
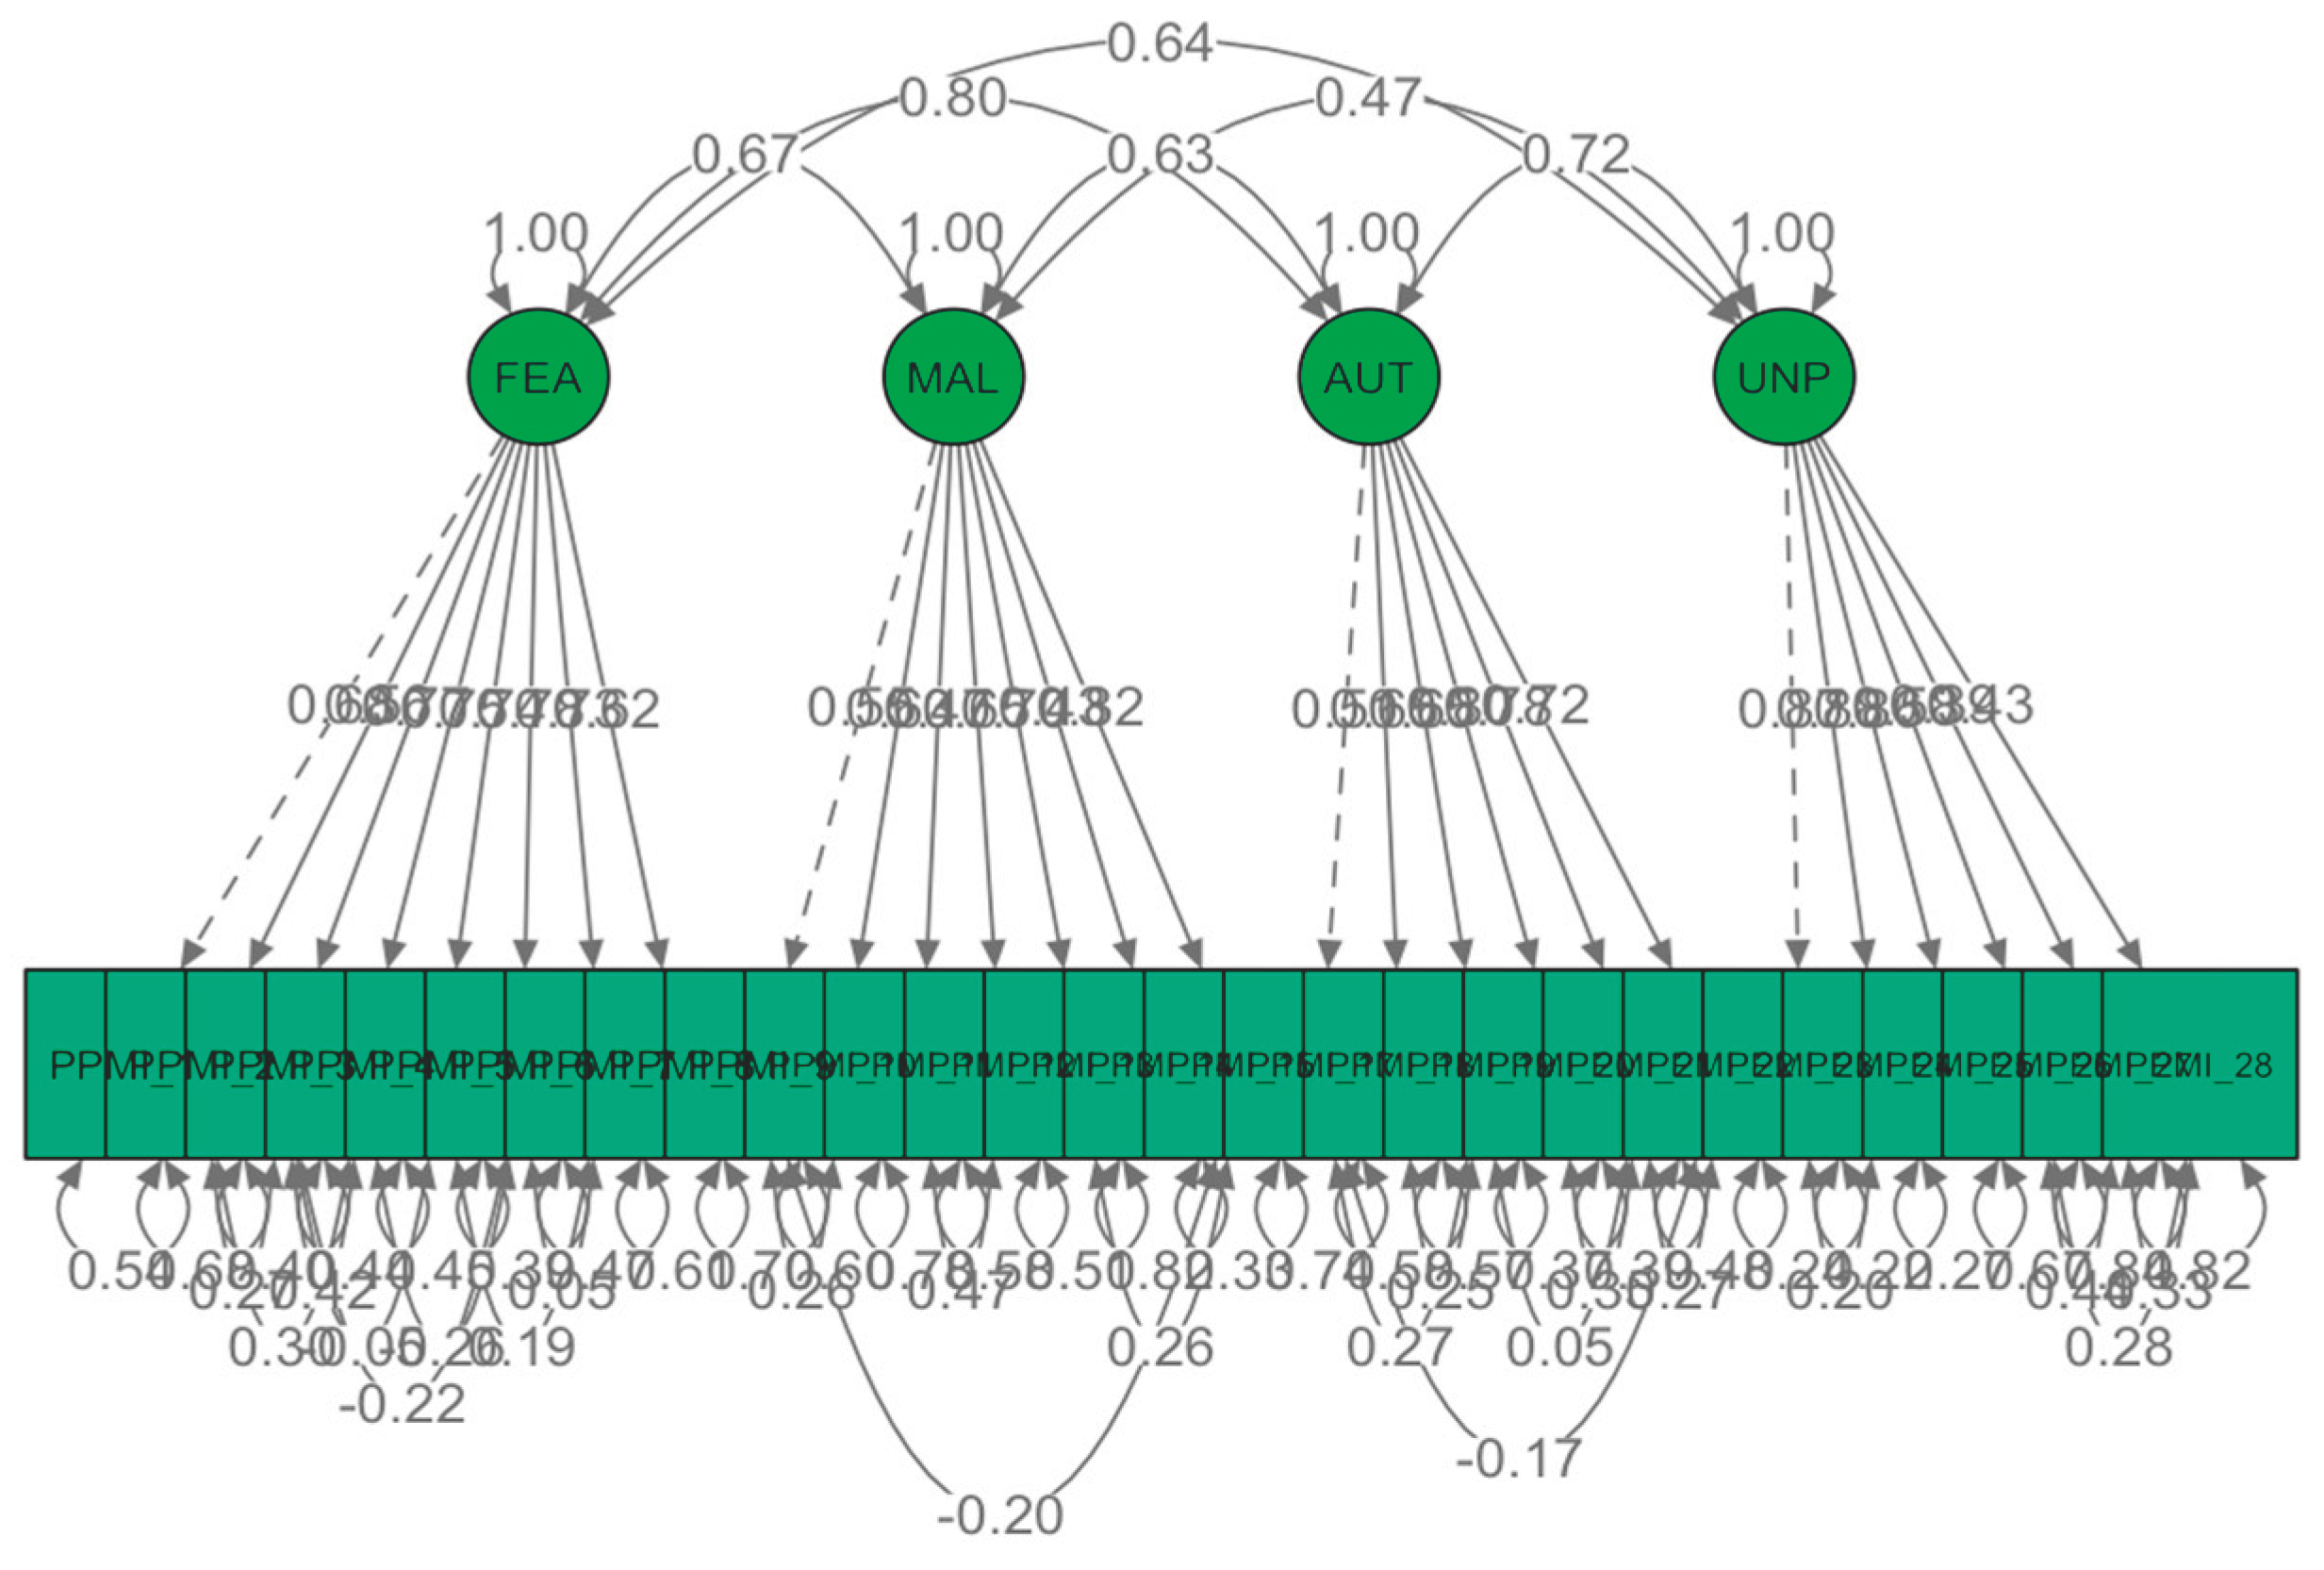

Table 1.
PPMI Structure and scoring procedure.
| Subscale | Description |
|---|---|
| Fear/Avoidance | The sum of the scores for items 1, 2, 3, 4, 5 (R), 6 (R), 7 (R), and 8 (R). |
| Malevolence | The sum of the scores for items 9, 10, 11, 12, 13 (R), 14 (R), 15 (R), and 16 (R). |
| Authoritarianism | The sum of the scores for items 17, 18, 19, 20 (R), 21 (R), and 22 (R). |
| Unpredictability | The sum of the scores for items 23, 24, 25, 26 (R), 27 (R), and 28 (R). |
Note: (R) indicates reverse-coded items.
Table 2.
Comparison of Cronbach's alpha values between the original version and the Italian version.
Table 2.
Comparison of Cronbach's alpha values between the original version and the Italian version.
| PPMI Scale/Subscale | Cronbach’s Alpha PPMI Original Version (Kenny et al., 2018) |
Cronbach’s Alpha PPMI-IT (Present Study) |
|---|---|---|
| Fear/Avoidance | 0.89 | 0.91 |
| Malevolence | 0.73 | 0.80 |
| Authoritarianism | 0.72 | 0.79 |
| Unpredictability | 0.86 | 0.82 |
Table 3.
Descriptive Statistics.
| PPMI-IT Subscale | Minimum | Maximum | Mean | St. Dev. | Skewness | Kurtosis |
|---|---|---|---|---|---|---|
| Fear/Avoidance | 8 | 70 | 32.09 | 14.216 | 0.367 | -0.487 |
| Malevolence | 8 | 63 | 16.24 | 9.656 | 1.706 | 3.251 |
| Authoritarianism | 6 | 54 | 26.51 | 11.486 | 0.309 | -0.455 |
| Unpredictability | 6 | 54 | 32.86 | 9.911 | 0.143 | 0.205 |
Table 4.
Total Variance Explained.
| Component | Initial Eigenvalues |
Extraction Sums of Squared Loadings |
Rotation Sums of Squared Loadings a | ||||
| Total | % of Variance | Cumulative % | Total | % of Variance | Cumulative % | Total | |
| 1 | 10,563 | 37,725 | 37,725 | 10,563 | 37,725 | 37,725 | 8,999 |
| 2 | 2,350 | 8,393 | 46,119 | 2,350 | 8,393 | 46,119 | 5,632 |
| 3 | 1,817 | 6,489 | 52,608 | 1,817 | 6,489 | 52,608 | 3,215 |
| 4 | 1,462 | 5,220 | 57,828 | 1,462 | 5,220 | 57,828 | 5,374 |
| Extraction Method: Principal Component Analysis. | |||||||
| a. When components are correlated, sums of squared loadings cannot be added to obtain a total variance. | |||||||
Table 5.
fit indices.
| Fit Index | Value |
|---|---|
| Chi-square (χ²) | 782.54 |
| Degrees of Freedom (df) | 296 |
| p-value | < 0.001 |
| CFI (Comparative Fit Index) | 0.928 |
| TLI (Tucker-Lewis Index) | 0.914 |
| RMSEA (Root Mean Square Error of Approximation) | 0.060 |
| RMSEA 90% CI | [0.055, 0.065] |
| p-value for RMSEA close fit | 0.0007 |
| SRMR (Standardized Root Mean Square Residual) | 0.060 |
Disclaimer/Publisher’s Note: The statements, opinions and data contained in all publications are solely those of the individual author(s) and contributor(s) and not of MDPI and/or the editor(s). MDPI and/or the editor(s) disclaim responsibility for any injury to people or property resulting from any ideas, methods, instructions or products referred to in the content. |
© 2025 by the authors. Licensee MDPI, Basel, Switzerland. This article is an open access article distributed under the terms and conditions of the Creative Commons Attribution (CC BY) license (http://creativecommons.org/licenses/by/4.0/).
Copyright: This open access article is published under a Creative Commons CC BY 4.0 license, which permit the free download, distribution, and reuse, provided that the author and preprint are cited in any reuse.


