
Submitted:
09 May 2025
Posted:
12 May 2025
You are already at the latest version
Abstract
This study explored the potential of Digital Earth Africa (DE Africa) coastline products for coastal vulnerability index (CVI) assessment. Although, CVI can be calculated from several dataset, objective of this study is to assess the CVI using remotely sensed data including the DE Africa coastline products and the Advanced Space borne thermal Emission and Reflection Radiometer Global Digital Elevation Model version 2 (ASTER GDEM), geological map, and geographic information system (GIS) techniques. The study has been conducted on the Atlantic coast of Morocco to evaluate the variability of the coastline of Casablanca from 2000 to 2023. The research was conducted by analyzing DE Africa coastline products namely annual shorelines and rates of coastal change along the Casablanca coastline. These products were used to extract coastal erosion metrics namely annual shoreline distances, shoreline change envelope (SCE), net shoreline movement (NSM), linear regression rate (LRR) and end point rate (EPR). The process involved the assessment of shoreline dynamics based on coastal erosion metrics and their variations especially for six main beaches located on the coast of Casablanca. These metrics were used in conjunction with information related to coastal elevation, coastal geomorphology and coastal slope, extracted from geologic map and ASTER GDEM, to compute the CVI in the GIS environment. The analyses of these datasets indicated that the major areas of Casablanca coastline, especially on the sand beaches, situated at elevation less than 12 m are threatened by the coastal hazards and are under pressure of coastal erosion at -1.5 m/yr rate. The results indicated that around 44 % and 23 % of the studied area have respectively a very high to high vulnerability index and they are vulnerable to natural phenomena such as inundation, coastal flooding and submersion, while 8 % and 25 % have respectively moderate and low vulnerability. This study showed that DE Africa coastline products combined with local landscape information constitute an invaluable tool for the studies of coastal monitoring.
Keywords:
satellite-derived shoreline
; coastal erosion
; digital earth Africa
; earth observation
; coastal geomorphology
; coastal monitoring
; climate change
1. Introduction
In view of the current changes into the climate system and their impacts in coastal areas, the assessment of coastal vulnerability (CV) has become the topic of greatest interest [1,2,3,4,5,6,7,8]. For this reason, several methods have been proposed to determine the coastal vulnerability; and they are mainly classified into 4 categories namely indexes, indicators, geographic information systems and dynamic computer models [1]. The most common used method to assess the CV is the coastal vulnerability index (CVI). The method has been introduced by Gornitz [9] to evaluate the CV by taking into consideration different physical factors that contribute to coastal erosion. Over the years, this method has been used by various authors [10,11,12,13] proposing its improvements and novelties which led to the creation of sub-methods considering risk factors such as socioeconomic for socioeconomic vulnerability index (SVI) and physical for physical vulnerability index (PVI) [1,13].
The physical risk factors such as coastal slope, coastal elevation, coastal geomorphology and shoreline dynamics have been adopted in the current study to assess the CVI of Casablanca coastline. It has been demonstrated that the coastline has important ecological functions and resource values for human survival and economic development [14,15,16] thus its monitoring and management are crucial. Such activities have been conducted in several areas with the main objective of producing vulnerability maps based on different variables [17,18]. The study conducted by Pantusa et al. [17] along the Calabrian Coastline demonstrated that the shoreline erosion/accretion rates are among the most influential variables in the studies of CV. The studies conducted by Borzi et al. [19] and Foti et al. [20] analyzed the coastline evolution and environmental changes by studying shoreline dynamics while Castelle et al. [21] and Konstantinou et al. [22] used satellite imagery to explore the potential of Earth observation (EO) data in the study of coastal area vulnerability. The studies highlighted the importance of using remote sensing and GIS techniques for coastal areas monitoring. These techniques are cost-effective and efficient for multi-temporal and multi-scales coastal vulnerability assessment. They can provide reliable and accurate results for long-term global shoreline changes investigations [23,24,25,26].
Digital Earth Africa (DE Africa) [27] is the most ambitious program established in 2019 to leverage the power of remote sensing EO technologies to produce products and provide services related to water resources and flood risks management; agriculture and food security; land degradation and coastline erosion; and services related to urbanisation. The aim of this study is to evaluate the potential of DE Africa coastline products [28] for CVI assessment on the Coastline of Casablanca. While several studies analyzing coastal erosion, beach retreat and shoreline retreat have been conducted on the Atlantic coast of Morocco [29,30,31,32], this current study intended to analyze CVI on the coastline of Casablanca by using DE Africa coastline products in conjunction with local landscape information. By the knowledge of the author, this study is the first of its kind conducted in this area by extracting and analyzing coastal erosion metrics such annual shoreline distances, shoreline change envelope (SCE), net shoreline movement (NSM), linear regression rate (LRR) and end point rate (EPR) with main objective of evaluating CVI. The study focused on the coastline of Casablanca to evaluate how climate change has been affecting the sea level of the Atlantic Ocean and its effects on this coastal environment by identifying and analyzing its shoreline variabilities. The methodological approach used in this study could help decision makers in their efforts of mitigation and adaptation to the effects of climate changes in the coastal areas.
2. Materials and Methods
2.1. Area of Study
Heger et al. [33] investigated coastal erosion with an objective of evaluating recent trends and hotspots of coastal erosion in Algeria, Libya, Morocco, and Tunisia. The authors analyzed high resolution EO data using 50 m resolution segments along the coastline and found that 54 % of Moroccan coastline is subject to erosion with a long-term erosion of 0.9 %. In addition, their analysis conducted to Identify coastal erosion hotspots found that the Atlantic side of Morocco’s coastline has a sand composition of about 96% In general, sources of coastal erosion vary and depend on shoreline characteristics as well as the coastline utilizations. The city of Casablanca is one of the Moroccan coastal cities. It is the economic capital which is located north-west of the country on the Atlantic Ocean (Figure 1). Casablanca has districts like Anfa, Ain Sebba, Sidi Bernoussi, …. It holds the most important port of the country and several industries. This area is the ideal place to study the effect of climate change because it is at the junction of three environments namely ocean, lands, and atmosphere where we can observe the role played by every unit in the climate system. Due to its position and its relationship with the Atlantic Ocean, Casablanca has winter precipitation influenced by several factors such as North Atlantic Oscillation and the atmospheric dampness of the west. The wind which takes place in areas with modification in atmospheric pressure has an impact on the ocean, in times of currants and oceanic temperatures. In the current area of study, the wind has S and SW directions in November till February and NNE and NW direction in April till September with 1.3 to 4.9 m/sec monthly average speed, but it can reach 43 m/s maximum value for instantaneous wind in winter at frequency of 10.2 days/year [34].
2.2. Methodology
2.2.1. Dataset and Software
In this study, DE Africa coastline products [35,36], geological maps, Advanced Space borne thermal Emission and Reflection Radiometer Global Digital Elevation Model version 2 (ASTER GDEM V2) with a space resolution of 30 m [37,38,39] were analyzed in geographic information system (GIS) environment for the assessment of CVI. DE Africa coastline products contain information related to Africa’s dynamic coastline from 2000 to 2023 for the whole African continent. These products have been generated following the same procedures as the Digital Earth Australia coastline products [25]. The V0.4.2 version of DE Africa Coastline products was accessed and downloaded from Amazon Web Service S3 [35]. They are grouped into two shapefile categories, polylines for the African annual shorelines that represent the median or ‘most representative’ position of the shoreline at approximately 0 m Above Mean Sea Level for each year since 2000 to 2023 and points for the African shoreline rates of change statistics which are point datasets providing robust rates of coastal change for every 30 m along Africa’s coastlines. The Centre de Suivi Ecologique, Dakar, has conducted a study to test the performance of the DE Africa Coastlines in collaboration with the member states of the WACA/ORLOA network (Investment Project for the Resilience of West African Coastal Zones / Regional Observatory of the West African Coast) Mauritania, Senegal, Gambia, Guinea Bissau, Republic of Guinea, Sierra Leone, Liberia, Côte d’Ivoire, Ghana, Togo, Benin, and Sao Tome and Principe [35] (As presented in Appendix C ). In each country, test sites have been selected depending on the size of the portion of the coast, the availability of reference data and metadata associated with each type of data. With imagery for each country having a consistent accuracy of 5 m [35]. The analyses of DE Africa coastline products (Table 1) allowed the more detailed analysis of the shoreline on the coastline of Casablanca.
2.2.2. Coastal Geomorphology - Lithology
The city of Casablanca situated on the west limit of Moroccan coastline, has two main rivers namely Beth and Bourgreg. It also has big watersheds and several dams. In addition, the coastal region is drained by small rivers such as Oued Mellah, Oued Lakhdar, Oued Dir, Oued Merzeg, Oued Arrimena and Oued Bouskoura. Each of these rivers has its own watershed with variable shapes and different characteristics. The geological formations dominating the coast of Casablanca are shale, sandstone, and quartzite; these formations constitute the folded Hercynian bedrock which is affected by a network of faults dominating the NE-SW direction. The bedrock is visible in some regions of the coast, but the rest is covered by secondary (Triassic and Cretaceous) formation and Tertiary formations dominated by limestone, conglomerate and quaternary formation dominated by sand. The geomorphology of Casablanca coast is characterized by sand beaches, rocky beaches, and man-made structures (Figure 2). In ArcGIS software, geomorphology – lithology information of Casablanca coastline was obtained using visual interpretation and manual digitization approaches from geologic maps and historic data [40].
2.2.3. Coastal Elevation
Coastal area elevation is an important factor in analyzing the behavior of the coastline with respect to sea level rise. On the coast of Casablanca, information related to elevation was extracted from ASTER GDEM. The low-lying regions represent areas that are very vulnerable to rising sea levels. It is important to note that sea level rise will amplify the erosion of beaches and accentuates the submersion of land by the action of waves. Previous studies carried out on the coastline of Casablanca-Mohammedia show evidence of ancient land movements and block falls generally located at the level of the coastal Corniche and places. The geological context of Morocco and other countries of the Gulf of Cadiz (Spain, Portugal) is the source of tsunami which can destroy a large part of their coastlines (Figure 3) Omira et al. [41]. Regarding seismic risks, the peak ground acceleration (PGA) maps calculated for a return period of 475 years show values between 0.04g and 0.08g indicating that the Casablanca site would have an intensity of the order of V corresponding to a moderate level of damage. This allowed to envisage an intensity on the order lower than V for a period of 50 years. However, such intensity estimate for PGA values do not take into account local geological or topographical conditions that can amplify seismic movements [42]. Concerning tsunami risks, historical events and seismotectonic contexts indicate that the Moroccan west coast is exposed to relatively significant tsunami risks with wave heights of 2 m and 1 m compared to the events of the first of November 1755 and 28th February 1969. In the next 20 years, it has been estimated to have an indication of about 10% probability of having a wave of 1m height on the coastline of Casablanca [42]. Analysis of altimetry data shows that from January 15, 1993, to December 15, 2014, the sea level at the coast of Casablanca increased at the rate of 2.6 mm/year. This sea level rise is partially the response of global melting of glaciers and ice sheets, continental water exchange with the ocean and the Gibraltar Strait, the rise of ocean temperature and glacial isostatic adjustment.
2.2.4. Coastal Slope
The slope is an important parameter in the study of the impact of sea level rise, it not only makes it possible to estimate the relative risks of flooding of the shore but also has influence on the velocity of change of the coastline for shrinkage regions with low slope values. Ten percent of Casablanca coastline has the slope ranging from 0 to 4% with areas likely to be affected by the rise in sea level which is accompanied by surges, storms and the action of waves. The slope was calculated from a digital elevation model (ASTER DEM) using Horn 1981 [43] method available in the ArcGIS spatial analyst and useful for beach morphology change studies [44].
2.2.5. Shoreline Dynamics
The coastline of Casablanca is subjected to a range of pressures, including extreme weather and climate, sea level rise and human development. To understand how this coastline is responding to these pressures is important for the management of this region, from social, environmental and economic perspectives. The DE Africa coastline products are continental datasets which include annual shorelines and rates of coastal change along the entire African coastline from 2000 to 2023. The product combines satellite data from the DE Africa program with tidal modelling to map the typical location of the coastline at mean sea level for each year. The product enables trends of coastal erosion and growth to be examined annually at both a local and continental scale, and for patterns of coastal change to be mapped historically and updated regularly as data continues to be acquired. The ability to map shoreline positions for each year provides valuable insights into whether changes to the coastline resulted from particular events or actions, or a process of more gradual change over time [35,36]. In this study, such analyses were conducted. A database of annual shorelines (Figure 4) and 1630 points of those products was created and analyzed in ArcGIS.
Locations of measured points containing rate of change statistics for every 30 m along the coast of Casablanca were obtained from DE Africa coastline v0.4.2 and were used to calculate coastal erosion metrics such as End point rate (EPR), which indicates the rate of change between the oldest and the youngest shoreline for each transect; and linear regression rate (LRR), which is a regression statistics estimated by fitting a least-squared regression line to all shoreline points of a transect. LRR represents the change in m/yr occurring on each transect. It is determined by plotting the shoreline intersect positions (distance from baseline) with respect to shoreline date (time), in this case, all the data (annual shoreline positions) is used, regardless of changes in trend or accuracy as presented on Figure 5. In this study, the EPR and LRR were used in conjunction with variables to calculate the CVI. The EPR is calculated by dividing the distance of displacement by the time elapsed between the oldest and the most recent shoreline. The results indicated the accretion (for positive values) and the erosion (for negative values) for the area of the study.
DE Africa coastline products also allowed to compute (equations 1, 2, 3) distance measurements in meters such as Net shoreline movement (NSM) which indicates the distance between the oldest and the recent shoreline for each point; and the Shoreline change envelope (SCE) which indicates a measure of the maximum distance of change or variability among all annual shorelines (Figure 6). SCE is calculated by computing the distance between any two annual shorelines that intersect a given transect.
Where is distance of the oldest shoreline, is distance of the recent shoreline, is shoreline date (time) of the oldest shoreline is shoreline date (time) of the recent shoreline, a is the slope of the equation describing the linear regression rate (LRR) of the linear regression equation of Y and b is a constant.
2.2.6. Coastal Vulnerability Index Calculation
Information obtained from different coastal variables such as coastal geomorphology-lithology, coastal slope, shoreline dynamics (erosion/accretion), coastal elevation were used to compute the CVI using an equation (4) integrating all these variables (Table 2). It is well known that there is no conventional equation to calculate CVI, methodological approaches depend on morphological characteristics (such the studied surface, length, the location, and geological settings) and the landscape of the studied area.
3. Results
In this study the coastal vulnerability index (CVI) was calculated to assess the vulnerability of the Moroccan Atlantic coast on the city of Casablanca. The CVI was analyzed by using remote sensing and GIS techniques namely the DE Africa coastline products and ASTER GDEM, geological map in GIS environment. The CVI was calculated based on four variables (coastal elevation, coastal slope, coastal geomorphology-lithology, and shoreline dynamic).
Figure 7 depicts the vulnerability of the coast of Casablanca based on its geomorphology. Very high vulnerability was observed on areas occupied by sandy beaches in NE and SW of Casablanca while high and moderate vulnerability were observed on natural and semi-natural coasts occupied by hard rocks.
Figure 8 illustrates the vulnerability ranking of the coast of Casablanca with reference to the coastal slope (steepness from each coastal cell of an elevation raster with 30 m of spatial resolution) and coastal elevation (vertical distance of a point above the mean sea level). Very high vulnerability was observed on areas occupied by sandy beaches while high and moderate vulnerability were observed on natural and semi-natural coasts occupied by hard rocks.
For each point, the rates of change have been calculated by linearly regressing annual shoreline cross-shore position against annual observation as presented in Figure 5. Negative values should indicate the retreat while positive values indicate the growth of the coastline. However, the annual shorelines do not reflect shorter-term coastal variability, such as changes in shoreline position between low and high tide, seasonal effects, or short-lived influences of individual storms. In this case, annual shorelines could show lower variability than the true range of coastal variability observed, and the rates of change could not assign a reason for change, and do not necessarily represent processes of coastal erosion or sea level rise [35,36]. For these reasons the rates of change (Figure 9) should be interpreted with caution. Therefore, six sand beaches were chosen for a better analysis of the shoreline dynamics related to coastal erosion and accretion. In this regard, the coastline of Casablanca, from 2000 to 2023, has a high rate of erosion of about – 1.45 m/yr and – 1 m/yr calculated on the beach of Ain Sebaa for EPR and LRR respectively. This phenomenon affected the regions occupied by the sand beaches with low protection against the tides and human activities. Almost the entire coastline of Casablanca is affected by erosion with high rate observed in the regions occupied by quaternary formations and low rate at the areas occupied by hard rocks and manmade structures. At the North-East of Casablanca, on the beaches of Zenata, Anfa and Ain Diab the shoreline variation is continuous in times with erosion persisting in these areas. On the Port and Marina of Casablanca and its western part the position of the shoreline is irregular in times with alternation of erosion and accretion processes. In general, CVI (Figure 10) calculated indicates that the coastline of Casablanca is vulnerable, and some parts of its coastline need changes in practice and protection against effects of extreme weather and human activities, the Easter part at Zenata where the city reaches the highly vulnerable coastline.
Figure 11 depicts the proportion of the CVI and indicates that 43.95 % and 23.03 % of Casablanca coastline have respectively very high to high vulnerability index and they are vulnerable to natural phenomena such as inundation, coastal flooding and submersion, while 7.58 % and 25.44 % have respectively moderate and low vulnerability. The north-east and south-west of the coastline of Casablanca are more vulnerable due to lack of protection for areas occupied by sandy beaches, while the areas occupied by hard rocks or cliffs are less vulnerable. However, in the central part of the harbor of Casablanca where the artificial coastline is occupied by constructions and is well protected.
4. Discussions
4.1. Annual Rates of Change and Coastline Classification for the Beaches of Madame Choual, Ain Diab, Anfa, Ain Sebaa, Nahla and Zenata located on the Coastline of Casablanca
The study conducted by Pantusa et al. [17] showed that the shoreline rates of change are the among the most influential variables in the assessment of the coastal vulnerability (CV); to further evaluate the contributions of the linear regression rate (LRR) and the end point rate (EPR) for the vulnerability of the coastline of Casablanca, very detailed shoreline dynamics were performed on six beaches namely Madame Choual (Figure A1, Table A1), Ain Diab (Figure A2, Table A2), Anfa (Figure A3, Table A3), Ain Sebaa (Figure A4 and Table A4), Nahla (Figure A5, Table A5) and Zenata (Figure A6, Table A6). The ability to calculate the rate of change of the shoreline for each 30 m along the coastline of Casablanca provides a huge opportunity to identify the areas which are being affected by the processes of erosion and accretion. This information is very useful for the determination of how such geological processes are contributing to the coastal vulnerability.
The sandy beach of Madame Choual is located on the SW of Casablanca, near the commercial center of Morocco Mall. Analysis of the 49 points obtained from the DE Africa coastline products as presented on Figure A1, revealed accretion of the coastline of about 77.5 % and 75.5% (Table A1) in respect with the results obtained by LRR and EPR. Also, a low vulnerability index was observed, probability due to the morphology of the beach protected by natural and semi-natural features located in the NE, contrary to the SW where a moderate erosion was observed. The rates of change calculated for 71 points along the coast of the beach of Ain Diab (Figure A2) indicated moderate erosion of about 18 % and 42 % (Table A2) for both LRR and EPR respectively. The assessment of the CV indicated that its index varies from moderate to low vulnerability mainly due to its configuration. Meanwhile, the Figure A3 showed that the rates of change calculated for 44 points located on the Beach of Anfa varied from 93.18% to 6.82% for LRR and from 59.1 % to 38.63% for EPR with low vulnerability observed for large part of the beach (Table A3).
In addition, on the Beach of Ain Sebaa, the rates of change calculated for the 43 points (Figure A4) highlighted areas affected by moderate to low vulnerability (Table A4). Furthermore, the rates of change calculated for 95 points located on the Beach of Nahla (Figure A5) illustrated a trend of shoreline changes dominated with erosion of about – 1.4 m/yr as obtained with EPR and moderate accretion of about 1.5 m/yr for LRR with both indexes revealing high, moderate and low vulnerable areas (Table A5). Analyses conducted for 76 points located on the Beach of Zenata (Figure A6) pinpointed the importance of evaluating the shoreline dynamics with two are more indexes for CVI assessment. LRR indicated that from 2000 to 2023 the beach of Zenata experienced accretion with low vulnerability while EPR was able to provide information related to erosion with a rate of about – 1 m/yr (Table A6).
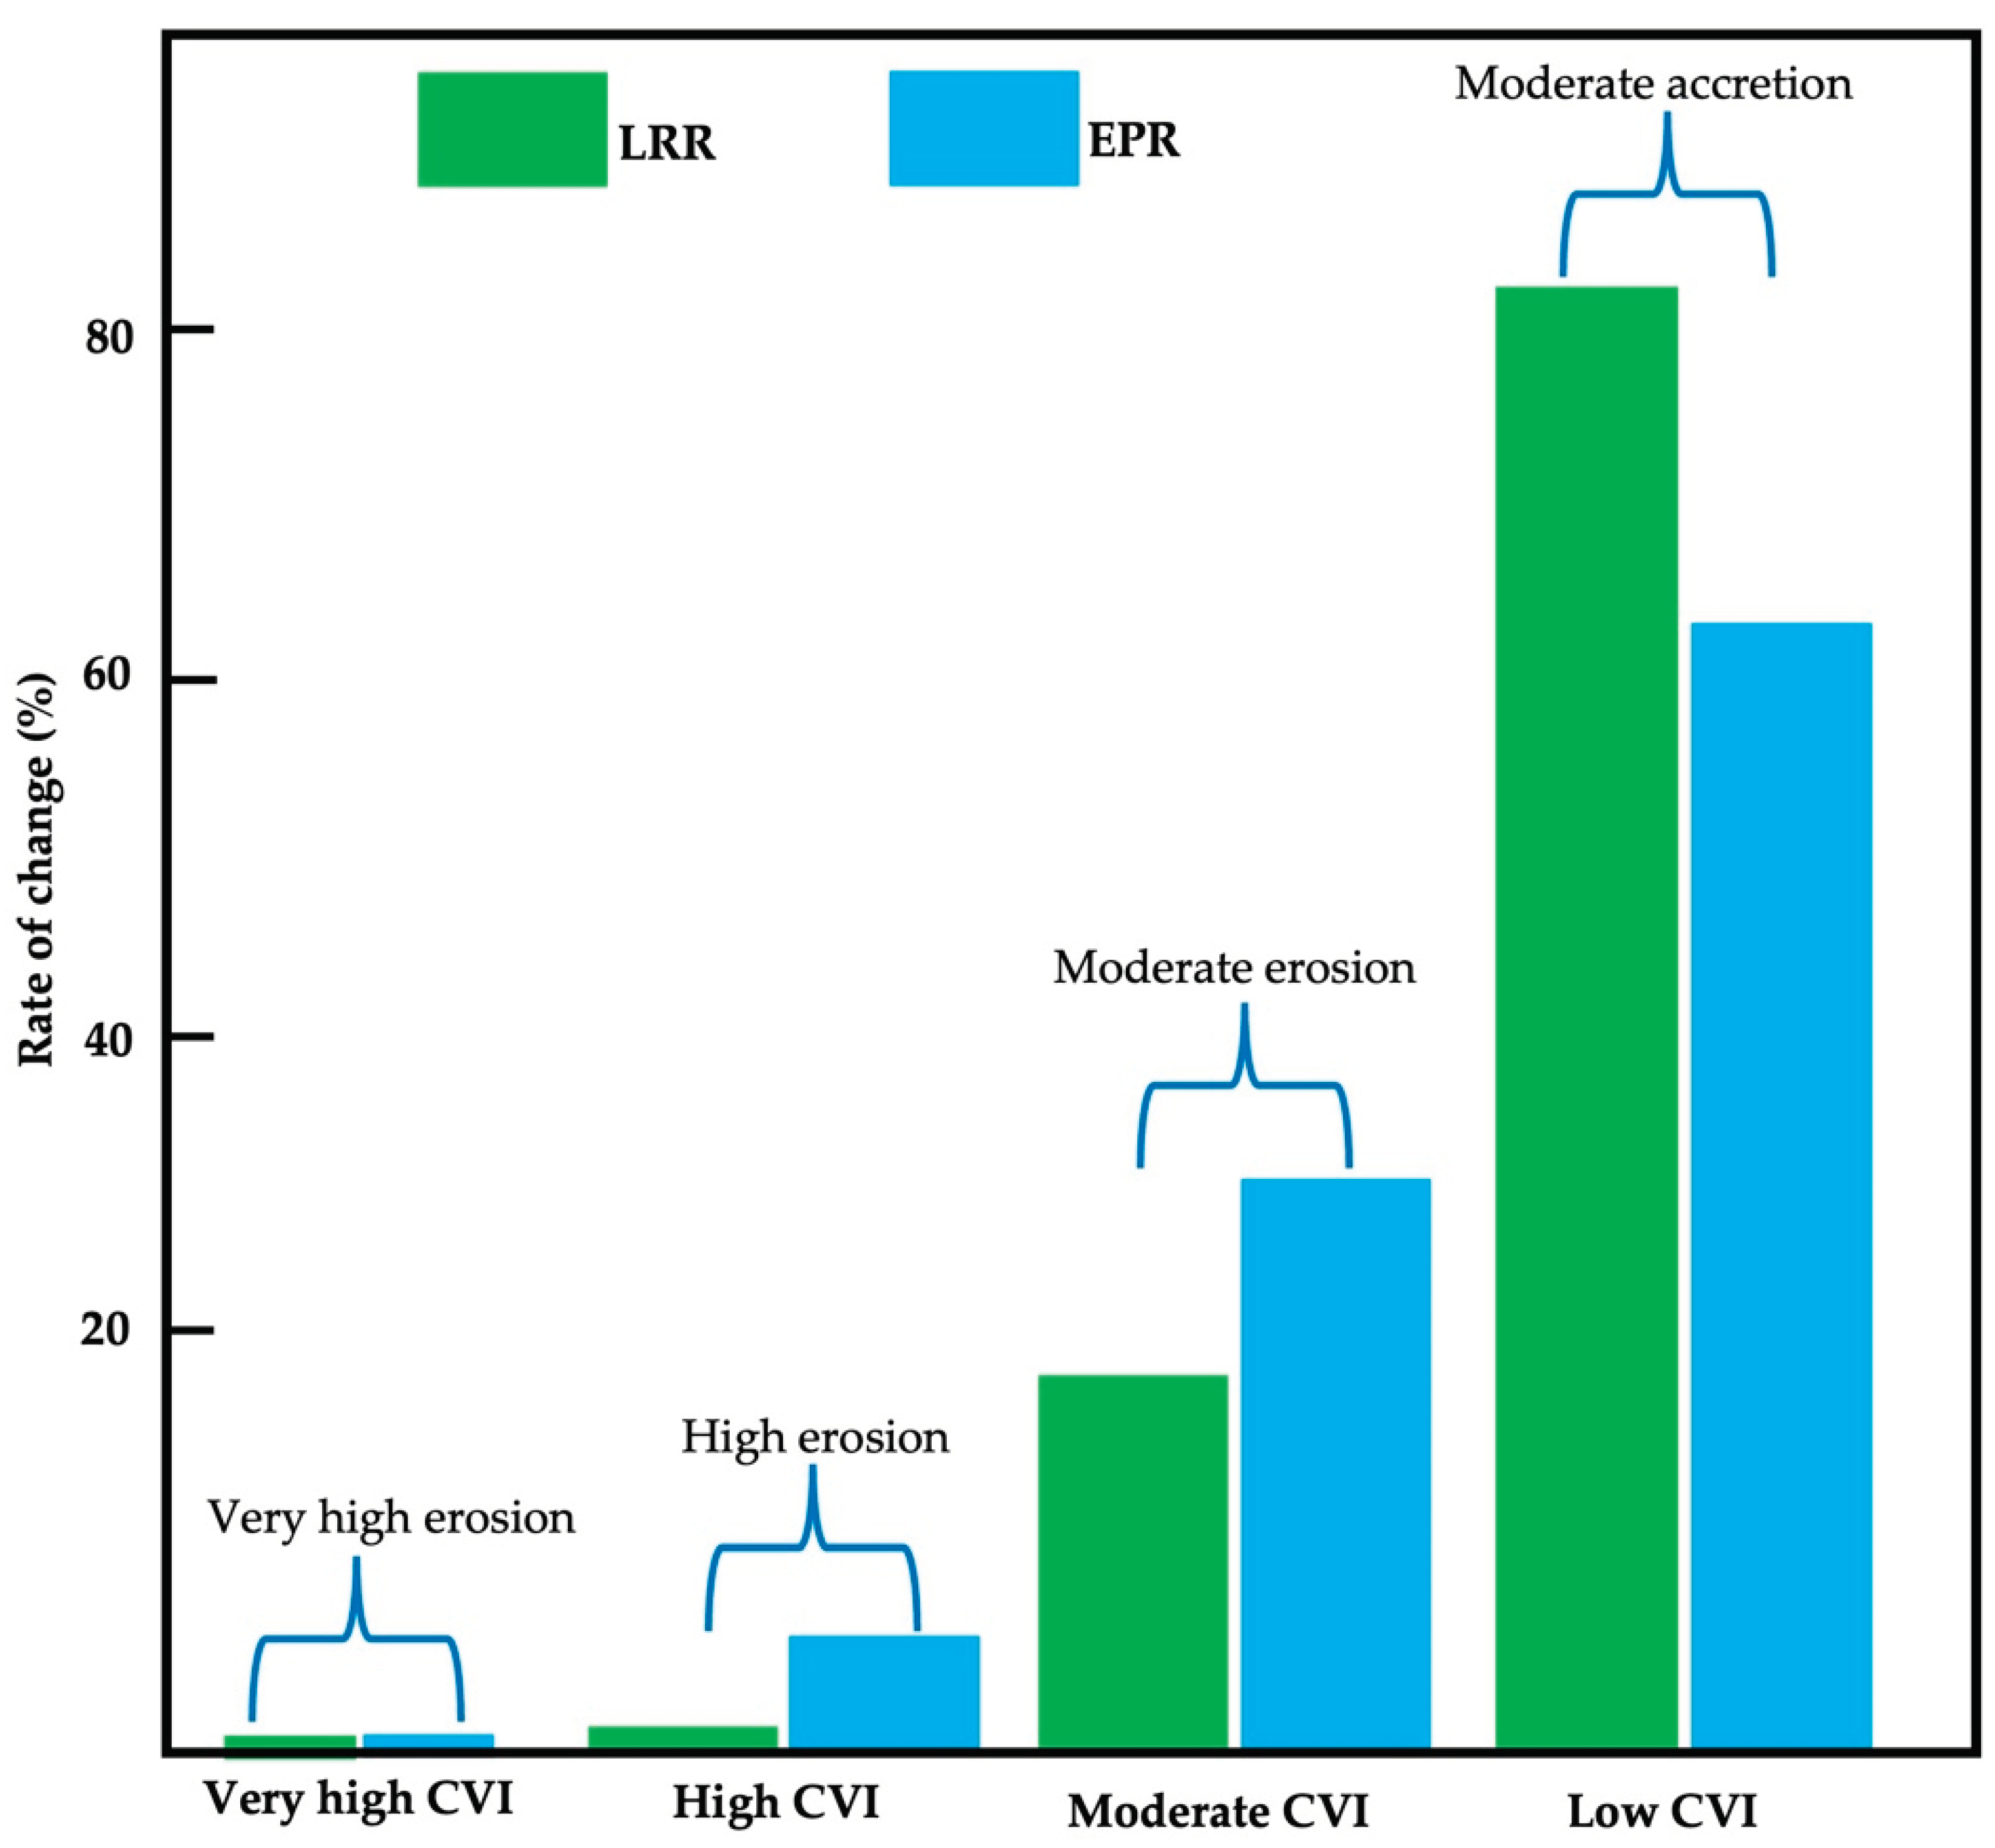
In general, the rates of change calculated for these six beaches revealed low CVI with moderate accretion at the rate of 82 % and 63 %, moderate CVI with moderate erosion at the rate of 17 % and 34 %, and high CVI with high erosion at the rate of 0.89 and 3.06 for LRR and EPR respectively; no very high CVI observed for both LRR and EPR (Figure 12).
4.2. Implications to Coastal Areas Management
This study reveals that DE Africa coastline products can be used for coastline dynamics studies and for the assessment of coastal vulnerability of the whole African continent. Such studies could provide useful information related to particular events or processes which are affecting African coastal regions. In the context of climate changes, monitoring of the shoreline and management of coastal areas are becoming more and more important, because it directly affects coastal environment and economic development. By analyzing the linear regression rate (LRR) and end point rate (EPR), future shoreline position can be predicted [45,46,47,48] and help prepare for future changes which could affect the coasts and effectively mitigate the impacts of hydrogeological events aggravated by climate change such as sea level rise, severe storms, coastal submersion and saltwater intrusion [49].
Coastal rates of change also help implement monitoring shoreline services that aim to support the effective management of highly dynamic and constantly changing coastal environments with hazardous conditions, as well as for sustainable coastal zones management. In addition, rates of changes from DE Africa can be combined with socioeconomic risk factors for an integrated socio-environmental vulnerability assessment of coastal hazards [50]. Therefore, this study not only constitutes a major contribution to coastal vulnerability assessment of Casablanca but also holds significant practical implications for scientists, managers, and policy makers to assess impact from the range of drivers impacting the coastlines and potentially assist planning and forecasting for future scenarios for other regions and countries [35,36,51].
5. Conclusions
The present study has been undertaken to evaluate the coastal vulnerability of Casablanca coastline due to climate change using remote sensing and geographic information system (GIS). DE Africa coastline products and ASTER GDEM combined with a geological map allowed the assessment of coastal vulnerability of the coast of Casablanca. To calculate the CVI, four variables namely coastal geomorphology, coastal elevation, coastal slope and coastal dynamics were used. The findings of this study can be summarized as follows:
1. Digital Earth Africa (DE Africa) coastline products allowed us to conduct very detailed analyses of shoreline dynamics from 2000 to 2023.
2. The results indicated that remotely sensed data and GIS techniques are very useful and cost-effective tools for multi scale geo-hazard coastal assessment studies.
5. Around 44 % to 23 % of the studied areas have respectively a very high to high vulnerability index. These areas are vulnerable to natural phenomena such as inundation, coastal flooding and submersion.
4. In addition to the coastal vulnerability index assessment, DE Africa coastline products can further be used for the development of coastal erosion indicators [52] and coastal erosion prediction.
Supplementary Materials
The following are available online at https://www.mdpi.com/article/doi/s1, Detailed descriptions of the point 0 considered for the showcase of the extraction of the coastal erosion metrics; the location of the 1630 points analysed on the coast of Casablanca; the significance (p-value) values of the linear relationship between annual shoreline positions and the annual observations; the standard error of the linear relationship between annual shoreline positions and the annual observations; and charts depicting annual shoreline positions (cross-shore distances) for each point located on the beaches of Madame Choual, Ain Diab, Anfa, Ain Sebaa, Nahla, and Zenata beaches, Casablanca, Morocco.
Funding
This research received no external funding.
Conflicts of Interest
The authors declare no conflicts of interest.
Appendix
Appendix A.1
Annual rates of change and coastline classification conducted on the beach of Madame Choual.
Figure A1.
Location of 49 points containing annual rates of change values (LRR and EPR) for the Beach of Madame Choual. The points are labelled from the NE (point 1473) to the SW (point 1521) with an interval of 30 m. For each point, annual rates of change have been calculated for the period of 2000 to 2023. LRR revealed the coastline growth of about 1.5 m/yr (a) while EPR indicated the coastline growth of about 0.9 m/yr and a retreat of about – 0.6 m/yr (b). Details on cross-shore annual shoreline positions are presented in the Supplementary Materials S.5 (Figures S4, S5, S6, S8).
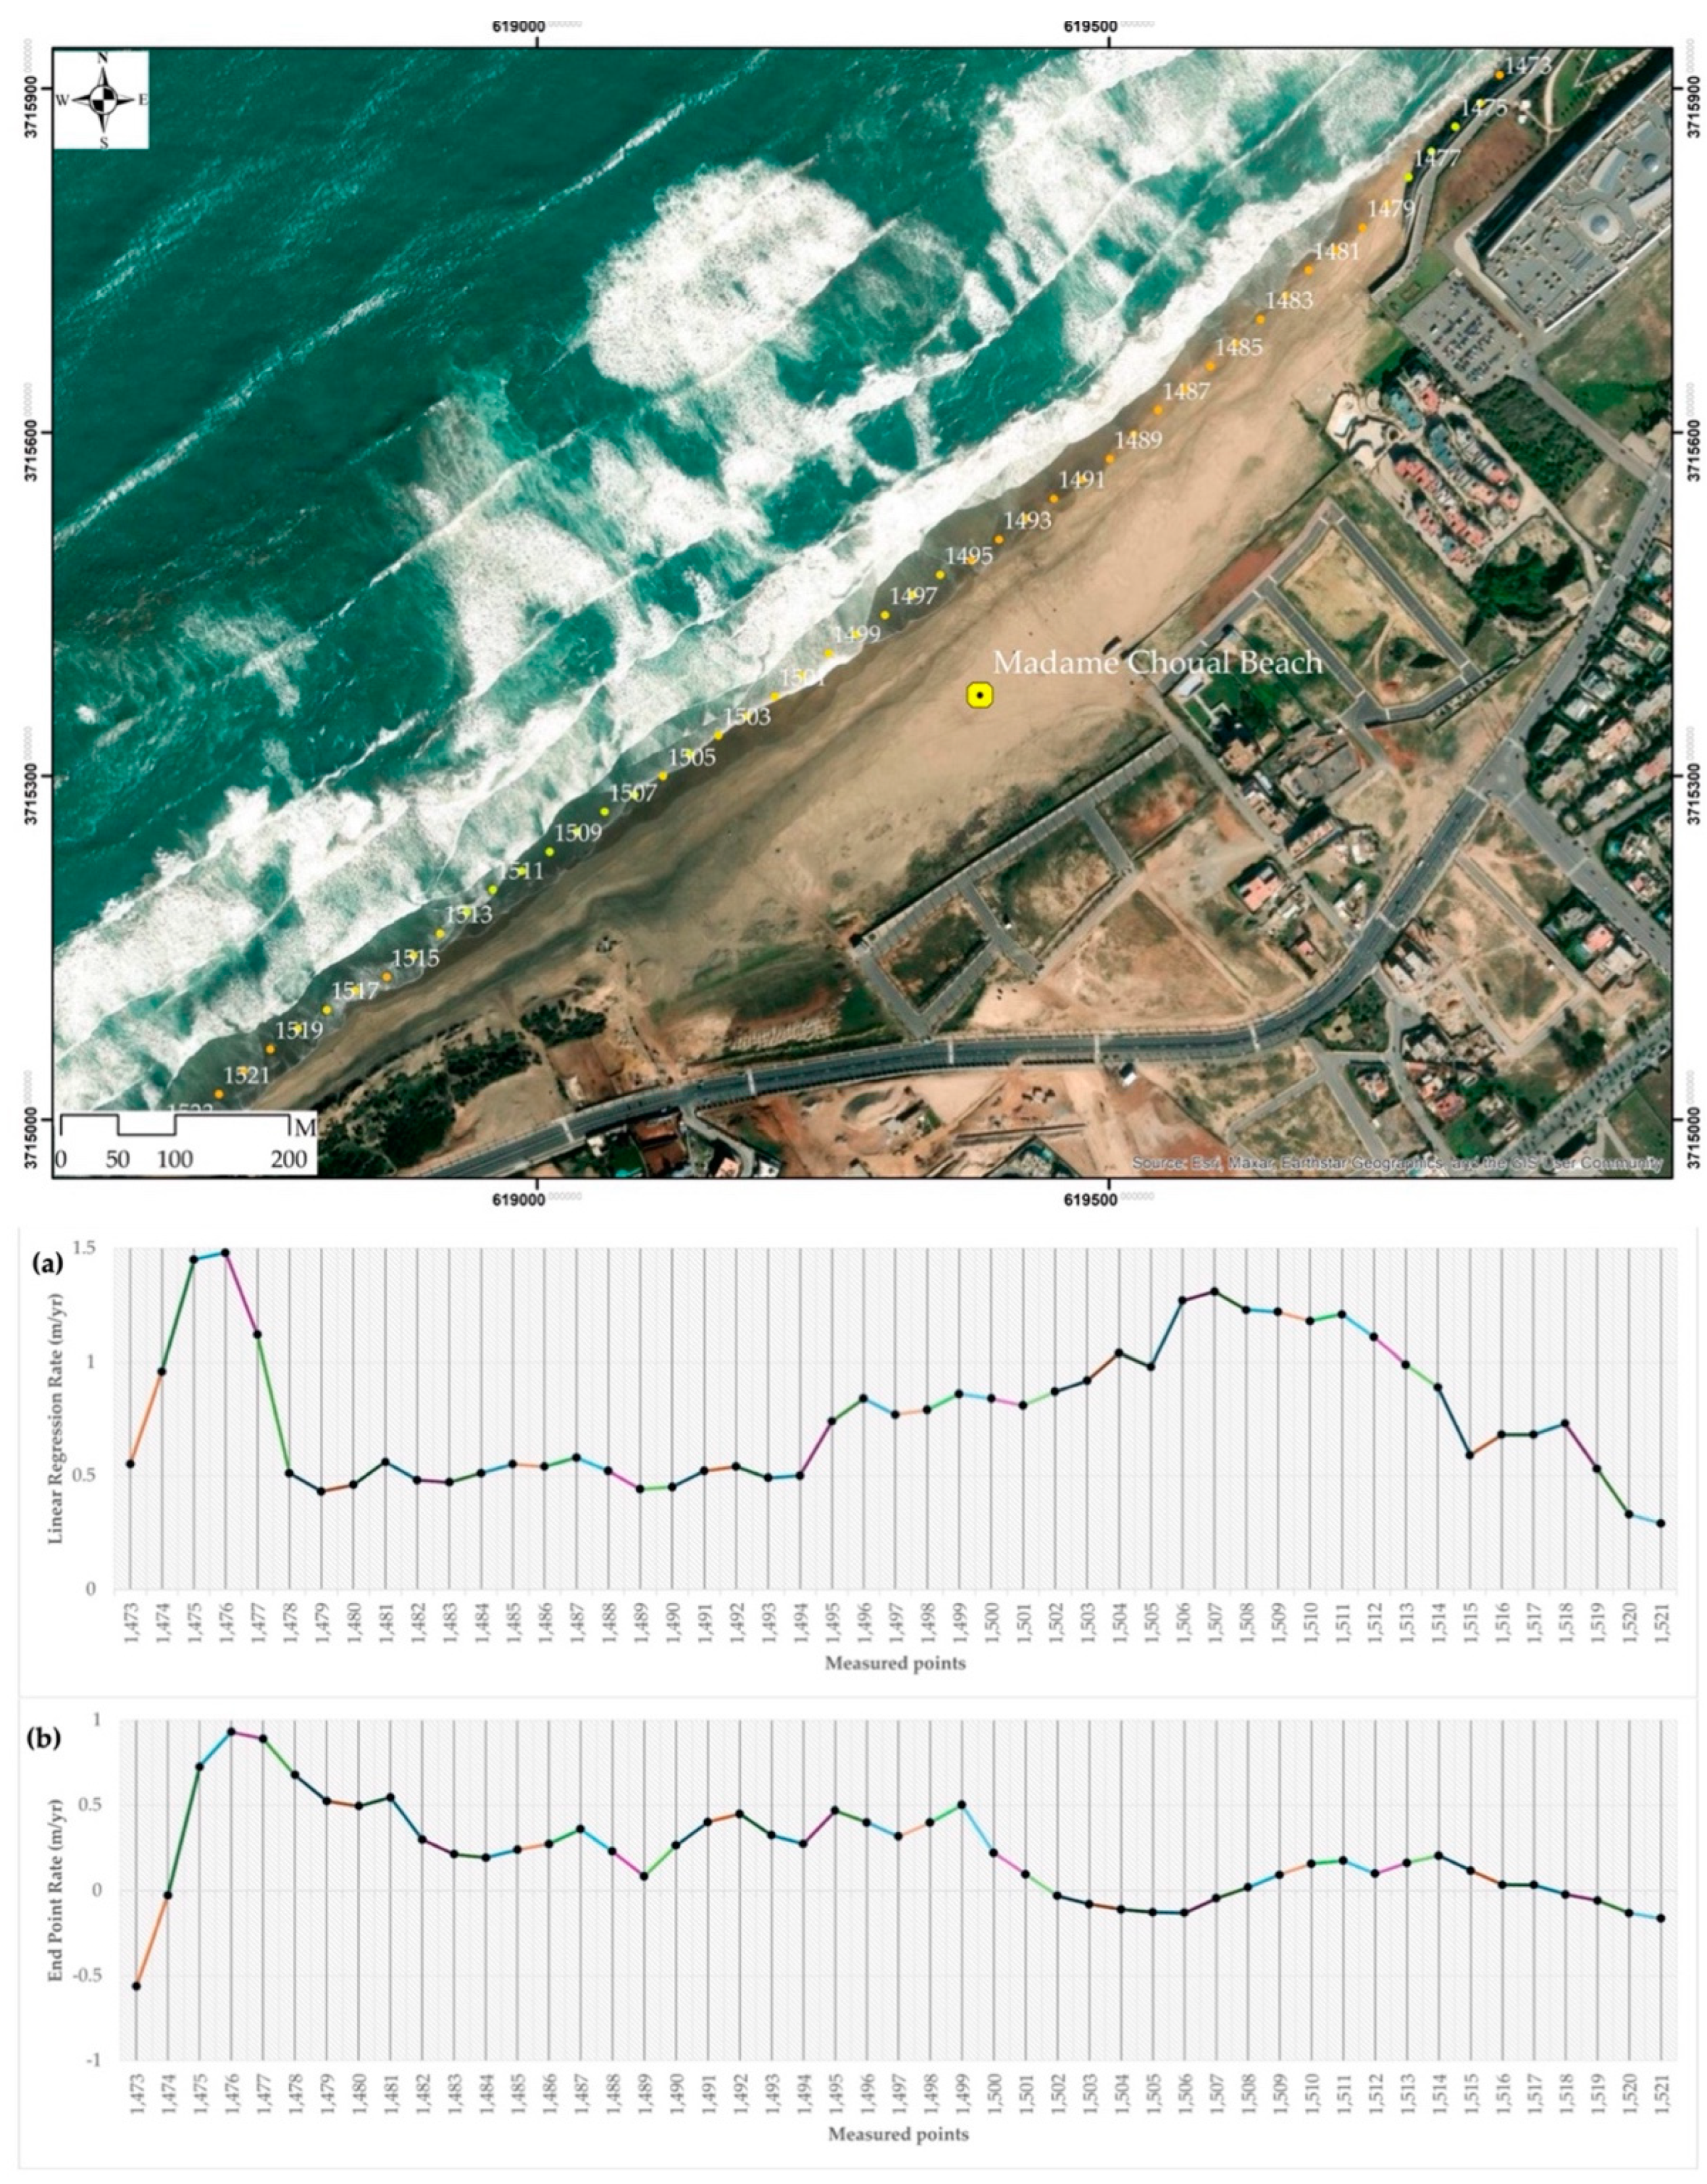

Table A1.
Annual rates of change and coastline classification results obtained on the beach of Madame Choual.
Table A1.
Annual rates of change and coastline classification results obtained on the beach of Madame Choual.
|
Rate of change Range (m/yr) |
LRR (%) |
EPR (%) |
Coastline Classification |
CVI Ranking |
| <-2 | N. A | N. A | Very high erosion | Very high |
| <-1 – ≥-2 | N. A | N. A | High erosion | High |
| < 0 – ≥-1 | N. A | 24.45 | Moderate erosion | Moderate |
| > 0 – ≤+1 | 77.55 | 75.55 | Accretion | Low |
| >+1 | 22.45 | N. A | Moderate accretion |
Appendix A.2
Annual rates of change and coastline classification conducted on Ain Diab beach
Figure A2.
Location of 71 points containing annual rates of change values (LRR and EPR) for the Beach of Ain Diab. The points are labelled from the NE (point 1356) to the SW (point 1426) with an interval of 30 m. For each point, annual rates of change have been calculated for the period of 2000 to 2023. LRR revealed the coastline growth of about 2 m/yr and retreat of about -0.4 m/yr (a) while EPR indicated the coastline growth of about 2.3 m/yr and a retreat of about -0.55 m/yr (b). Details on cross-shore annual shoreline positions are presented in the Supplementary Materials S.6 (Figures S8, S9, S10, S11, S12).
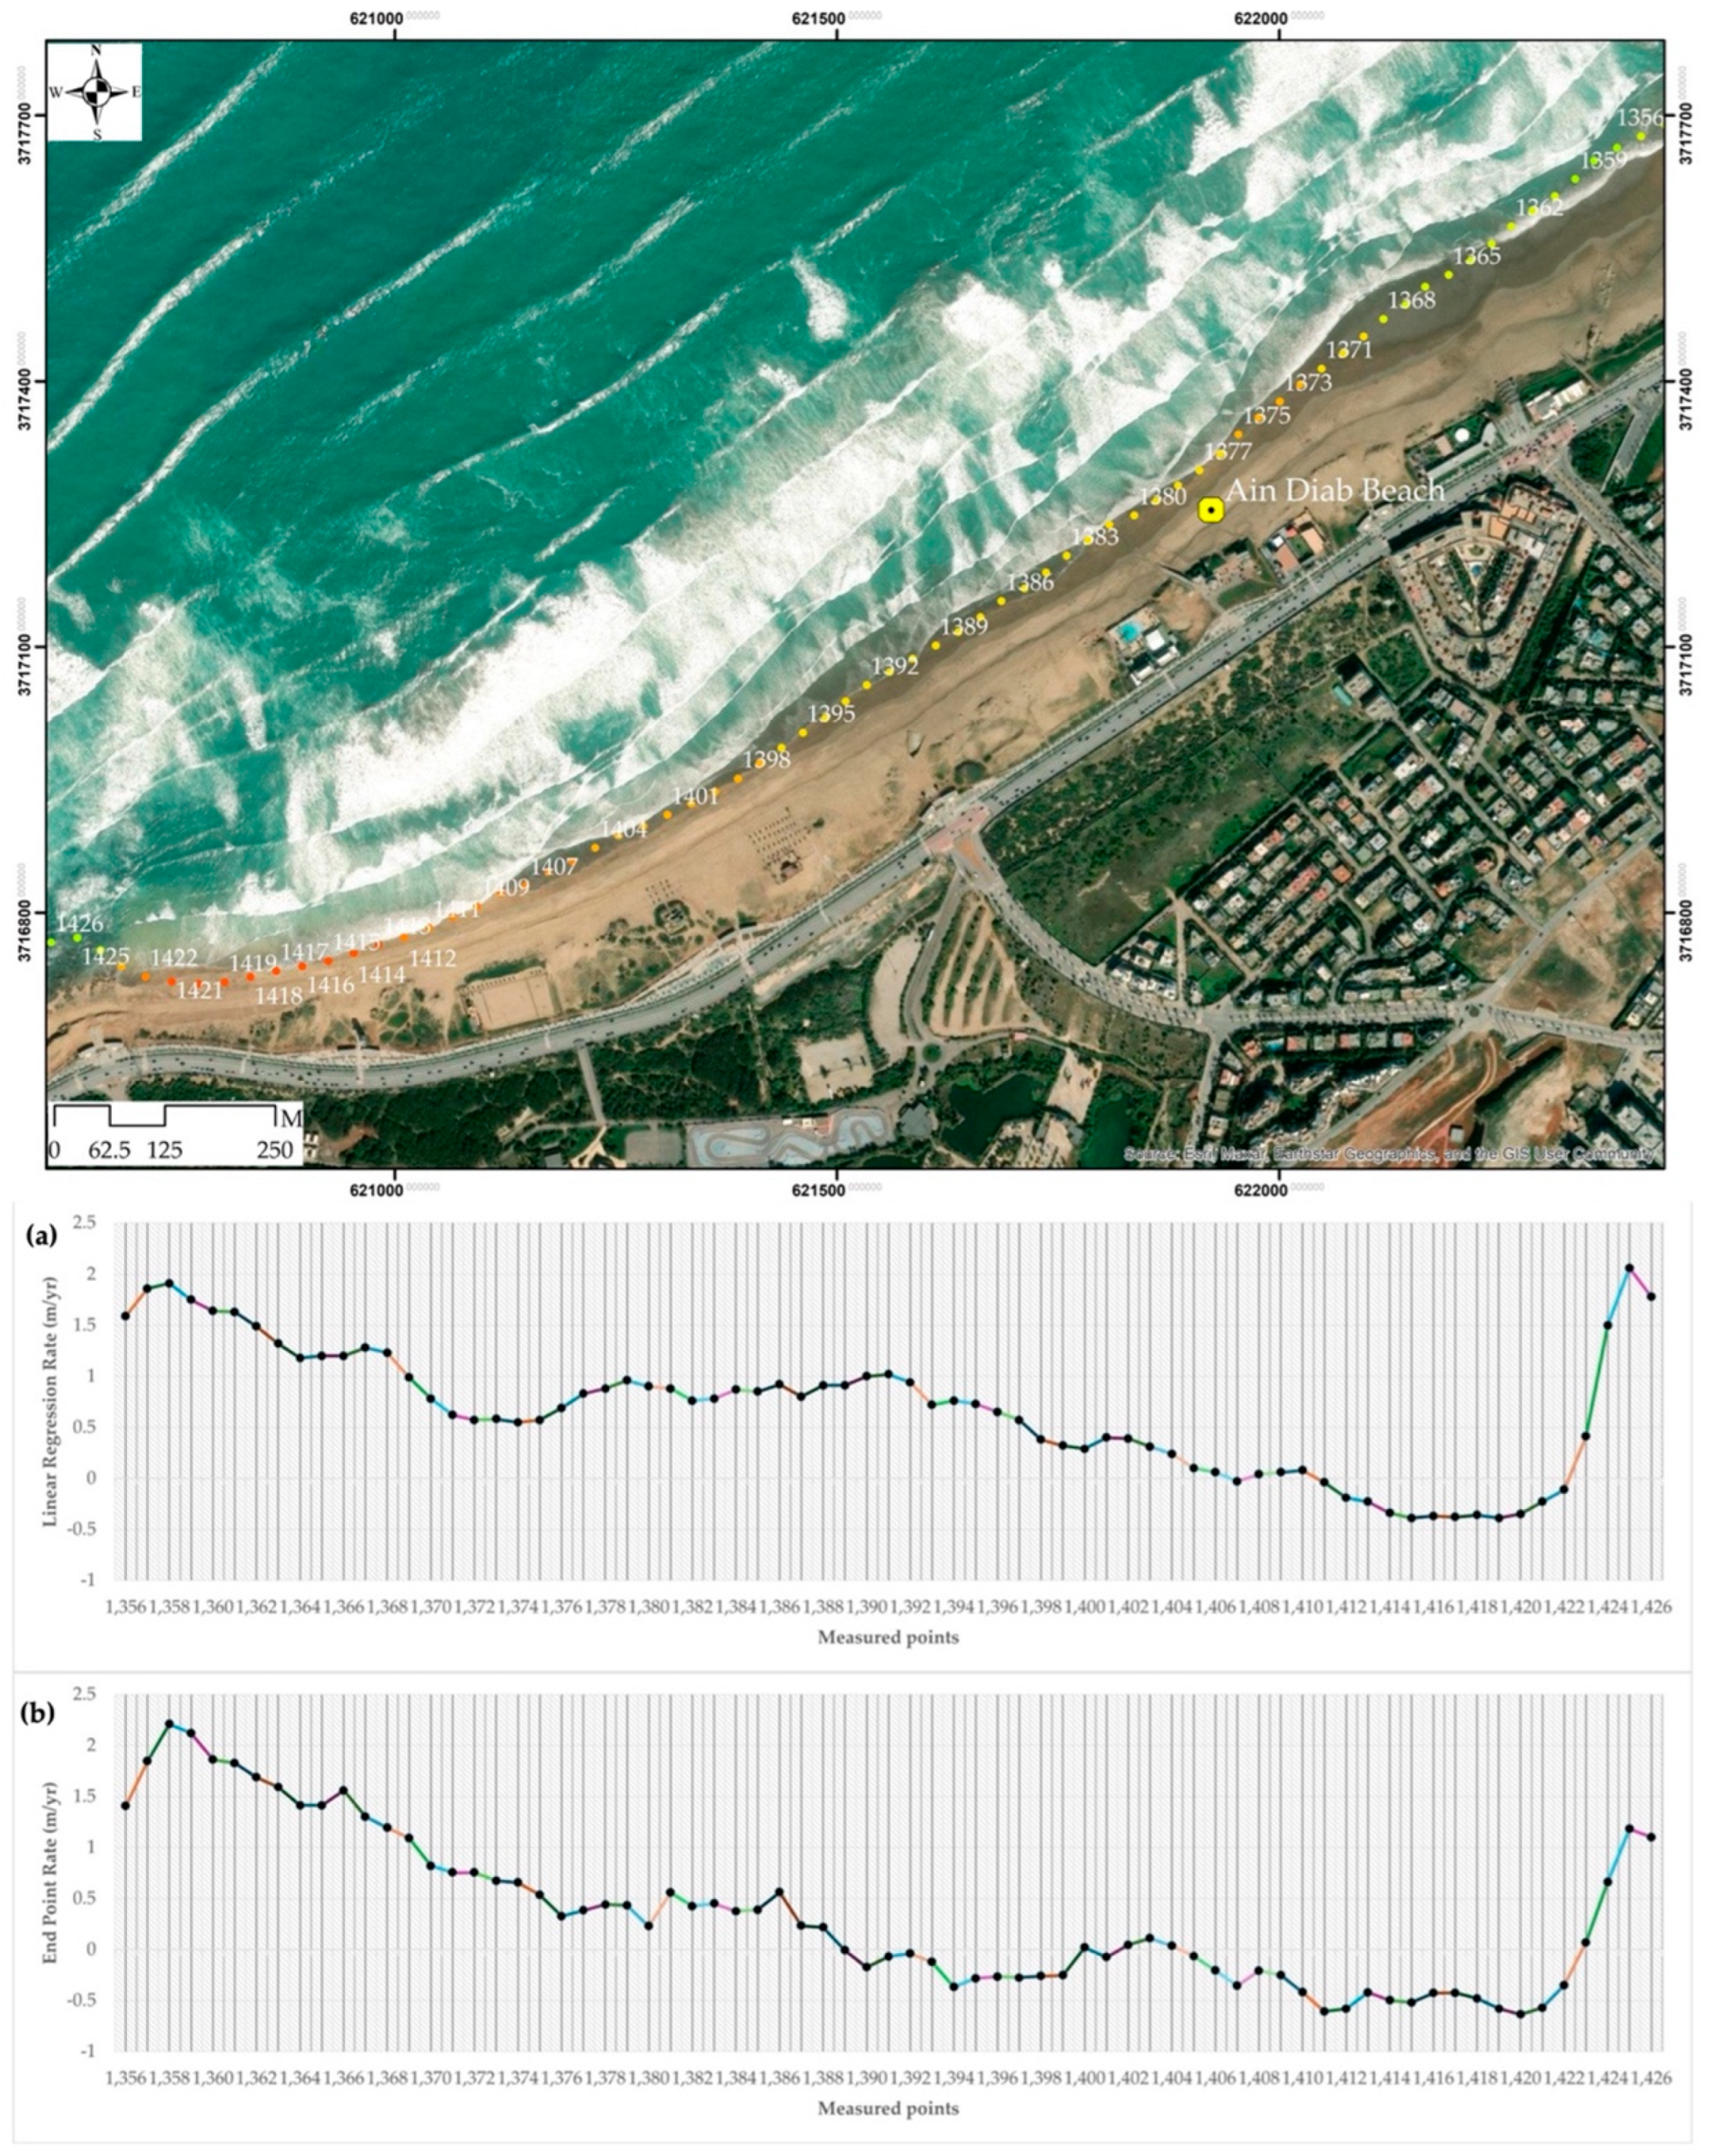
Table A2.
Annual rates of change and coastline classification results obtained on the beach of Ain Diab.
Table A2.
Annual rates of change and coastline classification results obtained on the beach of Ain Diab.
|
Rate of change Range (m/yr) |
LRR (%) |
EPR (%) |
Coastline Classification |
CVI Ranking |
| <-2 | N. A | N. A | Very high erosion | Very high |
| <-1 – ≥-2 | N. A | N. A | High erosion | High |
| < 0 – ≥-1 | 18.30 | 42.25 | Moderate erosion | Moderate |
| > 0 – ≤+1 | 56.34 | 35.21 | Accretion | Low |
| >+1 | 25.36 | 22.54 | Moderate accretion |
Appendix A.3
Annual rates of change and coastline classification conducted on the Beach of Anfa
Figure A3.
Location of 44 points containing annual rates of change values (LRR and EPR) for the Beach of Anfa. The points are labelled from the NE (point 1266) to the SW (point 1309) with an interval of 30 m. For each point, annual rates of change have been calculated for the period of 2000 to 2023. LRR revealed the coastline growth of about 1 m/yr and retreat of about -0.2 m/yr (a) while EPR indicated the coastline growth of about 1.09 m/yr and a retreat of about -0.5 m/yr (b). Details on cross-shore annual shoreline positions are presented in the Supplementary Materials S.7 (Figures S13, S14, S15).
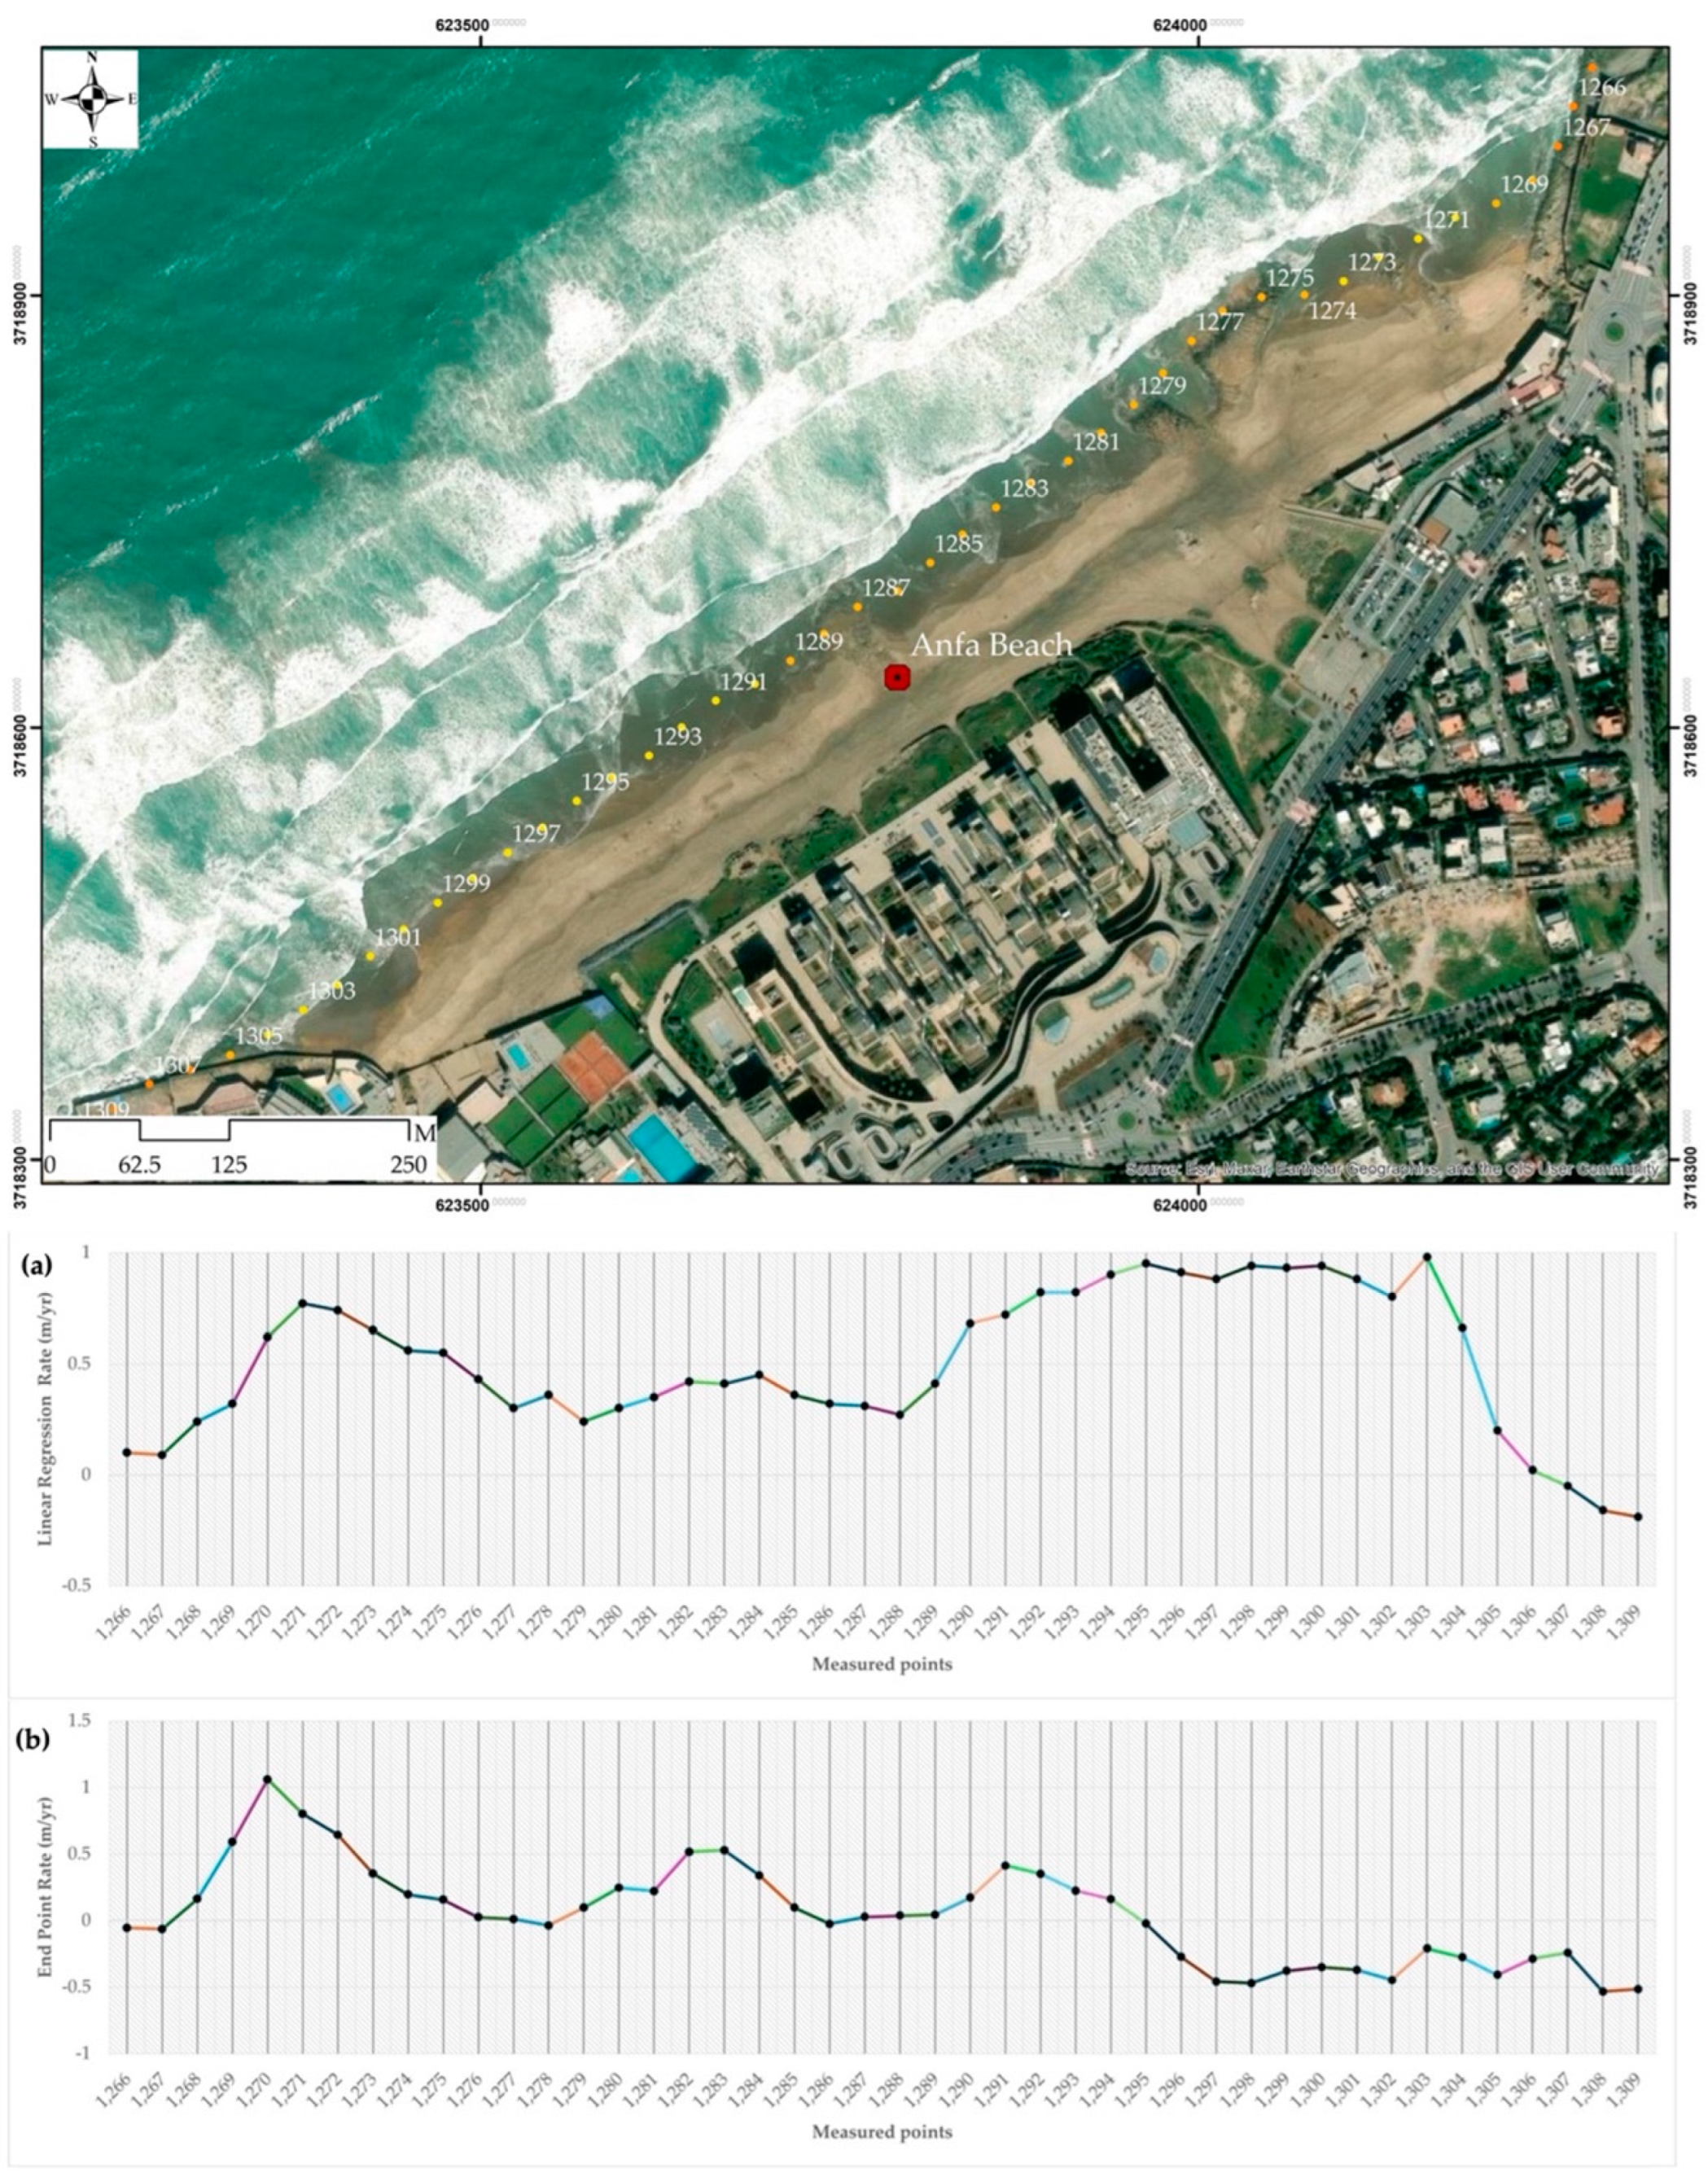
Table A3.
Annual rates of change and coastline classification results obtained on the beach of Anfa.
Table A3.
Annual rates of change and coastline classification results obtained on the beach of Anfa.
|
Rate of change Range (m/yr) |
LRR (%) |
EPR (%) |
Coastline Classification |
CVI Ranking |
| <-2 | N. A | N. A | Very high erosion | Very high |
| <-1 – ≥-2 | N. A | N. A | High erosion | High |
| < 0 – ≥-1 | 6.82 | 38.63 | Moderate erosion | Moderate |
| > 0 – ≤+1 | 93.18 | 59.1 | Accretion | Low |
| >+1 | N. A | 2.27 | Moderate accretion |
Appendix A.4
Annual rates of change and coastline classification conducted on Ain Sebaa beach
Figure A4.
Location of 43 points containing annual rates of change values (LRR and EPR) for the Beach of Ain Sebaa. The points are labelled from the NE (point 210) to the SW (point 252) with an interval of 30 m. For each point, annual rates of change have been calculated for the period of 2000 to 2023. LRR revealed the coastline growth of about 3.4 m/yr and retreat of about -1 m/yr (a) while EPR indicated the coastline growth of about 2.09 m/yr and a retreat of about -1.45 m/yr (b). Details on cross-shore annual shoreline positions are presented in the Supplementary Materials S.8 (Figures S16, S17, S18).
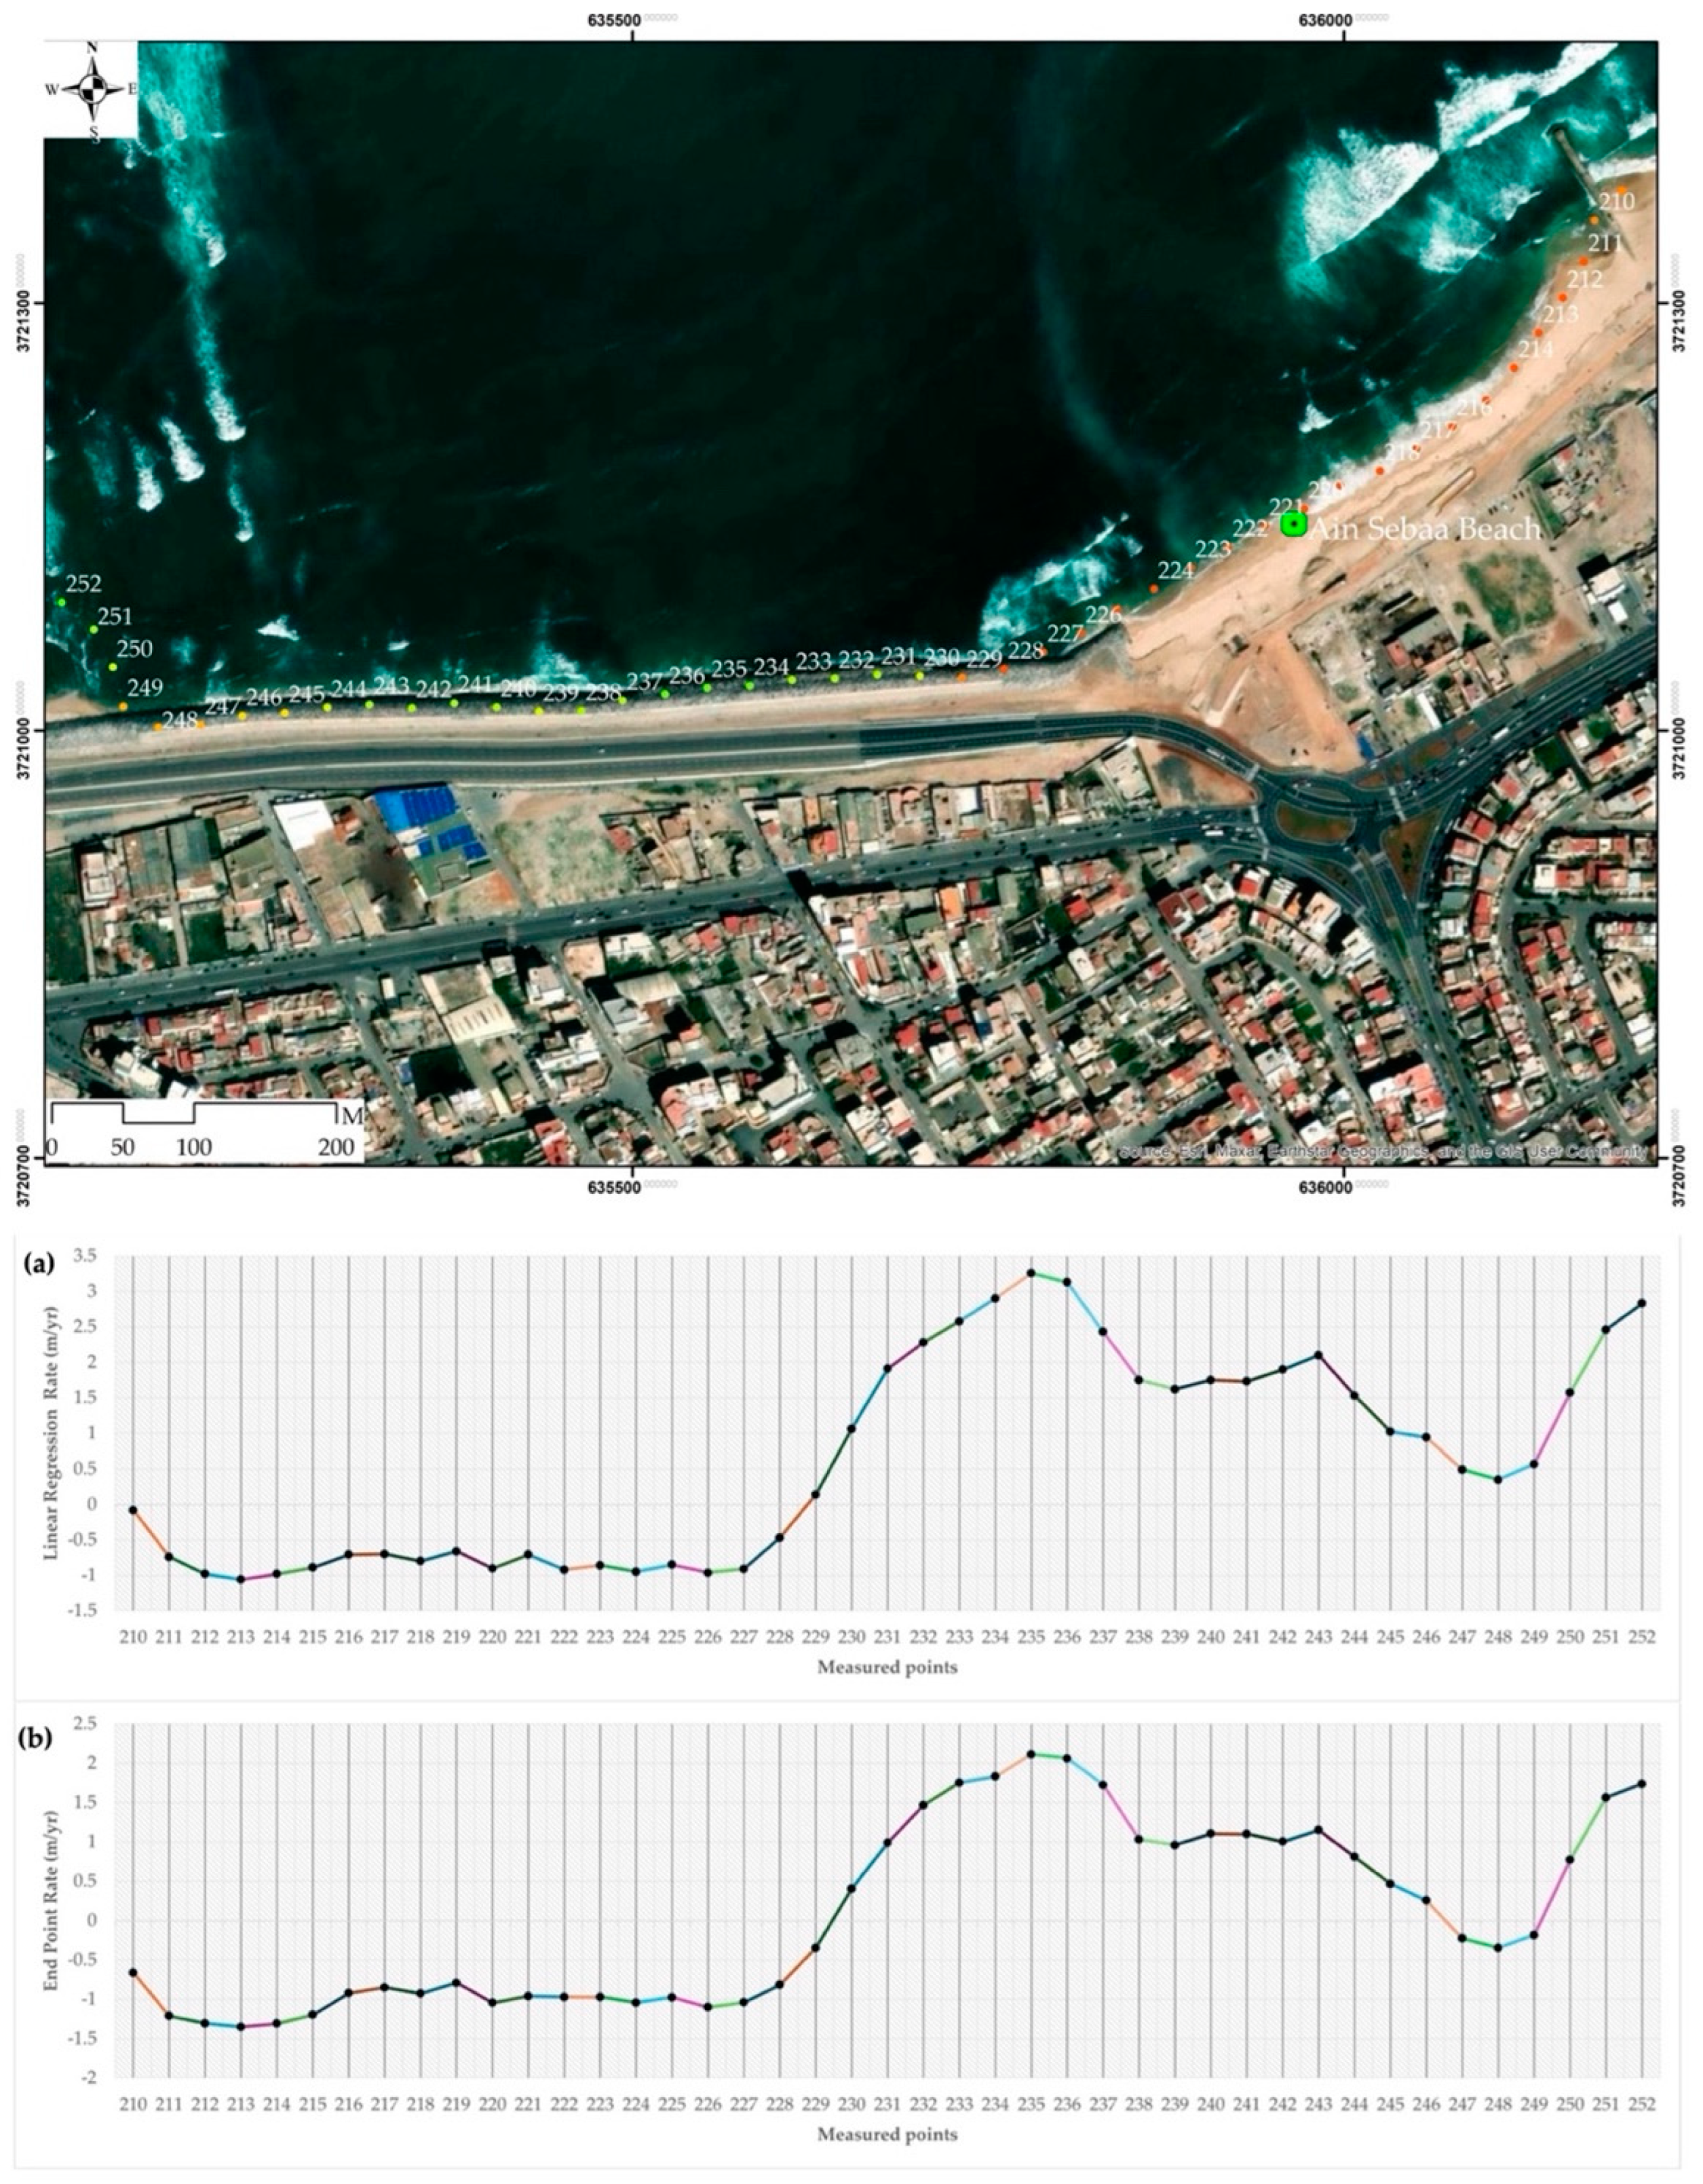
Table A4.
Annual rates of change and coastline classification results obtained on the beach of Ain Sebaa.
Table A4.
Annual rates of change and coastline classification results obtained on the beach of Ain Sebaa.
|
Rate of change Range (m/yr) |
LRR (%) |
EPR (%) |
Coastline Classification |
CVI Ranking |
| <-2 | N. A | N. A | Very high erosion | Very high |
| <-1 – ≥-2 | 4.66 | 16.28 | High erosion | High |
| < 0 – ≥-1 | 37.2 | 39.53 | Moderate erosion | Moderate |
| > 0 – ≤+1 | 11.63 | 20.93 | Accretion | Low |
| >+1 | 46.51 | 23.26 | Moderate accretion |
Appendix A.5
Annual rates of change and coastline classification conducted on the beach of Nahla.
Figure A5.
Location of 95 points containing annual rates of change values (LRR and EPR) for the Beach of Nahla. The points are labelled from the NE (point 118) to the SW (point 212) with an interval of 30 m. For each point, annual rates of change have been calculated for the period of 2000 to 2023. LRR revealed the coastline growth of about 1.5 m/yr and retreat of about -1 m/yr (a) while EPR indicated the coastline growth of about 1.2 m/yr and a retreat of about -1.3 m/yr (b). Details on cross-shore annual shoreline positions are presented in the Supplementary Materials S.9 (Figures S19, S20, S21, S22, S23, S24, S25).
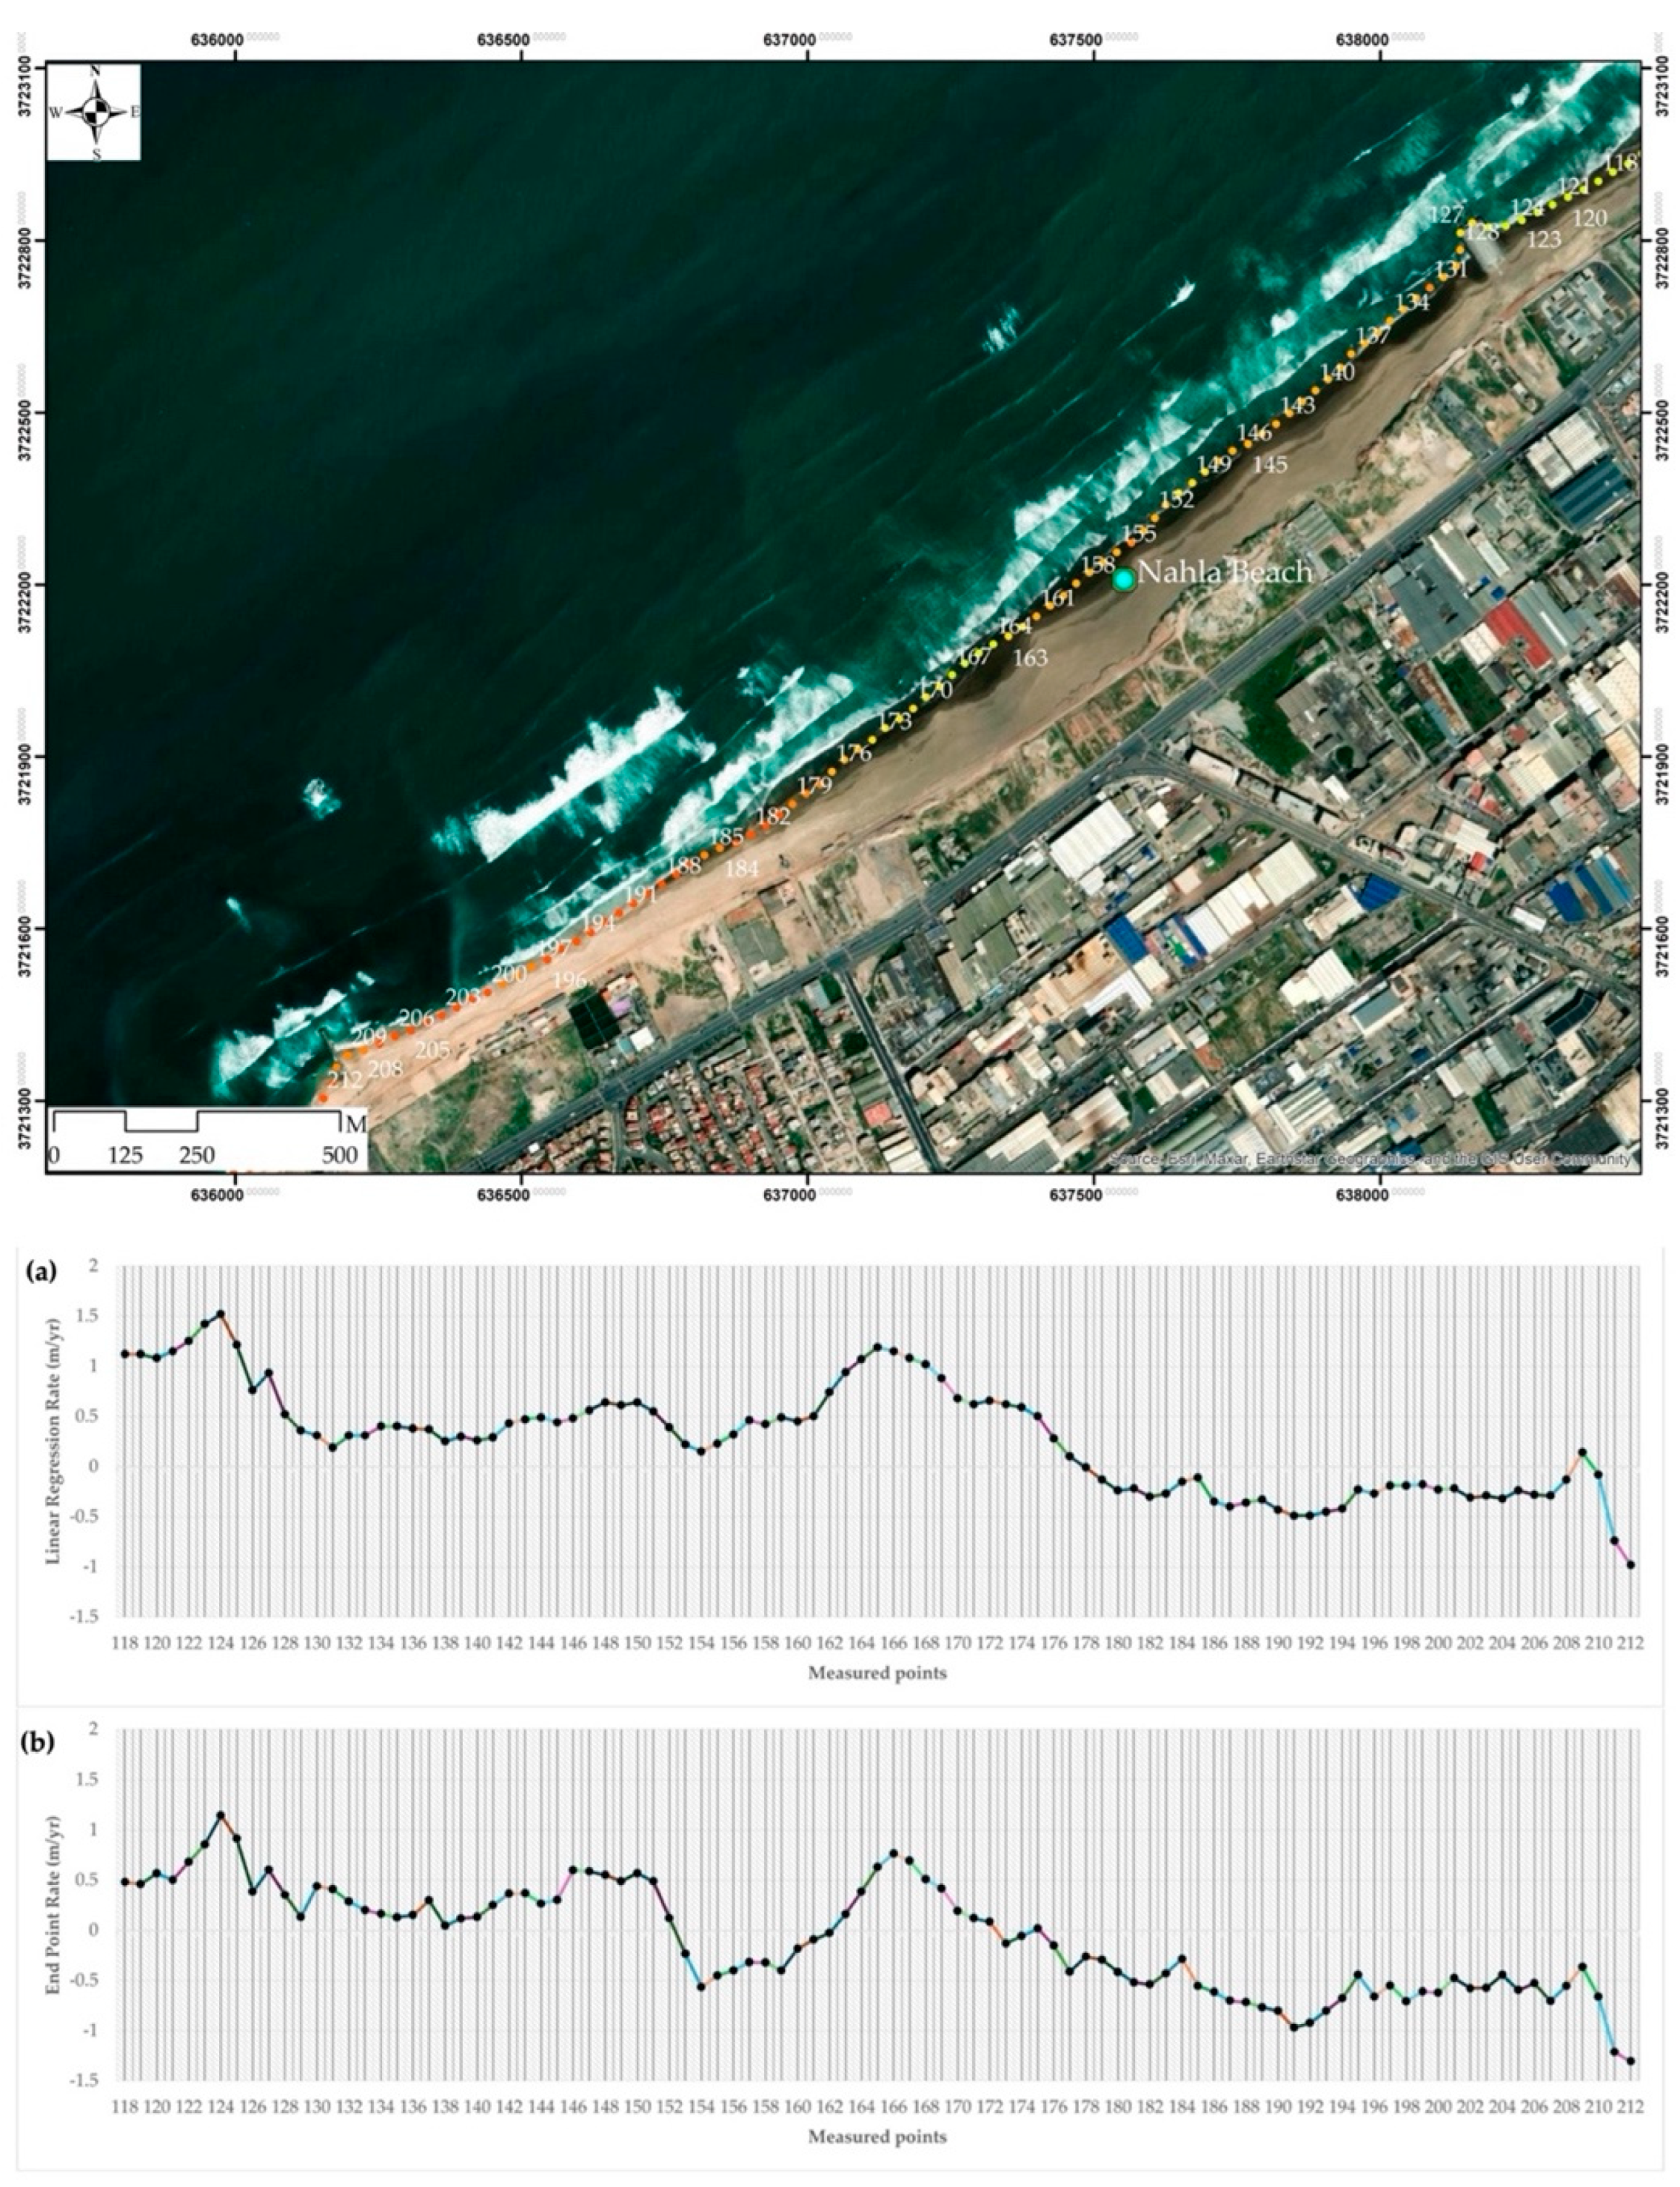
Table A5.
Annual rates of change and coastline classification results obtained on the beach of Nahla.
Table A5.
Annual rates of change and coastline classification results obtained on the beach of Nahla.
|
Rate of change Range (m/yr) |
LRR (%) |
EPR (%) |
Coastline Classification |
CVI Ranking |
| <-2 | N. A | N. A | Very high erosion | Very high |
| <-1 – ≥-2 | N. A | 2.11 | High erosion | High |
| < 0 – ≥-1 | 37.90 | 48.42 | Moderate erosion | Moderate |
| > 0 – ≤+1 | 48.42 | 48.42 | Accretion | Low |
| >+1 | 13.68 | 1.05 | Moderate accretion |
Appendix A.6
Annual rates of change and coastline classification conducted on the Beach of Zenata
Figure A6.
Location of 76 points containing annual rates of change values (LRR and EPR) for the Beach of Zenata. The points are labelled from the NE (point 0) to the SW (point 75) with an interval of 30 m. For each point, annual rates of change have been calculated for the period of 2000 to 2023. LRR revealed the coastline growth of about 3.4 m/yr (a) while EPR indicated the coastline growth of about 5 m/yr and a retreat of about -0.6 m/yr (b). Details on cross-shore annual shoreline positions are presented in the Supplementary Materials S.10 (Figures S26, S27, S28, S29, S30).
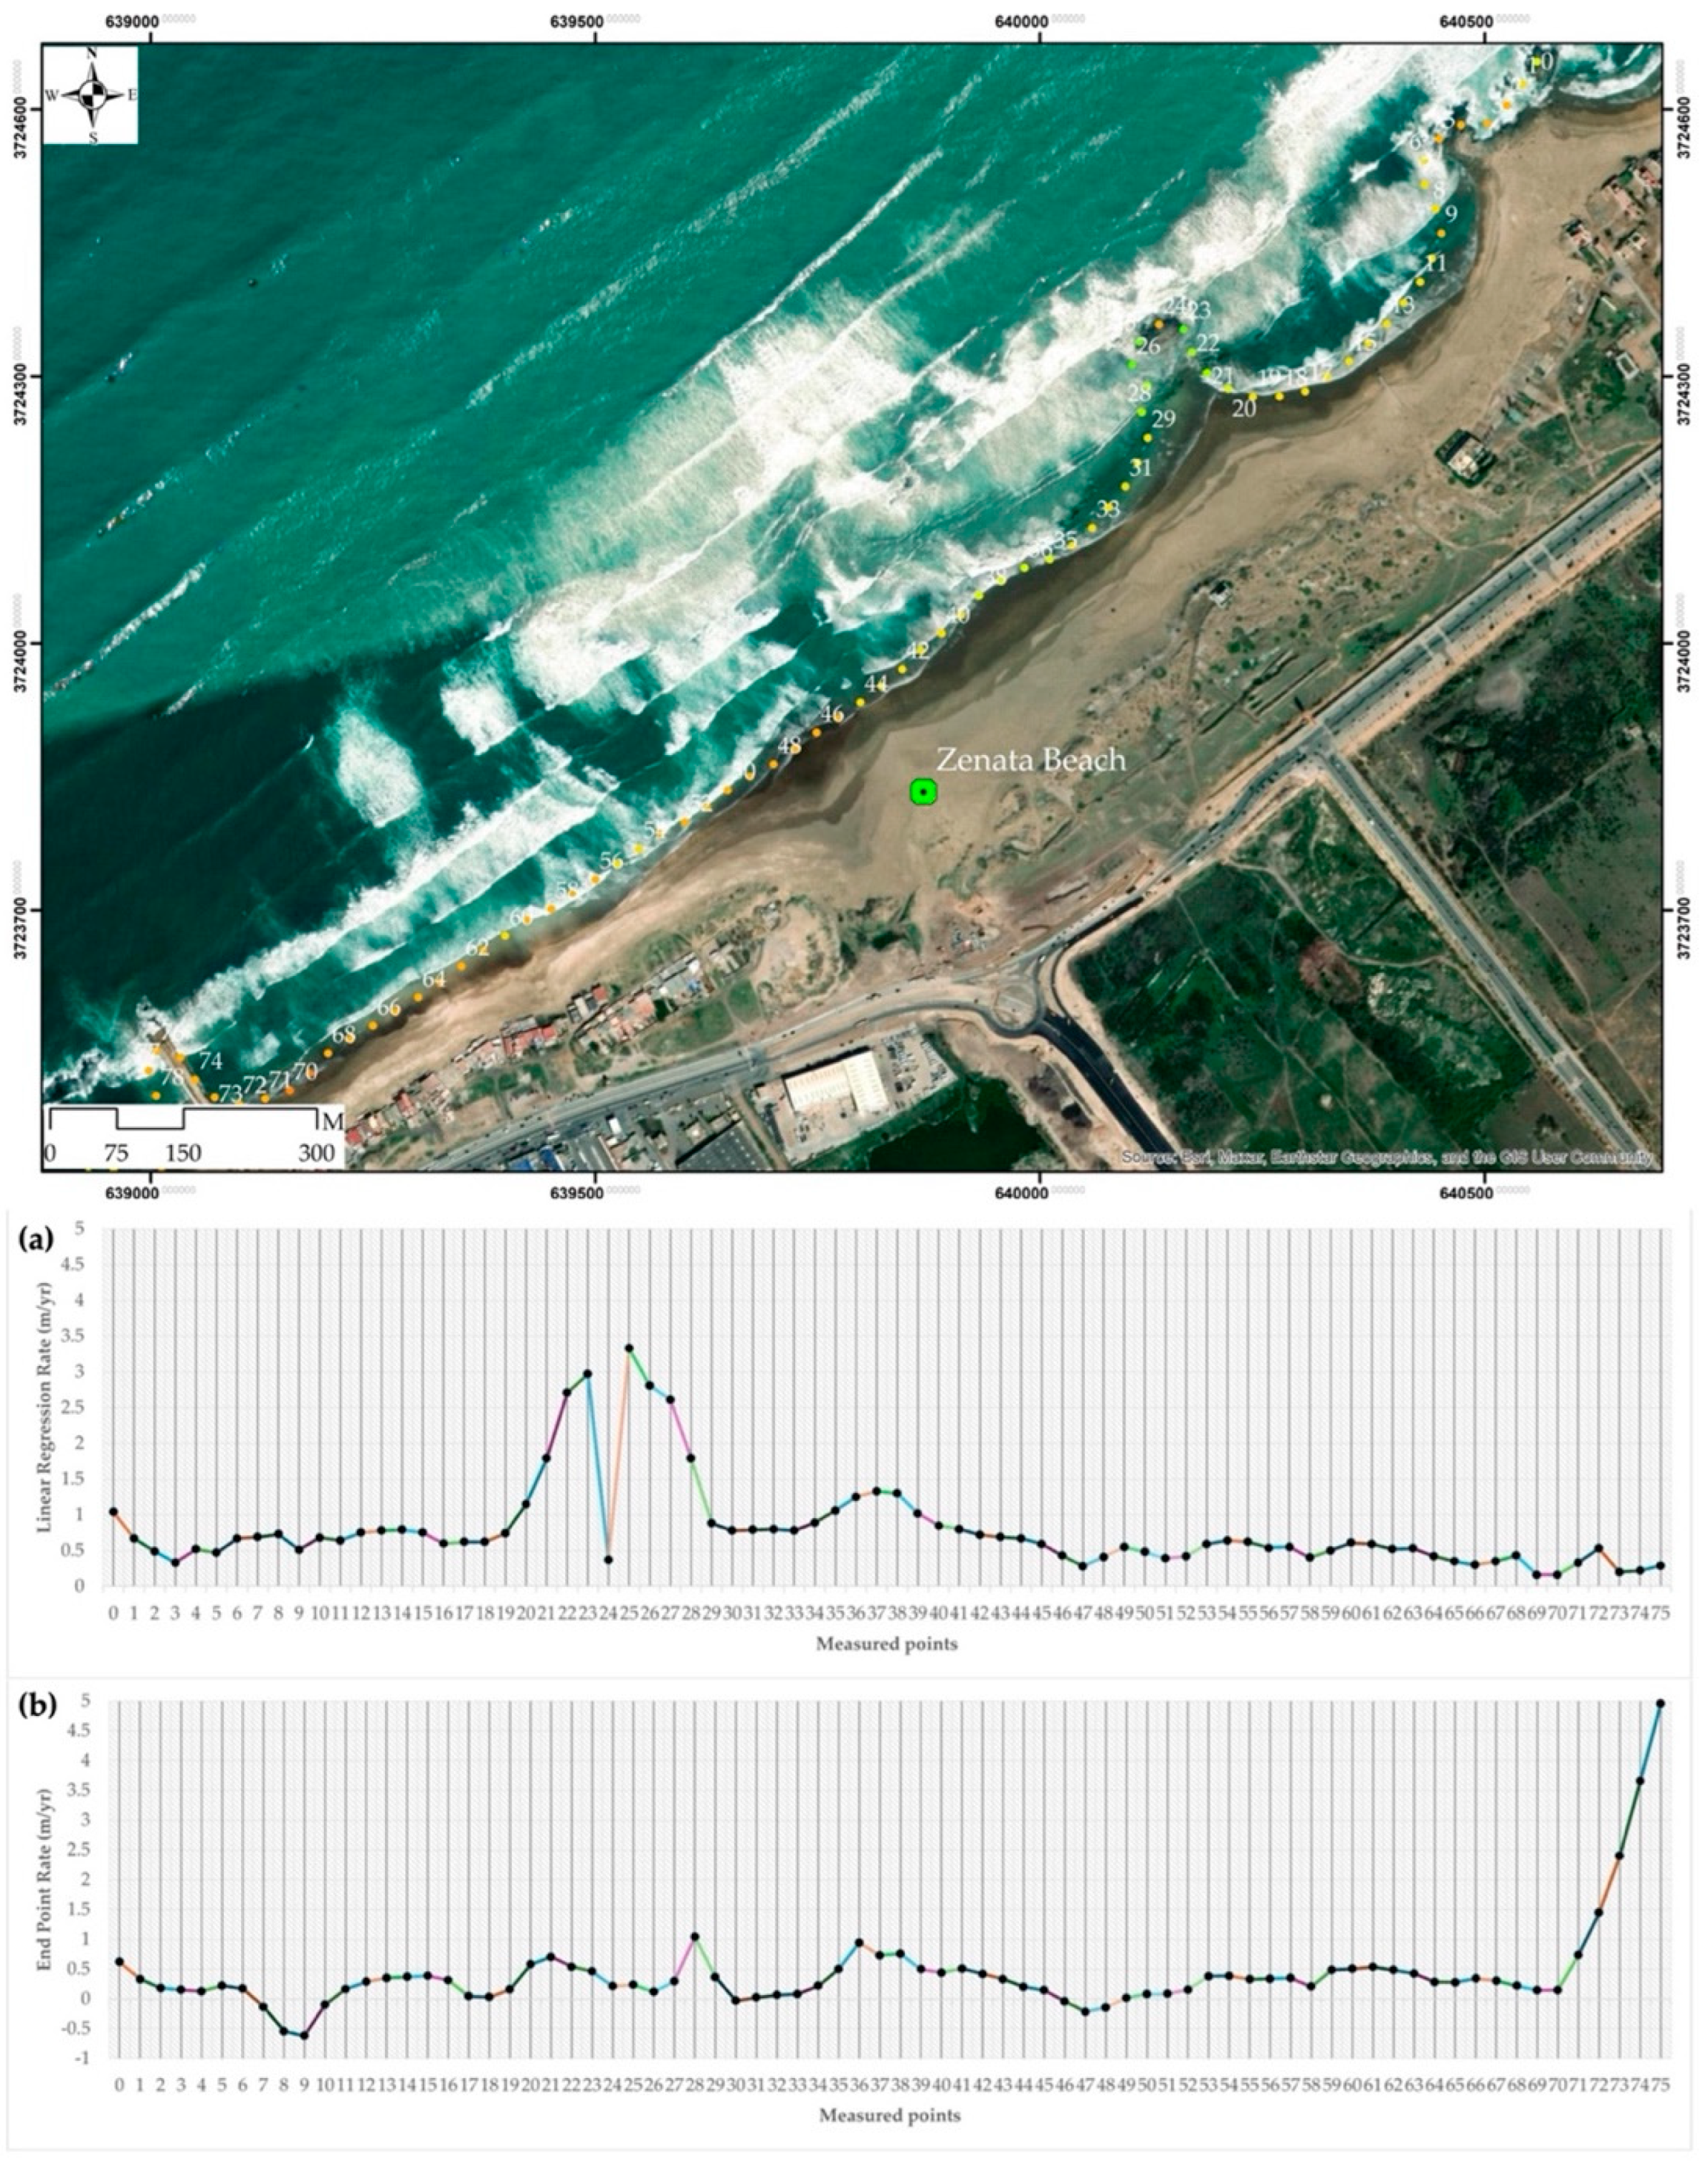
Table A6.
Annual rates of change and coastline classification results obtained on the beach of Zenata.
Table A6.
Annual rates of change and coastline classification results obtained on the beach of Zenata.
|
Rate of change Range (m/yr) |
LRR (%) |
EPR (%) |
Coastline Classification |
CVI Ranking |
| <-2 | N. A | N. A | Very high erosion | Very high |
| <-1 – ≥-2 | N. A | N. A | High erosion | High |
| < 0 – ≥-1 | N. A | 10.53 | Moderate erosion | Moderate |
| > 0 – ≤+1 | 17.11 | 81.58 | Accretion | Low |
| >+1 | 8289 | 7.89 | Moderate accretion |
References
- Noor, N.M.; Abdul Maulud, K.N. Coastal Vulnerability: A Brief Review on Integrated Assessment in Southeast Asia. J. Mar. Sci. Eng. 2022, 10, 595. [Google Scholar] [CrossRef]
- Toumasi, P.; Petropoulos, G.P.; Detsikas, S.E.; Kalogeropoulos, K.; Tselos, N.G. Coastal Vulnerability Impact Assessment under Climate Change in the Arctic Coasts of Tromsø, Norway. Earth 2024, 5, 640–653. [Google Scholar] [CrossRef]
- Ortiz, P.; López, I.; Pagán, J.I. Assessment of Beach Erosion Vulnerability in the Province of Valencia, Spain. J. Mar. Sci. Eng. 2024, 12, 2111. [Google Scholar] [CrossRef]
- TADIĆ, Andrea, et al. Coastal vulnerability index for the indented coastline of Primorje-Gorski Kotar County, Croatia. Regional studies in marine science, 2024, 80: 103862.
- Rocha, C.; Antunes, C.; Catita, C. Coastal Indices to Assess Sea-Level Rise Impacts—A Brief Review of the Last Decade. Ocean. Coast. Manag. 2023, 237, 106536. [Google Scholar] [CrossRef]
- Handiani, D.N.; Heriati, A.; Gunawan, W.A. Comparison of Coastal Vulnerability Assessment for Subang Regency in North Coast West Java-Indonesia. Geomat. Nat. Hazards Risk 2022, 13, 1178–1206. [Google Scholar] [CrossRef]
- Koroglu, A.; Ranasinghe, R.; Jiménez, J.A.; Dastgheib, A. Comparison of coastal vulnerability index applications for Barcelona Province. Ocean. Coast. Manag. 2019, 178, 104799. [Google Scholar] [CrossRef]
- Theocharidis, C.; Prodromou, M.; Doukanari, M.; Kalogirou, E.; Eliades, M.; Kontoes, C.; Hadjimitsis, D.; Neocleous, K. Integrated Coastal Vulnerability Index (ICVI) Assessment of Protaras Coast in Cyprus: Balancing Tourism and Coastal Risks. Geographies 2025, 5, 12. [Google Scholar] [CrossRef]
- Gornitz, V. Vulnerability of the East Coast, USA to future sea level rise. J. Coast. Res. 1990, 9, 201–237. [Google Scholar]
- Thieler, E.R.; Hammar-Klose, E.S. National Assessment of Coastal Vulnerability to Sea-Level Rise: Preliminary Results for the U.S. Atlantic Coast; United States Geological Survey: Reston, VA, USA, 1999. [Google Scholar]
- Pendleton, E.A.; Thieler, E.R.; Williams, S.J.; Beavers, R.L. Coastal Vulnerability Assessment of Padre Island National Seashore (PAIS) to Sea-Level Rise; US Geological Survey: Reston, VA, USA, 2004. [Google Scholar]
- Alcántara-Carrió, J.; García Echavarría, L.M.; Jaramillo-Vélez, A. Is the coastal vulnerability index a suitable index? Review and proposal of alternative indices for coastal vulnerability to sea level rise. Geo-Mar. Lett. 2024, 44, 8. [Google Scholar] [CrossRef]
- Šimac, Z.; Lončar, N.; Faivre, S. Overview of Coastal Vulnerability Indices with Reference to Physical Characteristics of the Croatian Coast of Istria. Hydrology 2023, 10, 14. [Google Scholar] [CrossRef]
- Angulo, R.J.; Lessa, G.C.; Souza, M.C. A critical review of Mid- to Late-Holocene sea-level fluctuations on the eastern Brazilian coastline. Quat. Sci. Rev. 2006, 25, 486–506. [Google Scholar] [CrossRef]
- Sun, W.; Chen, C.; Weiwei, L.; Yang, G.; Meng, X.; Wang, L.; Ren, K. Coastline extraction using remote sensing: A review. GISci. Remote Sens. 2023, 60, 2243671. [Google Scholar] [CrossRef]
- Zhou, X.; Wang, J.; Zheng, F.; Wang, H.; Yang, H. An Overview of Coastline Extraction from Remote Sensing Data. Remote Sens. 2023, 15, 4865. [Google Scholar] [CrossRef]
- Pantusa, D.; D’Alessandro, F.; Frega, F.; Francone, A.; Tomasicchio, G.R. Improvement of a Coastal Vulnerability Index and Its Application along the Calabria Coastline, Italy. Sci. Rep. 2022, 12, 21959. [Google Scholar] [CrossRef]
- Manno, G.; Azzara, G.; Lo Re, C.; Martinello, C.; Basile, M.; Rotigliano, E.; Ciraolo, G. An Approach for the Validation of a Coastal Erosion Vulnerability Index: An Application in Sicily. J. Mar. Sci. Eng. 2023, 11, 23. [Google Scholar] [CrossRef]
- Borzì, L.; Anfuso, G.; Manno, G.; Distefano, S.; Urso, S.; Chiarella, D.; Di Stefano, A. Shoreline Evolution and Environmental Changes at the NW Area of the Gulf of Gela (Sicily, Italy). Land 2021, 10, 1034. [Google Scholar] [CrossRef]
- Foti, G.; Barbaro, G.; Barillà, G.C.; Mancuso, P.; Puntorieri, P. Shoreline Evolutionary Trends Along Calabrian Coasts: Causes and Classification. Front. Mar. Sci. 2022, 9, 846914. [Google Scholar] [CrossRef]
- Castelle, B.; Masselink, G.; Scott, T.; Stokes, C.; Konstantinou, A.; Marieu, V.; Bujan, S. Satellite-derived shoreline detection at a high-energy meso-macrotidal beach. Geomorphology 2021, 383, 107707. [Google Scholar] [CrossRef]
- Konstantinou, A.; Scott, T.; Masselink, G.; Stokes, K.; Conley, D.; Castelle, B. Satellite-based shoreline detection along high-energy macrotidal coasts and influence of beach state. Mar. Geol. 2023, 462, 107082. [Google Scholar] [CrossRef]
- Luijendijk, A.P.; Kras, E.; Dagalaki, V.; Morelissen, R.; Hoteit, I.; Ranasinghe, R. Regime Shifts in Future Shoreline Dynamics of Saudi Arabia. Front. Mar. Sci. 2022, 8, 798657. [Google Scholar] [CrossRef]
- Darwish, K.; Smith, S. Landsat-Based Assessment of Morphological Changes along the Sinai Mediterranean Coast between 1990 and 2020. Remote Sens. 2023, 15, 1392. [Google Scholar] [CrossRef]
- Bishop-Taylor, R.; Nanson, R.; Sagar, S.; Lymburner, L. Mapping Australia’s Dynamic Coastline at Mean Sea Level Using Three Decades of Landsat Imagery. Remote Sens. Environ. 2021, 267, 112734. [Google Scholar] [CrossRef]
- Nanson, R.; Bishop-Taylor, R.; Sagar, S.; Lymburner, L. Geomorphic insights into Australia’s coastal change using a national dataset derived from the multi-decadal Landsat archive. Estuar. Coast. Shelf Sci. 2022, 265, 107712. [Google Scholar] [CrossRef]
- Digital Earth Africa was accessed on 22 April 2025 from https://www.digitalearthafrica.org/.
- DE Africa Coastline Data availability. Digital Earth Africa Coastlines was accessed on 22 April 2025 from https://registry.opendata.aws/deafrica-coastlines.
- Naji, E. M.; Aberkan, M.; Saadane, A.; Nmiss, M. Erosion and shoreline retreat indicators in the Rabat-Salé littoral and their impact on coastal planning. J. African Earth Sci., 2025. [CrossRef]
- Moussaid, J.; Fora, A.A.; Zourarah, B.; Maanan, M.; Maanan, M. Using automatic computation to analyze the rate of shoreline change on the Kenitra coast, Morocco. Ocean Eng. 2015, 102, 71–77. [Google Scholar] [CrossRef]
- Aangri, A.; Hakkou, M.; Krien, Y.; Benmohammadi, A. Predicting Shoreline Change for the Agadir and Taghazout Coasts (Morocco) J. Coast. Res., 38 (2022), pp. 937-950.
- Benkhattab, F.Z.; Hakkou, M.; Bagdanavičiūtė, I.; Mrini, A.E.; Zagaoui, H.; Rhinane, H.; Maanan, M. Spatial–temporal analysis of the shoreline change rate using automatic computation and geospatial tools along the Tetouan coast in Morocco. Nat. Hazards 2020, 104, 519–536. [Google Scholar] [CrossRef]
- Heger,M.; Vashold,L. M.;Carpenter, S.; Toquica O. M. A. Coastal Erosion and its Costs in the Maghreb: Disappearing Coasts. World Bank, 2023, report n. 179616.
- Oussama L., 2013, Approche multidisciplinaire de suivi de la dynamique marine du littoral de Mohammedia. Mémoires de MASTER "Eau et Environnement" Faculté des sciences et technique de Marrakech/Maroc. p24-25.
- Coastlines Monitoring data description. https://docs.digitalearthafrica.org/en/latest/data_specs/Coastlines_specs.html.
- DE Africa use case. Monitoring coastal erosion along Africa’s coastline: https://docs.digitalearthafrica.org/en/latest/sandbox/notebooks/Real_world_examples/Coastal_erosion.html.
- Zhang, K.; Gann, D.; Ross, M.; Robertson, Q.; Sarmiento, J.; Santana, S.; Rhome, J.; Fritz, C. Accuracy assessment of ASTER, SRTM, ALOS and TDX DEMs for Hispaniola and implications for mapping vulnerability to coastal flooding. Remote Sens. Environ. 2019, 225, 290–306. [Google Scholar] [CrossRef]
- Tachikawa, T.; Kaku, M.; Iwasaki, A.; Gesch, D.B.; Oimoen, M.J.; Zhang, Z.; Danielson, J.J.; Krieger, T.; Curtis, B.; Haase, J. ASTER Global Digital Elevation Model Version 2—Summary of Validation Results; NASA: Washington, DC, USA, 2011. [Google Scholar]
- Mahesh, R.; Sarunjith, K.J.; Rajakumari, S.; Muruganandam, R.; Ramesh, R. Quality assessment of open sourced digital elevation models in southeast coast of India. Egypt. J. Remote Sens. Space Sci. 2021, 24, 745–754. [Google Scholar] [CrossRef]
- Zerhouny, M.; Fadil, A.; Hakdaoui, M. Underground Space Utilization in the Urban Land-Use Planning of Casablanca (Morocco). Land 2018, 7, 143. [Google Scholar] [CrossRef]
- Omira, R.; Baptista, M.A.; Matias, L.; Miranda, J.M.; Catita, C.; Carrilho, F.; Toto, E. Design of a Sea-level Tsunami Detection Network for the Gulf of Cadiz. Nat. Hazards Earth Syst. Sci. 2009, 9, 1327–1338. [Google Scholar] [CrossRef]
- Egis bceom international / iau-idf / brgm, 2011, Adaptation au changement climatique et aux désastres naturels des villes côtières d’Afrique du Nord, phase 1: Évaluation des risques en situation actuelle et à l’horizon 2030 pour la ville de Casablanca Version finale. P17-25, p33-52, P70-80.
- Horn, B.K. Hill Shading and the Reflectance Map. Proc. IEEE 1981, 69, 14–47. [Google Scholar] [CrossRef]
- Pepe, G., Coutu, G.: Beach morphology change study using ArcGIS spatial analyst. Middle States Geogr. 41, 91–97 (2008).
- Jonah, F.E.; Boateng, I.; Osman, A.; Shimba, M.J.; Mensah, E.A.; Adu-Boahen, K.; Chuku, E.O.; Effah, E. Shoreline change analysis using end point rate and net shoreline movement statistics: An application to Elmina, Cape Coast and Moree section of Ghana’s coast. Reg. Stud. Mar. Sci. 2016, 7, 19–31. [Google Scholar] [CrossRef]
- Aladwani, N.S. Shoreline Change Rate Dynamics Analysis and Prediction of Future Positions Using Satellite Imagery for the Southern Coast of Kuwait: A Case Study. Oceanologia 2022, 64, 417–432. [Google Scholar] [CrossRef]
- Terres de Lima, L.; Fernández-Fernández, S.; Marcel de Almeida Espinoza, J.; da Guia Albuquerque, M.; Bernardes, C. End Point Rate Tool for QGIS (EPR4Q): Validation Using DSAS and AMBUR. ISPRS Int. J. Geo-Inf. 2021, 10, 162. [Google Scholar] [CrossRef]
- Laksono, F.A.T.; Borzì, L.; Distefano, S.; Di Stefano, A.; Kovács, J. Shoreline Prediction Modelling as a Base Tool for Coastal Management: The Catania Plain Case Study (Italy). J. Mar. Sci. Eng. 2022, 10, 1988. [Google Scholar] [CrossRef]
- Cao, T.; Han, D.; Song, X. Past, present, and future of global seawater intrusion research: A bibliometric analysis. J. Hydrol. 2021, 603, 126844. [Google Scholar] [CrossRef]
- Tanim, A.H.; Goharian, E.; Moradkhani, H. Integrated socio-environmental vulnerability assessment of coastal hazards using data-driven and multi-criteria analysis approaches. Sci. Rep. 2022, 12, 11625. [Google Scholar] [CrossRef]
- Muzirafuti, A.; Cascio, M.; Lanza, S.; Randazzo, G. UAV Photogrammetry-based Mapping of the Pocket Beaches of Isola Bella Bay, Taormina (Eastern Sicily). In Proceedings of the 2021 International Workshop on Metrology for the Sea, Learning to Measure Sea Health Parameters (MetroSea), Reggio Calabria, Italy, 4–6 October 2021; pp. 418–422. [Google Scholar]
- McCarroll, R.J.; David, M. K.; Jin, L.; Allan, B.; Ierodiaconou, D. Design and application of coastal erosion indicators using satellite and drone data for a regional monitoring program. Ocean Coast. Manage. 2024, 253, 107146. [Google Scholar] [CrossRef]
Figure 1.
Map showing the location of the Area of Study on the coastline of Casablanca.
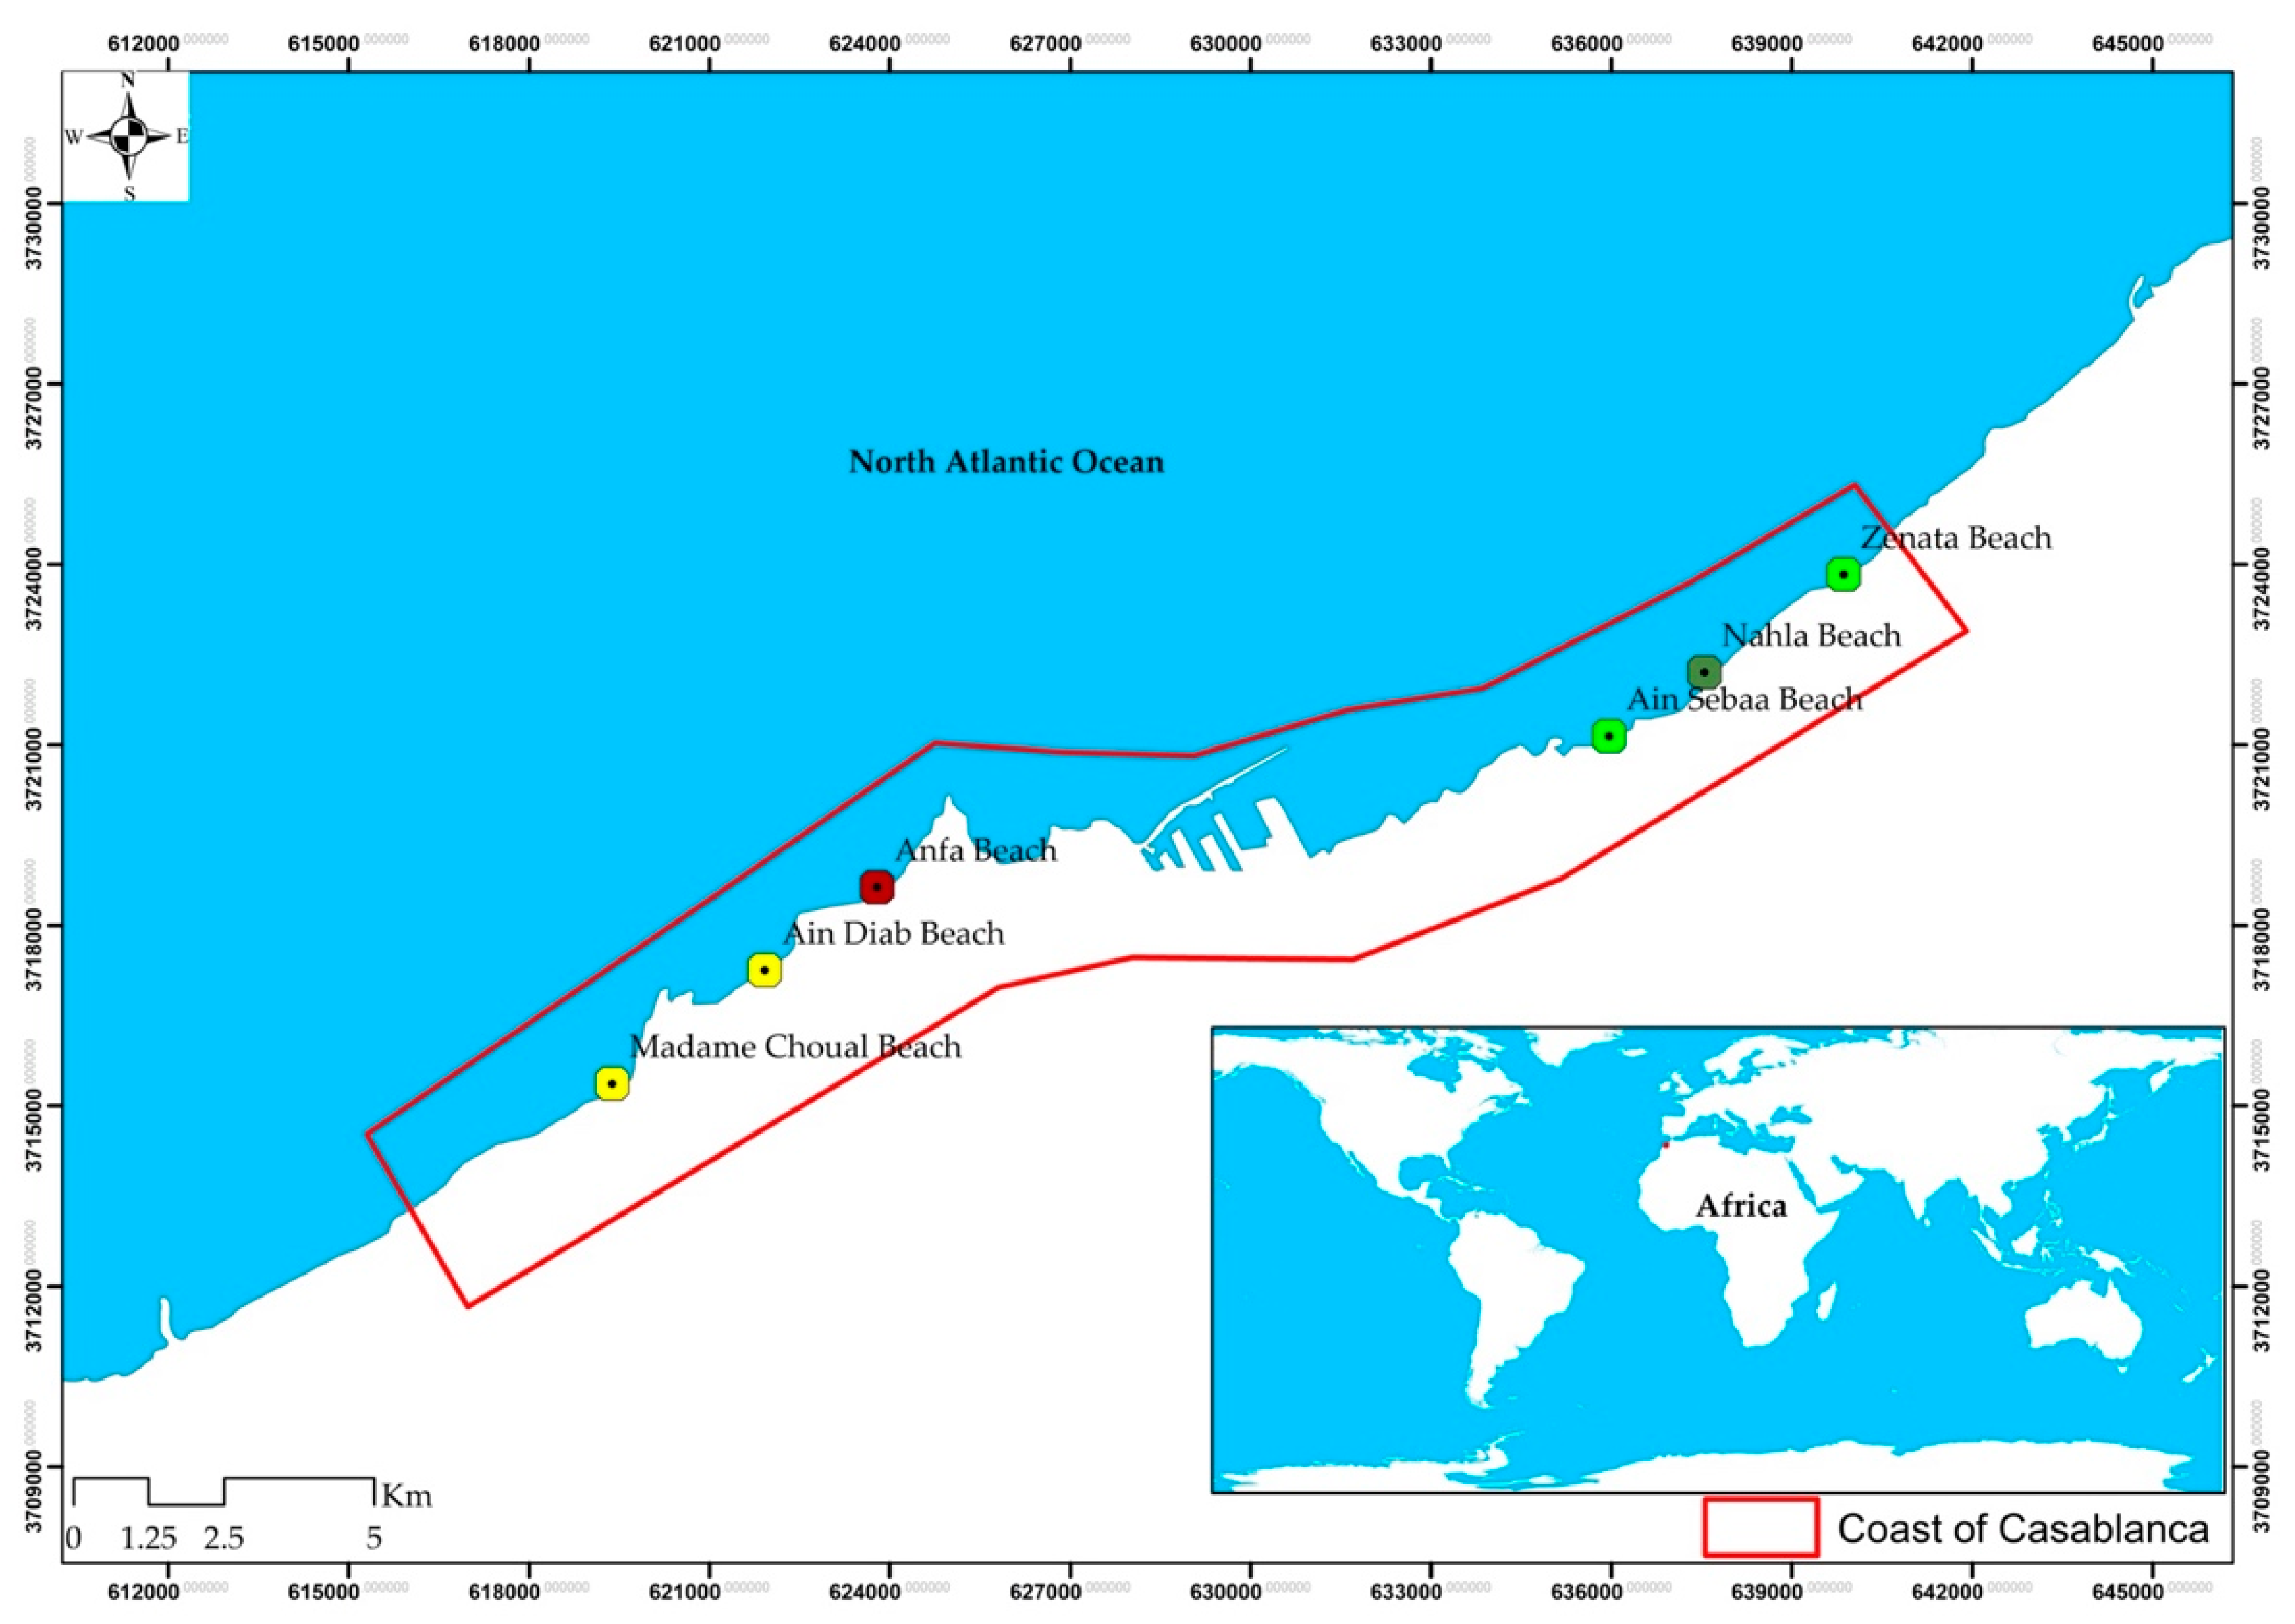
Figure 2.
Extract of geologic map of Casablanca showing main geologic outcrops (modified from the geologic map of 1946 and from Zerhouny et al. [40]).
Figure 2.
Extract of geologic map of Casablanca showing main geologic outcrops (modified from the geologic map of 1946 and from Zerhouny et al. [40]).
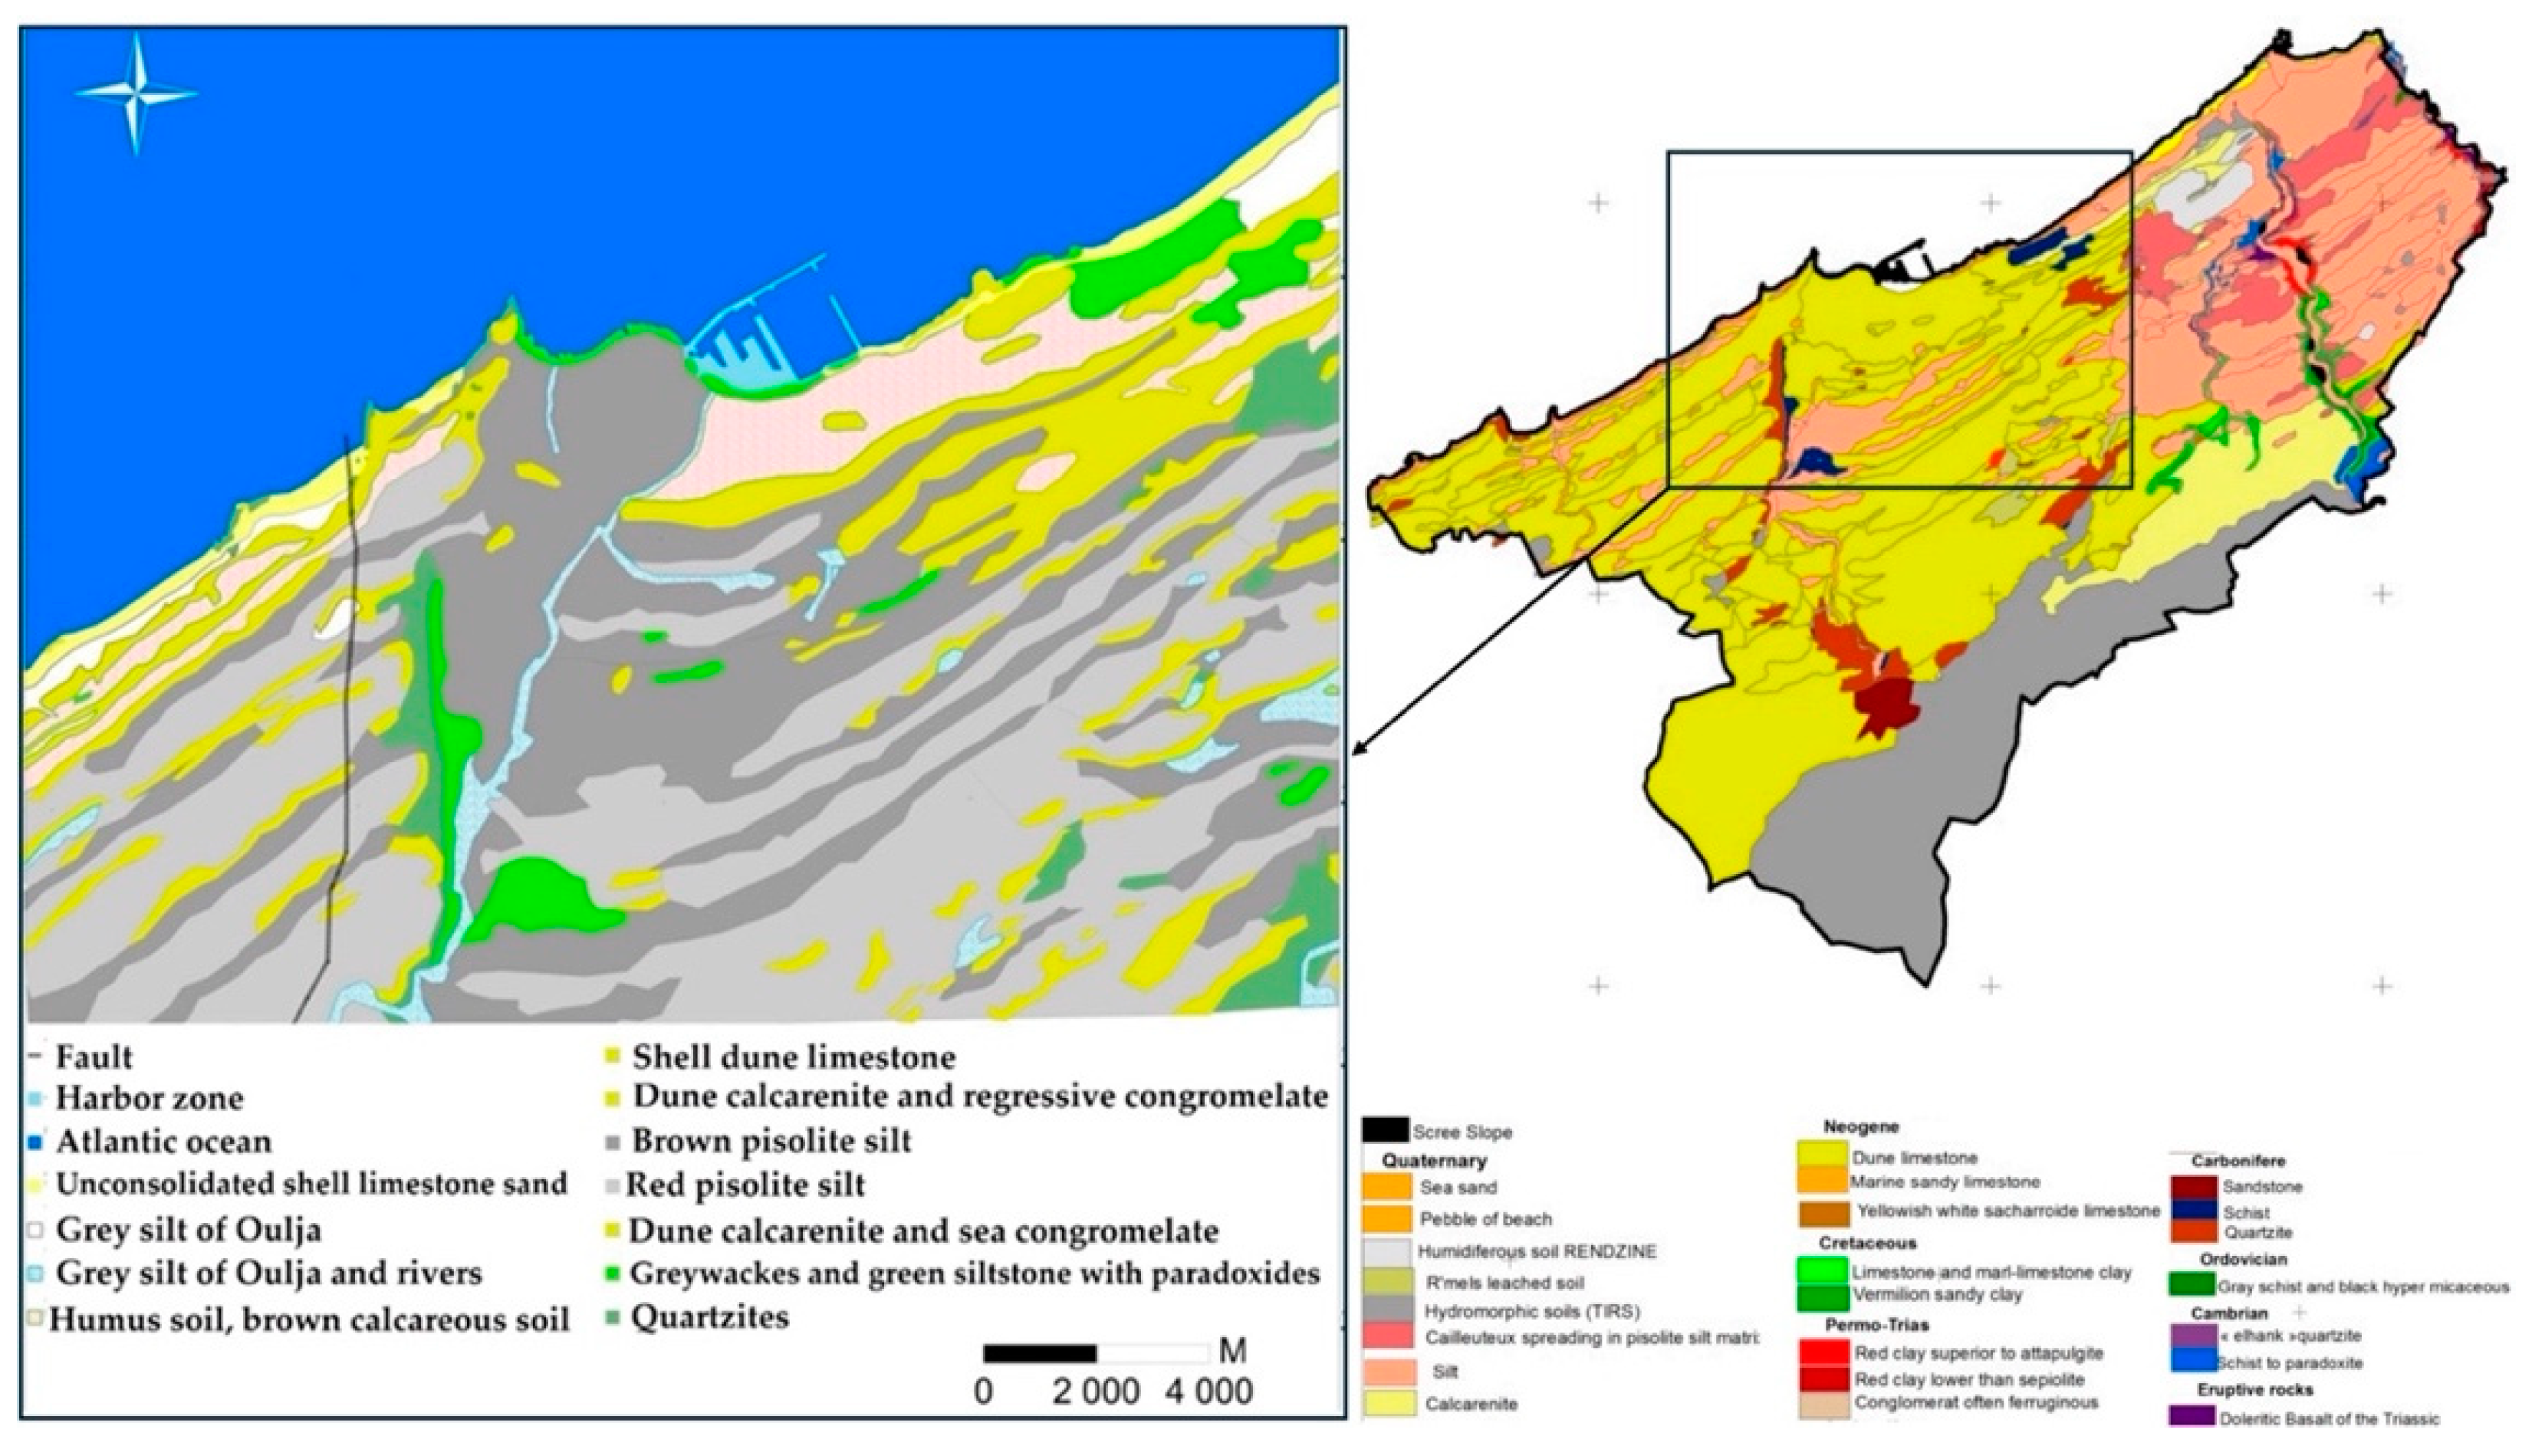
Figure 3.
Digital Maps showing (a) minimum travel time to arrive at the shore estimated for 5 sources (GB, MPF, HSF, PBF, CWF); (b) the maximum wave height for the 5 Tsunami sources of the coastline of Casablanca adapted from Omira et al. [41].
Figure 3.
Digital Maps showing (a) minimum travel time to arrive at the shore estimated for 5 sources (GB, MPF, HSF, PBF, CWF); (b) the maximum wave height for the 5 Tsunami sources of the coastline of Casablanca adapted from Omira et al. [41].
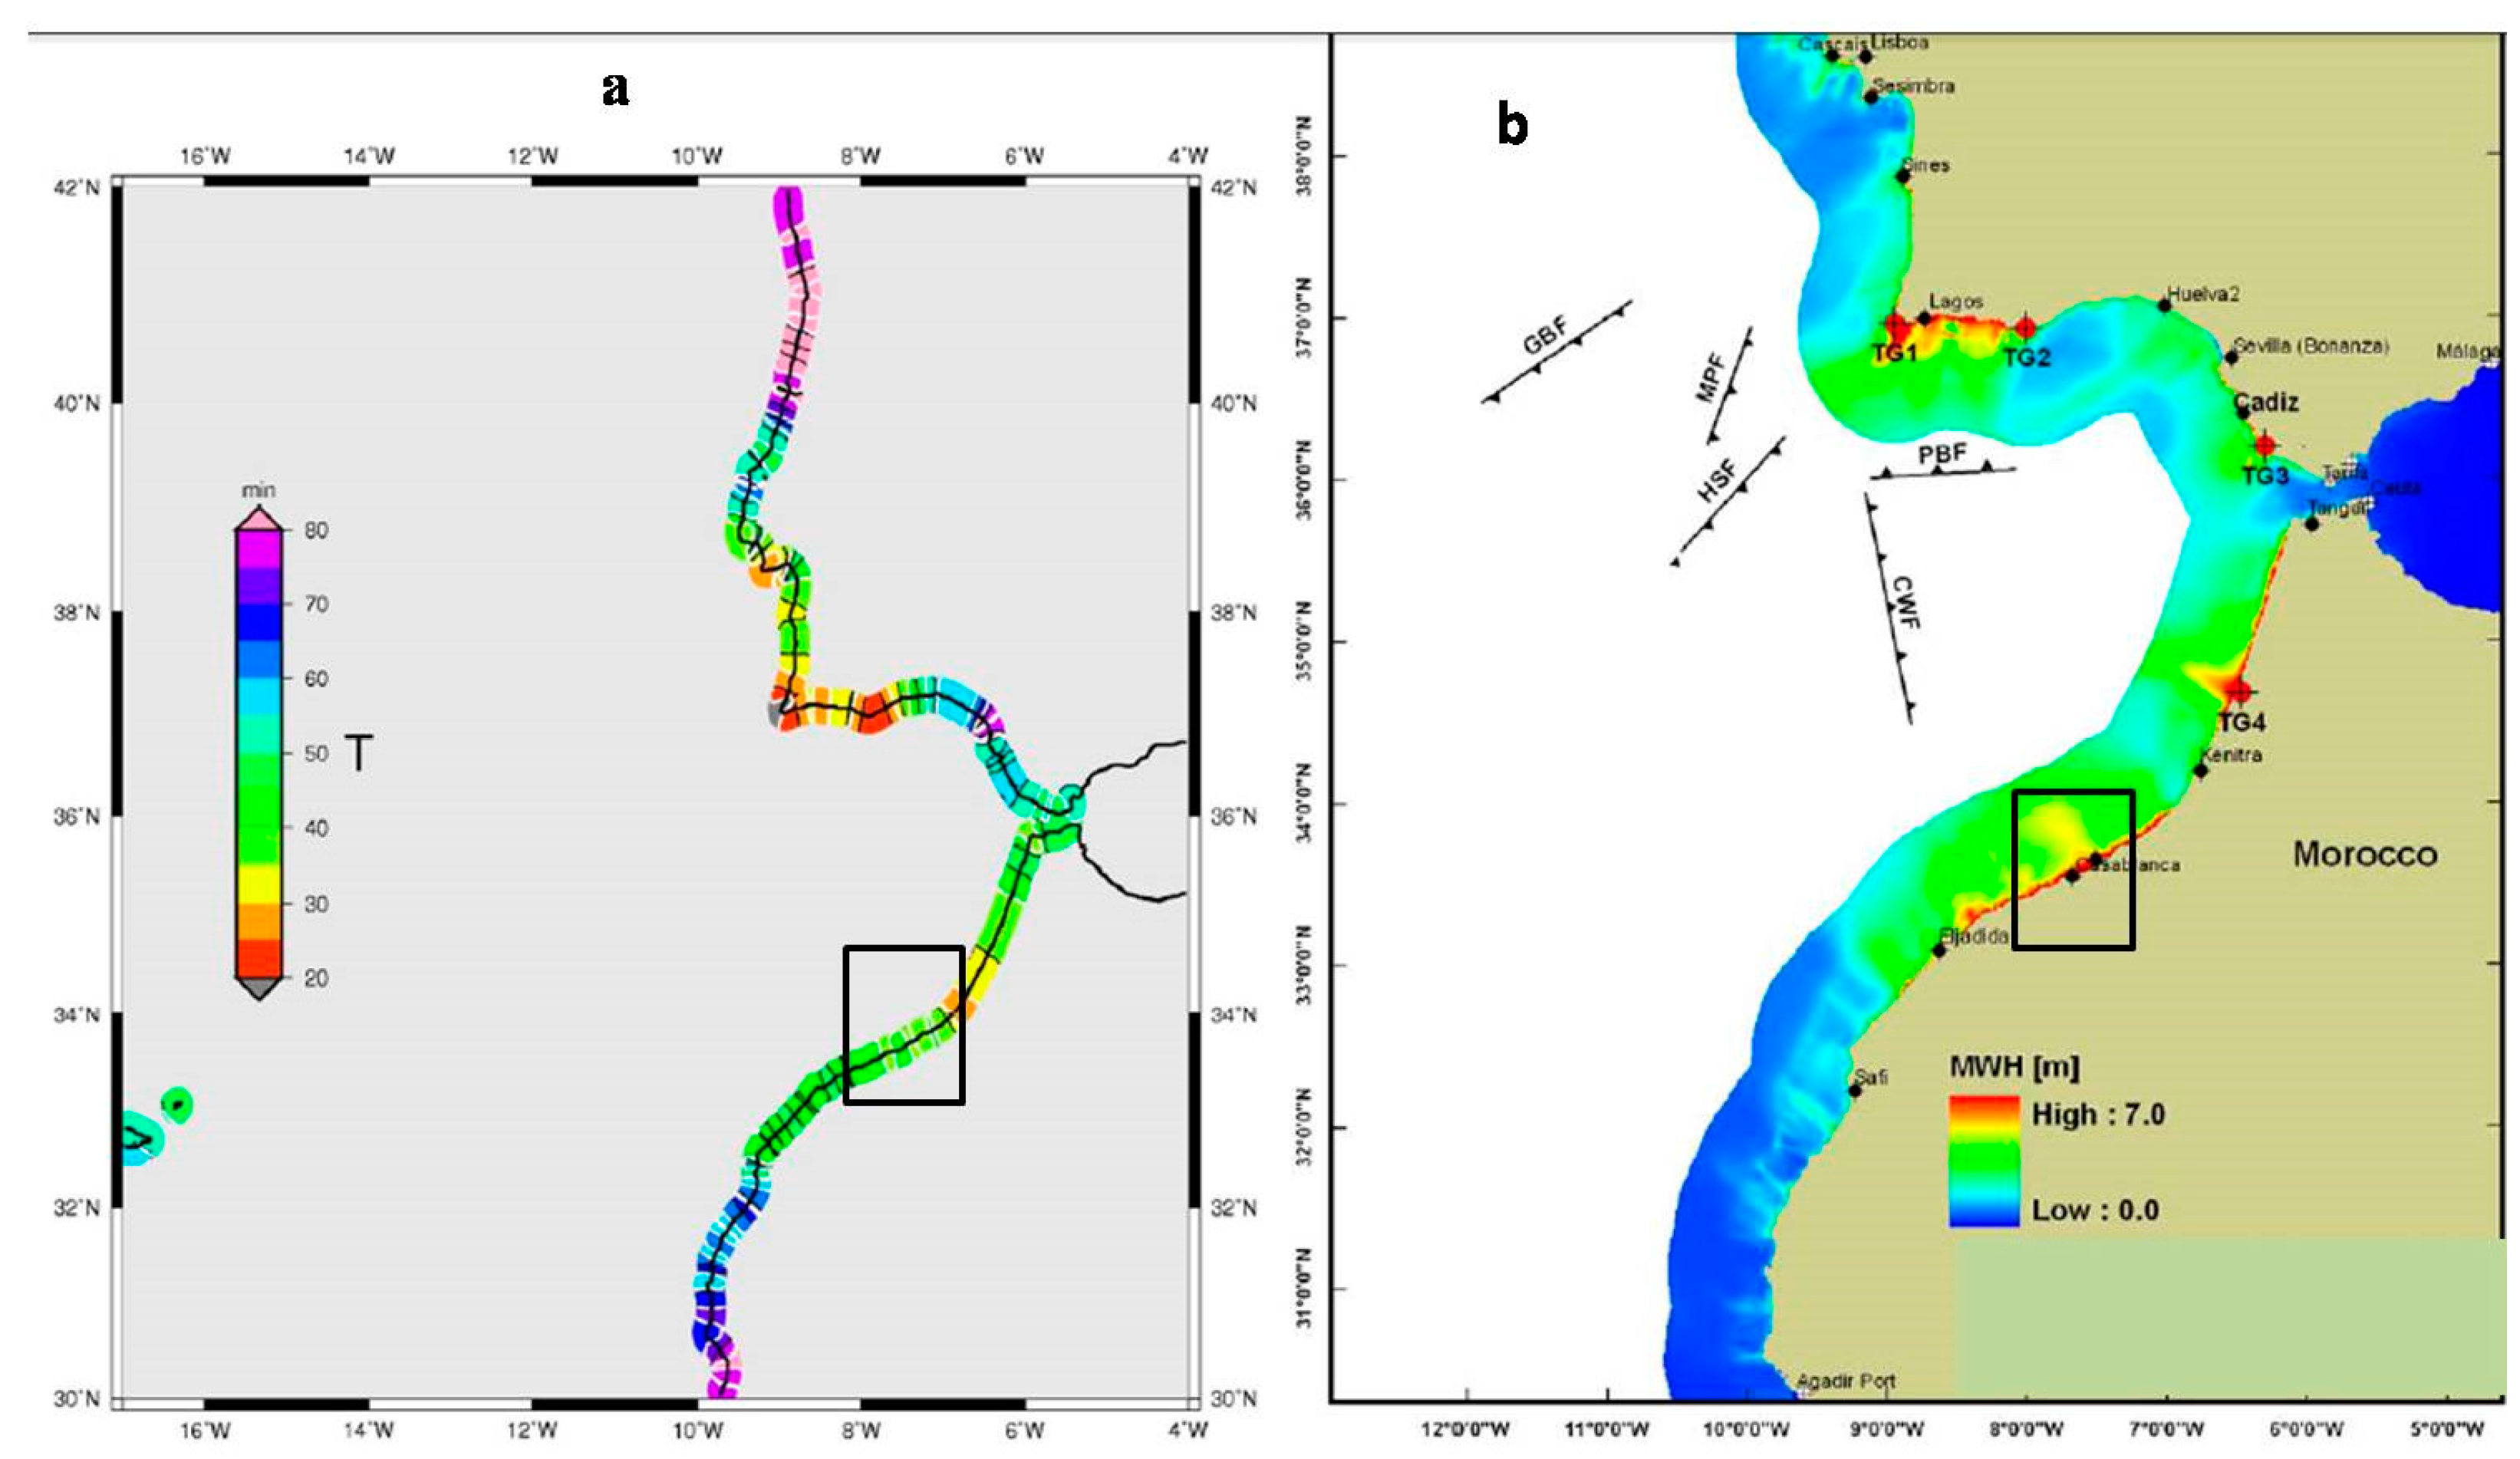
Figure 4.
Annual shorelines on the coast of Casablanca obtained from DE Africa coastline v0.4.2.
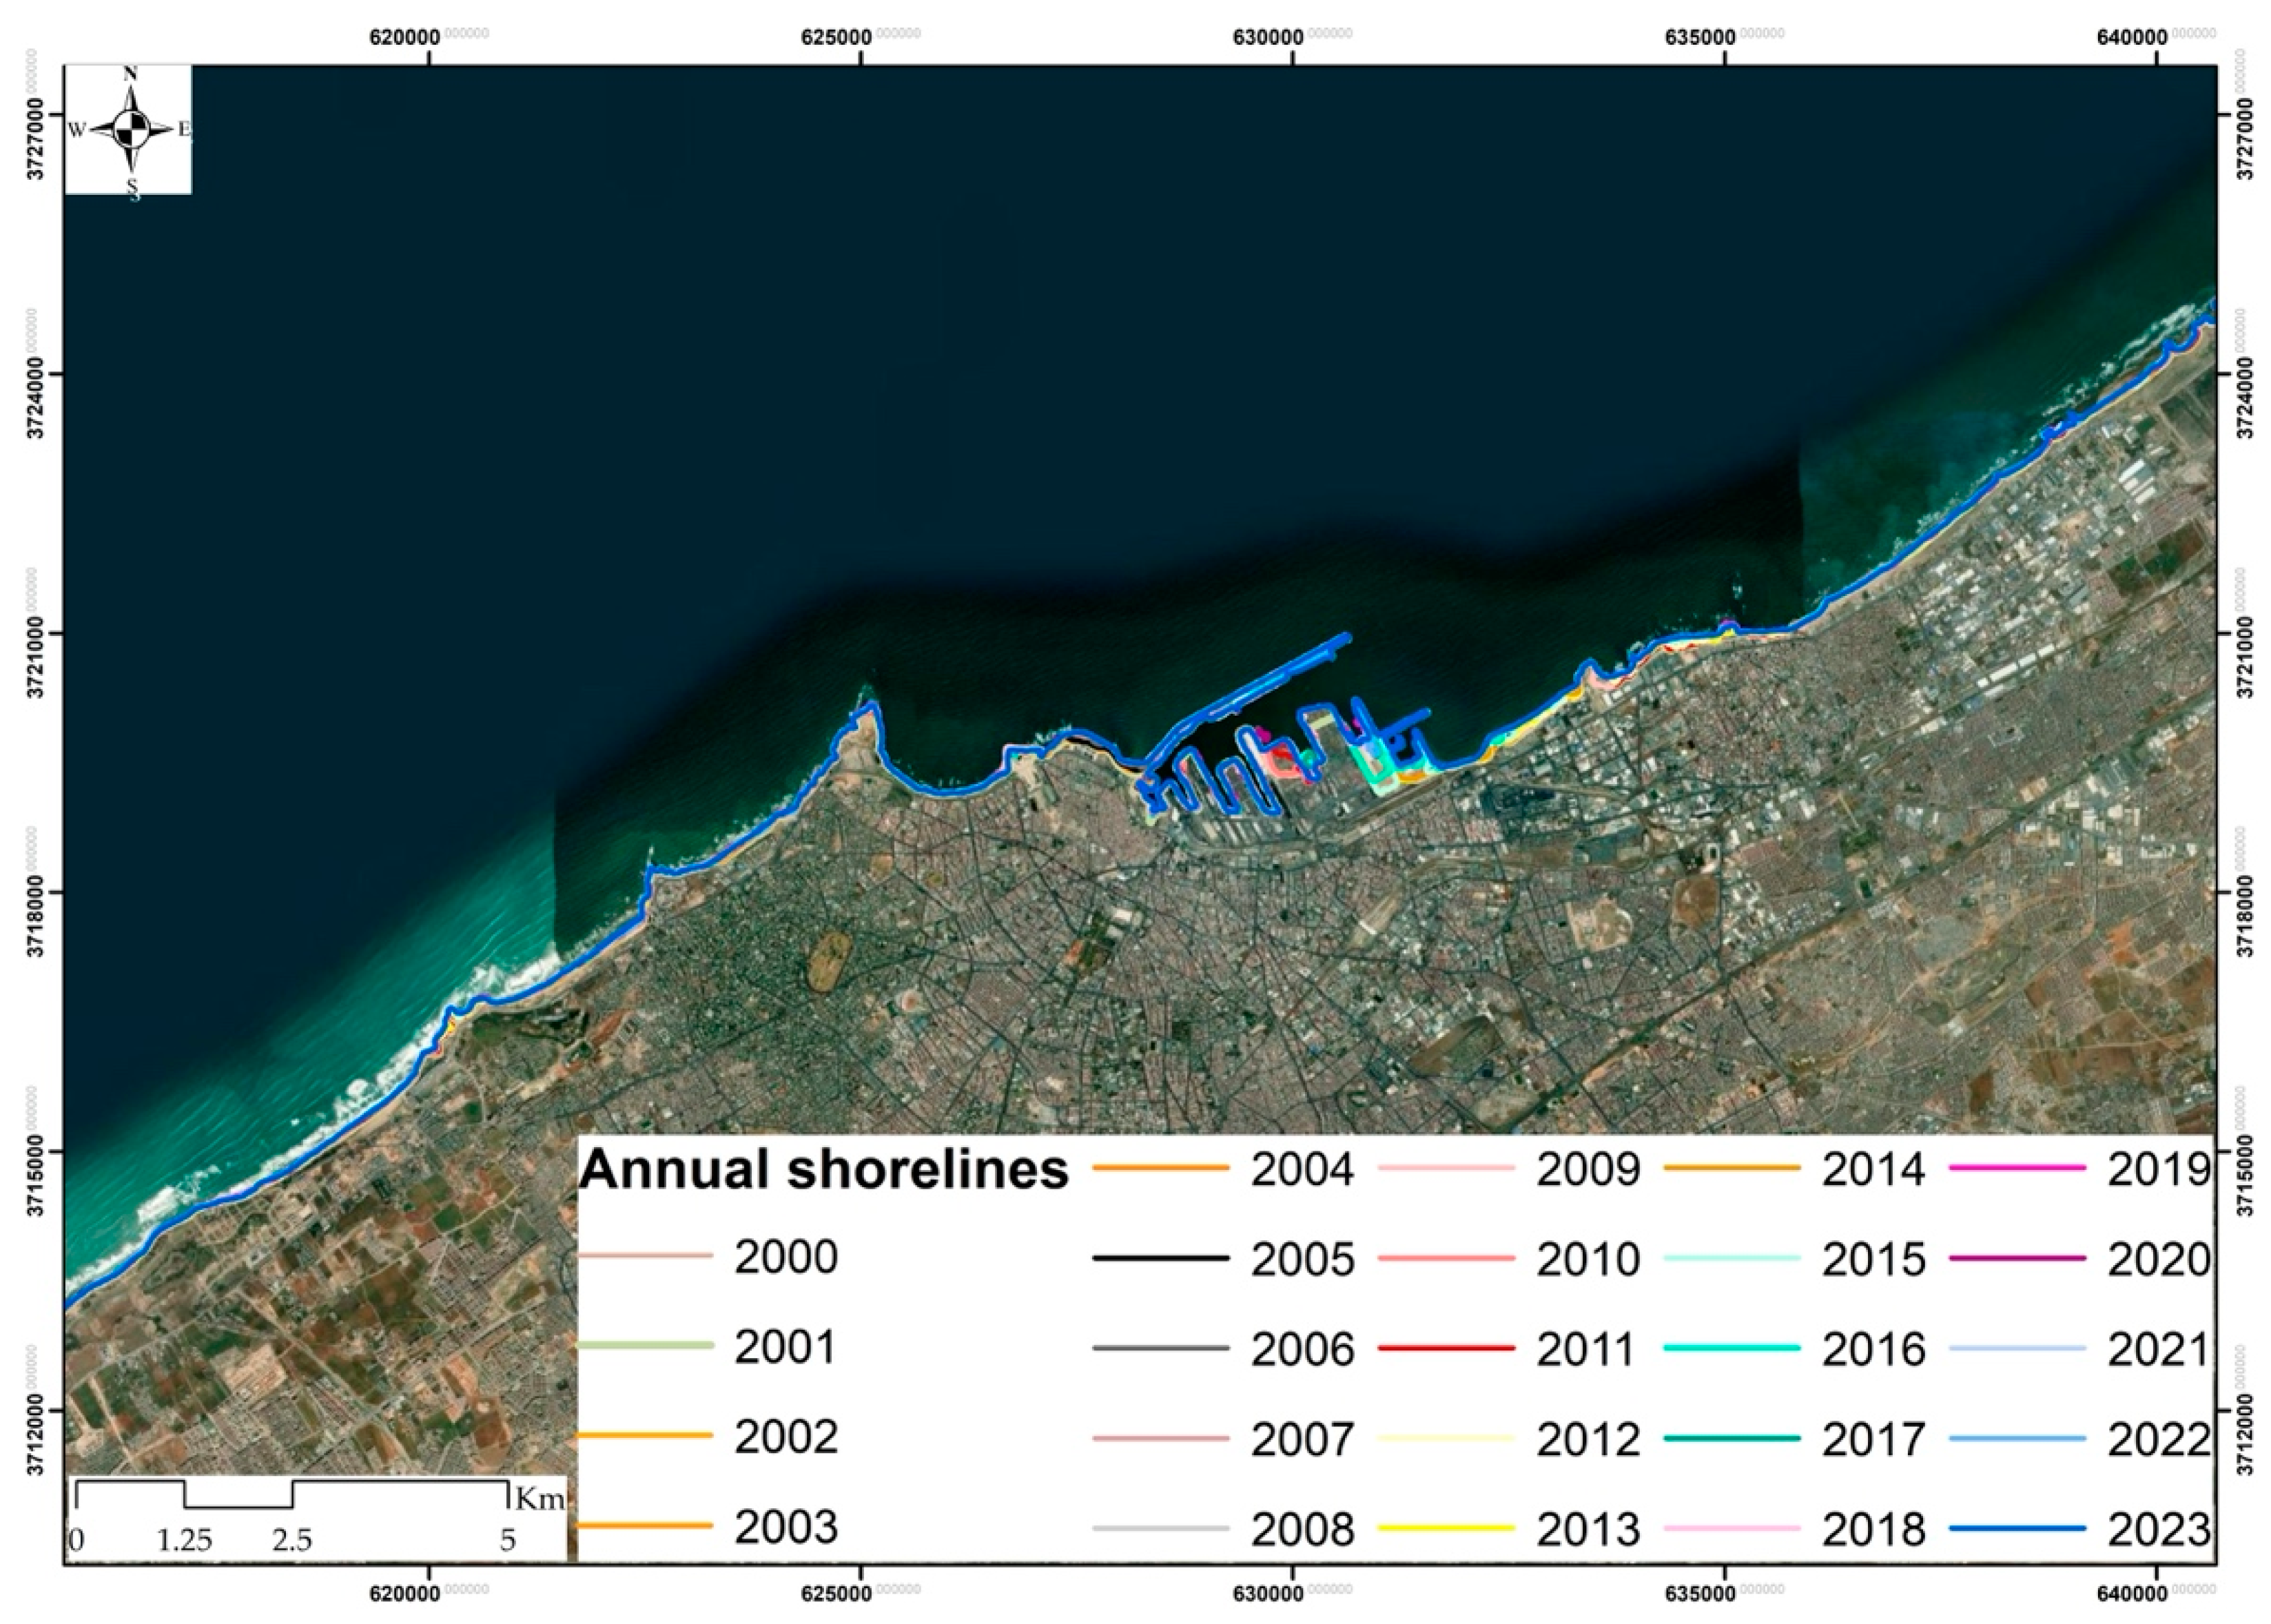
Figure 5.
Illustrations of Linear regression rate (LRR) and End point rate (EPR) calculations using annual shoreline distances. This illustration is an example for the measured point 0 located on the coast of Casablanca, Morocco (on the Beach of Zenata). Additional information on the point 0 are presented on the appendix A). (a) LRR is calculated by considering all cross-shore annual shoreline positions where the slope of equation equals the rate of change (1,0419 m/yr); (b) End point rate (EPR) is calculated by considering cross-shore positions of the oldest annual shoreline (2000) and most recent annual shoreline (2023) here the slope of equation equals the rate of change (0,6191 m/yr). Detailed descriptions of this point considered for LLR and EPR calculations are presented in the Supplementary Materials S.1 (Table S1).
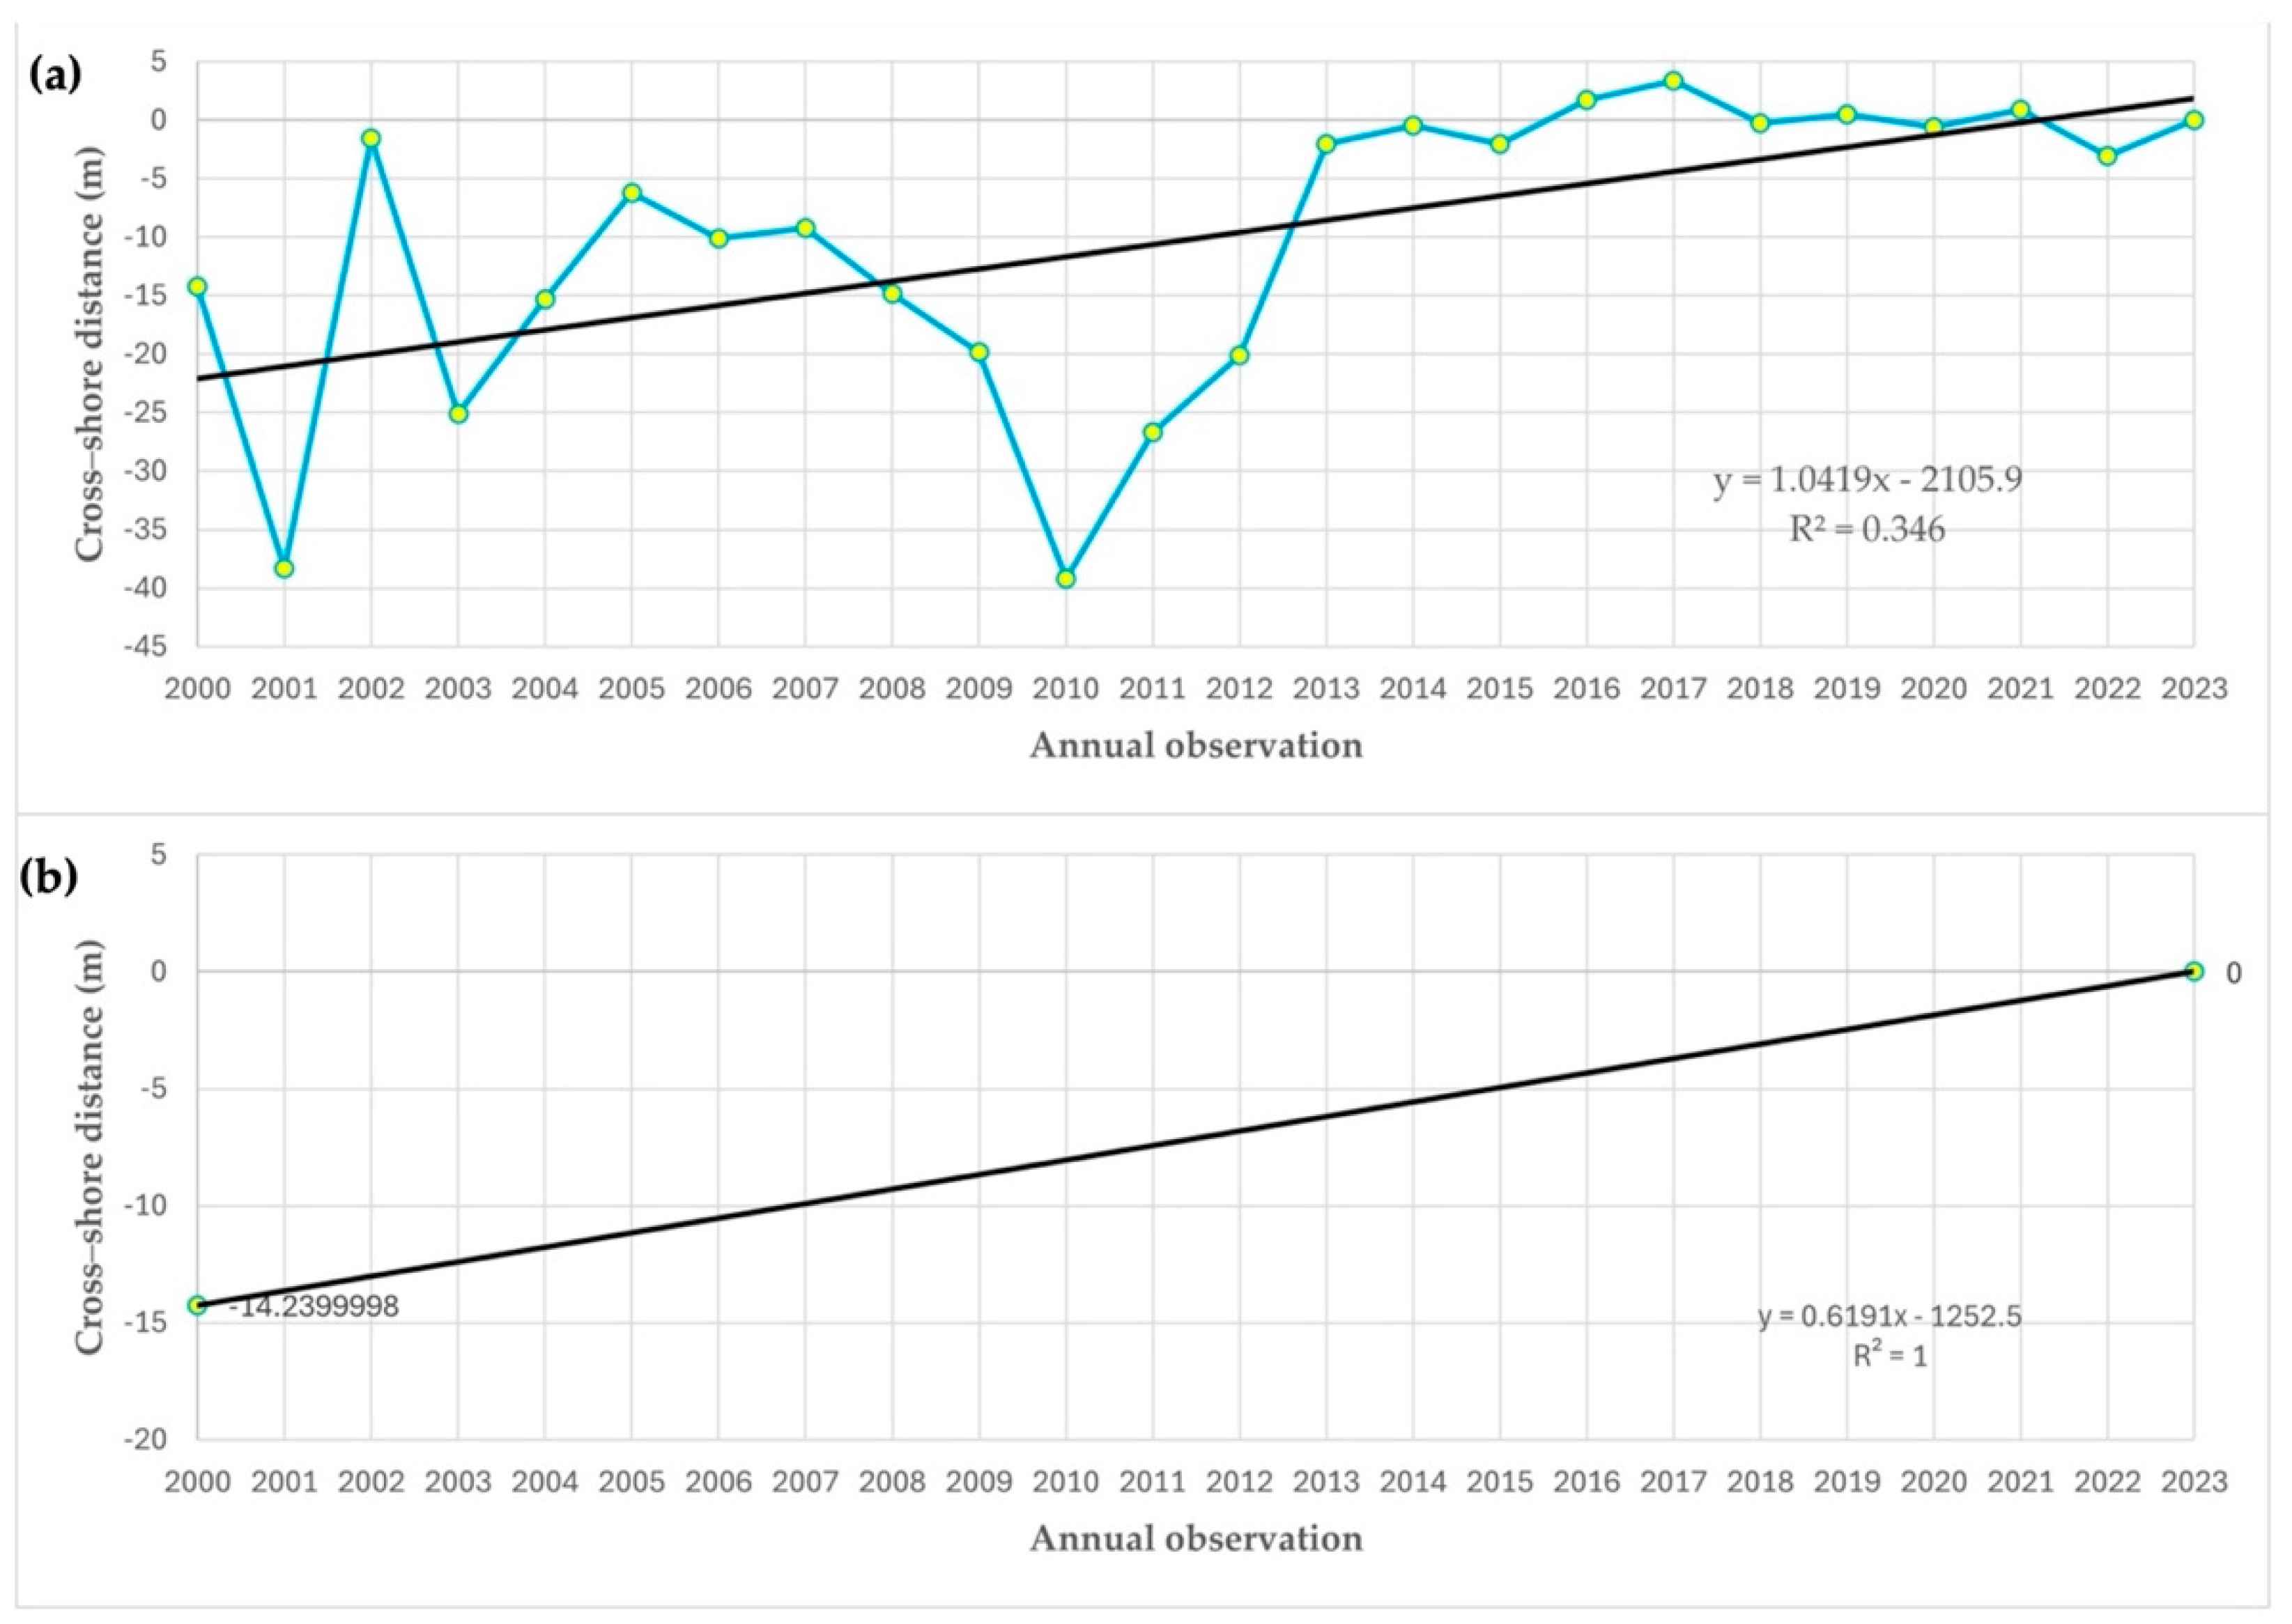
Figure 6.
(a) Net shoreline movement (NSM) on the coast of Casablanca. It is the distance between the oldest shoreline (2000) and most recent annual shoreline (2023). Negative values indicate that the coastline retreated between 2000 and 2023 while positive values indicate the growth of the coastline. (b) Map depicting the shoreline change envelope (SCE) on the coast of Casablanca. Information related to the location of 1630 points is presented in the Supplementary Materials S.2 (Figure S1).
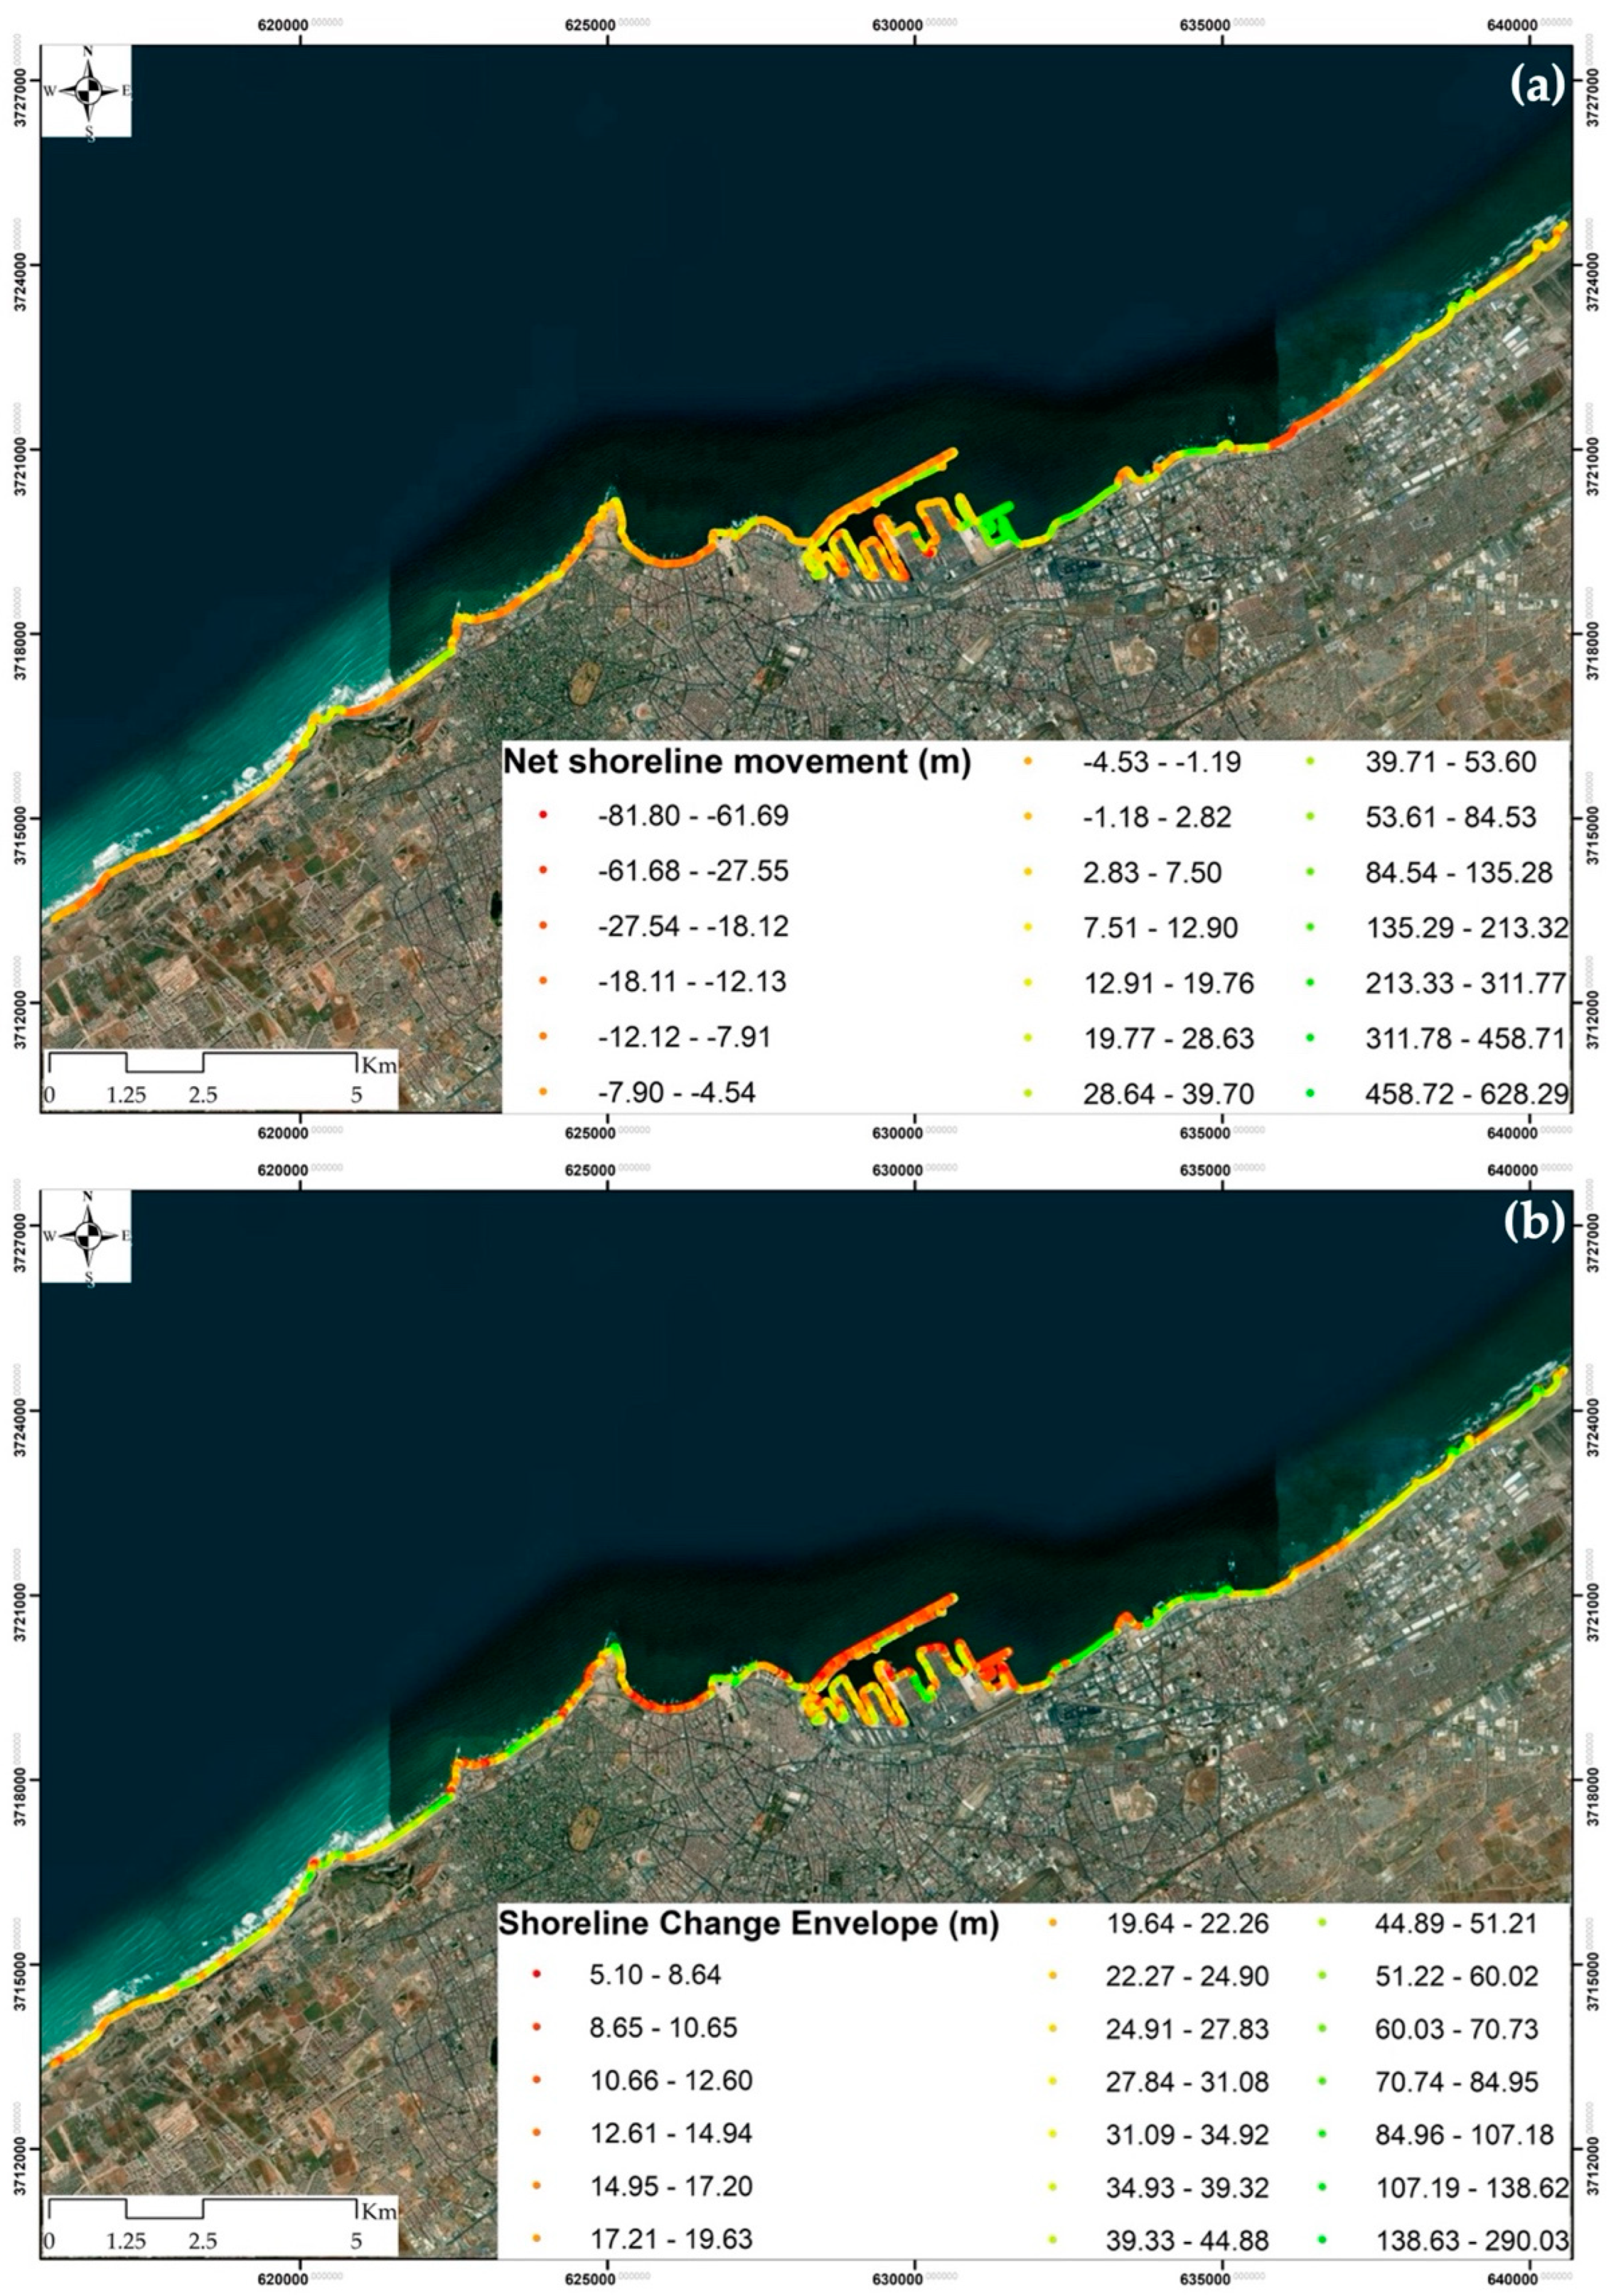
Figure 7.
Coastal geomorphology variable ranking used to calculate CVI calculation.
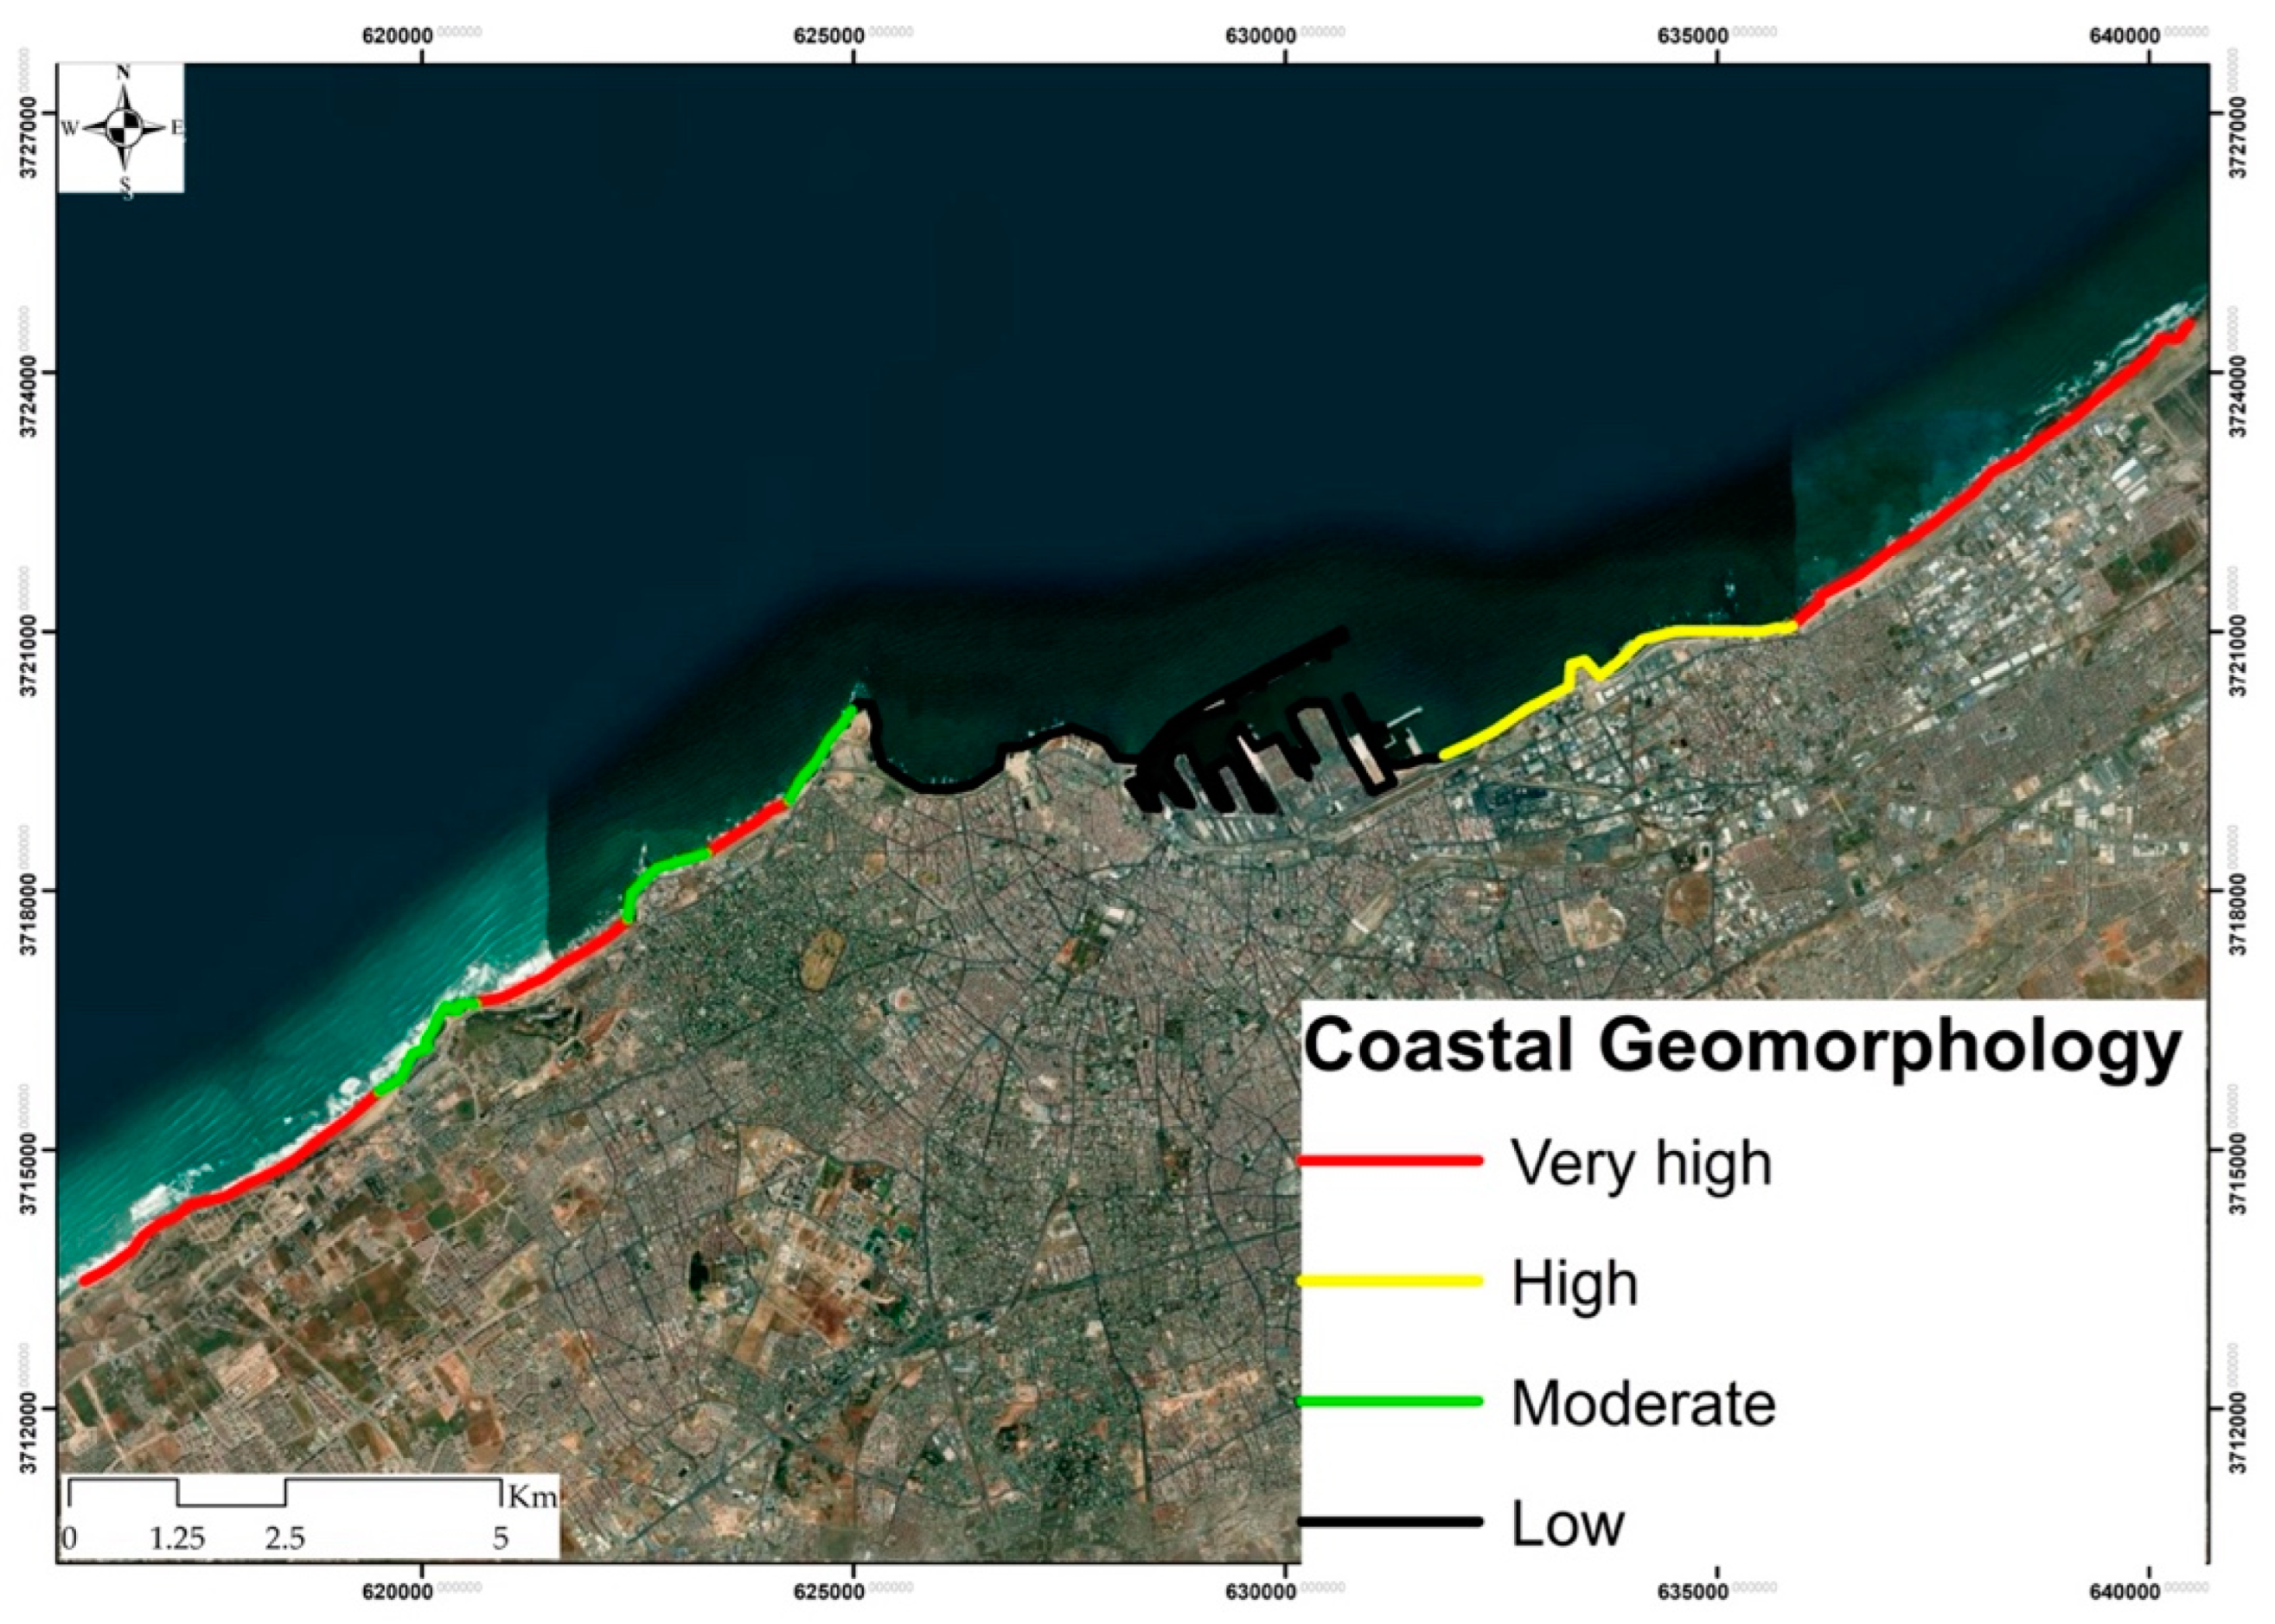
Figure 8.
Rankings of variables used to calculate the coastal vulnerability index. (a) Coastal slope; (b) Coastal elevation.
Figure 8.
Rankings of variables used to calculate the coastal vulnerability index. (a) Coastal slope; (b) Coastal elevation.
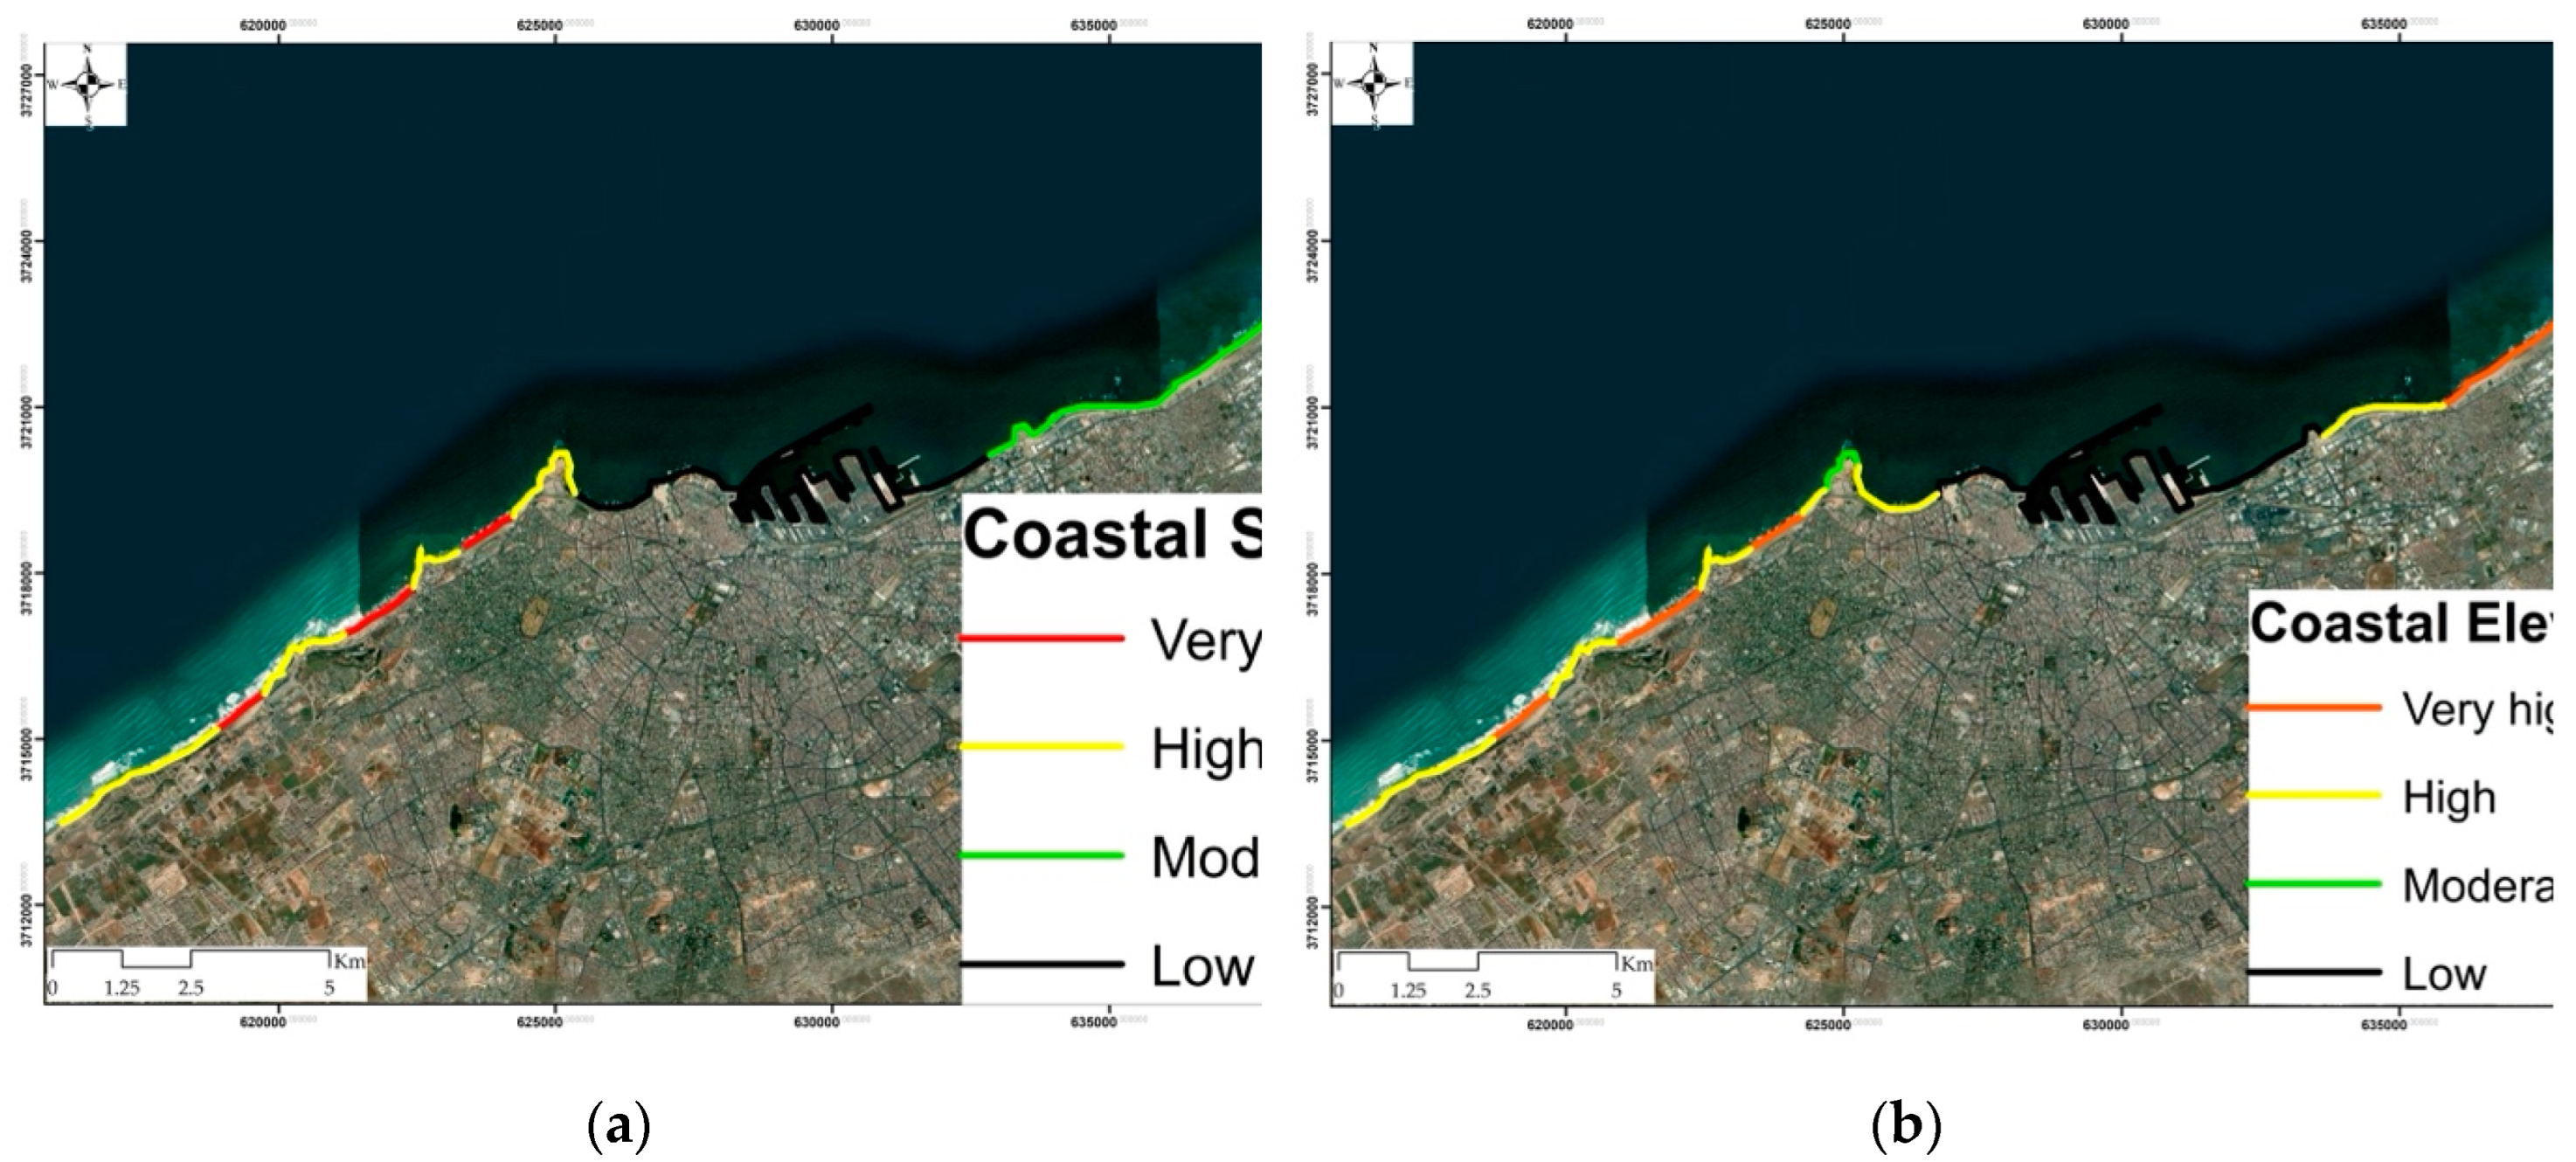
Figure 9.
Annual rates of change for 1630 points located on the coast of Casablanca. LRR revealed the coastline growth reaching 16 m/yr and the retreat of about -4 m/yr near the port of Casablanca (a) while EPR indicated the coastline growth of about 28 m/yr and a retreat of about -3 m/yr (b). Information related to the the significance (p-value) and the standard error of the linear relationship between the annul shoreline cross-shore positions and the annual observations are presented in the Supplementary Materials S.3 and S.4 (Figures S2, S3).
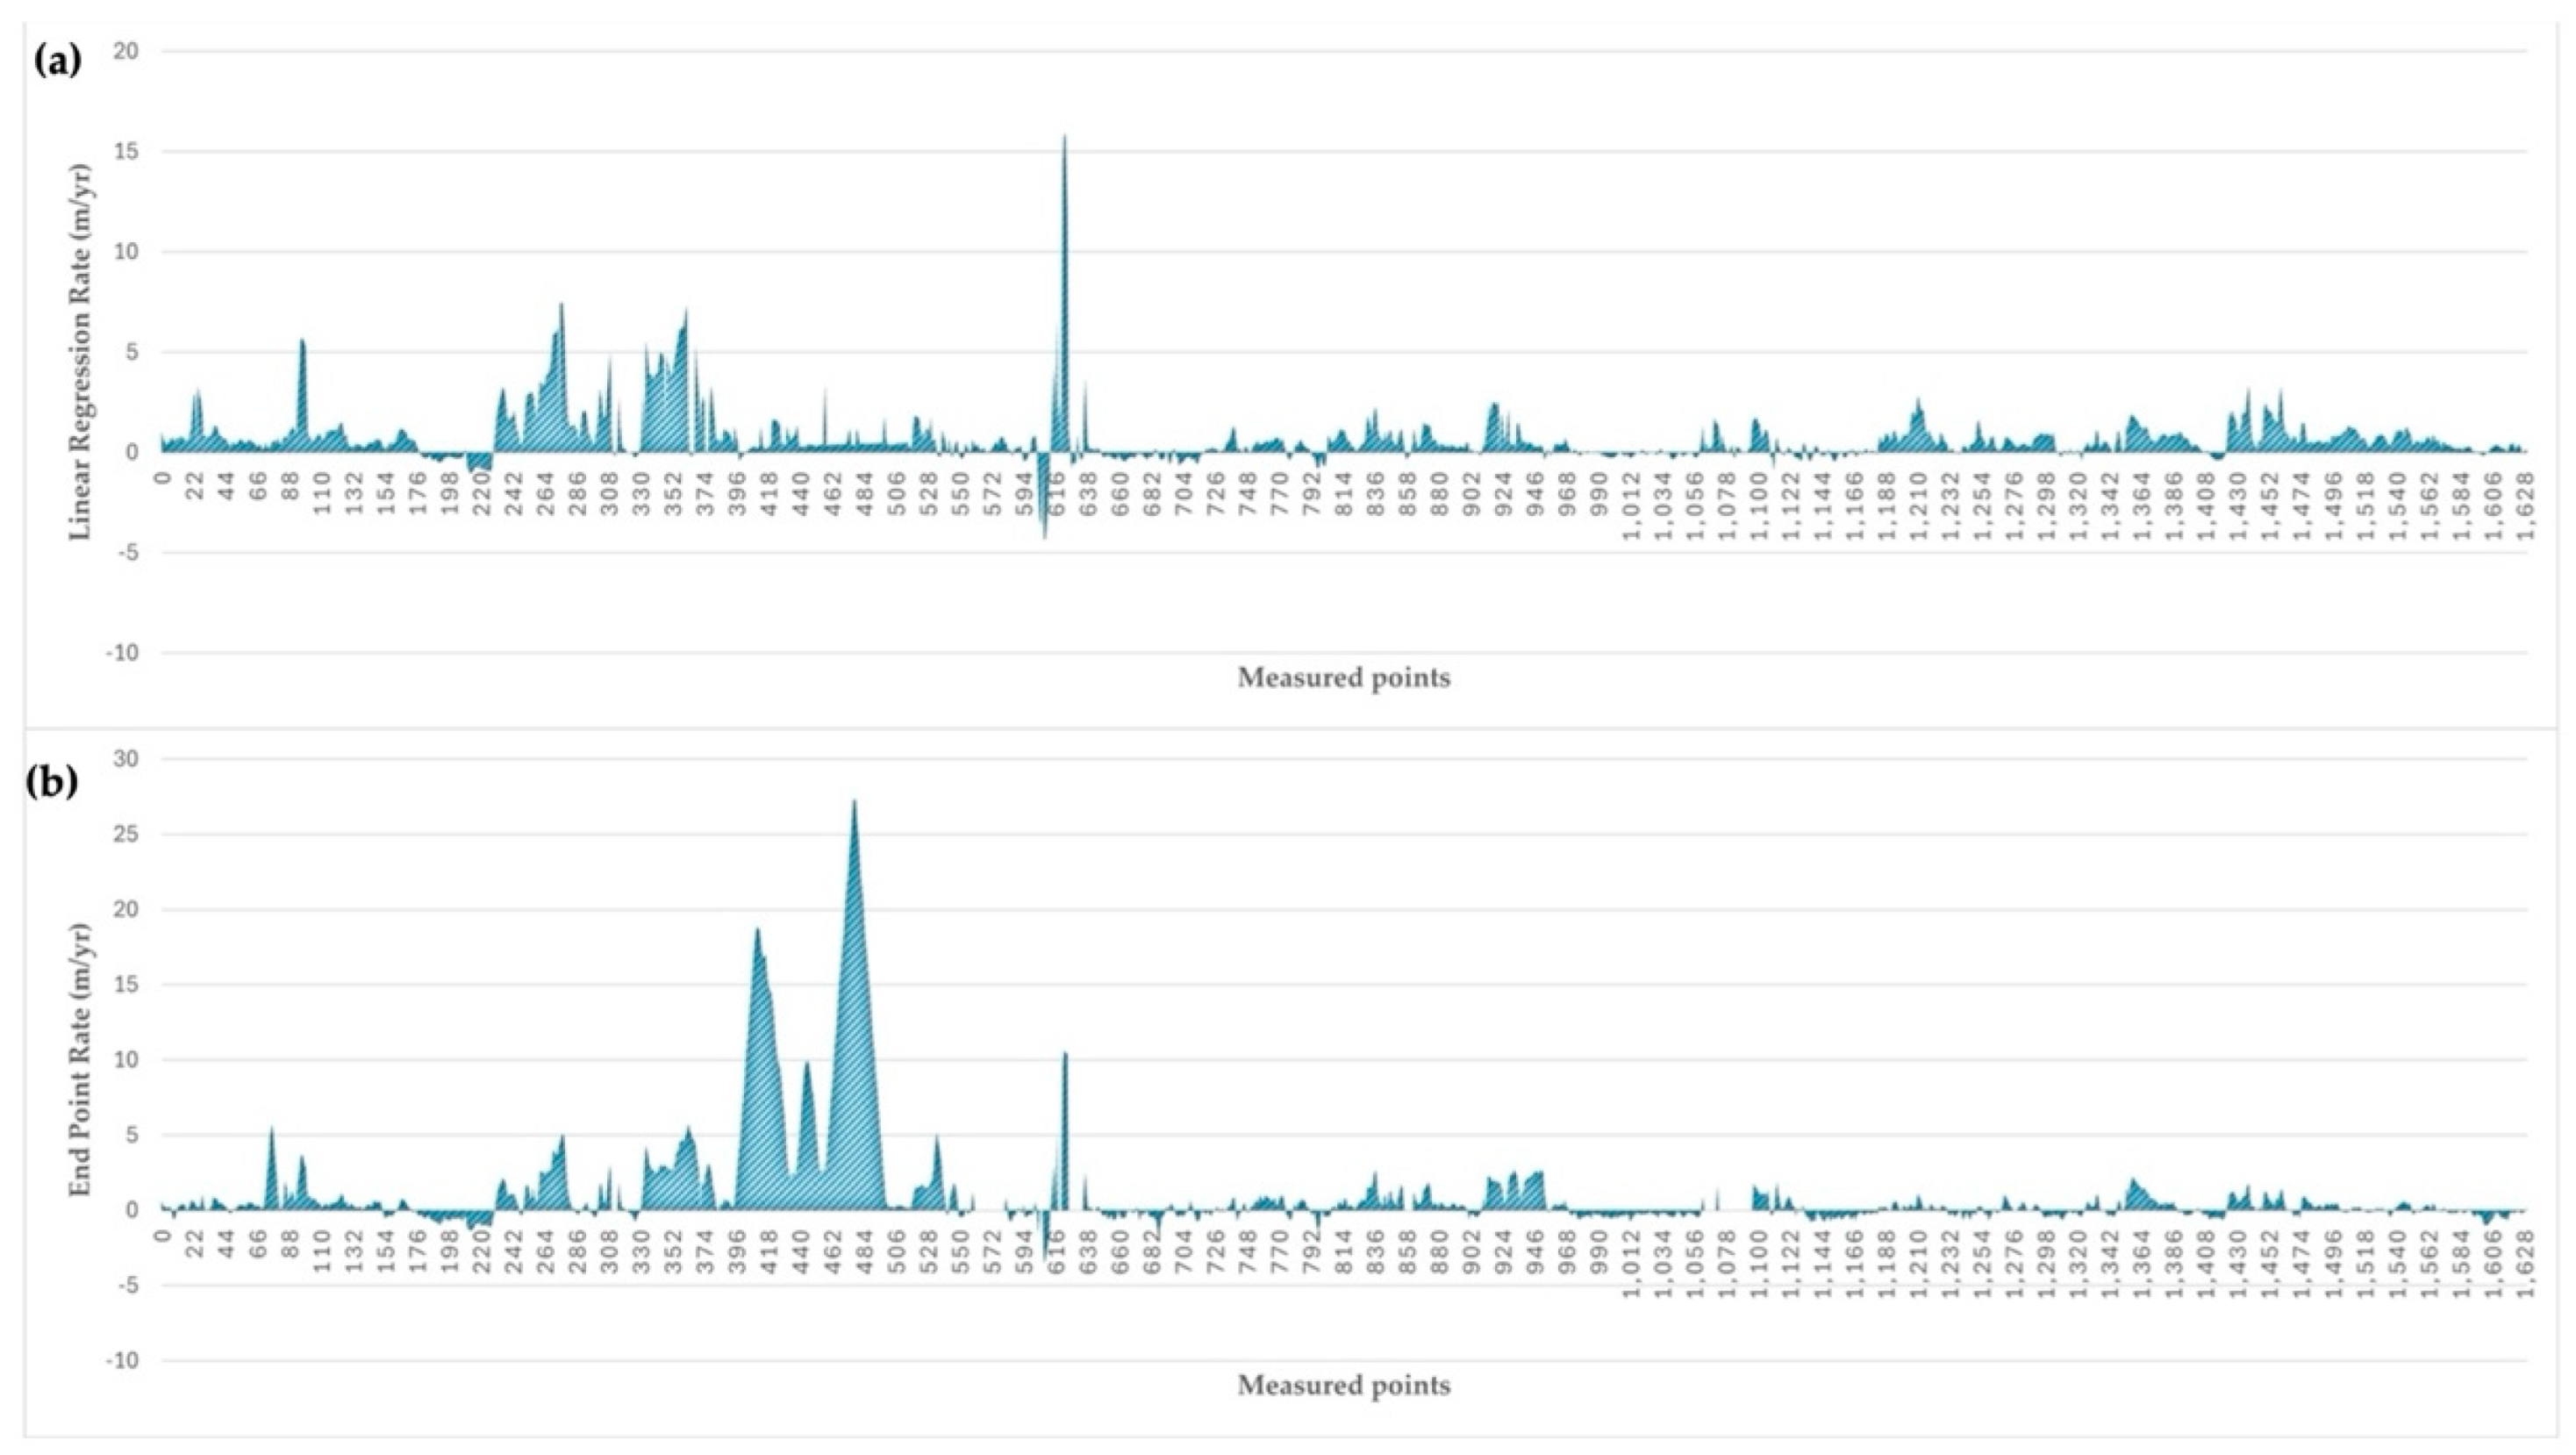
Figure 10.
Coastal Vulnerability index of the coast of Casablanca indicating very high vulnerability on sand beaches; high vulnerability observed on semi-and rocky areas; Moderate vulnerability was observed on semi-rocky areas; and low vulnerability observed on artificial areas.
Figure 10.
Coastal Vulnerability index of the coast of Casablanca indicating very high vulnerability on sand beaches; high vulnerability observed on semi-and rocky areas; Moderate vulnerability was observed on semi-rocky areas; and low vulnerability observed on artificial areas.
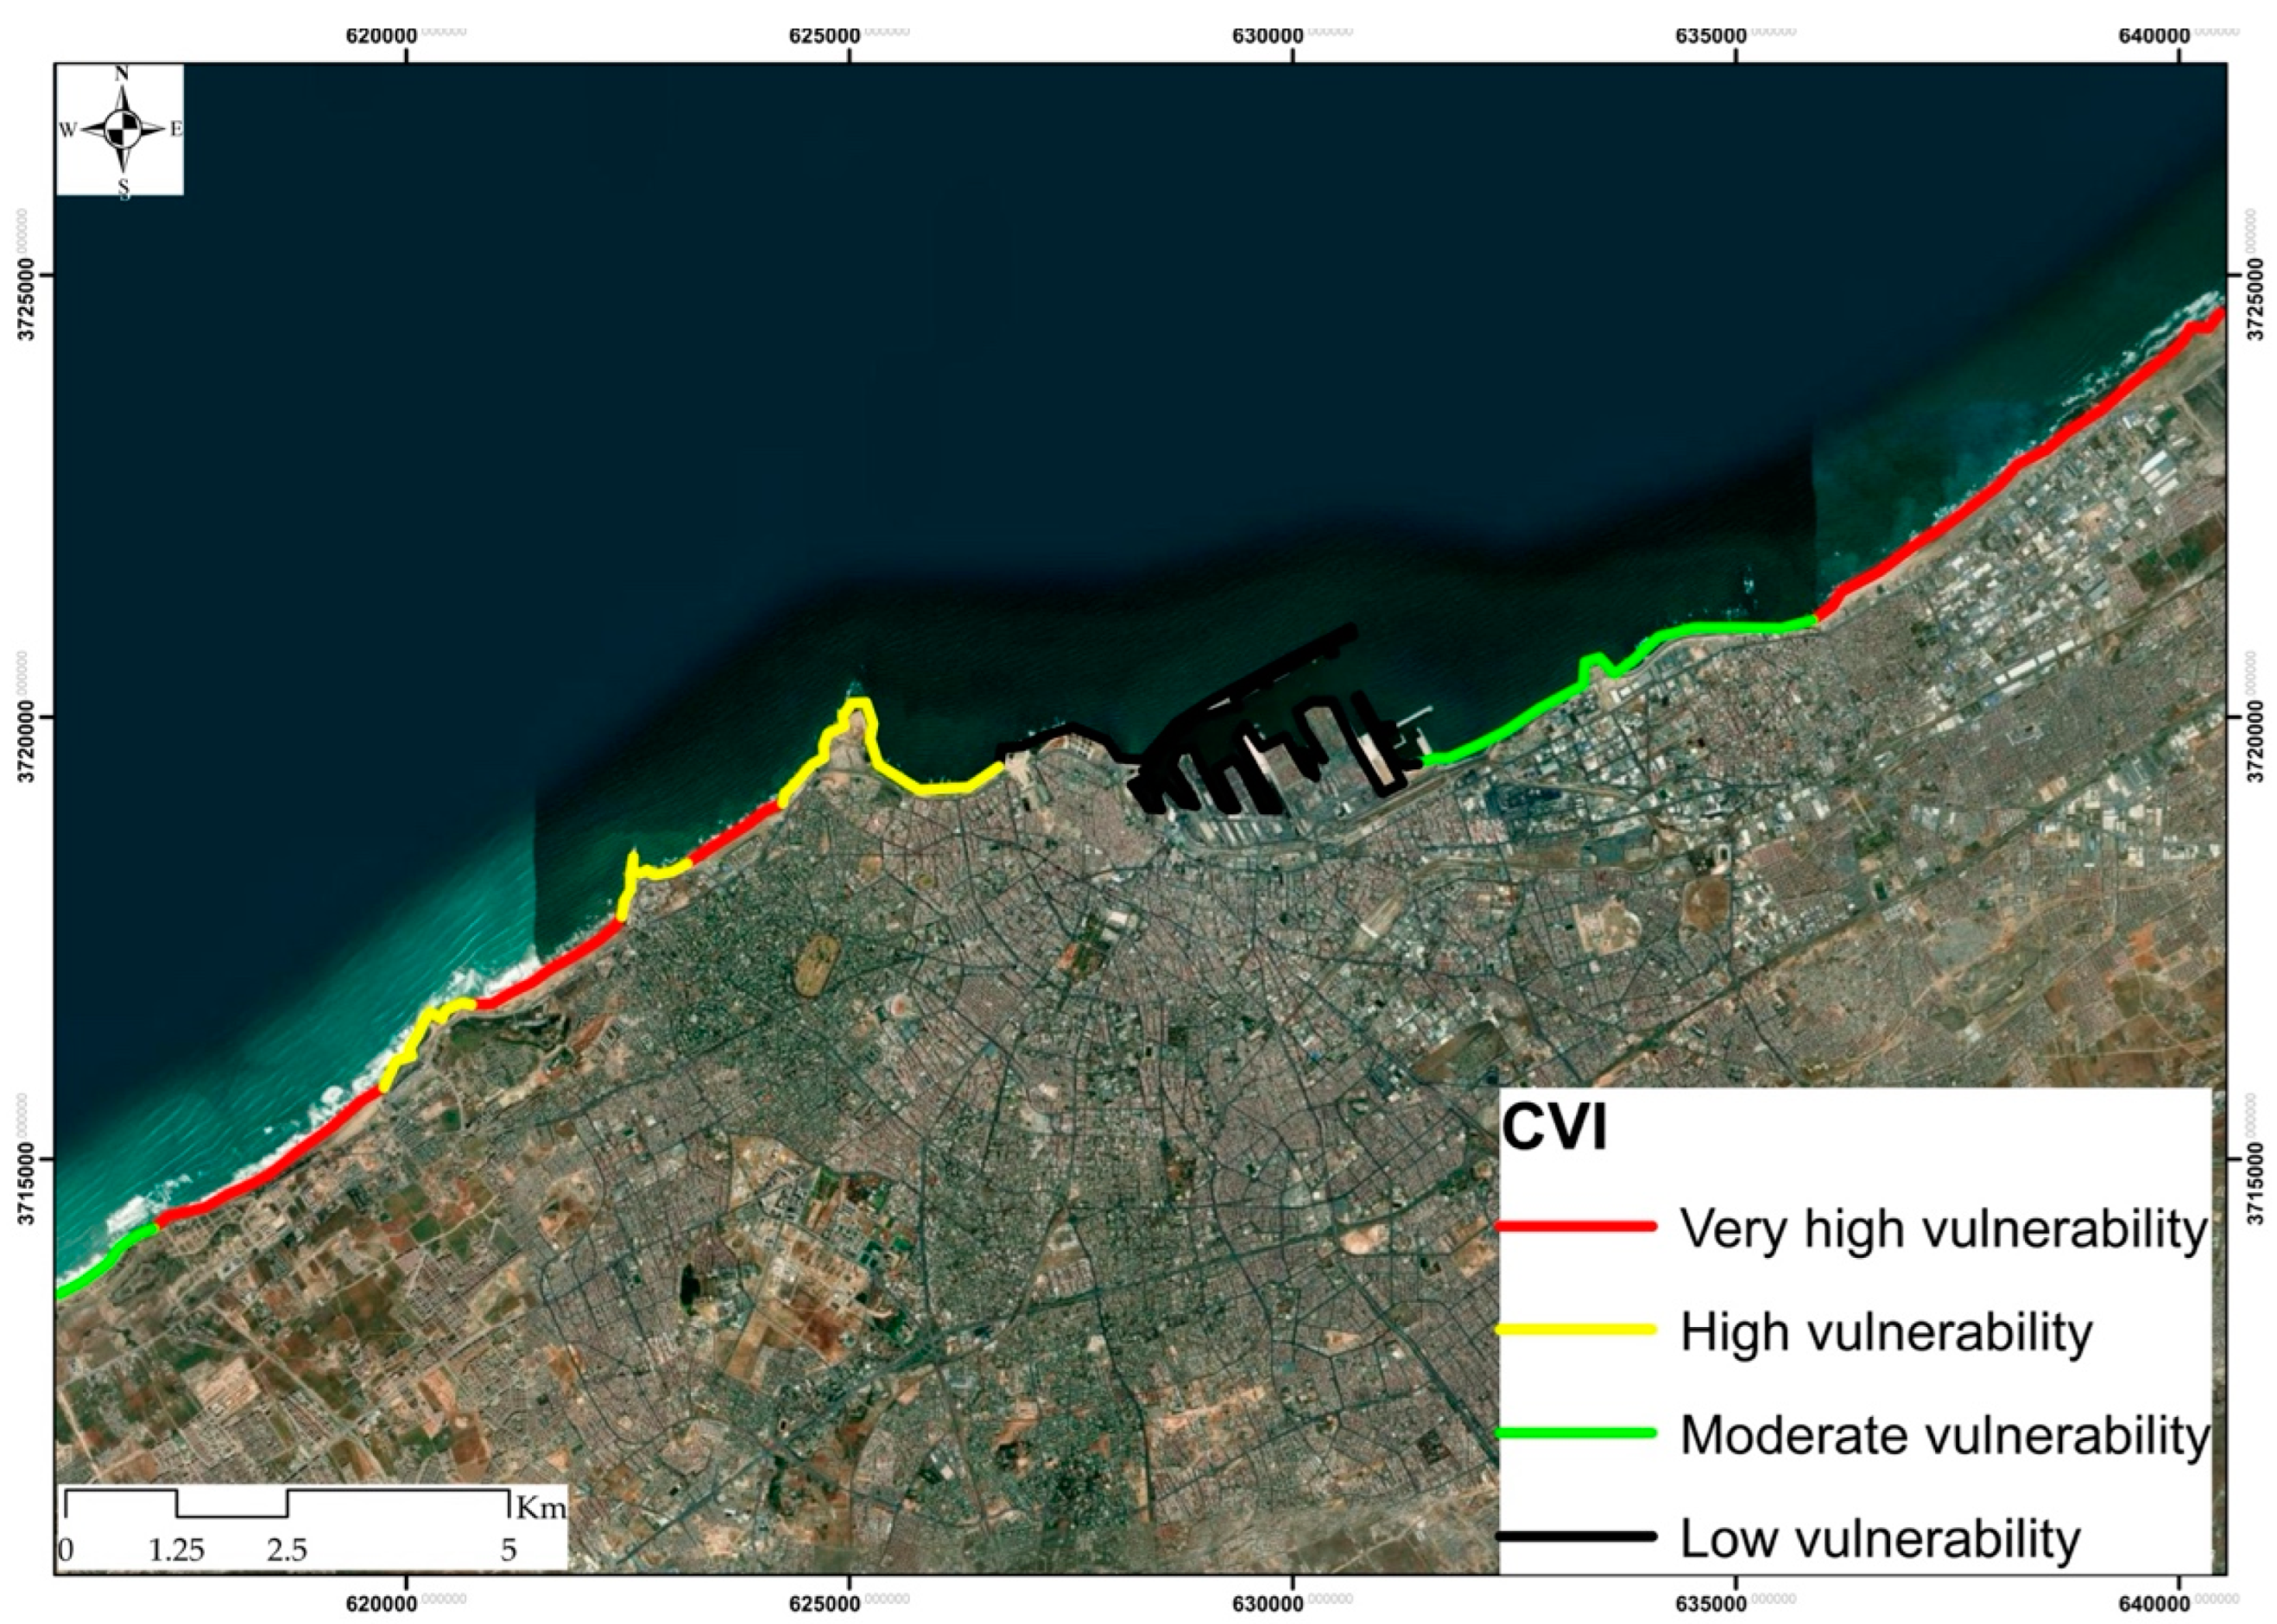
Figure 11.
Repartition of the coastal Vulnerability index for the coast of Casablanca.
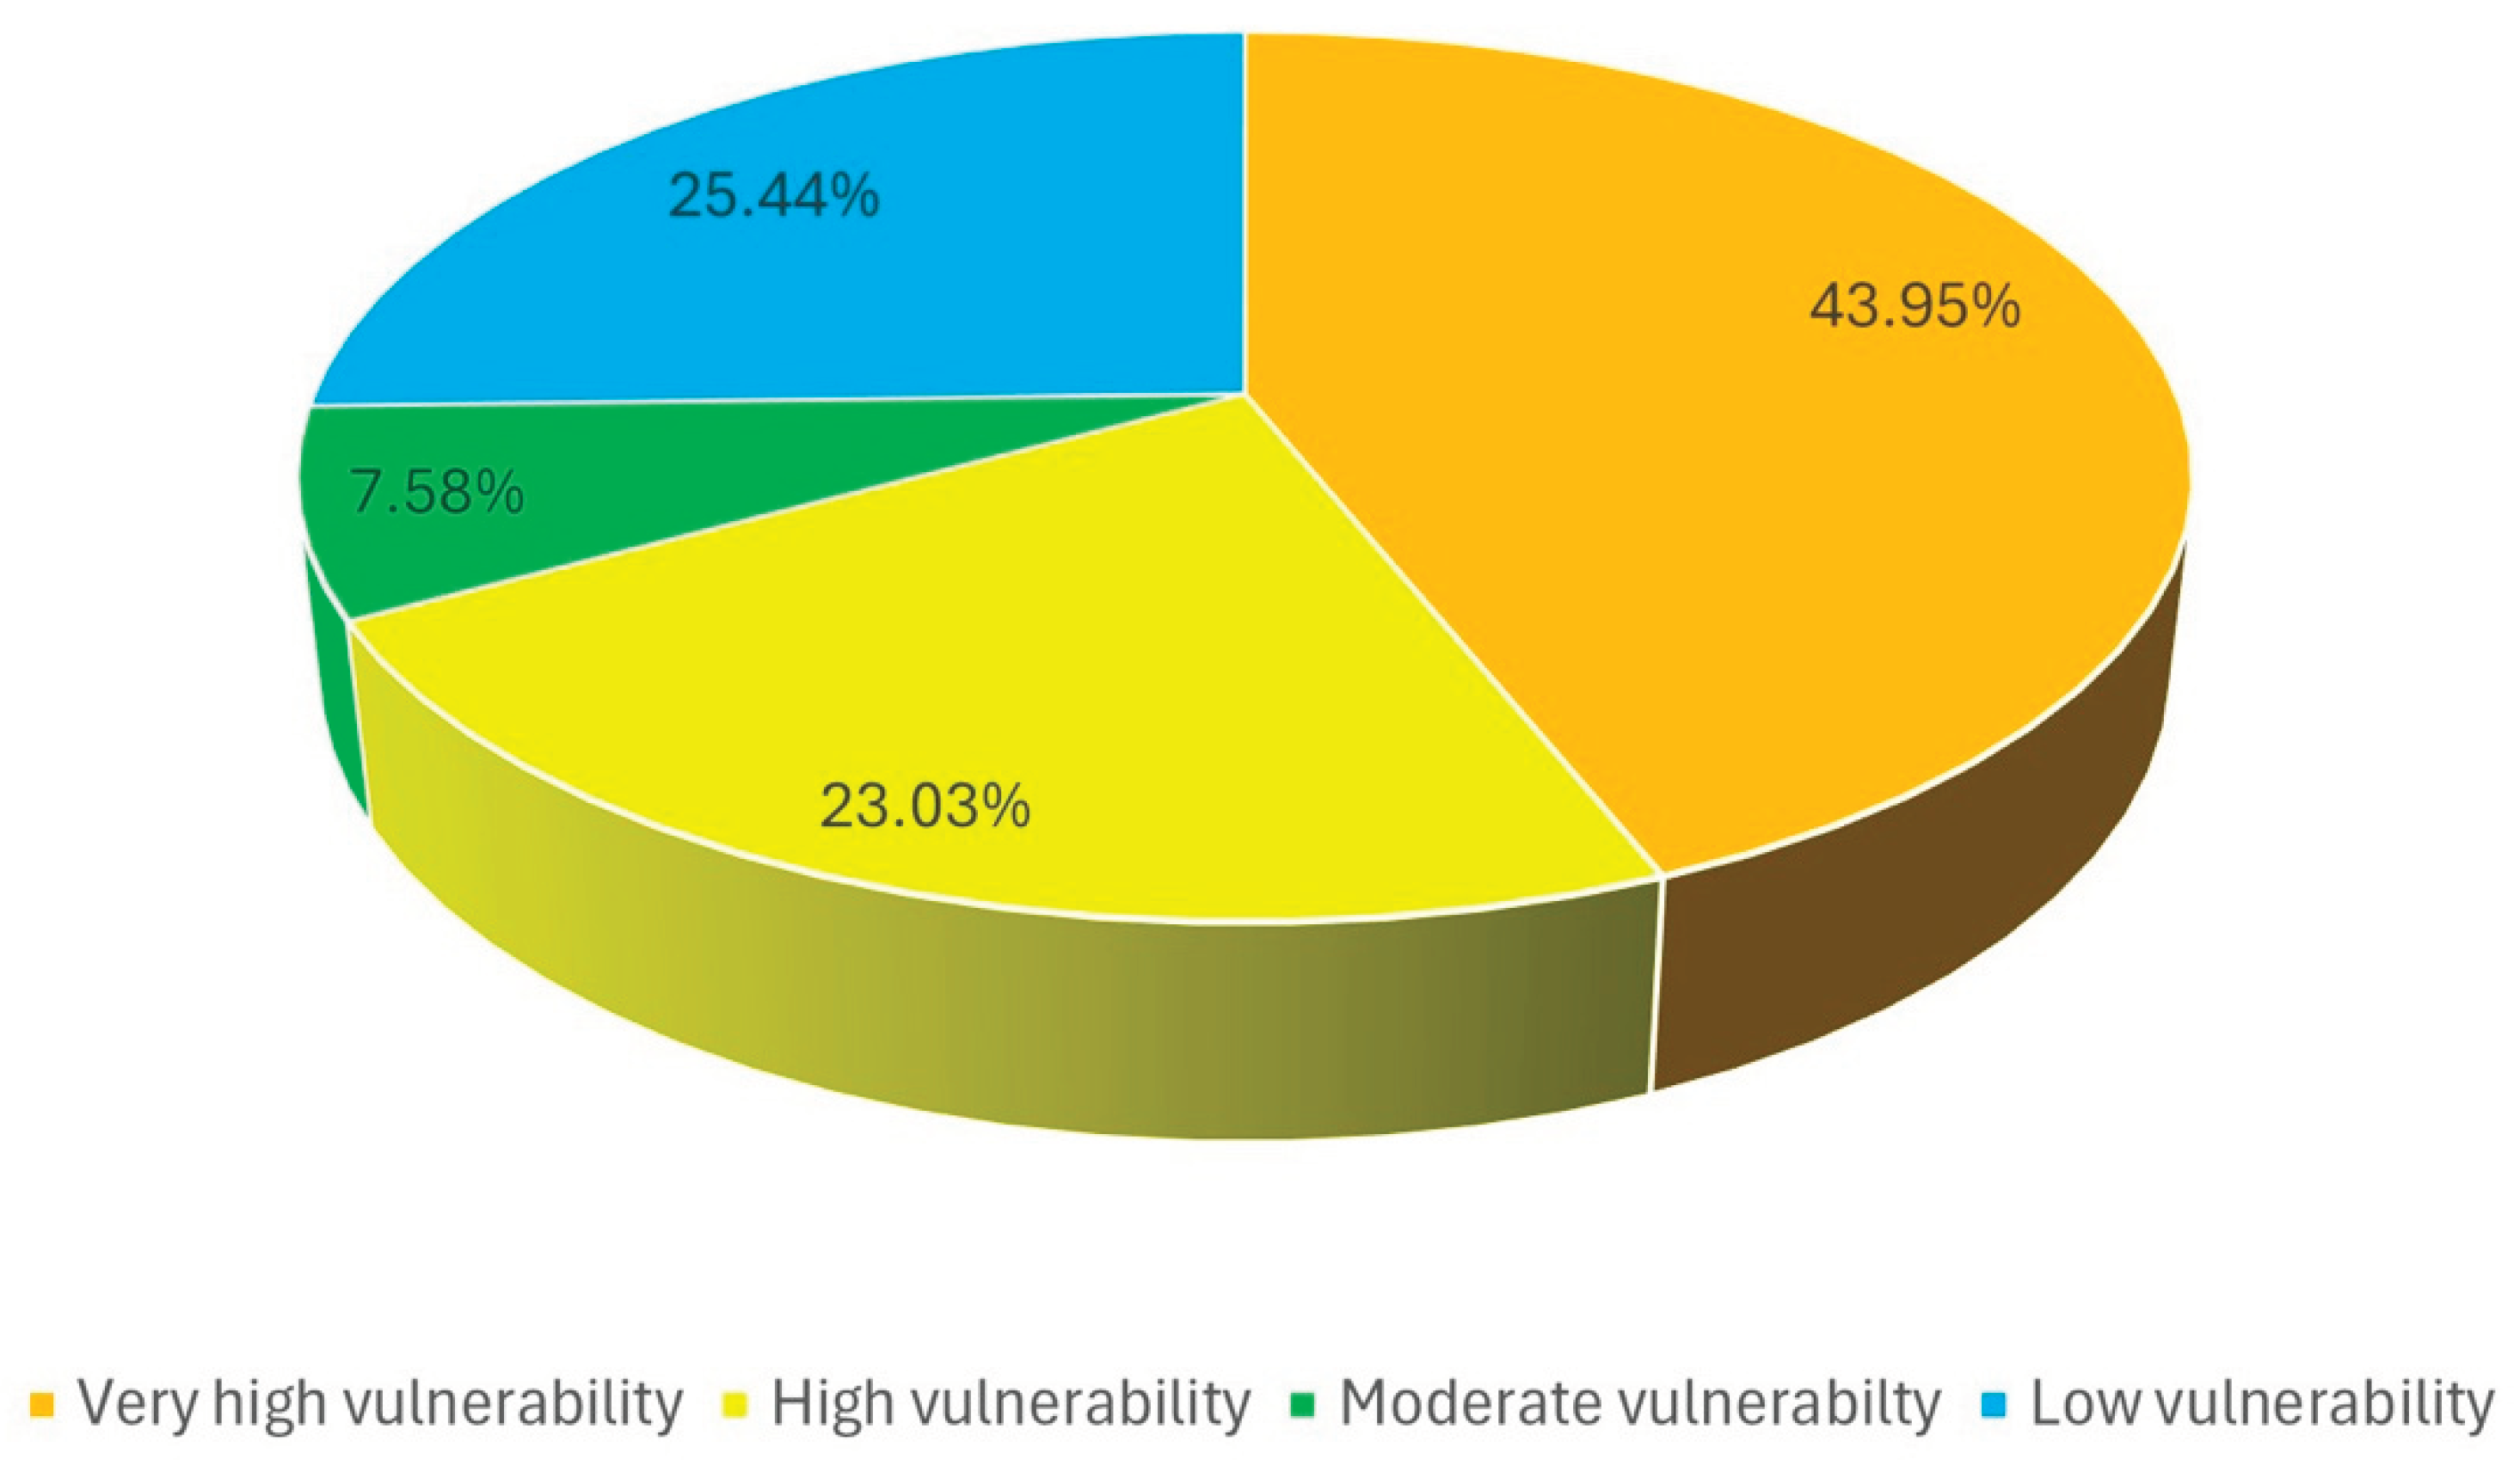
Figure 12.
Mean annual rates of change for the six beaches located on the coast of Casablanca.
| Specification | Descriptions |
| Cell size - X (meters) | 30 |
| Cell size - Y (meters) | 30 |
| Coordinate reference system | ESPG :6933 |
| Temporal resolution | Annual |
| Temporal range | 2000 - 2023 |
| Parent dataset | Landsat Collection 2 Surface Reflectance |
| Update frequency | Annual |
| Update latency | 6 months from end of previous year |
| Product types | Annual coastlines; Rate of change statistics |
| Product names | coastlines_v0.4.2_shorelines_annual; coastlines_v0.4.2_rates_of_change |
| Data types | Shapefiles : polylines and points |
Table 2.
Variables used to calculate the Coastal vulnerability index. .
| ID | Variable | Ranking of Coastal Vulnerability Index | |||
| Low | Moderate | High | Very High | ||
| 1 | 2 | 3 | 4 | ||
| V1 | Coastal Geomorphology | Rocky areas: quartzites, Greywackes and shales | Calcarenite dunes, protected sandy beaches | Sandy beaches | |
| V2 | Coastal Slope (%) | >12 | 8-12 | 4-8 | 0-4 |
| V3 | Altitude (m) | >9 | 6-9 | 3-6 | 0-3 |
| V4 | Shoreline dynamics (m/yr) | > +1 – > 0 | < 0 – ≥-1 | <-1 – ≥-2 | <-2 |
Disclaimer/Publisher’s Note: The statements, opinions and data contained in all publications are solely those of the individual author(s) and contributor(s) and not of MDPI and/or the editor(s). MDPI and/or the editor(s) disclaim responsibility for any injury to people or property resulting from any ideas, methods, instructions or products referred to in the content. |
© 2025 by the authors. Licensee MDPI, Basel, Switzerland. This article is an open access article distributed under the terms and conditions of the Creative Commons Attribution (CC BY) license (http://creativecommons.org/licenses/by/4.0/).
Copyright: This open access article is published under a Creative Commons CC BY 4.0 license, which permit the free download, distribution, and reuse, provided that the author and preprint are cited in any reuse.


