Submitted:
10 May 2025
Posted:
13 May 2025
You are already at the latest version
Abstract
The increasing scarcity of potable water necessitates innovative solutions to harness atmospheric moisture. This study focuses on the optimization of a regenerative atmospheric water generator (AWG) using computational fluid dynamics (CFD) simulations. The AWG operates on the principle of condensation, where humid air is cooled below its dew point to extract water. By employing CFD simulations, we analyze the airflow dynamics, heat transfer, and condensation processes within the AWG system. The study explores various design parameters, including the geometry of the cooling coils, the placement of thermoelectric coolers, and the efficiency of heat sinks. The simulation results indicate that optimizing these parameters can significantly enhance the water extraction rate and energy efficiency of the AWG. The findings provide valuable insights for the development of cost- effective and sustainable water generation technologies, particularly in arid and semi- arid regions.
Keywords:
CFD Simulation
1. Introduction
Water scarcity is a pressing global issue, with over two billion people living in regions experiencing high water stress. Atmospheric Water Generators (AWGs) present a promising solution by extracting water vapor from the air and converting it into liquid water. This technology is particularly valuable in arid and semi-arid regions where traditional water sources are limited or unreliable.
Regenerative AWGs operate on the principle of cooling humid air below its dew point to induce condensation. This process involves complex interactions of airflow dynamics, heat transfer, and condensation, which can be effectively analyzed and optimized using Computational Fluid Dynamics (CFD) simulations. CFD is a powerful tool that enables the detailed study of fluid flow and heat transfer phenomena within the AWG system, providing insights into the effects of various design parameters and operational conditions.
In this study, we aim to optimize the performance of a regenerative AWG using CFD simulations. By exploring different configurations of cooling coils, thermoelectric coolers, and heat sinks, we seek to enhance the water extraction rate and energy efficiency of the system.
2. Literature Survey
Computational Fluid Dynamics Study of an Atmospheric Water Generator-Aina
Olaoluwa: In this study, An Atmospheric Water Generator (AWG) is a device that extracts water from humid air by cooling it below the dew point, compressing the air, or exposing the air to hygroscopic substances. The AWG incorporates the concept of evaporation and condensation to condense water vapor from humid air. [1]
Atmospheric Water Generation: Concepts And Challenges - RaveeshG. , Goyal ,Rahul , Tyagi,SK : In this study, The active refrigeration approach is straightforward, which is based on well-established cooling technology. If moisture-laden air is drawn past an actively cooled coil, fin, or surface that is maintained below its dew-point temperature, condensation occurs. To facilitate a continuous process, as the air comes in contact with the cooling heat exchanger surface, the latent heat load must be continuously removed by the underlying cooling fluid (i.e., chilled water or an evaporating refrigerant).
The amount of water generation depends on many factors such as the air flow rate, heat exchanger effectiveness, cooling capacity, temperature, and humidity of the inlet air. Performance evaluation of AWG systems shows that it attains optimal performance under hot and humid conditions with minimum ambient dew point temperature. [2]
Atmospheric Water Generation: Concepts And Challenges: Raveesh, G. , Goyal,Rahul , Tyagi, S K – In this study, The main performance indicators of AWG systems are the water generation rate (L/h) and specific energy consumption (Wh/L). The main limitations of active refrigeration systems are their inability to work under low RH conditions and their high specific energy consumption requirements under unfavorable climate conditions. The sensible load on the AWG system due to the larger temperature difference between the air and its dew point represents an overburden to the AWG system; in that type of climate a lot of energy is required just to pre-cool the air to its dew point.
In addition, when the dew point temperature falls below 0°C under cold and dry conditions the cooling coils become covered with frost, which adds resistance to the heat and mass transfer rates and significantly reduces the efficiency of the AWG system. Small-scale portable AWG systems can be designed and fabricated, particularly for army or emergency applications but their scalability is limited. Overall, the active refrigeration AWG configuration is best employed in hot and humid climates and should be avoided in dry and cold climates due to the drastic performance degradation under unfavorable climate conditions [3].
Optimal design of an atmospheric water generator AWG - Sri Suryaningsih, Otong Nurhilal: In this study, Efficiency analysis and optimization strategies are discussed, with case studies demonstrating successful applications. The study identifies existing barriers and limitations, emphasizing the need for innovative modeling approaches and further research to drive technical improvements and environmental sustainability [4].
CFD Simulation and Optimization of Atmospheric Water Generator for Enhanced Performance- Tahereh B. Gorji : In this study , Atmospheric Water Generation (AWG) technologies offer a promising solution to address water scarcity issues. However, their economic viability depends on two critical factors: distance from the coast or water-rich regions and electricity costs. Atmosphere contains large amount of water in the form of vapor, moisture etc.
Within those amounts almost 30 % of water is wasted. This amount of water can be used by implementing a device like Atmospheric Water Generator. This device is capable of converting atmospheric moisture directly into usable and even drinking water. The device uses the principle of latent heat to convert water vapour molecules into water droplets [5].
Optimization of Regenerative Atmospheric Water Generator using CFD Simulation and Genetic Nafise Shafeian , A.A. Ranjbar :The goal is to obtain that specific temperature (dew point temperature) practically or experimentally to condense water with the help of some electronics devices, which are used to create the environment of water condensing temperature or dew point, indeed conventional compressor and evaporator system could also be used to condense water by simply exchanging the latent heat of coolant inside the evaporator. The condensed water will be collected to use for drinking purpose and various other uses [6].
3. Objectives and Methodology
- ➢
- Develop a CFD Model: Developing a CFD model to simulate the heat and mass transfer processes in regenerative AWG systems.
- ➢
-
Investigate Effects of Operating Conditions: Investigating the effects of operating conditions, such as temperature, air flow rate, number of passages on regenerativeAWG system performance.
- ➢
- Change of temperature of moisture inflow & change of velocity of moisture increases the net gain of water generation.
- ➢
- Validation of CFD Model: Validating the CFD model using simulated data to ensure accuracy and reliability.
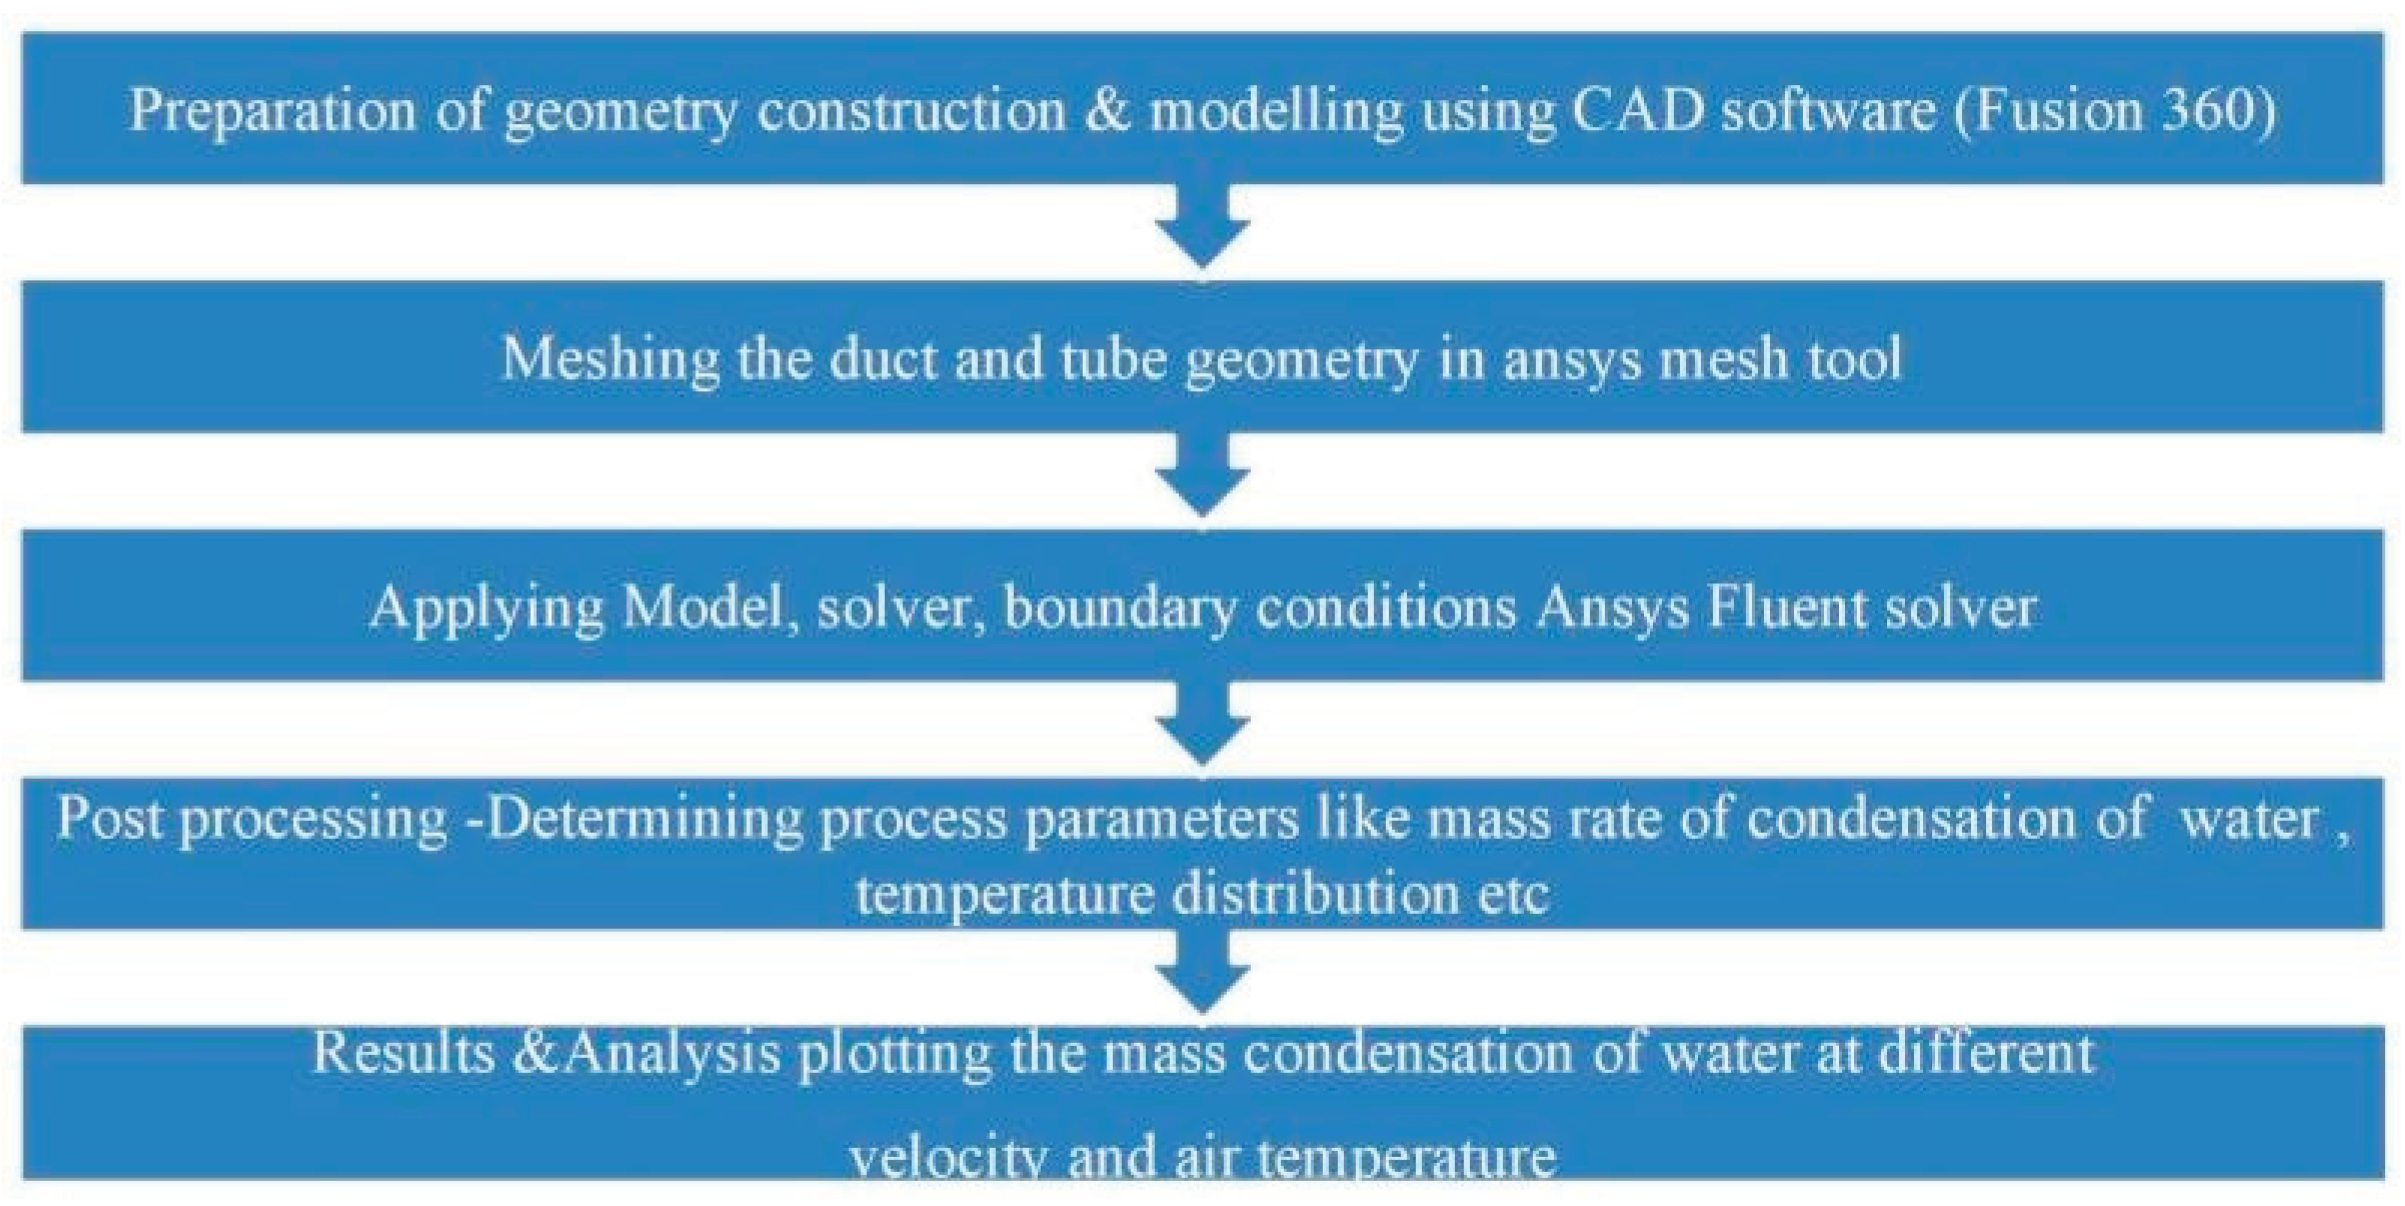
CFD Modeling:-
- ➢
- In CFD software ( ANSYS Fluent) create a 3D model of the regenerative AWG system.
- ➢
- Define the geometry, mesh, and boundary conditions for the CFD model.
- ➢
- Implement the necessary physics models, such as heat transfer, mass transfer, and fluid dynamics. Optimization of Regenerative Atmospheric Water Generator using CFD Simulation .
Figure 1.
3D Model of the Duct and Tube Assembly with symmetry.
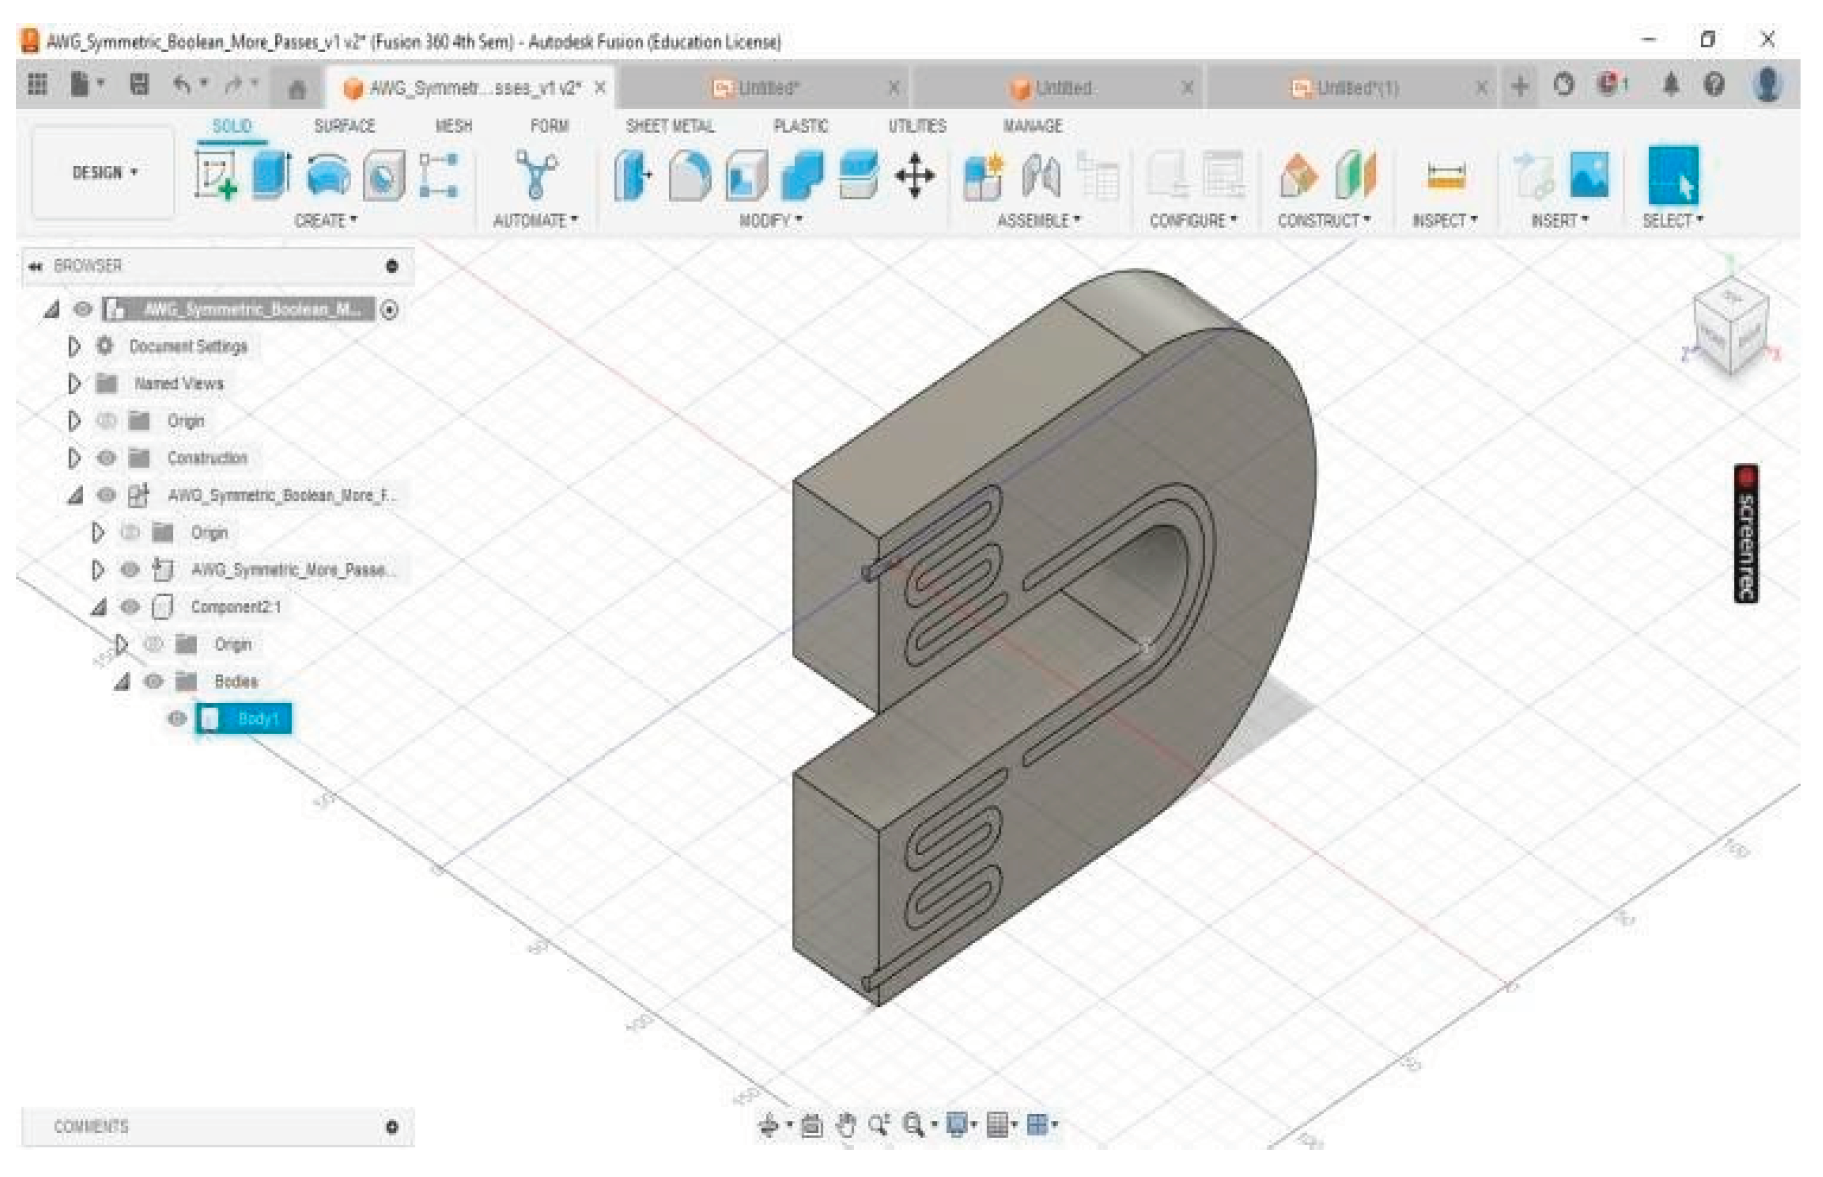
Figure 2.
Draft of the CAD Model of the assembly with symmetry.
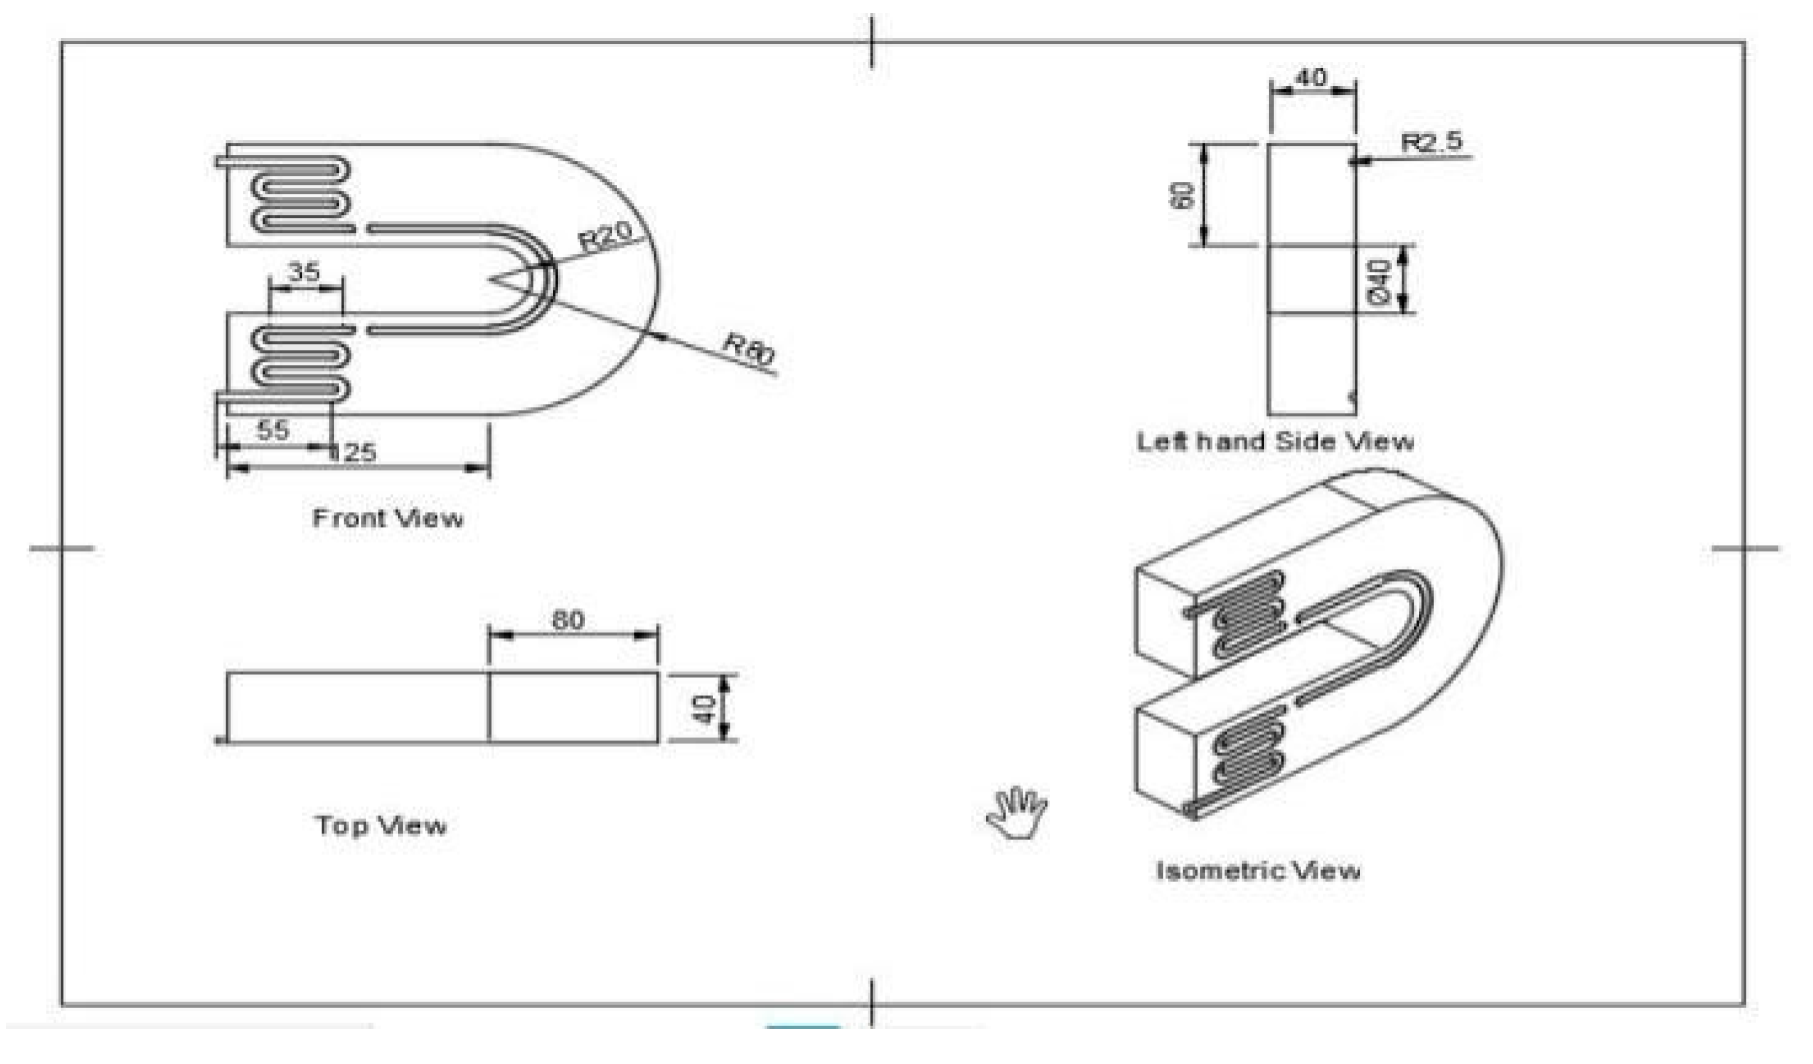
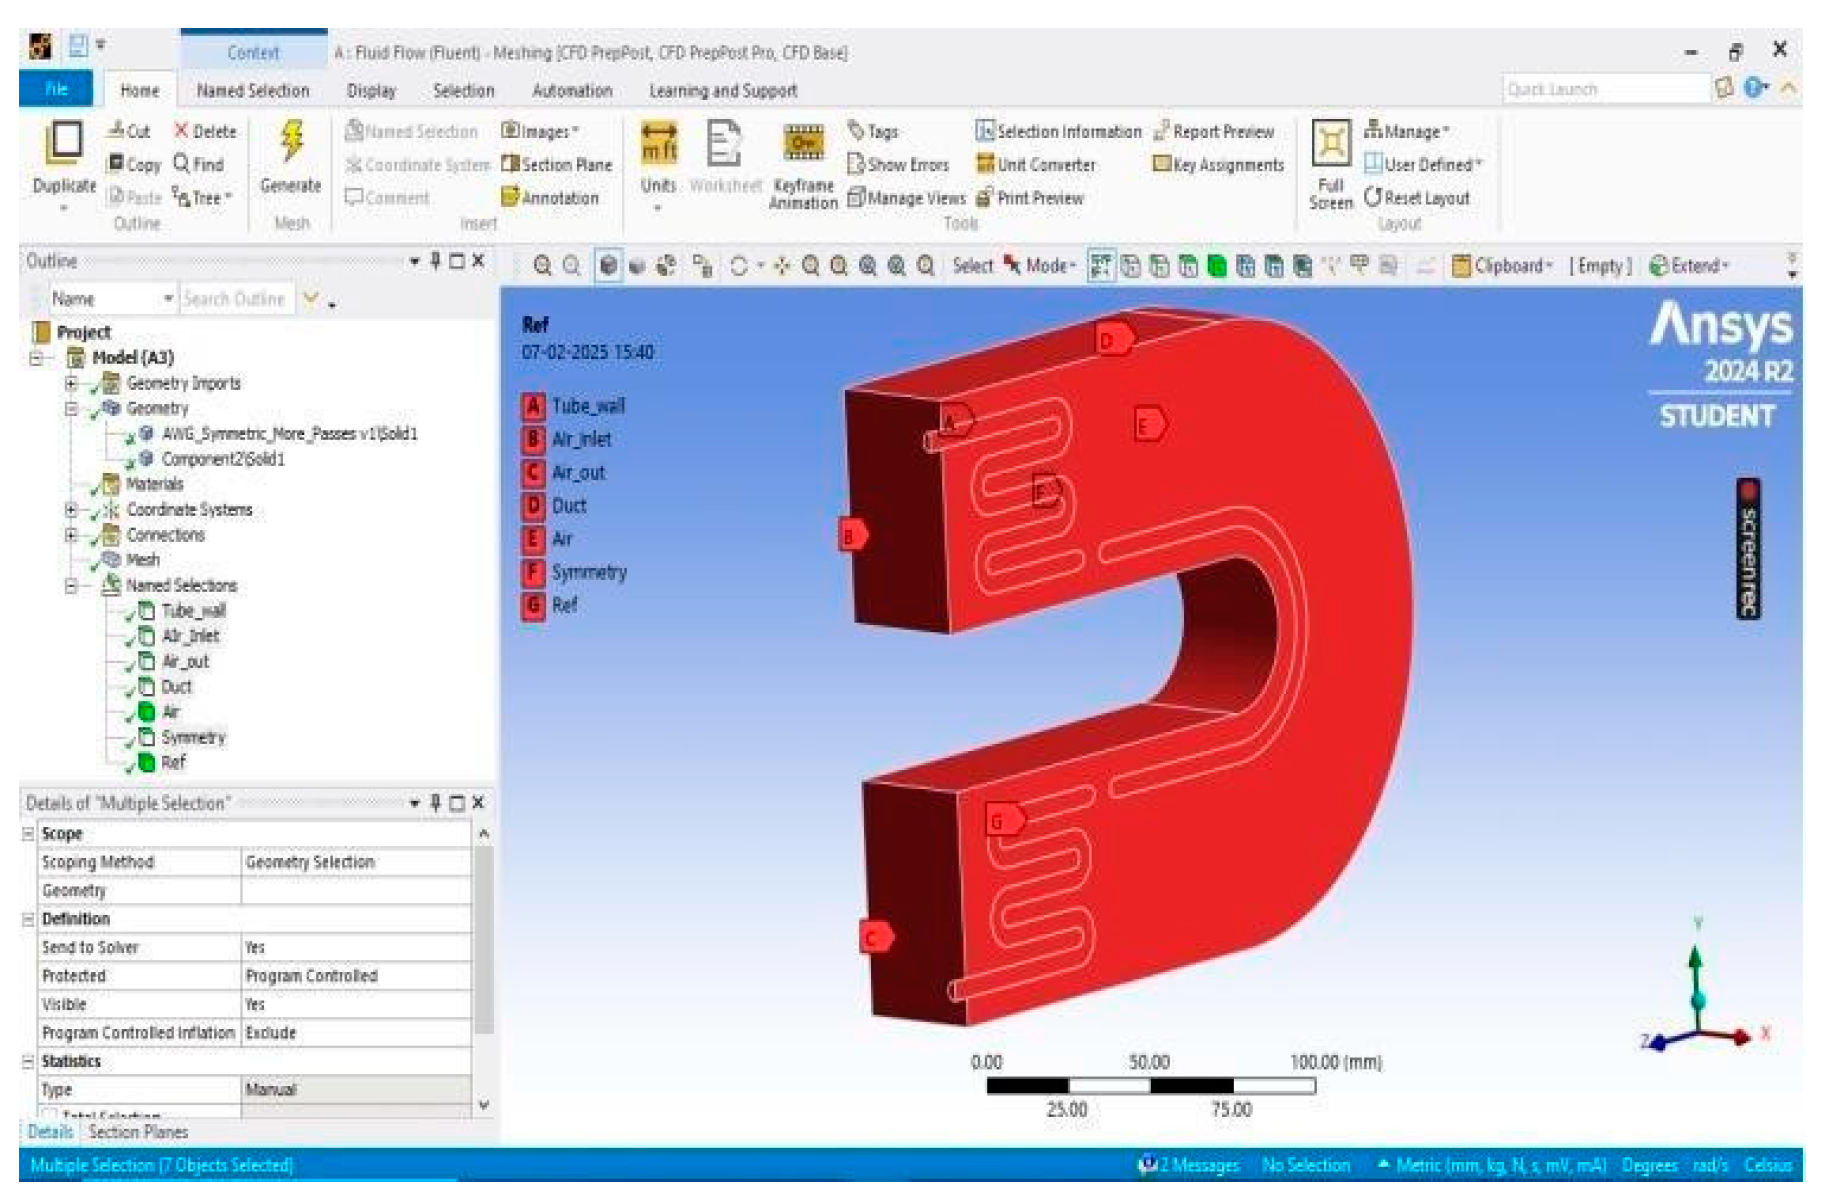
Figure 3.
Creating name selections for assigning boundary conditions.
Simulation and Analysis :-
- ➢
- Run CFD simulations for various operating conditions, such as temperature, number of passages, and air flow rate.
- ➢
- Analyze the simulation results, including water yield, energy consumption, and energy efficiency.
- ➢
- Investigate the effects of design parameters, such as geometry , evaporator & condenser design on system performance.
Figure 4.
Mesh view of the geometry.

Optimization:-
- ➢
- Define the optimization objective function, such as maximizing water yield or minimizing energy consumption.
- ➢
- Run the optimization objective to find the optimal design and operating conditions.
Validation and Verification:-
- ➢
- Validate the CFD model by comparing simulation results with existing research.
- ➢
- Verify the optimization results by running additional CFD simulations to ensure that the optimal design and operating conditions are indeed optimal.
CAD MODEL AND CFD SETUP OF REFRIGERATION SYSTEM
Step 1: Open Ansys workbench - open ansys fluent.
Step 2: Open import geometry into the project schematic and select the cad file.
Step 3: Open mesh in workbench - Create name selections as shown in Figure 3.
Assign air inlet, air outlet, symmetry, duct valve , air volume and refrigerant tube. Creating mesh[Statistics - Nodes 19413 and Elements 985356] .
Step 4: Open setup – General (solver pressure based) - time (transient) - gravity (Y- direction 9.81 m/s 2).
Open models - select volume of fluids – phases – air (primary phase) and water (secondary phase) – phase interaction – mass transfer mechanism (evaporation condensation) as inlet (air inlet) - momentum - velocity magnitude(2m/sec) and Thermal (300K). Outlet (air outlet) Symmetry (air and tube wall)
- temperature (278K) Wall (duct ) and tube- Mesh interfaces - contact regions - coupled wall.
Step 5 : Solutions - Methods - simple
Initialize - hybrid initialization. Run calculations - number of time steps (20) - iterations per time step
Energy (on) Viscous (SST- OMEGA) Materials - fluid (air , water , liquid) - solid (copper)
Cell zone condition - fluid - air water mixture Solid - refrigerant tube Boundary conditions.
(10) wait for the solution to converge.
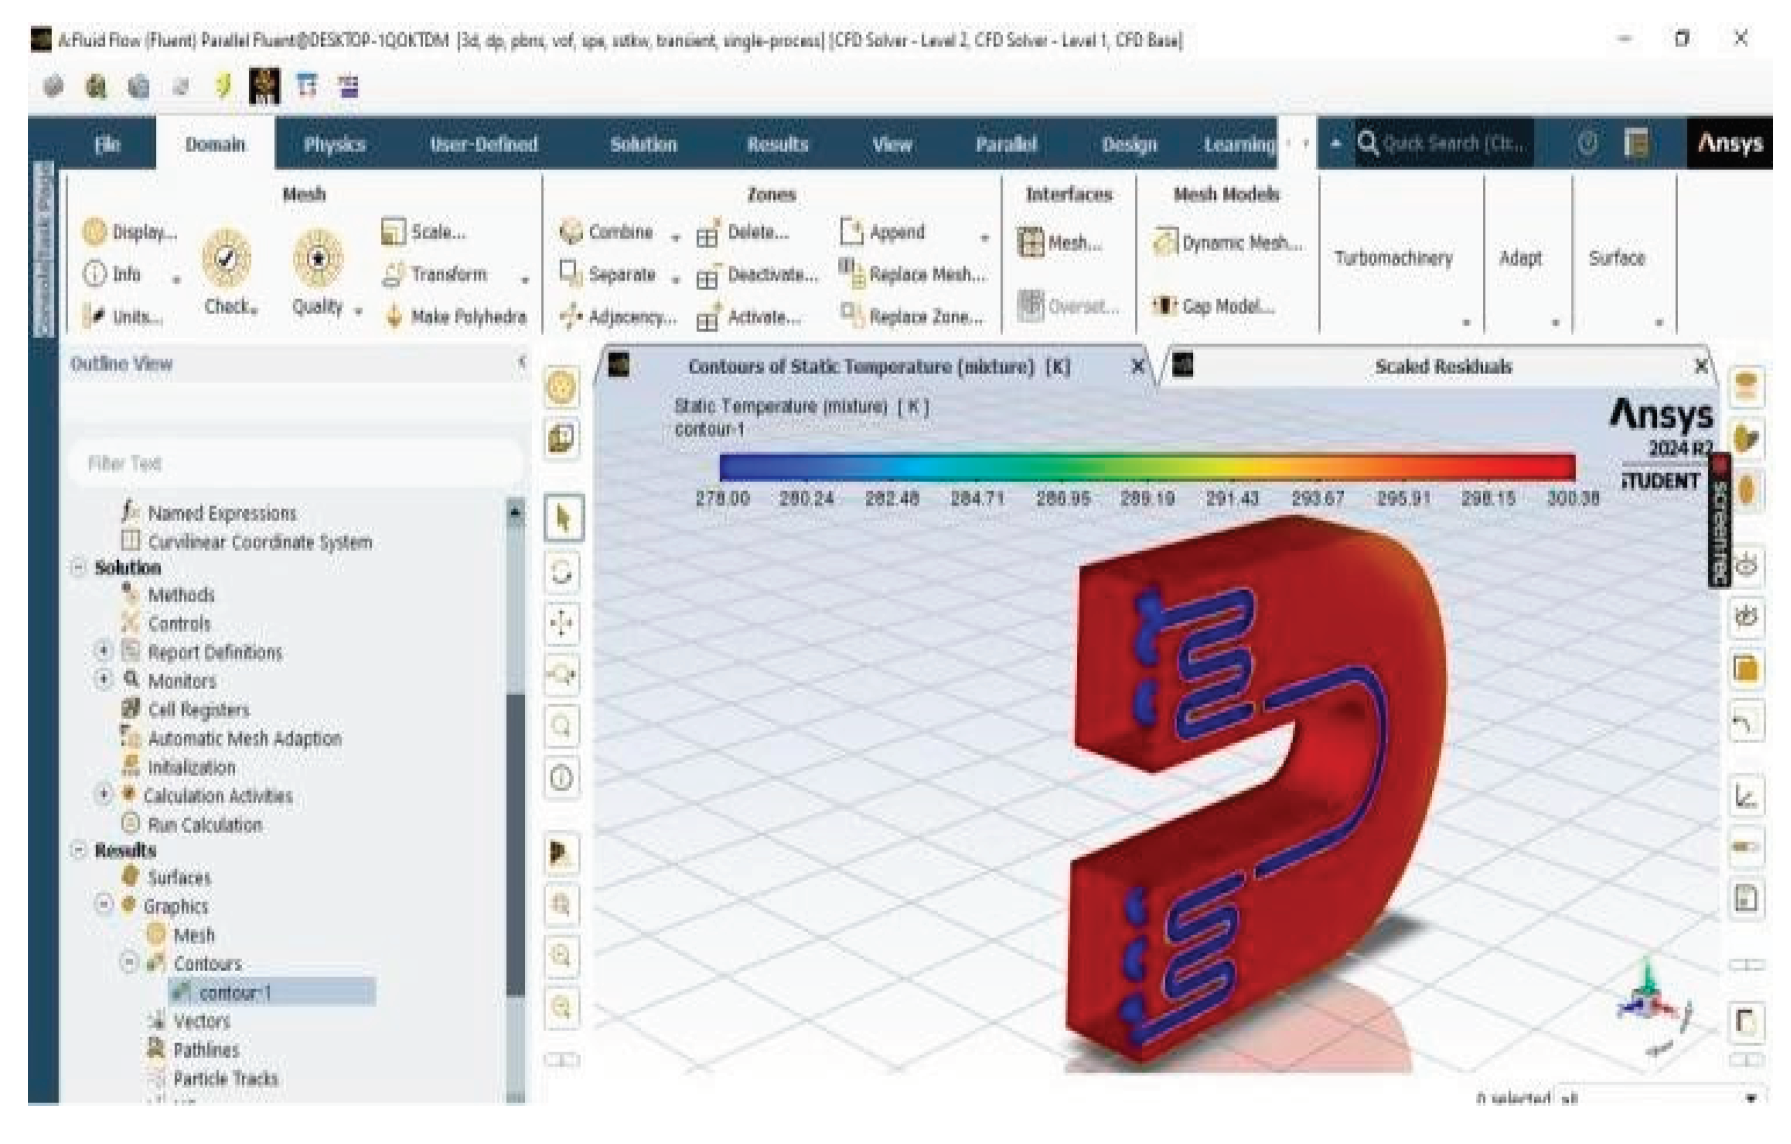
Figure 5.
Temperature distribution at the duct, tube wall and air tube interface.
4. Results and Discussion
For 2 m/s of air velocity :
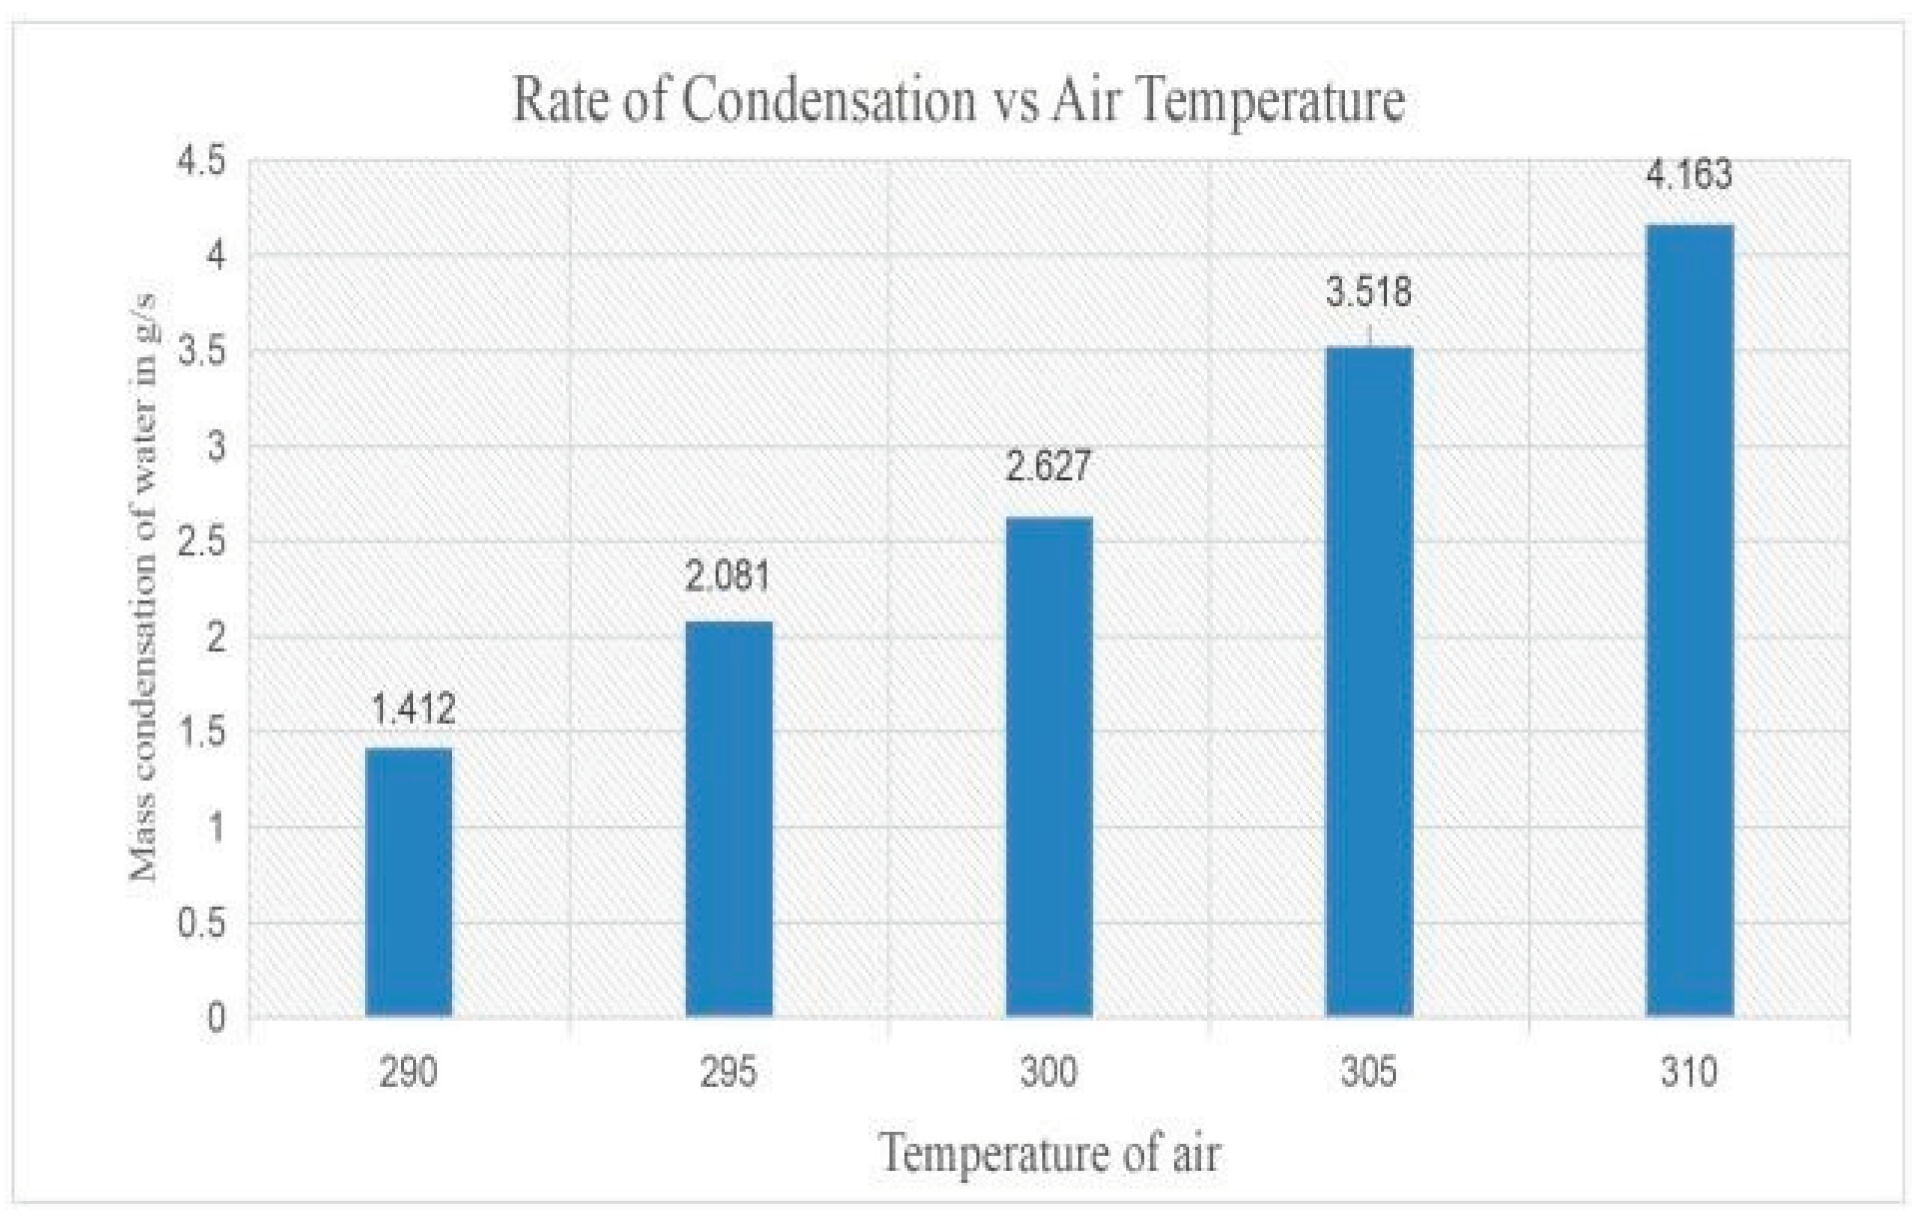
Graph 1.
Mass condensation of water in kg/s for 2m/s of air velocity.
- ➢
- At 290K, the condensation rate is 1.412 g/s
- ➢
- At 295, the condensation rate increases to 2.081 g/s
- ➢
- At 300K, the condensation rate further increases to 2.627 g/s
- ➢
- At 305K, the condensation rate is 3.518 g/s
- ➢
- At 310K, the condensation rate reaches 4.163 g/s.
For 4 m/s of air velocity:-
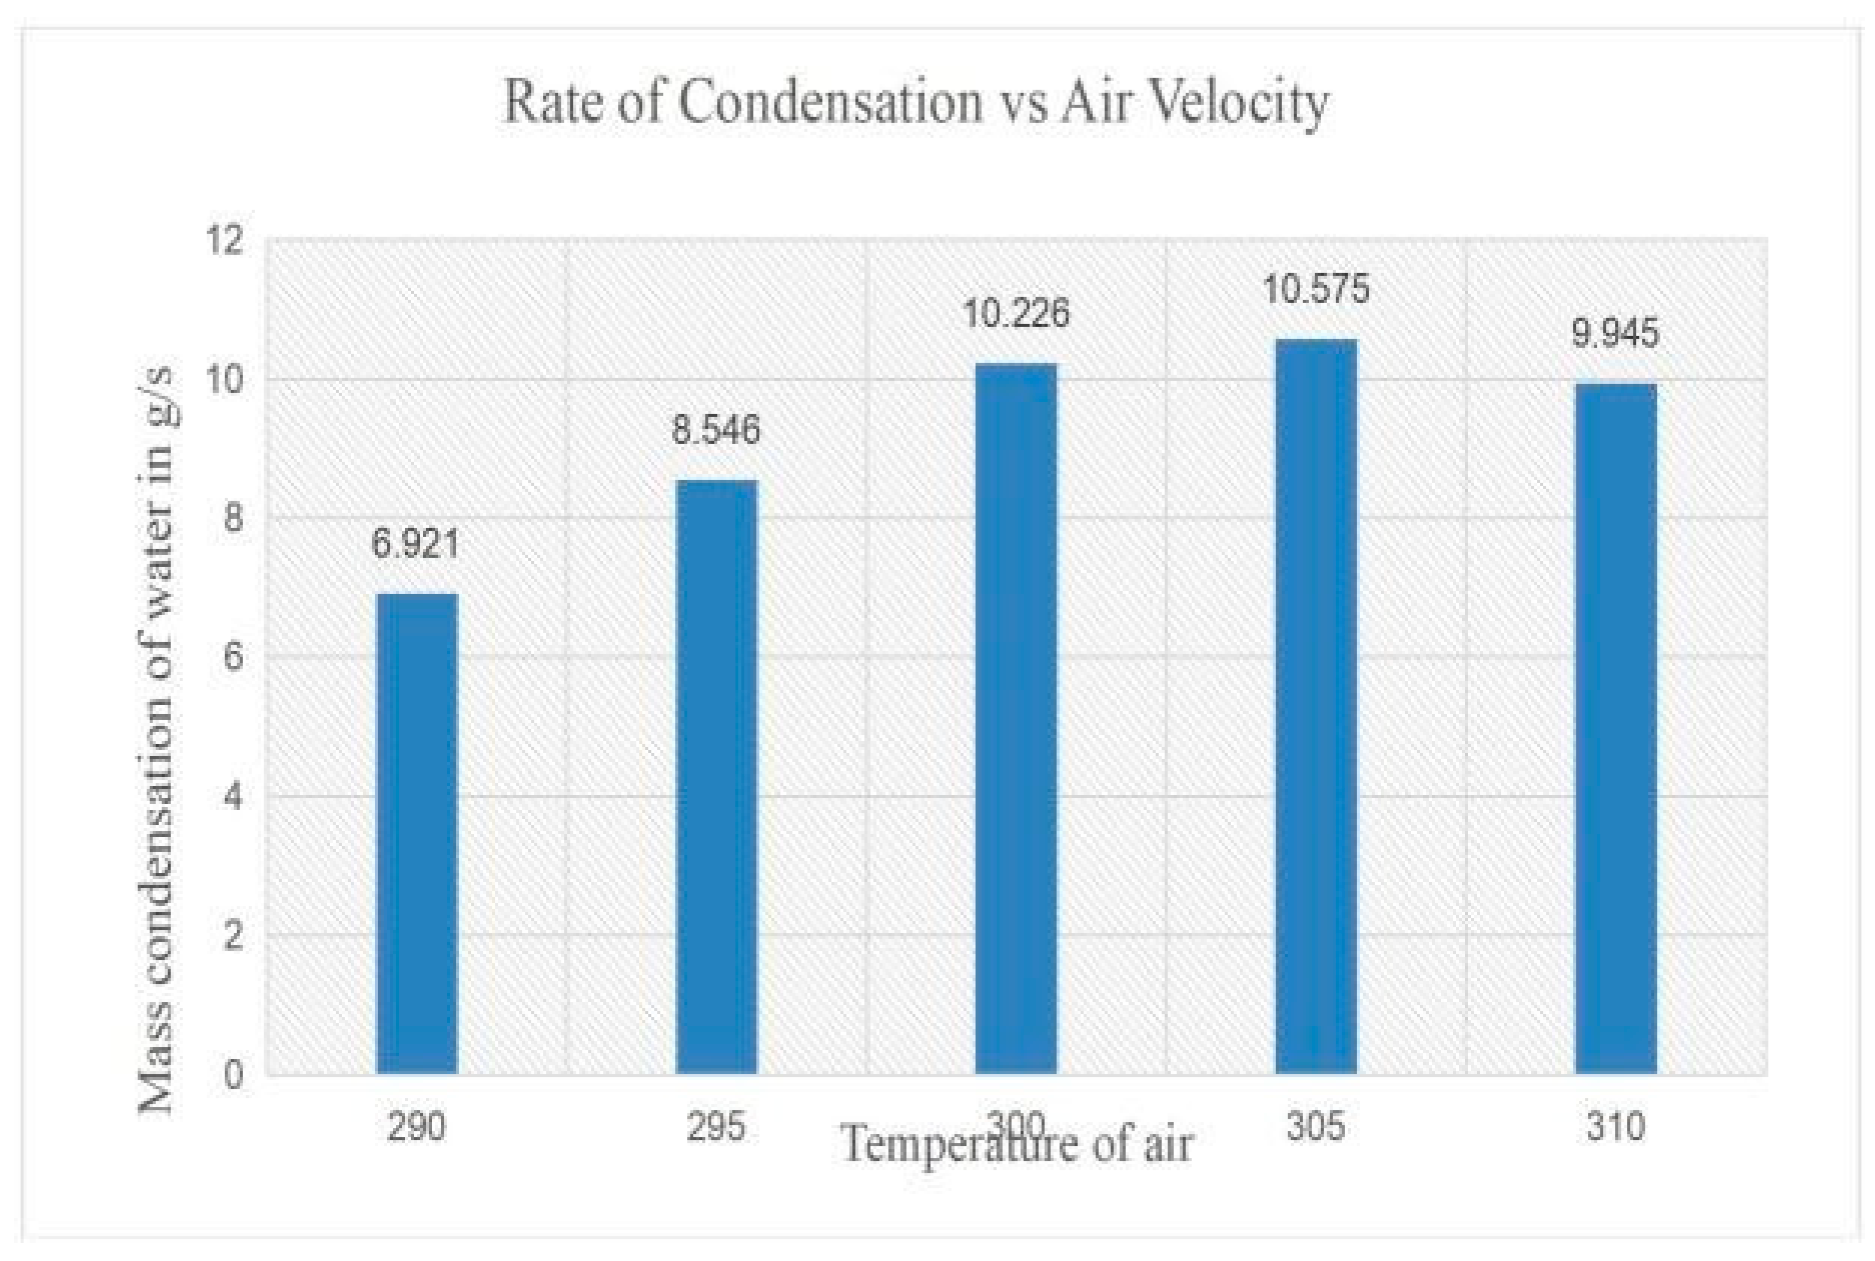
Graph 2 represents a non-linear relationship between the inlet air temperature and the water condensation rate. As the inlet air temperature increases, the condensation rate initially increases, reaches a peak, and then decreases.
- ➢
- At 290, the condensation rate is 6.921 g/s
- ➢
- At 295K, the condensation rate increases to 8.546 g/s
- ➢
- At 300K, the condensation rate further increases to 10.226 g/s
- ➢
- At 305K, the condensation rate reaches its peak at 10.575 g/s
- ➢
- At 310K, the condensation rate decreases to 9.945 g/s
Graph 2.
Mass condensation of water in kg/s for 4m/s of air velocity.
For 6m/s of air velocity :-
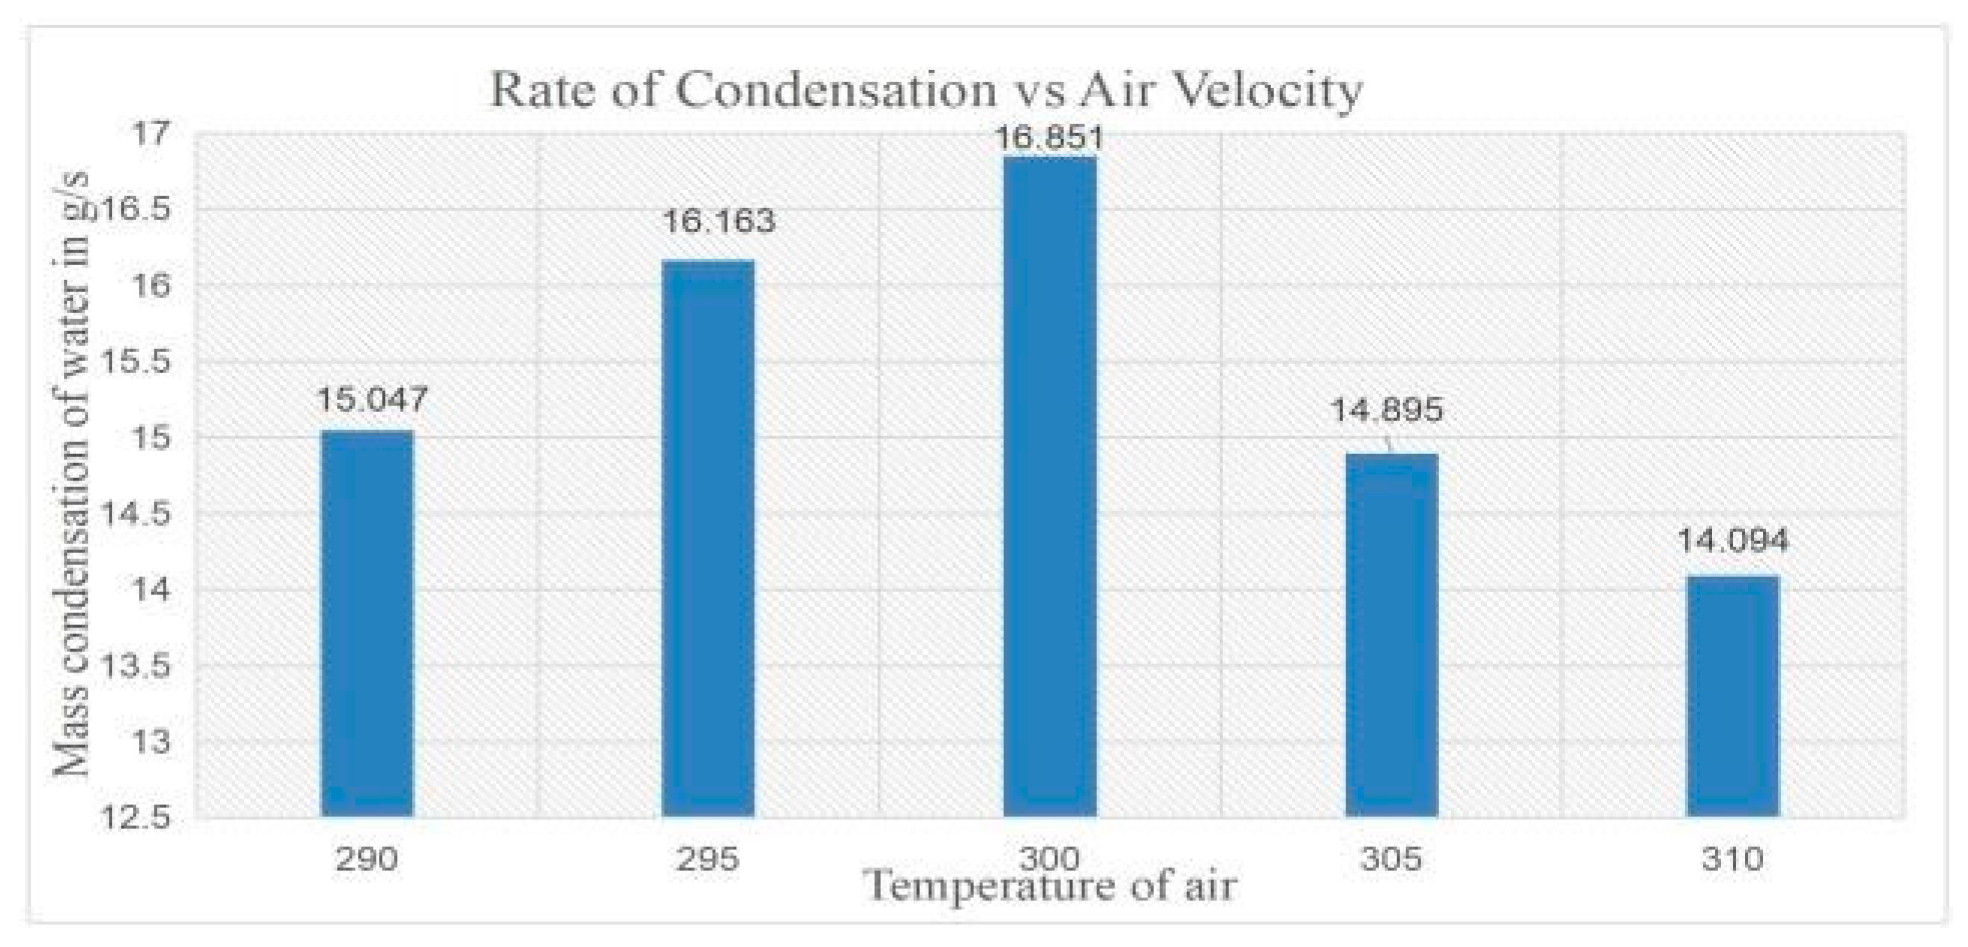
Graph 3 represents a non-linear relationship between the inlet air temperature and the water condensation rate. The condensation rate initially increases with temperature, reaches a peak, and then decreases.
Graph 3.
Mass condensation of water in kg/s for 6m/s of air velocity.
- ➢
- At 290K, the condensation rate is 15.047 g/s
- ➢
- At 295K, the condensation rate increases to 16.163 g/sOptimization of Regenerative Atmospheric Water Generator using CFD Simulation
- ➢
- At 300K, the condensation rate further increases to 16.851 g/s
- ➢
- At 305K, the condensation rate decreases to 14.895 g/s
- ➢
- At 310K, the condensation rate decreases further to 14.094 g/s.
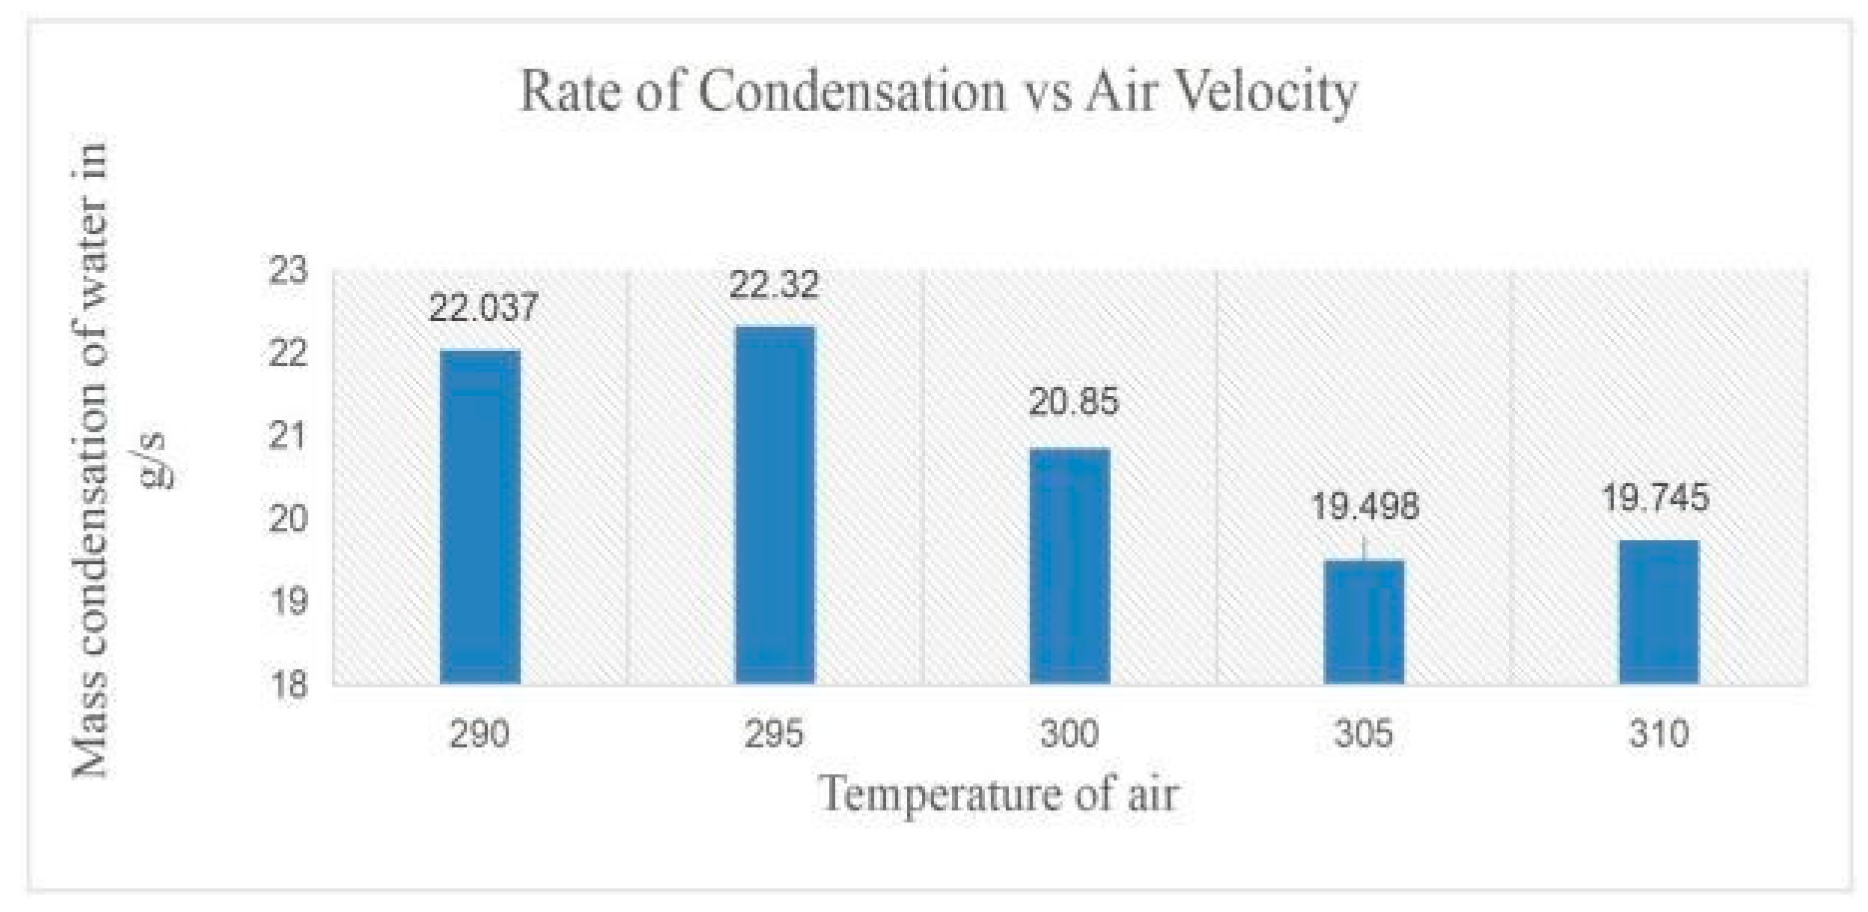
For 8m/s of air velocity :-
Graph 4 shows a non-linear relationship between the inlet air temperature and the water condensation rate. The condensation rate initially increases with temperature, reaches a peak, and then decreases.
Graph 4.
Mass condensation of water in kg/s for 8m/s of air velocity.
- ➢
- At 290K, the condensation rate is 22.037 g/s
- ➢
- At 295K, the condensation rate increases to 22.32 g/s
- ➢
- At 300K,the condensation rate decreases to 20.85 g/s
- ➢
- At 305K, the condensation rate decreases further to 19.498 g/s.
- ➢
- At 310K, the condensation rate increases slightly to 19.745 g/s.
For 10 m/s of air velocity:-
Graph 5.
Mass condensation of water in kg/s for 10m/s of air velocity.
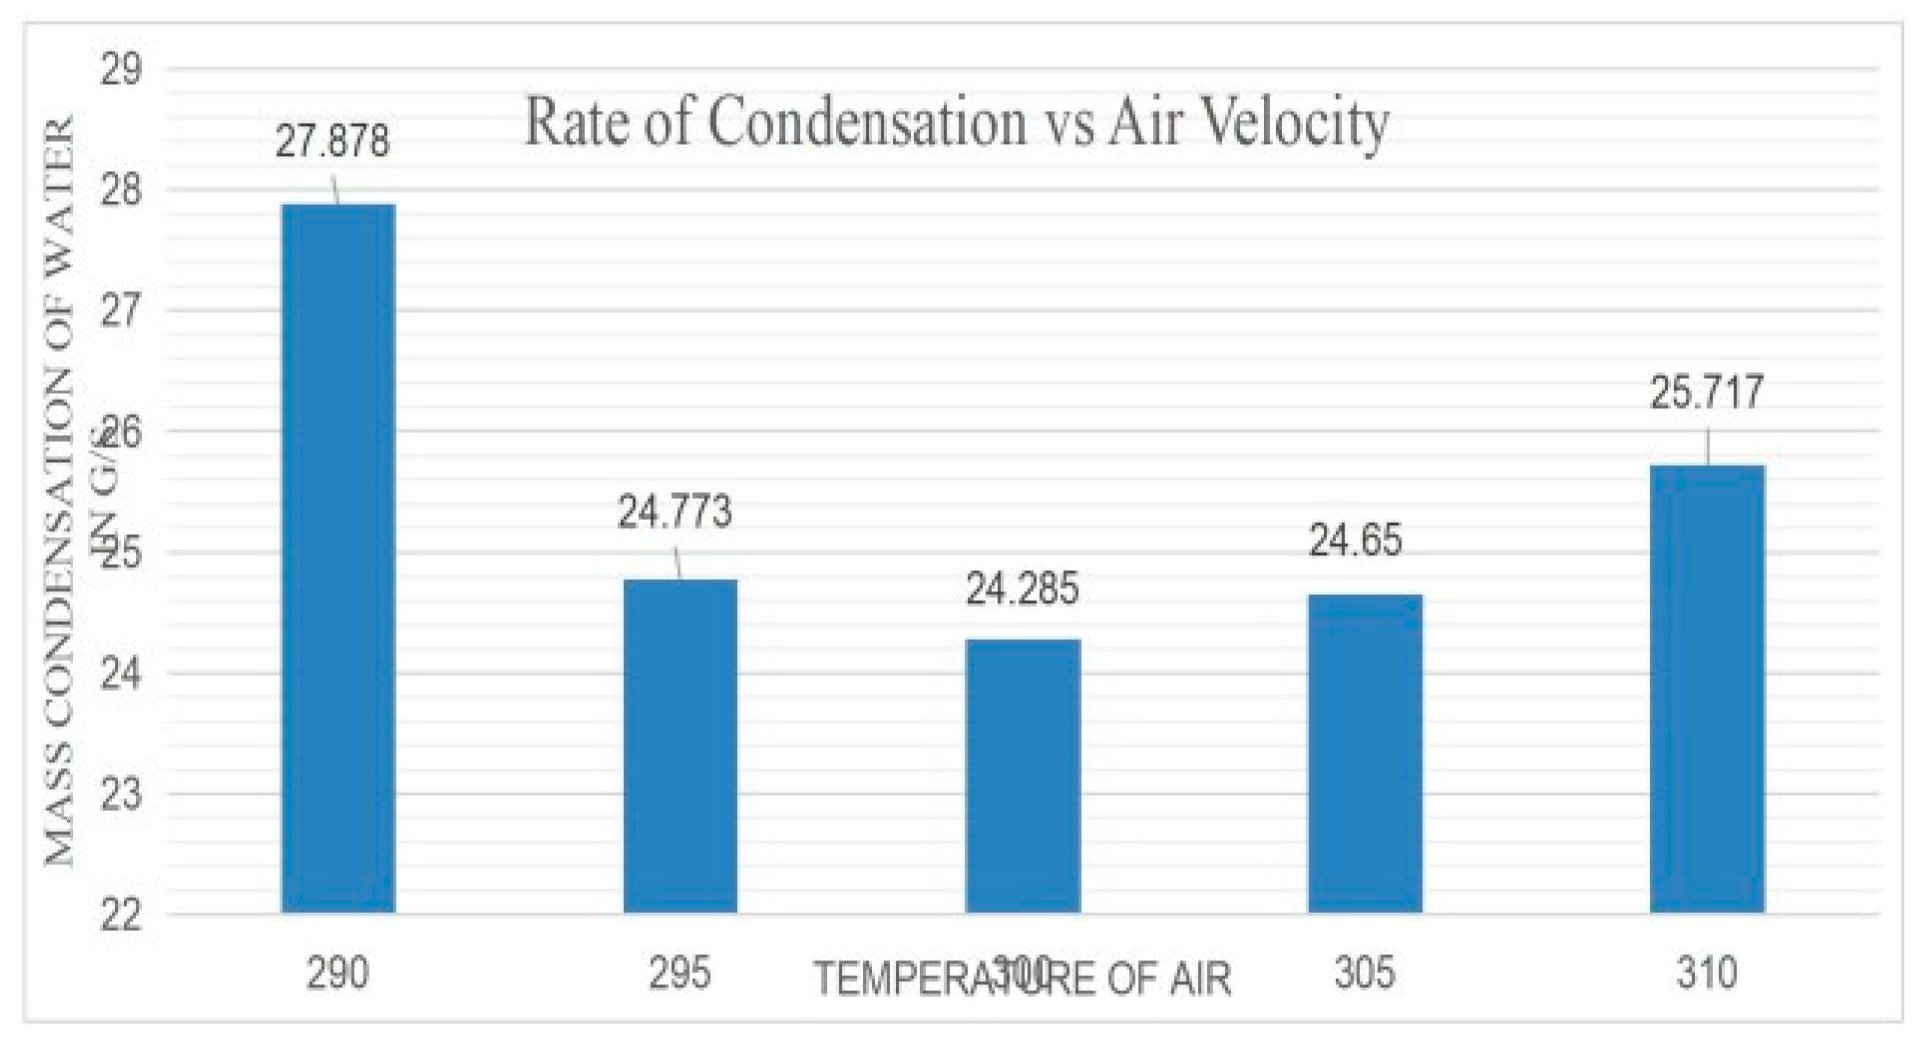
The condensation rate initially decreases with increasing temperature, reaches a minimum, and then increases.
- ➢
- At 290K, the condensation rate is 27.878 g/s.
- ➢
- At 295K, the condensation rate decreases to 24.773 g/s.
- ➢
- At 300K, the condensation rate decreases further to 24.285 g/s.
- ➢
- At 305K, the condensation rate increases to 24.65 g/s.
- ➢
- At 310K, the condensation rate increases further to 25.717 g/s.
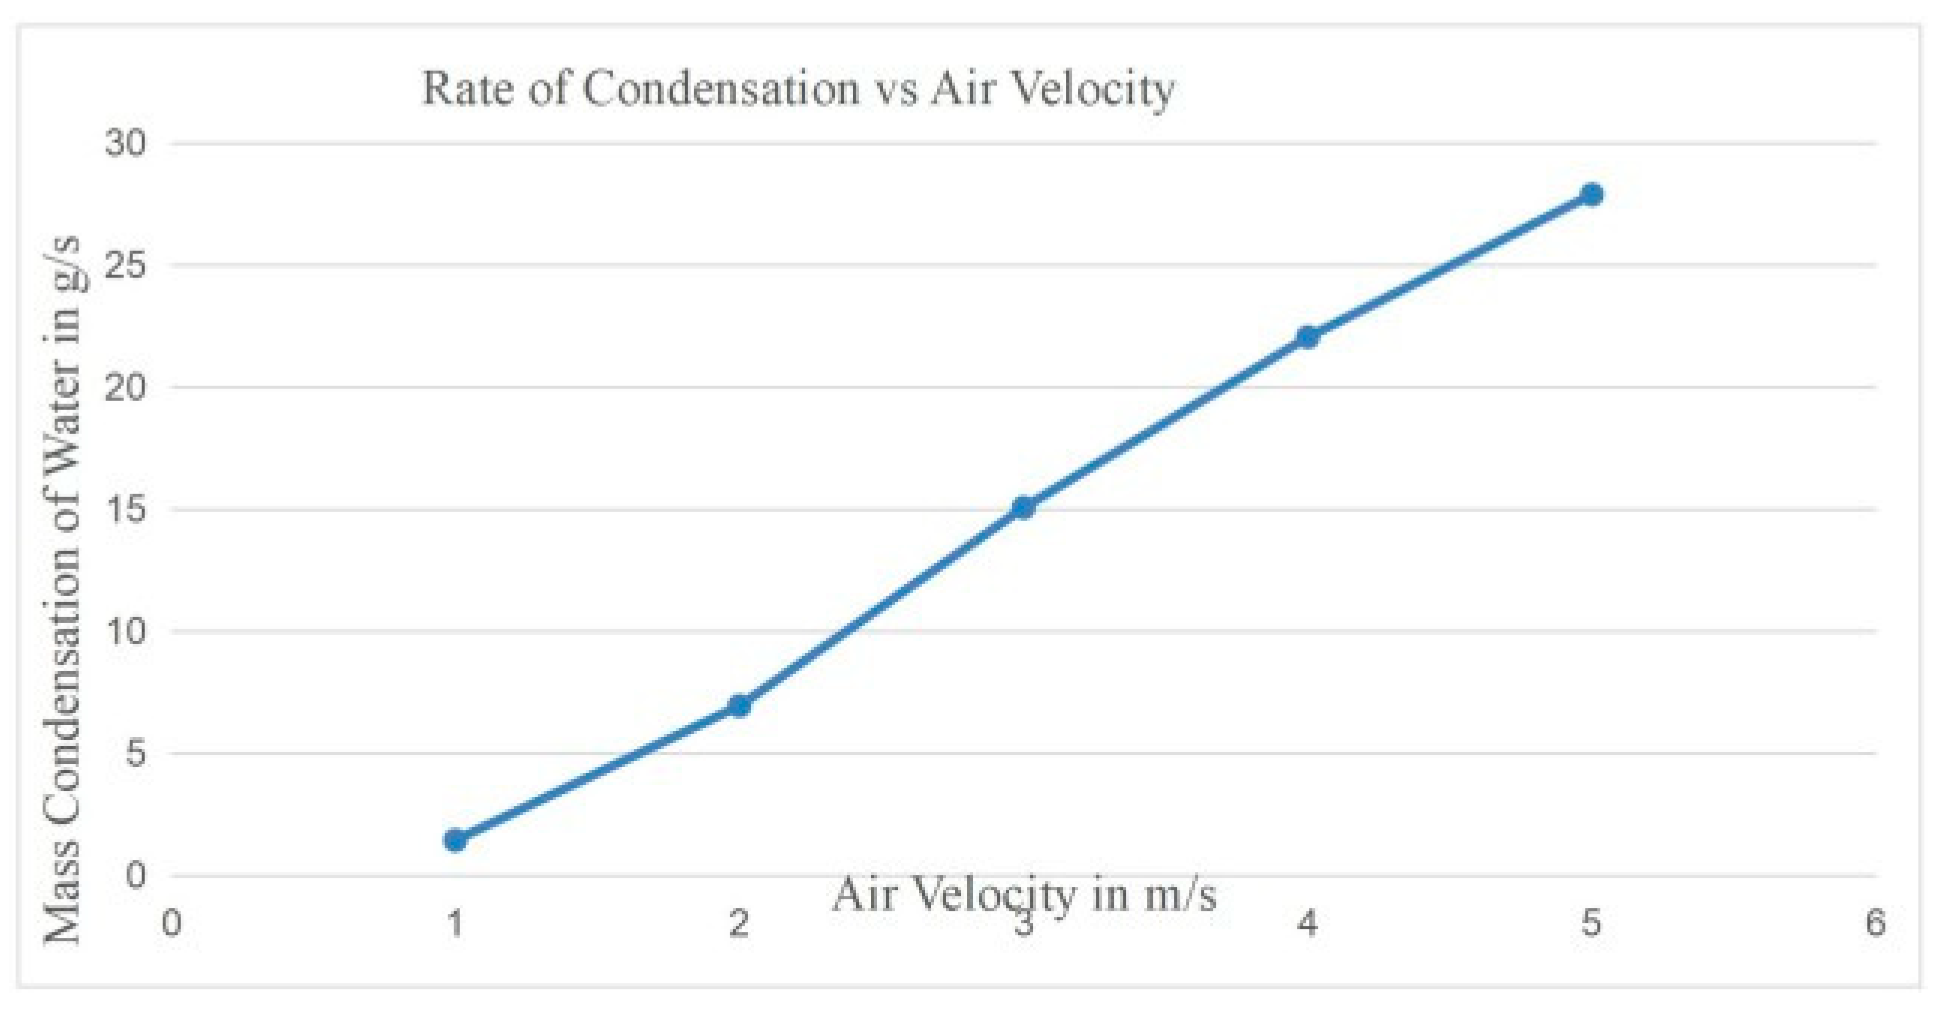
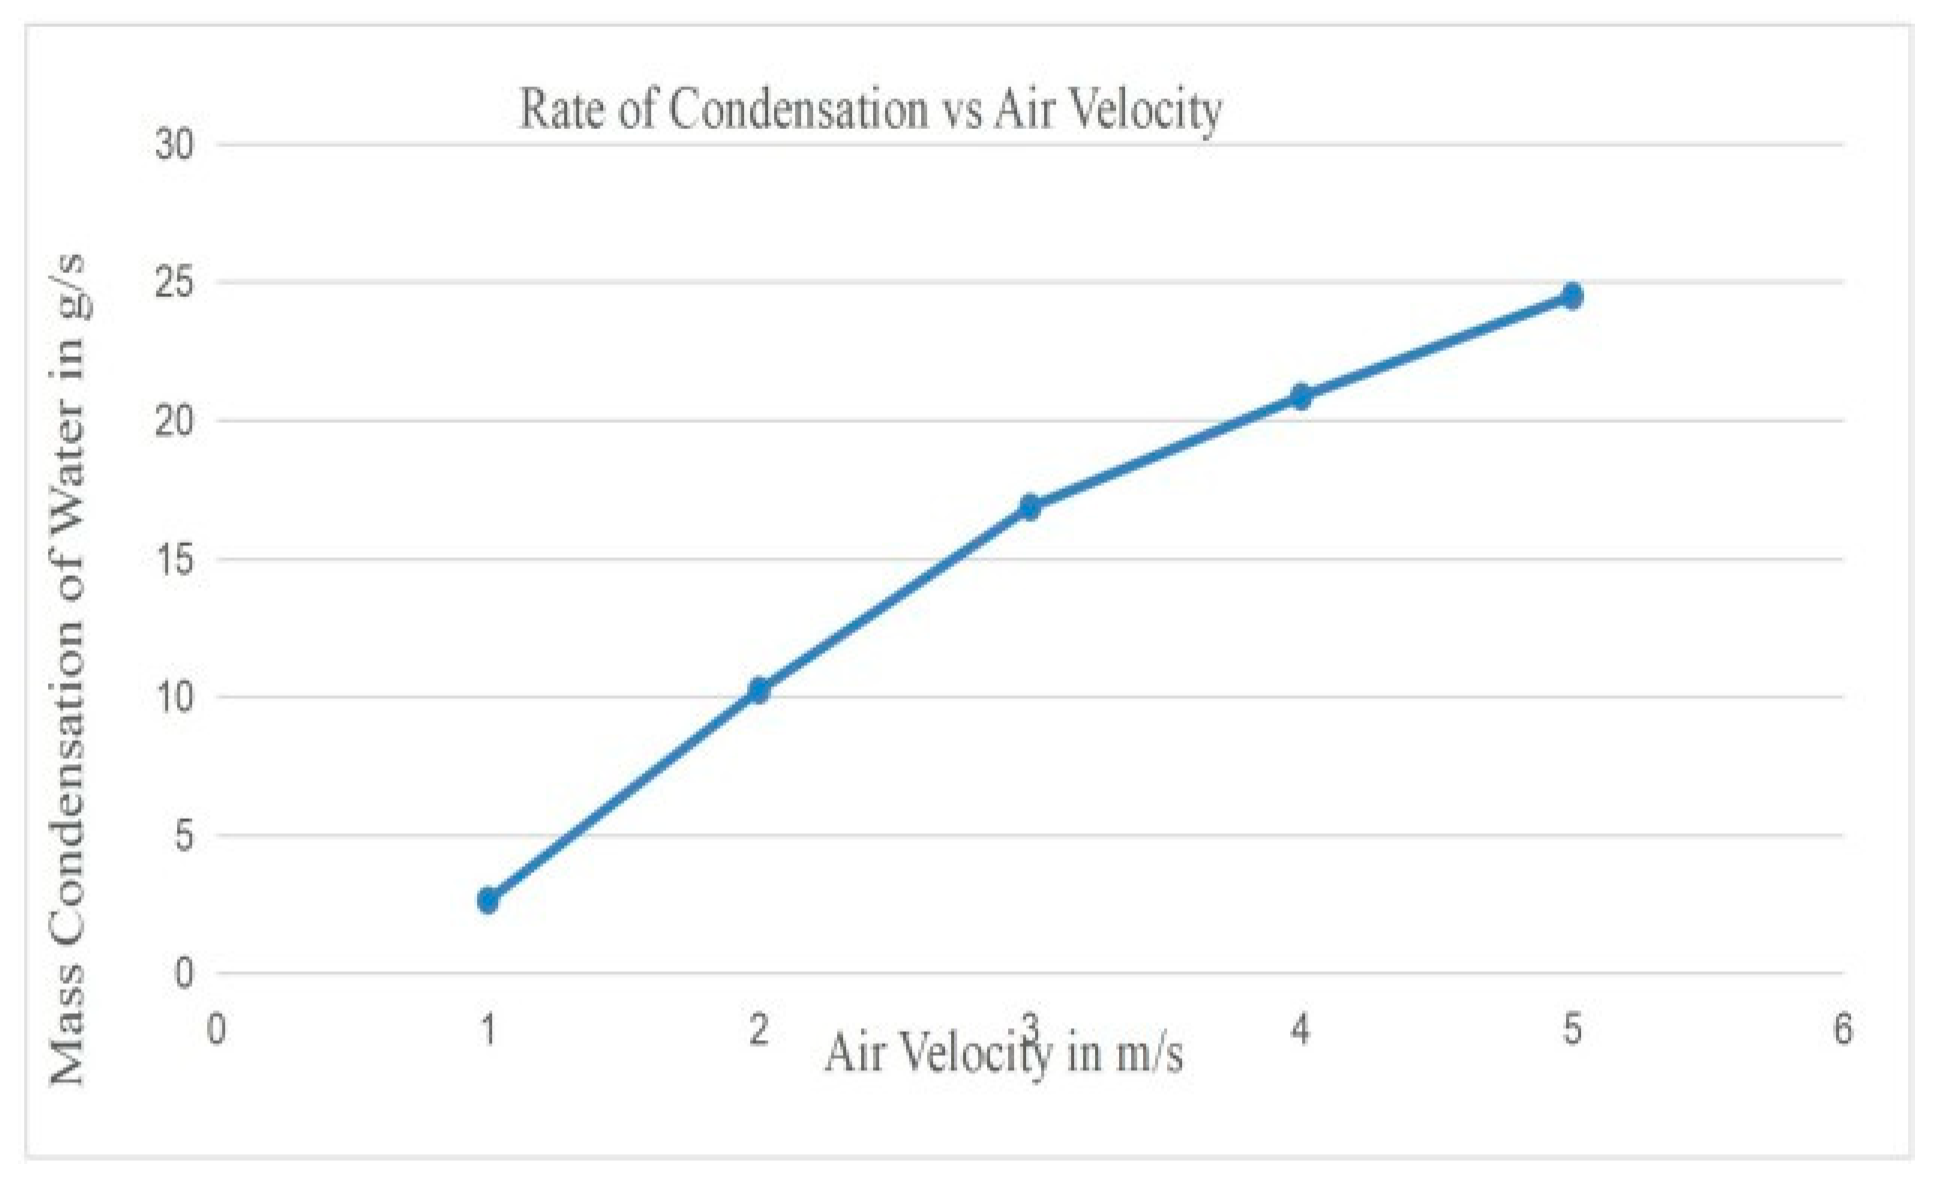
Based on temperature constant :- For 290K :-
Graph 6 shows a strong positive correlation between the inlet air velocity and the water condensation rate. As the inlet air velocity increases, the condensation rate also increases.
Graph 6.
Variation of mass condensation of water with respect to air velocity.
- ➢
- At 2 m/s, the condensation rate is 1.4124 g/s.
- ➢
- At 4 m/s, the condensation rate increases to 6.921 g/s.
- ➢
- At 6 m/s, the condensation rate further increases to 15.047 g/s.
- ➢
- At 8 m/s, the condensation rate increases to 22.037 g/s.
- ➢
- At 10 m/s, the condensation rate reaches 27.878 g/s.
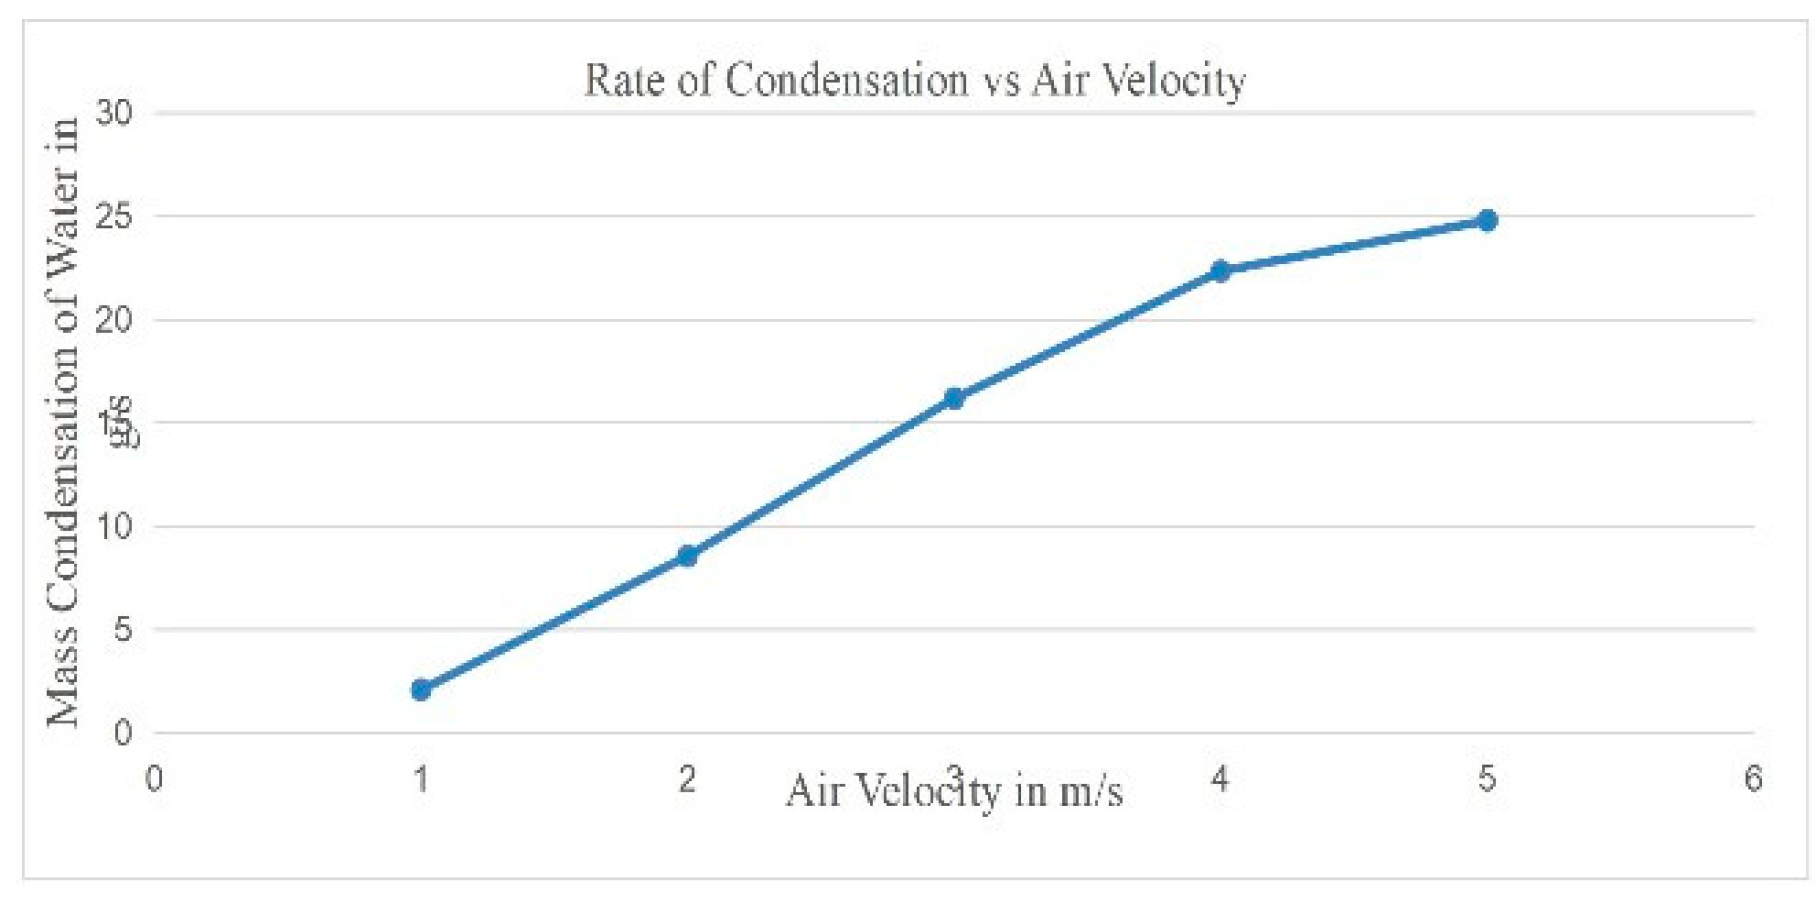
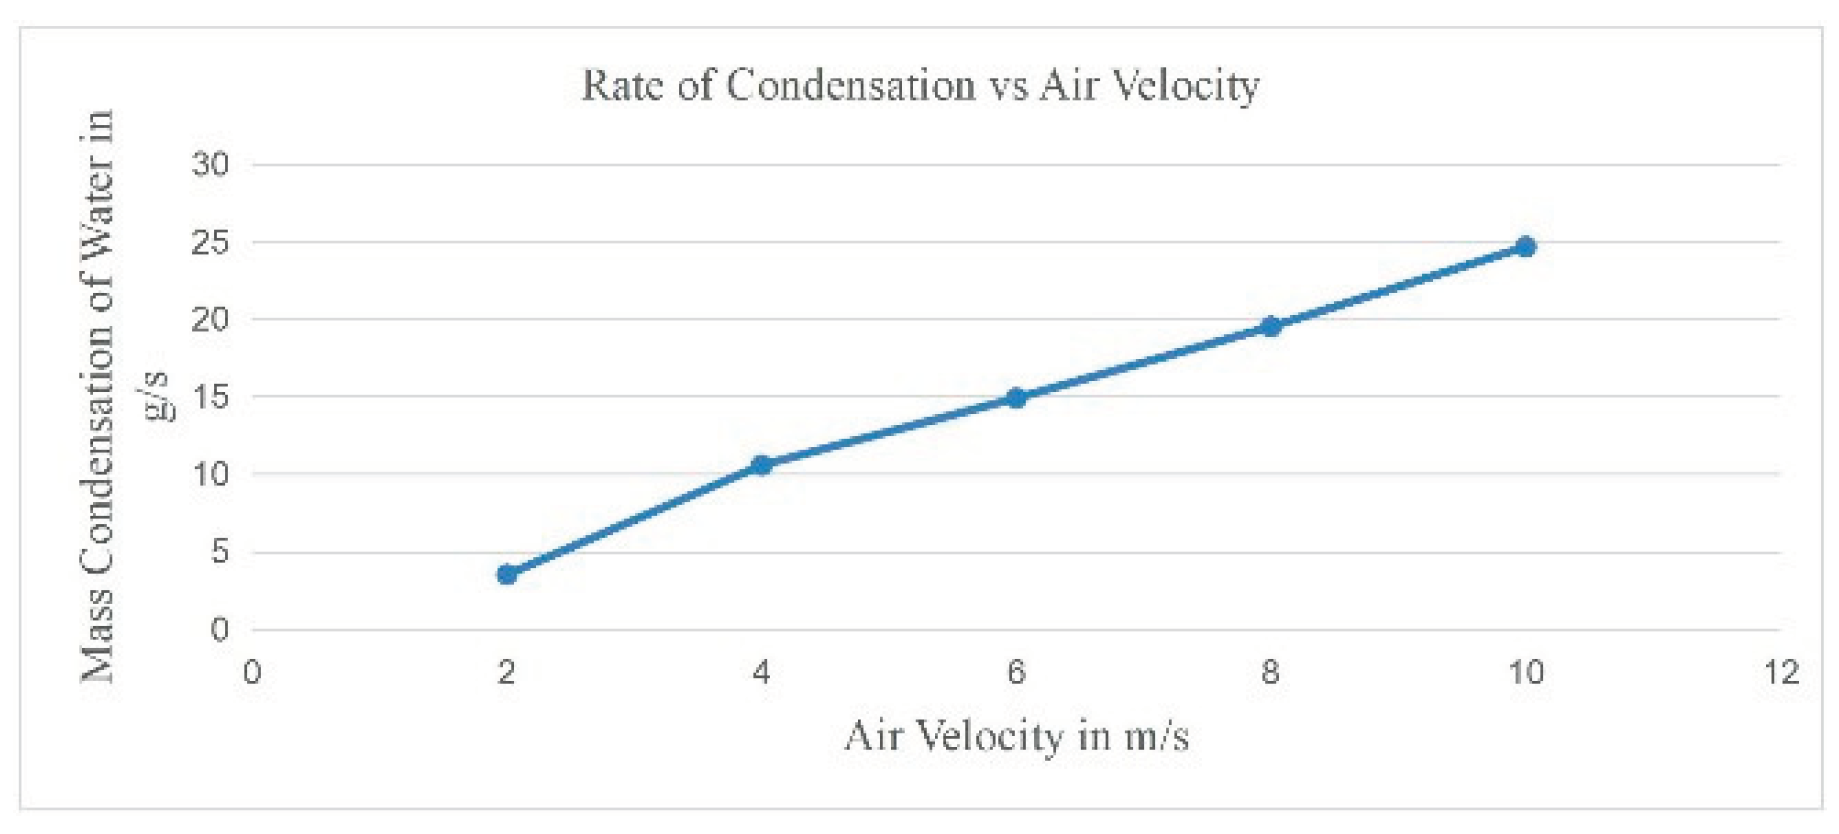
For 295K :-
Graph 7 shows a strong positive correlation between the inlet air velocity and the water condensation rate. As the inlet air velocity increases, the condensation rate also increases
Graph 7.
Variation of mass condensation of water with respect to air velocity.
- ➢
- At 2 m/s, the condensation rate is 2.081 g/s.
- ➢
- At 4 m/s, the condensation rate increases to 8.546 g/s.
- ➢
- At 6 m/s, the condensation rate further increases to 16.163 g/s.
- ➢
- At 8 m/s, the condensation rate increases to 22.32 g/s.
- ➢
- At 10 m/s, the condensation rate reaches 24.773 g/s.
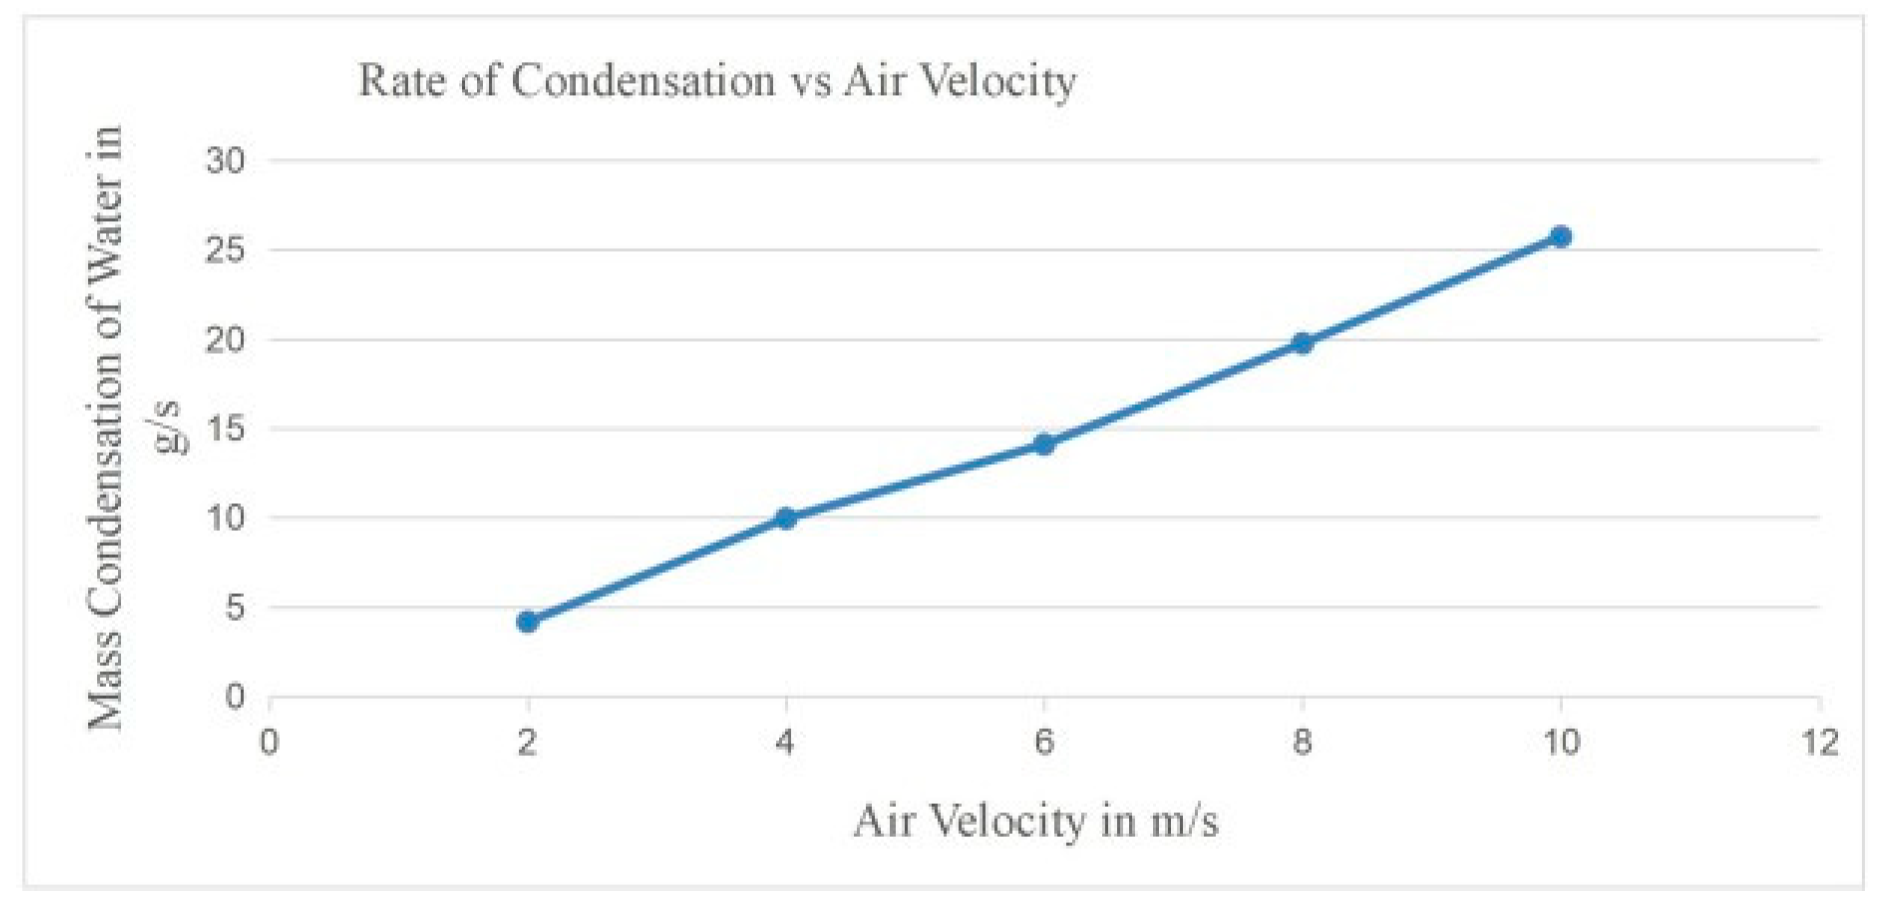
For 300K :
The Graph 8 shows a strong positive correlation between the inlet air velocity and the water condensation rate. As the inlet air velocity increases, the condensation rate also increases.
Graph 8.
Variation of mass condensation of water with respect to air velocity.
- ➢
- At 2 m/s, the condensation rate is 2.627 g/s.
- ➢
- At 4 m/s, the condensation rate increases to 10.226 g/s.
- ➢
- At 6 m/s, the condensation rate further increases to 16.851 g/s.
- ➢
- At 8 m/s, the condensation rate increases to 20.850 g/s.
- ➢
-
At 10 m/s, the condensation rate reaches24.485 g/s.
For 305K :
Graph 9 shows the relationship between the inlet air velocity and the quantity of water
Graph 9.
Variation of mass condensation of water with respect to air velocity.
- ➢
- At 2 m/s, the condensation rate is 3.518 g/s.
- ➢
- At 4 m/s, the condensation rate increases to 10.575 g/s.
- ➢
- At 6 m/s, the condensation rate further increases to 14.895 g/s.
- ➢
- At 8 m/s, the condensation rate increases to 19.498 g/s
- ➢
- At 10 m/s, the condensation rate reaches 24.650 g/s.
For 310K :
Graph 10 shows the relationship between the inlet air velocity and the quantity of water condensed per second.
Graph 10.
Variation of mass condensation of water with respect to air velocity.
- ➢
- At 2 m/s, the condensation rate is 4.163 g/s.
- ➢
- At 4 m/s, the condensation rate increases to 9.945 g/s.
- ➢
- At 6 m/s, the condensation rate further increases to 14.094 g/s.
- ➢
- At 8 m/s, the condensation rate increases to 19.745 g/s.
- ➢
- At 10 m/s, the condensation rate reaches 25.717 g/s.
References
- Computational Fluid Dynamics Study of an Atmospheric Water Generator.
- Optimization of Regenerative Heat Exchanger for Atmospheric Water Generator using CFD" (International Journal of Heat and Mass Transfer, 2019).
- "Numerical Investigation and Optimization of Atmospheric Water Generator using CFD" (Journal of Computational Multiphase Flows, 2018).
- "CFD Analysis and Optimization of Atmospheric Water Generator for Improved Efficiency" (International Conference on Energy and Environment, 2019).
- "Numerical Investigation and Optimization of Atmospheric Water Generator using CFD and Particle Swarm Optimization" (International Conference on Computational Fluid Dynamics, 2018).
- "Optimization of Atmospheric Water Generator using CFD Simulation and Taguchi Method" (International Conference on Sustainable Energy and Environment, 2017).
- "CFD Simulation and Optimization of Atmospheric Water Generator for Enhanced Performance" (International Conference on Fluid Mechanics and Thermodynamics, 2016).
- "Optimization of Regenerative Atmospheric Water Generator using CFD Simulation and Genetic Algorithm" (Master's Thesis, 2020).
Disclaimer/Publisher’s Note: The statements, opinions and data contained in all publications are solely those of the individual author(s) and contributor(s) and not of MDPI and/or the editor(s). MDPI and/or the editor(s) disclaim responsibility for any injury to people or property resulting from any ideas, methods, instructions or products referred to in the content. |
© 2025 by the authors. Licensee MDPI, Basel, Switzerland. This article is an open access article distributed under the terms and conditions of the Creative Commons Attribution (CC BY) license (http://creativecommons.org/licenses/by/4.0/).
Copyright: This open access article is published under a Creative Commons CC BY 4.0 license, which permit the free download, distribution, and reuse, provided that the author and preprint are cited in any reuse.


