
Submitted:
09 May 2025
Posted:
12 May 2025
You are already at the latest version
Abstract
Aerosol optical properties and radiative forcing critically influence Earth’s climate, particularly in semi-arid regions. This study investigates these properties in Yinchuan, Northwest China, focusing on aerosol optical depth (AOD), single scattering albedo (SSA), Ångström Index, and direct radiative forcing (DRF) using 2023 CE-318 sun photometer data, HYSPLIT trajectory analysis, and the SBDART model. Spring AOD peaks at 0.58 ± 0.15 (500 nm) due to desert dust, with coarse-mode particles dominating, while summer SSA reaches 0.94, driven by fine-mode aerosols. Internal mixing of dust and anthropogenic aerosols significantly alters DRF through enhanced absorption, with spring surface DRF at -101.1 W m⁻² indicating strong cooling and internal mixing increasing atmospheric DRF to 52.2W m⁻².These findings elucidate dust-anthropogenic interactions’ impact on optical properties and radiative forcing, offering critical observations for semi-arid climate research.
Keywords:
Aerosol Optical Properties
; Direct Radiative Forcing
; Dust-Anthropogenic Interactions
; Semi-Arid Region
1. Introduction
Aerosols influence the energy balance and atmospheric dynamics by scattering and absorbing solar radiation, playing a critical role in Earth’s climate [1]. In the semi-arid regions of Northwest China, the sources and characteristics of aerosols are particularly complex due to the presence of dust and anthropogenic emissions. This region encompasses the Taklimakan Desert, Gobi Desert, Junggar Basin, and Loess Plateau, which are among the major global sources of dust aerosols [2]. Concurrently, rapid industrialization and urbanization have led to a significant increase in emissions of anthropogenic aerosols, including sulfates, nitrates, black carbon (BC), and organic carbon (OC), forming a complex mixed system of dust and anthropogenic aerosols in the atmosphere [3,4].
The direct radiative forcing (DRF) of aerosols refers to their ability to alter the net radiative flux at the top of the atmosphere (TOA) or the surface through direct interactions with solar radiation, including scattering and absorption. The magnitude and sign of DRF directly impact regional climate patterns, precipitation distribution, and air quality. In Northwest China, dust aerosols, characterized by a high single scattering albedo (SSA, typically 0.95–1.0), generally induce significant cooling at the surface, with DRF values in dust source regions ranging from -9 to -24 W m⁻². However, at the TOA, dust aerosols may exhibit a slight warming effect due to the absorption of longwave radiation, with DRF values reaching 0 to +6.0 W m⁻² in certain areas [5,6]. In contrast, anthropogenic aerosols, with a lower SSA (approximately 0.7–0.9), typically exhibit a stronger cooling effect, with nationwide DRF values of approximately -5.6 W m⁻² (BOA) and -3.0 W m⁻² (TOA). Notably, when dust and anthropogenic aerosols mix, their synergistic optical properties can significantly alter the net radiative forcing [7,8]. For instance, strongly absorbing anthropogenic aerosols, such as black carbon, may adhere to dust particles, enhancing atmospheric absorption and amplifying the warming effect [9,10].
The semi-arid environment of Northwest China renders it particularly sensitive to climate change. Studies indicate that aerosol radiative forcing in this region has increased in recent years, especially in dust source areas like the Taklimakan Desert, where shortwave DRF under clear-sky conditions has reached -13.5 W m⁻² (BOA) and -4.8 W m⁻² (TOA), with an atmospheric heating effect of 8.7 W m⁻² [11,12]. This trend reflects not only the intensification of dust events but also the rising pollution emissions driven by human activities [13]. Furthermore, the vertical distribution differences between dust (concentrated at 2–5 km altitudes) and anthropogenic aerosols (predominantly in the boundary layer) add complexity to the calculation and prediction of radiative forcing. In urban areas, the optical and radiative properties of aerosols vary significantly under different pollution conditions, such as dust days exhibiting higher absorption and haze days dominated by fine organic aerosols [14,15].
This study focuses on Yinchuan, a non-AERONET site in Northwest China, strategically located between desert and industrial zones (situated in the central Ningxia Plain, surrounded by major deserts including the Badian Jaran and Tengger, serving as a critical pathway for cross-border dust transport and a hub for high-pollution industries such as coal and chemical production) [19,20]. This positioning makes Yinchuan an ideal location for investigating the interactions between dust and anthropogenic aerosols, enabling the retrieval of aerosol optical parameters and microphysical properties [16,17,18]. The unique geographical conditions of Yinchuan provide a natural experimental setting to explore the vertical differentiation effects between coarse-mode dust aerosols and fine-mode anthropogenic aerosols, as well as the synergistic mechanisms of scattering and absorption, thereby filling the observational gap in aerosol radiative forcing research in semi-arid regions [21].
2. Materials and Methods
2.1. Study Area
The Yinchuan region is located in the central part of the Ningxia Plain in Northwest China, surrounded by four deserts to the west, northwest, north, and east, as shown in Figure 1. The geographical characteristics of this region result in distinct climatic features, including significant diurnal temperature variations, scarce precipitation, intense evaporation, and arid conditions. Consequently, Yinchuan is not only one of the primary sources of dust storms but also serves as a critical pathway for the wind-driven transport of dust particles. Dust aerosols are a dominant aerosol type in this region, exerting a substantial impact on the local atmospheric environment [22]. Furthermore, Yinchuan is a major hub for coal, chemical, and power industries in Northwest China, with energy-intensive industries accounting for a significant proportion of local industrial activities. The resulting atmospheric particulate matter, including soot, chemical emissions, coal combustion fly ash, and mineral combustion particles, constitutes a major source of pollutants that significantly degrade regional air quality and environmental health.
2.2. Instruments and Data
This study employed a CE-318 sun photometer installed at the Northern University for Nationalities in Yinchuan, operational since September 2012. The instrument operates across nine channels spanning the visible and near-infrared spectra, with specific wavelengths at 340 nm, 380 nm, 440 nm, 500 nm, 675 nm, 870 nm, 936 nm, 1020 nm, and 1640 nm. It is equipped with multiple automatic sun-tracking and sky-scanning modes, collecting direct solar radiation data through all nine channels and sky-scanning data via six of these channels (440 nm, 500 nm, 675 nm, 870 nm, 1020 nm, and 1640 nm) [33]. The direct solar radiation data are primarily used to retrieve optical depth and total atmospheric water vapor content, while almucantar data are utilized to derive volume size distribution and single scattering albedo. These datasets provide essential support and research tools for investigating atmospheric optical parameters, offering significant application value and research importance in relevant academic fields.
Backward trajectory data were obtained using the HYSPLIT (Hybrid Single-Particle Lagrangian Integrated Trajectory) model, driven by meteorological fields from the Global Data Assimilation System (GDAS) of the National Centers for Environmental Prediction (NCEP). Simulations were initiated from the central point of the Yinchuan region (38.5°N, 106.2°E), and backward trajectory clustering was calculated for each season of 2023 to analyze aerosol transport mechanisms.
Research data were processed using aerosol subtype classification products to determine the vertical distribution types of aerosols. The Vertical Feature Mask (VFM) data employ a joint inversion of the 532 nm backscatter signal, depolarization ratio, and color ratio to classify aerosol types. Combined with Layer Top Height and the vertical profile of the Extinction Coefficient at 532 nm, the vertical distribution characteristics of different aerosol types are resolved at a 60 m vertical resolution. Dust aerosols are predominantly distributed at altitudes of 1.5–7 km, while smoke aerosols are primarily concentrated in the lower troposphere, from the surface up to 2 km.
2.3. Data Processing and Research Methods
In this research, the ESR. pack inversion scheme, which builds upon the method by Nakajima et al., has been adapted for various sun photometer data types. It features two key modules: Sunrad for direct solar radiation data processing and Skyrad for sky scattered radiation data inversion. The SBDART model, a FORTRAN-based radiative transfer tool, employs the discrete ordinate method (DISORT) coupled with a low-resolution atmospheric parameterization to simulate radiative transfer accurately across the 0.3-3 micron spectrum from the atmosphere’s top to the surface under both clear and cloudy skies. When examining seasonal changes in aerosol direct radiative forcing, SBDART automatically chooses appropriate mid-latitude atmospheric profiles—summer for April to October and winter for November to March. It incorporates aerosol optical properties like AOD (aerosol optical depth), SSA (single scattering albedo), and g (asymmetry factor), alongside environmental factors such as surface albedo, water vapor profiles, and ozone levels, to model atmospheric absorption, scattering, and surface interactions comprehensively. This model is instrumental for: Studying atmospheric radiation balance, Calibrating satellite remote sensing data, and Assessing aerosol and cloud radiative forcing. Aerosol radiative forcing is quantified as the radiative balance difference at the surface and top of the atmosphere due to aerosols, computed via equations (1) and (2), with the overall direct forcing given by equation (3).
In analyzing how the optical properties of dust and anthropogenic aerosols synergistically influence radiative forcing, the research employs the SBDART radiative transfer model, as illustrated in Figure 2. The approach quantifies the combined radiative effects of dust and anthropogenic aerosols by customizing aerosol optical parameters. Aerosol optical properties are specified via the aerosol.dat file, focusing on four scenarios where the optical thickness of dust and anthropogenic aerosols exhibits a stratified decrease with altitude. The output IOUT data are used to visualize and analyze the heating rate variation with altitude, net flux variation with altitude, direct radiative forcing (DRAF) for the four scenarios, and the variation of surface diffuse reflection and absorption indices with wavelength. Additionally, the physical effects of these phenomena are examined. The experimental design includes scenarios with dust alone, anthropogenic aerosols alone, and combined scenarios. The synergistic effects are analyzed through the difference in radiative forcing, and the mechanisms of their interactions are evaluated.
3. Results
3.1. Seasonal Analysis of Aerosol Optical Depth (AOD) in the Yinchuan Region
Based on the analysis of Aerosol Optical Depth (AOD) data measured by the CE-318 sun photometer at Northern University for Nationalities in 2023, it is evident from Figure 3(a)that the AOD in spring is significantly higher than in other seasons. Long-term observations using the CE-318 photometer reveal that the average AOD at 500 nm wavelength (AOD₅₀₀) during spring (March to May) is 0.58±0.15, which is notably higher than in summer (0.54±0.22), autumn (0.50±0.18), and winter (0.43±0.28) [24]. This phenomenon is closely linked to regional dust activities: HYSPLIT backward trajectory clustering, as shown in Figure 3(b), indicates that northwest airflow prevails in spring (accounting for 90%), transporting dust particles from the Badain Jaran and Tengger Deserts to Yinchuan. The frequent activity of Mongolian cyclones, in conjunction with the Siberian High, leads to increased near-surface wind speeds (averaging 4.5 m/s), providing dynamic conditions for cross-border dust transport. Additionally, spring dust storm events constitute 68% of the annual dust days, with an extreme weather event on March 22, 2023, recording an AOD₅₀₀ of 2.3 and surface PM₁₀ concentrations exceeding 559 μg/m³.
3.2. Analysis of the Aerosol Ångström Exponent
The monthly variation trend of the Ångström Exponent is shown in Figure 4. The monthly variation trend of the Ångström Index. This index is a critical parameter for characterizing the size distribution of atmospheric aerosol particles. A higher Ångström Exponent indicates a predominance of fine particulate matter from anthropogenic sources, while a decreasing Ångström Exponent suggests an increase in the dominant aerosol particle size. When the Ångström Exponent reaches lower values, coarse-particle aerosols, such as desert dust, are predominant. In spring, the Ångström Exponent exhibits its lowest values (ranging from 0.196 to 0.735, with an average of 0.354), with the minimum occurring in April, reflecting the increased prevalence of severe dust weather. In contrast, the Ångström Exponent reaches its highest values in summer (ranging from 0.175 to 1.685, with an average of 0.669), attributed to the high humidity environment in summer that promotes the deposition of dust aerosols. Based on their sources and optical properties, atmospheric aerosols can be classified into biomass burning aerosols, marine aerosols, dust aerosols, urban aerosols, and background continental aerosols. Analysis of AOD and Ångström Exponent data enables the identification of aerosol types. In the Yinchuan region, aerosol types show little variation, primarily consisting of desert dust aerosols, as well as black carbon (BC) and organic carbon (OC) aerosols generated from urban industrial activities and residential coal combustion for heating.
3.3. Analysis of Aerosol Particle Size Distribution and Single Scattering Albedo (SSA)
The Single Scattering Albedo (SSA), defined as the ratio of scattering to total extinction, is a critical parameter in radiative forcing. It depends on the shape, size, and composition of aerosols. Long-term observations from AERONET indicate that SSA typically ranges from 0.82 to 0.98 globally. As shown in Figure 5(a), the SSA in the Yinchuan region is relatively high in summer, reaching 0.94, indicating strong scattering properties. This is associated with the high-humidity environment in summer, where aerosols readily capture atmospheric water vapor, increasing their particle radius and significantly enhancing their scattering coefficient. In spring, SSA is relatively lower due to the high absorption properties of dust and mineral aerosols, which contain substantial iron oxide components. The lower SSA in autumn is linked to increased emissions of strongly absorbing biomass burning aerosols from straw incineration. Although the effective radii of coarse and fine mode aerosol particles in summer and autumn are similar, their SSA values differ significantly, suggesting that, in addition to the physical properties of aerosols, their chemical composition is likely a key factor influencing SSA variations.
The size distribution of aerosols was retrieved from sky radiation data measured by a sun photometer. The observational results of this study indicate that the aerosol particle volume size distribution in the Yinchuan region exhibits a pronounced bimodal pattern, with the fine mode peak diameter ranging between 0.25–0.26 μm and the coarse mode peak diameter approximately 7.73 μm. This distribution pattern is consistent with the aerosol size distribution characteristics derived by Liu et al. based on observational data from 2003–2004 in the Yinchuan region, further validating the typical features of regional aerosol size distributions. In spring, frequent dust transport events lead to a coarse-mode-dominated volume concentration spectrum, directly associated with the particle size characteristics of mineral components in dust aerosols. In contrast, summer exhibits a fine-mode-dominated distribution, attributed to mechanisms such as enhanced photochemical reactions under high-temperature conditions, which accelerate secondary aerosol formation, and the transport of water vapor by the southeast monsoon, increasing atmospheric relative humidity and inducing hygroscopic growth of aerosols. This results in the partial migration of fine-mode particles to the coarse mode. Compared to summer, autumn and winter experience reduced local precipitation, weakening wet deposition processes. Additionally, the onset of the heating period in late autumn significantly increases emissions from combustion sources, leading to a concurrent increase in fine-mode (PM₂.₅) and coarse-mode (PM₁₀) particle concentrations. This phenomenon aligns spatially with the characteristics of wintertime compound air pollution in the North China region.
3.4. Analysis of Aerosol Direct Radiative Forcing
Numerical simulations based on the SBDART model reveal that aerosol radiative forcing in the Yinchuan region exhibits significant spatiotemporal heterogeneity, modulated by the synergistic effects of aerosol physicochemical properties (type, size distribution) and local meteorological conditions. The study indicates that direct radiative forcing (DRF) by aerosols at the top of the atmosphere (TOA) and the surface (SUR) is strongly correlated with aerosol size distribution, aerosol optical depth (AOD), and single scattering albedo (SSA). As shown in Figure 6, TOA radiative forcing exhibits a pronounced cooling effect in March (-26.91±12.31 W m⁻²) and September (-39.42±19.26 W m⁻²), directly associated with seasonal peaks in SSA (March: 0.93±0.05; September: 0.95±0.03). This suggests that aerosols with high SSA values enhance planetary albedo due to their dominant scattering properties. Surface radiative forcing shows significantly high negative values from March to May (-101.13±21.7 W m⁻²), primarily driven by the cross-border transport of dust particles from the Badain Jaran and Tengger Deserts to Yinchuan under prevailing northwest airflow in spring, leading to a surge in coarse-mode aerosol mass concentration (PM₁₀ peak >300 μg/m³). Seasonal differences in aerosol direct radiative forcing are notable, with values of 69.98±29.52W m⁻², 35.20±21.31W m⁻², 29.74±19.18W m⁻², and 37.17±18.18 W m⁻² for spring, summer, autumn, and winter, respectively. The significant reduction in radiative forcing during summer is closely linked to enhanced wet deposition processes (average humidity 68%) and aerosol wet removal effects. In autumn and winter, radiative forcing exhibits a bimodal distribution, attributed to residential coal combustion for heating and industrial emissions from the Ningdong Energy and Chemical Industry Base, which collectively increase the proportion of fine-mode carbonaceous aerosols. The strong absorption properties of these aerosols in the near-infrared band (1.2–2.5 μm) induce an atmospheric heating effect, partially offsetting the radiative cooling at the TOA.
3.5. The Synergistic Effects of the Optical Properties of Dust and Anthropogenic Aerosols on Aerosol Radiative Forcing
3.5.1. The Heating Rate Analysis
The heating rate analysis, as shown in Figure 7, indicates that the external mixture (Extmix) at 7 km has a heating rate of 0.663 K/day, which is close to the linear superposition of dust (0.354 K/day) and anthropogenic aerosols (0.170 K/day) with an expected value of 0.523 K/day and a deviation of 0.140 K/day [23]. This suggests independent contributions from dust and anthropogenic aerosols, with dust’s weak absorption (primarily due to iron oxides) and anthropogenic aerosols’ strong absorption (e.g., black carbon in the shortwave band) contributing separately, resulting in a weak synergistic effect. The heating rate distribution is relatively uniform between 0–10 km. In contrast, the internal mixture (Intmix) exhibits a heating rate of 1.290 K/day at 7 km, significantly exceeding the linear superposition (deviation of 0.767 K/day) and is notably higher than other scenarios within the 0–10 km range. This phenomenon arises from the “lensing effect” caused by dust encapsulating black carbon, where the high-refractive-index dust shell focuses incident light onto the black carbon core, enhancing absorption efficiency. This leads to increased radiation absorption in the lower atmosphere (0–10 km), significantly elevating the heating rate [26]. Such nonlinear synergistic effects may alter boundary layer stability and convective activity, impacting regional precipitation and cloud formation, highlighting the significant influence of internal mixing on the atmospheric thermal structure.
3.5.2. The Net Flux Analysis
The net flux analysis, as shown in Figure 8, indicates that the external mixing (Extmix) scenario yields a net flux of 337.26 W m⁻² at the surface (0 km), lower than that of dust (358.77 W m⁻²) and anthropogenic aerosols (368.43 W m⁻²). Across the 0–10 km altitude range, the net flux decreases by 63.06 W m⁻², closely approximating the linear superposition of dust and anthropogenic aerosols. This suggests independent contributions, with dust increasing reflectance through Mie scattering and anthropogenic aerosols reducing downward flux via absorption (e.g., black carbon’s shortwave absorption). Their combined effect results in a reduced net flux, though the synergistic effect is weak, and the radiation distribution remains relatively uniform. In contrast, the internal mixing (Intmix) scenario exhibits the lowest net flux at the surface (321.13 W m⁻²), with a decrease of 89.59 W m⁻² across 0–10 km, significantly exceeding the linear superposition. This reflects the enhanced absorption driven by the “lensing effect” in internal mixing, where the dust shell focuses light onto the black carbon core, increasing radiation interception in the lower atmosphere. Consequently, the radiation received at the surface is substantially reduced, while heating in the lower atmosphere is enhanced. This nonlinear synergistic effect alters the vertical distribution of radiation, potentially intensifying surface cooling and influencing low-level atmospheric thermodynamic processes [26].
3.5.3. Analysis of Surface Diffuse Reflection and Absorption
As shown in Figure 9, within the wavelength range of 0.355–1.105 μm, the diffuse fraction at the surface for the external mixing (Extmix) scenario (0.797 at 0.355 μm) is higher than that for dust (0.687) and anthropogenic aerosols (0.571). The direct flux attenuation (0.883) closely approximates the linear superposition of the two, indicating that dust and anthropogenic aerosols exist as independent particles in external mixing. The high scattering of dust (e.g., via Mie scattering) and the strong absorption of anthropogenic aerosols (e.g., black carbon’s absorption peak in the ultraviolet-visible band) contribute independently, with a weak synergistic effect. Enhanced scattering results in a higher diffuse fraction, while the linear superposition of absorption leads to slightly greater attenuation compared to individual scenarios. In contrast, the internal mixing (Intmix) scenario exhibits a lower diffuse fraction (0.617) than Extmix, with direct flux attenuation (0.792) significantly exceeding the average of dust and anthropogenic aerosols in the shortwave band. Both scattering and attenuation decrease with increasing wavelength (>0.7 μm). This behavior arises from the formation of composite particles in internal mixing, where dust encapsulates black carbon, enhancing absorption efficiency through the “lensing effect” and reducing scattered radiation [25]. The strong absorption by black carbon in the shortwave band (ultraviolet-visible) further amplifies the synergistic effect, leading to increased attenuation and reduced scattering. This indicates that the nonlinear enhancement of absorption in internal mixing is primarily concentrated in the shortwave band, potentially exerting significant impacts on surface radiation balance and photochemical processes (e.g., ozone formation).
3.5.4. Direct Radiative Forcing of Aerosol Sunder Four Scenarios Analysis
The analysis of aerosol direct radiative forcing (DARF), as presented in Figure 10 and Table 1, shows that in the external mixing (Extmix) scenario, DARF values at the top of the atmosphere (TOA), bottom of the atmosphere (BOA), and atmospheric absorption (ATM) closely approximate the linear superposition of dust and anthropogenic aerosols (expected values: TOA: -24.44 W m⁻², BOA: -48.26 W m⁻², ATM: 23.82 W m⁻²), with small deviations (TOA: -0.310 W m⁻², BOA: -2.210 W m⁻², ATM: 1.900 W m⁻²) [26,27]. This indicates that dust and anthropogenic aerosols exist as independent particles in external mixing, contributing separately through scattering and absorption, with a weak synergistic effect. The physical mechanism primarily involves the simple superposition of dust’s high scattering (increasing reflectance) and anthropogenic aerosols’ strong absorption (reducing surface radiation). In contrast, the internal mixing (Intmix) scenario exhibits DARF values that significantly deviate from linear superposition (deviations: TOA: 10.09 W m⁻², BOA: -18.34 W m⁻², ATM: 28.431 W m⁻²), with atmospheric absorption increasing by 119.3%. This nonlinear effect stems from the “lensing effect” formed when dust encapsulates strongly absorbing components such as black carbon. In internal mixing, the dust shell focuses light onto the black carbon core, enhancing absorption and increasing radiative absorption in the lower atmosphere. This results in reduced surface forcing (intensifying cooling) and greater TOA forcing (due to decreased upward radiation escape), highlighting the profound impact of internal mixing on the radiative balance [28].
4. Discussion and Conclusions
(1) The aerosol properties in the Yinchuan region exhibit pronounced seasonal variations, shaped by its distinctive geographical environment and industrial context. In spring, elevated aerosol optical depth (AOD at 500 nm: 0.58 ± 0.15) and a low Ångström Exponent (AE: 0.354) align with intense dust activity from nearby deserts, such as the Badain Jaran and Tengger Deserts, consistent with findings from the Taklimakan Desert [36]. An extreme dust event on March 22, 2023 (AOD₅₀₀ = 2.3, PM₁₀ > 559 μg/m³), underscores the pivotal role of meteorological systems like the Mongolian cyclone and Siberian High in facilitating cross-border dust transport. In summer, fine-mode aerosols predominate (AE: 0.669), with a high single scattering albedo (SSA: 0.94), driven by hygroscopic growth and photochemical reactions under elevated humidity (68%), resulting in a diminished direct radiative forcing (DRF) [33]. During autumn and winter, fine-mode carbonaceous aerosols increase due to residential coal heating and industrial emissions from the Ningdong Energy and Chemical Industry Base, enhancing atmospheric absorption in the near-infrared band (1.2–2.5 μm) [35]. These seasonal shifts reflect the interplay between natural dust and anthropogenic emissions, significantly influencing the regional climate of this semi-arid area by altering surface cooling, atmospheric heating, and precipitation patterns [29,30].
(2) The interaction between dust and anthropogenic aerosols is particularly pronounced in the internal mixing (Intmix) scenario, markedly altering radiative forcing characteristics. Internal mixing yields a heating rate of 1.290 K/day at 7 km altitude, far exceeding the linear superposition of dust (0.354 K/day) and anthropogenic aerosols (0.170 K/day) (expected: 0.523 K/day, deviation: 0.767 K/day), with an increase of up to 119.3%. This amplification stems from the lensing effect, where the high-refractive-index dust shell focuses incident light onto the black carbon core, boosting absorption efficiency [38]. Net flux analysis reveals that internal mixing produces the lowest surface net flux (321.13 W m⁻²), with a reduction of 89.59 W m⁻² across 0–10 km, surpassing linear superposition and indicating enhanced radiation interception in the lower atmosphere. Optical property analysis shows that the diffuse fraction at the surface for internal mixing (0.617 at 0.355 μm) is lower than for external mixing (Extmix) (0.797), while direct flux attenuation (0.792) is significantly higher in the shortwave band (0.355–1.105 μm), reflecting nonlinear absorption enhancement [34,39]. The DRF for internal mixing (TOA: -14.35 W m⁻², BOA: -66.60 W m⁻², ATM: 52.25 W m⁻²) deviates substantially from expected values (ATM: 23.82 W m⁻²), aligning with studies on enhanced absorption by black carbon-dust mixtures (Liu et al., 2012). In contrast, the DRF for external mixing (TOA: -24.75 W m⁻², BOA: -50.47 W m⁻², ATM: 25.72 W m⁻²) closely matches linear superposition, with weaker synergistic effects. These findings highlight the critical role of aerosol mixing states in modulating radiative forcing and atmospheric heating in semi-arid regions.
(3) Aerosols in the Yinchuan region exert profound effects on climate and the environment through their optical and radiative properties. In spring, intense surface cooling reduces net radiation, potentially suppressing evaporation and convective activity, altering precipitation patterns, and exacerbating drought tendencies in this semi-arid region. The strong atmospheric heating from internal mixing (ATM: 52.25 W m⁻²) modifies the boundary layer’s thermodynamic structure, possibly enhancing atmospheric stability and inversion layer formation, which hampers pollutant dispersion and influences cloud formation and precipitation efficiency [37]. Over the long term, the synergistic absorption by dust and black carbon aerosols may amplify regional warming by reducing snow and ice albedo, particularly in Northwest China’s semi-arid zones. Compared to the national average surface DRF (-5 to -10 W m⁻²), Yinchuan’s springtime DRF is notably stronger, underscoring its significance in regional climate regulation. These aerosol-driven effects necessitate incorporating nonlinear mixing effects into climate models to enhance the accuracy of climate sensitivity predictions in semi-arid environments.
(4) The aerosol characteristics in Yinchuan have substantial implications for air quality and public health. In spring, coarse-mode dust aerosols (PM₁₀ peak > 300 μg/m³) significantly degrade air quality, especially during extreme dust events (PM₁₀ > 559 μg/m³), far exceeding the World Health Organization’s 24-hour guideline (50 μg/m³) and elevating risks of respiratory and cardiovascular diseases. In autumn and winter, the rising proportion of fine-mode carbonaceous aerosols (PM₂.₅) from coal heating and industrial emissions mirrors North China’s wintertime compound pollution, posing greater lung health risks due to their higher penetration [30]. Internal mixing enhances black carbon absorption via the lensing effect, potentially promoting photochemical reactions and increasing ozone and secondary aerosol formation, further worsening air quality. Moreover, enhanced absorption extends the atmospheric residence time of pollutants, heightening the frequency and severity of haze events [32]. Improving air quality in Yinchuan thus requires integrated strategies, including controlling coal combustion emissions, reducing industrial pollution, and enhancing dust source management to address both natural and anthropogenic aerosol sources.
This study systematically investigates the optical properties, microphysical characteristics, and radiative effects of aerosols in Yinchuan, Northwest China, unveiling the complex interactions between dust and anthropogenic aerosols in a semi-arid setting and their profound impacts on regional climate and the environment [40,41]. Seasonal observations indicate that spring is dominated by coarse-mode dust aerosols from desert sources like Badain Jaran and Tengger, with AOD reaching 0.58 ± 0.15 and significant surface cooling (DRF: -101.13 ± 21.7 W m⁻²). In summer, fine-mode aerosols prevail, with SSA up to 0.94, influenced by high humidity (68%) and hygroscopic growth, reducing DRF to -35.20 ± 21.31 W m⁻². Internal mixing of dust and anthropogenic aerosols markedly enhances atmospheric absorption (ATM: 52.25 W m⁻²) and heating rate (1.290 K/day at 7 km) via the lensing effect, exceeding external mixing (heating rate: 0.663 K/day) by 119.3% and deviating from linear superposition. Net flux analysis shows internal mixing yields the lowest surface net flux (321.13 W m⁻²), with a 89.59 W m⁻² reduction across 0–10 km, reflecting intensified radiation interception in the lower atmosphere. Optical property analysis confirms that internal mixing enhances absorption in the shortwave band (0.355–1.105 μm), reducing the diffuse fraction and affecting radiation balance and photochemical processes. These interactions significantly influence regional climate by intensifying surface cooling, enhancing atmospheric heating, and potentially altering precipitation patterns, while also degrading air quality by prolonging pollutant residence times and promoting secondary aerosol formation, thus increasing health risks for respiratory and cardiovascular diseases. This study bridges the gap in aerosol radiative forcing observations in Northwest China’s semi-arid regions, emphasizing the pivotal role of aerosol mixing states in regional climate regulation and air quality. The findings advocate for integrating nonlinear mixing effects into climate models to improve radiative forcing predictions and provide a scientific foundation for targeted emission control and dust management strategies, supporting climate change mitigation and environmental health improvements in semi-arid regions.
Author Contributions
X. Gong contributed to the conceptualization, formal analysis, investigation, writing—review and editing, supervision, project administration, and funding acquisition, leading the study’s design, overseeing its execution, and securing financial support. R. Z. Zhang was responsible for conceptualization, methodology, software, validation, data curation, writing—original draft preparation, and visualization, developing the research methods, processing data, drafting the manuscript, and creating visual representations. X. L. Sun provided resources and contributed to writing—review and editing, supporting the study with materials and revising the manuscript. D. L. Xiu also provided resources and contributed to writing—review and editing, assisting with material provision and manuscript revision. All authors have read and agreed to the published version of the manuscript.
Funding
This study was supported by the Natural Science Foundation of Ningxia, China (Grant No. 2024AAC03163 ), National Natural Science Foundation of China (Grant No.42005103) and Graduate student Innovative Project of North Minzu University (Grant No. YCX 24331).
Institutional Review Board Statement
Not applicable.
Informed Consent Statement
Not applicable.
Data Availability Statement
Data underlying the results presented in this paper are not publicly available at this time but maybe obtained from the authors upon reasonable request.
Acknowledgments
We sincerely thank the Key Laboratory of Atmospheric Environment Remote Sensing at the Northern University for Nationalities in Yinchuan for providing the CE-318 sun photometer and related observational facilities. We also express gratitude to the technical staff of the university’s atmospheric research laboratory for their support in maintaining and calibrating the instrumentation. Additionally, we acknowledge the National Centers for Environmental Prediction (NCEP) for providing the Global Data Assimilation System (GDAS) meteorological fields used in the HYSPLIT model simulations. We are grateful to the developers of the ESR.pack algorithm package, particularly Dr. Toshihiko Nakajima and colleagues, and to the developers of the SBDART radiative transfer model, including Dr. Paul Ricchiazzi and the research team, for their publicly available software.
Conflicts of Interest
The author declares no conflict of interest.
References
- Chen S Y, Huang J P, et al. Comparison of dust emissions, transport, and deposition between the Taklimakan Desert and Gobi Desert from 2007 to 2011. Science China Earth Sciences, 2017, 60: 1338-1355.
- Zhang X Y, Wang Y Q, et al. Atmospheric aerosol compositions in China: spatial/temporal variability, chemical signature, regional haze distribution and comparisons with global aerosols. Atmospheric Chemistry and Physics, 2012, 12(2): 779-799.
- Kok J F, Adebiyi A A, et al. Contribution of the world’s main dust source regions to the global cycle of desert dust. Atmospheric Chemistry and Physics, 2021, 21(10): 8169-8193.
- Xu S, Ren L, et al. Molecular markers of biomass burning and primary biological aerosols in urban Beijing: size distribution and seasonal variation. Atmospheric Chemistry and Physics, 2020, 20(6): 3623-3644. [CrossRef]
- Huang J, Fu Q, et al. Taklimakan dust aerosol radiative heating derived from CALIPSO observations using the Fu-Liou radiation model with CERES constraints. Atmospheric Chemistry and Physics, 2009, 9(12): 4011-4021. [CrossRef]
- Bond T C, Doherty S J, et al. Bounding the role of black carbon in the climate system: A scientific assessment. Journal of geophysical research: Atmospheres, 2013, 118(11): 5380-5552.
- Tian P, Zhang L, et al. Radiative absorption enhancement of dust mixed with anthropogenic pollution over East Asia. Atmospheric Chemistry and Physics, 2018, 18(11): 7815-7825. [CrossRef]
- Li Z Q, Xu H, et al. Comprehensive study of optical, physical, chemical, and radiative properties of total columnar atmospheric aerosols over China: An overview of Sun–Sky Radiometer Observation Network (SONET) measurements. Bulletin of the American Meteorological Society, 2018, 99(4): 739-755.
- Sutherland B, Meskhidze N. Type-based assessment of aerosol direct radiative effects: A proof-of-concept using GEOS-Chem and CATCH. Atmospheric Research, 2025, 320: 108036. [CrossRef]
- Elshora M, Xia H, et al. Observation and study of consecutive dust storms in the Taklimakan desert from March 16 to 27, 2022, using reanalysis models and lidar. Atmospheric Research, 2024, 305: 107431. [CrossRef]
- Wang X, Cai D, et al. Spatio-temporal trends of dust emissions triggered by desertification in China. Catena, 2021, 200: 105160. [CrossRef]
- Chen G, Wang W C. Circulation responses to regional aerosol climate forcing in summer over East Asia. Climate Dynamics, 2018, 51: 3973-3984.
- Che H, Qi B, et al. Aerosol optical properties and direct radiative forcing based on measurements from the China Aerosol Remote Sensing Network (CARSNET) in eastern China. Atmospheric Chemistry and Physics, 2018, 18(1): 405-425. [CrossRef]
- Ginoux P, Prospero J M, et al. Global-scale attribution of anthropogenic and natural dust sources and their emission rates based on MODIS Deep Blue aerosol products. Reviews of Geophysics, 2012, 50(3). [CrossRef]
- Li J, He Q, et al. Three-dimensional distribution of dust aerosols over the Tarim Basin and the Tibet Plateau during 2007–2021 derived from CALIPSO lidar observations. Journal of Cleaner Production, 2023, 400: 136746. [CrossRef]
- Xing C, Liu C, et al. Ground-based vertical profile observations of atmospheric composition on the Tibetan Plateau (2017–2019). Earth System Science Data, 2021, 13(10): 4897-4912. [CrossRef]
- Li Z, Xia X, et al. Aerosol optical properties and their radiative effects in northern China. Journal of Geophysical Research: Atmospheres, 2007, 112(D22). [CrossRef]
- Wen W, Guo C, et al. Impact of emission reduction on aerosol-radiation interaction during heavy pollution periods over Beijing-Tianjin-Hebei region in China. Journal of Environmental Sciences, 2020, 95: 2-13. [CrossRef]
- Wang Z, Huang X, et al. Environmental impacts of aerosol radiative effect and urbanization and their interactions over the Beijing-Tianjin-Hebei City cluster. Urban Climate, 2024, 56: 102020. [CrossRef]
- Aili A, Xu H, et al. Origin and transport pathway of dust storm and its contribution to particulate air pollution in northeast edge of Taklimakan Desert, China. Atmosphere, 2021, 12(1): 113. [CrossRef]
- Karakaş S Y, Tuncel S G. Chemical characteristics of atmospheric aerosols in a rural site of northwestern Anatolia. Atmospheric Environment, 1997, 31(18): 2933-2943. [CrossRef]
- Li K, Ma Y, et al. Chemical Composition and Mixing State of Fine Particles during Haze Periods in Yinchuan. Aerosol and Air Quality Research, 2023, 23(11): 230116. [CrossRef]
- Ramachandran S, Rupakheti M. Aerosol-induced atmospheric heating rate decreases over South and East Asia as a result of changing content and composition. Scientific Reports, 2020, 10(1): 20091. [CrossRef]
- Pan X, Uno I, et al. Real-time observational evidence of changing Asian dust morphology with the mixing of heavy anthropogenic pollution. Scientific Reports, 2017, 7(1): 335. [CrossRef]
- Yang Y, Russell L M, et al. Dust-wind interactions can intensify aerosol pollution over eastern China. Nature communications, 2017, 8(1): 15333. [CrossRef]
- Zheng H, Kong S, et al. Secondary inorganic aerosol dominated the light absorption enhancement of black carbon aerosol in Wuhan, Central China. Atmospheric Environment, 2022, 287: 119288. [CrossRef]
- Cheng Y, He K, et al. Brown and black carbon in Beijing aerosol: Implications for the effects of brown coating on light absorption by black carbon. Science of the Total Environment, 2017, 599: 1047-1055. [CrossRef]
- Cappa C D, Onasch T B, et al. Radiative absorption enhancements due to the mixing state of atmospheric black carbon. Science, 2012, 337(6098): 1078-1081. [CrossRef]
- An Z, Huang R J, et al. Severe haze in northern China: A synergy of anthropogenic emissions and atmospheric processes. Proceedings of the National Academy of Sciences, 2019, 116(18): 8657-8666. [CrossRef]
- Chen Y, Ebenstein A, et al. Evidence on the impact of sustained exposure to air pollution on life expectancy from China’s Huai River policy. Proceedings of the National Academy of Sciences, 2013, 110(32): 12936-12941. [CrossRef]
- Yang X, Shen S, et al. Spatial and temporal variations of blowing dust events in the Taklimakan Desert. Theoretical and Applied Climatology, 2016, 125: 669-677. [CrossRef]
- Huang R J, Zhang Y, et al. High secondary aerosol contribution to particulate pollution during haze events in China. Nature, 2014, 514(7521): 218-222. [CrossRef]
- Li J, Carlson B E, et al. Recent trends in aerosol optical properties derived from AERONET measurements. Atmospheric Chemistry and Physics, 2014, 14(22): 12271-12289. [CrossRef]
- Wang F, Li Z, et al. Comparative Analysis of Aerosol Vertical Characteristics over the North China Plain Based on Multi-Source Observation Data. Remote Sensing, 2024, 16(4): 609. [CrossRef]
- Liu J, Scheuer E, et al. Brown carbon in the continental troposphere. Geophysical Research Letters, 2014, 41(6): 2191-2195. [CrossRef]
- Liu Y, Sato Y, et al. Modeling study on the transport of summer dust and anthropogenic aerosols over the Tibetan Plateau. Atmospheric Chemistry and Physics, 2015, 15(21): 12581-12594. [CrossRef]
- Wang Q, Sun Y, et al. Vertically resolved characteristics of air pollution during two severe winter haze episodes in urban Beijing, China. Atmospheric Chemistry and Physics, 2018, 18(4): 2495-2509. [CrossRef]
- Liu S, Aiken A C, et al. Enhanced light absorption by mixed source black and brown carbon particles in UK winter. Nature communications, 2015, 6(1): 8435. [CrossRef]
- Yang M, Howell S G, et al. Attribution of aerosol light absorption to black carbon, brown carbon, and dust in China–interpretations of atmospheric measurements during EAST-AIRE. Atmospheric Chemistry and Physics, 2009, 9(6): 2035-2050.
- Zhang Q, Jimenez J L, et al. Ubiquity and dominance of oxygenated species in organic aerosols in anthropogenically-influenced Northern Hemisphere midlatitudes. Geophysical research letters, 2007, 34(13). [CrossRef]
- Bellouin N, Quaas J, et al. Bounding global aerosol radiative forcing of climate change. Reviews of Geophysics, 2020, 58(1): e2019RG000660. [CrossRef]
Figure 1.
Map of the Yinchuan study area, showing the CE-318 sun-photometer location (red star) and surrounding deserts (Badian Jaran, Tengger, etc.).
Figure 1.
Map of the Yinchuan study area, showing the CE-318 sun-photometer location (red star) and surrounding deserts (Badian Jaran, Tengger, etc.).
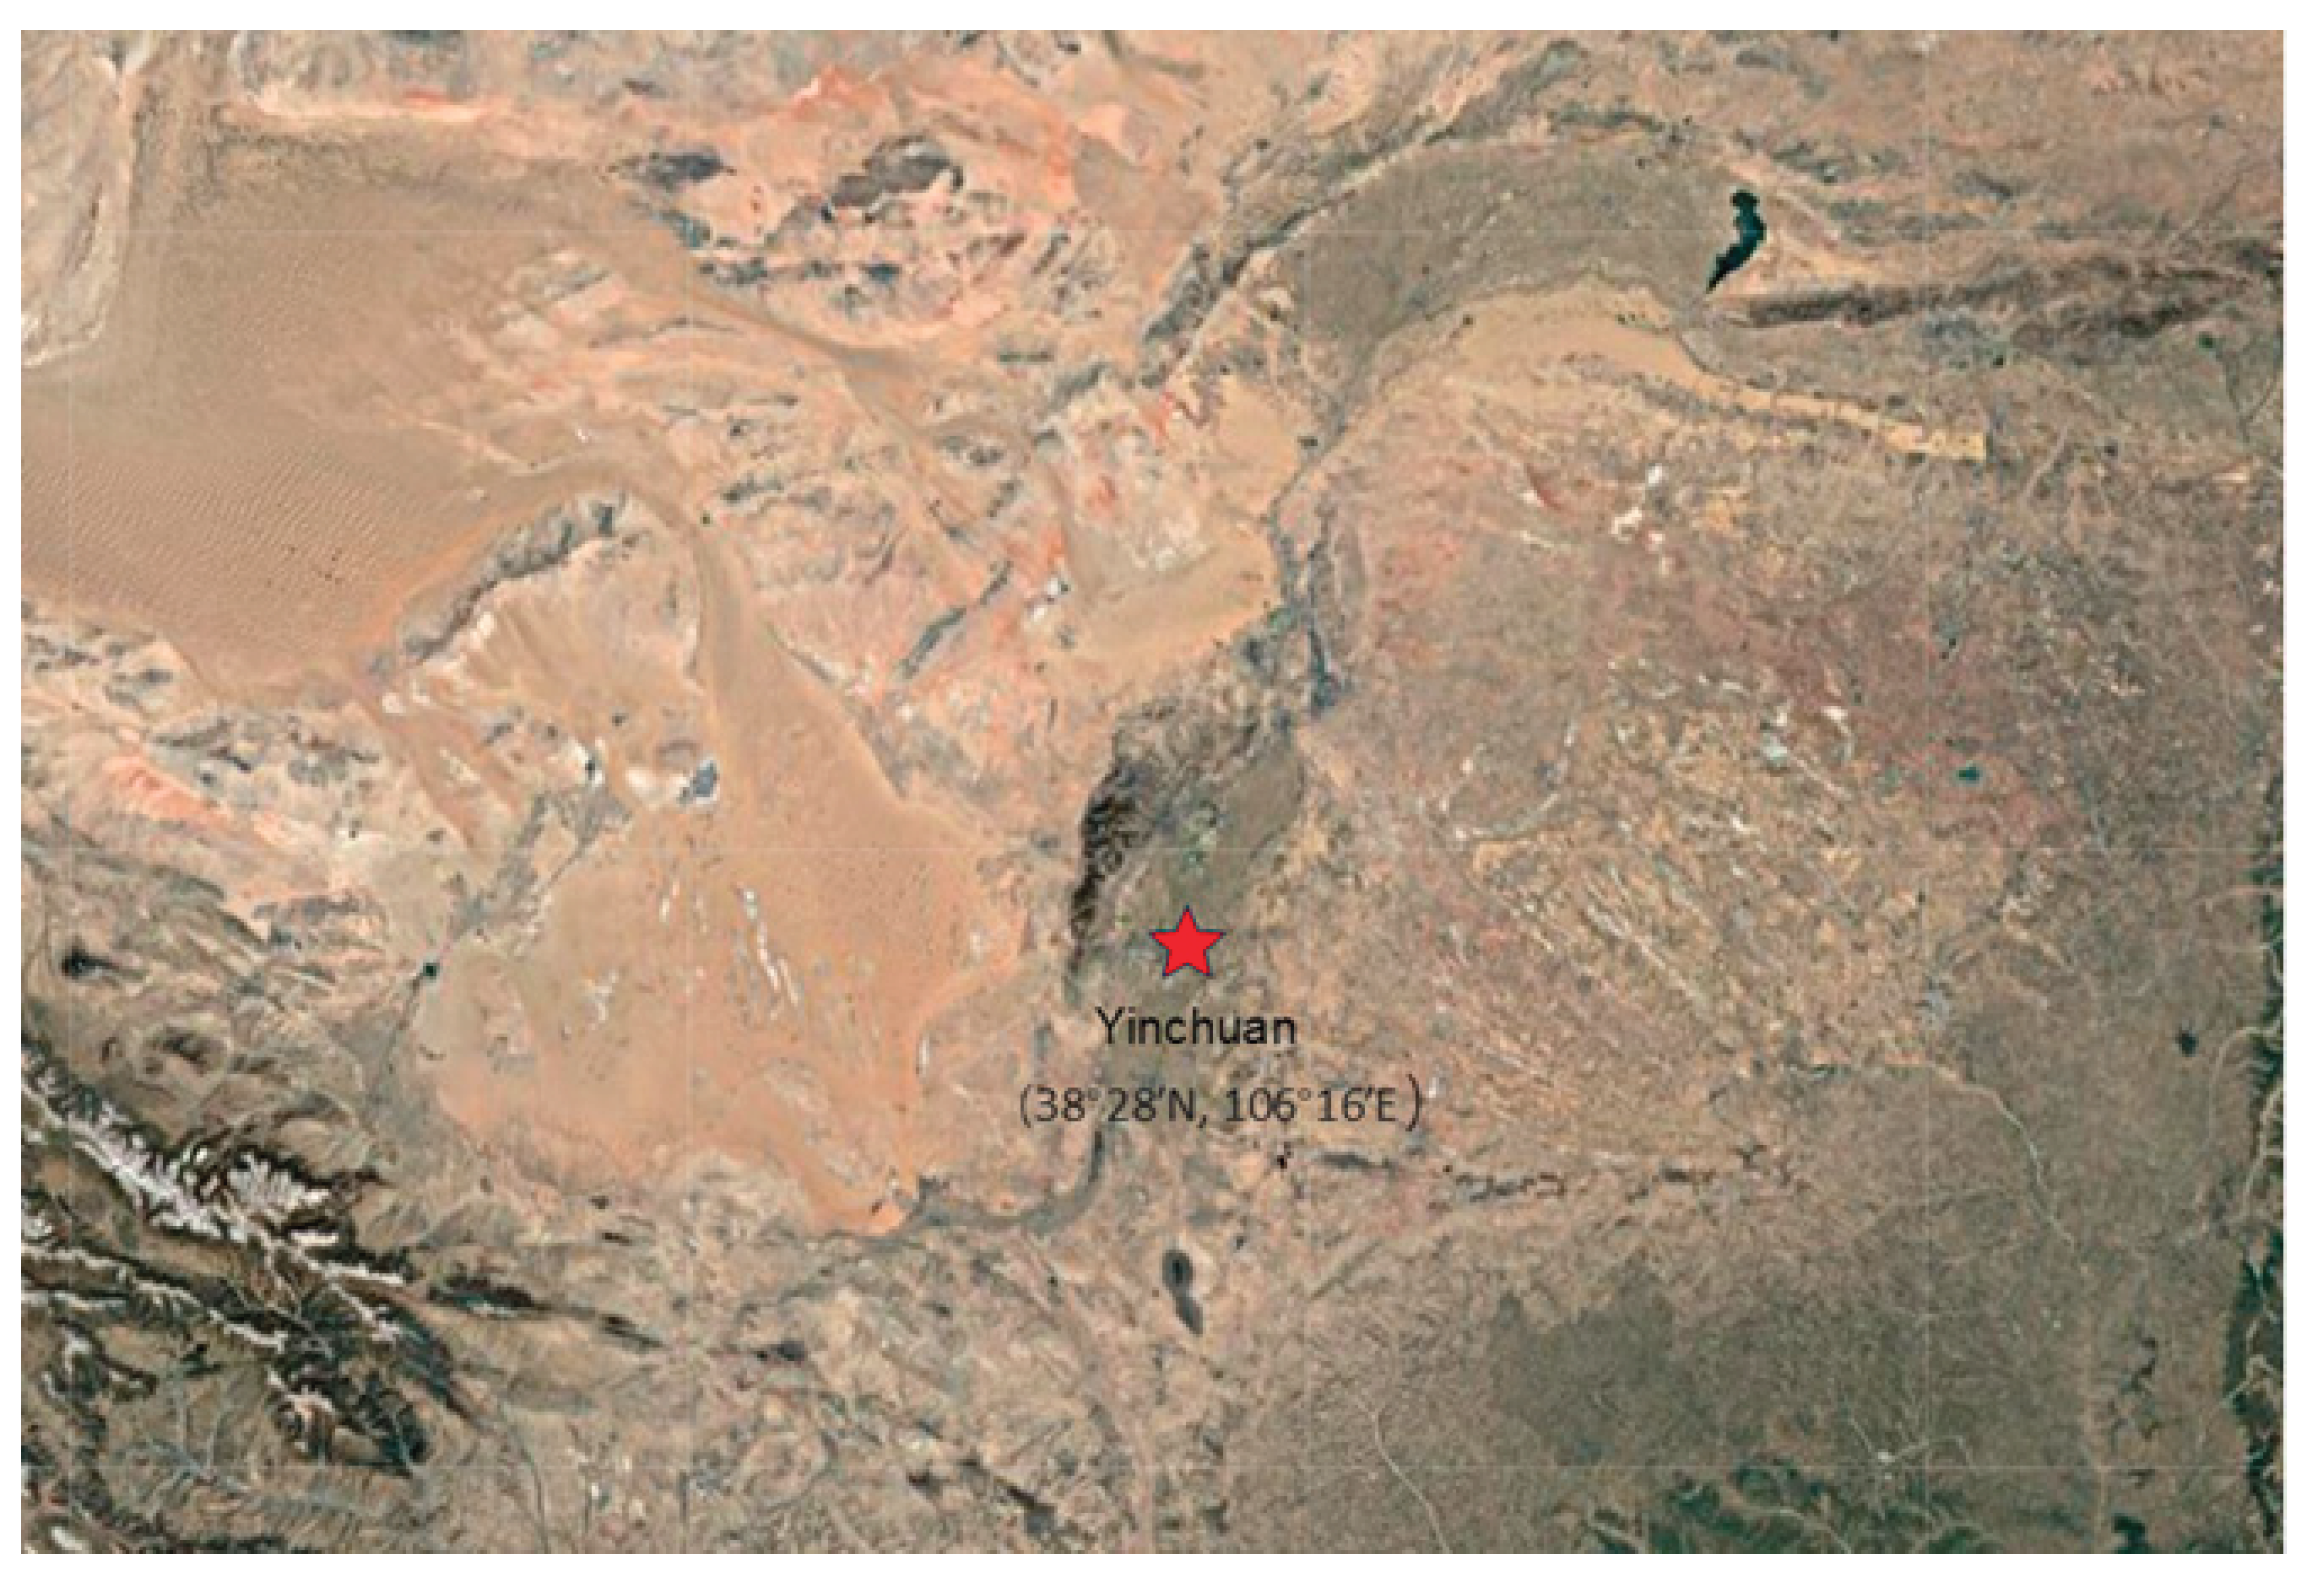
Figure 2.
Research on the Synergistic Radiative Effects of Dust and Anthropogenic Aerosols.
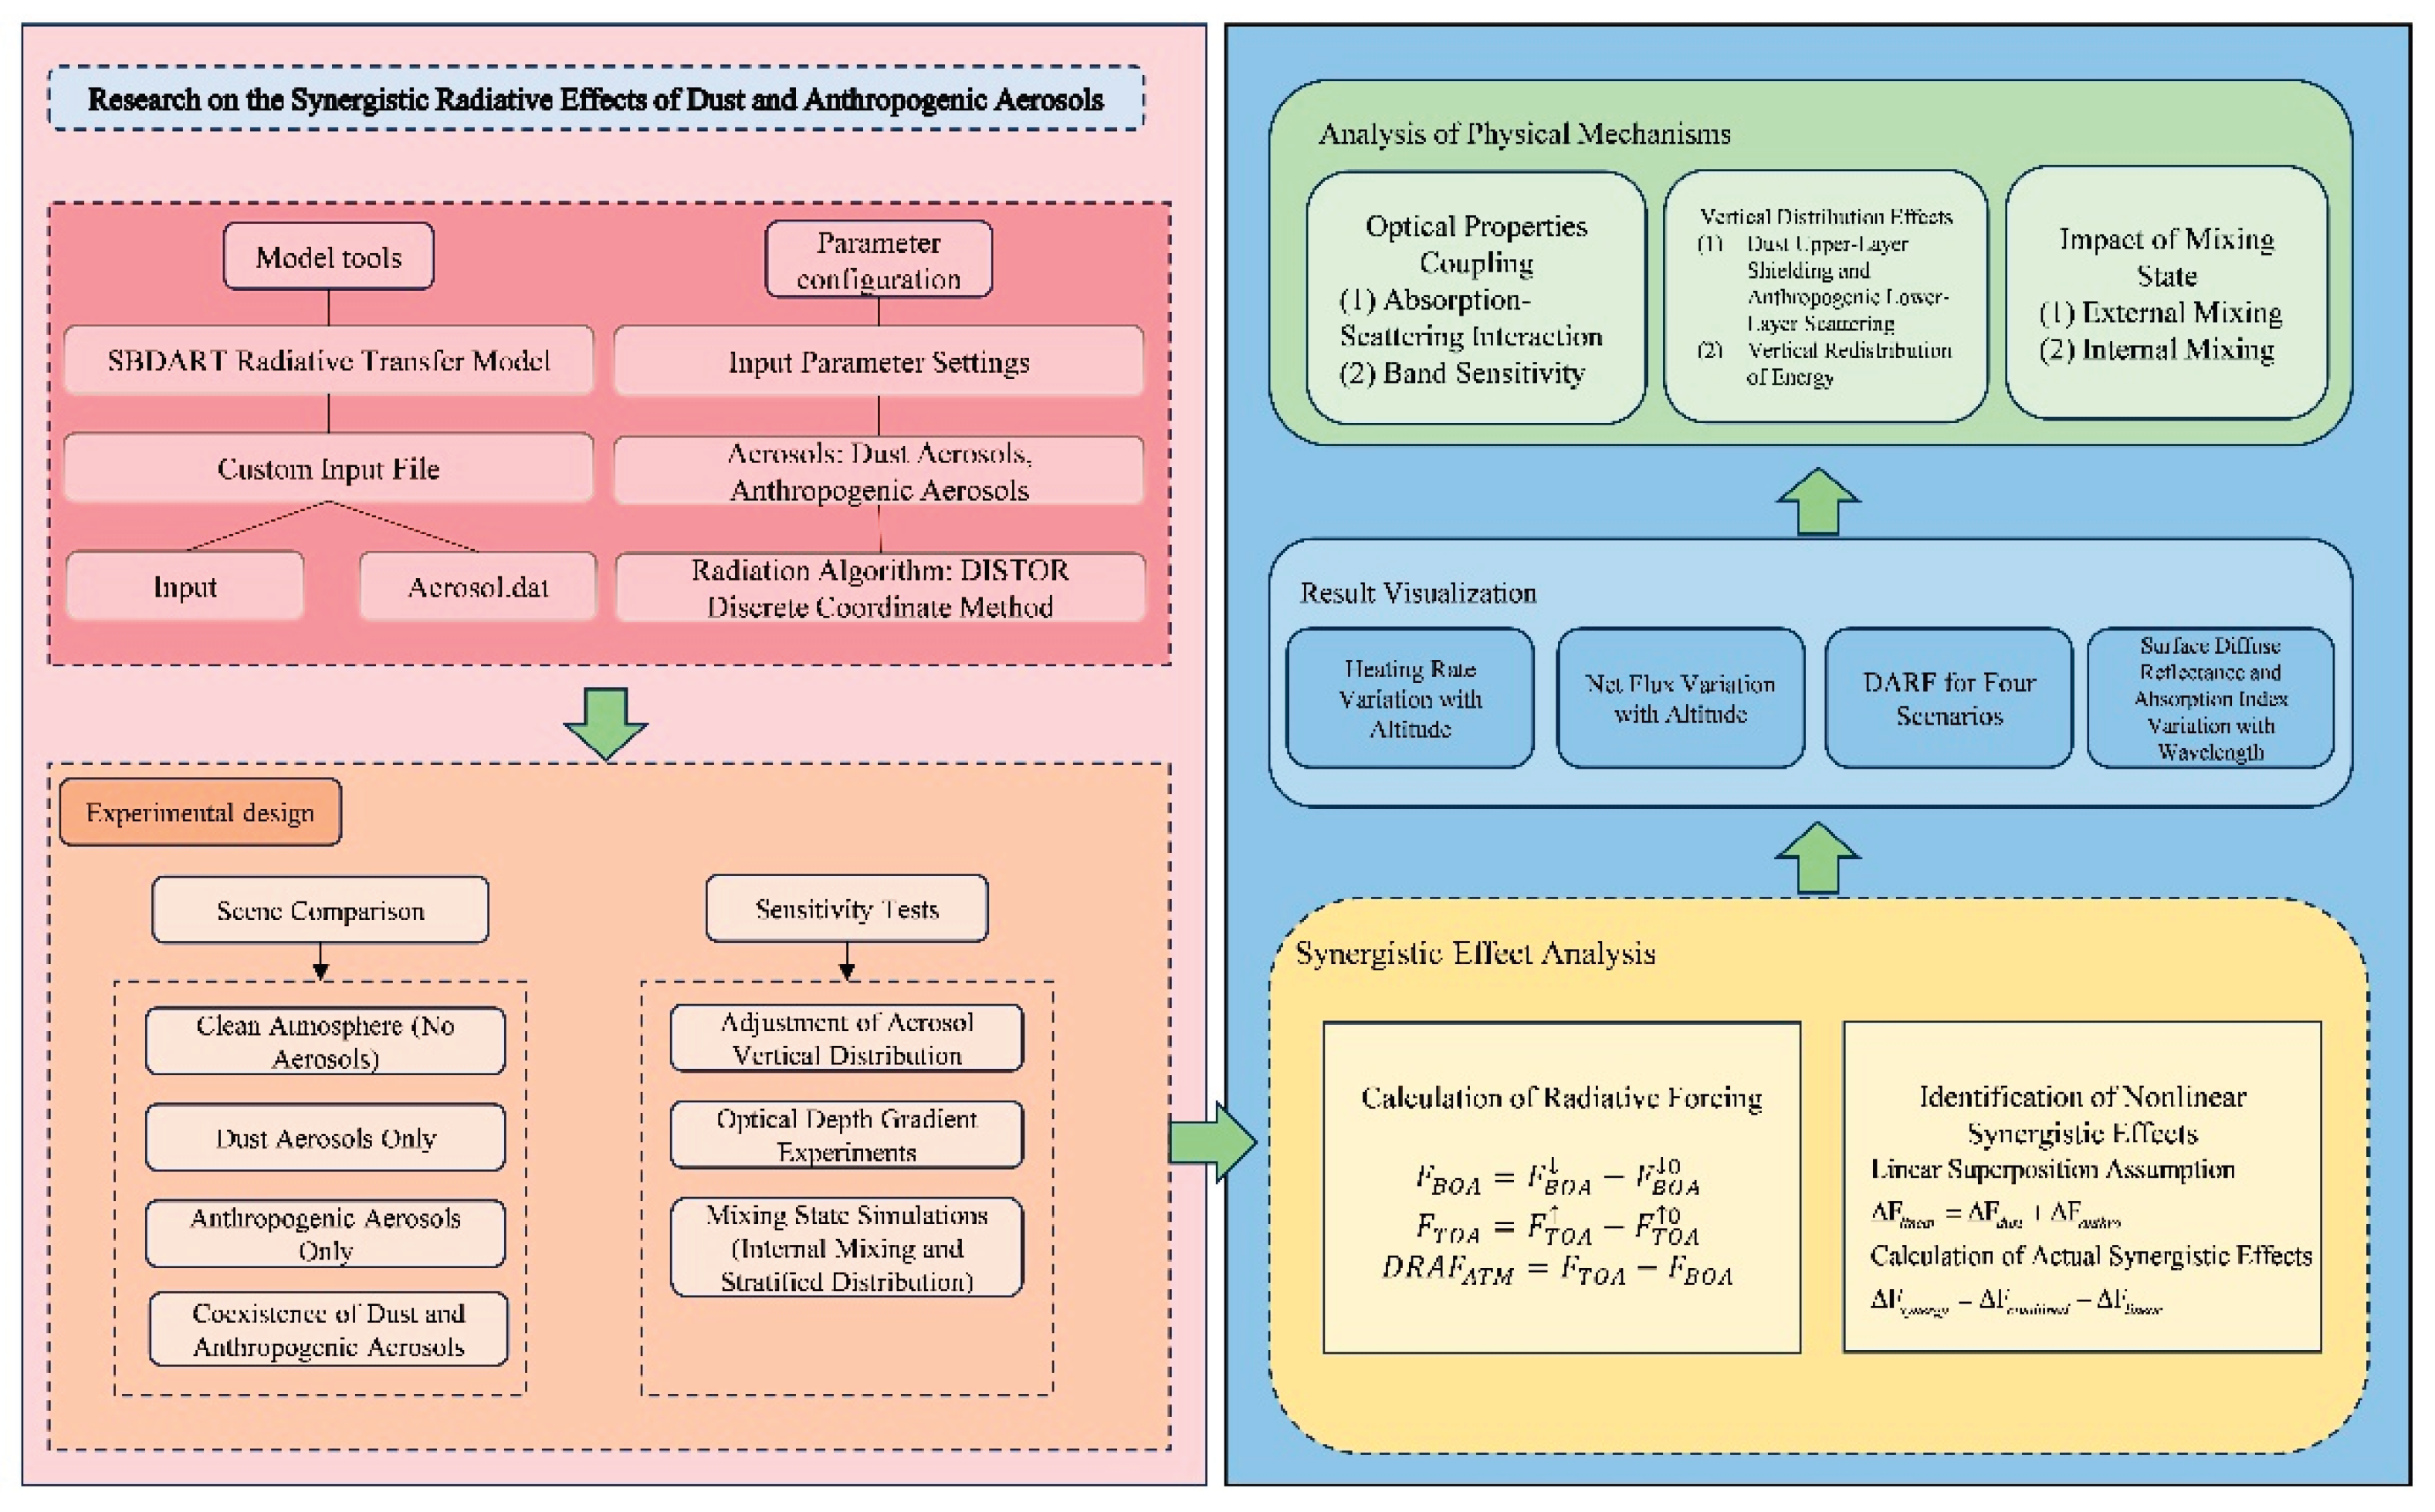
Figure 3.
a) Season a variations in Aerosol Optical Depth (AOD) at various wavelengths in the Yinchuan region during 2023;(b) The HYSPLIT backward-trajectory clustering diagram of the four seasons in the Yinchuan area.
Figure 3.
a) Season a variations in Aerosol Optical Depth (AOD) at various wavelengths in the Yinchuan region during 2023;(b) The HYSPLIT backward-trajectory clustering diagram of the four seasons in the Yinchuan area.
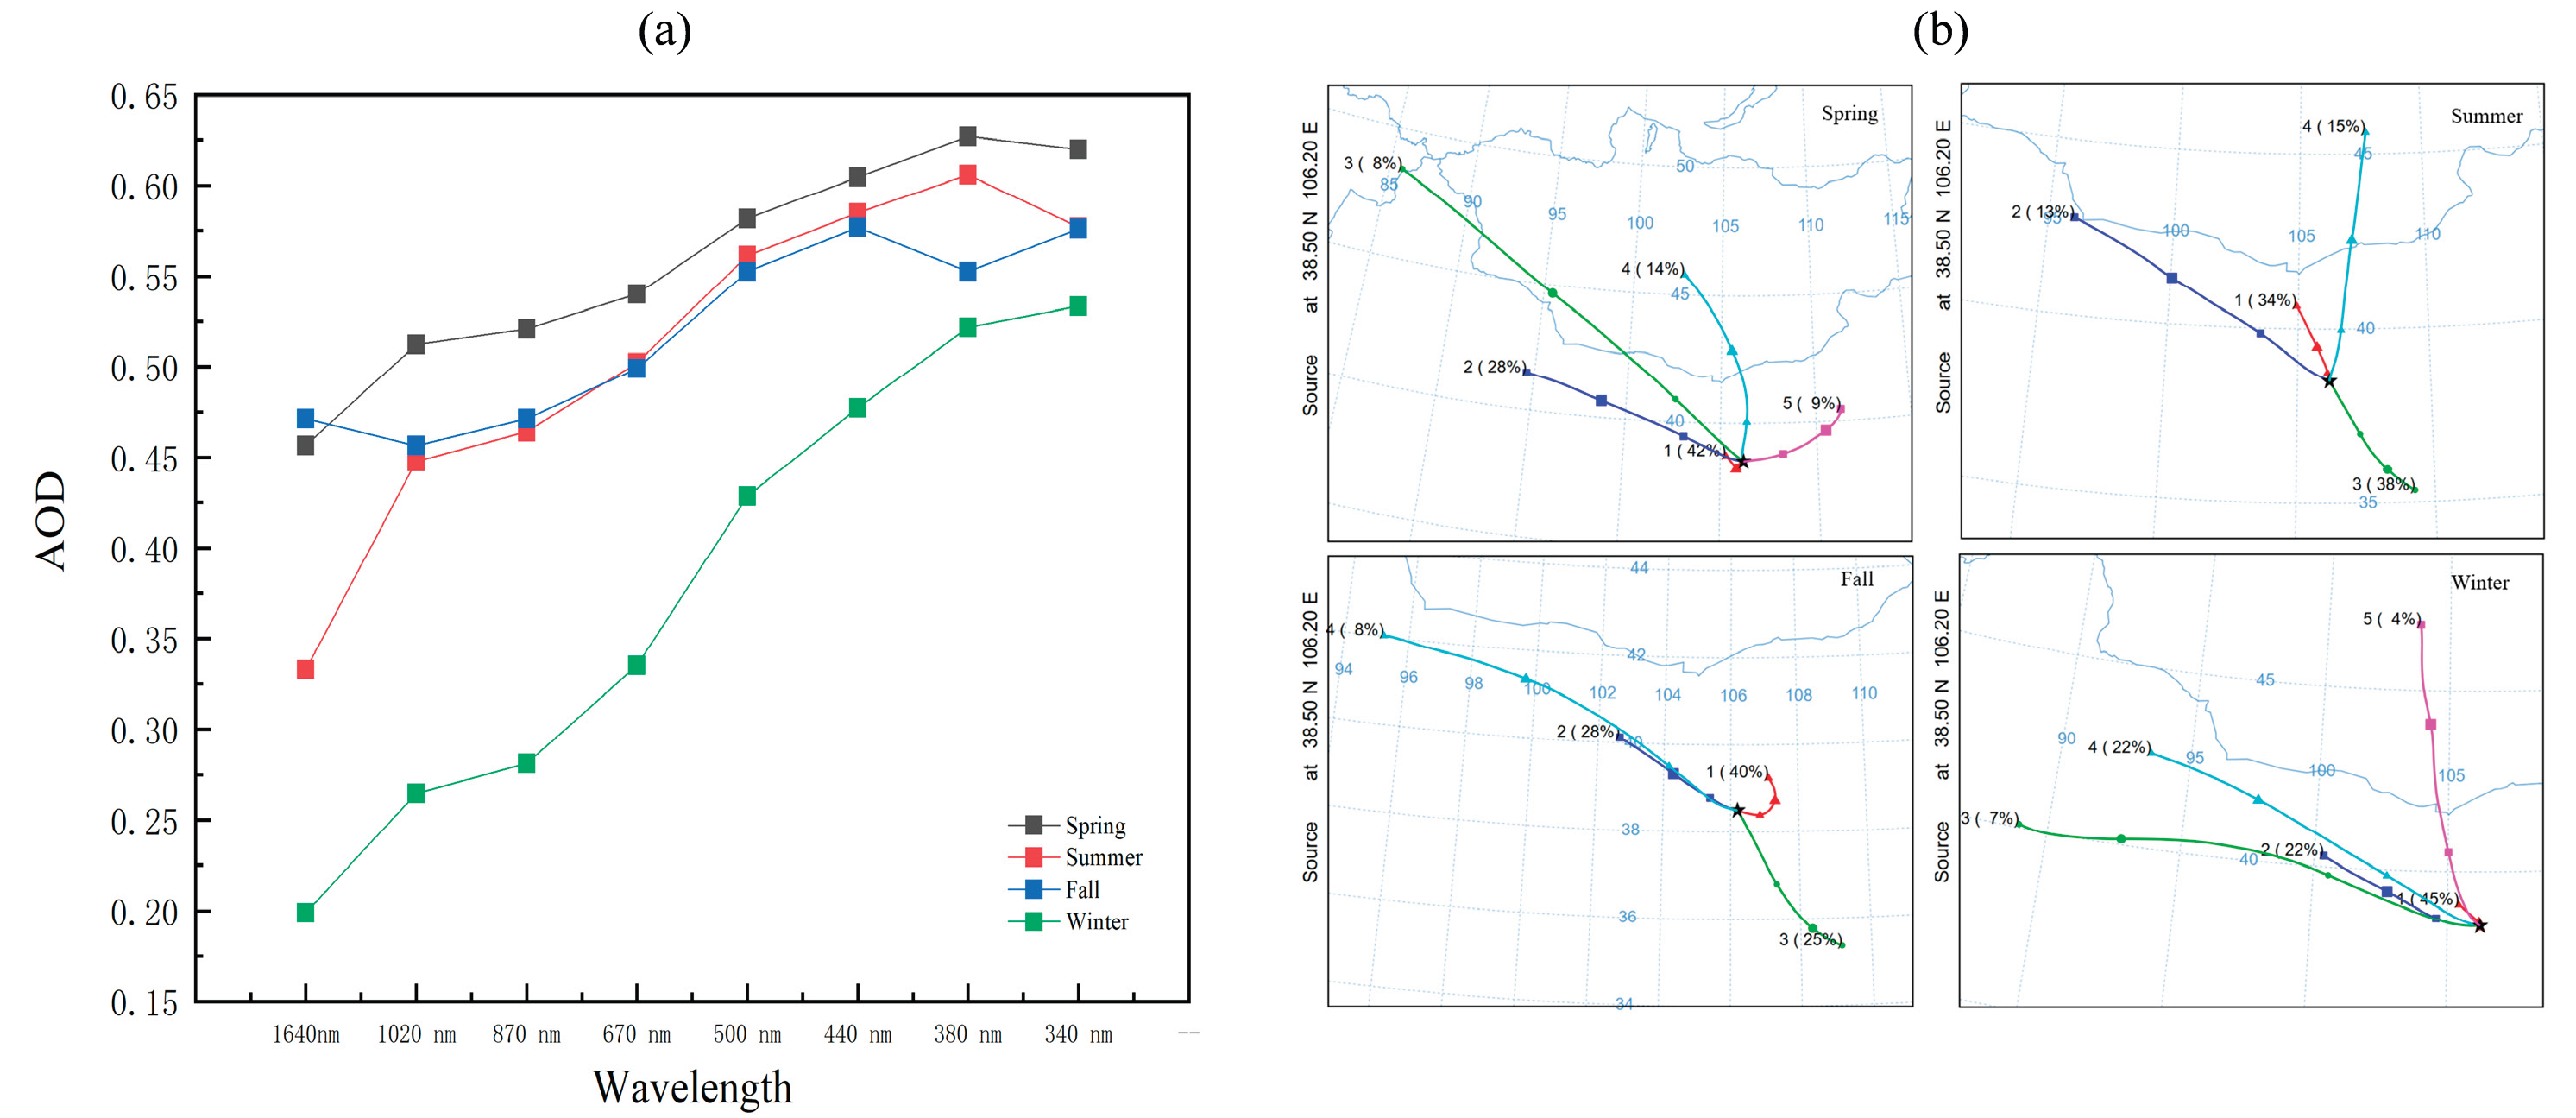
Figure 4.
The monthly variation trend of the Ångström Index.
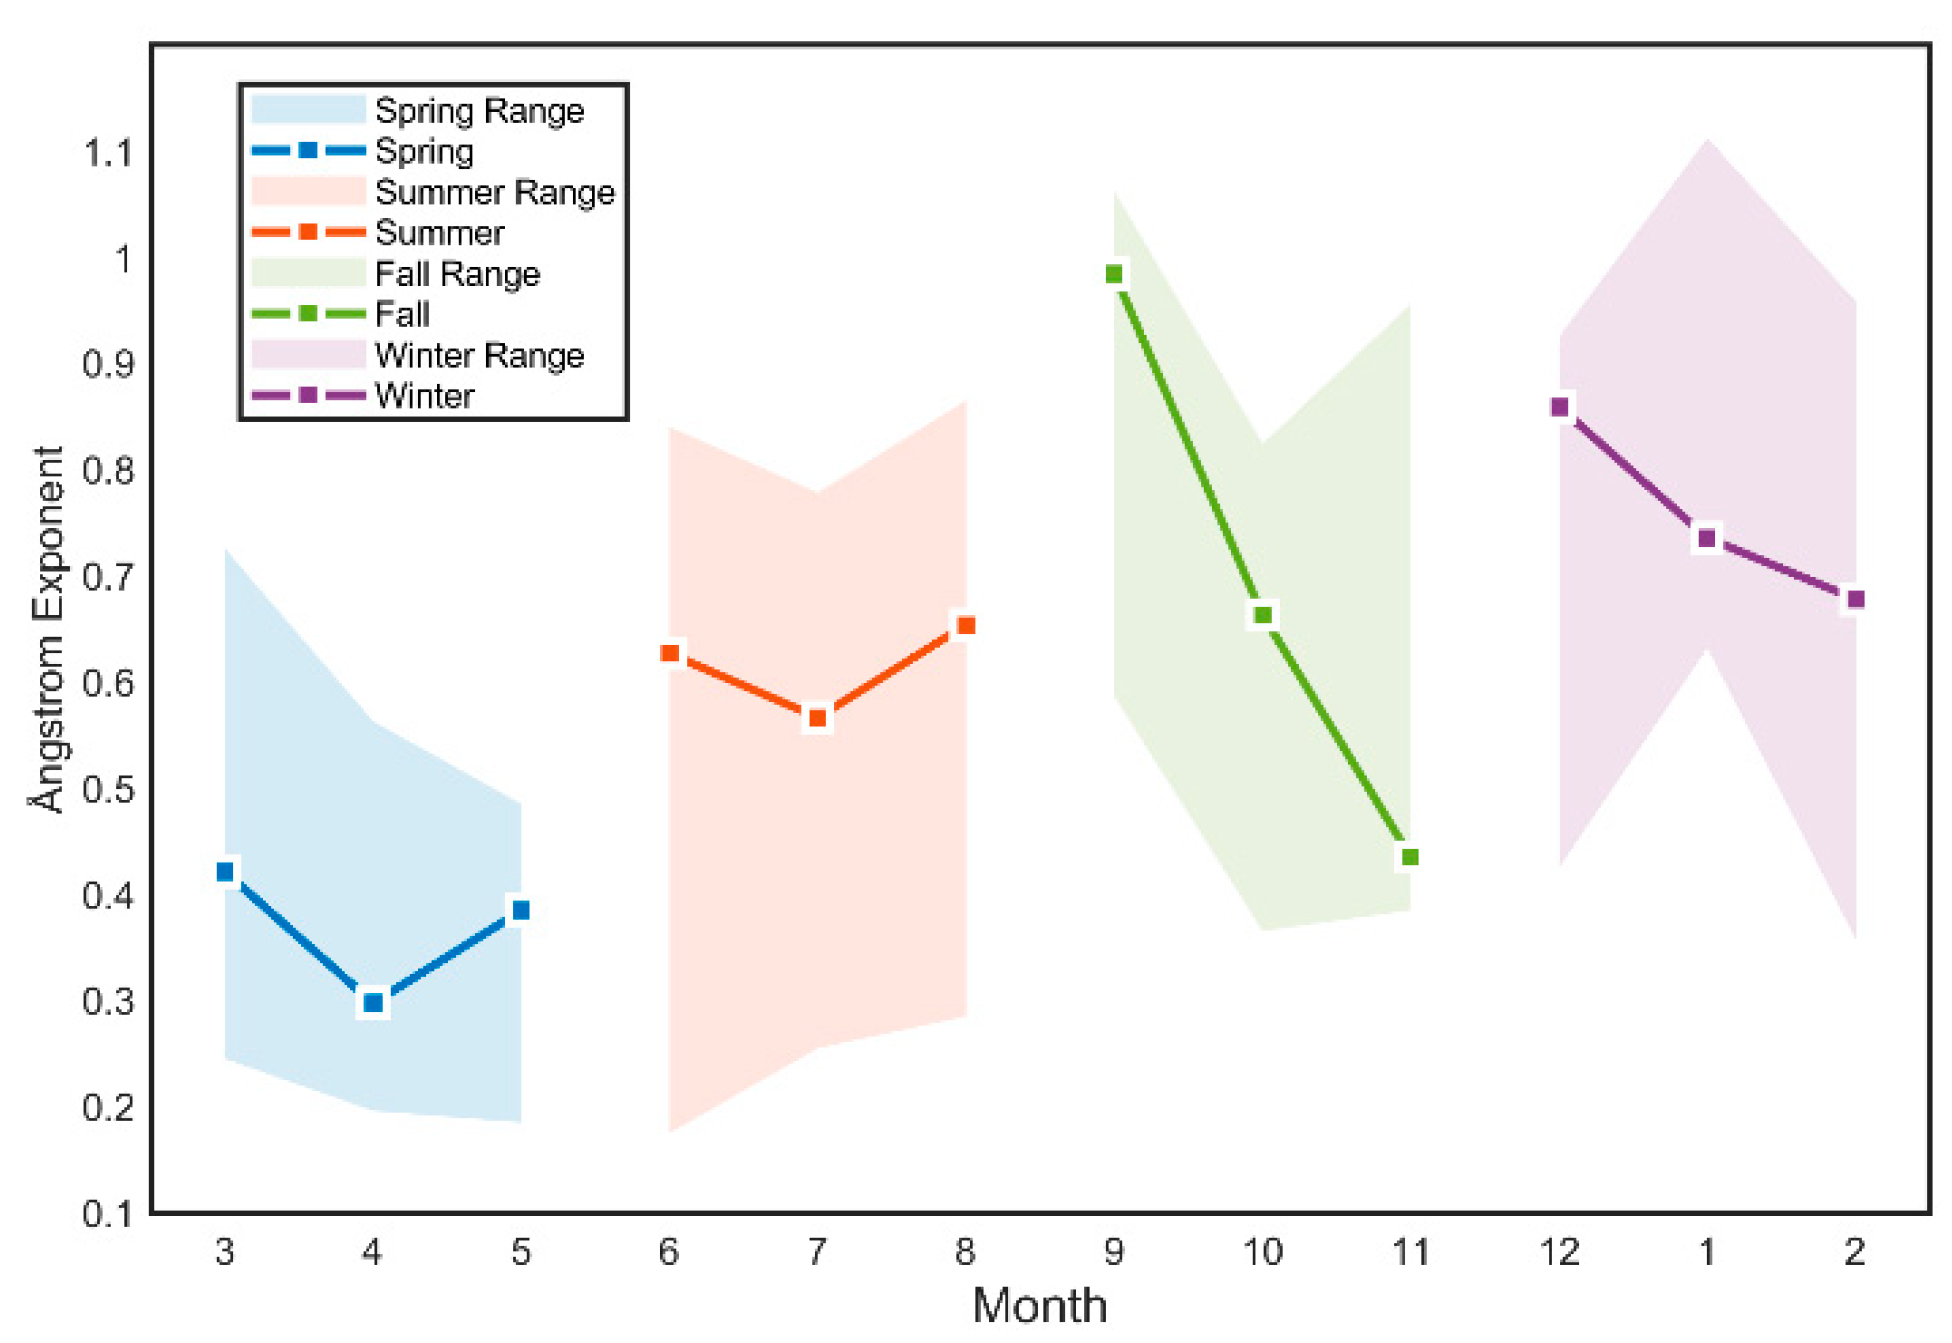
Figure 5.
Single Scattering Albedo (SSA) at different wavelengths across various seasons;(b) Seasonal Characteristics of Aerosol Size Distribution in the Yinchuan Region.
Figure 5.
Single Scattering Albedo (SSA) at different wavelengths across various seasons;(b) Seasonal Characteristics of Aerosol Size Distribution in the Yinchuan Region.
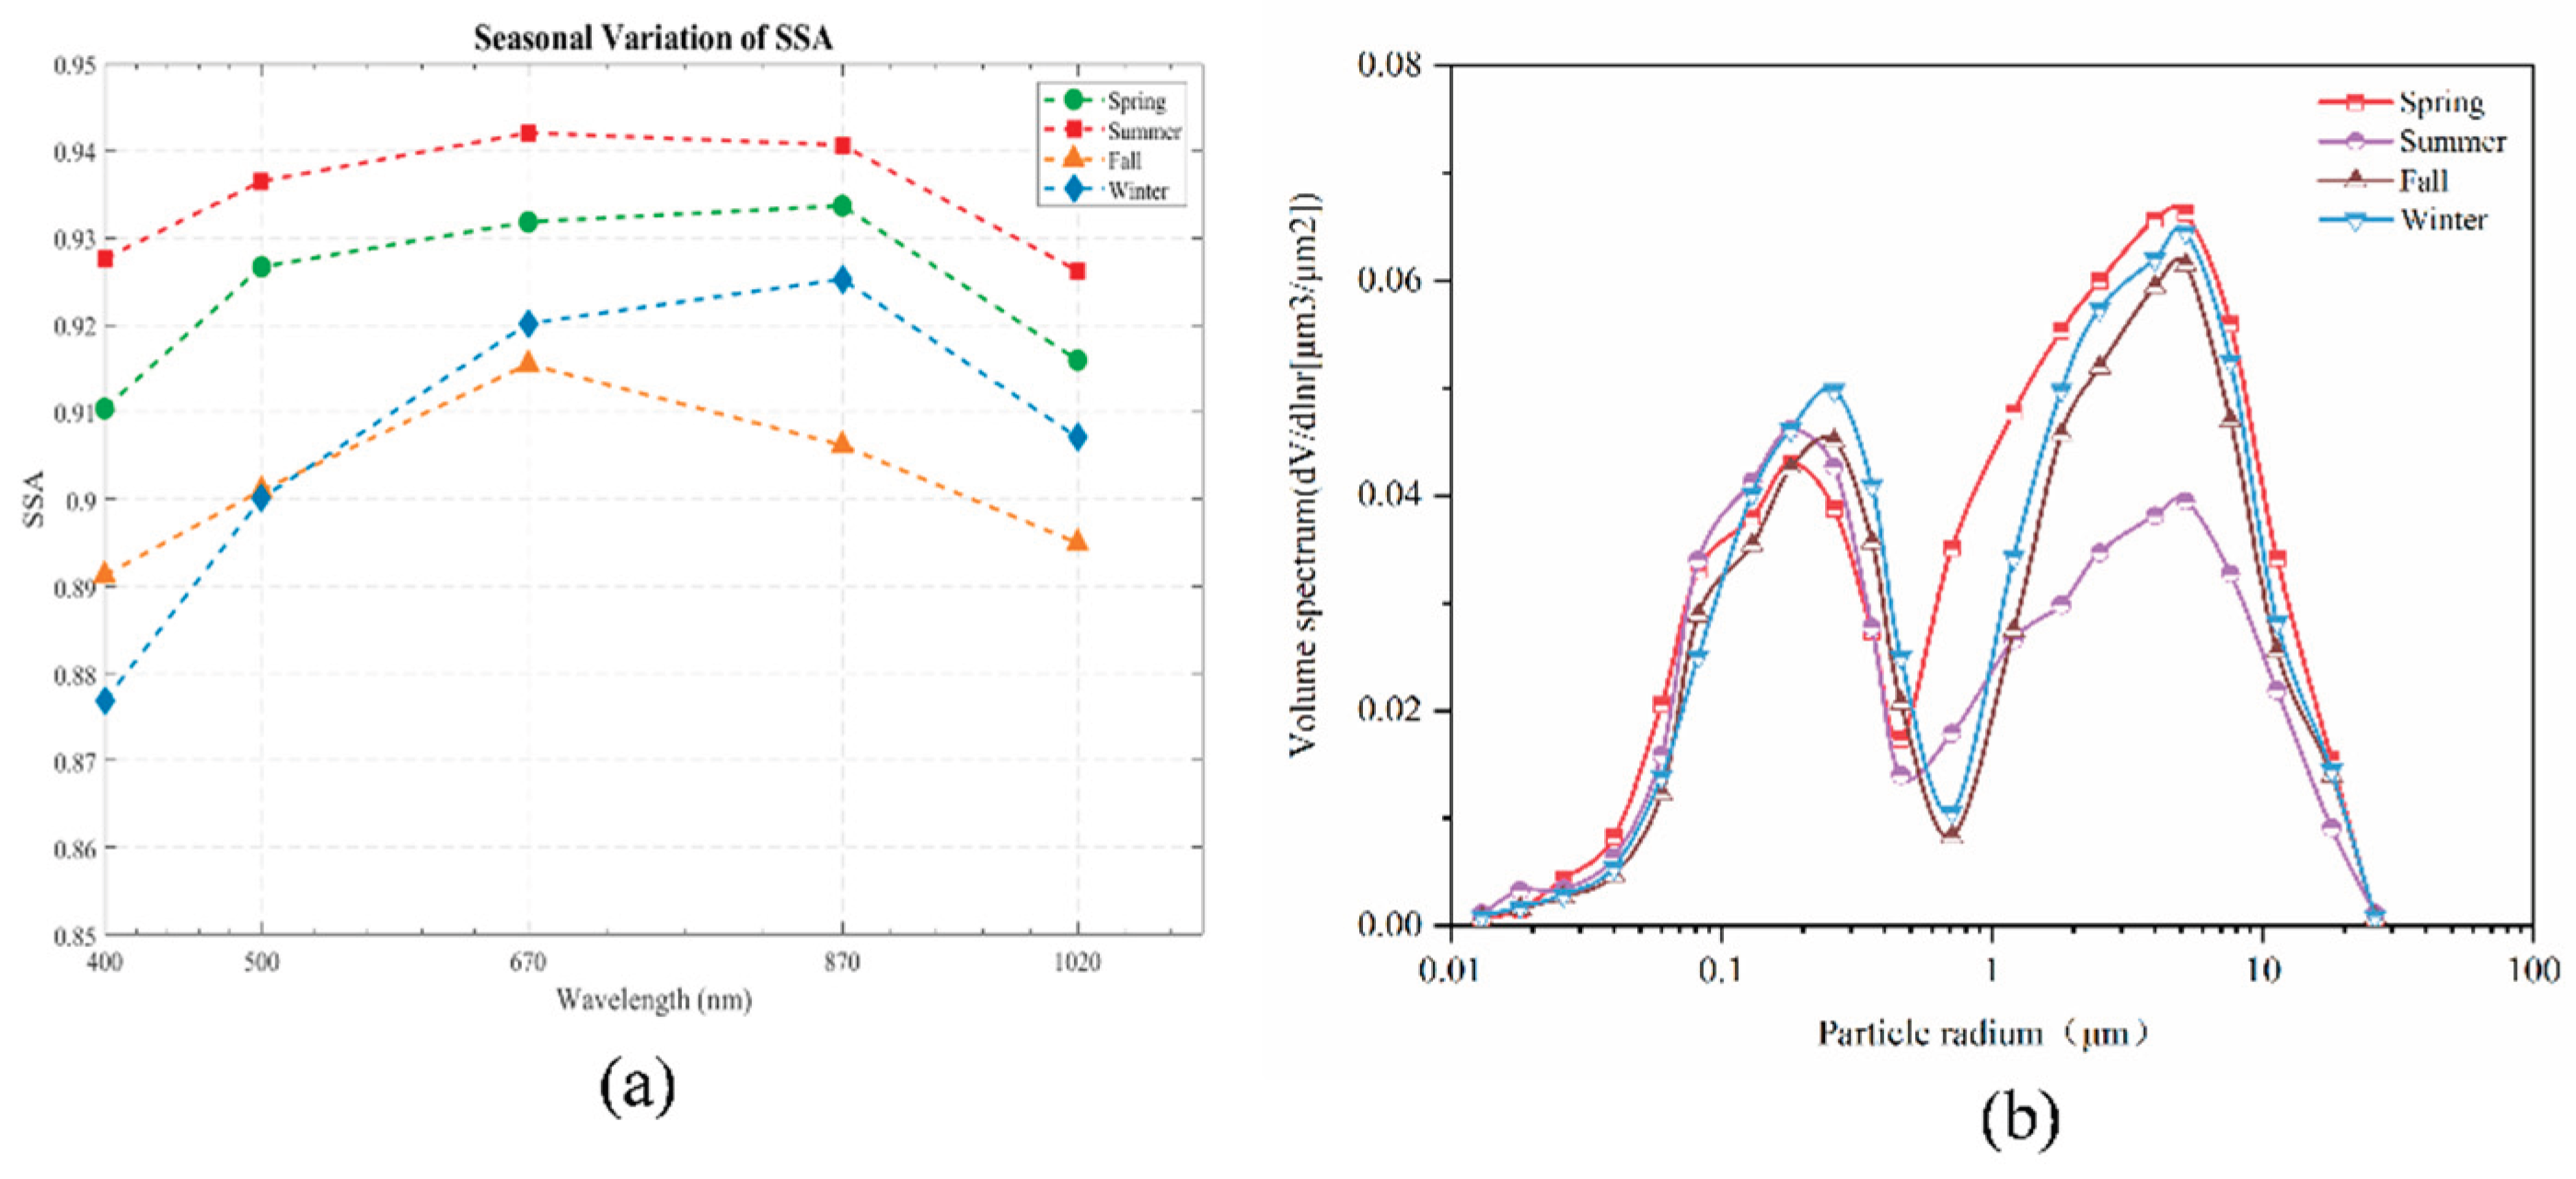
Figure 6.
Variation trend of aerosol direct radiative forcing in the Yinchuan region during 2023.
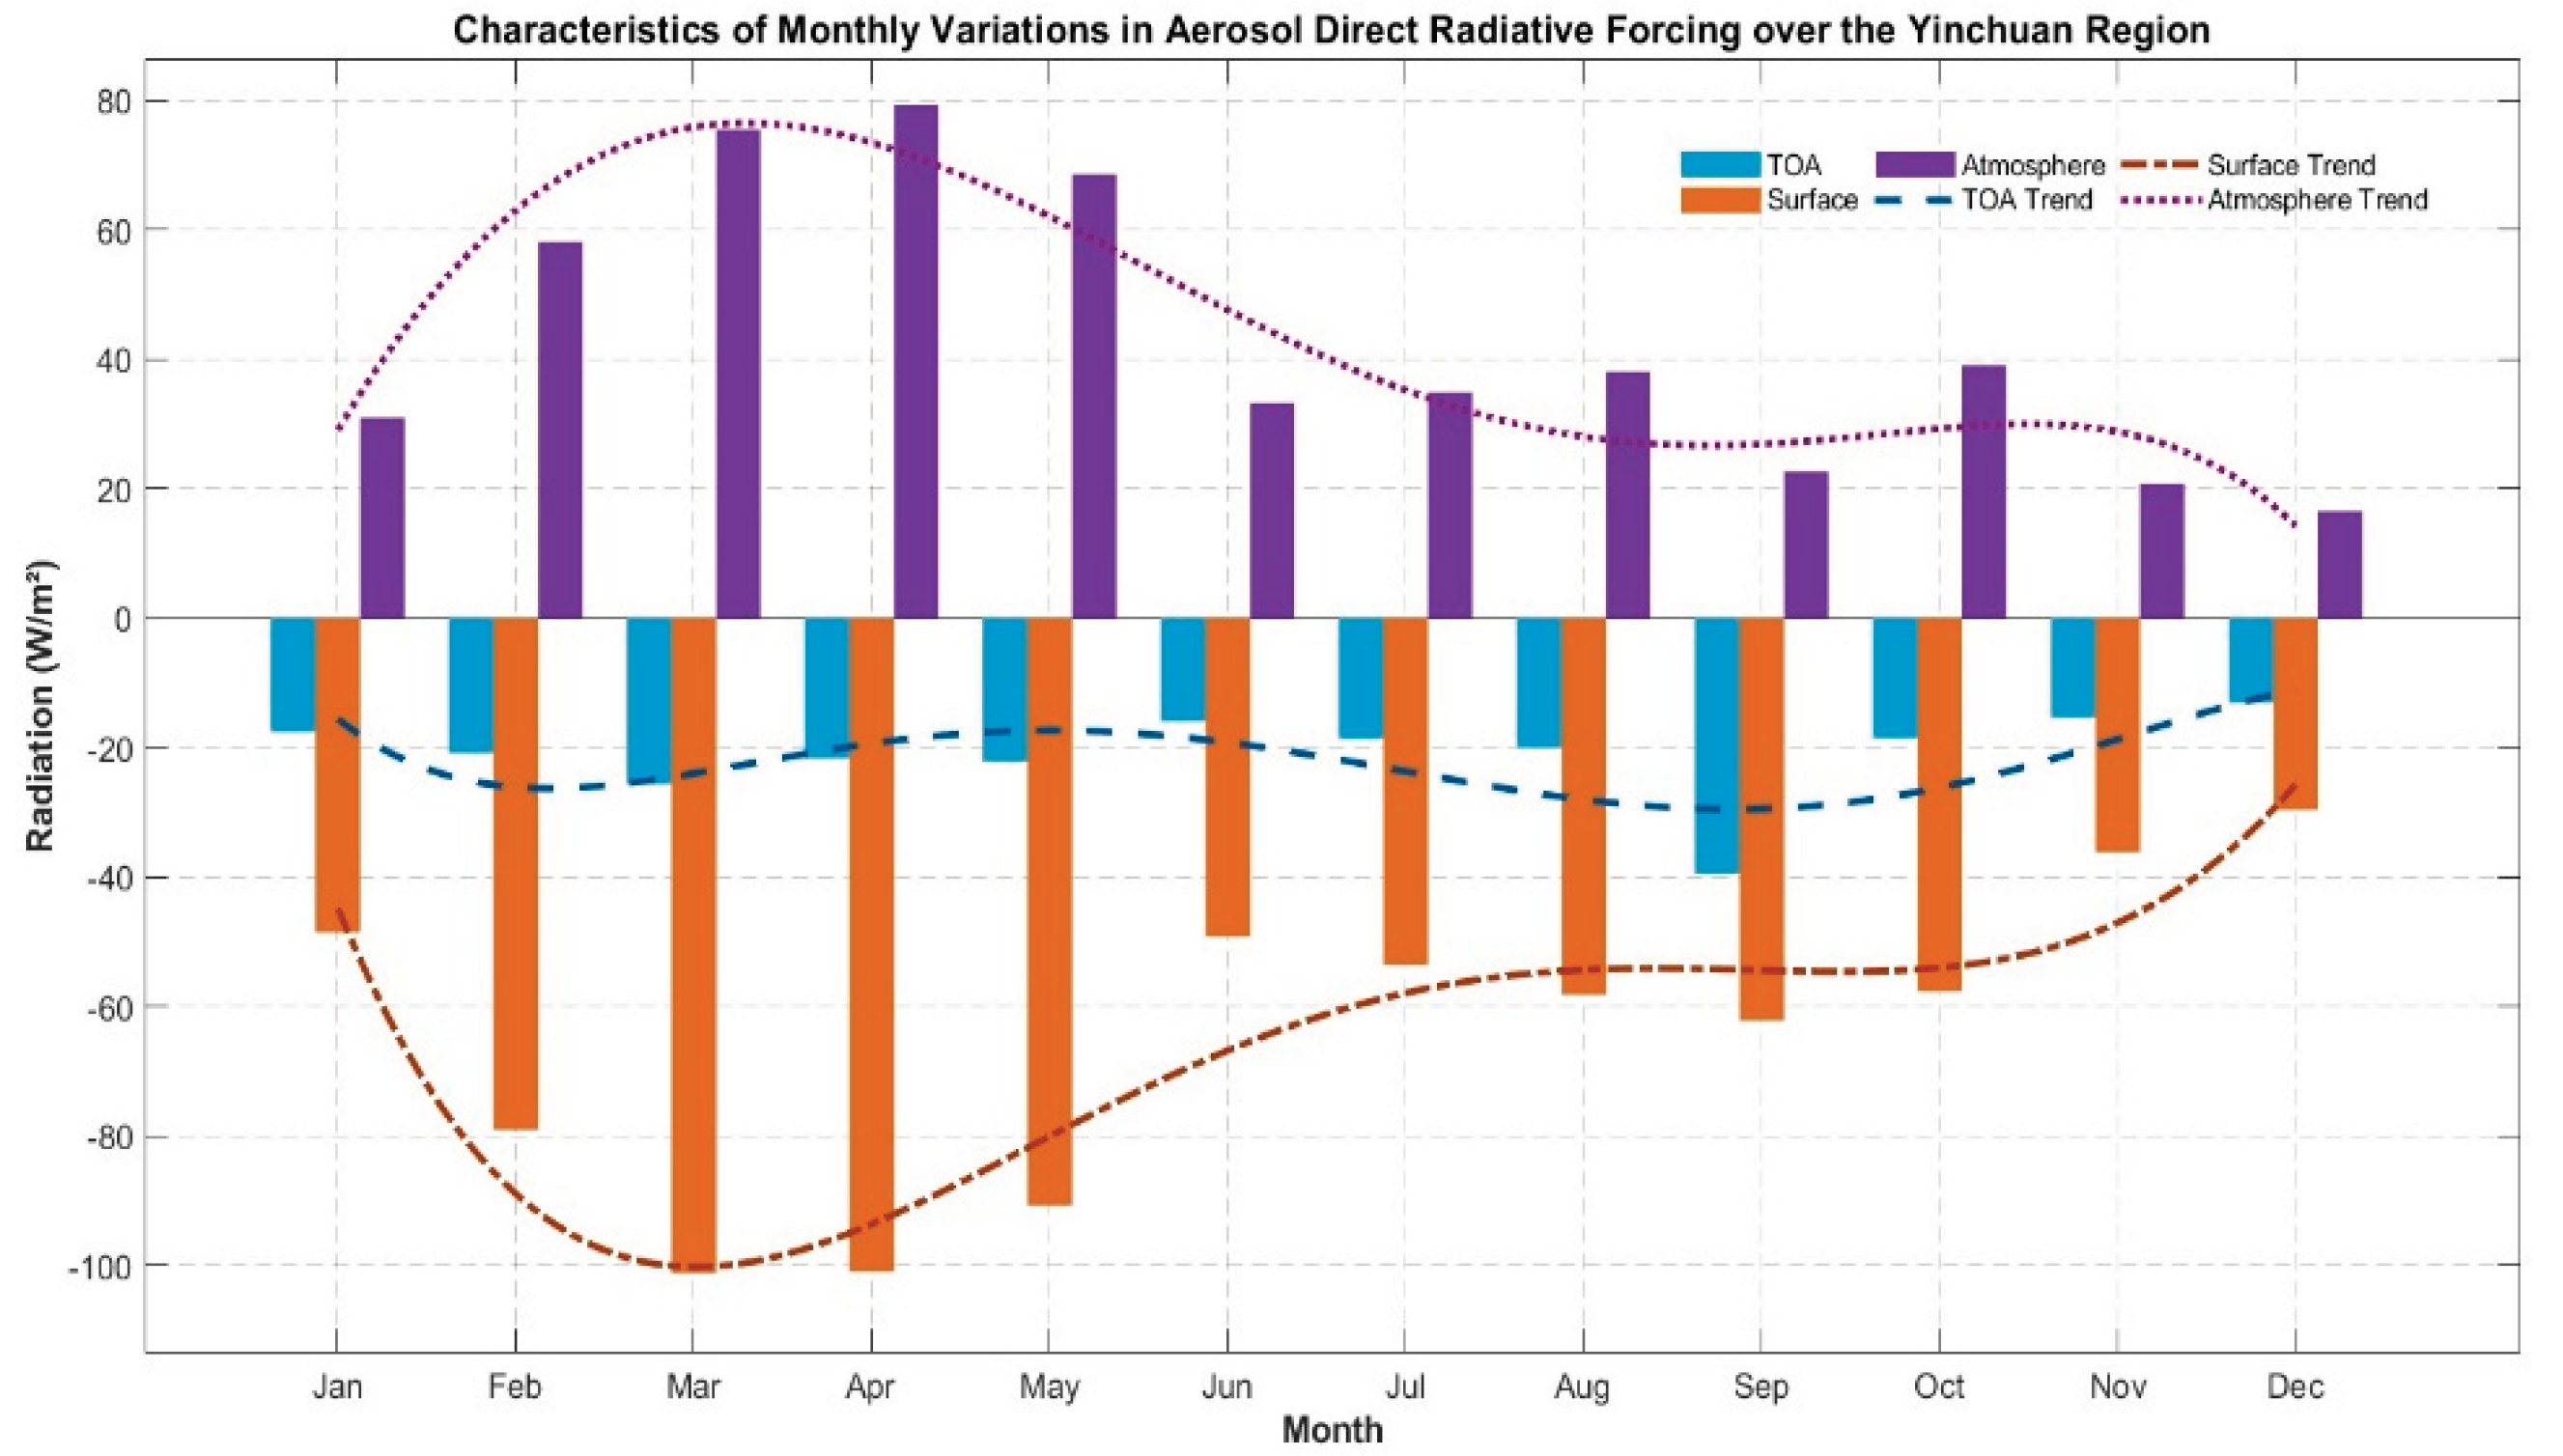
Figure 7.
Vertical profiles of heating rate (K day⁻¹) for four aerosol scenarios (Dust, Anthropogenic, External Mixing, Internal Mixing) in Yinchuan, 2023.
Figure 7.
Vertical profiles of heating rate (K day⁻¹) for four aerosol scenarios (Dust, Anthropogenic, External Mixing, Internal Mixing) in Yinchuan, 2023.
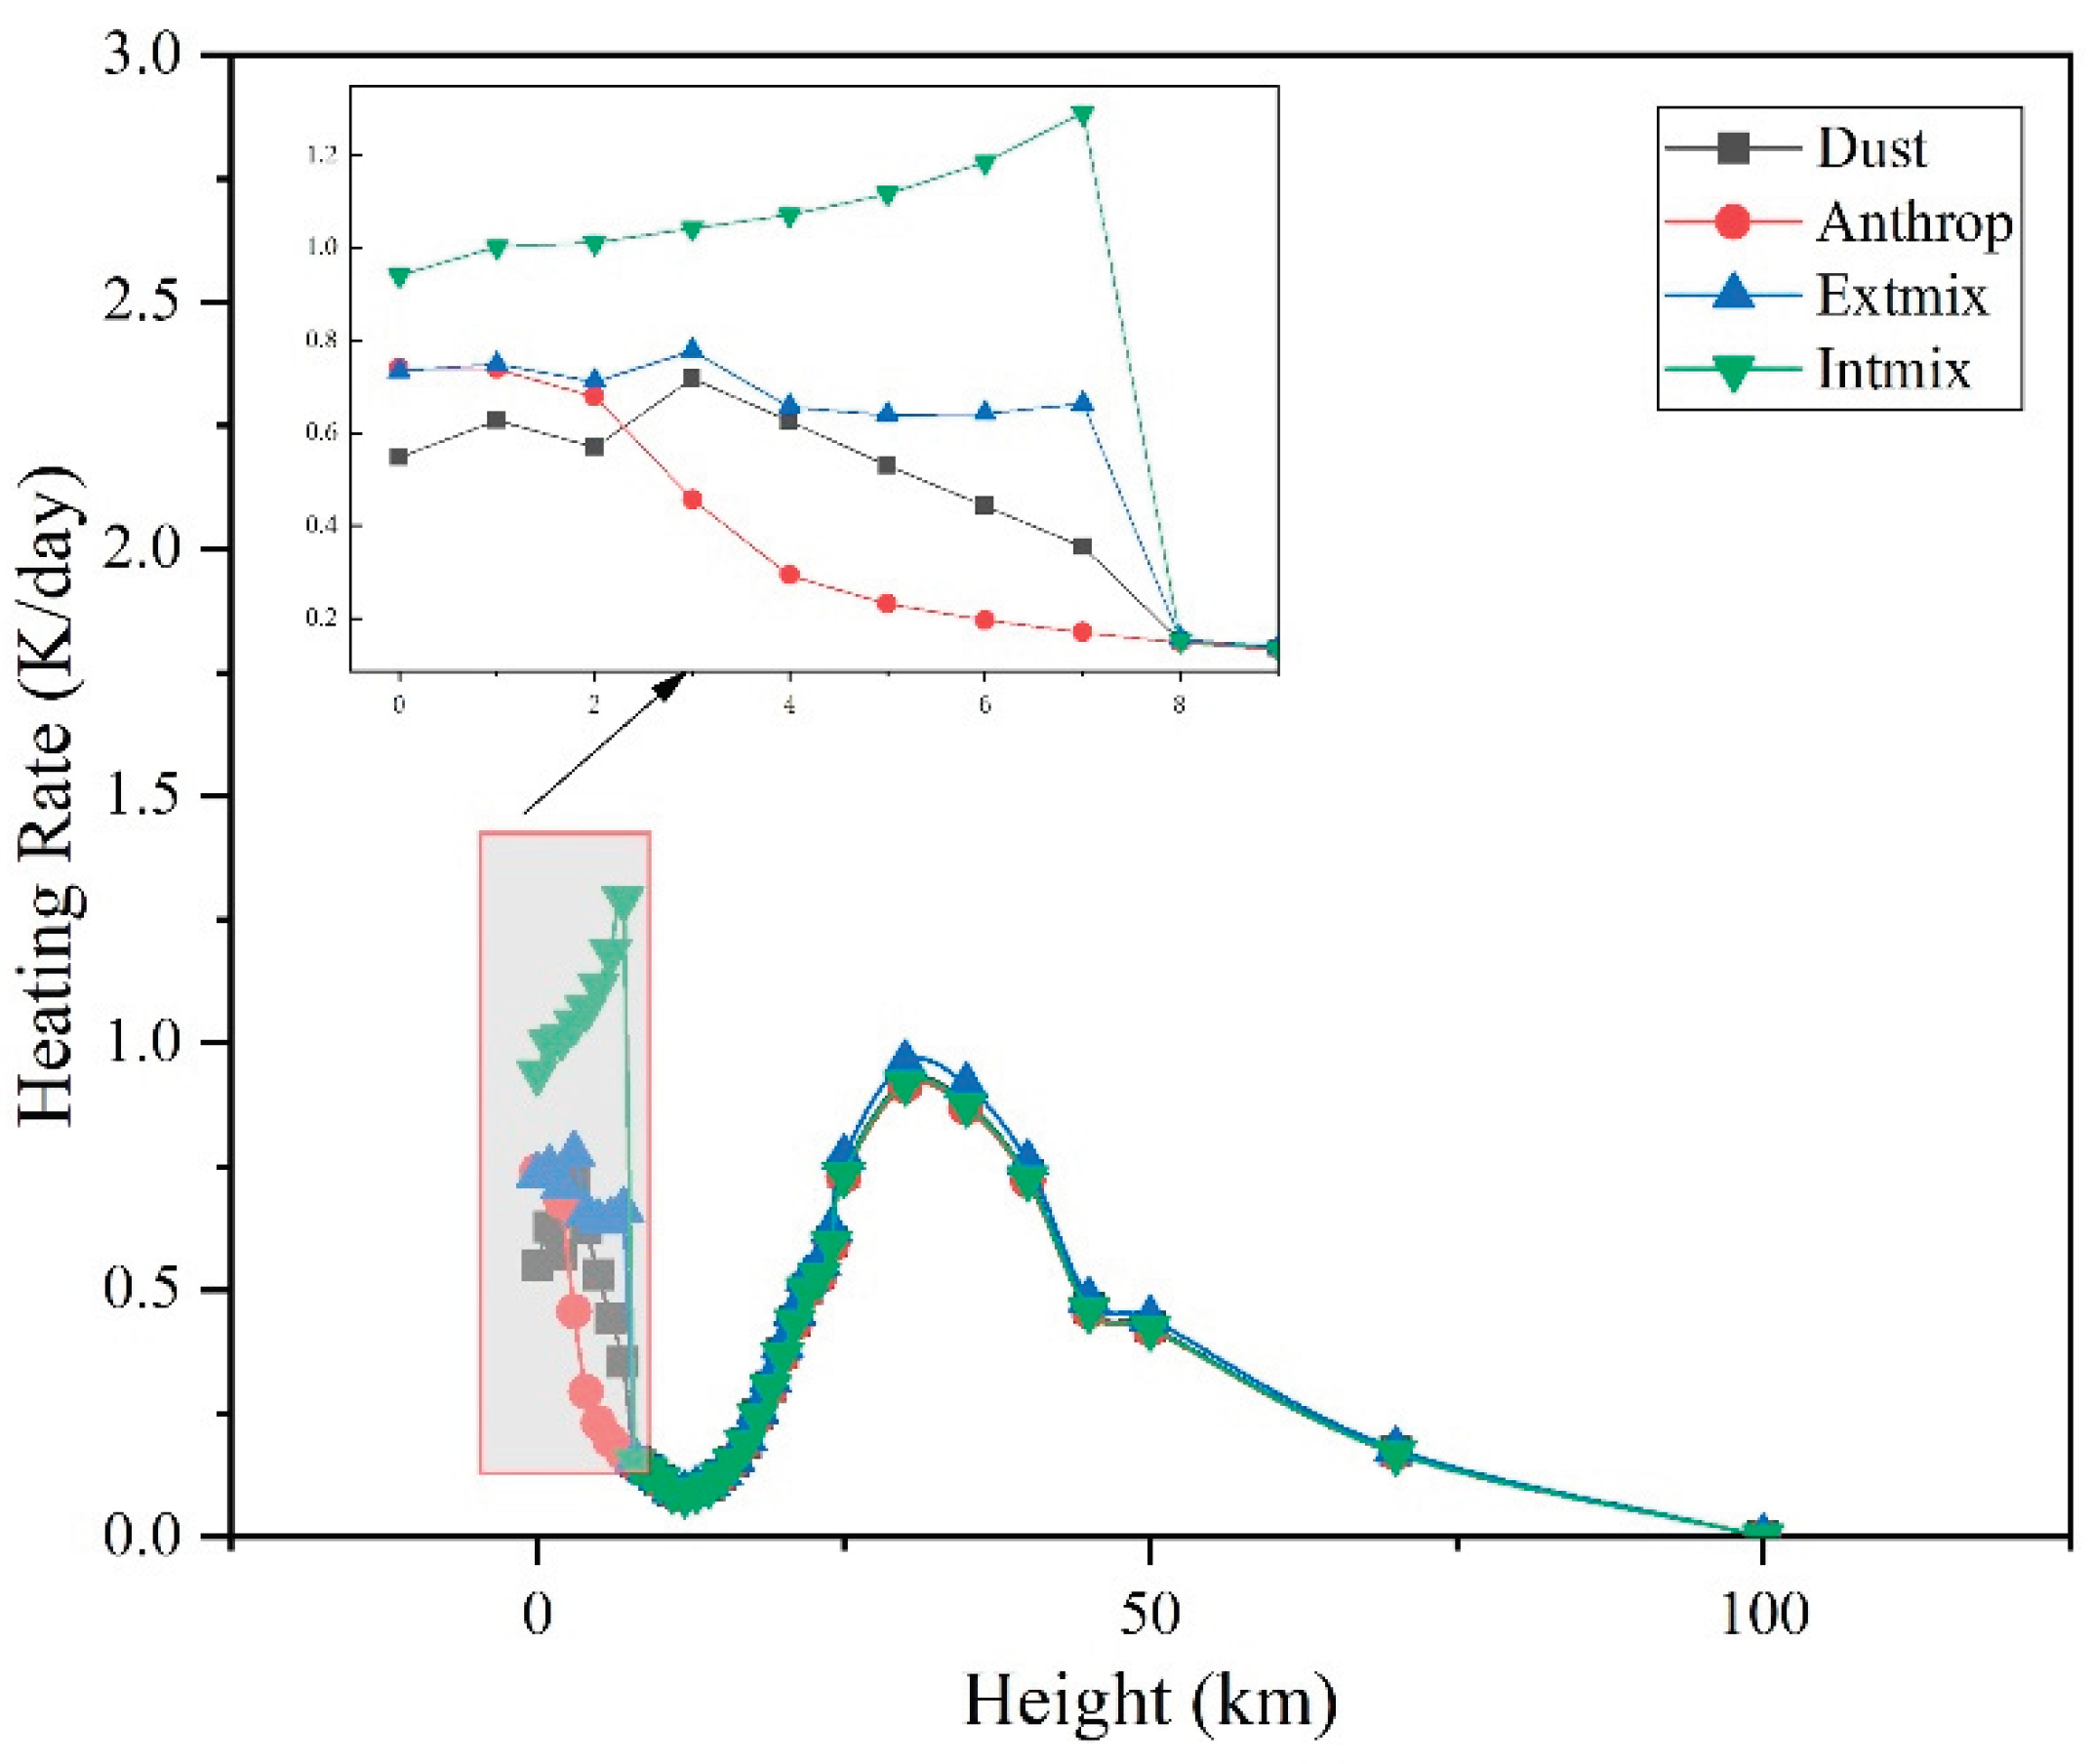
Figure 8.
Vertical Profiles of Net Flux for Four Scenarios.
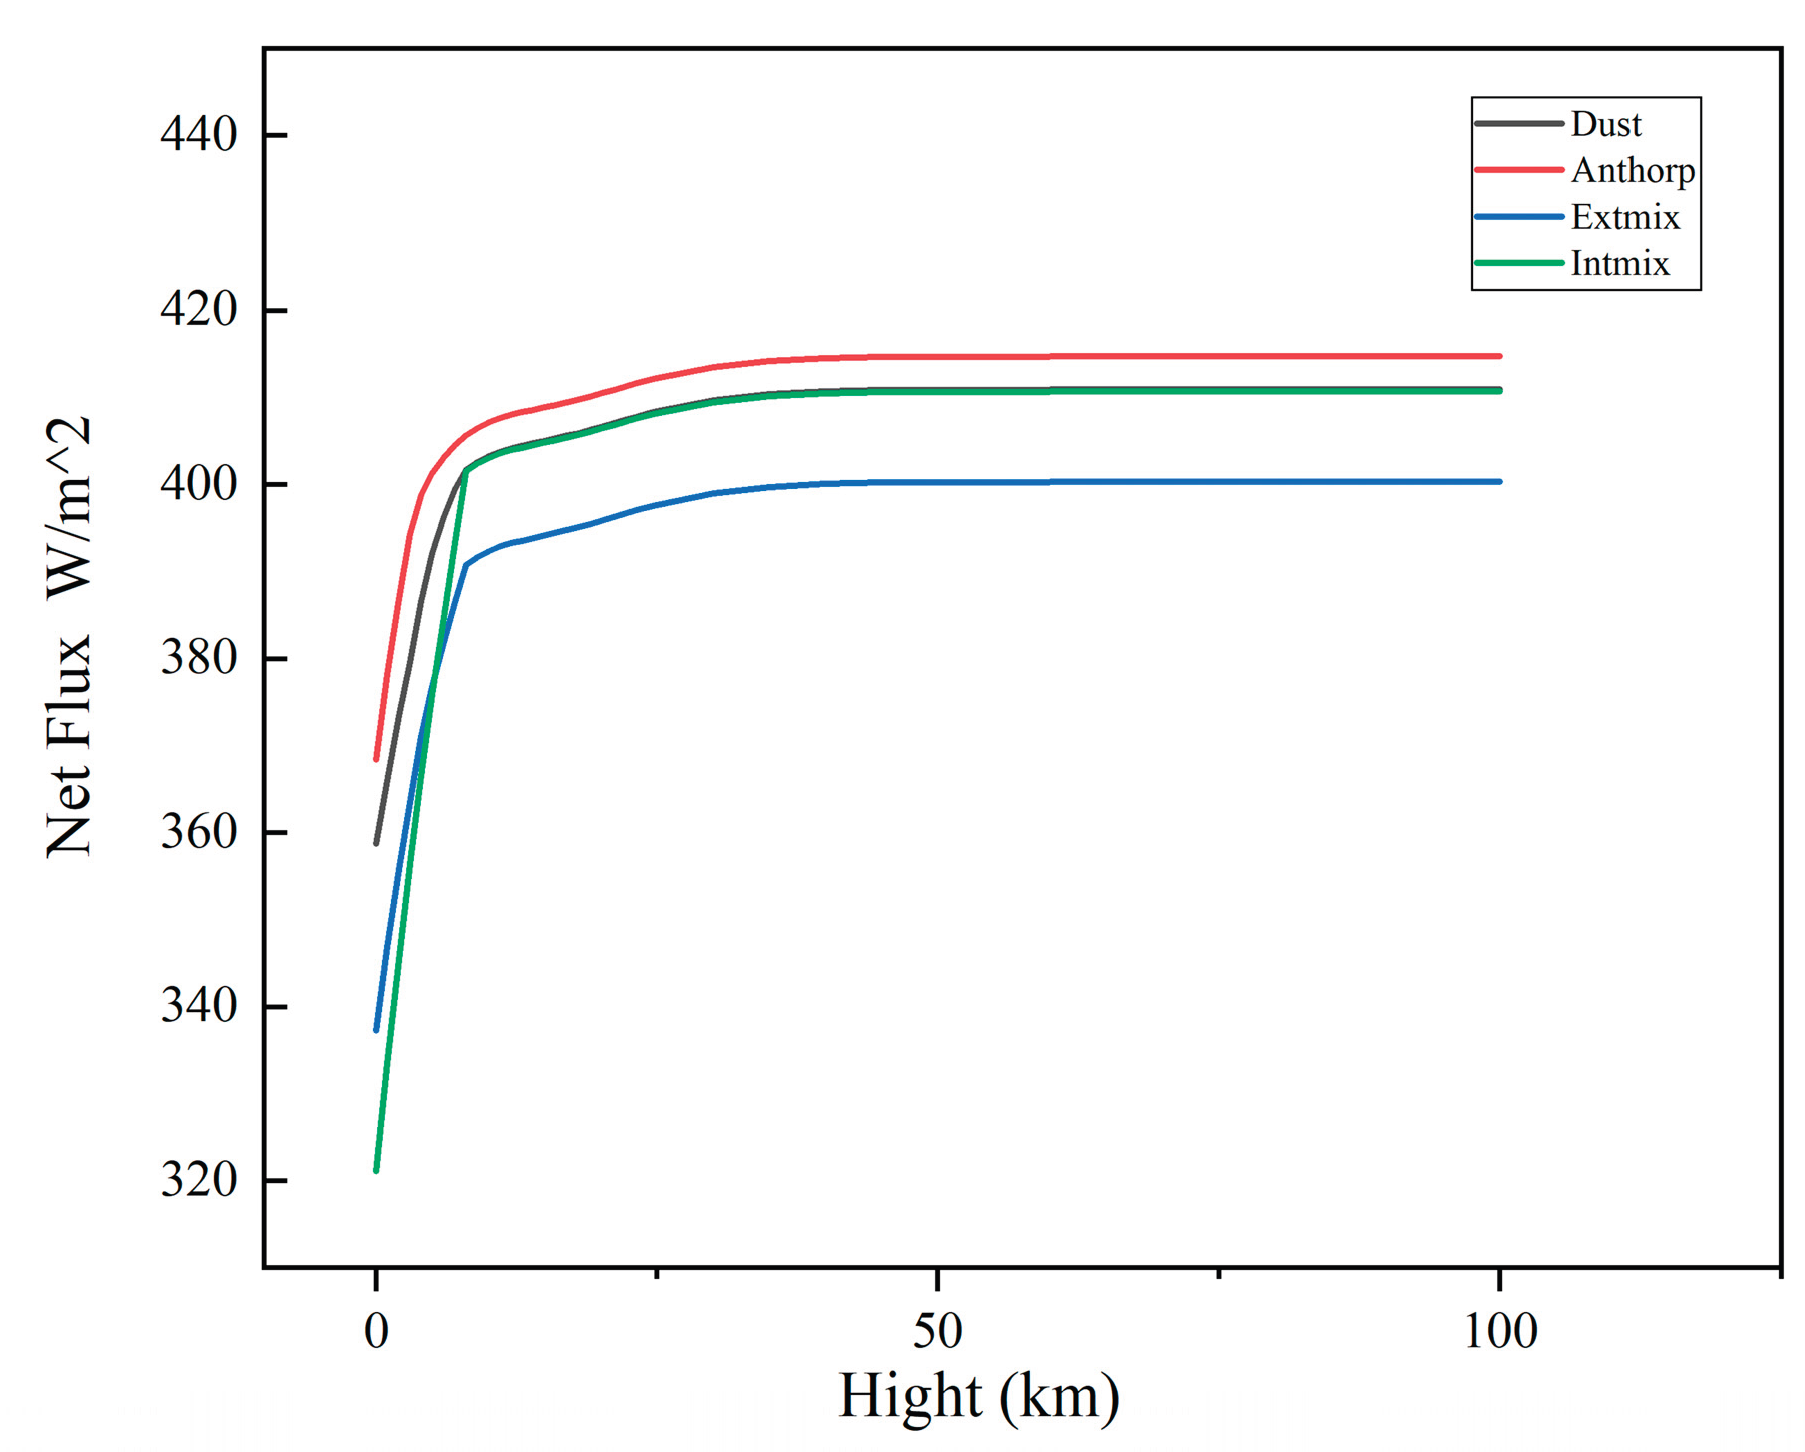
Figure 9.
Variation of Absorption Index and Scattering Ratio with Wavelength under Four Scenarios.
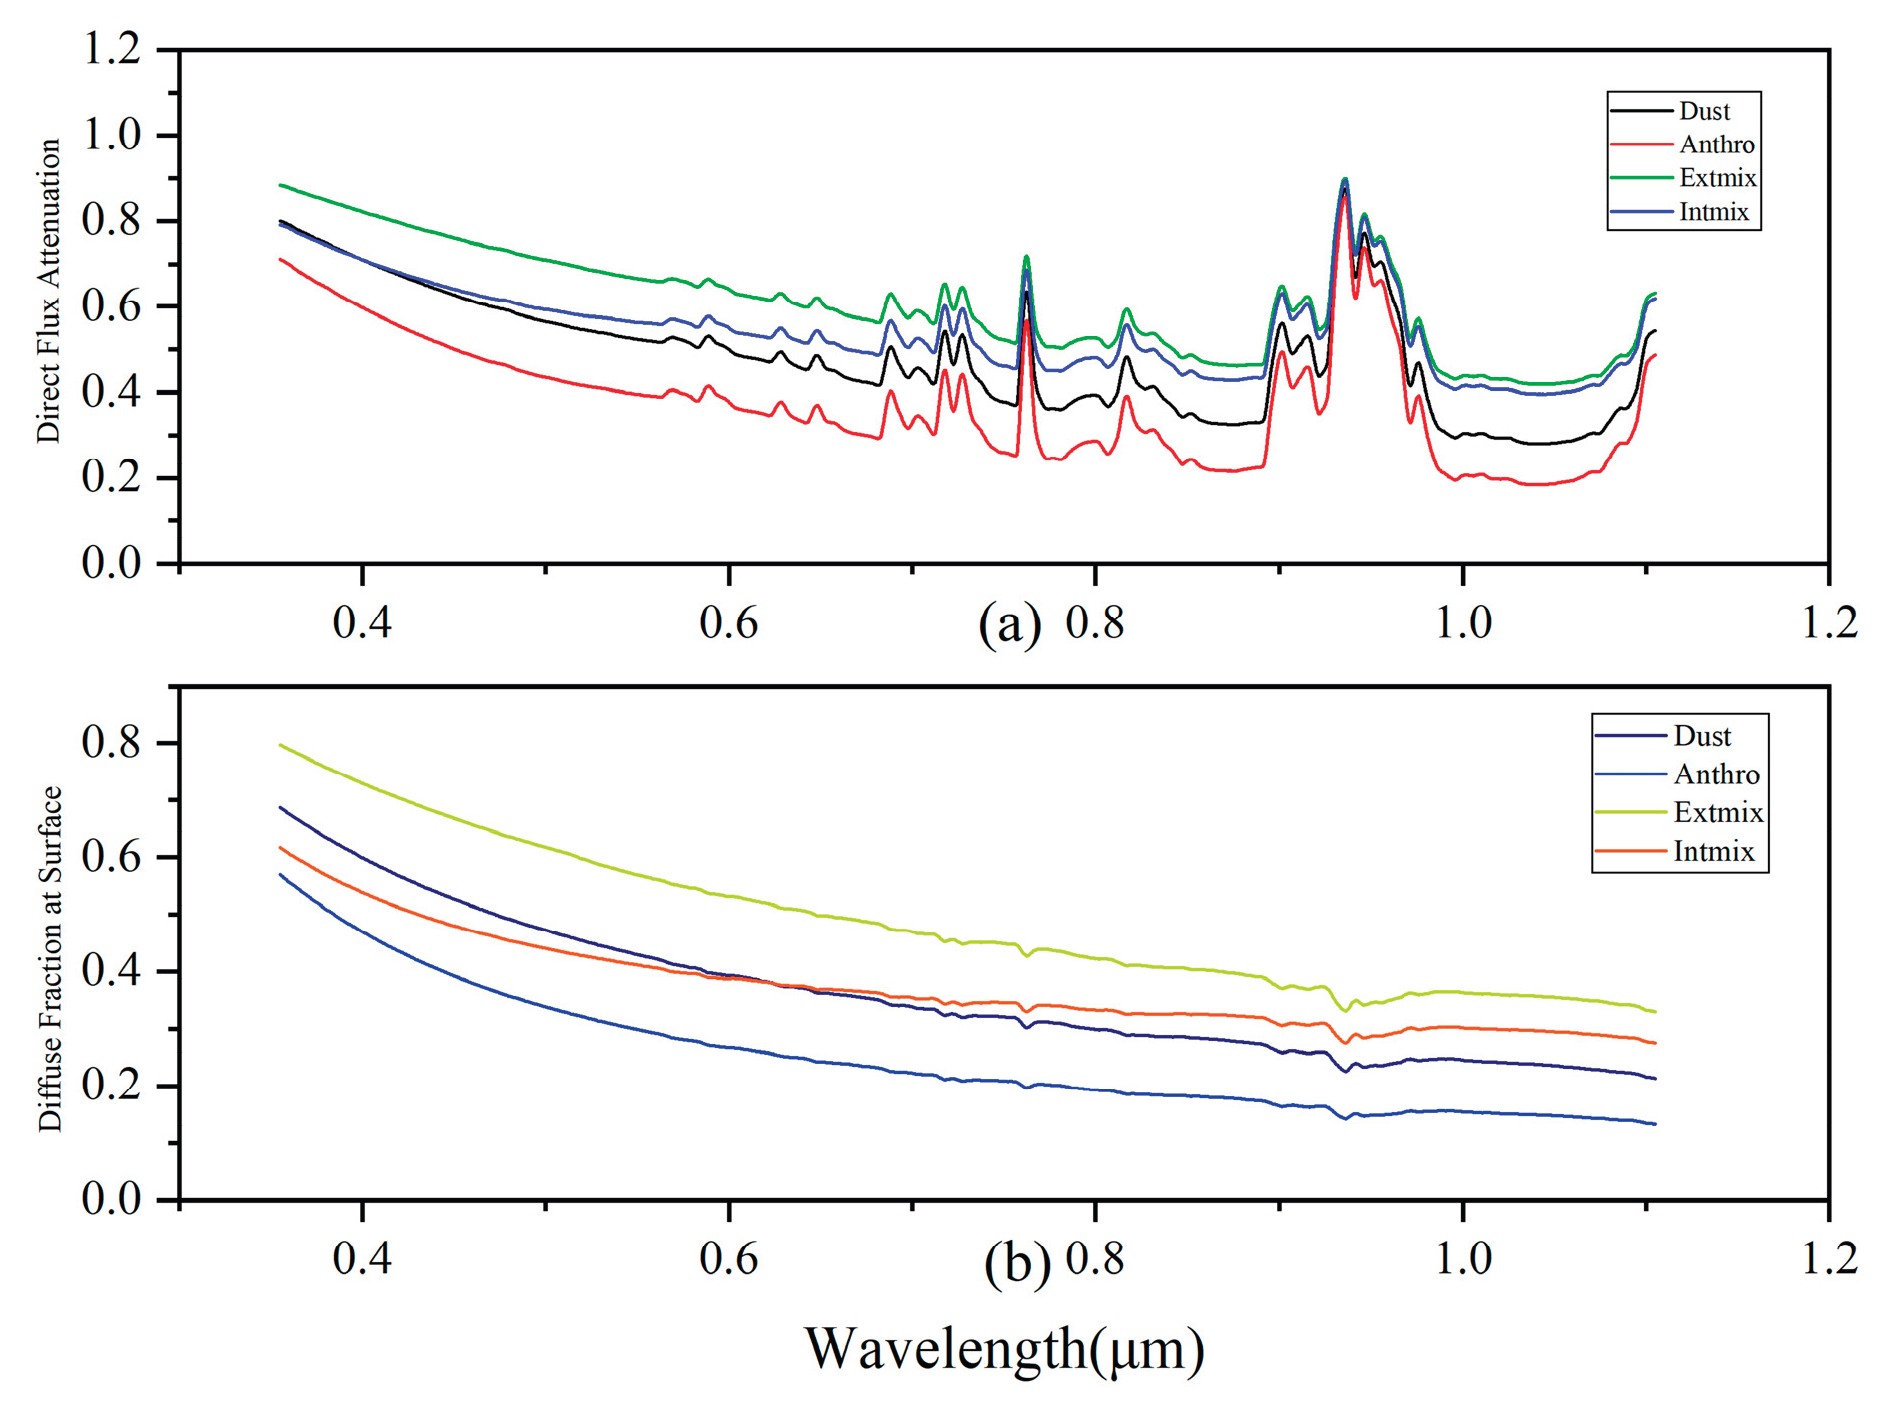
Figure 10.
Direct Radiative Forcing of Aerosol sunder Four Scenarios.
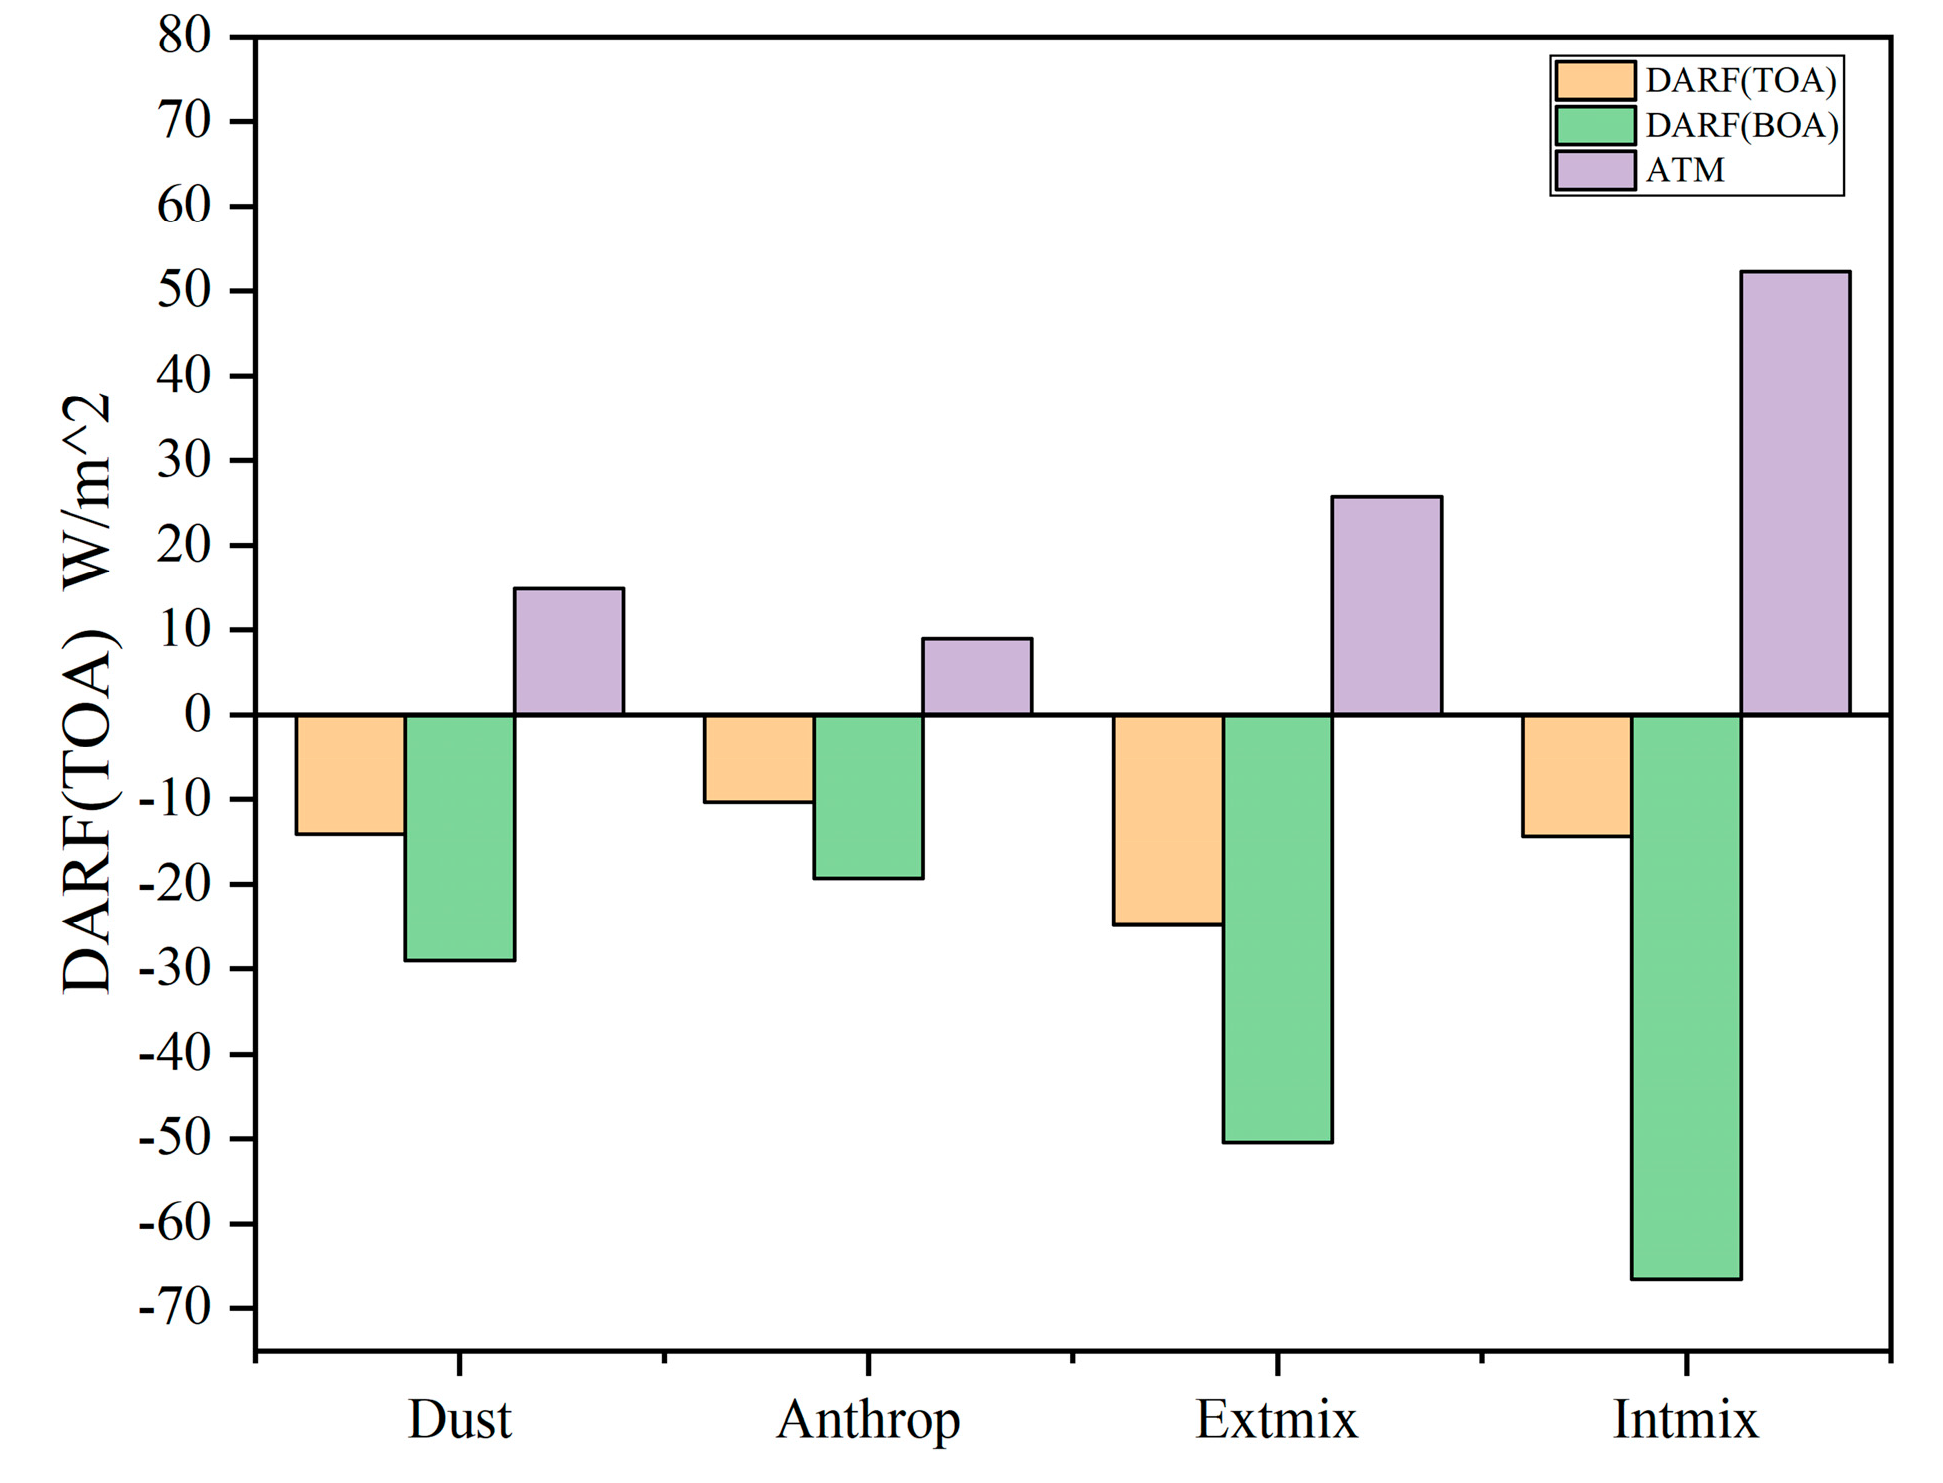

Table 1.
Direct Radiative Forcing of Aerosol sunder Four Scenarios.
| Different scenarios | TOA | BOA | ATM |
|---|---|---|---|
| Dust (W m⁻²) Anthrop (W m⁻²) External Mixing (W m⁻²) Internal Mixing (W m⁻²) |
-14.11 | -28.96 | 14.85 |
| -10.34 | -19.30 | 8.97 | |
| -24.75 -14.35 |
-50.47 -66.60 |
25.72 52.25 |
Disclaimer/Publisher’s Note: The statements, opinions and data contained in all publications are solely those of the individual author(s) and contributor(s) and not of MDPI and/or the editor(s). MDPI and/or the editor(s) disclaim responsibility for any injury to people or property resulting from any ideas, methods, instructions or products referred to in the content. |
© 2025 by the authors. Licensee MDPI, Basel, Switzerland. This article is an open access article distributed under the terms and conditions of the Creative Commons Attribution (CC BY) license (http://creativecommons.org/licenses/by/4.0/).
Copyright: This open access article is published under a Creative Commons CC BY 4.0 license, which permit the free download, distribution, and reuse, provided that the author and preprint are cited in any reuse.


