
Submitted:
01 April 2025
Posted:
03 April 2025
You are already at the latest version
Abstract
This study investigates a severe sandstorm event in northern China during 21-23 March 2023 using a three-dimensional variational (3D-Var) aerosol data assimilation system coupled with the WRF-Chem model. By assimilating FY-4B geostationary satellite aerosol optical depth (AOD) retrievals and surface PM2.5/PM10 mass concentration observations, the research evaluates improvements in aerosol initialization and quantifies aerosol-meteorology feedback through radiative impacts on brightness temperature (BT). A novel approach integrates the Rapid Radiative Transfer Model (RTTOV) to simulate FY-4A satellite infrared BT, enabling independent validation of aerosol-radiation interactions. Results demonstrate that aerosol assimilation significantly enhances initial field accuracy, reducing PM2.5 and PM10 root mean square errors (RMSE) by 56.3% and 63.4%, respectively, with forecast improvements persisting over 40 hours. For meteorological fields, assimilation optimizes aerosol radiative effects, reducing BT biases in dust-affected regions (e.g., Beijing-Tianjin-Hebei). Statistical metrics reveal a 11.5% decrease in BT RMSE and an increase in the index of agreement (IOA) from 0.533 (control) to 0.812 (assimilation), highlighting enhanced representation of aerosol scattering-absorption coupling for coarse-mode dust particles. The study underscores that constraining aerosol fields through multi-source data assimilation not only refines pollutant predictions but also indirectly improves meteorological simulations via radiation-mediated pathways. These findings advance understanding of bidirectional aerosol-meteorology feedback mechanisms and demonstrate the value of geostationary satellite BT products in validating coupled chemistry-climate models.
Keywords:
FY-4B
; 3DVAR
; AOD
; PM10
; WRF-Chem
1. Introduction
Despite China’s remarkable achievements in aerosol pollution control in recent years, regional pollution events remain frequent, with sandstorm activities in northern regions showing a significant intensification trend. Furthermore, aerosol particles profoundly influence climate systems and weather processes through direct and indirect radiative effects, influencing key meteorological elements such as surface solar radiation flux, atmospheric boundary layer structure, thermal stratification stability, and regional heavy precipitation [1,2,3,4]. Accurate simulation and forecasting of three-dimensional pollutant fields using atmospheric chemistry models are not only crucial for implementing emergency pollution control measures but also essential for advancing research on aerosol-cloud-precipitation interactions [5,6,7,8,9,10,11]. However, uncertainties in emission inventories, initial conditions, and physicochemical parameterizations continue to pose significant challenges to the accuracy of aerosol pollution modeling and forecasting. Data assimilation techniques, which optimize model initial fields by integrating multi-source observations, have proven effective in enhancing pollutant prediction accuracy [12,13].
Researchers have systematically integrated a variety of observational datasets—including ground-based aerosol concentration measurements, multi-satellite-derived Aerosol Optical Depth (AOD) products, and lidar-derived vertical extinction coefficients—into coupled atmospheric chemistry models using advanced assimilation algorithms such as the Ensemble Kalman Filter, 3D-Var, and hybrid variational-ensemble methods [14,15,16,17,18,19,20,21,22,23,24,25,26,27]. These studies demonstrate that aerosol data assimilation significantly improves the accuracy of model initial aerosol fields and enhances the reliability of concentration forecasts. For example, Wang et al. (2020) [22] developed a 3D-Var assimilation framework for the MOSAIC aerosol scheme in WRF-Chem, assimilating both aerosol and gaseous pollutant concentrations, which resulted in improved initial fields and forecast performance for multiple pollutants. Similarly, Ye et al. (2021) [28] developed a Mie-scattering-based observation operator to assimilate CAPILSO lidar extinction coefficients into the MOSAIC scheme, leading to notable improvements in PM2.5 forecasts and better representation of vertical structure. Furthermore, geostationary satellite observations, with their extensive coverage and high spatiotemporal resolution, have played a critical role in optimizing chemical initial fields and refining aerosol pollution simulations [20,29,30].
Despite the significant advancements in aerosol assimilation, current studies predominantly focus on optimizing initial aerosol fields and improving chemical forecast accuracy [12,22]. However, a critical knowledge gap remains in understanding the bidirectional feedback mechanisms between aerosols and meteorology triggered by assimilation processes, as well as their subsequent impacts on meteorological fields. While aerosol radiative forcing is known to influence boundary layer thermodynamics and atmospheric stability [31], these interactions are still not fully explored. The Advanced Geostationary Radiation Imager (AGRI) aboard China’s FY-4A satellite provides high-resolution multispectral data (visible to longwave infrared), offering unprecedented potential to advance both meteorological monitoring and model evaluation.
This study investigates a severe sandstorm event in northern China from March 21–24, 2023. Using a multi-scale 3D-Var assimilation system, we integrate high-resolution FY-4B geostationary satellite AOD products and ground-based aerosol monitoring network observations into the WRF-Chem model. We then systematically evaluate improvements in aerosol initialization and forecast performance. Additionally, by using FY-4B’s longwave infrared brightness temperature (BT) observations as independent validation data—a novel approach—we couple the Rapid Radiative Transfer Model (RTTOV) to quantify how aerosol assimilation impacts radiative BT simulations. This study provides a quantitative assessment of aerosol assimilation’s effect on radiative BT simulations and highlights how it improves the representation of meteorological fields through radiation-mediated pathways.
2. Materials and Methods
2.1. WRF-Chem Model
The Weather Research and Forecasting Model with Chemistry (WRF-Chem) is a next-generation regional meteorology-chemistry coupled model jointly developed by the National Centers for Environmental Prediction (NCEP), the National Center for Atmospheric Research (NCAR), and several universities and research institutions. As a key extension of the WRF model, WRF-Chem achieves full coupling between meteorological and chemical processes. The model comprehensively incorporates critical physicochemical processes of atmospheric chemical transport, including advection, turbulent diffusion, convective transport, dry and wet deposition mechanisms, aerosol chemical transformations, as well as radiative feedback and photolysis reactions, making it a powerful numerical simulation tool for atmospheric environmental research. [32,33].
The simulation domain utilizes a two-way nested configuration with two grids, as shown in Figure 1. The outer grid has a horizontal resolution of 27 km, while the inner grid has a resolution of 9 km, both discretized into 41 vertical layers. Centered at (36°N, 109.4°E), the inner grid spans 175×166 grid points. The adopted physical and chemical parameterization schemes are summarized in Table 1. For meteorological forcing, the model is driven by 6-hourly NCEP Global Forecast System (GFS) reanalysis data (0.25°×0.25° resolution), which provides initial and boundary conditions for the meteorological fields. Chemical initial conditions are based on outputs from previous simulations. Anthropogenic emissions are specified using the Multi-resolution Emission Inventory for China (MEIC, http://www.meicmodel.org), developed by Tsinghua University [34].
2.2. 3D-VAR
Aerosol data assimilation optimally constrains atmospheric chemistry models by integrating observational data, enhancing the spatiotemporal accuracy of aerosol distributions and refining simulations and forecasts. The aerosol 3D-Var system used in this study follows the methodological framework established in our previous work [22,45]. From a mathematical implementation perspective, 3D-Var formulates the data assimilation problem as the minimization of a cost functional, constructed as follows:
Here, x represents the control variable (or analysis variable) in the assimilation system, denotes the model background field, and y is the observation field. B and R are the background error covariance matrix and observation error covariance matrix, respectively. The H operator is the observation operator, which maps variables from model space to observation space.
This study adopts the National Meteorological Center (NMC) method to estimate background error covariance, a well-established approach originally proposed by Derber and Parrish [44]. The methodology involves computing differences between 48-hour and 24-hour forecasts from the same initial time, with these difference fields statistically approximating background errors. We implement this by running WRF-Chem for one month, performing daily 48-hour forecasts initialized at 00 UTC, and systematically collecting the differences between corresponding 48-hour and 24-hour forecast fields to build a robust error covariance matrix. For a more detailed description of the construction of the B matrix, the observation operator, and the minimization solution, please refer to Wang et al. (2022) [45].
2.3. RTTOV Model
RTTOV (Radiative Transfer for TOVS) is an atmospheric radiative transfer model developed by the European Centre for Medium-Range Weather Forecasts (ECMWF), primarily used to simulate satellite-observed brightness temperatures. By solving the radiative transfer equation, the model accurately simulates the absorption and scattering effects of atmospheric gases, clouds, aerosols, and other components on electromagnetic waves, covering a broad spectral range from ultraviolet to microwave [46,47,48,49]. RTTOV efficiently retrieves top-of-atmosphere upwelling radiance and brightness temperatures using input atmospheric profiles (from model output), surface parameters (from model output), and satellite viewing geometry. In this study, we use RTTOV version 13 to simulate the FY4A radiance.
2.4. Data
This study assimilates AOD data from the Fengyun-4B (FY-4B) satellite along with surface pollutant observation data. The FY-4B AOD data, sourced from the Level-2 Land Aerosol Product (LDA) of its Advanced Geostationary Radiation Imager (AGRI), are retrieved using the “dark target” algorithm. This product provides AOD, Ångström exponent, and columnar mass concentration of suspended particles, with a spatial resolution of 4 km and a temporal resolution of 15 minutes. The study specifically utilizes AOD data at 550 nm from the LDA product, which is available for download from the National Satellite Meteorological Center (NSMC) website. Surface pollutant data are collected from over 2,000 monitoring stations of the China National Environmental Monitoring Centre, updated hourly, and include concentrations of PM2.5, PM10, SO2, NO2, CO, and O3. The validation of assimilation uses FY-4B AGRI data, while PM10 and PM2.5 are validated against surface observations.
This study employs the blackbody brightness temperature (TBB) data, a Level-2 product from the Fengyun-4A (FY-4A) satellite, as a validation dataset to assess the improvement effects of assimilating aerosol optical depth (AOD) and ground-level particulate matter concentrations on meteorological fields. As a standard product of the Advanced Geostationary Radiation Imager (AGRI), the TBB data are derived through rigorous onboard radiometric calibration processes and represent the equivalent blackbody temperature corresponding to Earth’s outgoing radiation. The dataset has a spatial resolution of 4 km, is stored in NetCDF format, and has update frequencies of 60 minutes, 15 minutes, or irregular intervals depending on observation modes.In terms of radiative characteristics, visible and near-infrared bands (corresponding to AGRI channels 1-6) primarily measure solar radiation and are typically expressed as reflectance, while infrared bands (channels 7-14) mainly detect thermal emissions from Earth’s surface and atmosphere, thus represented by black body temperature. The TBB product only contains black body temperature data for channels 7-14, with channels 1-6 being null values. This study selects channel 8 black body temperature observations from the AGRI Level-2 TBB product as ground truth data to evaluate the WRF-Chem model performance under different assimilation conditions. Comparative analysis between assimilation and non-assimilation scenarios aims to reveal the impact mechanisms of data assimilation on model simulation performance.
This study utilizes the TBB observations from Channel 10 (central wavelength 7.1 μm) of the AGRI Level-2 product as the validation benchmark. The selection of this specific channel is based on its pronounced sensitivity to the scattering-absorption coupling effects of coarse-mode aerosols such as dust particles, owing to its distinctive infrared spectral characteristics. By systematically comparing the deviation characteristics between WRF-Chem simulated brightness temperatures and satellite observations under assimilation and non-assimilation scenarios, this study quantitatively elucidates the impact mechanisms of aerosol data assimilation on improving meteorological field simulation accuracy.
2.5. DA Experimental Design
This study conducts numerical experiments to evaluate the improvement of 3D-Var data assimilation on dust weather forecasting, with the following experimental design (Table 2): Control experiment: Without data assimilation, initialized at 00:00 UTC on 21 March 2023 for a 54-hour forecast;Assimilation experiment: Assimilates FY-4B LDA aerosol products and surface pollutant observations (with 6-hourly cycling assimilation) in D01/D02 domains, using the final analysis field as initial conditions for a 54-hour forecast.
This study conducts numerical experiments to evaluate the improvement of 3D-Var data assimilation on aerosol and FY-4A radiance simulations. The experimental design is as follows (Table 2):
Control experiment: No data assimilation, initialized at 00:00 UTC on 21 March 2023, with a 54-hour forecast.
Assimilation experiment: Assimilates FY-4B AOD and PM2.5/PM10 (with 6-hourly cycling assimilation) in the D01/D02 domains, using the final analysis field as the initial condition for a 54-hour forecast.
To quantitatively evaluate the improvement of data assimilation on model forecasting, this study employs four key statistical metrics:Root Mean Square Error (RMSE)、Mean Fractional Error (MFE)、Correlation Coefficient (CORR).The evaluation criteria are defined as follows: Smaller RMSE and MFE values indicate higher simulation accuracy; larger CORR values reflect better model-observation consistency. The specific calculation formulas are as follows:
where represents the observed value, denotes the model value interpolated to the observation location, is the observed value, is the mean of , is the mean of , and N indicates the total number of samples.
This study additionally employs the Index of Agreement (IOA) to quantitatively assess the improvement of brightness temperature simulation through data assimilation. The IOA ranges from 0 to 1, with its value directly indicating the degree of consistency between model predictions and observations: An IOA of 1 denotes perfect agreement, while 0 indicates complete disagreement. The mathematical formulation of this index is defined as follows:
where represents the observed value, denotes the model value interpolated to the observation location , is the mean of , and N indicates the total number of samples.
3. Result
3.1. Weather Field and Pollution Process Analysis
Figure 2 demonstrates the spatiotemporal evolution of surface PM10 concentrations and 10-m wind fields within the D02 modeling domain during 21-22 March 2023. The analysis reveals that at 00 UTC on 21 March, significantly elevated PM10 levels first emerged in northern Ningxia and southern Inner Mongolia, with peak concentrations reaching 681 μg/m³, indicating the initial impact of the dust weather system on the study area. The surface wind field at this time exhibited prevailing northwesterly winds across the entire domain, with wind speeds maintained between 4-6 m/s, establishing favorable meteorological conditions for southeastward dust transport. As the event progressed, sustained northwesterly flow facilitated the gradual formation of a distinct PM10 pollution belt over North China. By 12 UTC on 22 March, this pollution belt had expanded to cover extensive areas including Beijing, Tianjin, central-northern Hebei, northern Shanxi, and northern Shandong, with regional average PM10 concentrations exceeding 500 μg/m³ and localized peaks reaching 695 μg/m³. This spatial distribution pattern shows strong consistency with observed dust weather processes, confirming the model’s capability to reasonably reproduce the dust transport pathways and intensity variations.
Figure 3 displays the spatial distribution of surface PM2.5 concentrations and 10-meter wind fields at different time points within the D02 region on 21-22 March 2023. The figure shows that at 00:00 UTC on 21 March, high PM2.5 concentration areas appeared in the Beijing-Tianjin-Hebei region and northern Ningxia, with peak concentrations reaching 195 μg/m³, indicating severe dust weather conditions. Most areas of North China also exhibited elevated PM2.5 levels, averaging above 100 μg/m³, suggesting PM2.5 was the dominant pollutant, forming a haze pollution belt across northern China. By 12:00 UTC on 22 March, the high PM2.5 concentration zone had shifted southward to western Shandong. Combining the evolution of both PM2.5 and PM10 concentrations, we conclude that during the weather event from 00:00 UTC 21 March to 00:00 UTC 22 March, PM10 gradually spread from northwestern to southeastern regions.
Figure 4 presents the spatial distribution of aerosol optical depth (AOD) observations at 00:00 UTC on 21 March 2023. The maximum AOD values (up to 2) were observed in central and eastern Hebei province. A comparison with Figure 3 reveals a significant spatial consistency between PM2.5 concentrations and AOD distributions, indicating a strong correlation between these two parameters. This suggests that AOD data can effectively characterize the spatial patterns of PM2.5 pollution. Furthermore, AOD measurements offer more comprehensive spatial coverage and higher resolution compared to ground-based PM2.5 monitoring. In regions with sparse surface monitoring stations, AOD data can serve as a valuable supplement to fill the gaps in PM2.5 observations.
3.2. Initial Condition Field Analysis for Data Assimilation
Upon completion of the assimilation process, the system generates an analysis field by combining the increment field (derived from observational data assimilation) with the original background field. This analysis field subsequently serves as the initial field for the next assimilation cycle. Notably, the increment field quantitatively demonstrates the improvements made to the background field through data assimilation. In this experiment, we performed the assimilation of FY-4B satellite data and surface pollutant observations based on the initial field at 00:00 UTC on 21 March 2023.
Figure 5 presents scatter plots comparing PM2.5 and PM10 mass concentrations between the Control (blue) and Analysis (red) experiments in Domain 2 (D02) of the initial field. The plots reveal that while data points from both experiments are distributed on both sides of the reference line, most Control experiment points fall below the line, indicating systematic underestimation of both PM2.5 and PM10 concentrations by the model. In contrast, the Analysis experiment results show closer clustering around the reference line.Quantitatively, for PM2.5, the Analysis experiment demonstrated significant improvements over the Control: RMSE decreased from 56.912 to 24.854 (reduction of 32.058 or 56.3%), MFE decreased from 0.8 to 0.184 (reduction of 0.616 or 77%), and CORR increased from 0.292 to 0.793 (improvement of 0.501). Similar improvements were observed for PM10: RMSE decreased from 123 to 45 (reduction of 78 or 63.4%), MFE decreased from 0.787 to 0.215 (reduction of 0.572 or 72.7%), and CORR increased from 0.099 to 0.872 (improvement of 0.773).These comparative metrics clearly demonstrate that the analysis field generated through data assimilation better approximates the true atmospheric conditions and more accurately represents the spatial distribution of PM2.5 and PM10 in the initial field. Utilizing this improved analysis field as the model’s initial conditions will consequently enhance the overall forecasting performance of the model.
Figure 6 and Figure 7 display the spatial distributions of initial fields and assimilation increments for PM2.5 and PM10 at 00:00 UTC on 21 March 2023 in both Control and Analysis experiments. Comparative analysis reveals: (1) The initial PM2.5 concentrations in the Analysis experiment are significantly higher than those in the Control experiment, with the most pronounced increases (exceeding 180μg/m³) occurring in southern Shaanxi, the Beijing-Tianjin-Hebei region, and Shandong province; (2) PM10 exhibits similar spatial variation patterns, but its peak values are primarily located in northern Ningxia and southern Inner Mongolia, which is directly related to the observed maximum PM10 concentrations at surface stations in these regions, while the concentration changes in northwestern China are mainly attributed to the assimilation of surface PM10 observations.
Figure 8 Spatial distribution of initial AOD fields, showing maximum increments (up to 1.8) in central Hebei (panel c). The assimilation experiment accurately reproduces AOD patterns, with spatial variations consistent with PM₂.₅/PM₁₀ changes (Figure 6 and Figure 7), demonstrating effective observational data integration for improved initial field generation.
3.3. Comparative Analysis of the Effect of Assimilation on Aerosol Forecasting
Figure 9 and Figure 10 display the comparative results of PM2.5 and PM10 simulations at monitoring stations in Domain 2 between the two experiments, including RMSE, MFE, and CORR statistics along with time series curves. Comprehensive analysis demonstrates that the assimilation experiment exhibits significantly better performance across all metrics, showing closer agreement with station observations. Notably, the CORR displays cyclic variations due to the 6-hourly cycling assimilation scheme, with immediate improvement followed by gradual decay after each assimilation, clearly reflecting the continuous enhancement from assimilated data. Furthermore, the optimized effects persist for over 40 hours before the metrics gradually converge toward the control experiment levels.
3.4. Simulation of Bright Temperature Using RTTOV
This study evaluates the impact of aerosol assimilation on brightness temperature simulations by leveraging the distinct sensitivity of coarse dust particles to longwave infrared radiation. The analysis utilizes brightness temperature observations from Channel 10 (central wavelength 7.1 μm) of the FY-4A satellite. Figure 11 shows the adjustment characteristics of the assimilation experiment on the brightness temperature field at the initial time: in key dust pollution areas (northern Ningxia, Beijing-Tianjin-Hebei, and southern Henan), the control experiment shows significant positive brightness temperature deviations, with maximum deviations reaching 40 K; in most northern areas of the study region, the brightness temperature deviations are relatively small, with increment field fluctuations mainly ranging between -10 K and 10 K. Notably, the high-value areas of brightness temperature deviations show spatial consistency with the high-value areas of PM10/PM2.5 concentration changes (Figure 11d). The assimilation experiment results demonstrate that after assimilating multi-source aerosol observation data, the agreement between the simulated brightness temperature field and FY-4A actual observations is significantly improved.
Figure 12 presents the comparison between simulated and observed brightness temperatures (Channel 10) at 00:00 UTC on 21 March 2023. The analysis reveals that compared to the Control experiment, the Assimilation experiment produces brightness temperature simulations that are more tightly clustered and closer to the y=x reference line in the scatter plot. Quantitative evaluation demonstrates that assimilation reduces RMSE from 6.863 to 6.074 (a decrease of 0.789, 11.5% reduction), lowers MFE from 0.02178 to 0.02062 (a decrease of 0.00116, 5.32% reduction), and significantly improves IOA from 0.533 to 0.812. It is noteworthy that the improvements show distinct temperature-dependent characteristics: significant accuracy enhancement in the 220-240 K range but systematic underestimation in the 240-250 K range. Compared to the remarkable improvements in PM2.5 and PM10 simulations, the progress in brightness temperature simulation appears relatively limited, primarily due to the susceptibility of brightness temperature signals to atmospheric interference such as cloud effects.
Figure 13 presents the temporal evolution of RMSE, MFE, and IOA statistics for brightness temperature simulations over Domain 2. Comparative analysis demonstrates superior performance of the assimilation experiment across all metrics, showing closer agreement with FY-4A satellite observations. The results exhibit distinct temporal characteristics: during 0-24 forecast hours, both experiments show increasing RMSE/MFE and decreasing IOA, while 24-48 hours reveal opposite trends (decreasing RMSE/MFE and increasing IOA). This pattern aligns with PM10/PM2.5 simulations, validating the cycling assimilation system’s efficacy—the 6-hourly assimilation updates consistently improve initial field quality, leading to periodic enhancements in simulation performance after each assimilation cycle.
4. Conclusion and Discussion
This study employed a 3D-Var aerosol data assimilation system that integrates FY-4B satellite AOD retrievals and surface aerosol observations to improve dust event simulations. The assimilation system demonstrates remarkable success in enhancing both aerosol initial fields and forecast accuracy. Notably, the incorporation of aerosol observations not only optimizes particulate matter predictions but also indirectly improves meteorological field simulations by refining radiative transfer processes, as evidenced by significant advancements in FY-4A brightness temperature (BT) simulations. Key findings are as follows:
Assimilation of FY-4B AOD and surface aerosol mass concentrations markedly improved initial field quality for PM₂.₅ and PM₁₀. For PM₂.₅, RMSE decreased by 56.3%, MFE by 77%, and CORR increased by 0.501; for PM10, RMSE dropped by 63.4%, MFE by 72.7%, and CORR rose by 0.773. Spatial consistency between AOD adjustments and PM concentration changes confirmed the effectiveness of assimilation in generating realistic initial conditions. Forecast improvements persisted for over 40 hours, underscoring the sustained impact of assimilation.
By coupling the RTTOV radiative transfer model, this study quantitatively assesses the impact of aerosol assimilation on brightness temperature (BT) simulations. The assimilation experiment revealed significant improvements in BT simulations, reducing the RMSE of Channel 10 BT by 11.5% and increasing the IOA from 0.533 to 0.812. These enhancements are spatially consistent with increases in aerosol concentration, particularly in dust-affected regions like northern Ningxia and the Beijing-Tianjin-Hebei area, where BT biases are reduced by as much as 40 K. The improved BT simulations reflect a better representation of aerosol radiative effects, as the assimilated aerosol fields may more accurately capture the scattering and absorption interactions of coarse-mode dust particles in the longwave infrared spectrum. Also, the BT improvements validate that aerosol assimilation indirectly enhances meteorological simulations through radiation-mediated pathways. By constraining aerosol initial conditions, the assimilation system reduces errors in radiative transfer calculations, leading to more realistic simulations of near-surface meteorological variables, as well as temperature and specific profiles. This mechanism explains the persistent positive forecast impacts observed over 40 hours, where refined aerosol fields drive better-coupled aerosol-meteorology interactions. These improvements not only validate the assimilation’s accuracy but also emphasize its critical role in refining aerosol-radiation interactions within numerical models.
While the improvements in BT confirm the system’s ability to enhance aerosol-meteorology feedback modeling, the extent of these gains remains moderate in comparison to the improvements in PM concentration. This discrepancy is due to confounding atmospheric factors, especially cloud contamination and uncertainties in the parameterization of aerosol optical properties. Future work should focus on assimilating hyperspectral infrared observations and developing cloud-aware assimilation algorithms to better resolve aerosol-cloud-radiation interactions. Furthermore, extending the evaluation to a wider range of meteorological variables (e.g., boundary layer height, vertical temperature gradients) will provide a more comprehensive understanding of the broader impacts of aerosol assimilation on weather forecasting.
Author Contributions
Conceptualization, W.Y.; methodology, X.C.; software, W.Y.; validation, W.Y. and J.L.; formal analysis, X.C.; investigation, R.D. and M.G.; resources, W.Y., J.L.and Z.Z.; data curation, X.C.; writing—original draft preparation, X.C.; writing—review and editing, W.Y. and J.L.; visualization, X.C.; supervision, W.Y. All authors have read and agreed to the published version of the manuscript.
Funding
This research was funded by the Natural Science Foundation of Hunan Province-Outstanding Youth Foundation, grant number No. 2023JJ20050 and the National Natural Science Foundation of China under grants U2142209 and 42475166.
Conflicts of Interest
The authors declare no conflicts of interest.
References
- Ramanathan, V.; Crutzen, P.J.; Kiehl, J.T.; et al. Aerosols, climate, and the hydrological cycle. Science 2001, 294, 2119–2124. [Google Scholar] [CrossRef] [PubMed]
- Daellenbach, K.R.; Cai, J.; Hakala, S.; Dada, L.; Yan, C.; Du, W.; Yao, L.; Zheng, F.; Ma, J.; Ungeheuer, F.; et al. Substantial contribution of transported emissions to organic aerosol in Beijing. Nat. Geosci. 2024, 17, 747–754. [Google Scholar] [CrossRef]
- Zheng, Y.; Che, H.; Xia, X.; Wang, Y.; Wang, H.; Wu, Y.; Tao, J.; Zhao, H.; An, L.; Li, L.; et al. Five-year observation of aerosol optical properties and its radiative effects to planetary boundary layer during air pollution episodes in North China: Intercomparison of a plain site and a mountainous site in Beijing. Sci. Total. Environ. 2019, 674, 140–158. [Google Scholar] [CrossRef]
- Seinfeld, J.H.; Bretherton, C.; Carslaw, K.S.; Coe, H.; DeMott, P.J.; Dunlea, E.J.; Feingold, G.; Ghan, S.; Guenther, A.B.; Kahn, R.; et al. Improving our fundamental understanding of the role of aerosol−cloud interactions in the climate system. Proc. Natl. Acad. Sci. 2016, 113, 5781–5790. [Google Scholar] [CrossRef]
- Fast, J.D.; Gustafson, W.I.; Easter, R.C.; Zaveri, R.A.; Barnard, J.C.; Chapman, E.G.; Peckham, S.E. Evolution of ozone, particulates, and aerosol direct radiative forcing in the vicinity of Houston using a fully coupled meteorology-chemistry-aerosol model. Journal of Geophysical Research: Atmospheres 2006, 111. [Google Scholar] [CrossRef]
- Liao, H.; Henze, D.K.; Seinfeld, J.H.; Wu, S.; Mickley, L.J. Biogenic secondary organic aerosol over the United States: Comparison of climatological simulations with observations. J. Geophys. Res. Atmos. 2007, 112. [Google Scholar] [CrossRef]
- Grell, G.A.; Peckham, S.E.; Schmitz, R.; McKeen, S.A.; Frost, G.; Skamarock, W.C.; Eder, B. Fully coupled “online” chemistry within the WRF model. Atmos. Environ. 2005, 39, 6957–6975. [Google Scholar] [CrossRef]
- Jing, B.; Wu, L.; Mao, H.; Gong, S.; He, J.; Zou, C.; Song, G.; Li, X.; Wu, Z. Development of a vehicle emission inventory with high temporal–spatial resolution based on NRT traffic data and its impact on air pollution in Beijing – Part 1: Development and evaluation of vehicle emission inventory. Atmos. Chem. Phys. 2016, 16, 3161–3170. [Google Scholar] [CrossRef]
- Guo, J.; Su, T.; Li, Z.; Miao, Y.; Li, J.; Liu, H.; Xu, H.; Cribb, M.; Zhai, P. Declining frequency of summertime local-scale precipitation over eastern China from 1970 to 2010 and its potential link to aerosols. Geophys. Res. Lett. 2017, 44, 5700–5708. [Google Scholar] [CrossRef]
- Ma, S.; Zhang, X.; Gao, C.; Tong, D.Q.; Xiu, A.; Wu, G.; Cao, X.; Huang, L.; Zhao, H.; Zhang, S.; et al. Multimodel simulations of a springtime dust storm over northeastern China: Implications of an evaluation of four commonly used air quality models (CMAQ v5.2.1, CAMx v6.50, CHIMERE v2017r4, and WRF-Chem v3.9.1). Geosci. Model Dev. 2019, 12, 4603–4625. [Google Scholar] [CrossRef]
- Yu, M.; Tang, G.; Yang, Y.; Li, Q.; Wang, Y.; Miao, S.; Zhang, Y.; Wang, Y. The interaction between urbanization and aerosols during a typical winter haze event in Beijing. Atmospheric Meas. Tech. 2020, 20, 9855–9870. [Google Scholar] [CrossRef]
- Bocquet, M.; Elbern, H.; Eskes, H.; Hirtl, M.; Žabkar, R.; Carmichael, G.R.; Flemming, J.; Inness, A.; Pagowski, M.; Camaño, J.L.P.; et al. Data assimilation in atmospheric chemistry models: Current status and future prospects for coupled chemistry meteorology models. Atmos. Chem. Phys. 2015, 15, 5325–5358. [Google Scholar] [CrossRef]
- Hu, Y.; Zang, Z.; Chen, D.; Ma, X.; Liang, Y.; You, W.; Pan, X.; Wang, L.; Wang, D.; Zhang, Z. Optimization and Evaluation of SO2 Emissions Based on WRF-Chem and 3DVAR Data Assimilation. Remote. Sens. 2022, 14, 220. [Google Scholar] [CrossRef]
- Pagowski, M.; Grell, G.A.; McKeen, S.A.; Peckham, S.E.; Devenyi, D. Three-dimensional variational data assimilation of ozone and fine particulate matter observations: Some results using the Weather Research and Forecasting—Chemistry model and Grid-point Statistical Interpolation. Q. J. R. Meteorol. Soc. 2010, 136, 2013–2024. [Google Scholar] [CrossRef]
- Liu, Z.; Liu, Q.; Lin, H.-C.; Schwartz, C.S.; Lee, Y.-H.; Wang, T. Three-dimensional variational assimilation of MODIS aerosol optical depth: Implementation and application to a dust storm over East Asia. J. Geophys. Res. Atmos. 2011, 116. [Google Scholar] [CrossRef]
- Li, Z.; Zang, Z.; Li, Q.B.; Chao, Y.; Chen, D.; Ye, Z.; Liu, Y.; Liou, K.N. A three-dimensional variational data assimilation system for multiple aerosol species with WRF/Chem and an application to PM2.5 prediction. Atmospheric Meas. Tech. 2013, 13, 4265–4278. [Google Scholar] [CrossRef]
- Schwartz, C.S.; Liu, Z.; Lin, H.C.; Cetola, J.D. Assimilating aerosol observations with a “hybrid” variational-ensemble data assimilation system. Journal of Geophysical Research: Atmospheres 2024, 119, 4043–4069. [Google Scholar]
- Zang, Z.; Li, Z.; Pan, X.; Hao, Z.; You, W. Aerosol data assimilation and forecasting experiments using aircraft and surface observations during CalNex. Tellus B: Chem. Phys. Meteorol. 2016, 68. [Google Scholar] [CrossRef]
- Peng, Z.; Liu, Z.; Chen, D.; Ban, J. Improving PM 2. 5 forecast over China by the joint adjustment of initial conditions and source emissions with an ensemble Kalman filter. Atmospheric Chemistry and Physics 2017, 17, 4837–4855. [Google Scholar]
- Xia, X.; Min, J.; Shen, F.; Wang, Y.; Yang, C. Aerosol Data Assimilation Using Data from Fengyun-3A and MODIS: Application to a Dust Storm over East Asia in 2011. Adv. Atmospheric Sci. 2018, 36, 1–14. [Google Scholar] [CrossRef]
- Cheng, X.; Liu, Y.; Xu, X.; You, W.; Zang, Z.; Gao, L.; Chen, Y.; Su, D.; Yan, P. Lidar data assimilation method based on CRTM and WRF-Chem models and its application in PM2.5 forecasts in Beijing. Sci. Total. Environ. 2019, 682, 541–552. [Google Scholar] [CrossRef]
- Wang, D.; You, W.; Zang, Z.; Pan, X.; He, H.; Liang, Y. A three-dimensional variational data assimilation system for a size-resolved aerosol model: Implementation and application for particulate matter and gaseous pollutant forecasts across China. Sci. China Earth Sci. 2020, 63, 1366–1380. [Google Scholar] [CrossRef]
- Sun, W.; Liu, Z.; Chen, D.; Zhao, P.; Chen, M. Development and application of the WRFDA-Chem three-dimensional variational (3DVAR) system: Aiming to improve air quality forecasting and diagnose model deficiencies. Atmos. Chem. Phys. 2020, 20, 9311–9329. [Google Scholar] [CrossRef]
- Pang, J.M.; Wang, X.M. The impacts of background error covariance on particulate matter assimilation and forecast: An ideal case study with a modal aerosol model over China. Sci Total Environ 2021, 786, 147417. [Google Scholar]
- Ye, H.; You, W.; Zang, Z.; Pan, X.; Wang, D.; Zhou, N.; Hu, Y.; Liang, Y.; Yan, P. Observing system simulation experiment (OSSE)-quantitative evaluation of lidar observation networks to improve 3D aerosol forecasting in China. Atmospheric Res. 2022, 270. [Google Scholar] [CrossRef]
- Ha, S. Implementation of aerosol data assimilation in WRFDA (v4.0.3) for WRF-Chem (v3.9.1) using the RACM/MADE-VBS scheme. Geosci. Model Dev. 2022, 15, 1769–1788. [Google Scholar] [CrossRef]
- Ha, S.; Kumar, R.; Pfister, G.; Lee, Y.; Lee, D.; Kim, H.M.; Ryu, Y. Chemical Data Assimilation With Aqueous Chemistry in WRF-Chem Coupled With WRFDA (V4.4.1). J. Adv. Model. Earth Syst. 2024, 16. [Google Scholar] [CrossRef]
- Ye, H.; Pan, X.; You, W.; Zhu, X.; Zang, Z.; Wang, D.; Zhang, X.; Hu, Y.; Jin, S. Impact of CALIPSO profile data assimilation on 3-D aerosol improvement in a size-resolved aerosol model. Atmospheric Res. 2021, 264. [Google Scholar] [CrossRef]
- Pang, J.; Liu, Z.; Wang, X.; Bresch, J.; Ban, J.; Chen, D.; Kim, J. Assimilating AOD retrievals from GOCI and VIIRS to forecast surface PM2.5 episodes over Eastern China. Atmospheric Environ. 2018, 179, 288–304. [Google Scholar] [CrossRef]
- Wang, D.; You, W.; Zang, Z.; Pan, X.; Hu, Y.; Liang, Y. A three-dimensional variational data assimilation system for aerosol optical properties based on WRF-Chem v4.0: Design, development, and application of assimilating Himawari-8 aerosol observations. Geosci. Model Dev. 2022, 15, 1821–1840. [Google Scholar] [CrossRef]
- Yang, J.; Ji, Z.; Kang, S.; Zhang, Q.; Chen, X.; Lee, S.-Y. Spatiotemporal variations of air pollutants in western China and their relationship to meteorological factors and emission sources. Environ. Pollut. 2019, 254, 112952. [Google Scholar] [CrossRef] [PubMed]
- Zaveri, R.A.; Easter, R.C.; Fast, J.D.; Peters, L.K. Model for Simulating Aerosol Interactions and Chemistry (MOSAIC). J. Geophys. Res. Atmos. 2008, 113. [Google Scholar] [CrossRef]
- Grell, G.A.; Peckham, S.E.; Schmitz, R.; et al. Fully coupled “online” chemistry within the WRF model. Atmospheric environment 2005, 39, 6957–6975. [Google Scholar] [CrossRef]
- Zheng, B.; Tong, D.; Li, M.; Liu, F.; Hong, C.; Geng, G.; Li, H.; Li, X.; Peng, L.; Qi, J.; et al. Trends in China's anthropogenic emissions since 2010 as the consequence of clean air actions. Atmospheric Meas. Tech. 2018, 18, 14095–14111. [Google Scholar] [CrossRef]
- Grell, G.A.; Dudhia, J.; Stauffer, D.R. A description of the fifth-generation Penn State/NCAR Mesoscale Model (MM5). 1994.
- Iacono, M.J.; Delamere, J.S.; Mlawer, E.J.; Shephard, M.W.; Clough, S.A.; Collins, W.D. Radiative forcing by long-lived greenhouse gases: Calculations with the AER radiative transfer models. J. Geophys. Res. Atmos. 2008, 113, D13103. [Google Scholar] [CrossRef]
- Grell, G.A.; Dévényi, D. A generalized approach to parameterizing convection combining ensemble and data assimilation techniques. Geophys. Res. Lett. 2002, 29, 38-1–38-4. [Google Scholar] [CrossRef]
- Chen, F.; Dudhia, J. Coupling an advanced land surface–hydrology model with the Penn State–NCAR MM5 modeling system. Part I: Model implementation and sensitivity. Monthly weather review 2001, 129, 569–585. [Google Scholar] [CrossRef]
- Hong, S.Y.; Lim, J.O.J. The WRF single-moment 6-class microphysics scheme (WSM6). Asia-Pacific Journal of Atmospheric Sciences 2006, 42, 129–151. [Google Scholar]
- Zaveri, R.A.; Peters, L.K. A new lumped structure photochemical mechanism for large-scale applications. J. Geophys. Res. Atmos. 1999, 104, 30387–30415. [Google Scholar] [CrossRef]
- Zaveri, R.A.; Easter, R.C.; Fast, J.D.; Peters, L.K. Model for Simulating Aerosol Interactions and Chemistry (MOSAIC). J. Geophys. Res. Atmos. 2008, 113. [Google Scholar] [CrossRef]
- Ruggaber, A.; Dlugi, R.; Nakajima, T. Modelling radiation quantities and photolysis frequencies in the troposphere. J. Atmospheric Chem. 1994, 18, 171–210. [Google Scholar] [CrossRef]
- Shao, Y.; Ishizuka, M.; Mikami, M.; Leys, J.F. Parameterization of size-resolved dust emission and validation with measurements. J. Geophys. Res. Atmos. 2011, 116. [Google Scholar] [CrossRef]
- Parrish, D.F.; Derber, J.C. The National Meteorological Center’s Spectral Statistical-Interpolation Analysis System. Mon. Weather Rev. 1992, 120, 1747–1763. [Google Scholar] [CrossRef]
- Wang, D.; You, W.; Zang, Z.; et al. A three-dimensional variational data assimilation system for aerosol optical properties based on WRF-Chem: Design, development, and application of assimilating Himawari-8 aerosol observations. Geoscientific Model Development Discussions 2021, 2021, 1–54. [Google Scholar] [CrossRef]
- De Angelis, F.; Cimini, D.; Hocking, J.; Martinet, P.; Kneifel, S. RTTOV-gb–adapting the fast radiative transfer model RTTOV for the assimilation of ground-based microwave radiometer observations. Geosci. Model Dev. 2016, 9, 2721–2739. [Google Scholar] [CrossRef]
- Wang, Y.; Qiu, Z.; Zhao, D.; Liu, J.; Yang, J. Atmospheric Correction Above Clouds for FY-4A AGRI Based on RTTOV. IEEE Trans. Geosci. Remote. Sens. 2024, 62, 1–18. [Google Scholar] [CrossRef]
- Saunders, R.W.; Matricardi, M.; Brunel, P.; et al. RTTOV-7: Science and Validation Report[M]. Met. Office, NWP Division, 2002.
- Saunders, R.; Hocking, J.; Turner, E.; Rayer, P.; Rundle, D.; Brunel, P.; Vidot, J.; Roquet, P.; Matricardi, M.; Geer, A.; et al. An update on the RTTOV fast radiative transfer model (currently at version 12). Geosci. Model Dev. 2018, 11, 2717–2737. [Google Scholar] [CrossRef]
Figure 1.
Spatial distribution of the model domain.
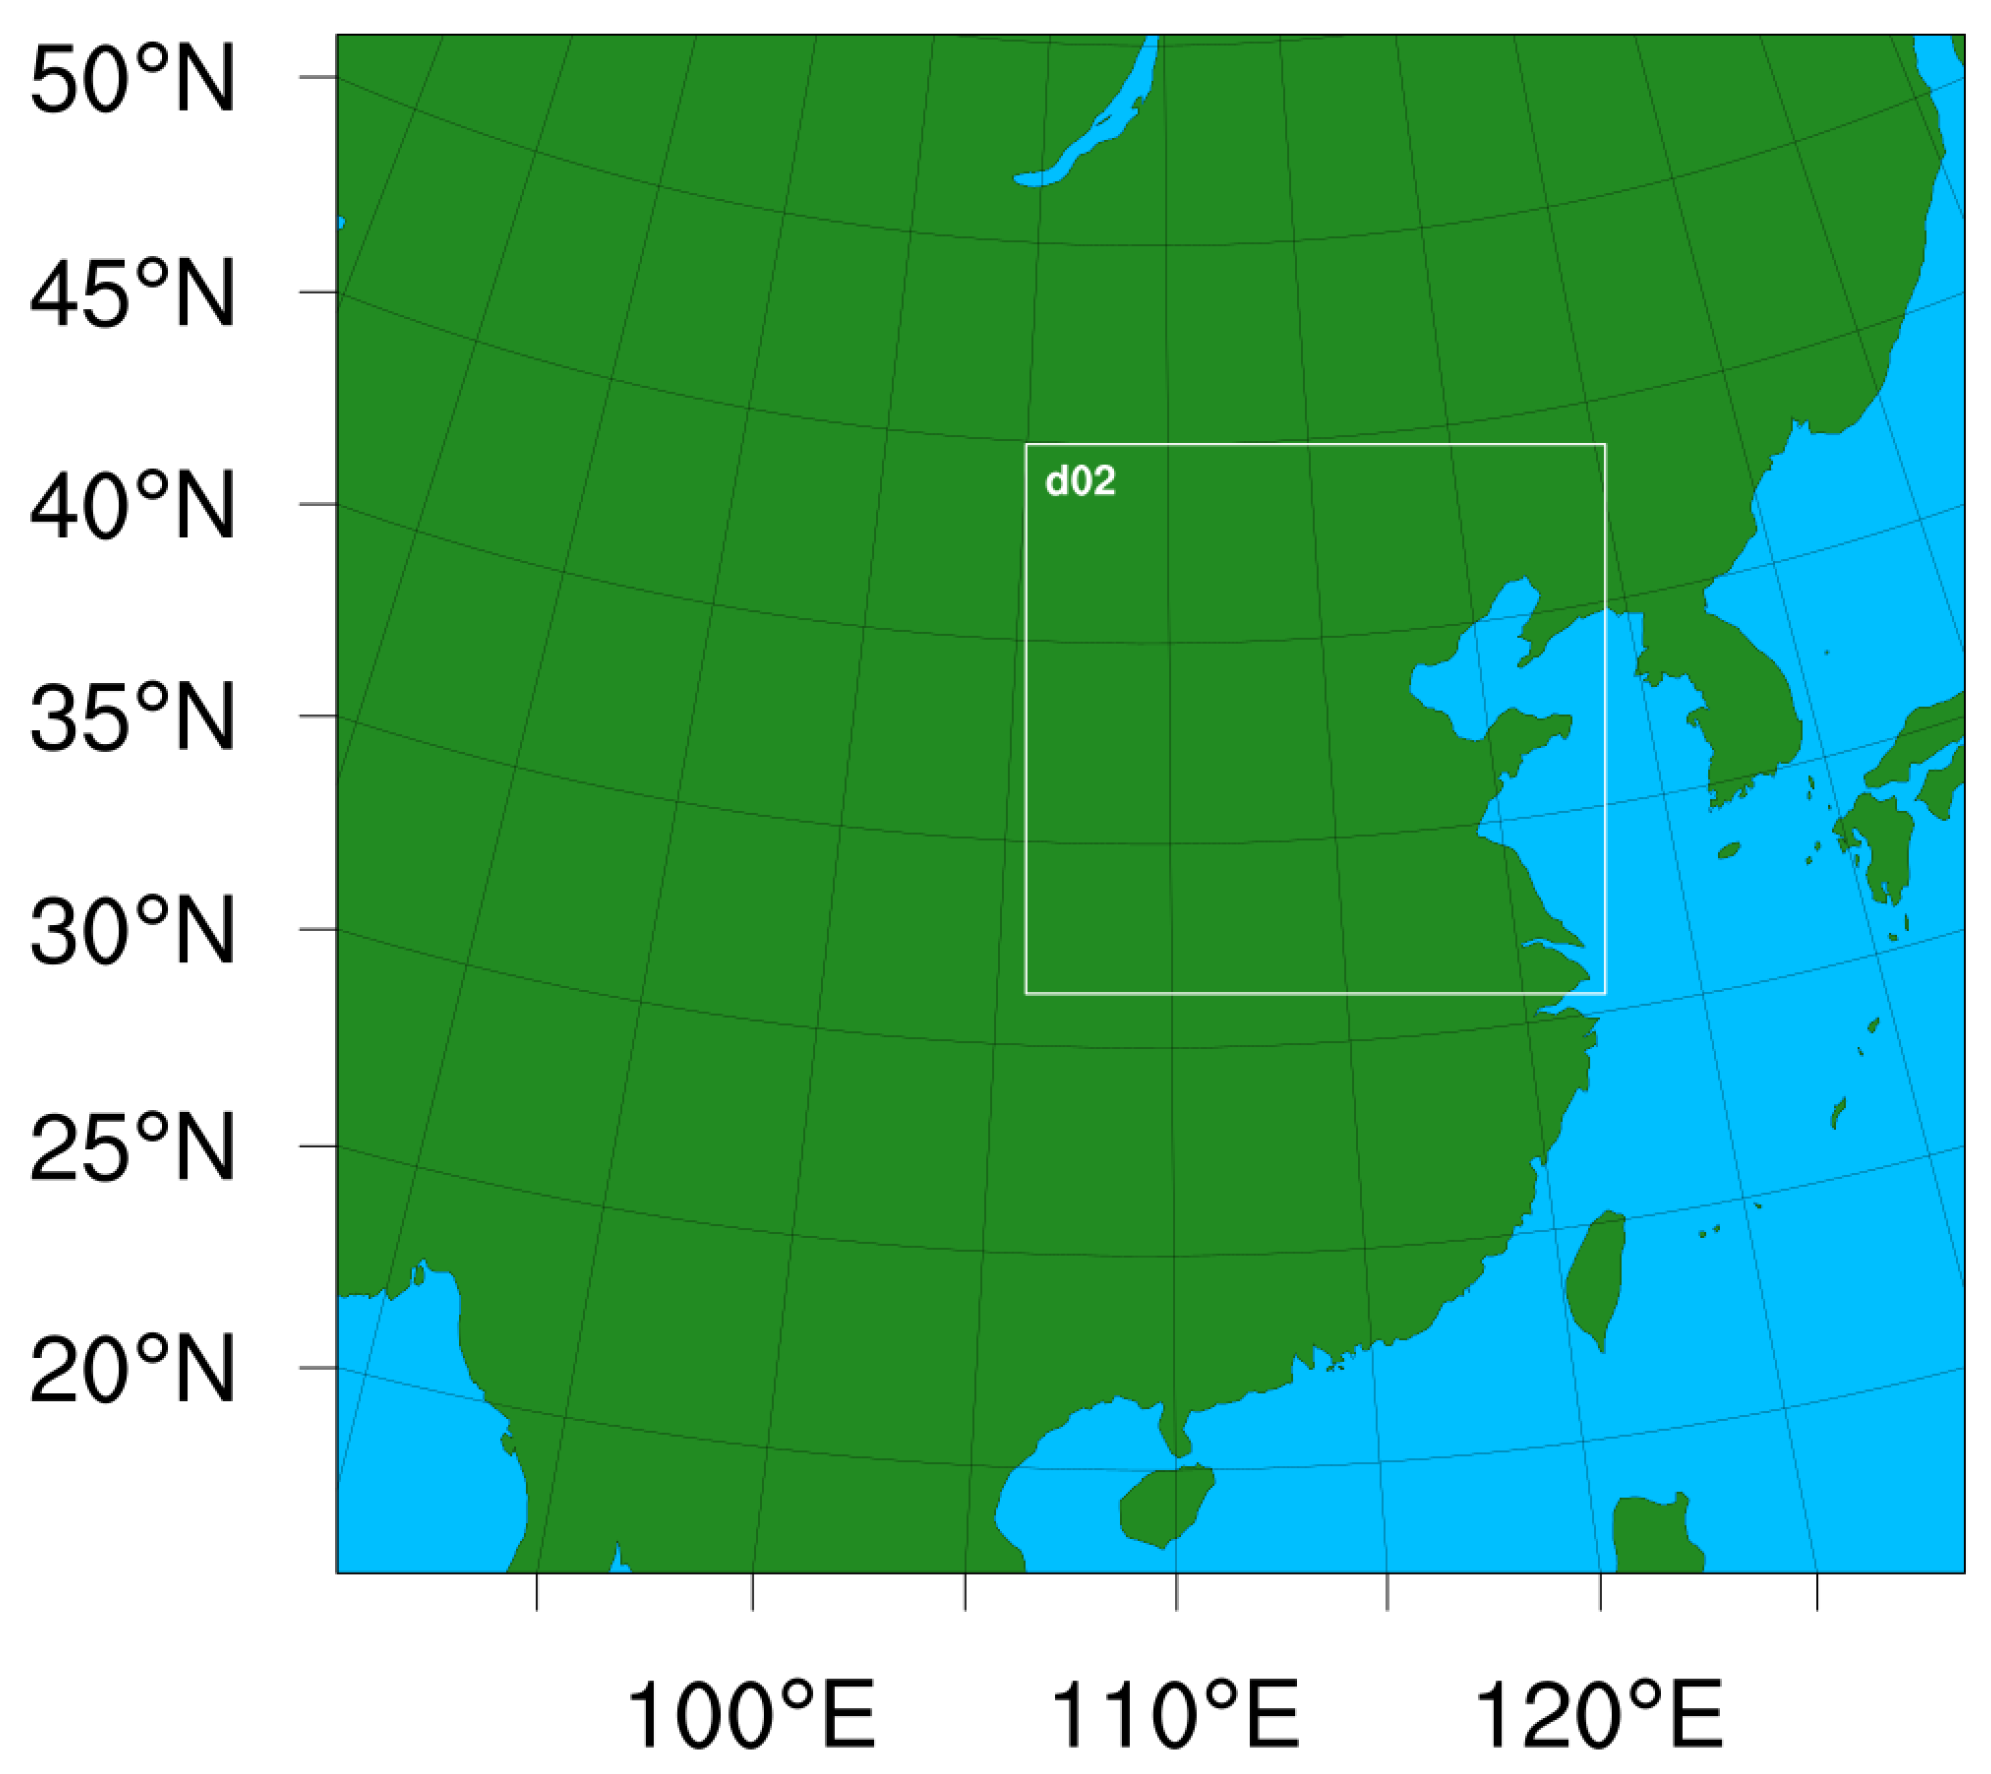
Figure 2.
Surface PM10 mass concentration and 10-meter wind field from 21 to 22 March 2023.
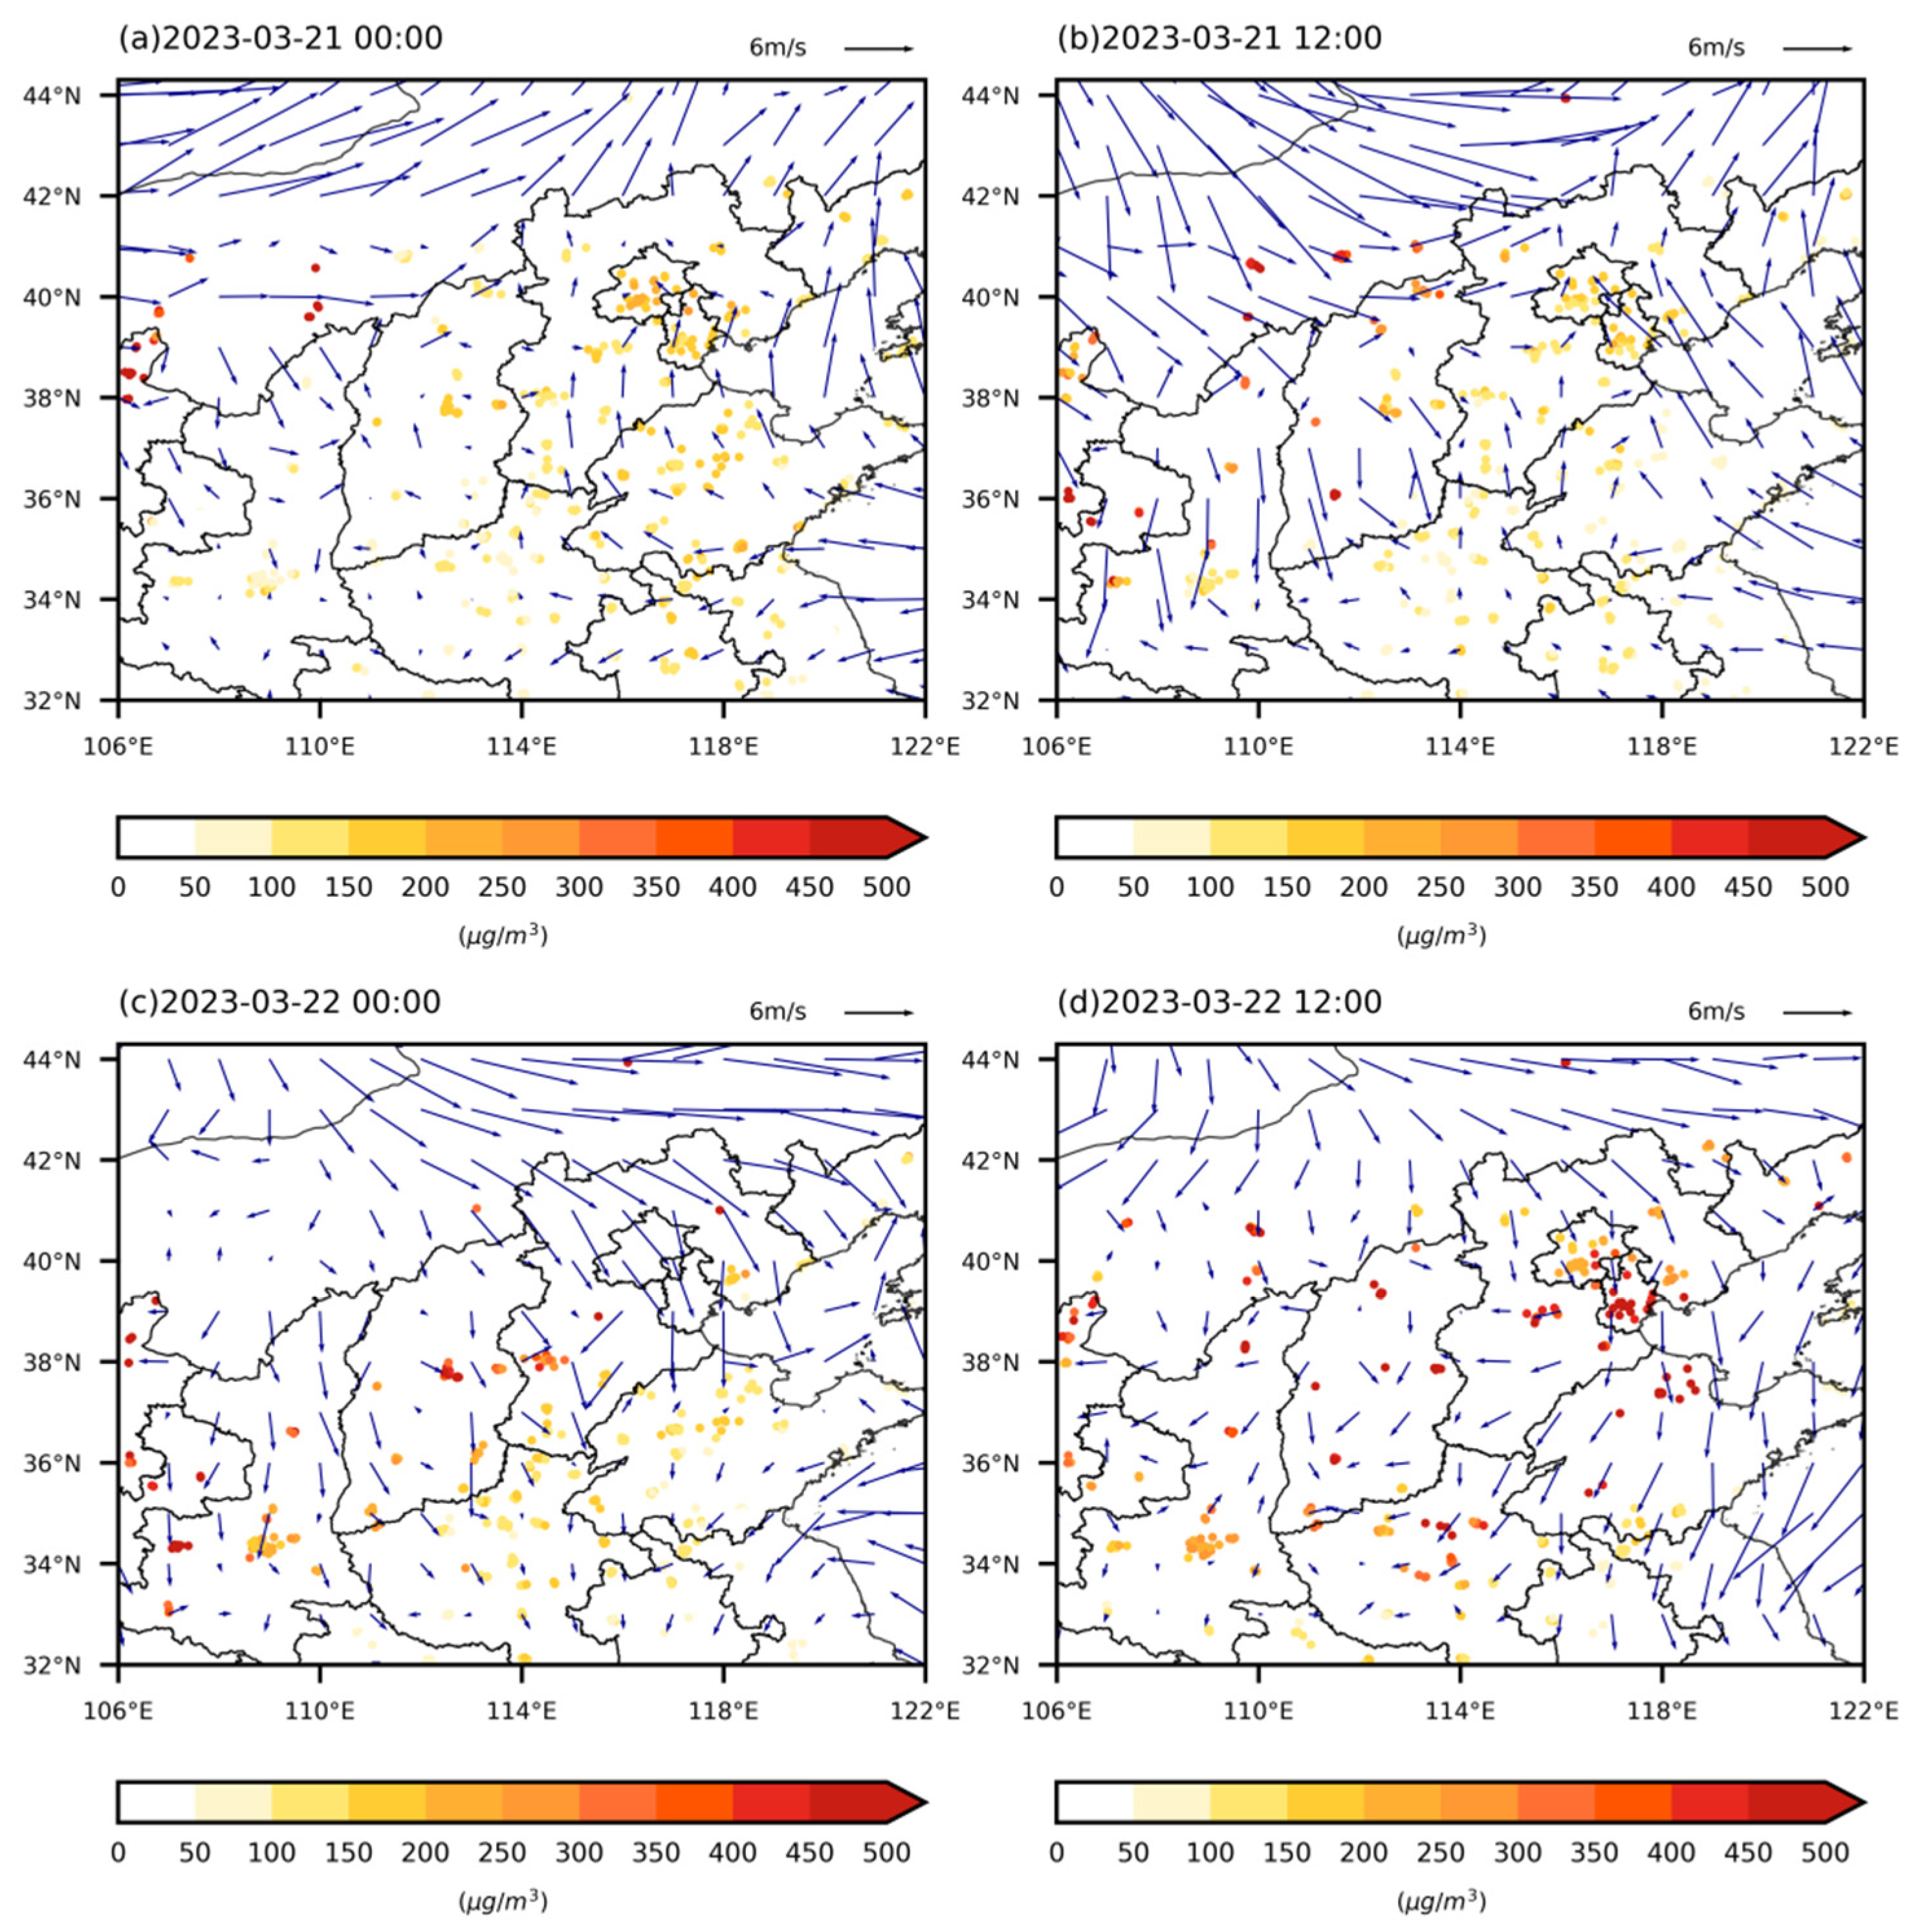
Figure 3.
Surface PM2.5 mass concentration and 10-meter wind field from 21 to 22 March 2023.
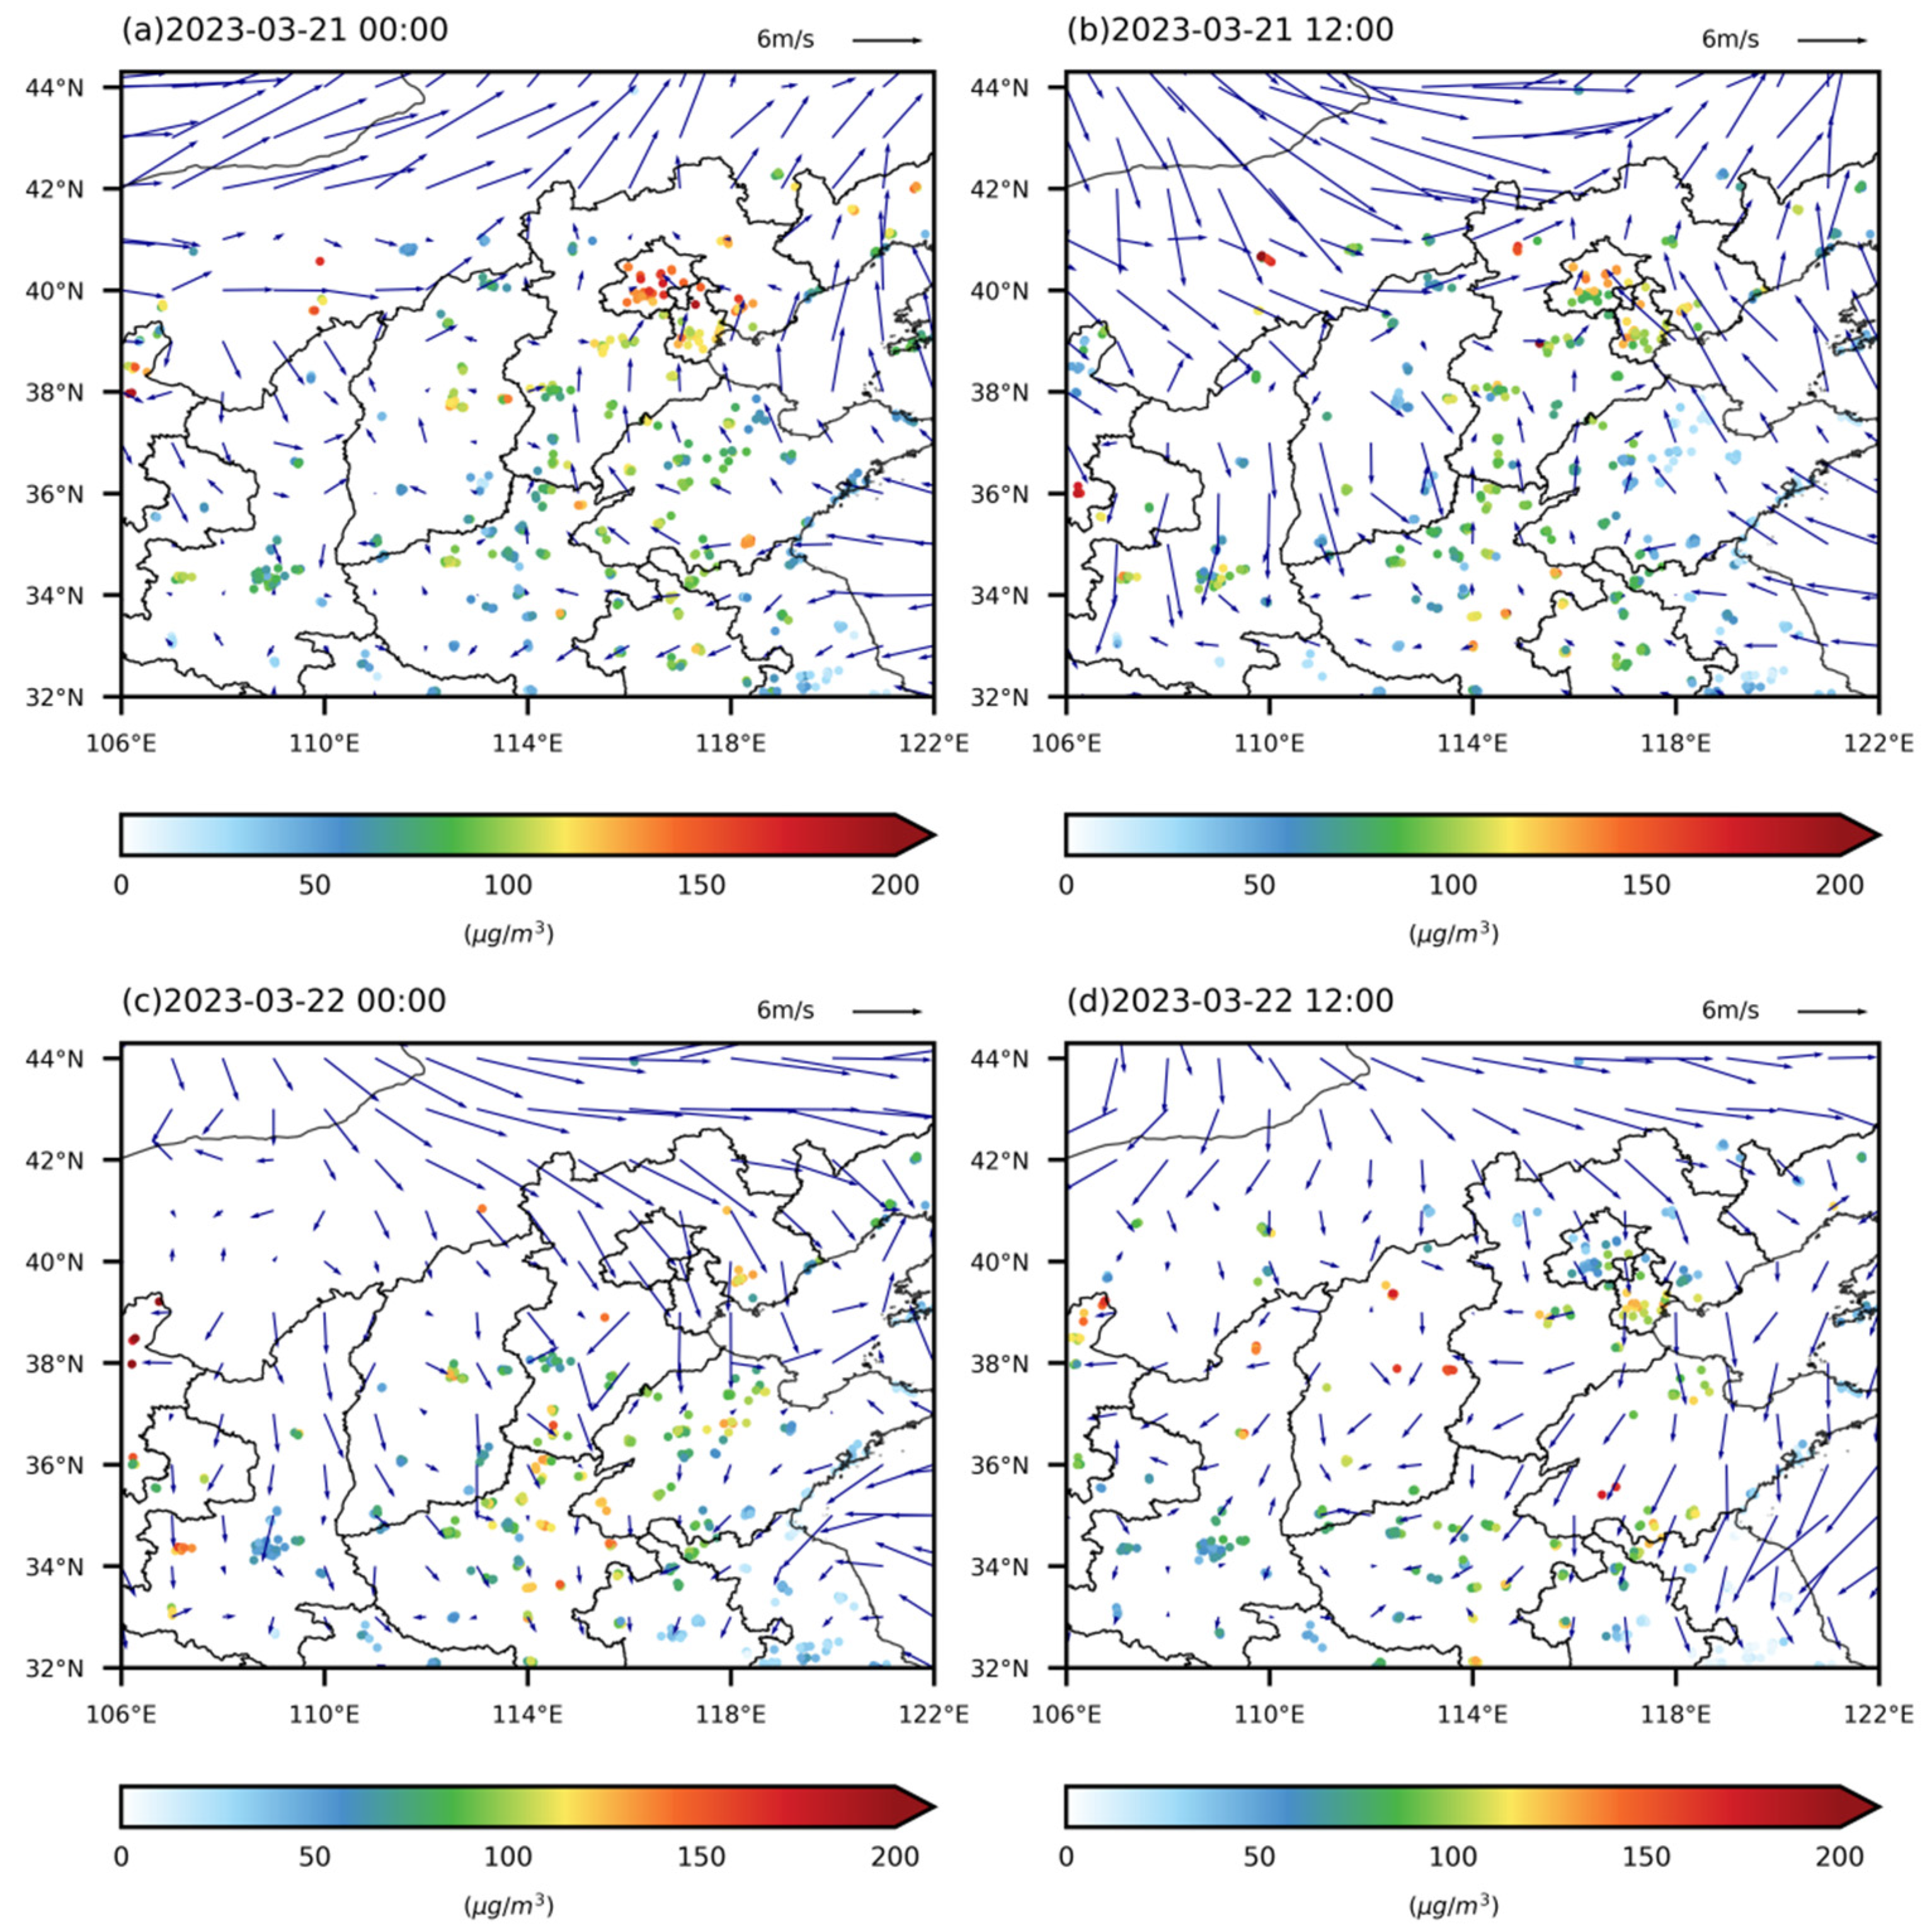
Figure 4.
AOD observations at 00:00 UTC on 21 March 2023.
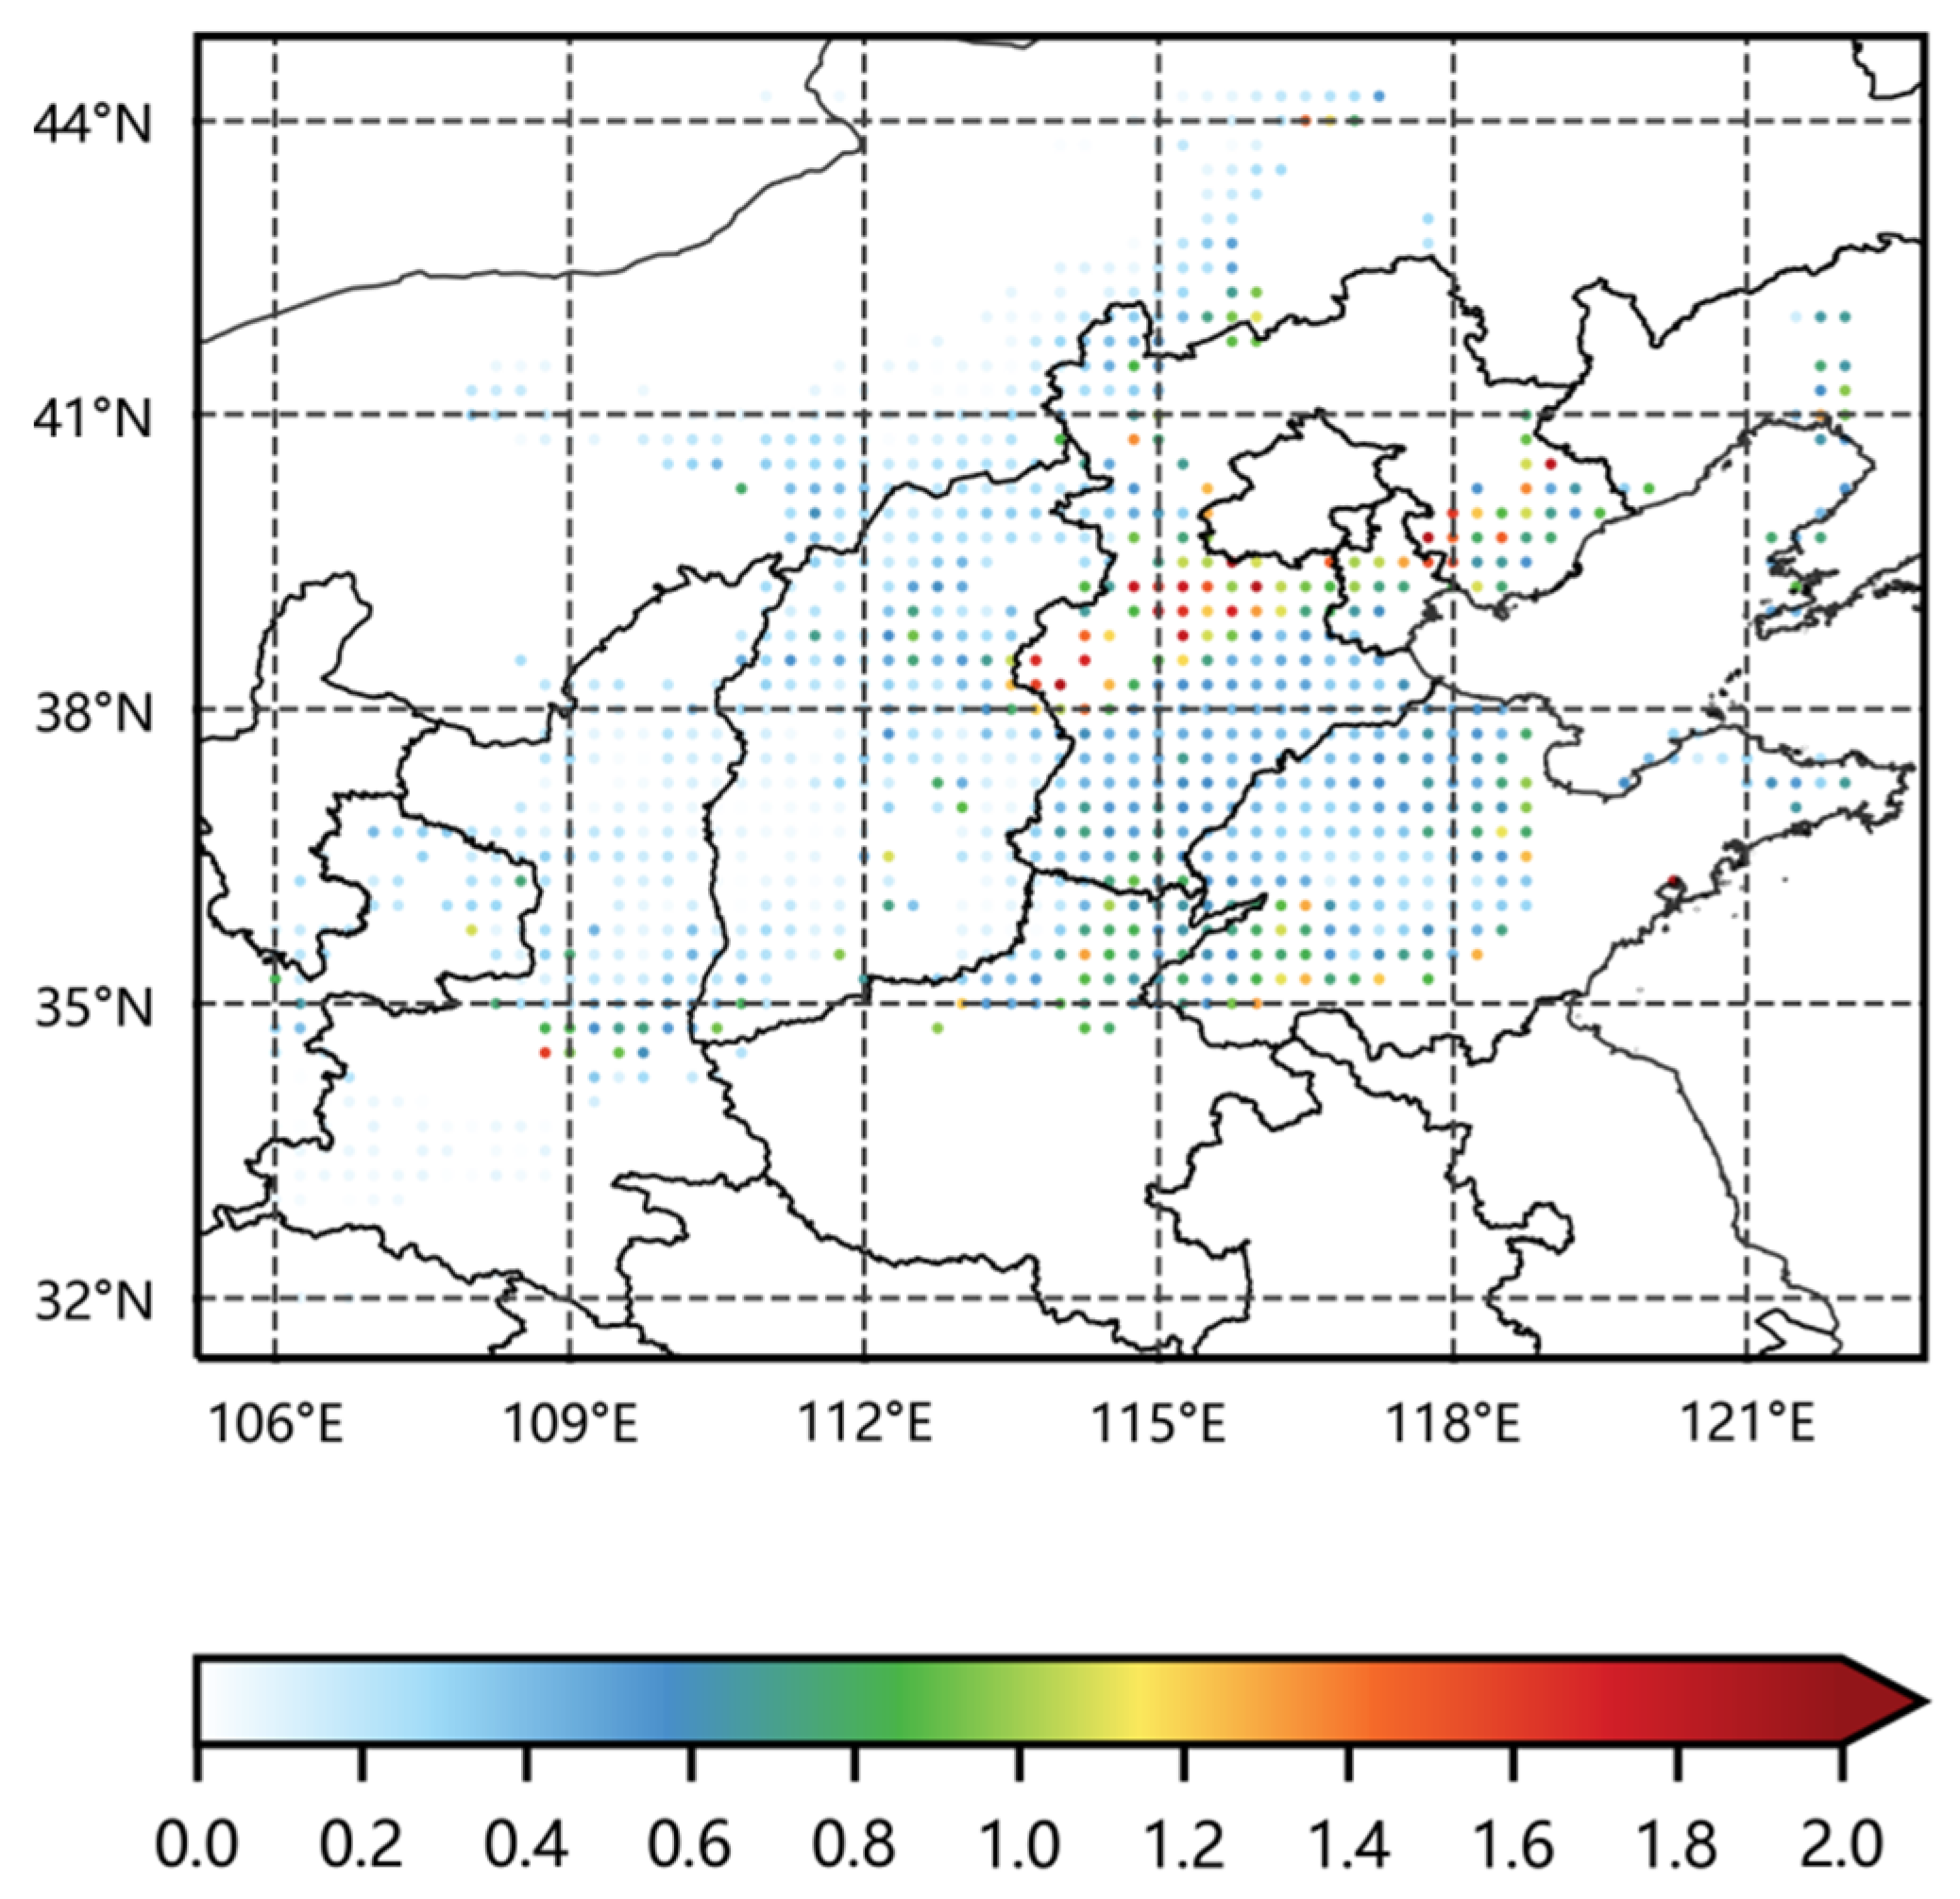
Figure 5.
Scatter plots of simulated versus observed PM₂.₅ concentrations in Domain 2 at 00:00 UTC on the 21st for control (blue) and assimilation (red) experiments. Dashed lines show 2:1, 1:1, and 1:2 observation-to-simulation ratios.
Figure 5.
Scatter plots of simulated versus observed PM₂.₅ concentrations in Domain 2 at 00:00 UTC on the 21st for control (blue) and assimilation (red) experiments. Dashed lines show 2:1, 1:1, and 1:2 observation-to-simulation ratios.
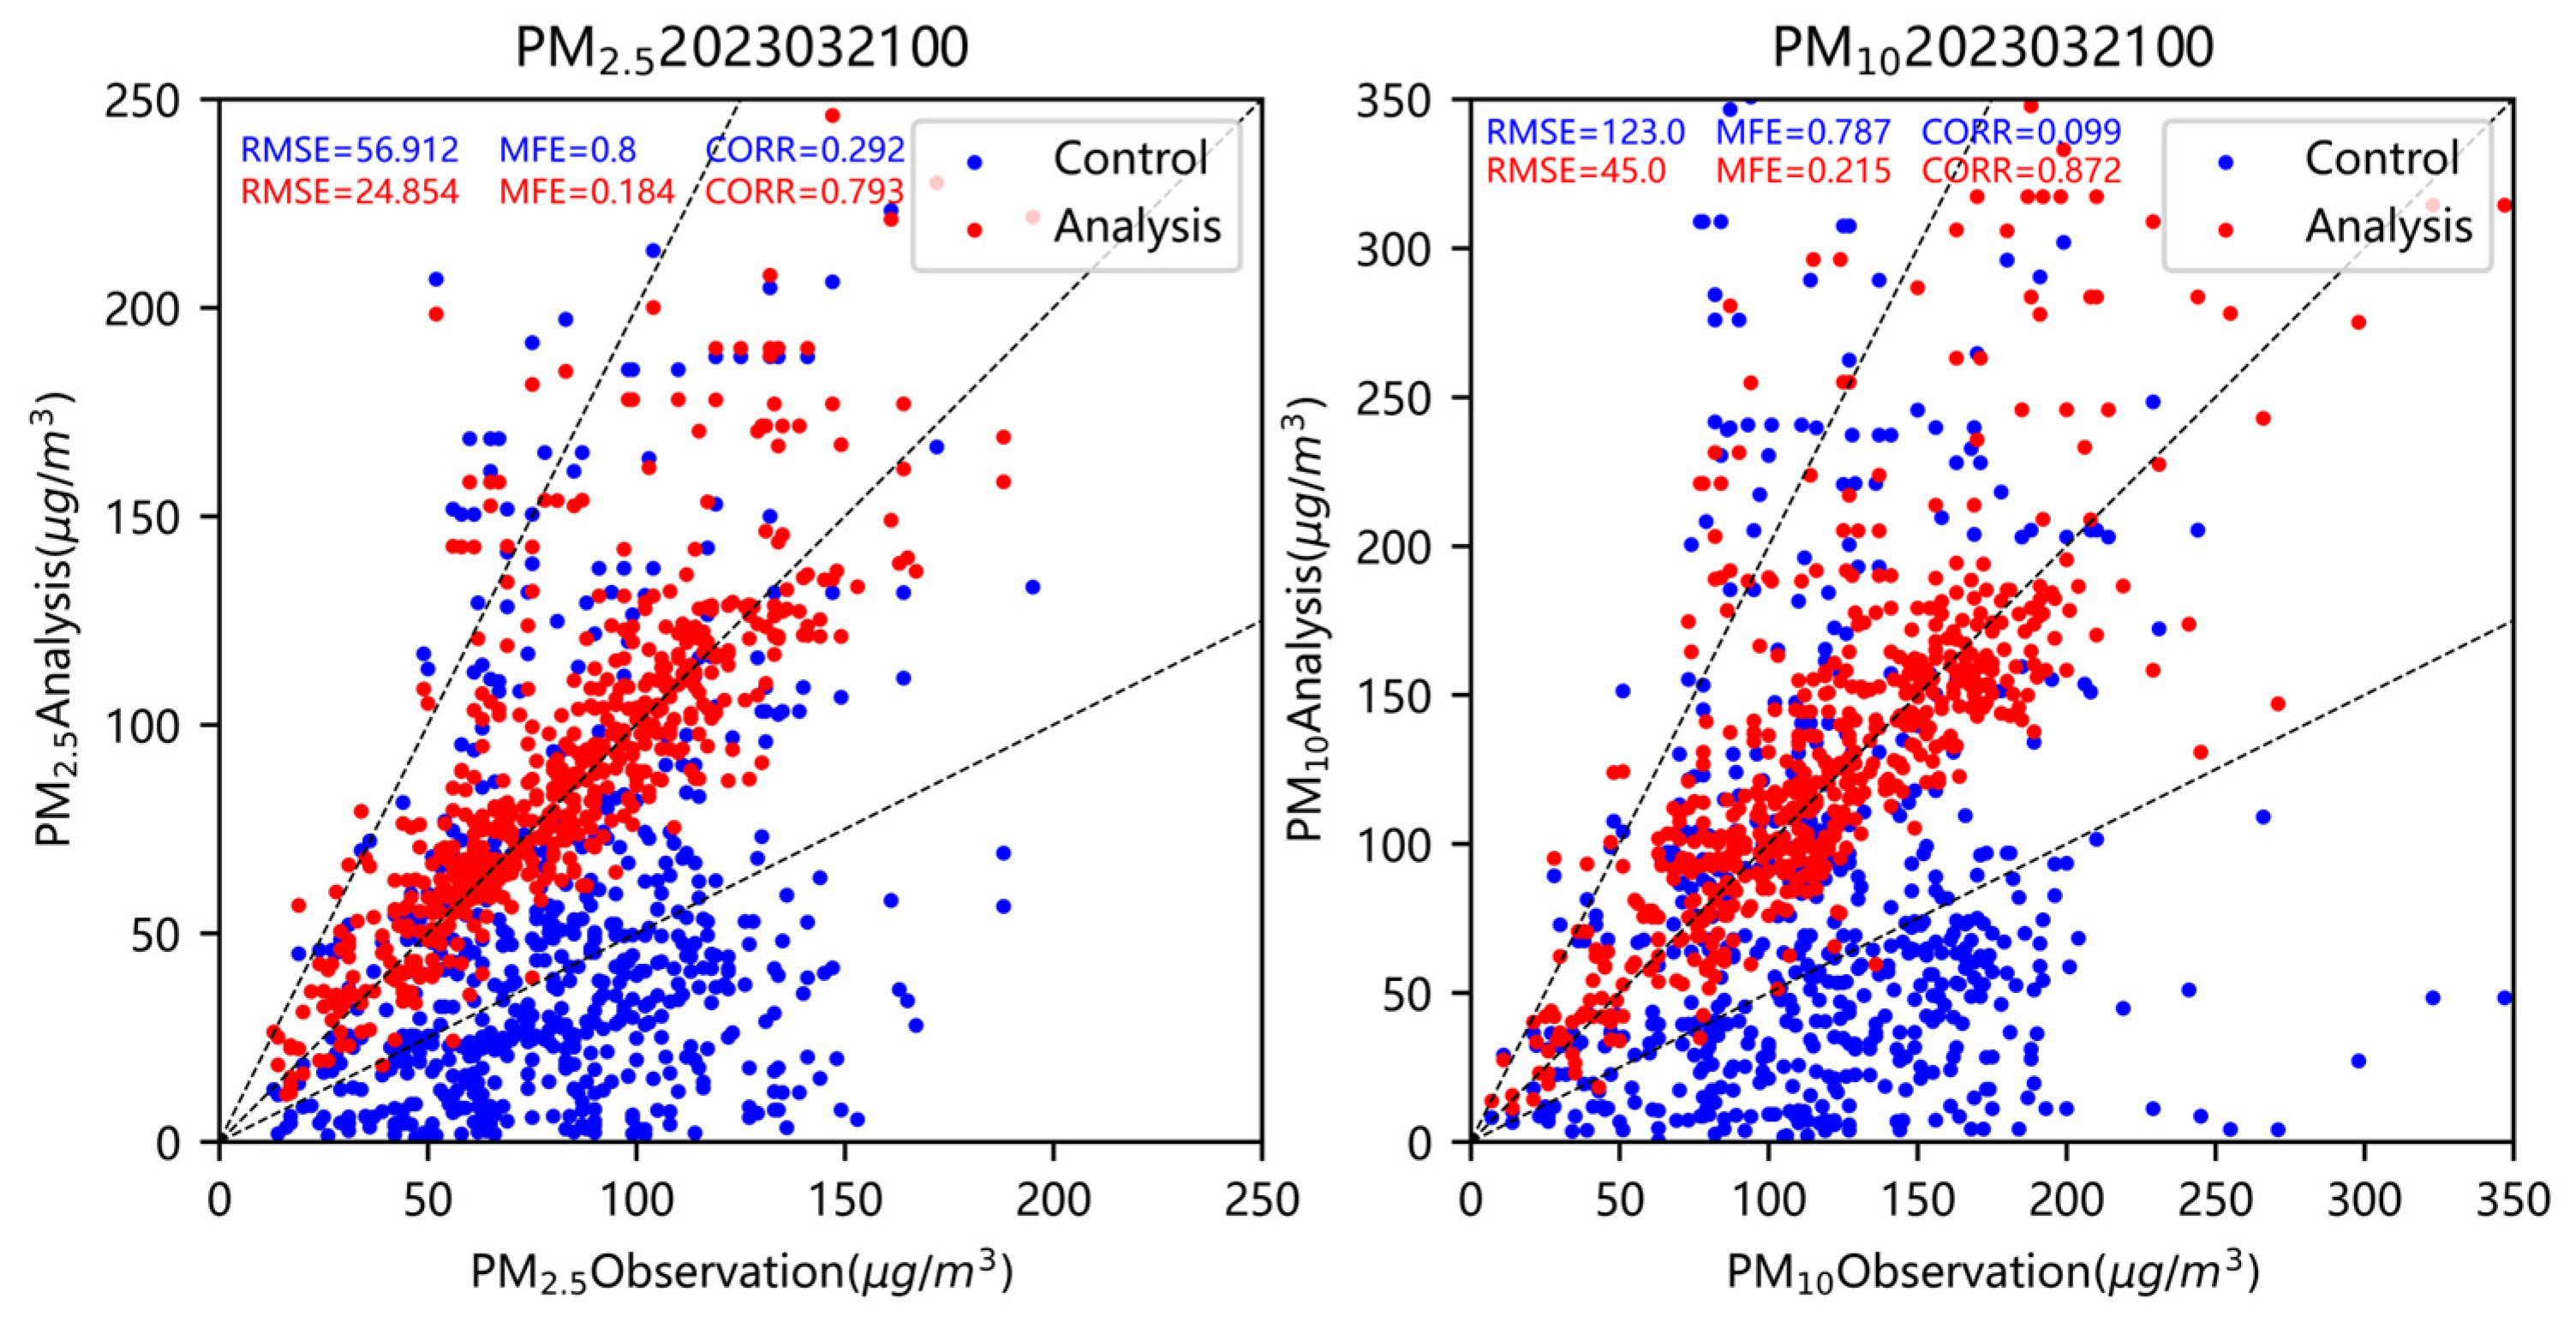
Figure 6.
Spatial distribution of initial PM₂.₅ fields: (a) Control experiment, (b) Assimilation experiment, (c) Increment field.
Figure 6.
Spatial distribution of initial PM₂.₅ fields: (a) Control experiment, (b) Assimilation experiment, (c) Increment field.
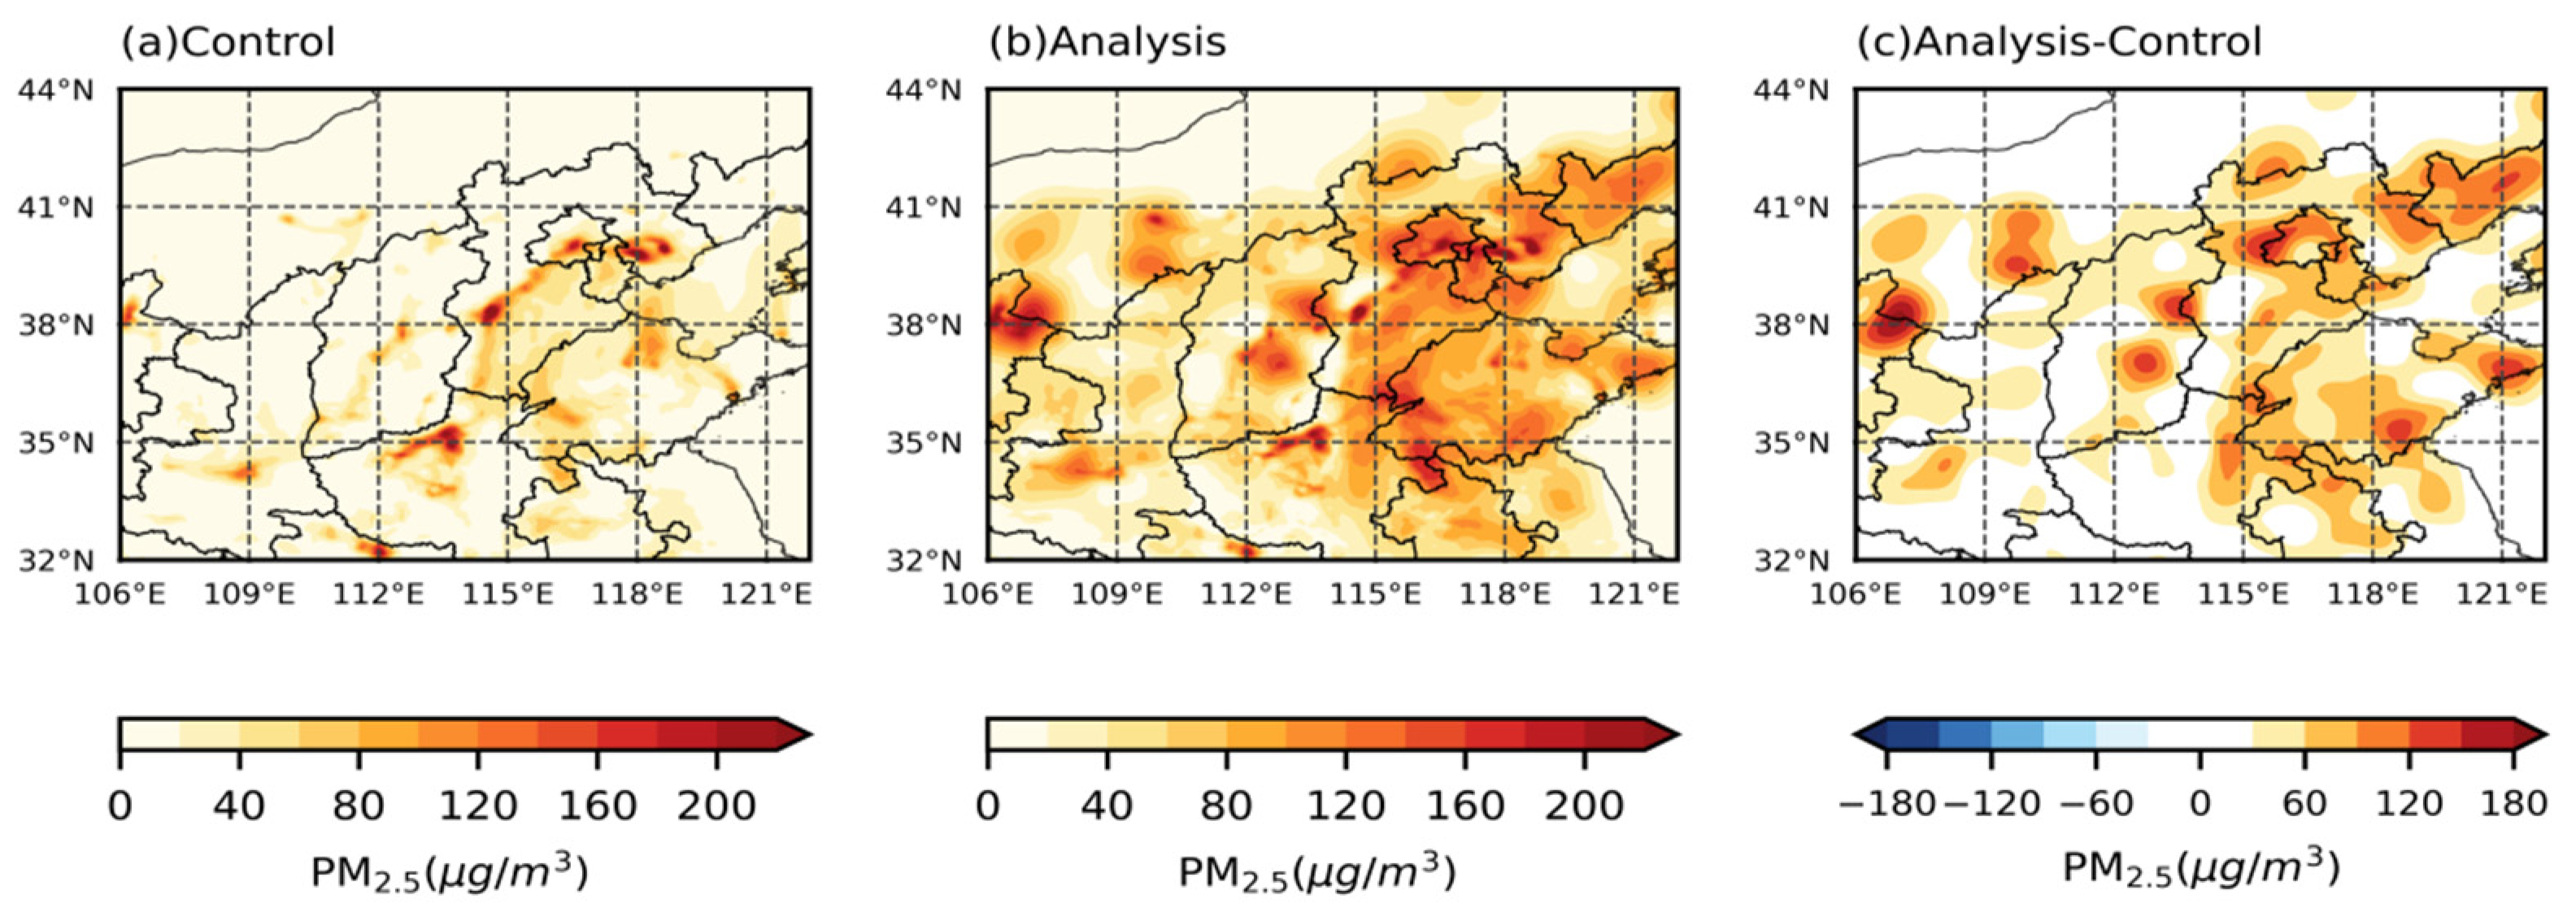
Figure 7.
Spatial distribution of initial PM10 fields: (a) Control experiment, (b) Assimilation experiment, (c) Increment field.
Figure 7.
Spatial distribution of initial PM10 fields: (a) Control experiment, (b) Assimilation experiment, (c) Increment field.
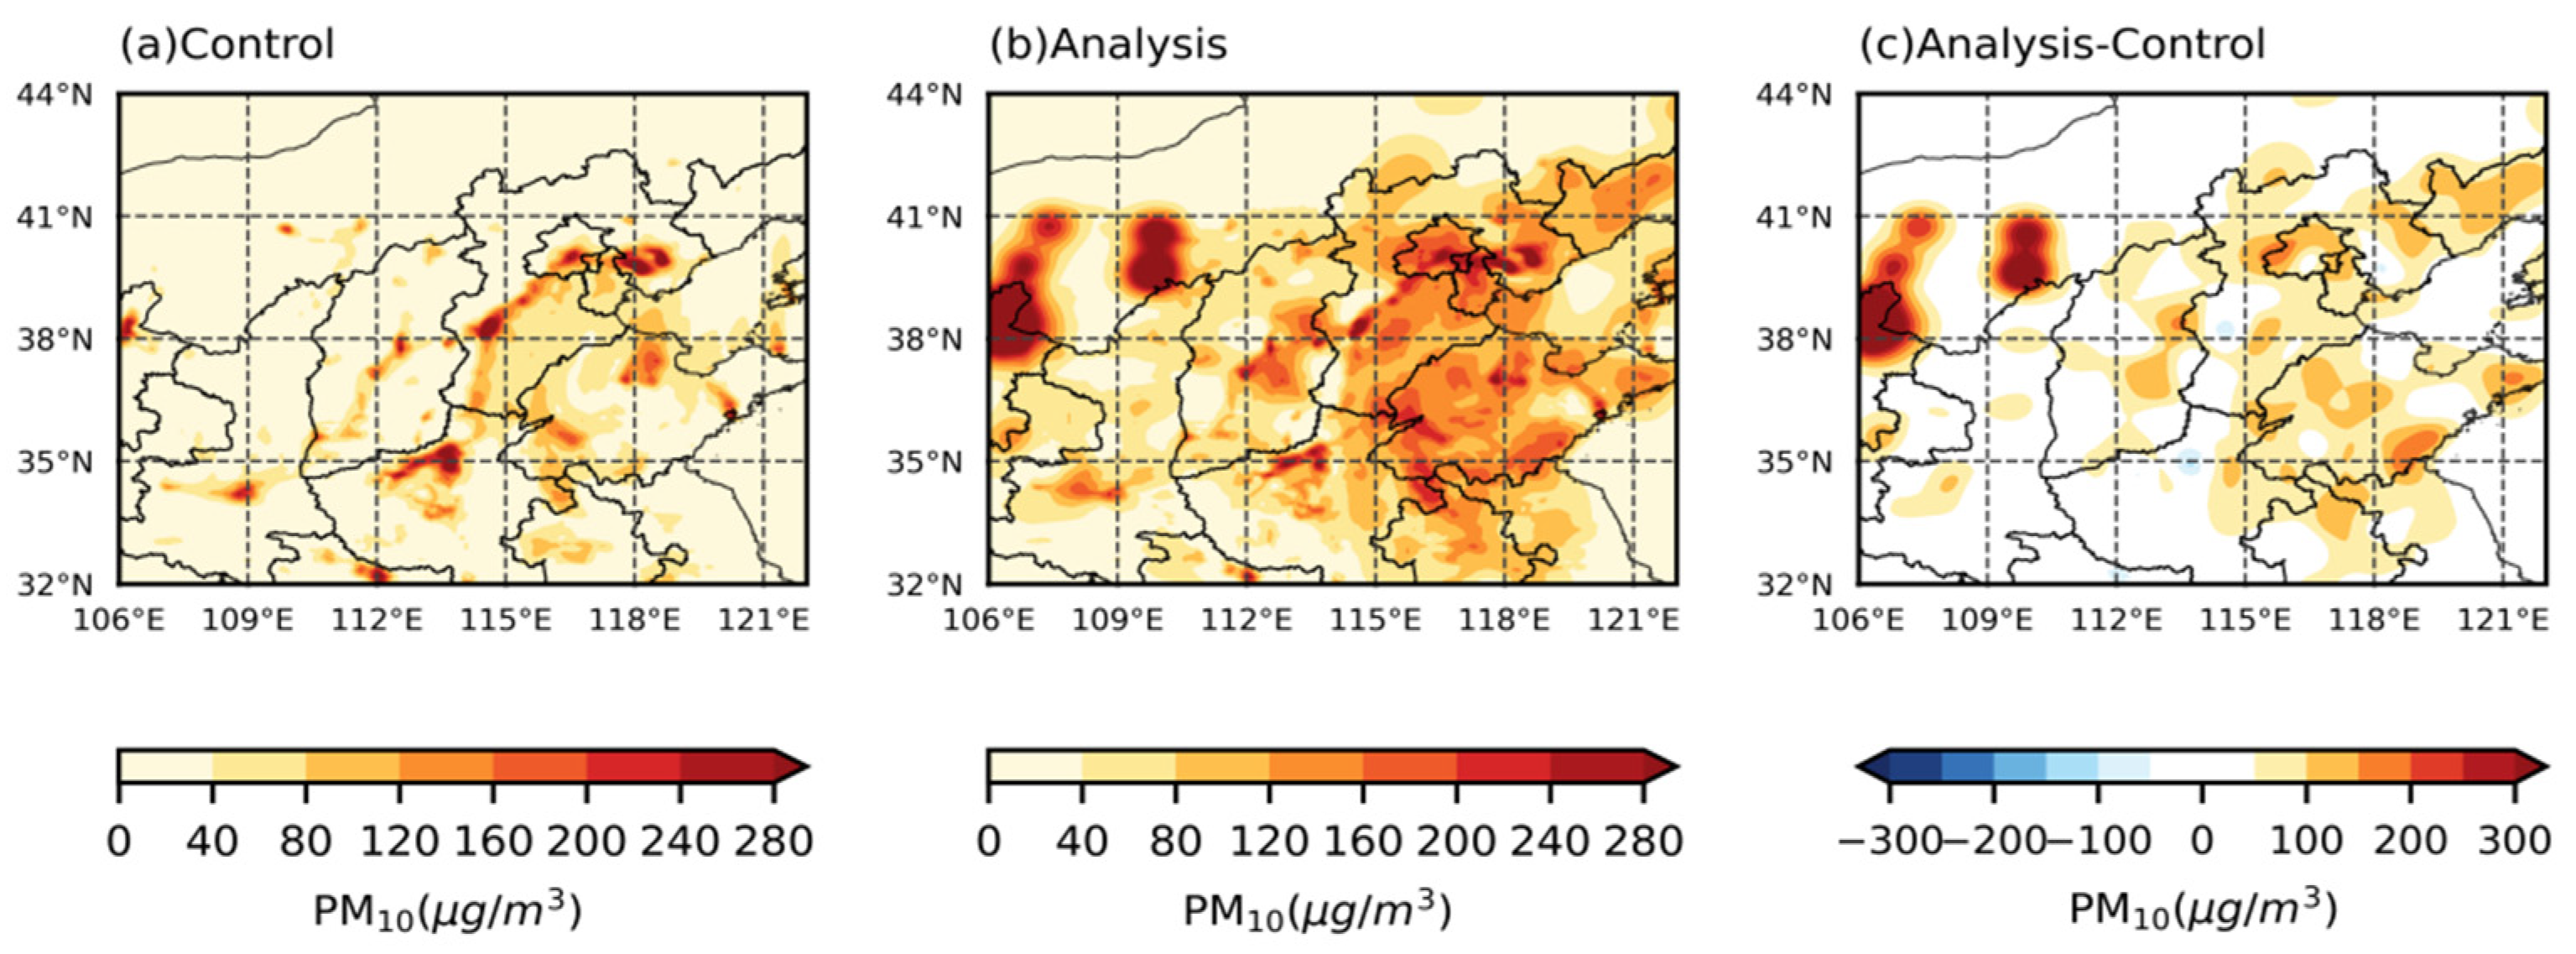
Figure 8.
Spatial distribution of initial AOD fields: (a) Control experiment, (b) Assimilation experiment, (c) Increment field.
Figure 8.
Spatial distribution of initial AOD fields: (a) Control experiment, (b) Assimilation experiment, (c) Increment field.
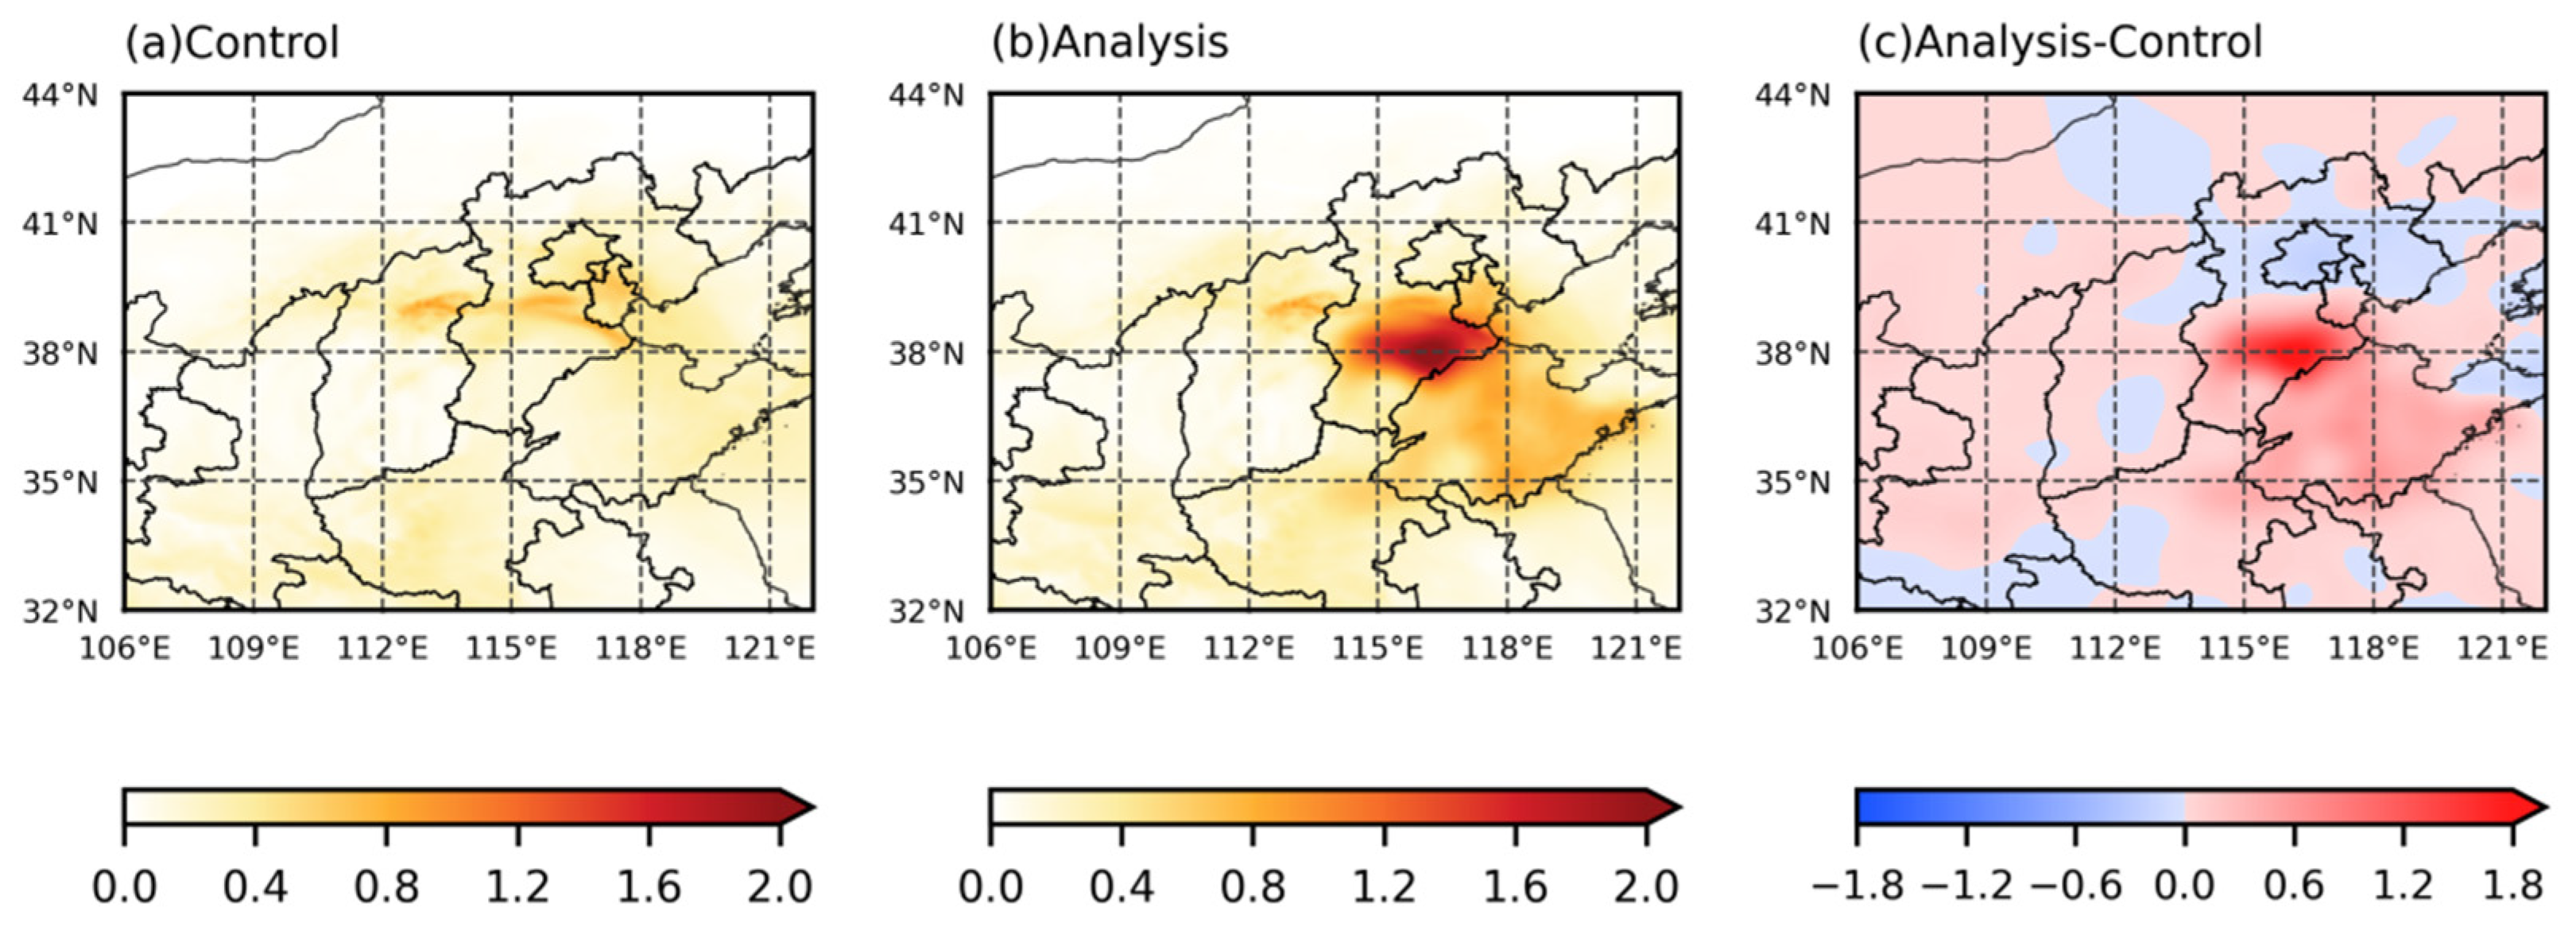
Figure 9.
Temporal variations of PM10 statistical metrics during the 54-hour forecast initialized at 00:00 UTC 21 March 2023: assimilation experiment (blue) vs control experiment (red).
Figure 9.
Temporal variations of PM10 statistical metrics during the 54-hour forecast initialized at 00:00 UTC 21 March 2023: assimilation experiment (blue) vs control experiment (red).
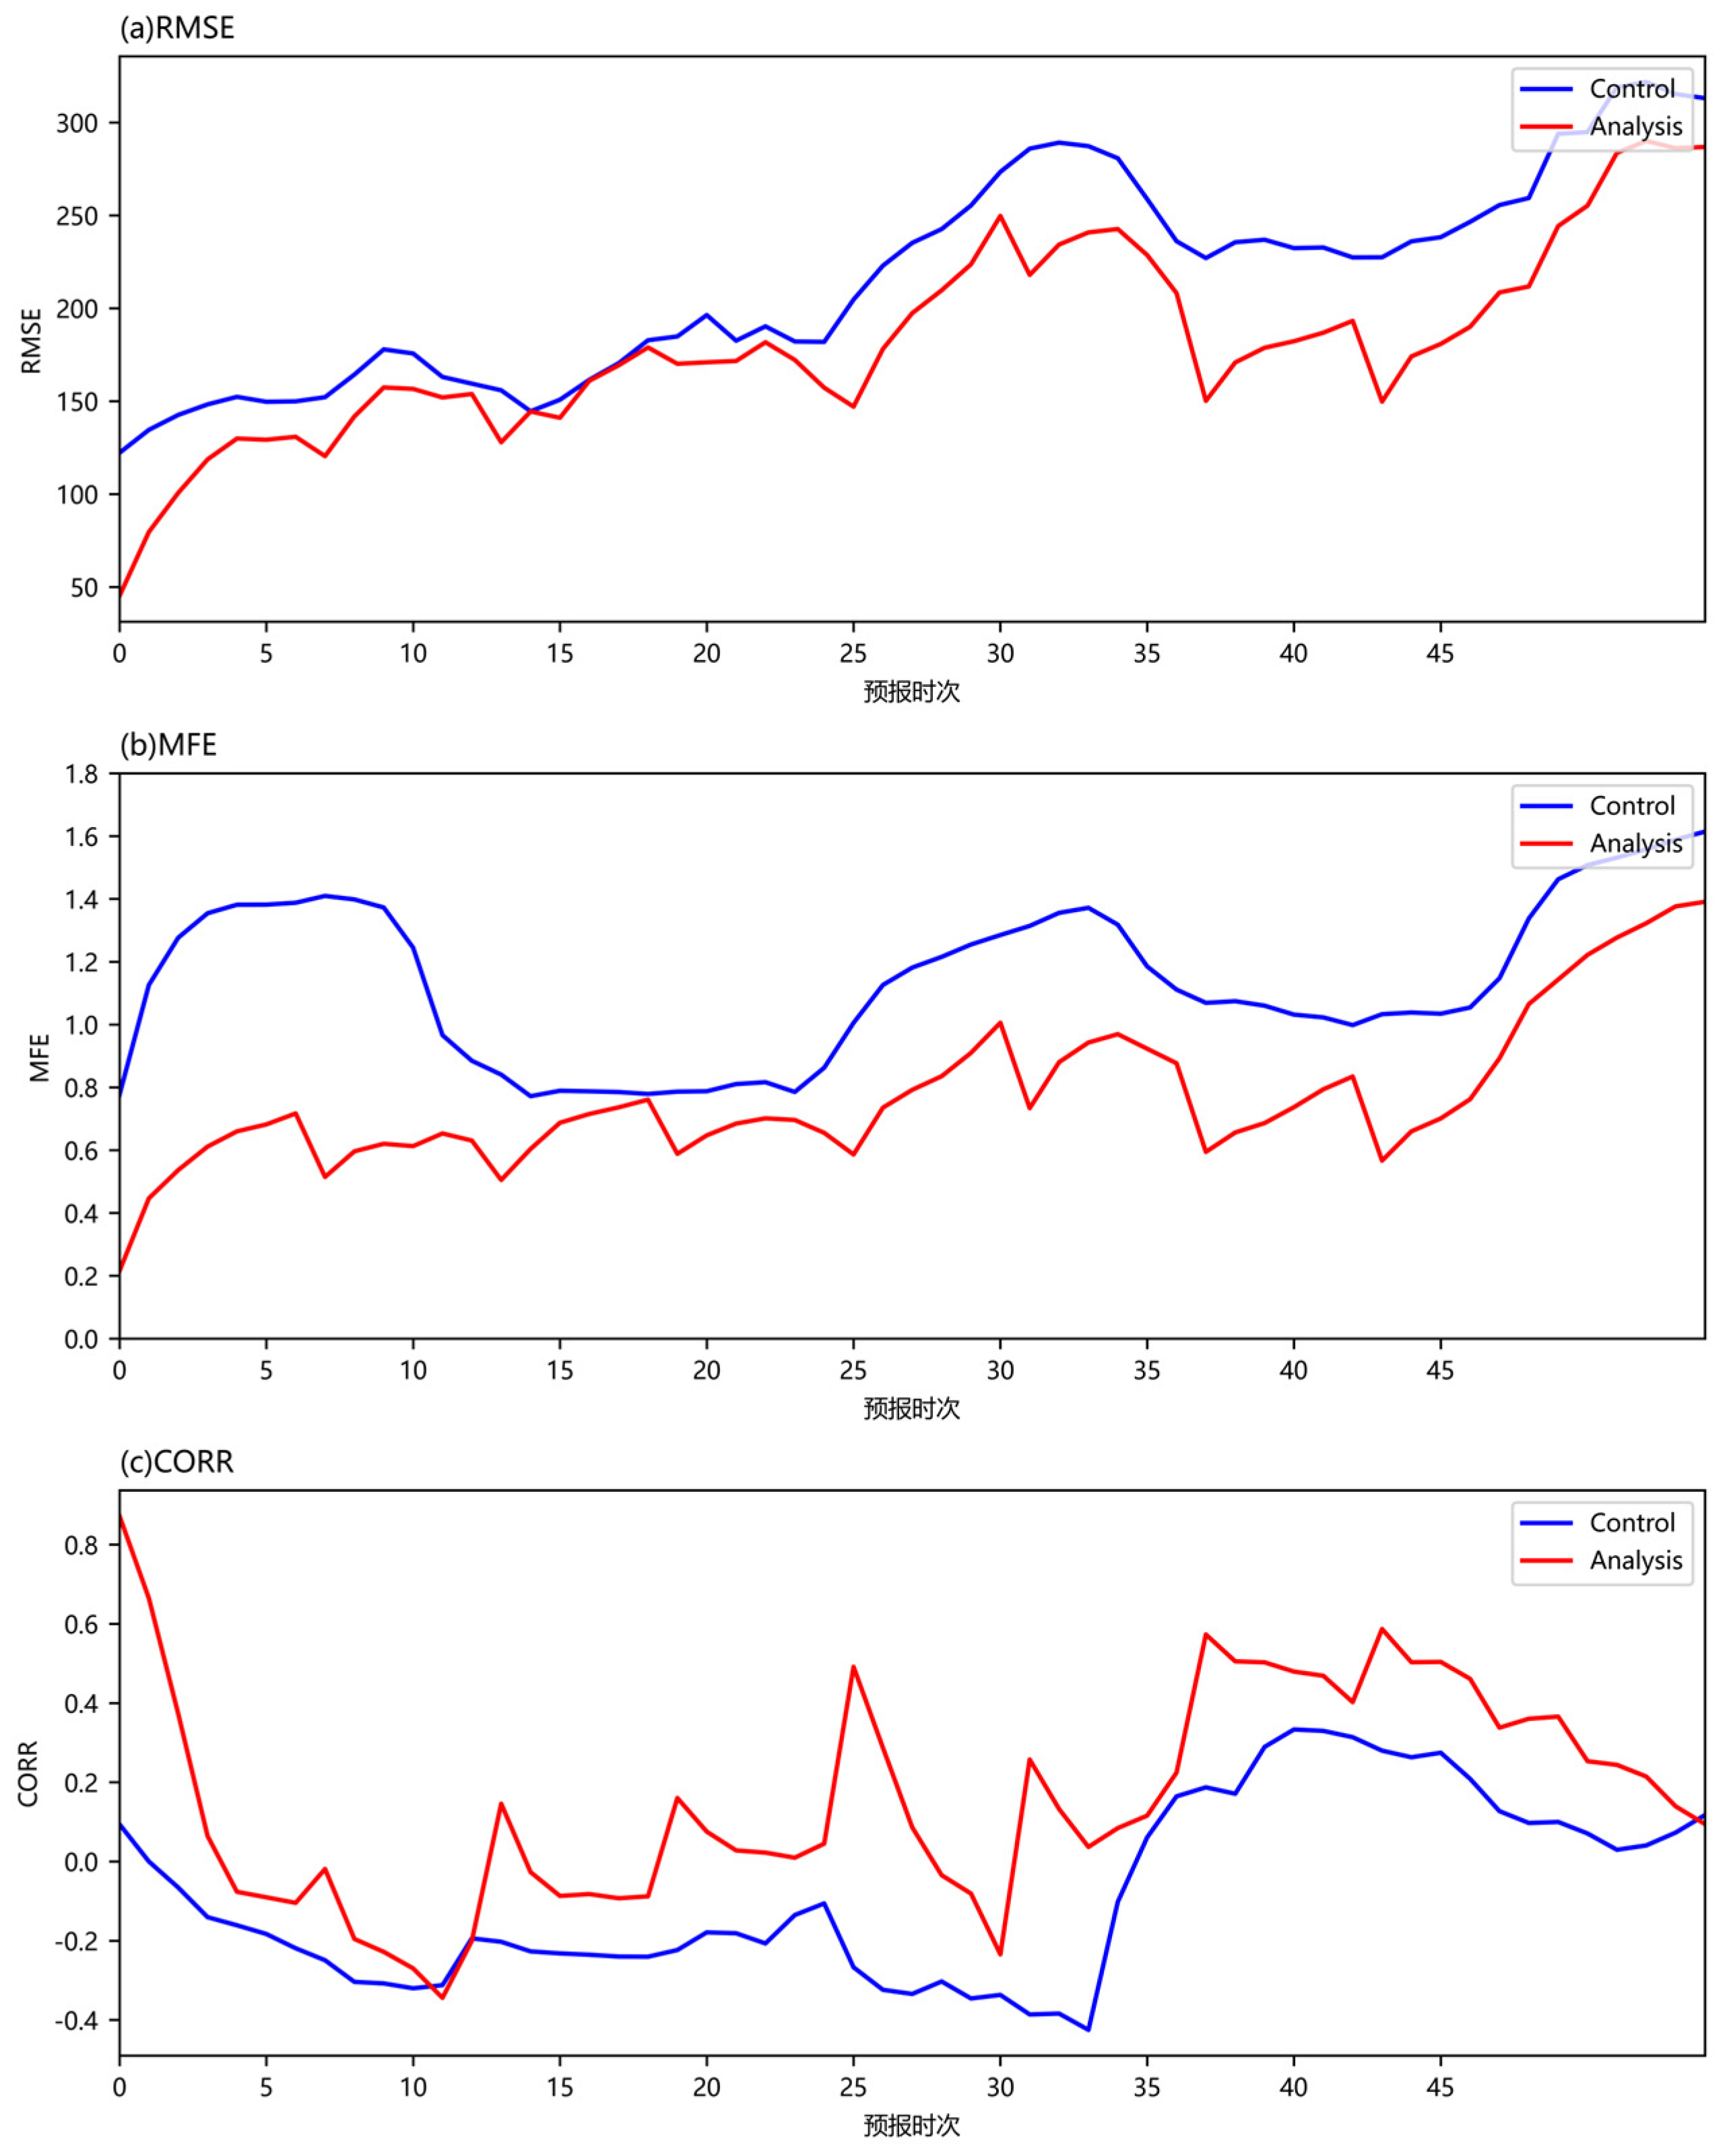
Figure 10.
The same as Figure 9, but PM2.5.
Figure 10.
The same as Figure 9, but PM2.5.
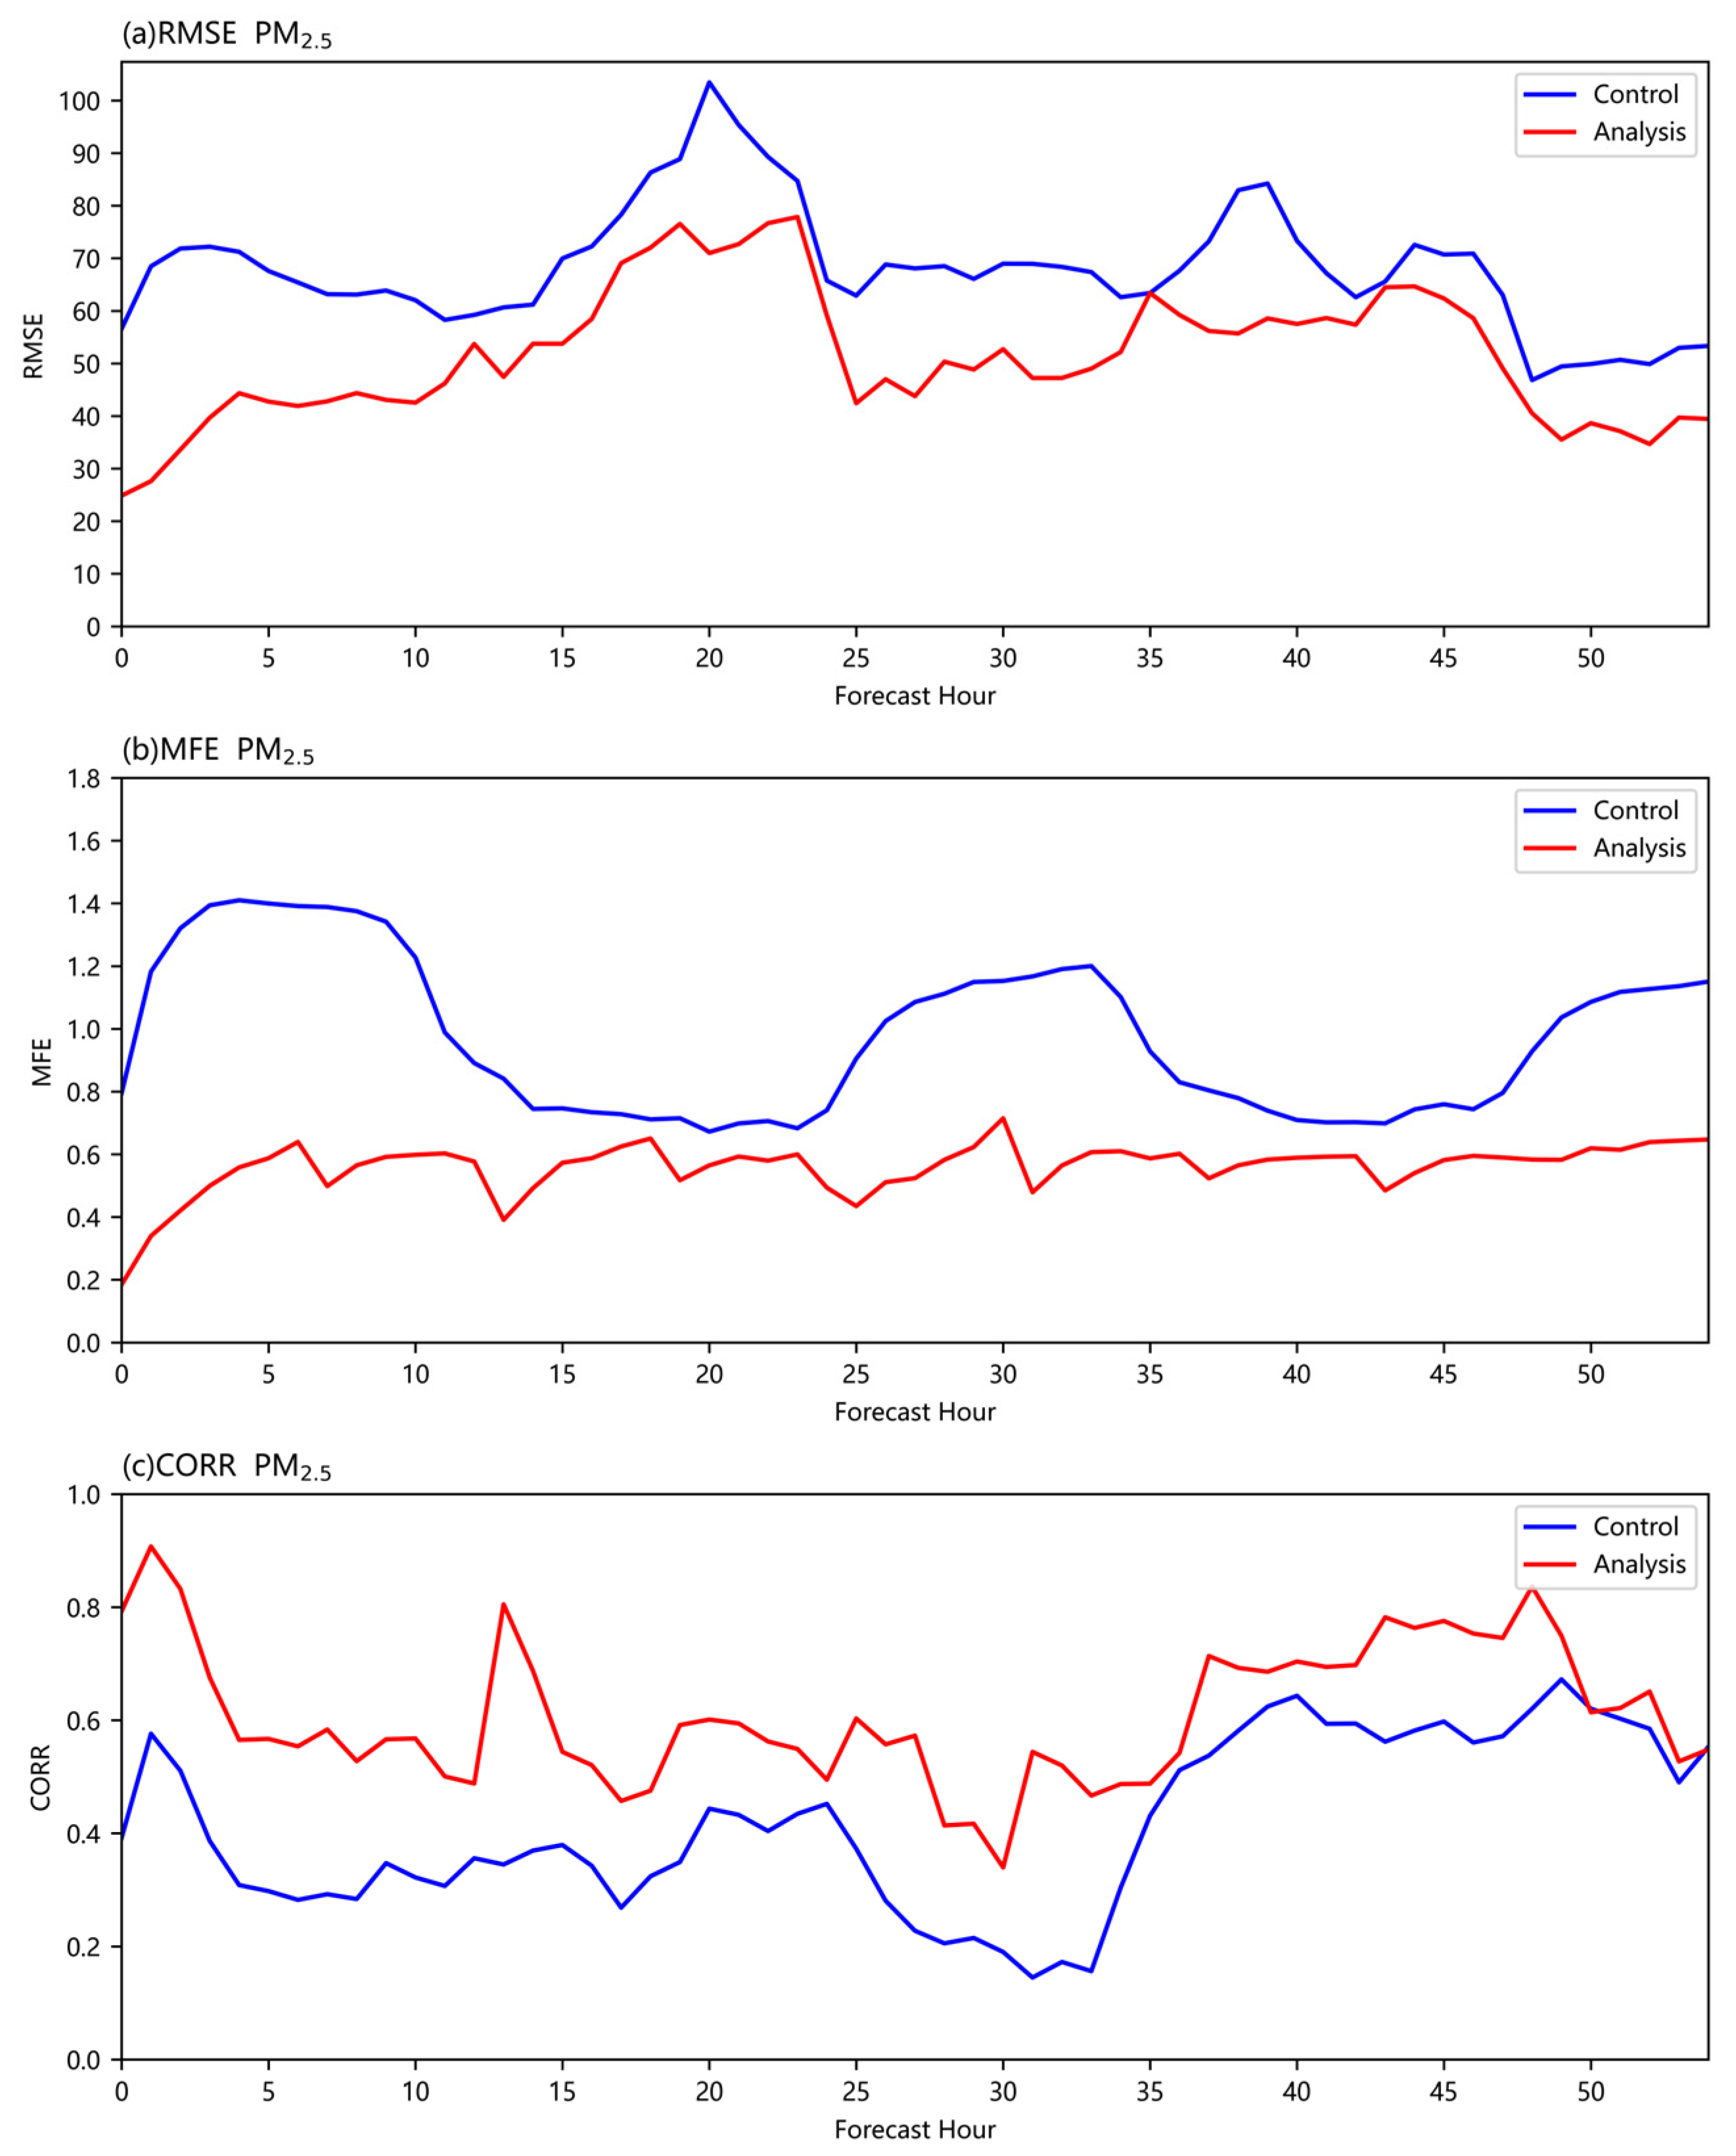
Figure 11.
Spatial distributions of Channel 10 TBB at 00:00 UTC 21 March 2023: (a) Control experiment, (b) Assimilation experiment, (c) Increment field, and (d) FY-4A TBB observations.
Figure 11.
Spatial distributions of Channel 10 TBB at 00:00 UTC 21 March 2023: (a) Control experiment, (b) Assimilation experiment, (c) Increment field, and (d) FY-4A TBB observations.
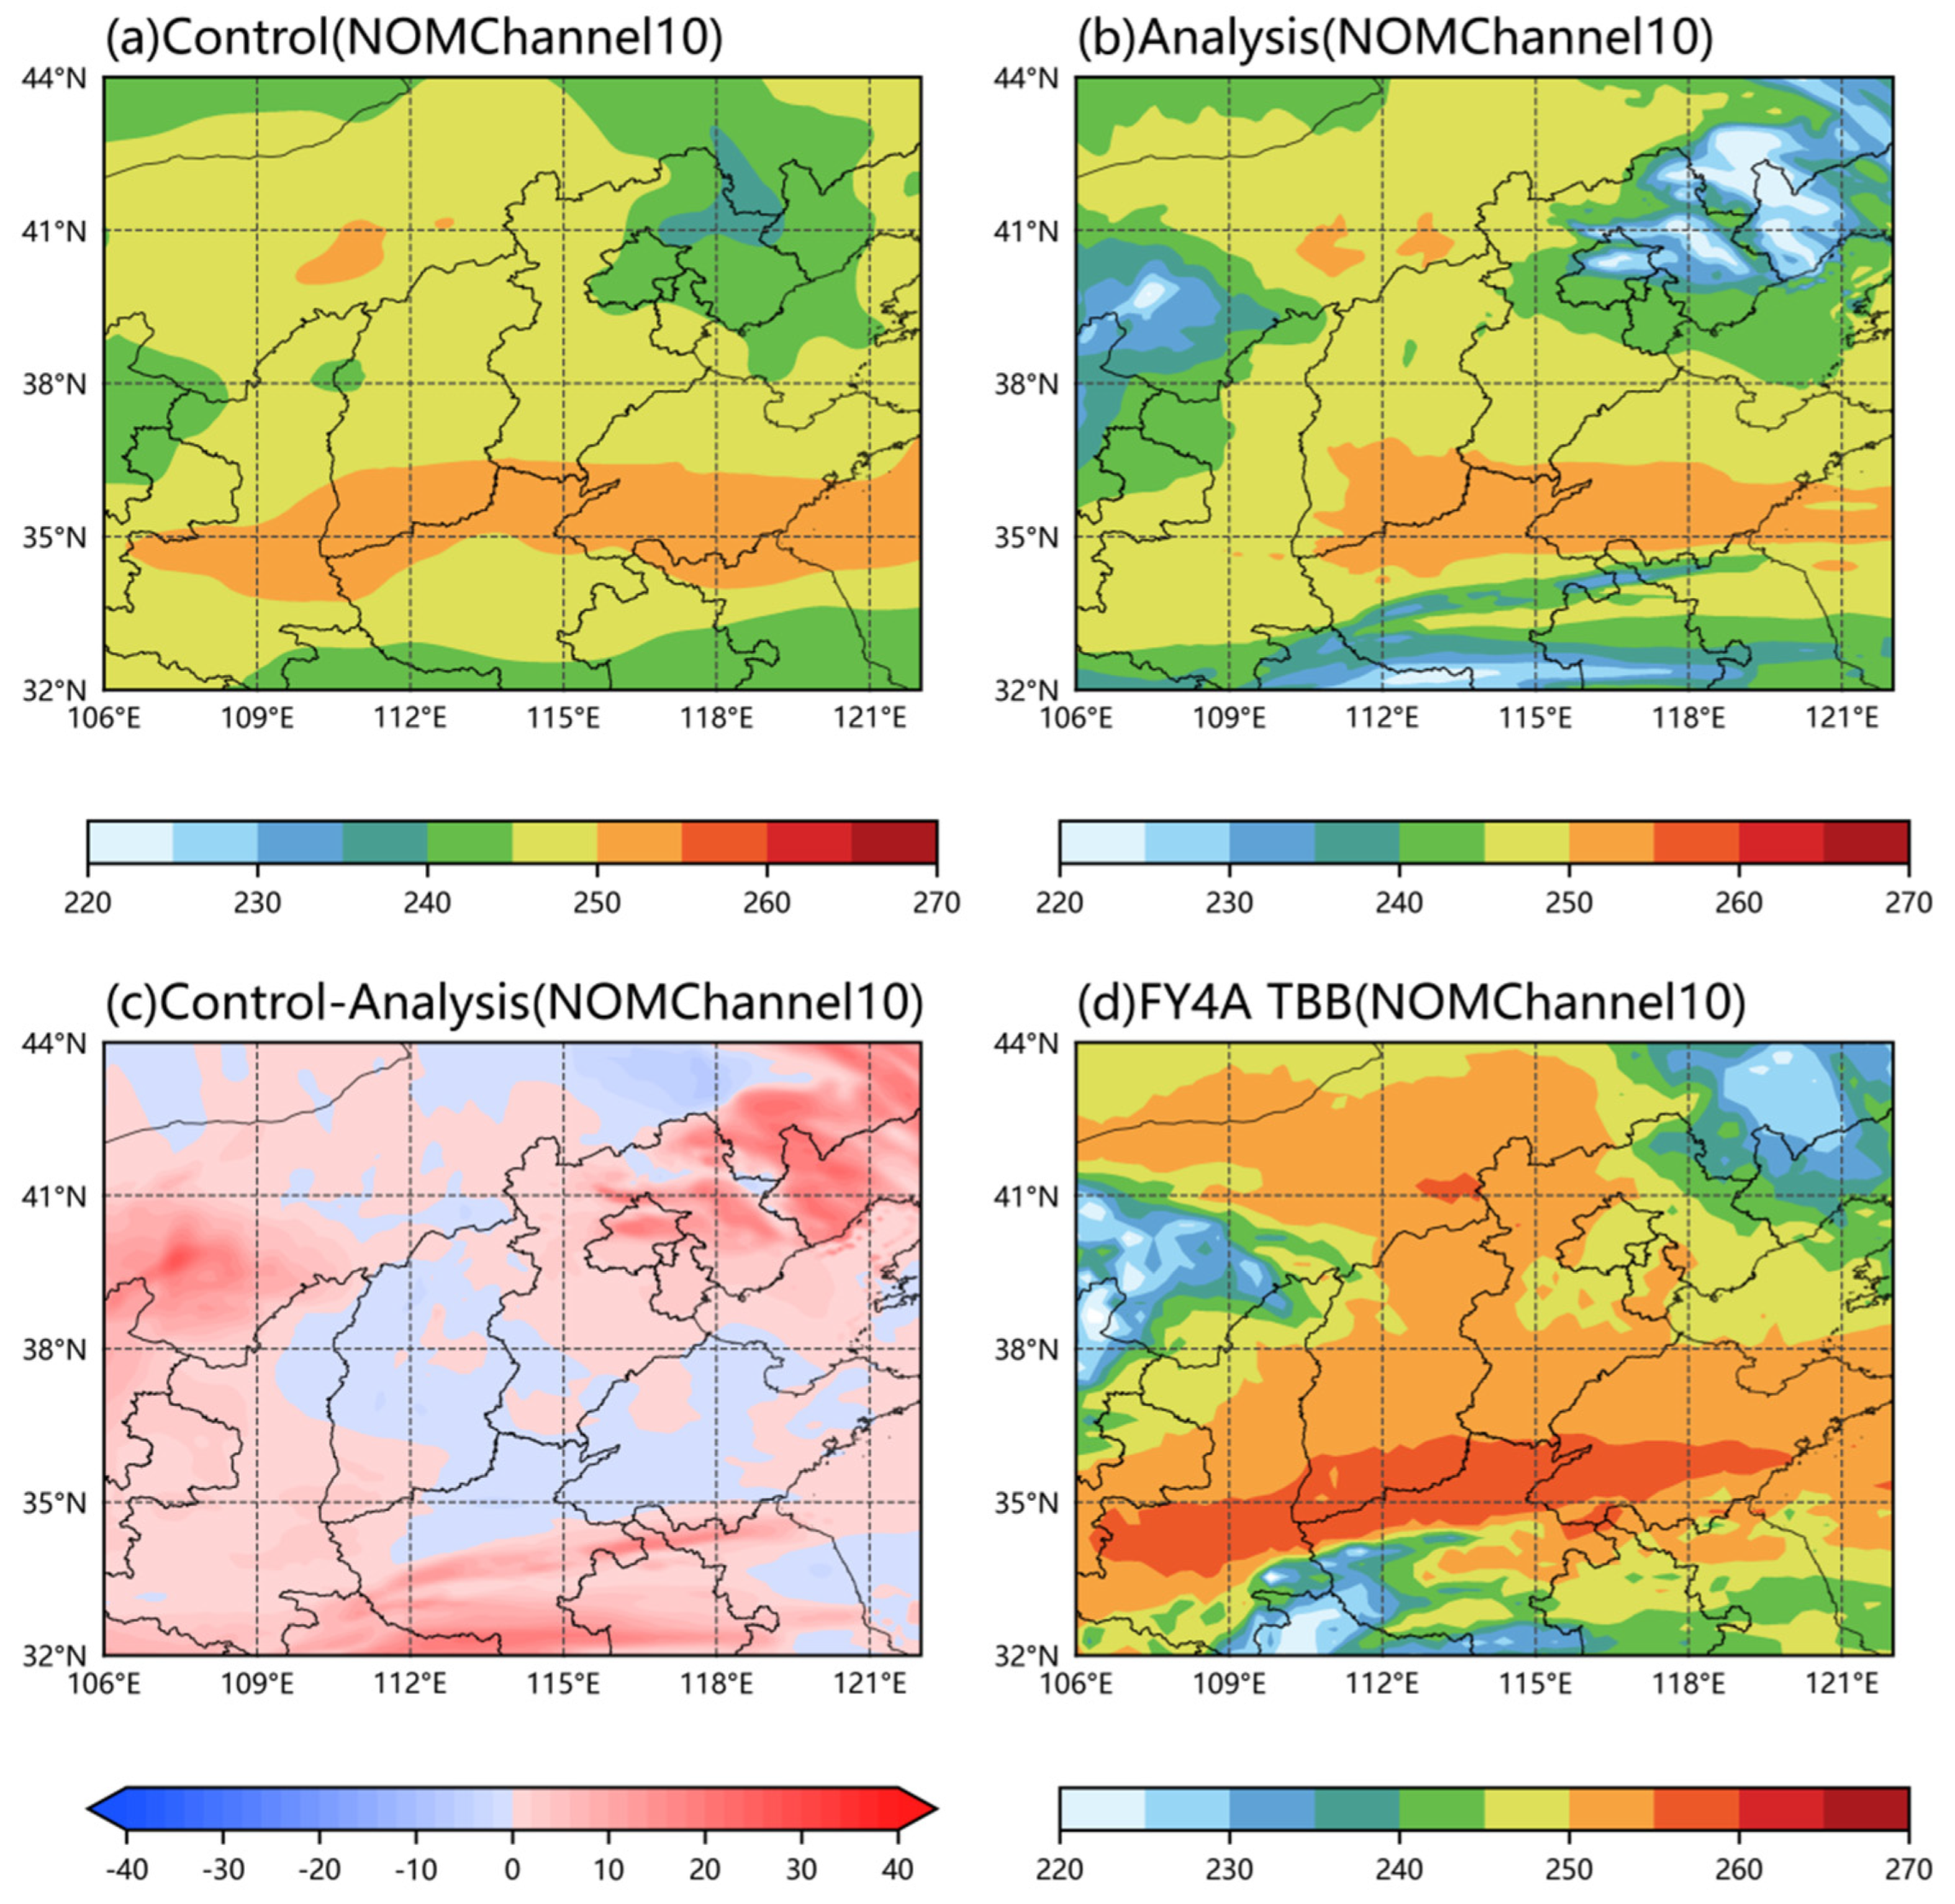
Figure 12.
Scatter plots of simulated versus observed brightness temperatures (Channel 10) at 00:00 UTC 21 March for control (red) and assimilation (blue) experiments.
Figure 12.
Scatter plots of simulated versus observed brightness temperatures (Channel 10) at 00:00 UTC 21 March for control (red) and assimilation (blue) experiments.
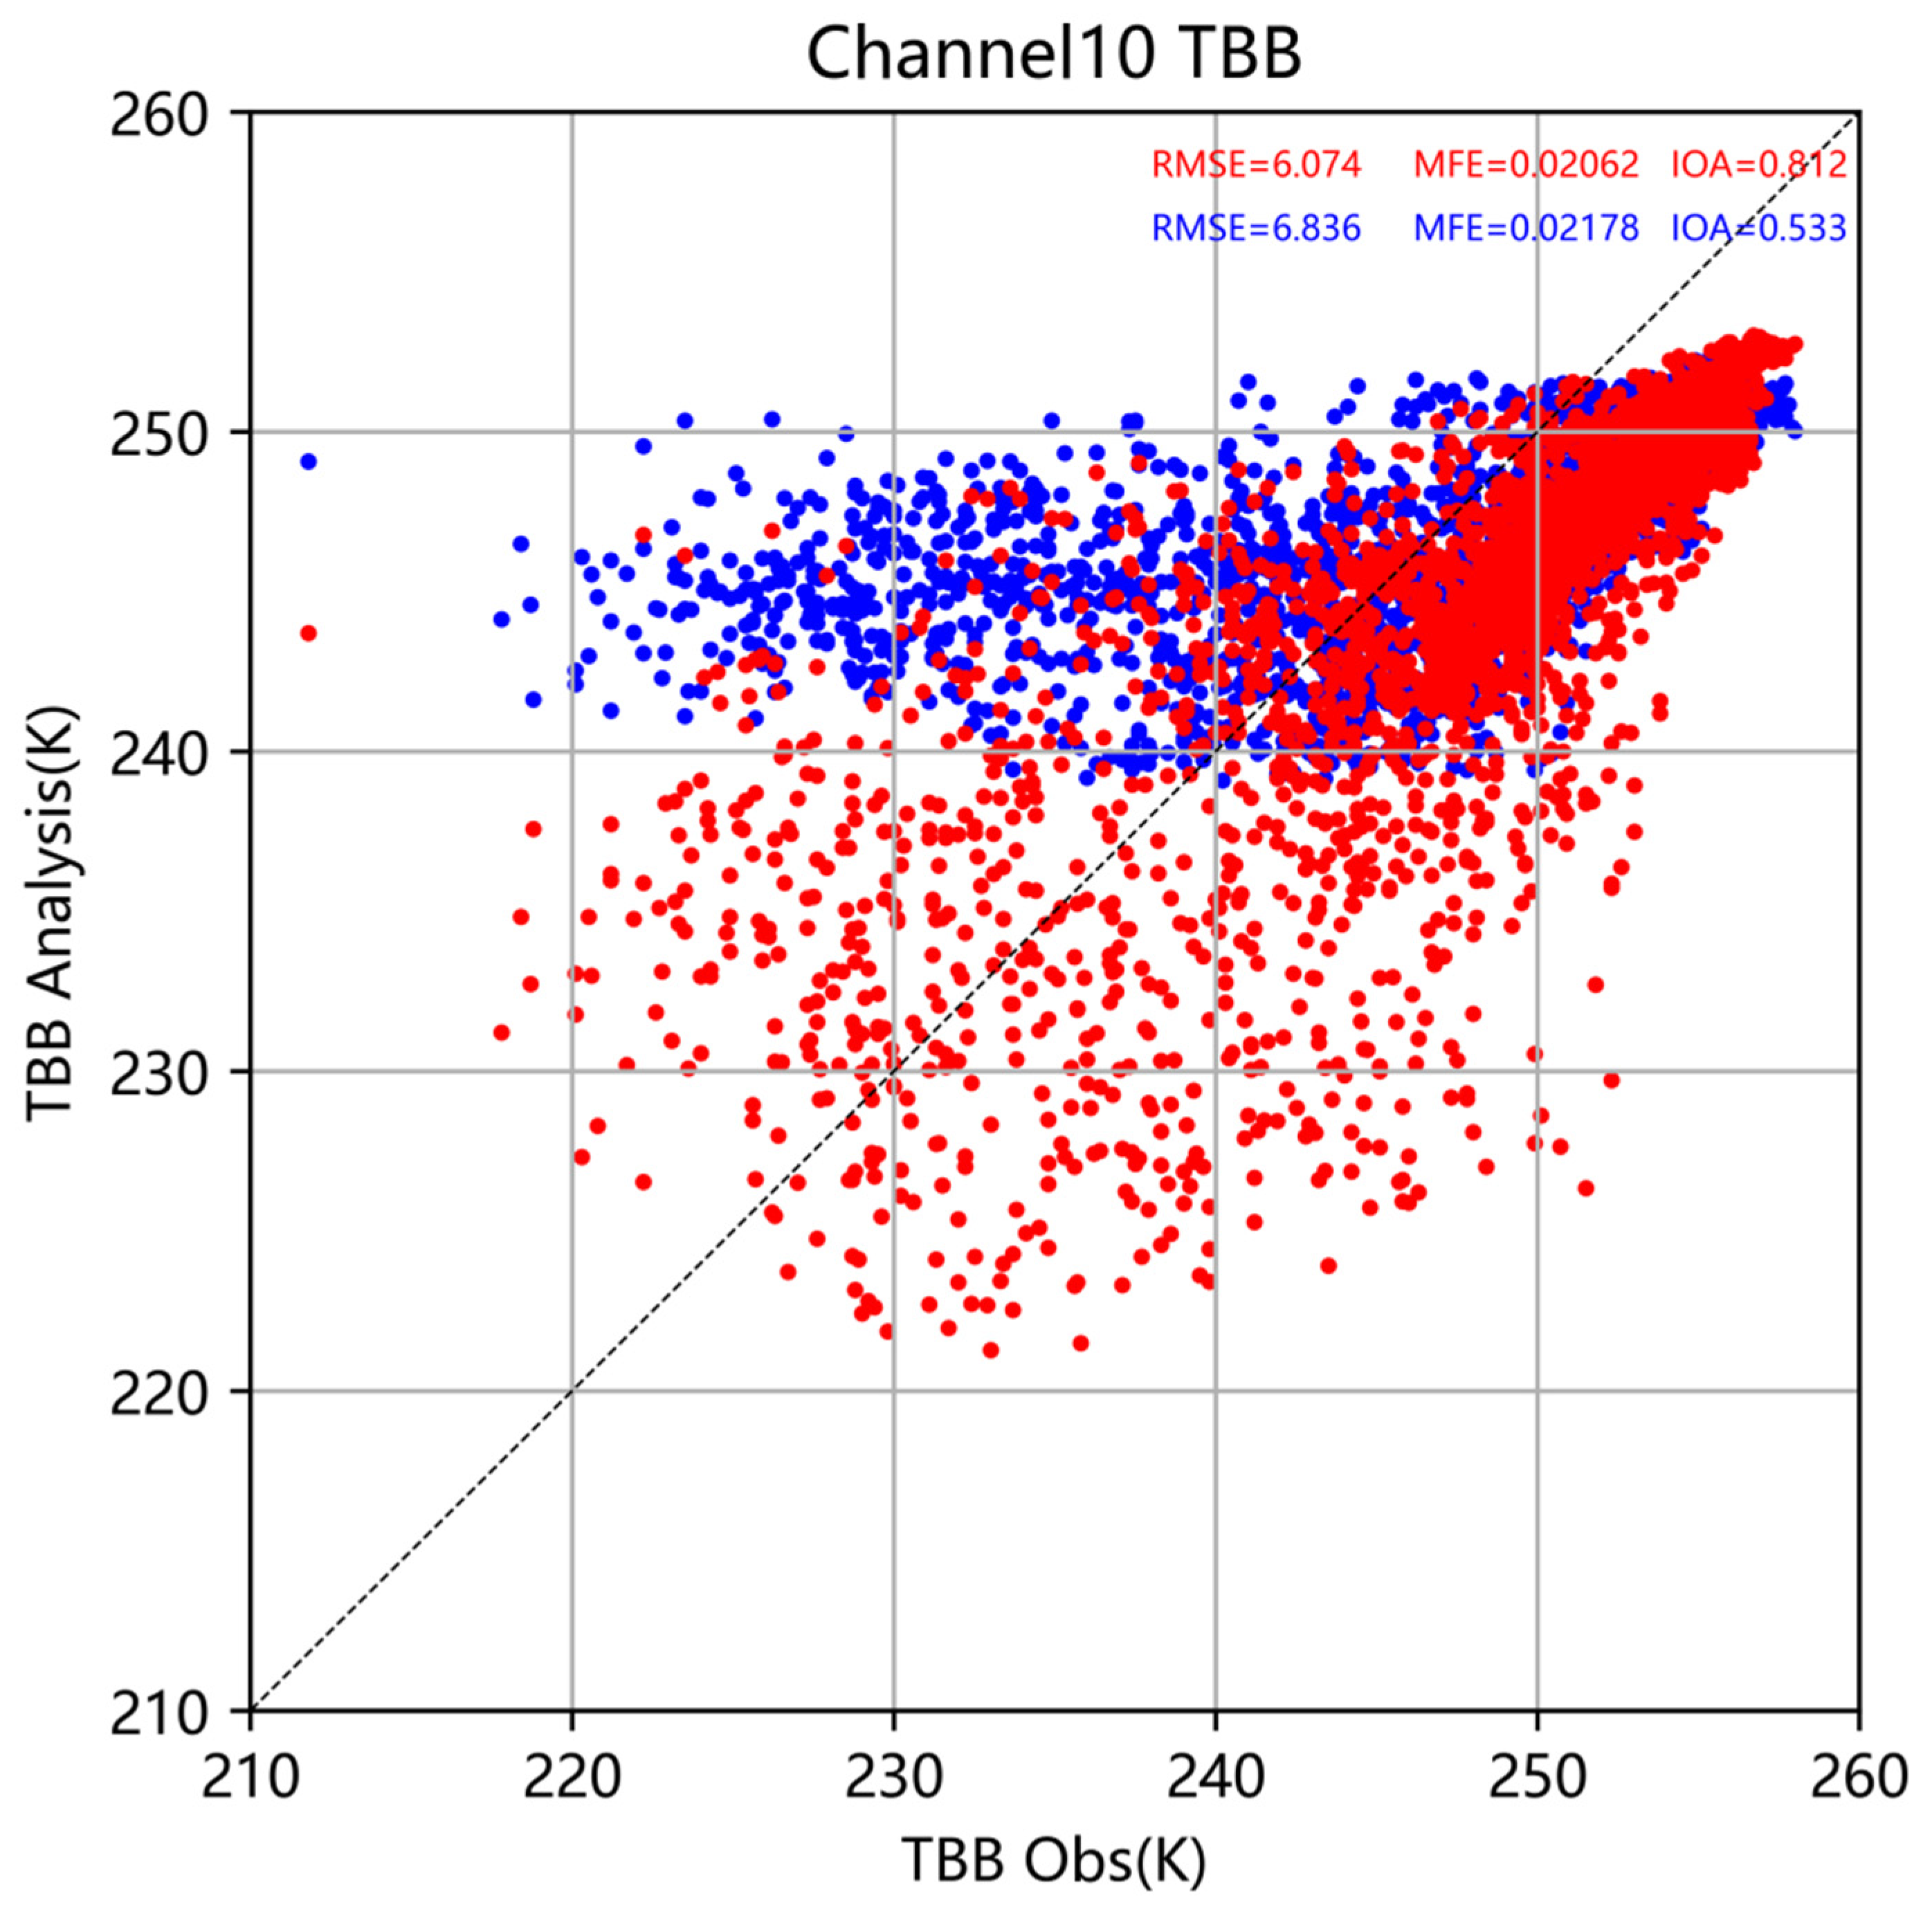
Figure 13.
Temporal evolution of brightness temperature statistics during the 48-hour forecast initialized at 00:00 UTC 21 March 2023: assimilation experiment (blue) versus control experiment (red).
Figure 13.
Temporal evolution of brightness temperature statistics during the 48-hour forecast initialized at 00:00 UTC 21 March 2023: assimilation experiment (blue) versus control experiment (red).
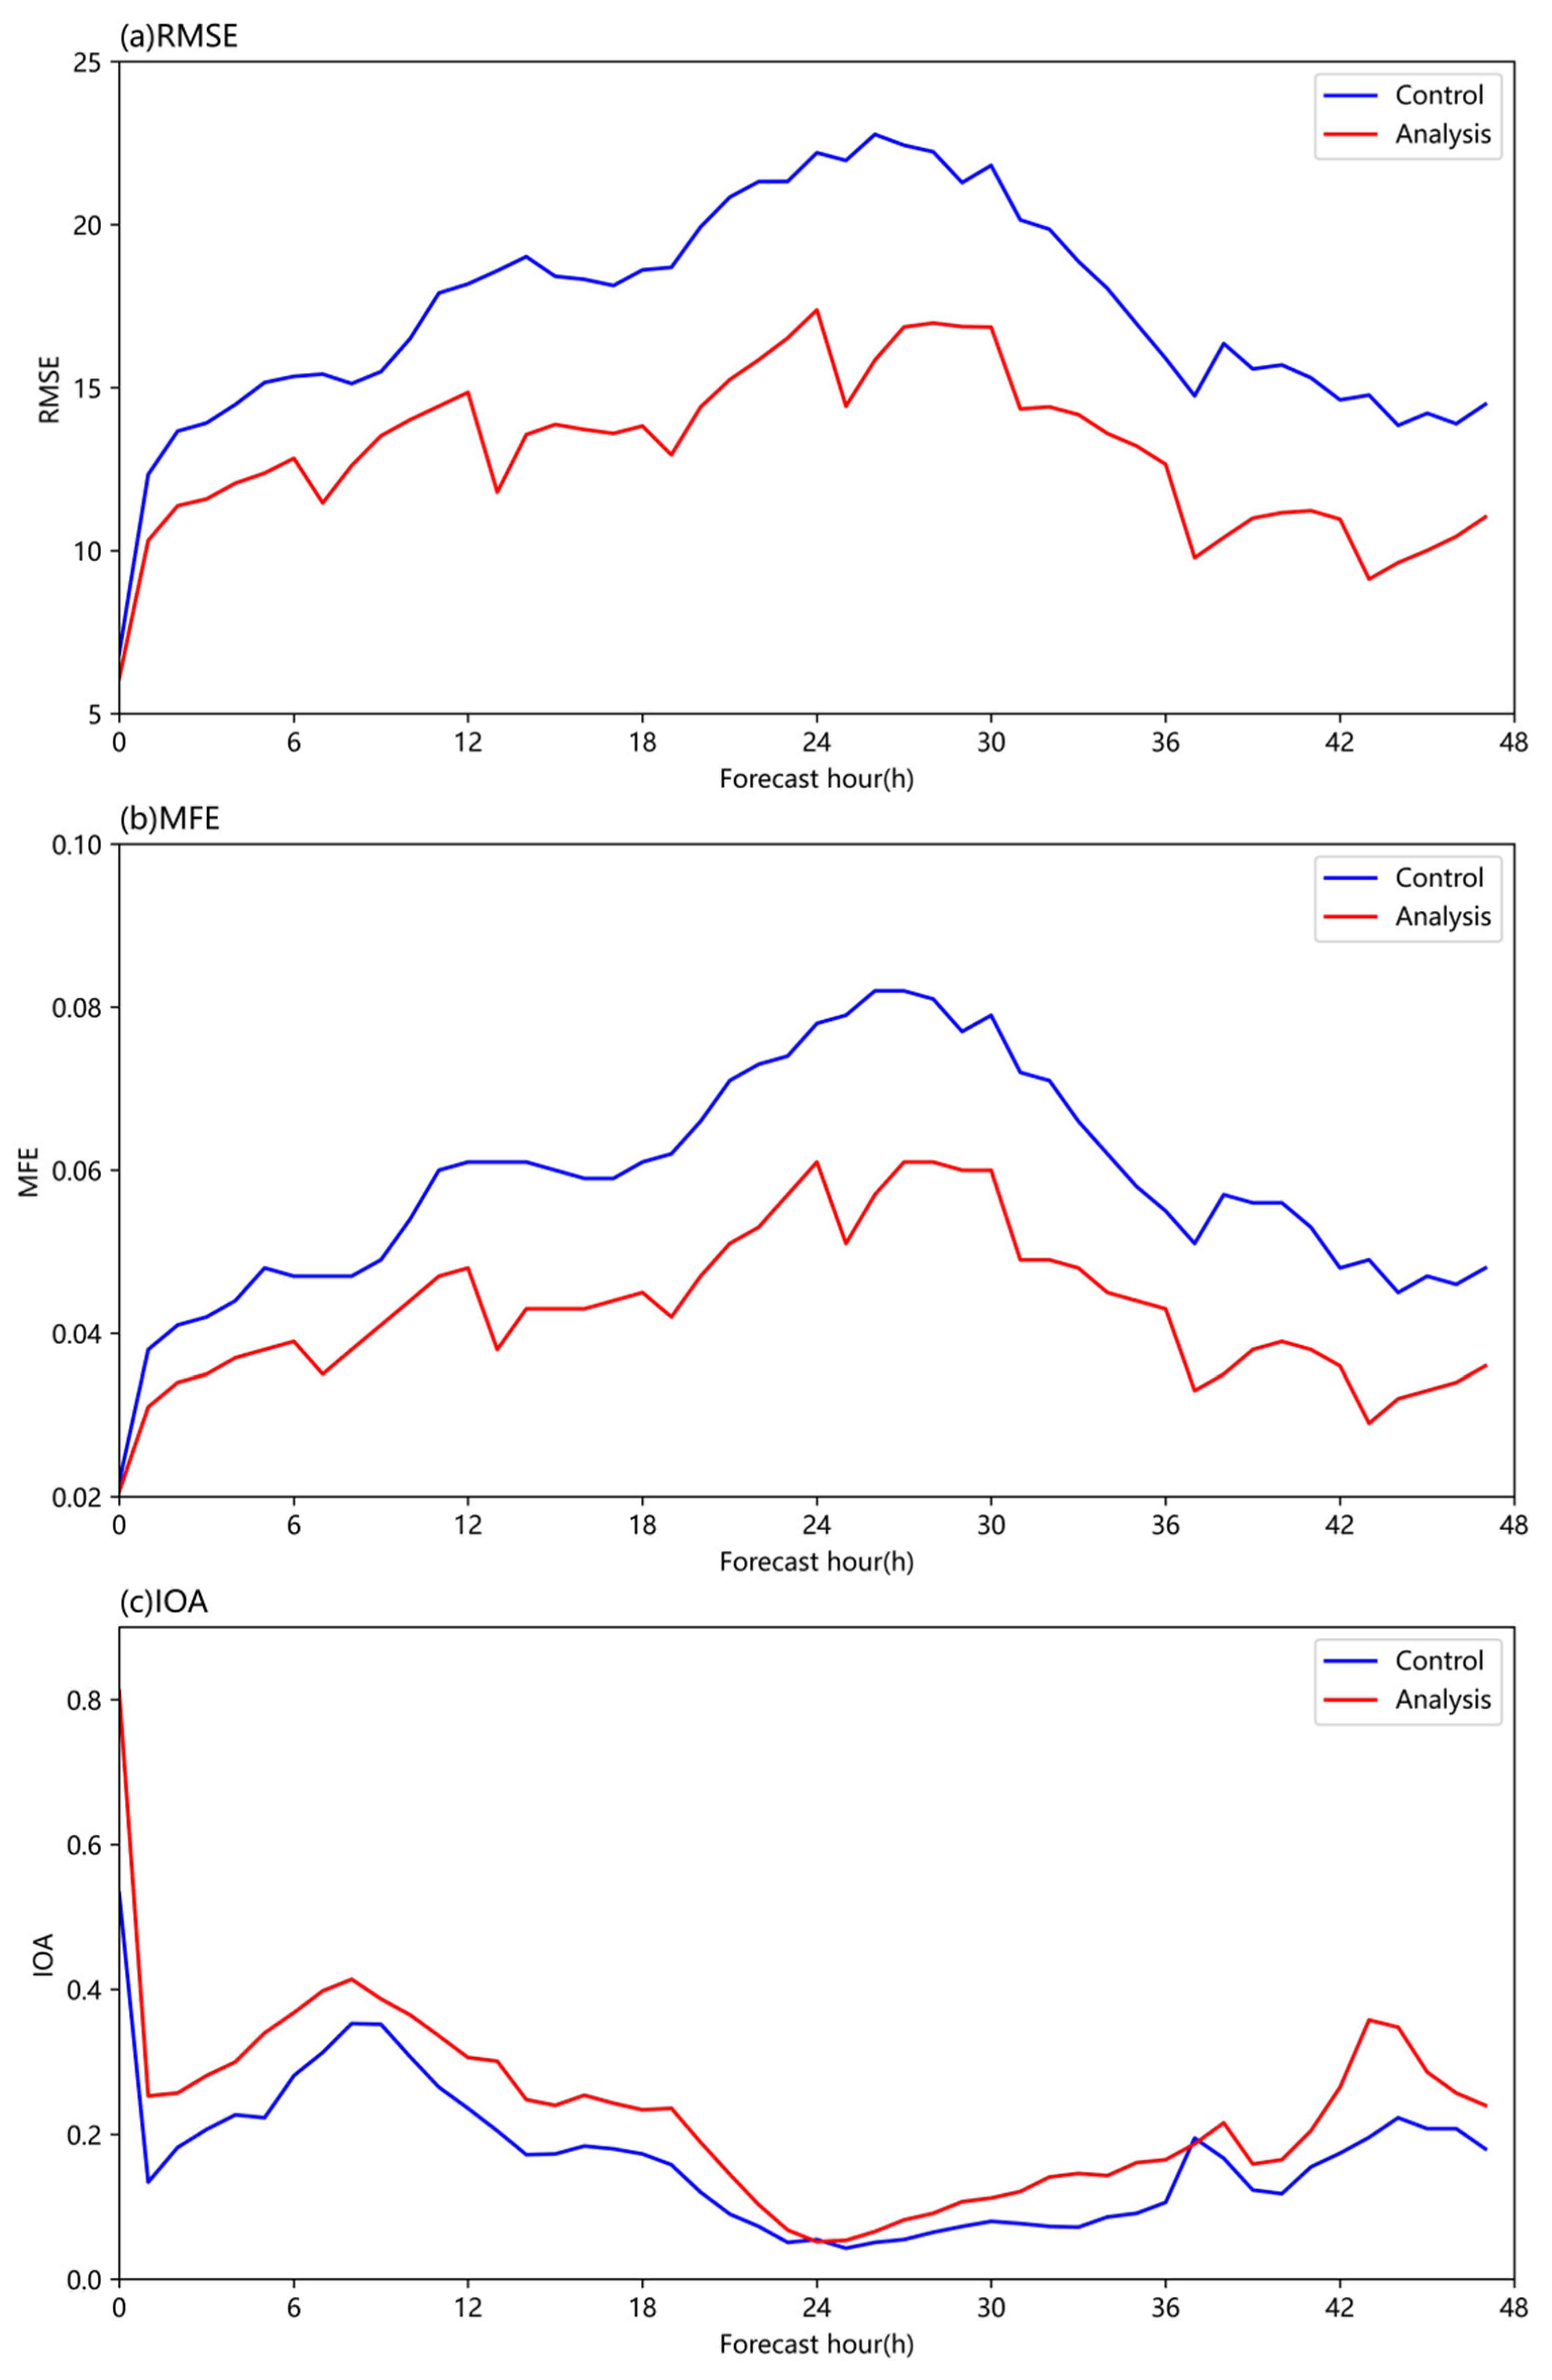

Table 1.
Physical and chemical parameterization schemes implemented in WRF-Chem.
| Physical or chemical parameterization scheme | Option |
| Cloud Microphysics | WSM 5-class scheme [35] |
| Longwave Radiation | RRTMG [36] |
| Shortwave Radiation | RRTMG [36] |
| Cumulus Convection | Grell-3 [37] |
| Land Surface Model | Noah [38] |
| Planetary Boundary | YSU [39] |
| Chemical Mechanism | CBMZ [40] |
| Aerosol | MOSAIC_4bin [41] |
| Photolysis Calculation | Fast-J [42] |
| Dust scheme | Shao (2011) [43] |
Table 2.
Numerical experiment design.
| Experiment Name | Assimilation Domain | Assimilated Data | Forecast Time | Forecast Hour |
|---|---|---|---|---|
| Control | No assimilation | No assimilation | 2023-03-21T00:00Z To 2023-03-23T06:00Z |
54h |
| Analysis | D01/D02 | 1. FY-4B AOD data2. PM2.5 and PM10 data(Data assimilated every 6 hours) | 54h |
Disclaimer/Publisher’s Note: The statements, opinions and data contained in all publications are solely those of the individual author(s) and contributor(s) and not of MDPI and/or the editor(s). MDPI and/or the editor(s) disclaim responsibility for any injury to people or property resulting from any ideas, methods, instructions or products referred to in the content. |
© 2025 by the authors. Licensee MDPI, Basel, Switzerland. This article is an open access article distributed under the terms and conditions of the Creative Commons Attribution (CC BY) license (http://creativecommons.org/licenses/by/4.0/).
Copyright: This open access article is published under a Creative Commons CC BY 4.0 license, which permit the free download, distribution, and reuse, provided that the author and preprint are cited in any reuse.


