
Submitted:
09 May 2025
Posted:
12 May 2025
You are already at the latest version
Abstract
The rapid development of urban subway network puts forward higher requirements for daylighting in subway stations. The skylight daylighting space of shallow buried subway stations not only improves the quality of light environment, but also brings challenges for the optimization of light and thermal performance especially in areas with hot summer and cold winter. In this paper, key parameters such as illumination, air temperature and black sphere temperature of skylight and artificial lighting areas at stations A and B in Shanghai were tested with a field test system. The results show that the light environment in the skylight areas was significantly improved, but the need for the regulation and control of thermal environment was increased. Combined with response surface analysis, 10 sample models for two types of daylighting space (partitioned and through-atrium types) were studied and constructed, including 254 simulated working conditions. The results reveal that design parameters such as the number, aspect ratio, and depth of light openings, and skylight angle have significant effects on combined energy consumption. The decentralized double slope roof daylighting space has the best performance in the partitioned and through-atrium public areas, and combined energy consumption can be reduced to 385.14 kWh/㎡. The optimization strategies proposed in this study can provide a quantitative basis for the skylight design of shallow buried subway stations and an important reference for the design of low-carbon and energy-saving underground space.
Keywords:
Shallow buried subway stations
; Skylights
; Light and thermal performance
; Response
; surface analysis
1. Introduction
Urban subway network is becoming increasingly denser to relieve the pressure of surface traffic and increase people’s stay in subway stations, so that the demand for light and thermal environments in subway stations is more and more prominent especially in areas with hot summer and cold winter [1]. Shallow buried subway stations are faced with unique challenges in space design due to their small buried depth (the thickness of covered soil is only 3-8 m). They have complex internal structure and dense passengers, and the demand for illumination and thermal comfort has significantly increased. In areas with hot summer and cold winter, external solar radiation enters the stations through skylights, which can not only improve natural daylighting, but also introduce additional heat, thereby leading to a significant increase in cooling load [2,3]. In view of this contradiction of light and heat, optimizing the daylighting design of skylights becomes the key to ensure energy conservation and passengers’ comfort in subway stations.
At present, subway stations are mostly lit by artificial light sources, resulting in large power consumption. In order to reduce energy consumption, some subway stations introduce natural light through skylights [4]. Although natural daylighting improves illumination and reduces energy consumption, it also introduces solar radiation into the interior, affecting the indoor thermal environment of subway stations. Research on skylight daylighting mainly focuses on the influence of building atrium on space. For instance, Dussault et al. [5] tested the impact of the window-to-wall ratio of skylights on building energy consumption, and found that an appropriate window-to-wall ratio could reduce building energy consumption. Tsikaloudaki et al. [6] and Kim et al. [7] used EnergyPlus software to simulate the solar heat gain coefficient of skylights, and revealed its impact on building energy consumption. It is verified that the visible light transmittance of skylights had a significant impact, and it is proposed that building energy consumption can be reduced by adjusting the transmittance [8,9]. In recent years, studies on skylights of subway stations have shown that skylights can effectively improve the utilization efficiency of natural light [10], but it is easy to cause problems of over brightness and a decrease in thermal comfort in summer [11]. From a field test and multi-objective optimization [12], it is found that adjusting design parameters such as skylight ratio, light transmittance and U value can not only reduce the annual energy consumption of air conditioning (by 28.1%), but also significantly improve light performance (by 31.5%) and thermal comfort (by 43.8%). This study provides a concrete quantitative method and theoretical support for the design optimization of skylights of shallow buried subway stations. Nevertheless, research on the form, distribution and dynamic control strategy of skylights is still insufficient especially in the practical application of shallow buried subway stations with high-density passenger flow.
Research on the thermal environment of subway stations mainly focuses on thermal comfort and temperature control optimization. For example, Wang et al. [13] studied the thermal comfort of passengers in subway stations of Changchun in a cold area, and the results provide references for the thermal environment design of underground stations. Katavoutas et al. [14] conducted a field test on the internal thermal environment of a subway station in Athens, and found that the thermal comfort of passengers was related to platform design. Pan et al. [15] studied two underground stations in Beijing, and pointed out that the thermal sensation of passengers in the subway stations alternated between cold and hot during the waiting process. Passi et al. [16] investigated the thermal environment on the platforms and in the carriages of Jinnai subway station in India, and the results show that passengers’ dissatisfaction on the platforms was significantly higher than that in the carriages. Li et al. [17] conducted a field test on the platform thermal environment of metro line 1 in Beijing, and found that passengers’ dissatisfaction on the platforms was significantly higher than that in the carriages. Through a field test and questionnaire survey on thermal comfort, the thermal environment of different underground buildings was evaluated, and it is found that passengers’ thermal comfort was significantly different from the theoretical calculated value of PMV. In addition, Zhao et al. [18] tested the microclimate of a sunken square in Shenzhen, and revealed its impact on the environment inside a subway station. Liu et al. [5] analyzed the operating temperature of air conditioning in a subway station of Tianjin and its variation trend with outdoor temperature, and studied the changes of passengers’ thermal comfort (represented by RWI value) during the process of entering and leaving the station. Besides, some scholars have studied the thermal comfort of subway stations in different seasons, control units and time periods, and put forward some control strategies.
At present, there have been some studies on the light and thermal environment of subway stations, but there are still some shortcomings. Specifically, most studies focus on the evaluation of a single performance (such as daylighting or shading), and fail to comprehensively evaluate light and thermal performance. Moreover, there are relatively few studies on the light and thermal environment of shallow buried subway stations with high personnel density and compact spatial layout. There is no effective regulation and control scheme for skylights according to light and thermal characteristics in different seasons and time periods.
In this paper, the daylighting spatial form and its proportional relationship in public areas of shallow buried subway stations were systematically investigated and tested, and the key form elements affecting the light and thermal environment were extracted. This study focuses on subway stations in Shanghai in an area with hot summer and cold winter. Based on test data in summer and winter, the light environment quality and thermal comfort conditions were analyzed. The daylighting spatial models of two typical public areas (partitioned and through-atrium type) were established based on response surface analysis, covering 254 working conditions. The relationship between skylight daylighting form and energy consumption was quantitatively analyzed by using DesignBuilder software through numerical simulation, and the range of design parameters was optimized based on multiple regression models. This study can provide systematic theoretical support and practical guidance for optimizing the light and thermal performance of skylights in shallow buried subway stations.
2. Methodology
2.1. Field Investigation
2.1.1. Investigation of Spatial Features and Form Parameterization
To clarify the form elements of daylighting space in public areas of subway stations, typical shallow buried subway stations were investigated. The detailed content of the investigation are shown in Appendix I. The statistical analysis of spatial form and daylighting space was conducted from the aspect ratio of light openings [19,20], window-to-floor ratio [21], depth of light openings [22], number of atriums [23,24], number of light openings [25], and type of daylighting skylights [26]. Based on the interface form, as well as the number of light openings, they can be partitioned into centralized and decentralized types, and their roofs can be divided into flat, double slope and arched roofs according to skylight angle. In order to comprehensively study the influence of daylighting spatial form of skylights on the light and thermal performance of public areas, 10 sample models of common skylight daylighting space in public areas in subway stations were identified based on basic models of partitioned and through-atrium public areas (Table 1).
2.1.2. Site for Field Measurement
Shanghai is located in an area with hot summer and cold winter, and has typical characteristics of light and thermal environment in summer and winter. In this study, a field test on the light and thermal environment of public spaces in subway stations A and B of Shanghai were conducted. Their geographical locations are shown in Figure 1. The two subway stations, which are shallow buried standard island subway stations, are adjacent on the same subway line, and have a uniform outdoor climate environment. Station A is an underground standard station with a two-floor island platform, and has a partitioned public area. The skylight of the station hall is a rectangle 28 m long and 5.2 m wide, and the public area is located in the middle of the subway station. Station B is also an underground standard station with a two-floor island platform, and has a through-atrium public area. The skylight of the station hall is a rectangle 82 m long and 10 m wide, and the public area is situated in the middle of the subway station. In the center of the public area, there are four atriums (18 m×10 m). The two stations have different types of space and skylights, and it is easy to compare and analyze the influence on their light and thermal environment. Therefore, the light and thermal environment in the areas under the skylights of stations A and B were tested.
2.1.3. Time and Content of the Field Test
The field test was conducted from July 25 to 29 in 2023 (summer) and from January 7 to 9 in 2024 (winter). During a day, the test time was 07:00-18:00, once every hour on the hour. The test lasted for 1-2 d at each station. The skylights were closed during the test. The illumination, air temperature, black sphere temperature, ground temperature, surface temperature under the skylights of the subway stations, and outdoor solar radiation were tested. In addition, the intensity of outdoor solar radiation was recorded to provide outdoor data for the change of light and thermal environment in the public areas of the subway stations.
2.1.4. Test Instruments and Position of Test Points
Test instruments and position of test points can be seen in Figure 2. Test instruments include handheld illumination meter, handheld WBGT tester, infrared thermometer, and total solar radiation sensor. The basic information of each instrument is shown in Table 2. The setting of test points and selection of instruments for light environment are based on the Method of Daylighting Measurements (GB/T 5699-2017) and Measurement Methods for Lighting (GB/T 5700-2008). The test of light environment follows the Standard for Daylighting Design of Buildings (GB 50033-2013) and Standard for Lighting Design of Buildings (GB 50034-2013). The test of thermal environment is based on the Design Standard for Energy Efficiency of Public Buildings (GB 50189-2015). As shown in Figure 1-b, the test points of station A are arranged in a 32 m×8 m rectangular space in the station hall. The area was partitioned into natural and artificial lighting areas. Points 1-20 belong to the natural daylighting area, and one test point was set every 2 m. The outer area, which is an artificially lighting area, was marked with test point a-l, and the distance between the test points is 6-8 m. Seen from Figure 1-c, the test points of station B are arranged in a 20 m×16 m rectangular space in the station hall. The test was carried out on the first and second underground floor. The first underground floor has natural daylighting and artificial lighting areas. Test points 7-9 and 16-18 belong to the natural daylighting area, and points 1-6 and 10-15 are distributed in the artificial daylighting area. The second underground floor is the natural daylighting area, containing test points a-k. The distance between the test points is 4 m. The datum plane of the daylighting standard value of public transport buildings should be located on the ground or 0.15 m away from the ground, so the test points are about 0.15 m away from the ground in this study.
2.2. Simulation of Light and Thermal Environment
The analysis of light and thermal environment in the public areas of the subway stations should be combined with annual meteorological conditions and indoor parameters, but it is difficult to carry out anannual test due to the limitations of field conditions. Hence, it is necessary to simulate the light and thermal environment of the underground bus hub and then conduct response surface analysis, thereby determining the optimal parameters of skylights in the public areas of the subway stations.
2.2.1. Simulation of Light Environment
Based on DesignBuilder platform, the influence of skylights of two shallow buried subway stations (stations A and B in Shanghai) on the light and thermal environment of the underground public spaces was simulated. The basic model information and software modeling of stations A and B are shown in Figure 3.
Meteorological parameters of Shanghai City were derived from meteorological data of representative years and obtained in CSWD format from the official website of EnergyPlus. The meteorological dataset was jointly developed by the China Meteorological Administration and Tsinghua University based on five decades of real-time monitoring data from 194 meteorological stations in China. It covers summer and winter design days and annual hourly meteorological parameters, including temperature, humidity, solar radiation, wind speed, sunshine duration and atmospheric pressure. The setting of the building envelope according to the actual field investigation is listed in Table 3. In addition, the Perez sky model was used to simulate the dynamic natural daylighting effect throughout the year [27]. This threshold was determined as 300 lx according to the Standard for Daylighting Design of Buildings (GB 50033-2013). UDI is the percentage of time between 200 lx and 2000 lx of daylight received by the analysis point during the actual use of a building.
2.2.2. Simulation of Energy Consumption and Thermal Environment
The energy consumption of stations A and B in Shanghai was simulated based on DesignBuilder platform. Heat transfer is the basis of energy consumption calculation. The heat transfer of the wall was calculated based on conduction transfer function (CTF) [28]. The heat transferred through the inner and outer surfaces of the wall at the jth time step is as follows:
where Xj is the CTF coefficient for the outside surface of the wall, j=0,1,…,n; Yj is the CTF coefficient for the intermediate layer of the wall, j=0,1,…,n; Zj is the CTF coefficient for the inner surface of the wall, j=0,1,…,n; Φj is the heat flow CTF coefficient, j=0,1,…,n; Ti is the inner surface temperature; To is the outside surface temperature; qko is the outside surface heat transfer; and qki is the inner surface heat transfer.
The control equation of heat transfer in double glazing glass is as follows:
where Eₒ and Eᵢ are the intensity of longwave radiation on the outside and inner surfaces of the glass, respectively; k₁ and k₂ are heat transfer coefficients for layers 1 and 2, respectively; hₒ and hᵢ are the convective heat transfer coefficients of the outside and inside surfaces, respectively; Sᵢ is the intensity of shortwave radiation absorbed by surface i and longwave radiation from indoor heat sources; θi and θo are the indoor and outdoor temperatures, respectively; εi is the longwave emissivity of surface i; hj is the heat transfer coefficient of the gas between the glass layers; σ is the Stefan-Boltzmann constant.
The heat balance model equation of heat gain in the air conditioning area is as follows:
where is the total convective heat transfer from the internal heat source; is the convective heat transfer from the surface of the zone; is the heat transfer from the outdoor infiltration air; is the mixed heat transfer from the air in the inner zone; is the output energy of the air-conditioning system; is the energy stored in the air.
The parameters required for the calculation of energy consumption were set based on the field test data. The heat transfer coefficient of the skylights was 3.0 W/(m²·K), and the heat transfer coefficient of the roofs was 0.38 W/(m²·K). In addition, according to the operation time of the underground public transportation hubs, the operation time of station A in Shanghai was from 5:30 to 22:30, and the presence rate of passengers was determined based on the passenger flow observed in the field test. According to the HVAC design parameters of station A in Shanghai, the primary return air conditioning system was adopted. Interior design temperature is 26 ℃, and humidity is 65%. Passenger flow density is 1 person/m2. Equipment power density is 4.5 W/m2, and lighting power density is 12 W/m2. Fresh air volume is 20 m3/(person·h). Mechanical ventilation was used in other seasons.
2.3. Response Surface Methodology
Response surface methodology (RSM), which is an experimental design and optimization method based on statistics and regression analysis, is mainly used to determine the functional relationship between multiple input variables (factors) and output variables (responses) to optimize system performance [29,30]. RSM can be used to analyze the influence of form parameters of skylights on the light and thermal environmental performance in the public areas of the subway stations to seek the optimal skylight design scheme and then balance the light and thermal environmental performance. Central composite design (CCD) was adopted, and key form parameters of skylights (such as aspect ratio, window-to-floor ratio, and angle, etc.) were selected as input variables, while light and thermal performance indicators (such as illumination uniformity and thermal gain, etc.) were as response variables. The quadratic polynomial regression model was used to establish the model relationship between the input variables and response variables. The model equation is as follows:
where represents the input variable or factor of the system. In the response surface analysis of light and thermal environment, the input variable can be the key form parameter of a skylight. represents the baseline response value of the system, and when input variable is zero, the response variable of the system is equal to , which is the intercept of the regression model. is the linear regression coefficient of input variable , and is the degree of linear influence of input variable on response variable . is the quadratic regression coefficient of the input variable, and represents the quadratic nonlinear influence of input variable on response variable . This term can reflect the degree of curvature of response surface in the parameter space. is the interaction regression coefficient between input variables and , and means the impact of the interaction of two input variables on response variable . ϵ is random error term.
2.4. Comparison Between Simulated and Field Test Data
In order to verify the accuracy of the simulation, the data of illumination at the test points under the skylight of station A in summer were compared with the simulated data. As shown in Figure 4, the simulated data are consistent with the test data, but there are also errors. The main reason is that the simulation environment is relatively ideal, and the changes of the actual meteorological environment are transient and non-characteristic, resulting in large fluctuations of the data at some test points. In addition, there are no buildings or obstacles directly blocking the light in the actual test environment, but there are surrounding objects such as the ground and reflective surfaces in the actual test scene, which will increase the test illumination in the model. During the simulation, the surrounding environment was not set, so that the simulated illumination is lower than the test value.
3. Results and Discussion
3.1. Field Test Results
Some indicators were tested in the skylight and artificial lighting areas at stations A and B in Shanghai in summer and winter, including illumination , air temperature, black sphere temperature, ground temperature, surface temperature under skylights, and outdoor solar radiation intensity. The specific analysis results are as follows.
3.1.1. Summer Experimental Results
1. Analysis of illumination
As shown in Figure 5a, the average illumination of the skylight areas showed an obvious changing trend during a day, and peaked at 13:00 at stations A and B, up to 3672 lx and 7214 lx, respectively. The illumination in the artificial lighting areas was relatively stable, with a range of 2,601-8,501 lx, and there was little fluctuation throughout the day. At station B, the illumination of the skylight area on the first underground floor (d1) was 33.23% higher than that of the second underground floor (d2), indicating that the design of the skylight contributed significantly to improving the quality of light environment. According to the Standard for Daylighting Design of Buildings (GB 50033-2013) and Standard for Lighting Design of Buildings (GB 50034-2013), the illumination of the skylight areas can meet the natural daylighting standard (≥300 lx) from 08:00 to 17:00. In the artificial lighting areas, illumination was insufficient in the morning and evening hours, so additional light sources were needed to ensure the visual needs of passengers.
2. Analysis of air temperature
The daily variation of air temperature can be seen in Figure 5b. The temperature in the skylight areas was higher than that in the artificial lighting areas in most of the time, with an increase of 0.3 ℃ on average. The temperature difference in the skylight areas was 2.7 ℃, significantly higher than 2.4 ℃ in the artificial lighting areas, reflecting the direct influence of solar radiation on the temperature fluctuation in the skylight areas. The daily variation range of air temperature on the first underground floor was larger than that on the second underground floor, 1.1 ℃ higher on average. Although the air conditioning system effectively regulated the temperature, the design of the skylights still had a direct effect on the thermal environment.
3. Analysis of surface and air temperature
Seen from Figure 5c, the surface temperature under the skylights was most significantly affected by solar radiation, with an average temperature of 33.6 ℃ and a fluctuation range of 10.6 ℃. The ground temperature was the second, with an average temperature of 29.7 ℃ and a fluctuation range of 2.3 ℃. Air temperature was the smallest, with an average temperature of 28.6 ℃ and a fluctuation range of 2.7 ℃. The data show that the heat load of the skylights was significant, but the air conditioning system effectively controlled the temperature of passengers’ activity areas, keeping it within the comfortable range.
4. Relation between outdoor solar radiation and indoor illumination
Figure 5d shows that the variation of outdoor solar radiation intensity was highly positively correlated with the illumination of the skylight areas. At station A, the illumination of the skylight area reached a peak of 3672 lx at 13:00, and the average of the whole day was 1534 lx, which was 4.43 times that of the artificial lighting areas. At station B, the average illumination of the skylight area on the first and second underground floors was 6855 lx and 5220 lx, respectively, indicating that natural light could meet indoor lighting needs in most times.
5. Relationship between outdoor solar radiation and indoor air temperature
As shown in Figure 5e, the variation trend of air temperature in the skylight and artificial lighting areas was highly correlated with outdoor solar radiation intensity. The average temperature of the whole day in the skylight areas was 28.6 ℃, 0.3 ℃ higher than that of the artificial lighting areas (28.3 ℃). The difference was small, but it further validates the impact of skylight design on thermal environment. The air conditioning system effectively reduced the additional heat load introduced by the skylights to ensure temperature comfort.
3.1.2. Winter Experimental Results
1. Analysis of indoor illumination
Seen from Figure 6a, the illumination of the skylight areas was significantly affected by weather conditions, and the illumination at noon was higher than that in the morning and evening. At station A, illumination peaked at 13:00, reaching 1465 lx. At station B, the peak was up to 4823 lx on the first underground floor and 3452 lx on the second underground floor. That is, the latter was only 71.6% of the former, reflecting a significant vertical illumination gradient. In contrast, the illumination in the artificial lighting areas was more stable, with a small changing range, and the peak appeared during 12:00-14:00.
2. Analysis of indoor air temperature
As shown in Figure 6b, the air temperature at stations A and B showed a fluctuating upward trend before 14:00, with an average increase of 2-2.6 ℃, and gradually declined with the decrease of outdoor radiation intensity after 14:00. At 18:00 in the evening peak period, the temperature at each test point increased slightly due to the increase of passengers, but the range was limited. The diurnal variation in the natural daylighting areas was consistent with that of solar radiation intensity, which further reveals the internal relationship between light and thermal environment.
3. Analysis of surface and air temperature
Figure 6c shows that the surface temperature under the skylights varied most greatly, and the maximum daily temperature difference at stations A and B was 5.3 ℃ and 4.3 ℃, respectively. Ground temperature difference was 3.6 ℃, and air temperature difference was 2.1 ℃. The surface temperature under the skylights rose slowly in the morning and rapidly at noon because of direct solar radiation, 3-5 ℃ higher than air temperature, and had a significant impact on ground and air temperature. It reveals that the thermal effect of skylights plays an important role in indoor thermal environment.
4. Relation between outdoor solar radiation and indoor illumination
As shown in Figure 6d, the peak of outdoor solar radiation intensity was 638 W/m², which was consistent with the peak trend of illumination in the skylight areas. However, due to the occlusion of the surrounding buildings, the peak of illumination in the skylight areas appeared later than that of outdoor radiation, and its duration was shorter. At station B, the illumination on the first underground floor was higher than that of the second underground floor, and the former was 1.41 times of the latter at 12:00, indicating that the daylighting level of the skylights was significantly affected by outdoor radiation and occlusion.
5. Relationship between outdoor solar radiation and indoor air temperature
Seen Figure 6e, the outdoor solar radiation intensity at station A was above 400 W/m² from 10:00 to 14:00, which was consistent with the changing trend of indoor air temperature, and the peak appeared at 14:00. During the evening peak period (18:00), because of the increase in passengers, air temperature rose slightly. At station B, the fluctuation range of air temperature on the first underground floor was 2.6 ℃, while that of the second underground floor was only 2.0 ℃, indicating that the first underground floor was more sensitive to solar radiation, and the temperature on the second underground floor was more stable. The analysis shows that indoor air temperature was significantly affected by solar radiation, and there was a certain lag effect.
3.1.3. Comparison of Test Results Between the Two Stations
Based on the field test data, the light and thermal environment of the skylight and artificial lighting areas at stations A and B in Shanghai was compared to reveal the significant differences in the lighting and thermal environmental performance of the two stations. The results reveal that the illumination of the skylight areas at station B was significantly higher than that of station A. In summer, the peak of illumination on the first underground floor reached 7214 lx, almost twice that of station A (3672 lx). In winter, the peak of illumination at station B was also significantly higher than that of station A, which is mainly due to the larger daylighting area of station B and more optimized skylight design. However, the illumination gradient of station B (for example, the difference between the first and second underground floor was 33.23%) and the fluctuation amplitude of the skylight surface temperature (up to 10.6 ℃ in summer and 5.3 ℃ in winter) were more significant than those of station A, reflecting the deficiencies in the control of thermal environment uniformity and local heat load while the lighting efficiency was improved. In terms of thermal environment, the fluctuation of daily temperature in the skylight areas at the two stations was significantly higher than that in the artificial lighting areas, but it was larger at station B, and it was up to 2.7 ℃ in summer, which was 12.5% higher than that of station A (2.4 ℃). At station B, the first underground floor was more sensitive to solar radiation, and the change range of air temperature was larger than that of the second underground floor, revealing the important influence of the location of light openings and surrounding occlusion on the light and thermal environmental performance.
3.2. Simulation Results
In order to further verify and analyze the comprehensive characteristics of energy consumption of 10 sample models, the regression models of variance analysis was carried out to clarify the significance and interaction of factors such as the number, aspect ratio and depth of light openings, as well as skylight angle on combined energy consumption (Appendix II). Besides, experimental models for the working conditions of 10 samples are listed in this study, including the form design of partitioned and through-atrium daylighting spaces (Appendix III), which provides a quantitative basis and practical reference for optimal design.
3.2.1. Influence of Daylighting Spatial Form on Light and Thermal Performance in the Partitioned Public Area
1. Decentralized flat roof skylight
The influence of the lighting spatial form (the number A, aspect ratio B and depth C of light openings) of a decentralized flat roof skylight on the light and thermal performance was analyzed. The results show that the main effect of A, B and C on combined energy consumption is significant, and the interaction terms (such as AB and AC) also play an important role. The single factor analysis reveals that the number of light openings and aspect ratio are negatively correlated with combined energy consumption, while the depth has a relatively weak influence. The simulation range of combined energy consumption is 394.45-400.03 kWh/m², in which refrigeration energy consumption dominates combined energy consumption (Figure 7). Based on response surface analysis, the optimized daylighting form is obtained as follows: the number of light openings is 6, and aspect ratio is 3; depth is 4 m. Under this working condition, combined energy consumption is the lowest, only 394.17 kWh/m².
2. Decentralized double slope roof skylight
The influence of form elements (the number A, aspect ratio B, and depth C of light openings and skylight angle D) of a decentralized double slope roof skylight on the light and thermal performance was studied. The results indicate that the main effects of the number (A) and aspect ratio (B) of light openings, and skylight angle (D) are significant (p<0.01). The single factor analysis reveals that the number of light openings is negatively correlated with combined energy consumption, while skylight angle is positively correlated with combined energy consumption. The influence of aspect ratio is weak, and the influence of depth is the smallest. In the interaction analysis, the interaction between the number of light openings and skylight angle (AD) is significant, and combined energy consumption varies from 387.49 to 403.44 kWh/m² (Figure 8). According to the response surface analysis, the optimized daylighting form is gained as follows: the number of light openings is 6, and aspect ratio is 2.6; depth is 4 m, and skylight angle is 15°. The minimum of combined energy consumption is 385.14 kWh/m². The results show that the double slope roof can reduce combined energy consumption more effectively than the flat roof.
3. Centralized flat roof skylight
The influence of form elements (window-to-floor ratio A, aspect ratio B, and depth C of light openings) of a centralized flat roof skylight on the light and thermal performance was discussed. The results reveal that window-to-floor ratio has the greatest influence on combined energy consumption, and they are positively correlated, while the aspect ratio and depth of light openings are negatively correlated with combined energy consumption. The interaction effect between window-to-floor ratio and the aspect ratio of light openings is significant (p<0.05). Combined energy consumption ranges from 398.63 to 405.69 kWh/m² (Figure 9). According to the response surface analysis, the optimized daylighting form is obtained as follows: window-to-floor ratio is 0.08, and the aspect ratio of light openings is 8; depth is 4 m. Under this working condition, combined energy consumption is the lowest (only 398.48 kWh/m²).
4. Centralized double slope roof skylight
The influence of the window-to-floor ratio (A), aspect ratio (B), and depth (C) of light openings and skylight angle (D) of a centralized double slope roof skylight on the light and thermal performance was analyzed. Skylight angle is positively correlated with combined energy consumption, while the aspect ratio of light openings is negatively correlated with combined energy consumption, and window-to-floor ratio and depth have little influence. The interaction analysis shows that there is a significant interaction between the aspect ratio of light openings and skylight angle (BD) (p<0.05). Combined energy consumption ranges from 392.23 to 398.22 kWh/m² (Figure 10). The optimized design parameters are as follows: window-to-ground ratio is 0.18, and the aspect ratio of light openings is 8; depth is 2.962 m, and skylight angle is 15°. Corresponding combined energy consumption is 392.28 kWh/m².
5. Centralized arched roof skylight
The influence of form elements (the window-to-floor ratio A, aspect ratio B, and depth C of light openings and skylight angle D) of a centralized arched roof skylight on the light and thermal performance was studied. It is found that window-to-floor ratio is positively correlated with combined energy consumption, while skylight angle is negatively correlated with combined energy consumption, and the influence of the depth and aspect ratio of light openings is weak. Interaction analysis reveals that the interaction effect between window-to-floor ratio and skylight angle (AD) is significant. Combined energy consumption ranges from 397.88 to 412.99 kWh/m² (Figure 11). For the optimized parameters, window-to-ground ratio is 0.08, and the aspect ratio of light openings is 7.198; depth is 4 m, and skylight angle is 22.282°. Corresponding combined energy consumption is 397.582 kWh/m².
3.2.2. Influence of Daylighting Spatial Form on Light and Thermal Performance in the Through-Type Public Area
1. Decentralized flat roof skylight
The influence of the lighting spatial form (the number A, aspect ratio B and depth C of light openings and the number of atriums D) of a decentralized flat roof skylight on the light and thermal performance was dicussed. The results reveal that the effect of the number of light openings and atriums on combined energy consumption is the most significant (p<0.01), and they are negatively correlated, while the aspect ratio and depth of light openings have a relatively weak effect. Combined energy consumption varied from 417.97 to 423.54 kWh/m² (Figure 12). The optimized parameters are as follows: the number of light openings is 6, and aspect ratio is 3; depth is 4 m, and the number of atriums is 5. Corresponding combined energy consumption is 411.819 kWh/m².
2. Decentralized double slope roof skylight
The influence of form elements (the number A and aspect ratio B of light openings, the number of atriums C, and skylight angle D) of a decentralized double slope roof skylight on the light and thermal performance was studied. It is found that both the number of light openings and atriums on combined energy consumption are negatively correlated with combined energy consumption, while skylight angle is positively correlated with combined energy consumption. The influence of aspect ratio is small. Combined energy consumption ranges from 406.11 to 422.8 kWh/m² (Figure 13). In terms of the optimized parameters, the number of light openings is 6, and aspect ratio is 3; the number of atriums is 5, and skylight angle is 15°. Corresponding combined energy consumption is 403.476 kWh/m².
3. Centralized flat roof skylight
The effect of form elements (the window-to-floor ratio A and depth B of light openings, and the number of atriums C) of a centralized flat roof skylight on the light and thermal performance was analyzed. Window-to-floor ratio has the greatest influence on combined energy consumption, and they are positively correlated, while the influence of the number of atriums is small, and the depth makes almost no difference. Combined energy consumption varies from 417.47 to 442.4 kWh/m² (Figure 14). The optimized parameters are as follows: window-to-floor ratio is 0.1, and depth is 4 m; the number of atriums is 5. Corresponding combined energy consumption is 417.151 kWh/m².
4. Centralized double slope roof skylight
The influence of form elements (the window-to-floor ratio A and depth B of light openings, the number of atriums C, and skylight angle D) of a decentralized double slope roof skylight on the light and thermal performance was studied. The results reveal that window-to-floor ratio is positively correlated with combined energy consumption, while skylight angle and the depth of light openings are negatively correlated with combined energy consumption. The effect of the number of atriums is weak. Combined energy consumption is between 408.76 and 421 kWh/m² (Figure 15). In terms of the optimized parameters, window-to-floor ratio is 0.1, and depth is 2.401; the number of atriums is 5, and skylight angle is 26.548°. Corresponding combined energy consumption is 414.811 kWh/m².
5. Centralized arched roof skylight
The effect of form elements (the window-to-floor ratio A and depth B of light openings, the number of atriums C, and skylight angle D) of a centralized arched roof skylight on the light and thermal performance was analyzed. It is found that window-to-floor ratio is positively correlated with combined energy consumption, while skylight angle is negatively correlated with combined energy consumption. The influence of the depth is weak. Combined energy consumption changes from 417.36 to 467.01 kWh/m² (Figure 16). The optimized parameters are as follows:window-to-floor ratio is 0.1, and depth is 2.401; the number of atriums is 5, and skylight angle is 26.548°. Corresponding combined energy consumption is 414.811 kWh/m².
3.2.3. Comparison of Simulation Results Between the Two Stations
From the comparative analysis of 10 sample models of daylighting space at the two stations, it is seen that the light and thermal performance of the partitioned daylighting space is superior to that of the through-atrium daylighting space (Figure 17). Decentralized double slope roof skylights perform best in the two layouts, with the combined energy consumption of 385.14 kWh/m² for the partitioned type and 403.48 kWh/m² for the through-atrium type. Centralized flat and arched roofs have higher energy consumption, and should be used under specific constraints. It is recommended to preferentially use decentralized double slope roof skylights, and appropriately adjust the number and aspect ratio of light openings as well as skylight angle to optimize light and thermal environmental performance.
3.3. Optimization Strategies
3.3.1. Partitioned Daylighting Space
For the decentralized skylight daylighting space, the number, aspect ratio and depth of light openings are key factors affecting combined energy consumption [31,32,33]. Optimization strategies should be refined according to specific working conditions. ① When a decentralized flat roof is adopted, the number of light openings should be set to 6 to ensure sufficient natural light entry and reduce the need for artificial lighting; the aspect ratio of light openings should be 2.5-3 to optimize daylighting efficiency, and depth should be set to 4 m to balance the cooling load and lighting energy consumption. ② As a decentralized double slope roof is used, skylight angle should be set to 15°, and the number and aspect ratio of light openings should be consistent with those of the flat roof. In the study, it is further pointed out that the double slop roof design has a significant advantage in terms of reducing the heat load. Through the above strategies, combined energy consumption can be optimized to 385.14 kWh/m².
For the centralized skylight daylighting space, window-to-floor ratio is the key factor influencing combined energy consumption. The increase of window-to-floor ratio will significantly improve cooling load and combined energy consumption, but at the same time reduce heating load and lighting energy consumption [34,35]. Optimization strategies should be formulated according to the type of skylights (flat roof, double slope roof, and arched roof). For the design of flat and arched roofs, window-to-floor ratio should be set to 0.08 to limit excessive heat into the room and maintain a suitable level of natural light; the aspect ratio of light openings should be 7-8, and the depth is set to 3-4 m. For the design of a double slope roof, window-to-floor ratio can be appropriately increased to 0.18 to enhance the natural lighting effect; skylight angle should be 15-25°, and the depth of light openings should be 3-4 m. The optimized design can significantly decrease artificial lighting energy consumption and cooling load and meet thermal comfort requirements.
3.3.2. Through-Atrium Daylighting Space
The optimization analysis of the through-atrium skylight daylighting space shows that the number of light openings is significantly negatively correlated with cooling load and combined energy consumption, and increasing the number of light openings can effectively reduce energy consumption [36,37,38]. The aspect ratio of light openings has significant influence on cooling load, lighting energy consumption and combined energy consumption, and is negatively correlated with them, with the best value of 3. The influence of the depth of light openings is weak, and it only has a small positive correlation with heating load. The number of atriums is negatively correlated with combined energy consumption, so it is recommended to set the number of atriums to 5 to achieve the best energy consumption performance. Besides, skylight angle is positively correlated with cooling load and combined energy consumption, and should be within 15°. It is suggested to set the number of light openings to 6, the aspect ratio of light openings to 3, the depth of light openings to 3-4 m, skylight angle to 15°, and the number of atriums to 5. After optimization, the lowest combined energy consumption of the decentralized distributed double slope roof is 403.48 kWh/m², that is, energy conservation performance is good.
For the centralized skylight daylighting space, window-to-floor ratio has the most significant influence on combined energy consumption. That is, with the increase of window-to-floor ratio, cooling load and combined energy consumption rise, but heating load and lighting energy consumption decrease [39]. The depth of light openings has little influence on combined energy consumption, while the number of atriums is significantly negatively correlated with combined energy consumption. It is recommended that the number of atriums is 5. Besides, skylight angle is positively correlated with cooling load and combined energy consumption, and it is suggested to set skylight angle to 15-30°. It is recommended to set the window-to-floor ratio of flat and arched roofs to 0.1, the window-to-floor ratio of double slope roofs to 0.4, the depth of light openings to 2.4-4 m, and skylight angle to 15-30°. In the optimized configuration, the combined energy consumption of the centralized double slope roof is the lowest, only 404.86 kWh/m², which is better than other centralized types.
According to the comprehensive analysis of optimization strategies of partitioned and through-atrium skylight daylighting space, the partitioned double slope roof design has the best performance in energy conservation performance and the regulation of light and thermal environment, followed by the through-atrium double slope roof design. The window-to-floor ratio, number and aspect ratio of light openings have the most significant influence on combined energy consumption, while the depth of light openings and skylight angle should be adjusted according to the specific type. In the actual design, a skylight in the form of a double slope roof is preferentially recommended, and the optimal configuration is selected according to the specific spatial form and functional requirements of the public area of a subway station, so as to achieve the comprehensive improvement of light and thermal performance and the realization of energy conservation.
4. Conclusions
Through the combination of field test and numerical simulation, the light and thermal environment of underground public transportation hubs with skylights were systematically evaluated. The characteristics of light and thermal environment in summer and winter at stations A and B in Shanghai were analyzed, and the relationship models between daylighting spatial form and energy consumption were established. The main conclusions are as follows.
In terms of skylight daylighting and thermal environmental characteristics, the illumination of skylight areas was significantly affected by the external solar radiation and climate conditions, fluctuating with time, while the the illumination of artificial lighting areas was more stable. The daily fluctuation range of the surface temperature under the skylights was significantly larger than that of ground and air temperature. However, due to the effective adjustment of air conditioning system, the difference of air temperature between the skylight and artificial lighting areas was small, and the overall temperature was kept within the comfortable range. The daylighting effect of station B in Shanghai was better than that of station A. At station B with a large skylight daylighting area, the quality of light environment has been improved, but the demand for the adjustment of thermal environment has been also increased.
- 10 sample models of common skylight daylighting space in the public areas of the subway stations were summarized. They can be divided into centralized and decentralized types according to the number of light openings, and the roofs can be partitioned into flat, double slope and arched roofs according to skylight angle. Among them, decentralized daylighting space usually does not use arched roofs. According to the spatial classification of partitioned and through-atrium public areas, 10 sample models of common skylight daylighting space were formed. This study reveals that under the premise of satisfying indoor light and thermal environment comfort, the decentralized double slope roof structure is preferred, followed by the centralized double slope roof structure.
- Aiming at the design goal of optimal combined energy consumption, the optimized parameters of skylight daylighting space are determined as follows. In the decentralized daylighting space, the number of light openings is 6, and the aspect ratio of light openings is 2.5-3; depth is 4 m, and the skylight angle of a double slope roof skylight is 15°. In the centralized daylighting space in the partitioned public area, the window-to-floor ratio of flat and arched roofs is 0.08, and that of a double slope roof is 0.18; the aspect ratio of light openings is 7-8, and depth is 3-4 m; skylight angle is 15-25°. In the through-atrium public area, the window-to-floor ratio of flat and arched roofs is 0.1, and that of a double slope roof is 0.4; the depth of light openings is 2.4-4 m, and the number of atriums is 5; skylight angle is 15-30°.
- Although this study provides theoretical and practical support for the design optimization of skylight daylighting spatial form of shallow buried subway stations, there are still some limitations. For instance, the research objects are concentrated on shallow buried subway stations, and the influence of complex factors such as ground materials and interior layout is not fully considered. Future research should be extended to more diverse underground transportation hubs, and dynamic control strategies should be developed in combination with intelligent control technology. In conclusion, this study provides an important reference for improving the light and thermal performance and energy efficiency of underground public space, and lays scientific foundation for the construction of low-carbon cities in the future.
Author Contributions
Conceptualization, X.L., B.S., H.Z. and X.J.; data curation, X.L. and B.S.; formal analysis, X.L and H.Z.; funding acquisition, X.L.; methodology, X.L., B.S., C.H., and Y.C.; resources, B.S. and X.J.; software, X.L., B.S. and C.H.; supervision, X.L. and B.S.; validation, B.S.; visualization, X.L. and C.H.; writing–original draft, X.L., B.S. and C.H..; writing–review & editing, X.L and B.S. All authors have read and agreed to the published version of the manu-script.
Funding
This research was funded by the Foundation for Young Doctors of Jiangsu Collaborative Innovation Center for Building Energy Saving and Construction Technology (No. SJXTBS2108).
Institutional Review Board Statement
Not applicable.
Informed Consent Statement
Not applicable.
Data Availability Statement
Not applicable.
Conflicts of Interest
The authors declare no conflict of interest.
References
- Ma, C.; Peng, F.; Qiao, Y.; Li, H. Evaluation of spatial performance of metro-led urban underground public space: A case study in Shanghai. Tunn. Undergr. Space Technol. 2022, 124, 104484. [Google Scholar] [CrossRef]
- Zhang, Z.; Qin, Y.; Jia, L. Discrete modeling approach for emergency guidance signage system design in underground spaces: A case study in transportation hubs. Tunn. Undergr. Space Technol. 2022, 120, 104275. [Google Scholar] [CrossRef]
- Passi, A.; Nagendra, S.M.S.; Maiya, M.P. Characteristics of indoor air quality in underground metro stations: A critical review. Build. Environ. 2021, 198, 107907. [Google Scholar] [CrossRef]
- Wu, Z.; Ji, X.; Zhou, X.; Tong, S. Research on Environmental Suitability Evaluation of the Transfer Spaces in Urban Subway Stations. Buildings 2022, 12, 2209. [Google Scholar] [CrossRef]
- Dussault, J.; Gosselin, L.; Galstian, T. Integration of smart windows into building design for reduction of yearly overall energy consumption and peak loads. Sol. Energy 2012, 86, 3405–3416. [Google Scholar] [CrossRef]
- Tsikaloudaki, K.; Laskos, K.; Theodosiou, T.; Bikas, D. The energy performance of windows in Mediterranean regions. Energy Build. 2015, 92, 180–187. [Google Scholar] [CrossRef]
- Kim, J.T.; Todorovic, M.S. Tuning control of building glazing’s transmittance dependence on the solar radiation wavelength to optimize daylighting and building’s energy efficiency. Energy Build. 2013, 63, 108–118. [Google Scholar] [CrossRef]
- Pu, J.; Shen, C.; Wang, J.; Zhang, Y.; Zhang, C.; Kalogirou, S.A. Near-infrared absorbing glazing for energy-efficient windows: A critical review and performance assessments from the building requirements. Nano Energy 2023, 110, 108334. [Google Scholar] [CrossRef]
- Liu, X.; Shen, C.; Yang, H.; Wang, J. Comprehensive investigation on lighting and energy-saving performance of lighting/heating coupled tubular daylighting devices integrated with nanofluids. Appl. Therm. Eng. 2024, 239, 122094. [Google Scholar] [CrossRef]
- Zhao, J.; Dong, J.; Zhang, X.; Na, Y.; Jiang, C.; He, F.; Cui, Q.; Liu, J. Field measurement of microclimate of sunken square and its effect on indoor environment of underground metro station in subtropical region. Build. Environ. 2023, 228, 109873. [Google Scholar] [CrossRef]
- Huang, S.; Hao, S.; Li, J.; Dong, J.; Liu, J. Effects of large skylights on lighting and thermal environments in underground public transport hubs: A case study in Shenzhen. Build. Environ. 2024, 250, 111182. [Google Scholar] [CrossRef]
- Yuan, J.; Yu, Q.; Yao, S.; Ma, X.; Sun, Z. Multi-objective optimization for the daylighting and thermal comfort performance of elevated subway station buildings in cold climate zone of China. J. Build. Eng. 2023, 78, 107771. [Google Scholar] [CrossRef]
- Wang, C.; Li, C.; Xie, L.; Wang, X.; Chang, L.; Wang, X.; Li, H.; Liu, Y. Thermal environment and thermal comfort in metro systems: A case study in severe cold region of China. Build. Environ. 2023, 227, 109758. [Google Scholar] [CrossRef]
- Katavoutas, G.; Assimakopoulos, M.N.; Asimakopoulos, D.N. On the determination of the thermal comfort conditions of a metropolitan city underground railway. Sci. Total Environ. 2016, 566-567, 877–887. [Google Scholar] [CrossRef]
- Pan, S.; Liu, Y.; Xie, L.; Wang, X.; Yuan, Y.; Jia, X. A thermal comfort field study on subway passengers during air-conditioning season in Beijing. Sustain. Cities Soc. 2020, 61, 102218. [Google Scholar] [CrossRef]
- Passi, A.; Nagendra, S.M.; Maiya, M.P. Evaluation of comfort perception of passengers in urban underground metro stations. Energy Sustain. Dev. 2022, 68, 273–288. [Google Scholar] [CrossRef]
- Li, Y.; Geng, S.; Zhang, X.; Zhang, H. Study of thermal comfort in underground construction based on field measurements and questionnaires in China. Build. Environ. 2017, 116, 45–54. [Google Scholar] [CrossRef]
- Zhao, J.; Dong, J.; Zhang, X.; Na, Y.; Jiang, C.; He, F.; Cui, Q.; Liu, J. Field measurement of microclimate of sunken square and its effect on indoor environment of underground metro station in subtropical region. Build. Environ. 2023, 228, 109873. [Google Scholar] [CrossRef]
- Li, X.; Shi, W.; Liu, Y.; Zhang, N. Optimization Strategy for Thermal Comfort in Railway Stations above Ground Level in Beijing. Buildings 2024, 14, 2843. [Google Scholar] [CrossRef]
- Futrell, B.J.; Ozelkan, E.C.; Brentrup, D. Bi-Objective optimization of building enclosure design for thermal and lighting performance. Build. Environ. 2015, 92, 591–602. [Google Scholar] [CrossRef]
- Konis, K.; Gamas, A.; Kensek, K. Passive performance and building form: An optimization framework for early-stage design support. Sol. Energy 2016, 125, 161–179. [Google Scholar] [CrossRef]
- Motamedi, S.; Liedl, P. Integrative algorithm to optimize skylights considering fully impacts of daylight on energy. Energy Build. 2017, 138, 655–665. [Google Scholar] [CrossRef]
- Fang, Y.; Cho, S. Design Optimization of building geometry and fenestration for daylighting and energy performance. Sol. Energy 2019, 191, 7–18. [Google Scholar] [CrossRef]
- Shi, L.; Li, Y.; Tao, L.; Zhang, Y.; Jiang, X.; Yang, Z.; Qi, X.; Qiu, J. Sporters’ visual comfort assessment in gymnasium based on subjective evaluation & objective physiological response. Build. Environ. 2022, 225, 109678. [Google Scholar]
- Bian, Y.; Luo, Y.; Hu, L.; Liu, L.; Pang, Y. Visual discomfort assessment in an open-plan space with skylights: A case study with POE survey and retrofit design. Energy Build. 2021, 248, 111215. [Google Scholar] [CrossRef]
- Loy-Benitez, J.; Li, Q.; Alfaei, P.; et al. A dynamic gain-scheduled ventilation control system for a subway station based on outdoor air quality conditions. Build. Environ. 2018, 144, 159–170. [Google Scholar] [CrossRef]
- Albatayneh, A.; Juaidi, A.; Abdallah, R.; Manzano-Agugliaro, F. Influence of the advancement in the LED lighting technologies on the optimum windows-to-wall ratio of Jordanians residential buildings. Energies 2021, 14, 5446. [Google Scholar] [CrossRef]
- Al-Janabi, A.; Kavgic, M.; Mohammadzadeh, A.; Azzouz, A. Comparison of EnergyPlus and IES to model a complex university building using three scenarios: free-floating, ideal air load system, and detailed. J. Build. Eng. 2019, 22, 262–280. [Google Scholar] [CrossRef]
- Pan, Y.; Zhu, M.; Lv, Y.; Yang, Y.; Liang, Y.; et al. Building energy simulation and its application for building performance optimization: A review of methods, tools, and case studies. Adv. Appl. Energy 2023, 10, 100135. [Google Scholar] [CrossRef]
- Sun, W.; Feng, L.; Abed, A.M.; Sharma, A.; Arsalanloo, A. Thermoeconomic assessment of a renewable hybrid RO/PEM electrolyzer integrated with Kalina cycle and solar dryer unit using response surface methodology (RSM). Energy 2022, 260, 124947. [Google Scholar] [CrossRef]
- Wang, Y.; Yang, W.; Wang, Q. Multi-objective parametric optimization of the composite external shading for the classroom based on lighting, energy consumption, and visual comfort. Energy Build. 2022, 275, 112441. [Google Scholar] [CrossRef]
- Yin, Y.; Zhang, D.; Zhen, M.; Jing, W.; Luo, W.; Feng, W. Combined effects of the thermal-acoustic environment on subjective evaluations in outdoor public spaces. Sustain. Cities Soc. 2022, 77, 103522. [Google Scholar] [CrossRef]
- Khanmohammadi, S.; Musharavati, F. Multi-generation energy system based on geothermal source to produce power, cooling, heating, and fresh water: Exergoeconomic analysis and optimum selection by LINMAP method. Appl. Therm. Eng. 2021, 195, 117127. [Google Scholar] [CrossRef]
- Bi, Y.; Lin, Y.; Qin, L.; Wang, H.; Sun, R. Performance optimization of a solar air conditioning with a three-phase accumulator based on the energy-economic analysis. J. Build. Eng. 2022, 59, 105065. [Google Scholar] [CrossRef]
- Yu, Z.; Zhu, X.; Liu, X. Characterizing metro stations via urban function: Thematic evidence from transit-oriented development (TOD) in Hong Kong. J. Transport Geogr. 2022, 99, 103299. [Google Scholar] [CrossRef]
- Su, S.; Zhang, H.; Wang, M.; Weng, M.; Kang, M. Transit-oriented development (TOD) typologies around metro station areas in urban China: A comparative analysis of five typical megacities for planning implications. J. Transport Geogr. 2021, 90, 102939. [Google Scholar] [CrossRef]
- Kumar, P.; Sekhar, P.C.H.; Ravi, C.H.; Parida, M. Identification of neighborhood typology for potential transit-oriented development. Transport Res. D 2020, 78, 102218. [Google Scholar]
- Hu, M.; Liu, M.; You, D.; et al. Influence of train arrival characteristics on unorganized ventilation in underground subway station with platform screen doors. J. Wind Eng. Ind. Aerod. 2020, 198. [Google Scholar] [CrossRef]
- Bian, Y.; Luo, L.; Hu, L.; Liu, L.; Pang, Y. Visual discomfort assessment in an open-plan space with skylights: A case study with POE survey and retrofit design. Energy Build. 2021, 248, 111215. [Google Scholar] [CrossRef]
Figure 1.
Sites for field test.
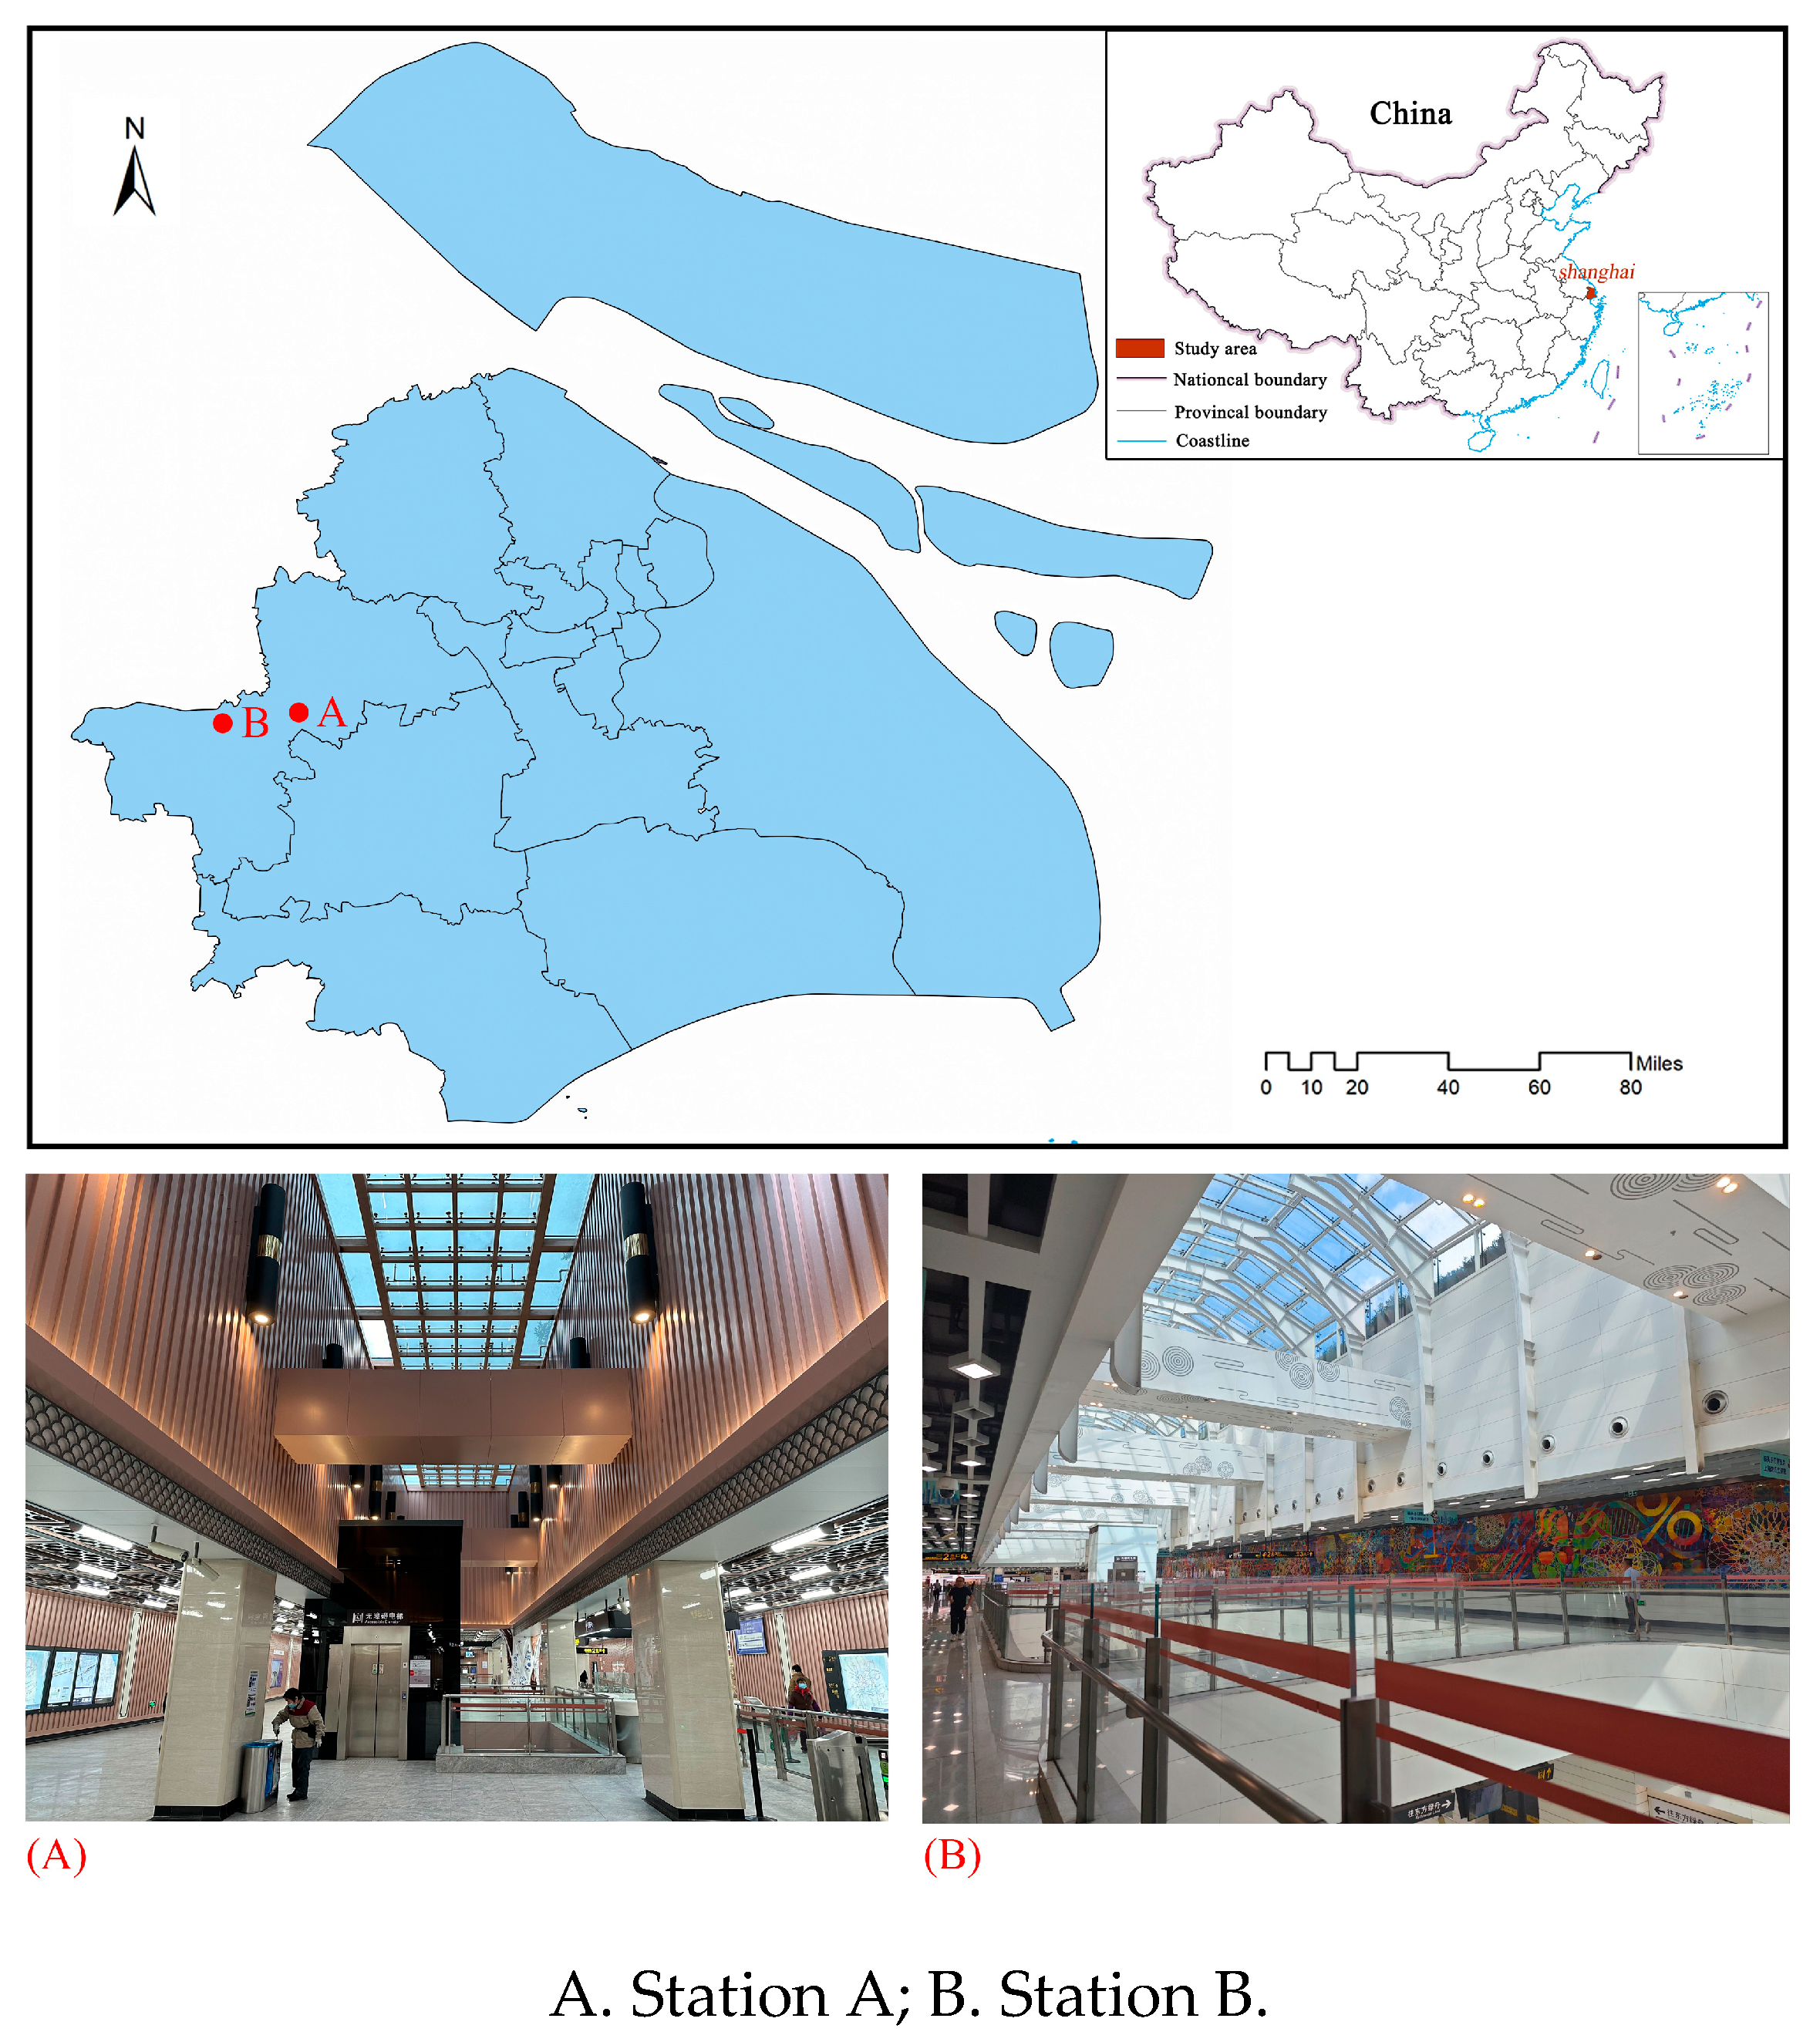
Figure 2.
Test instruments and points.
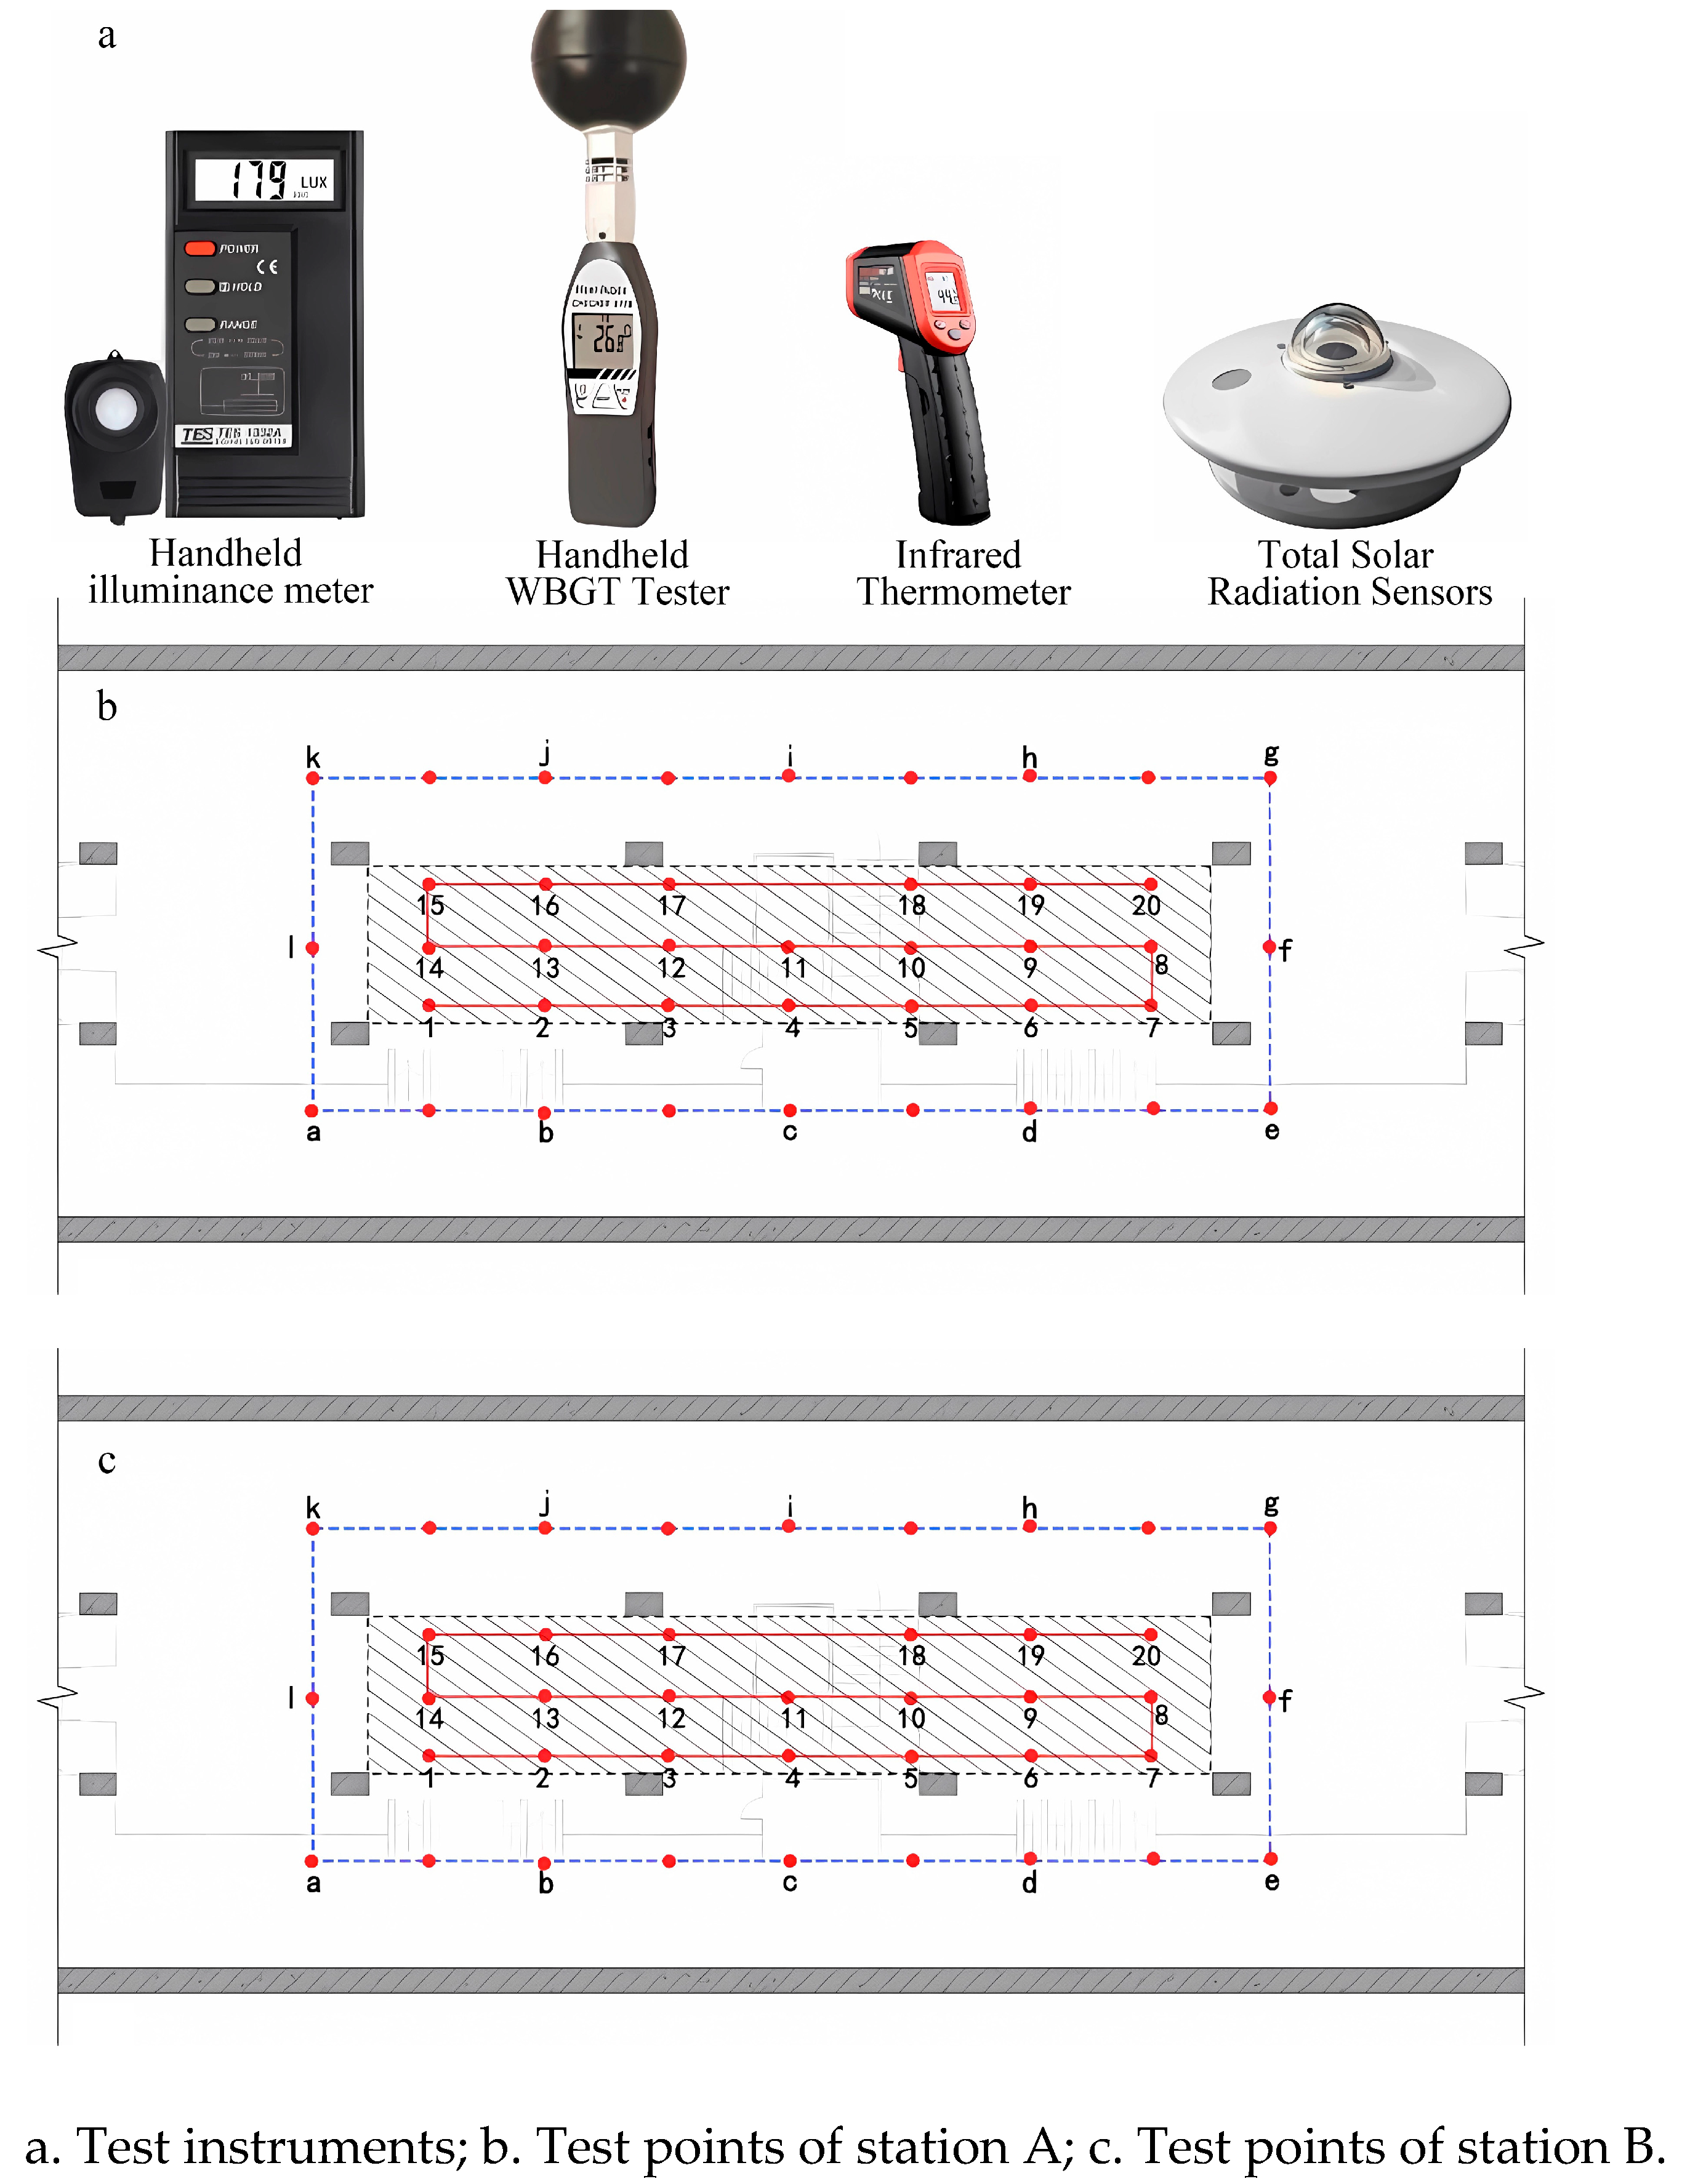
Figure 3.
Software modeling.
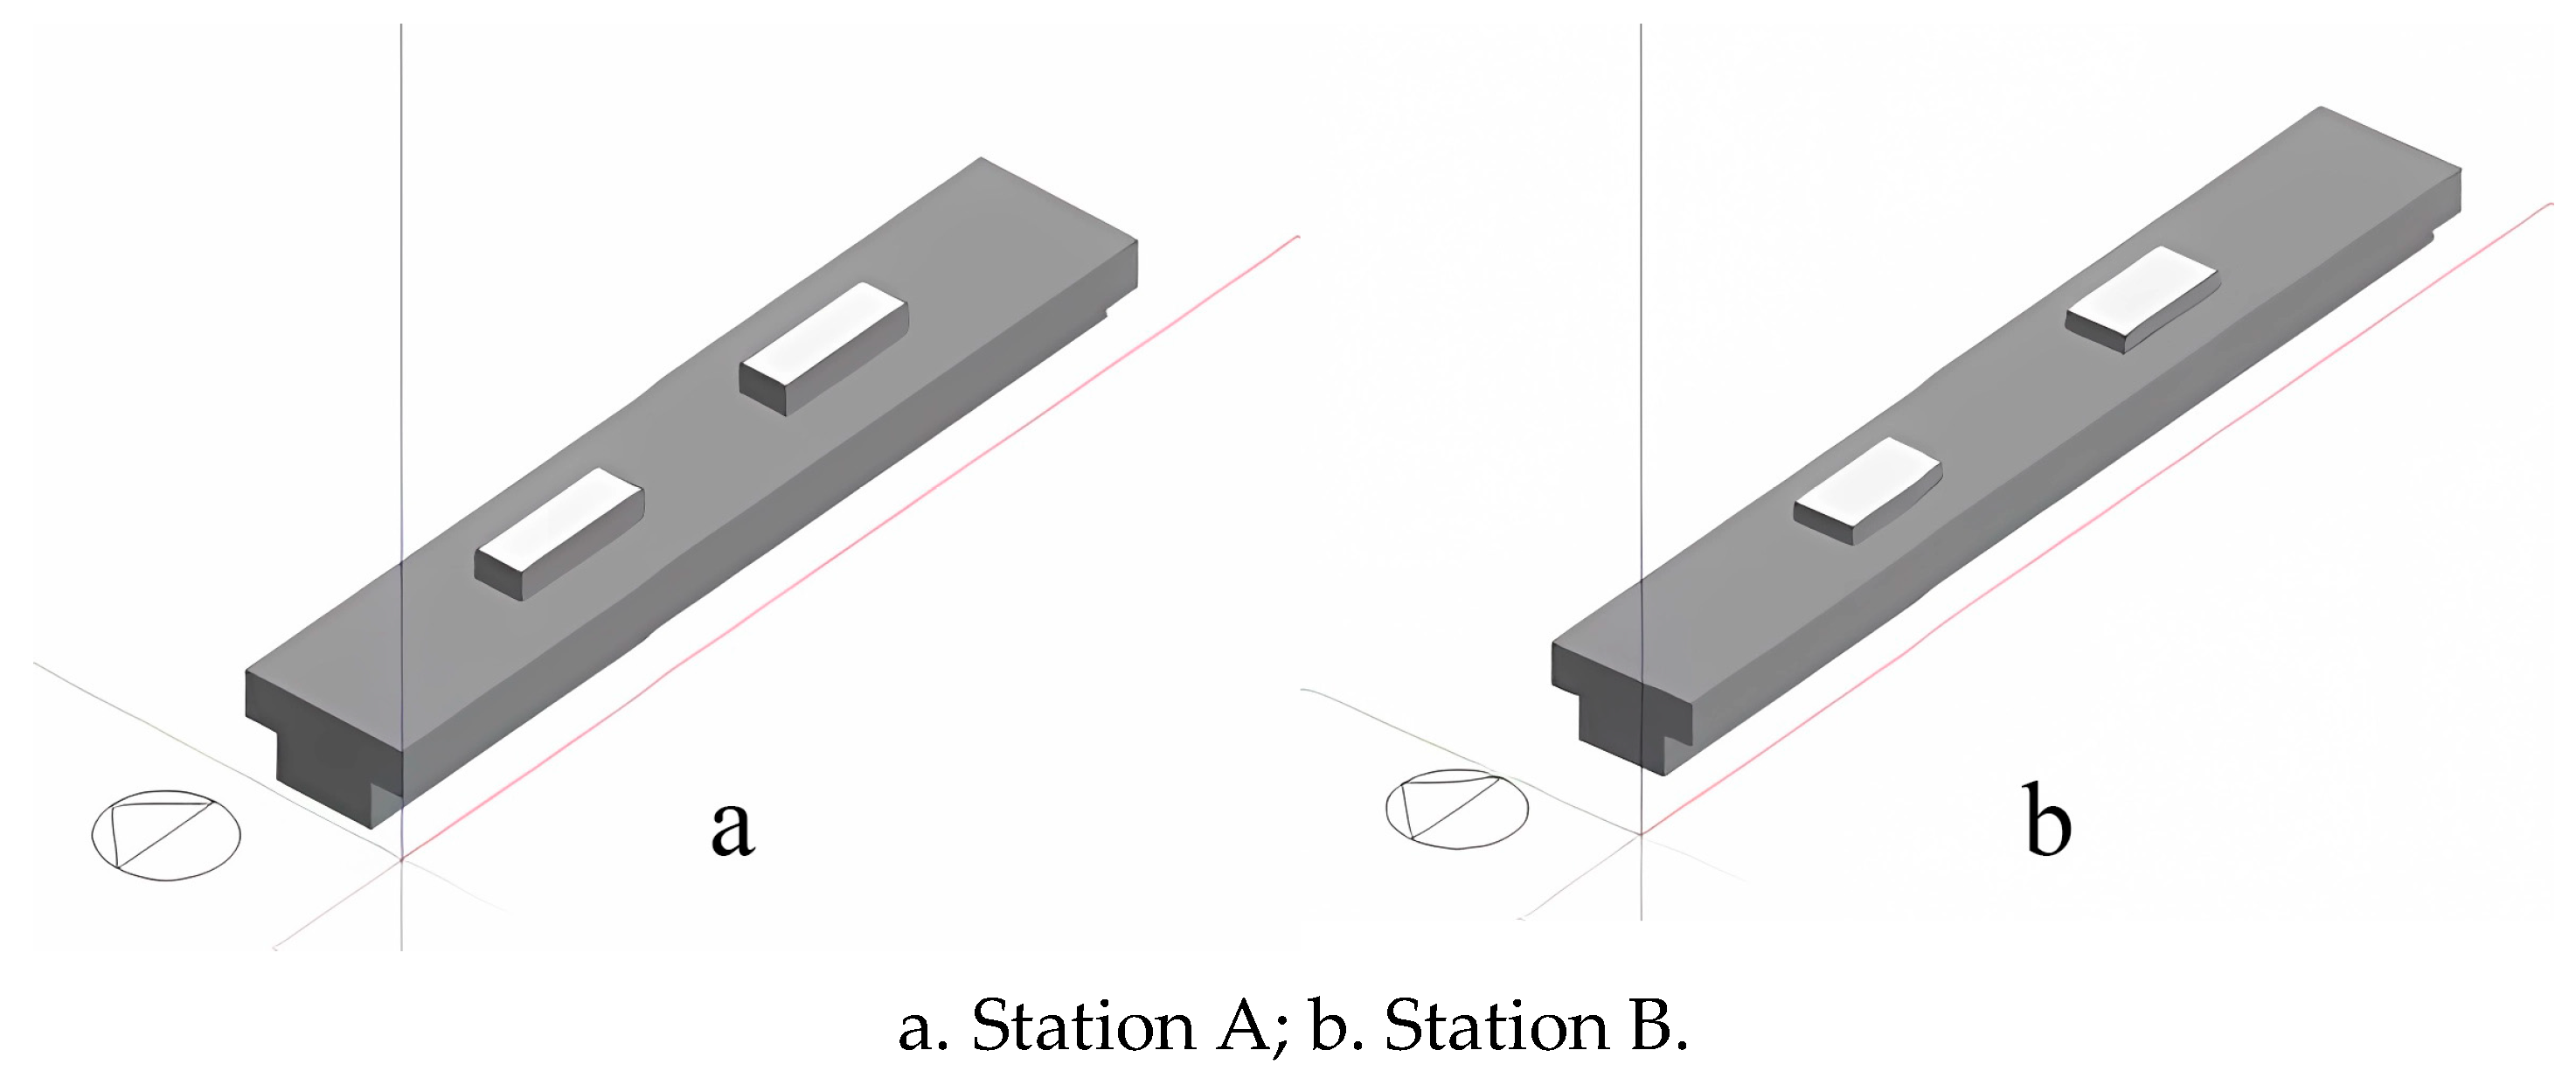
Figure 4.
Comparison between the field test and simulated data of illumination.
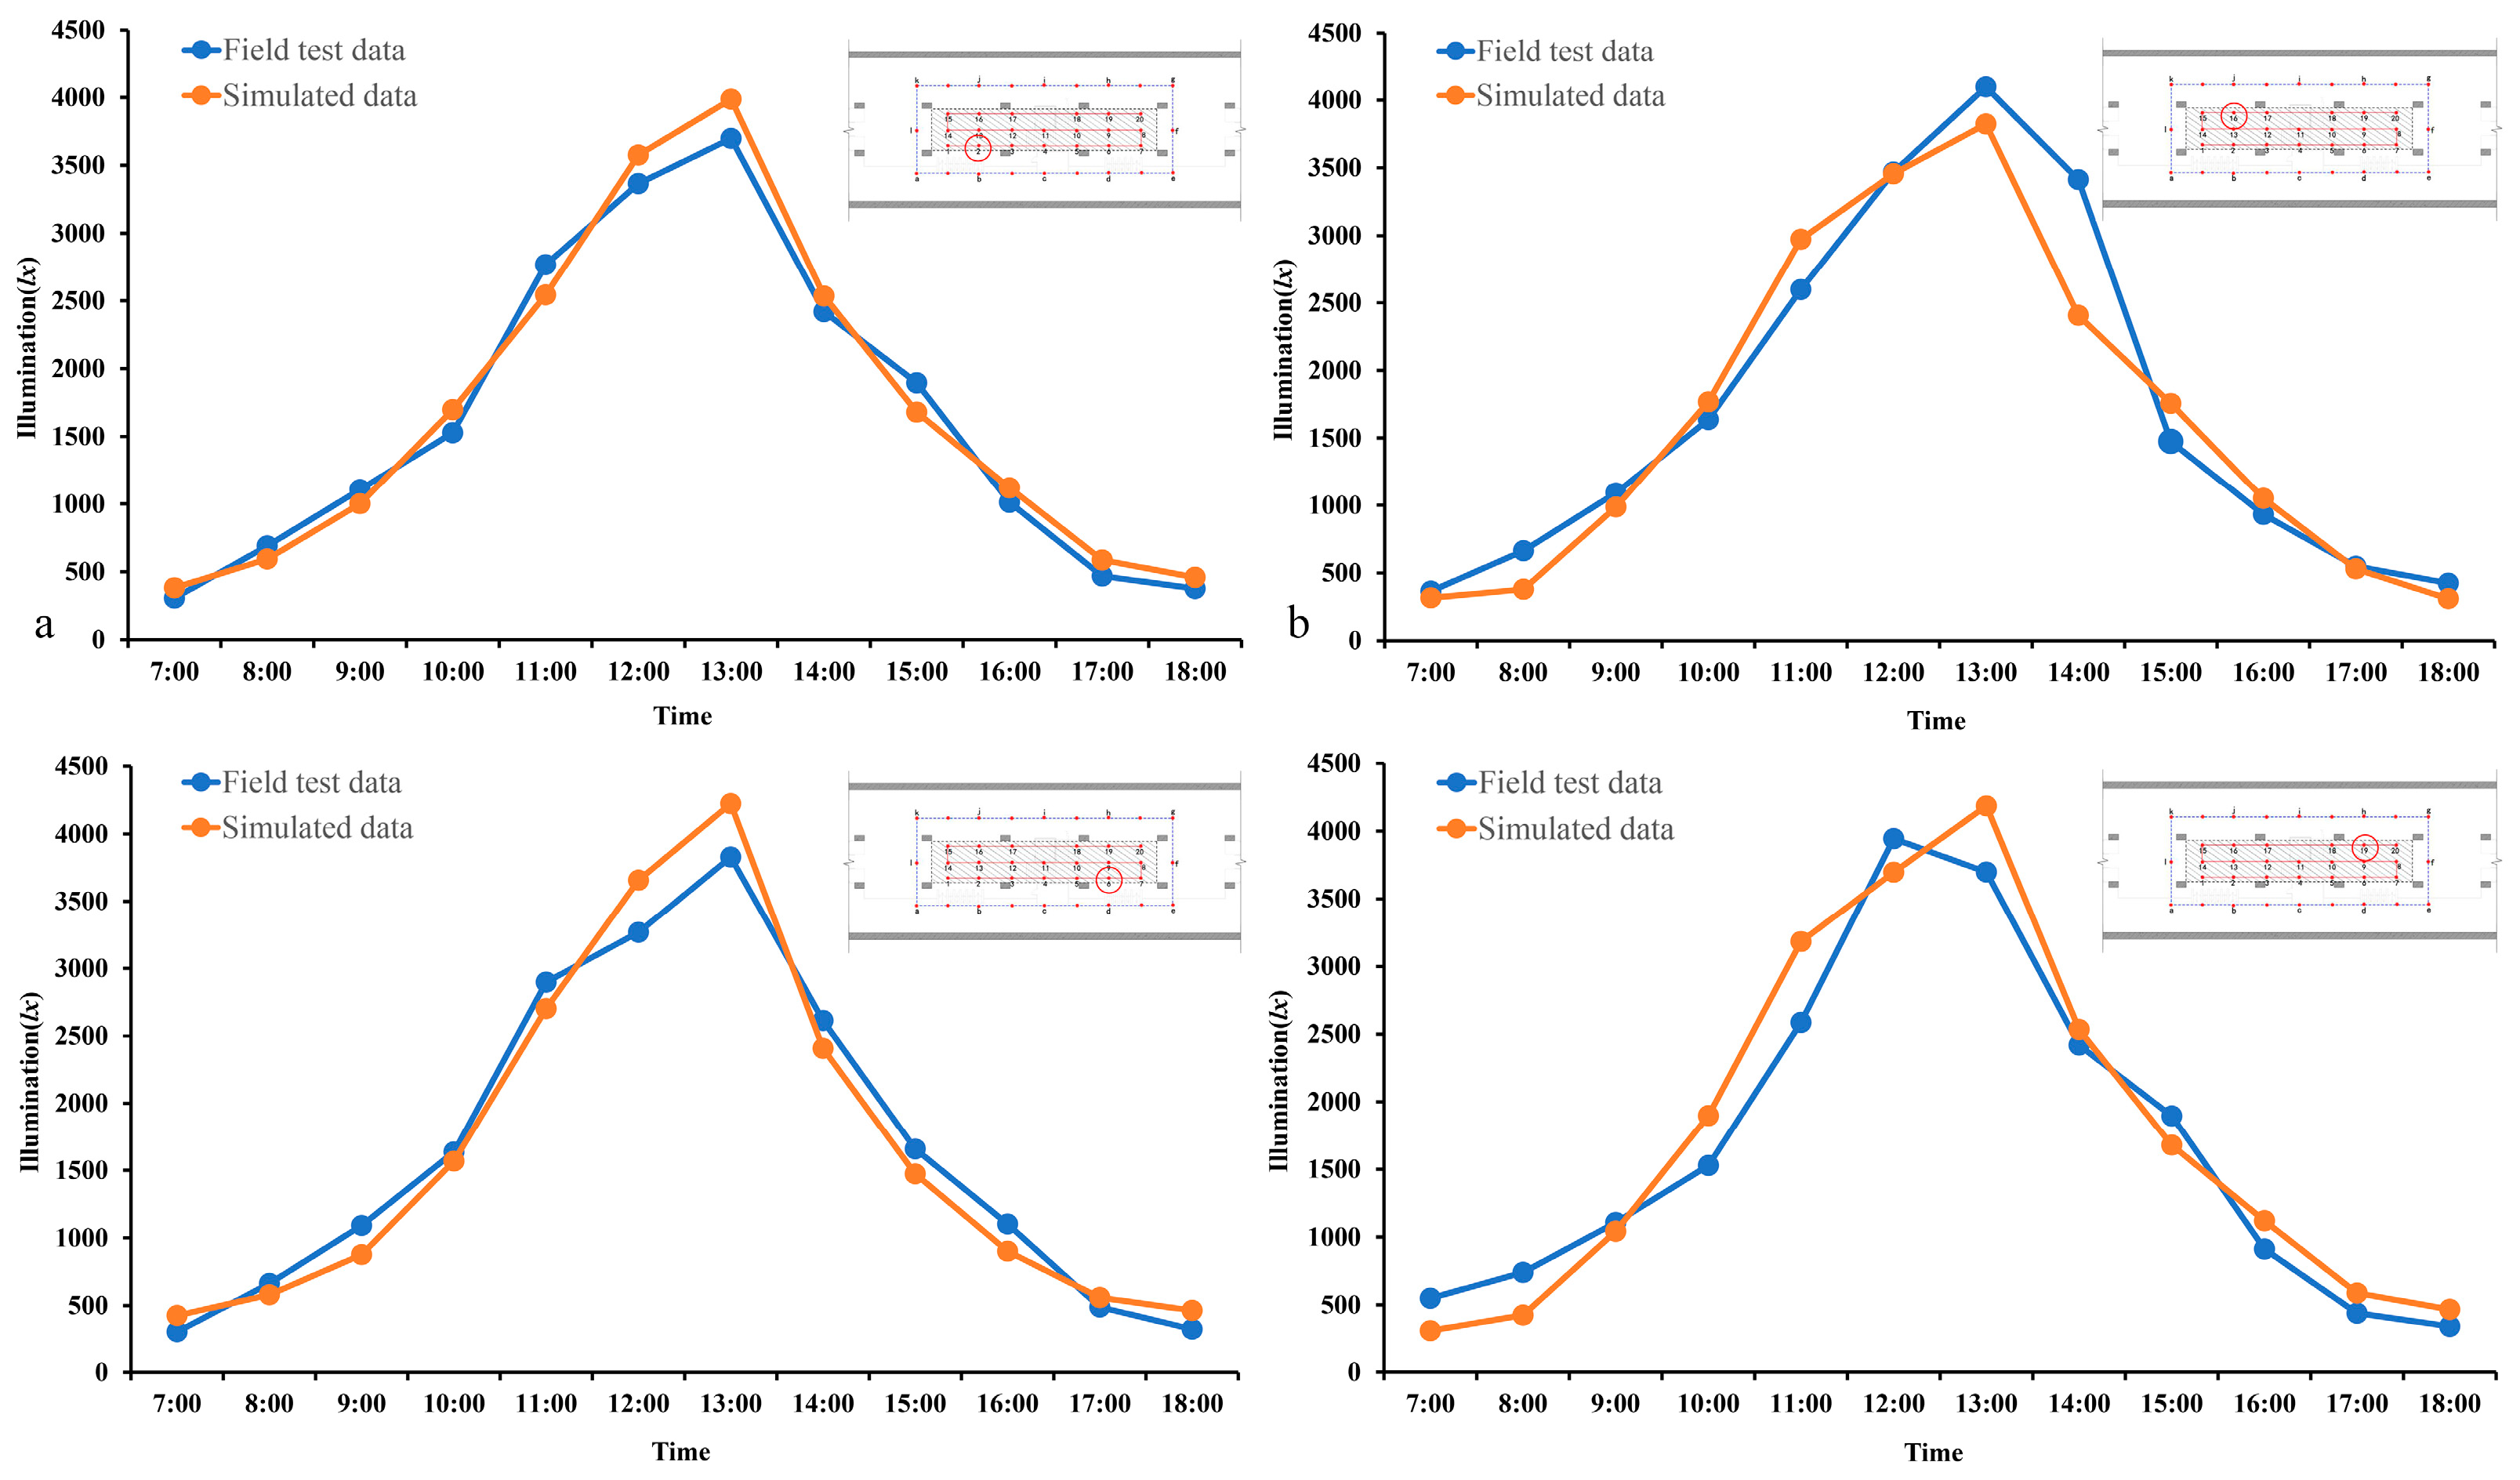
Figure 5.
Field test data of stations A and B in Shanghai.
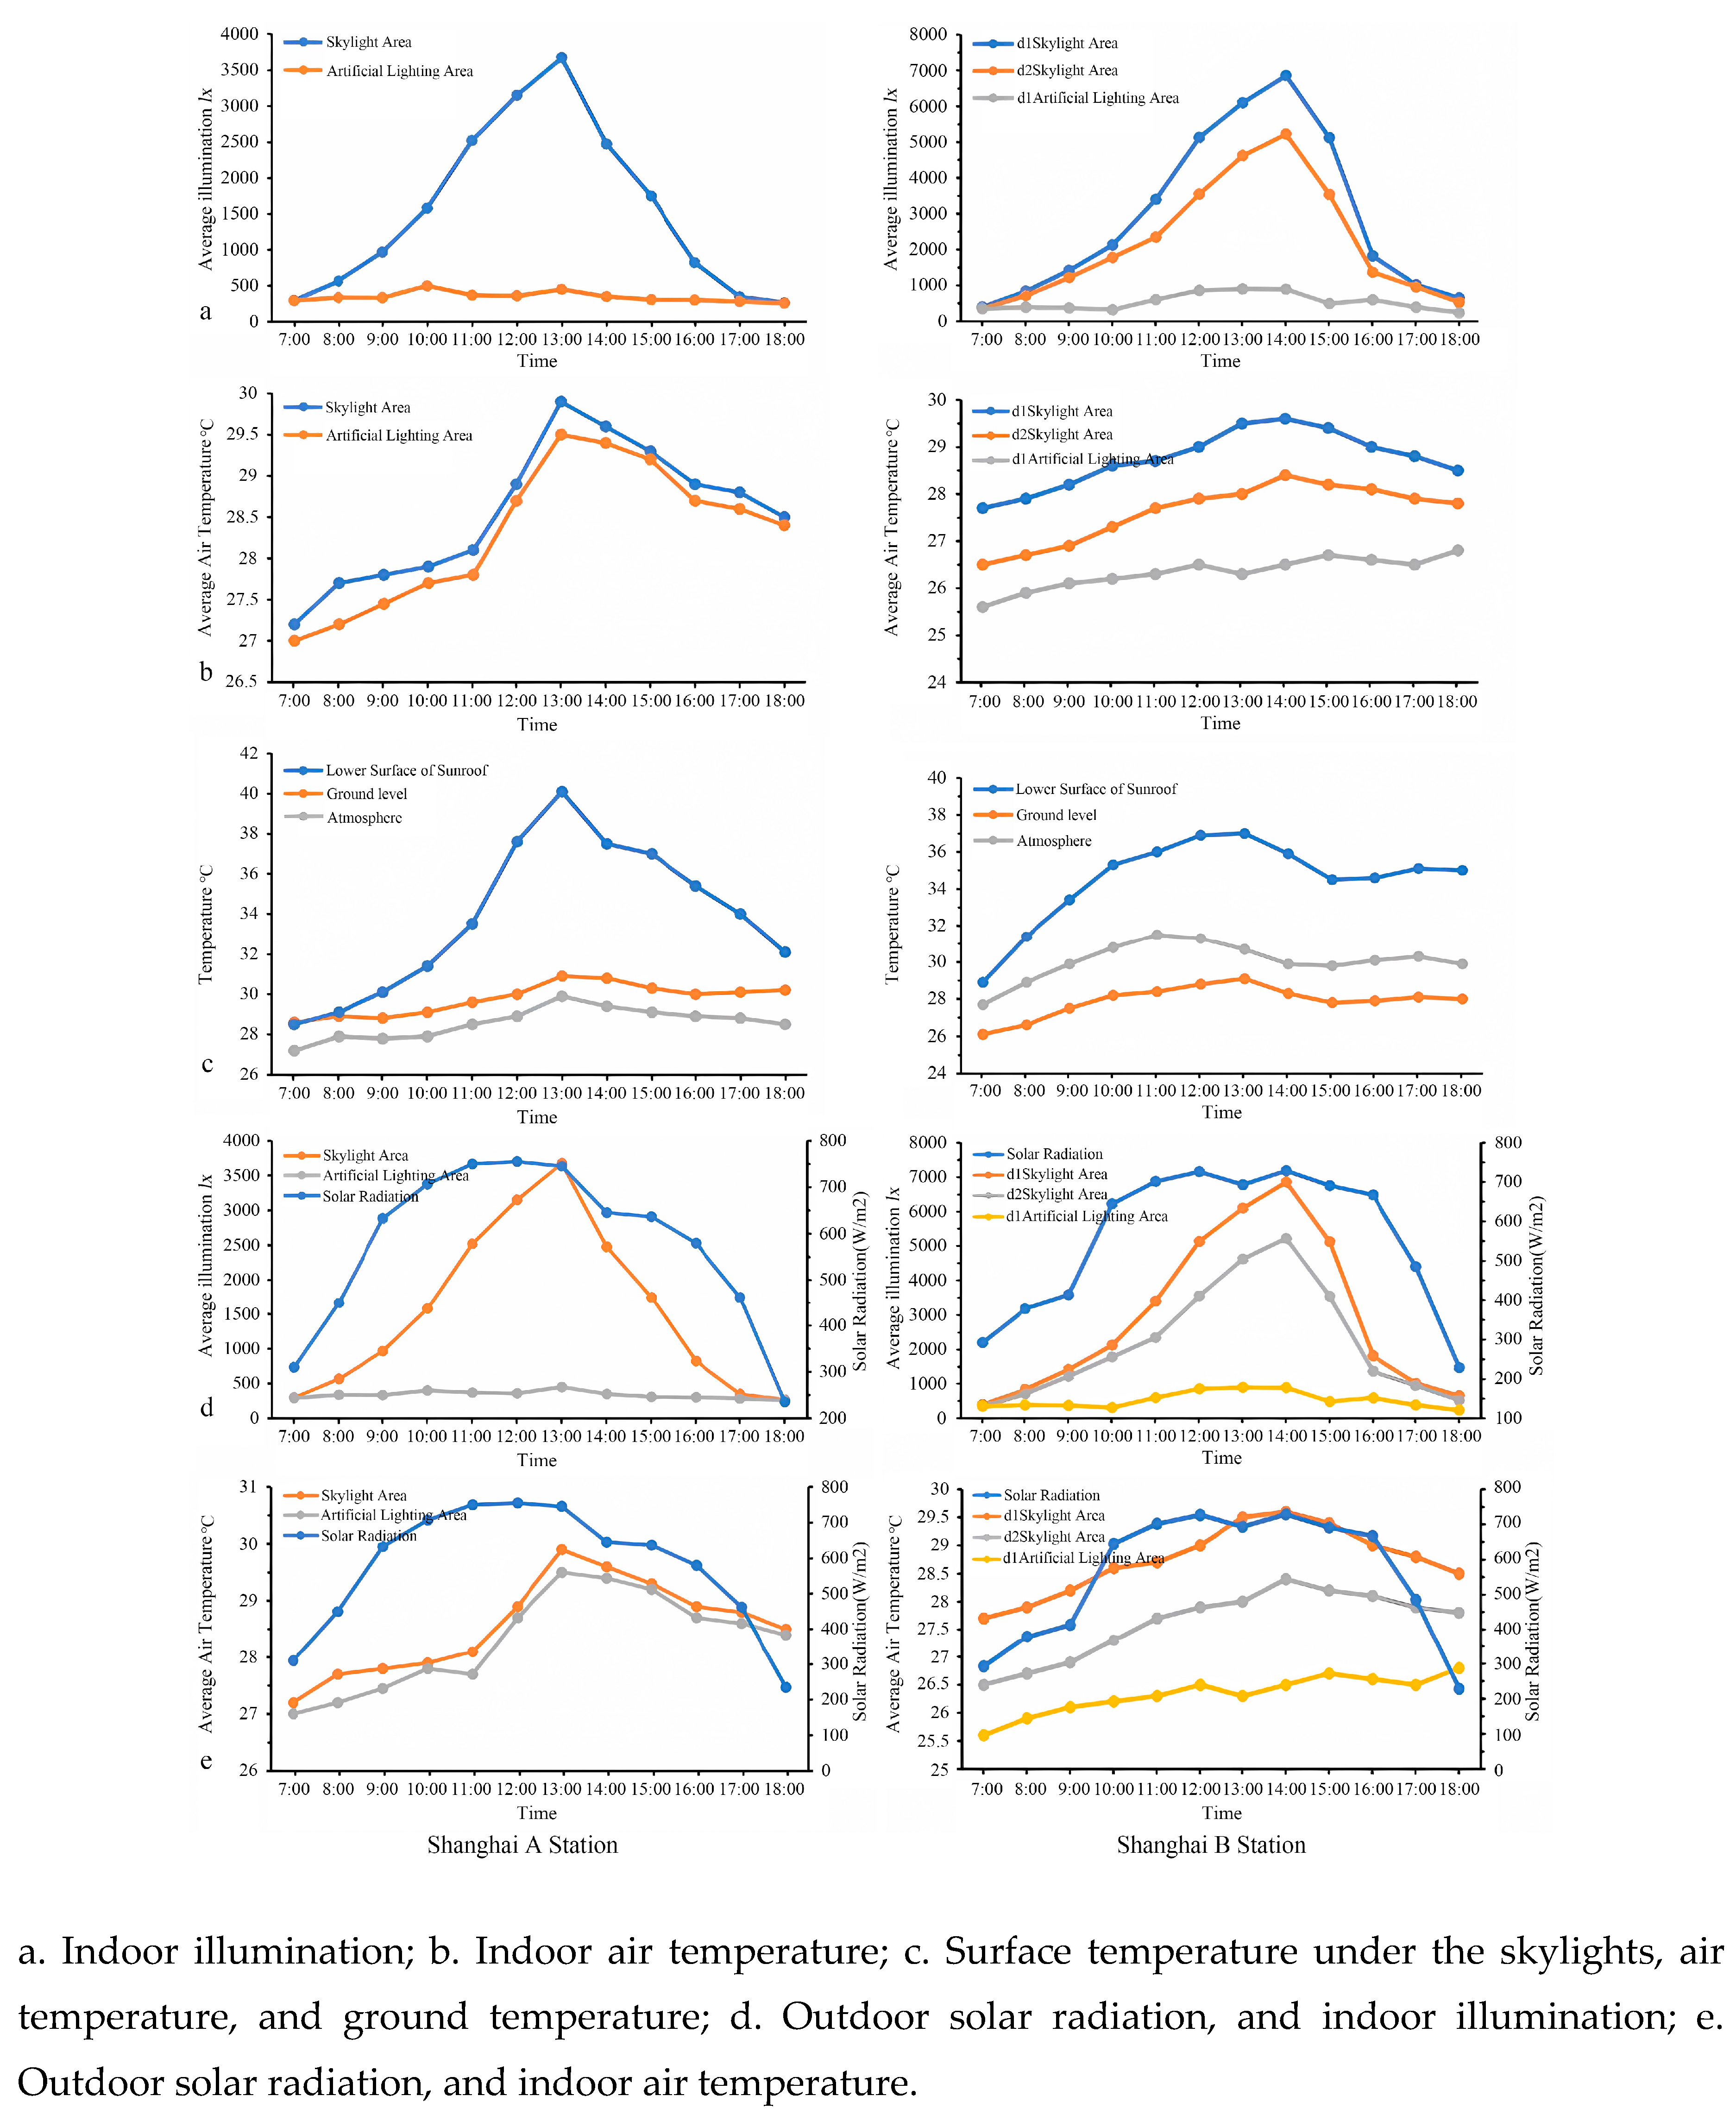
Figure 6.
Field test data of stations A and B in Shanghai.
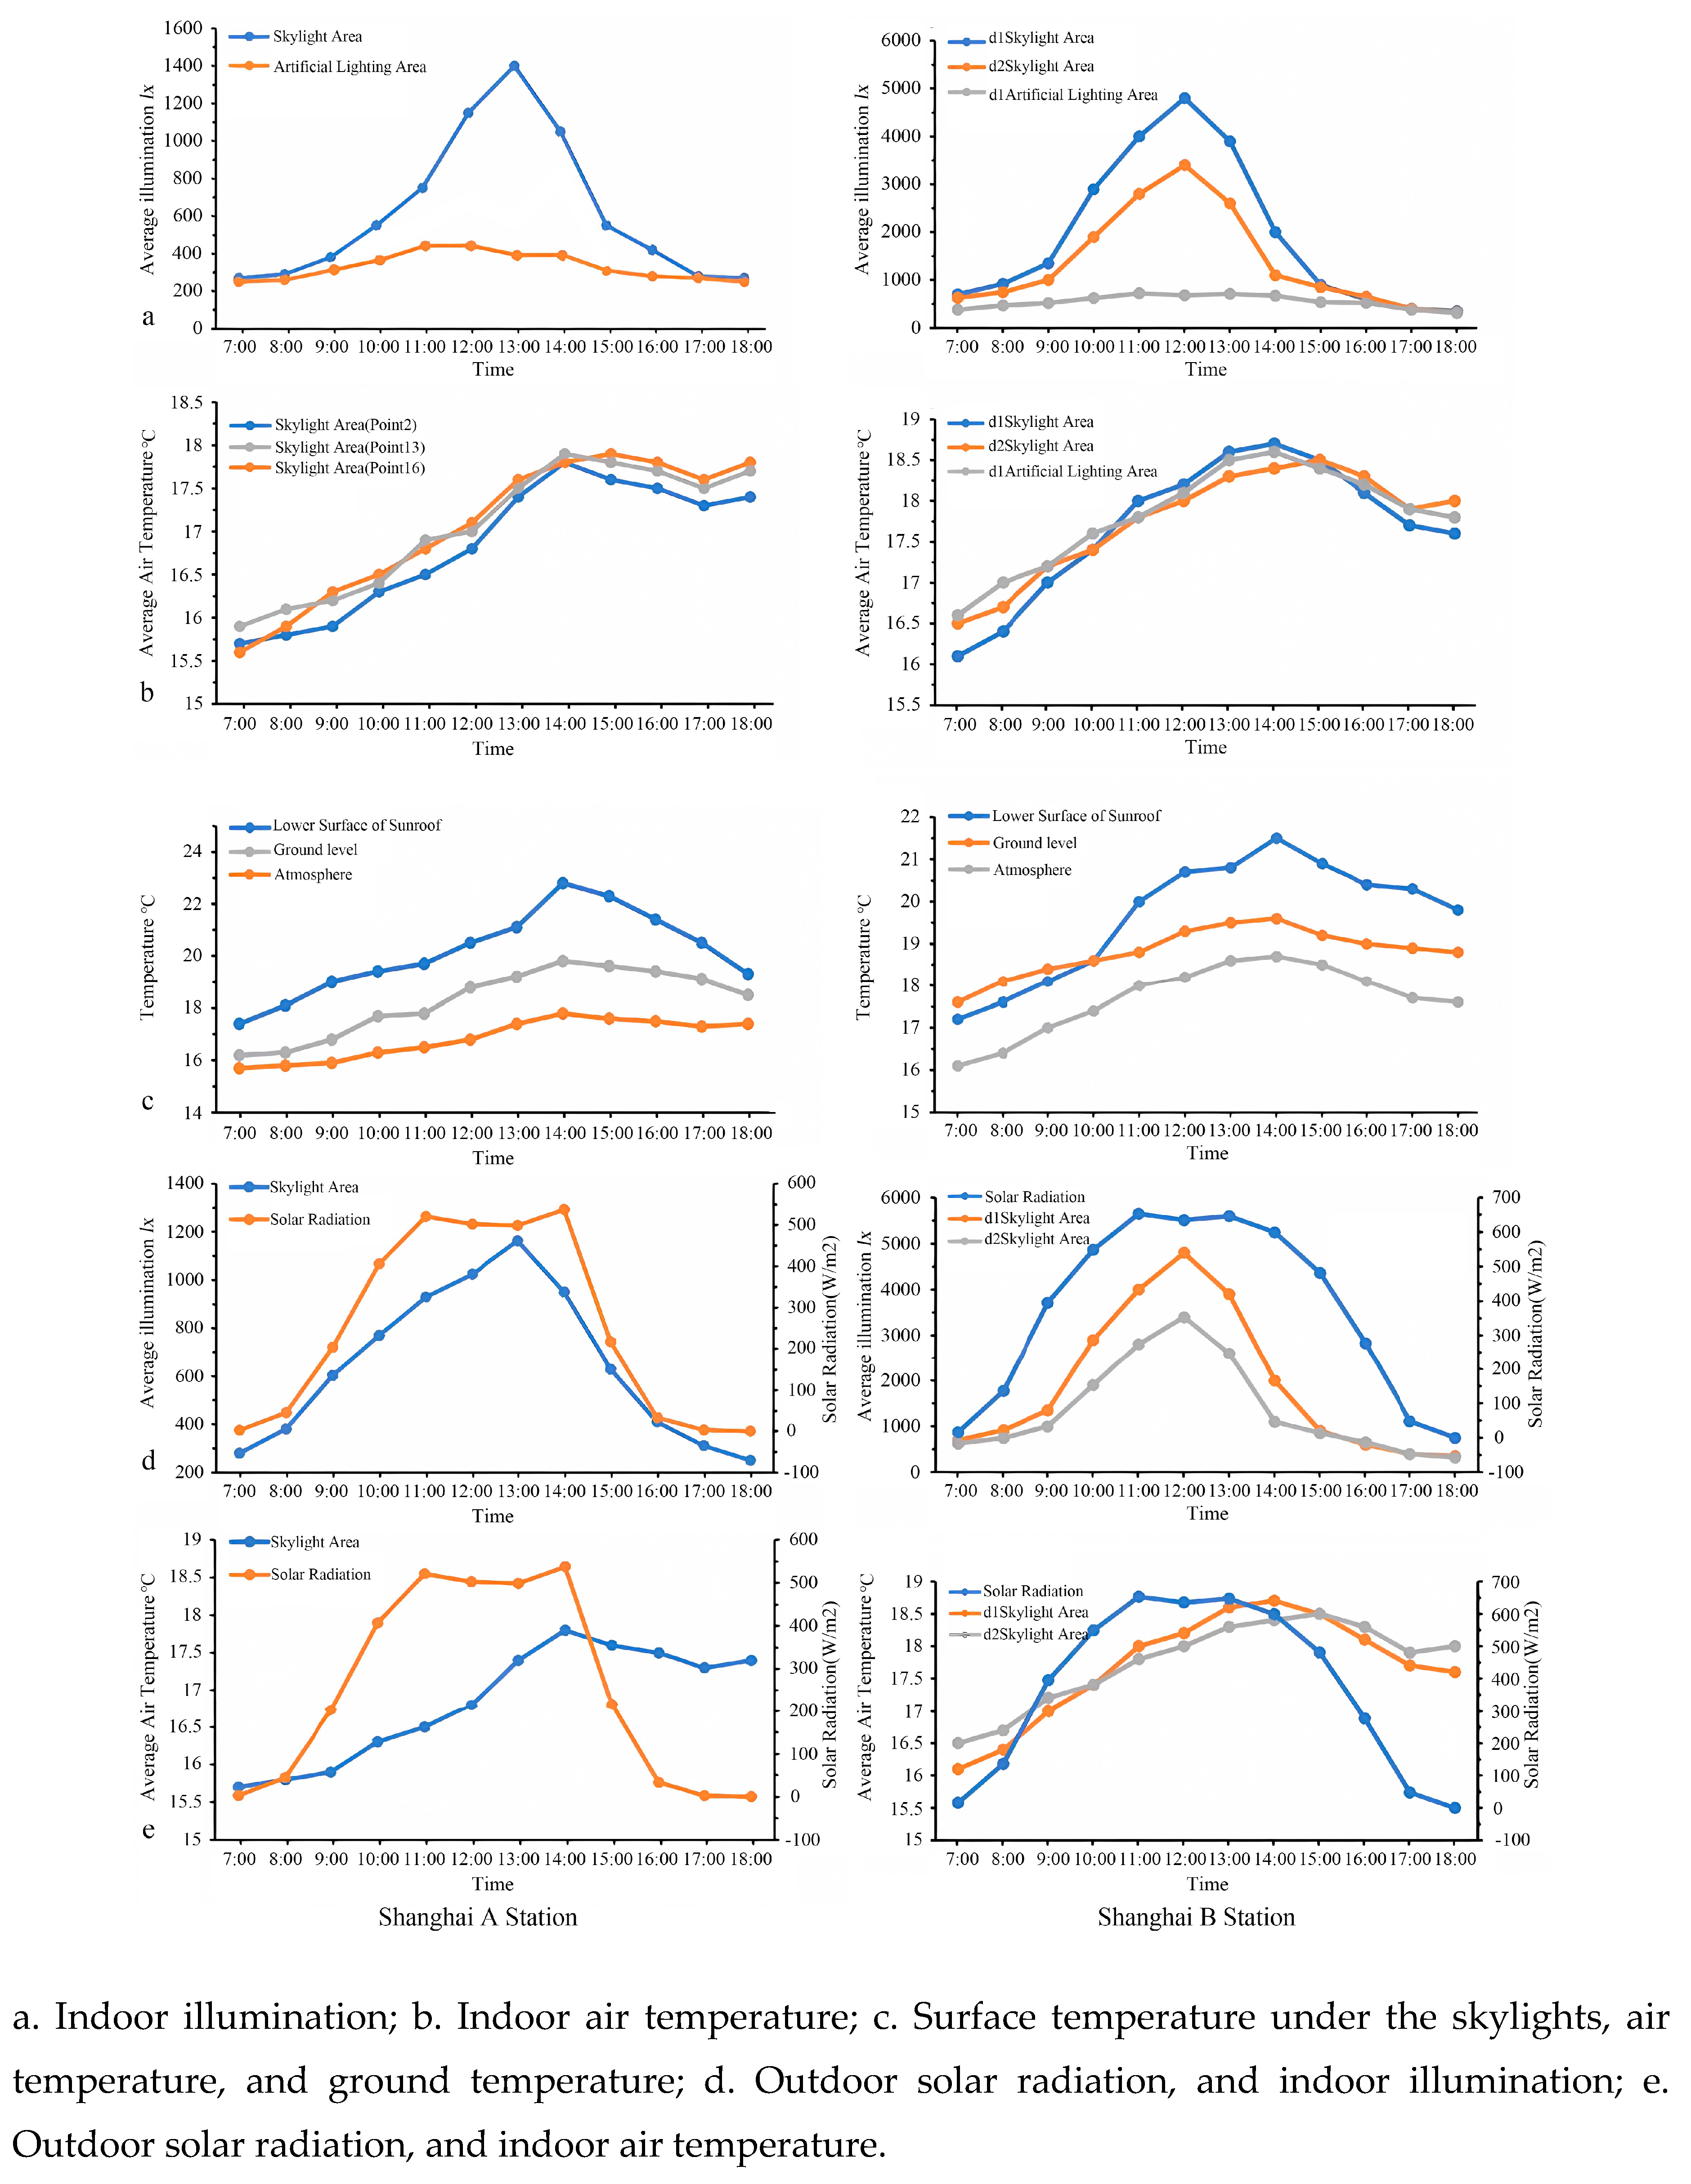
Figure 7.
Fitting relationship of combined energy consumption in the partitioned public area of sample 1.
Figure 7.
Fitting relationship of combined energy consumption in the partitioned public area of sample 1.
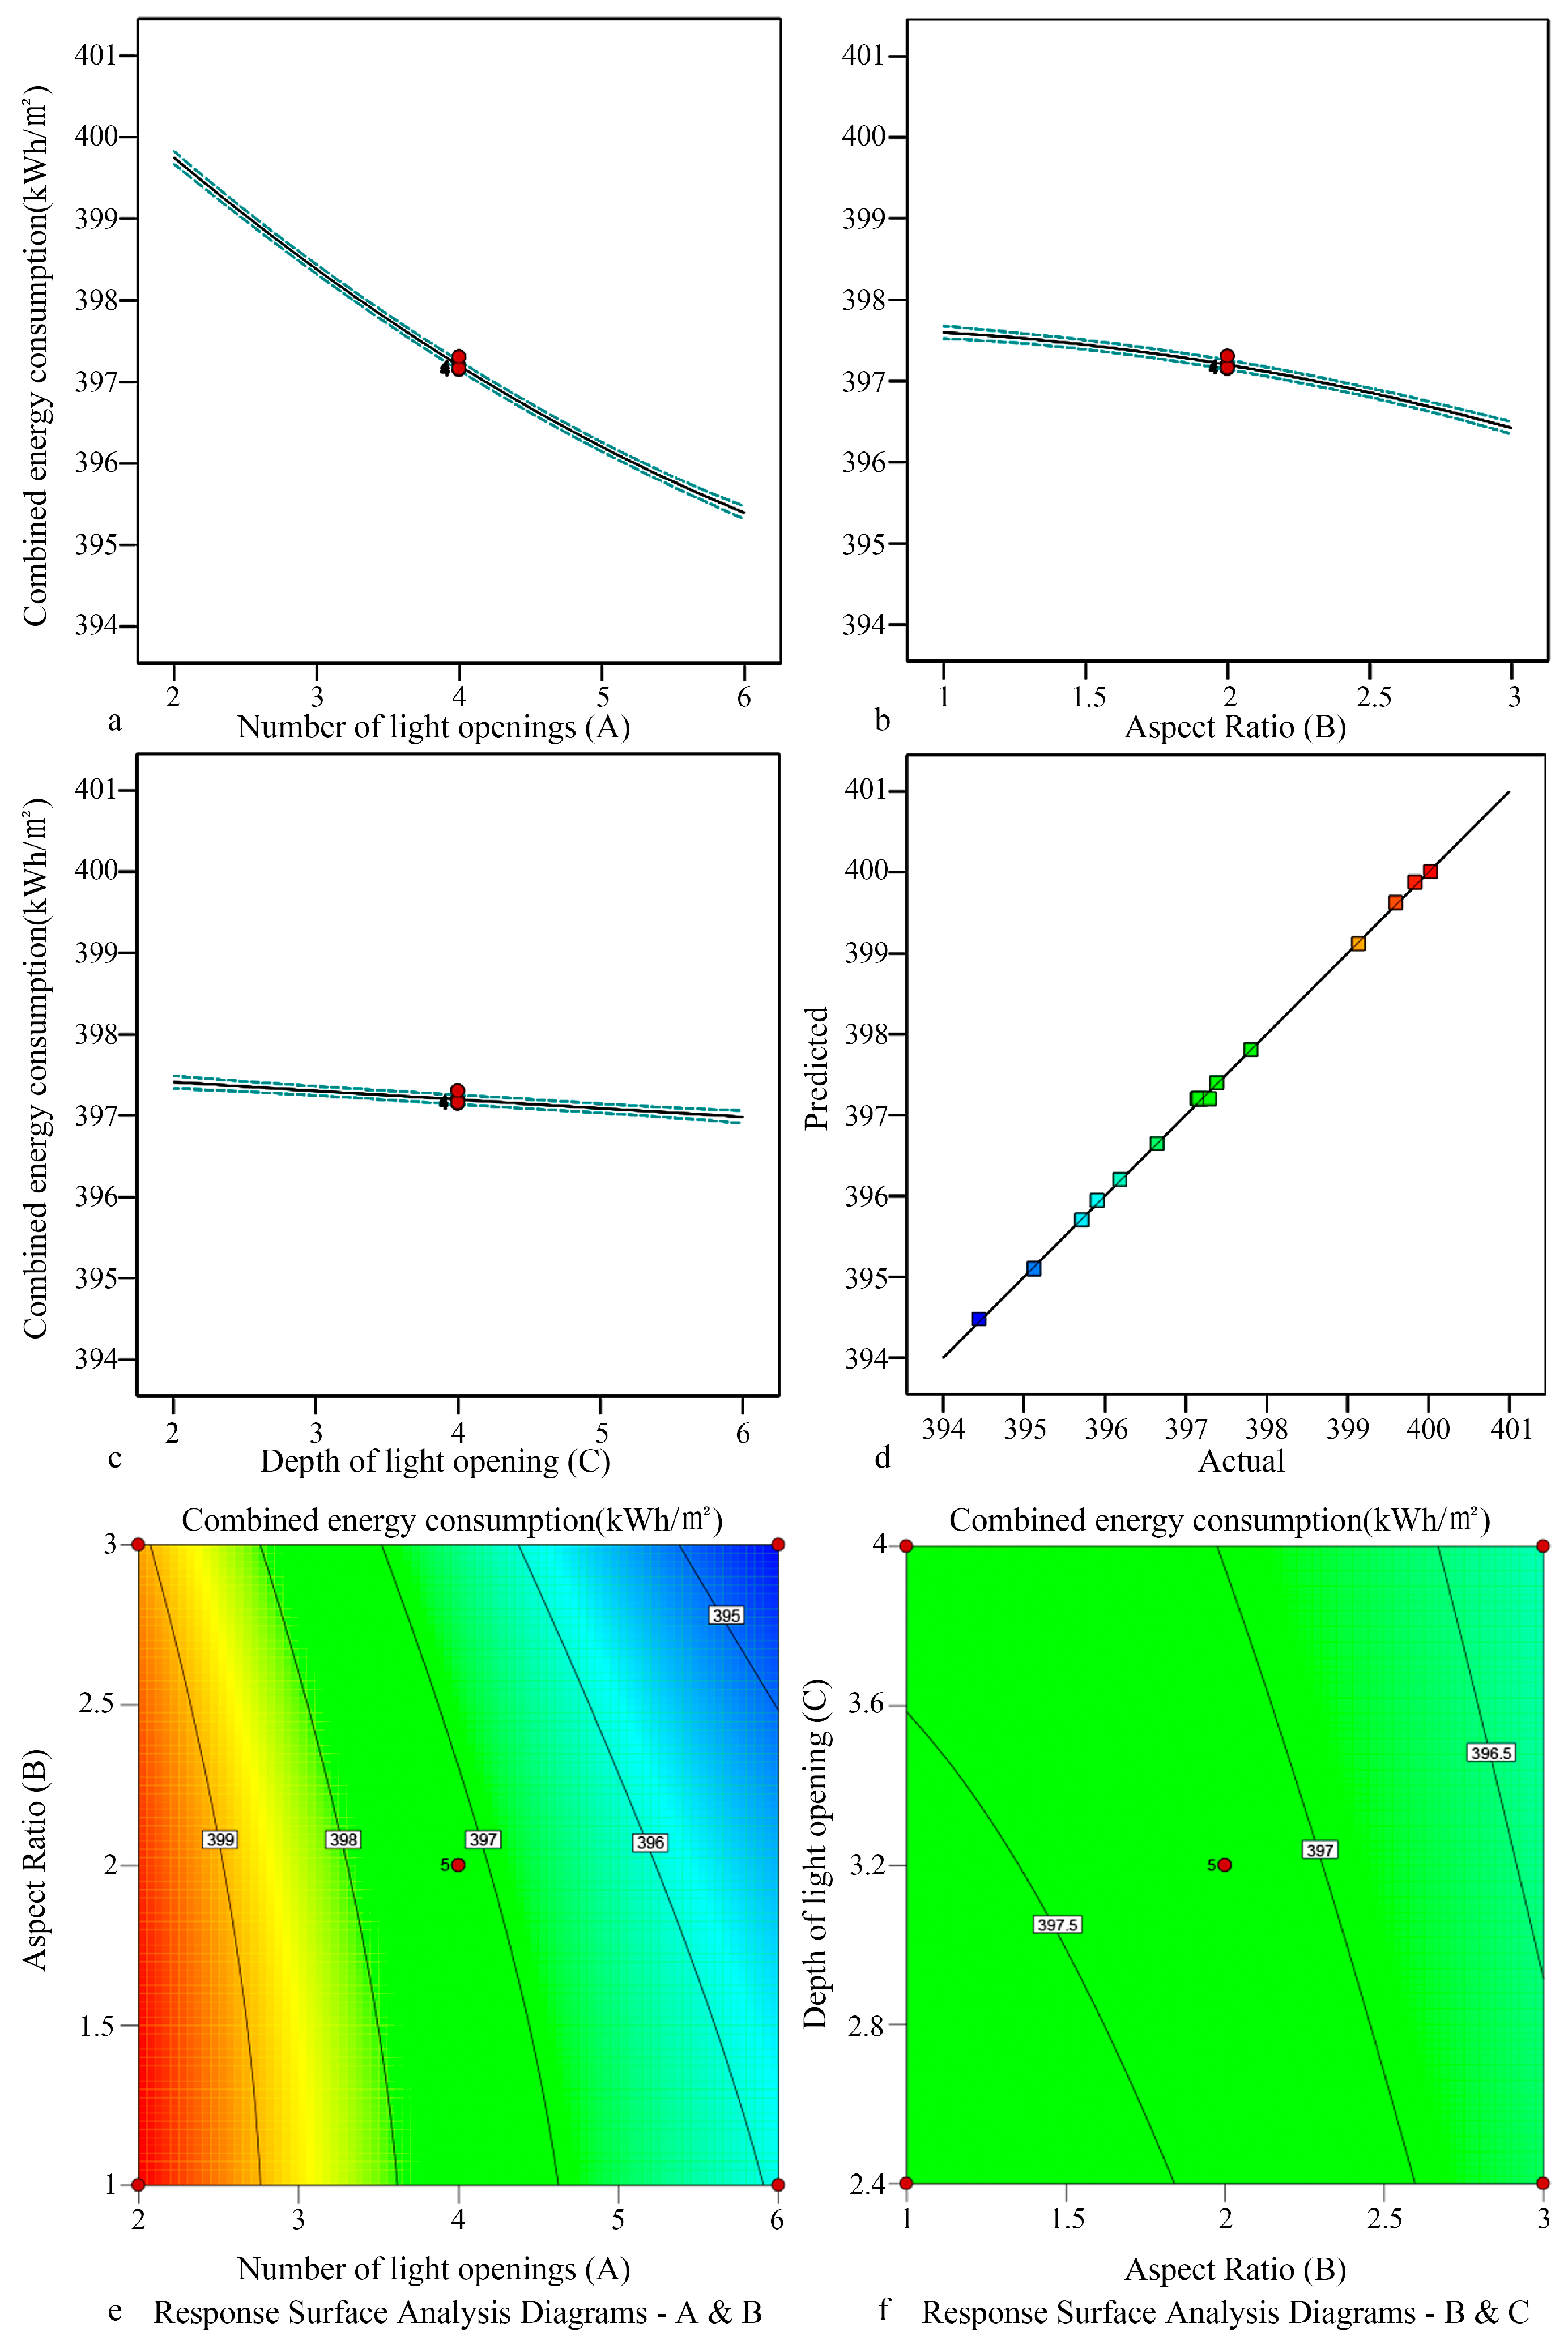
Figure 8.
Fitting relationship of combined energy consumption in the partitioned public area of sample 2.
Figure 8.
Fitting relationship of combined energy consumption in the partitioned public area of sample 2.
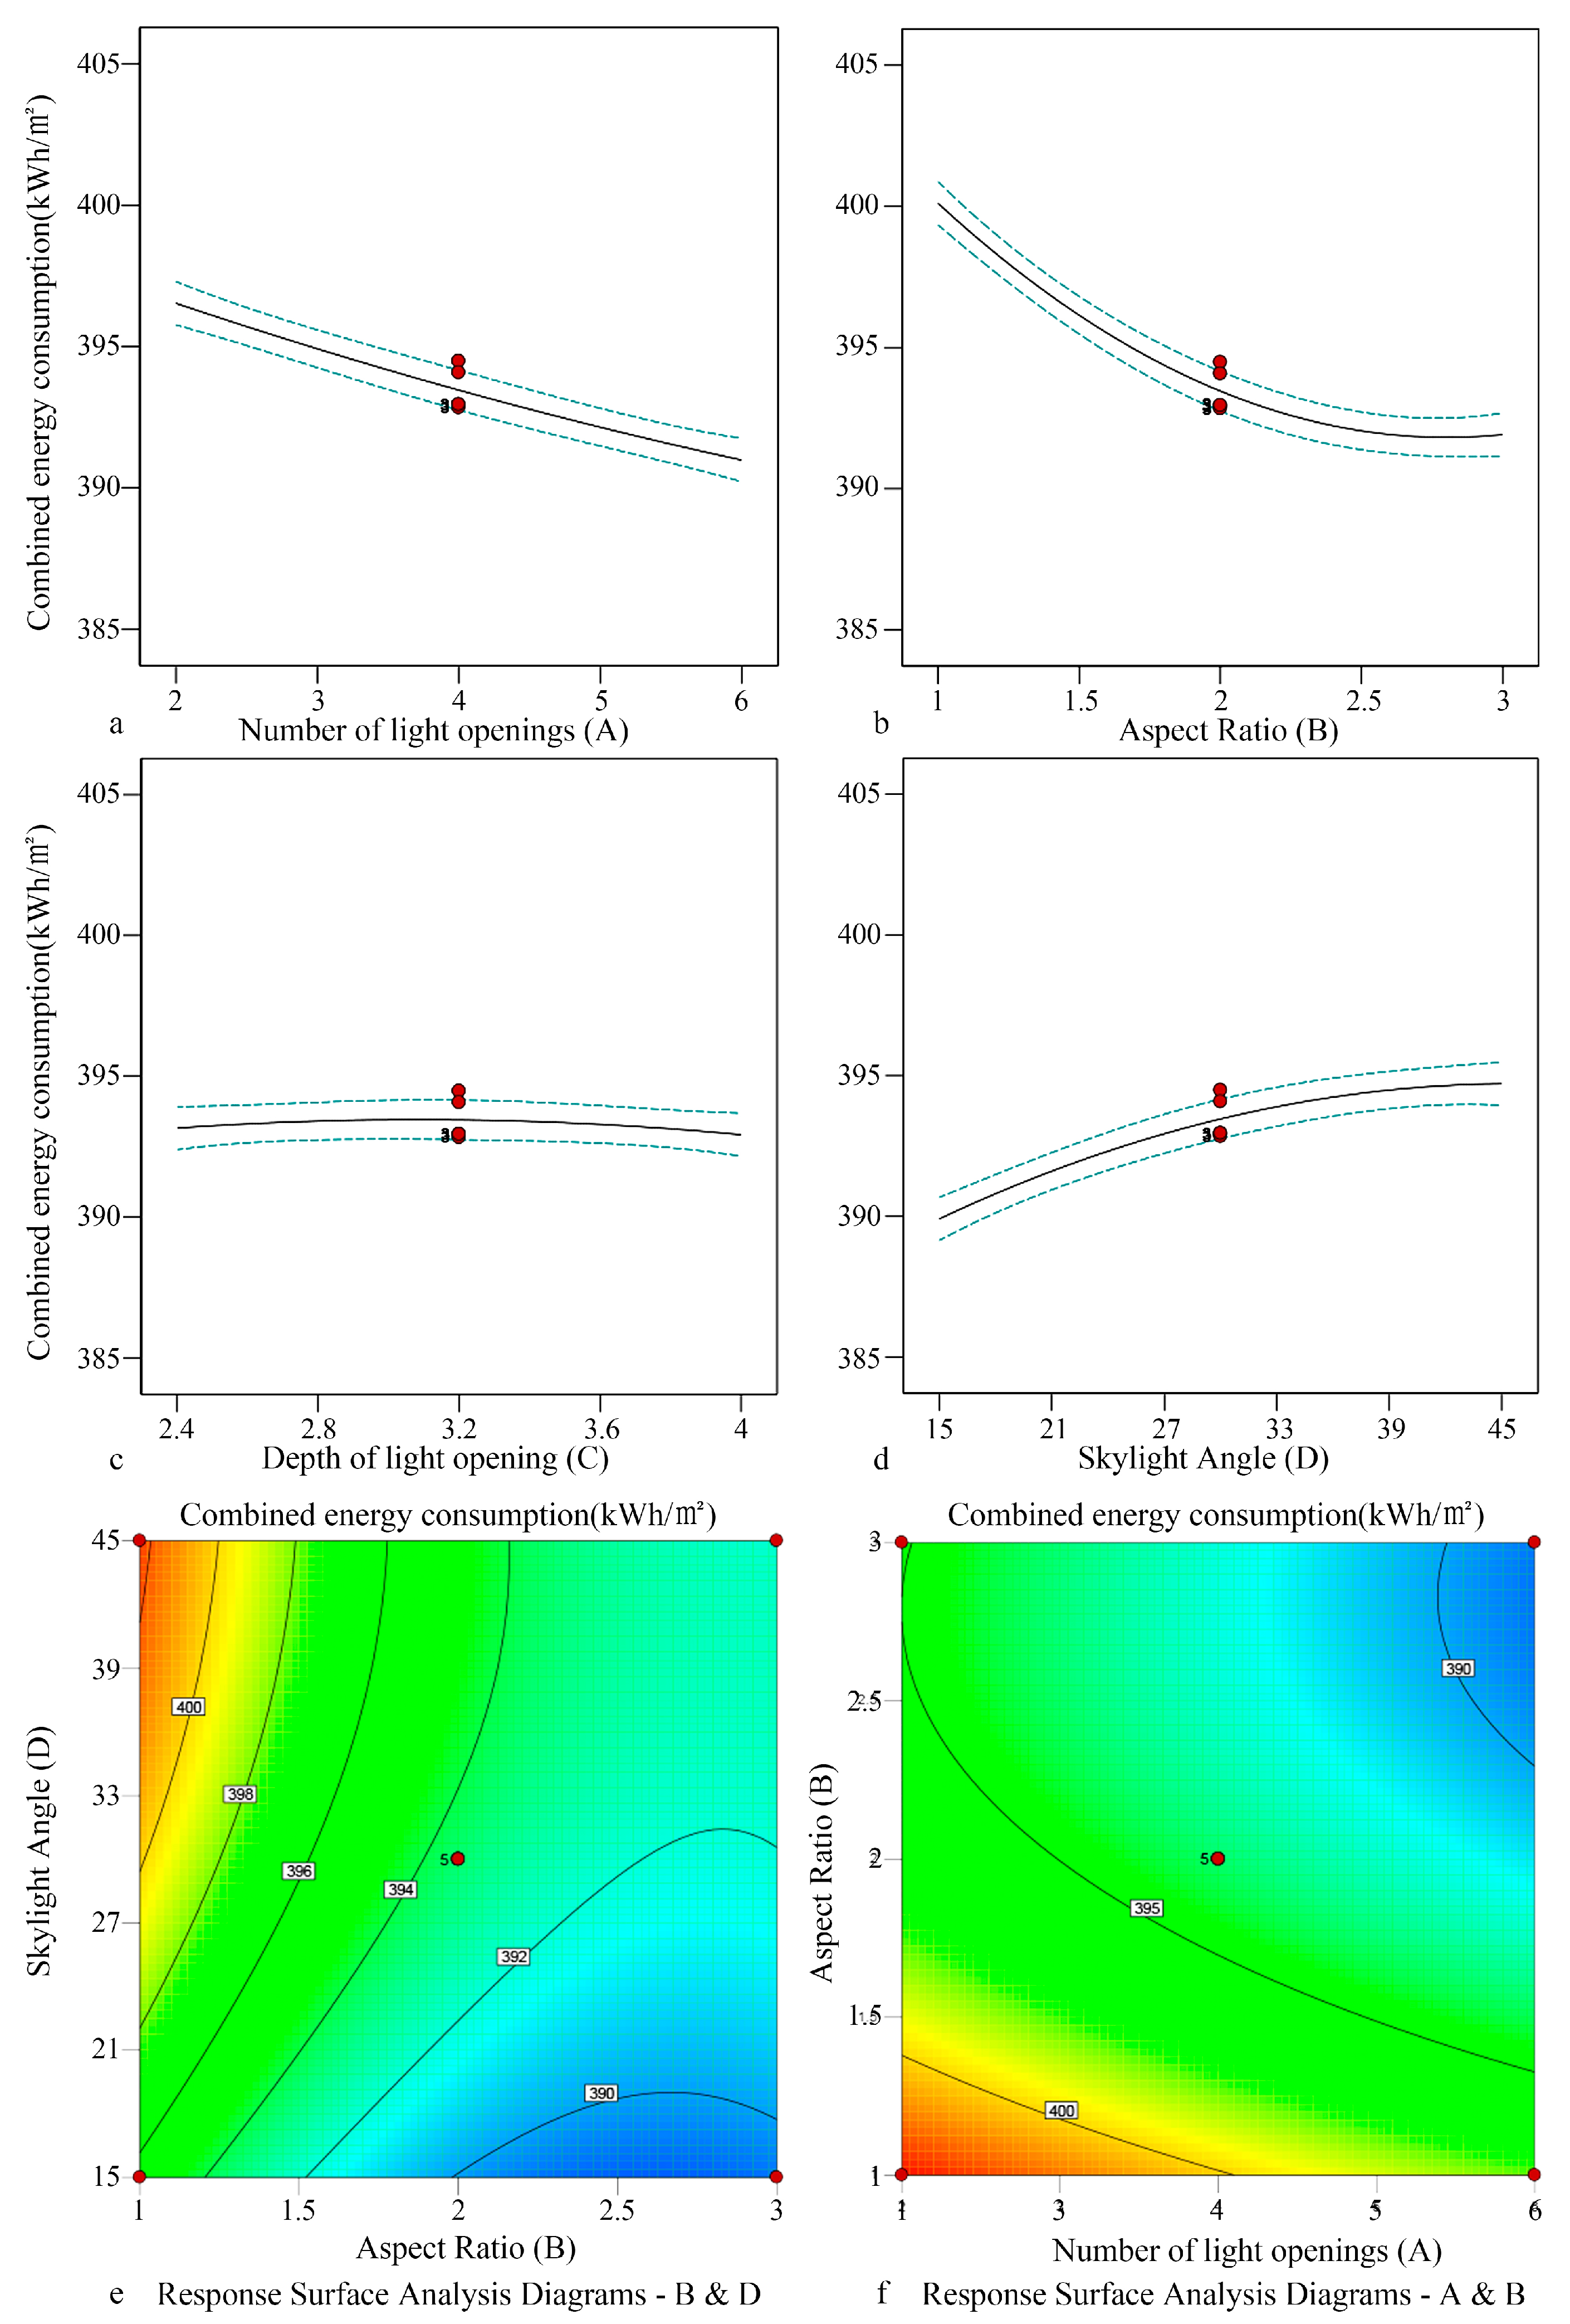
Figure 9.
Fitting relationship of combined energy consumption in the partitioned public area of sample 3.
Figure 9.
Fitting relationship of combined energy consumption in the partitioned public area of sample 3.
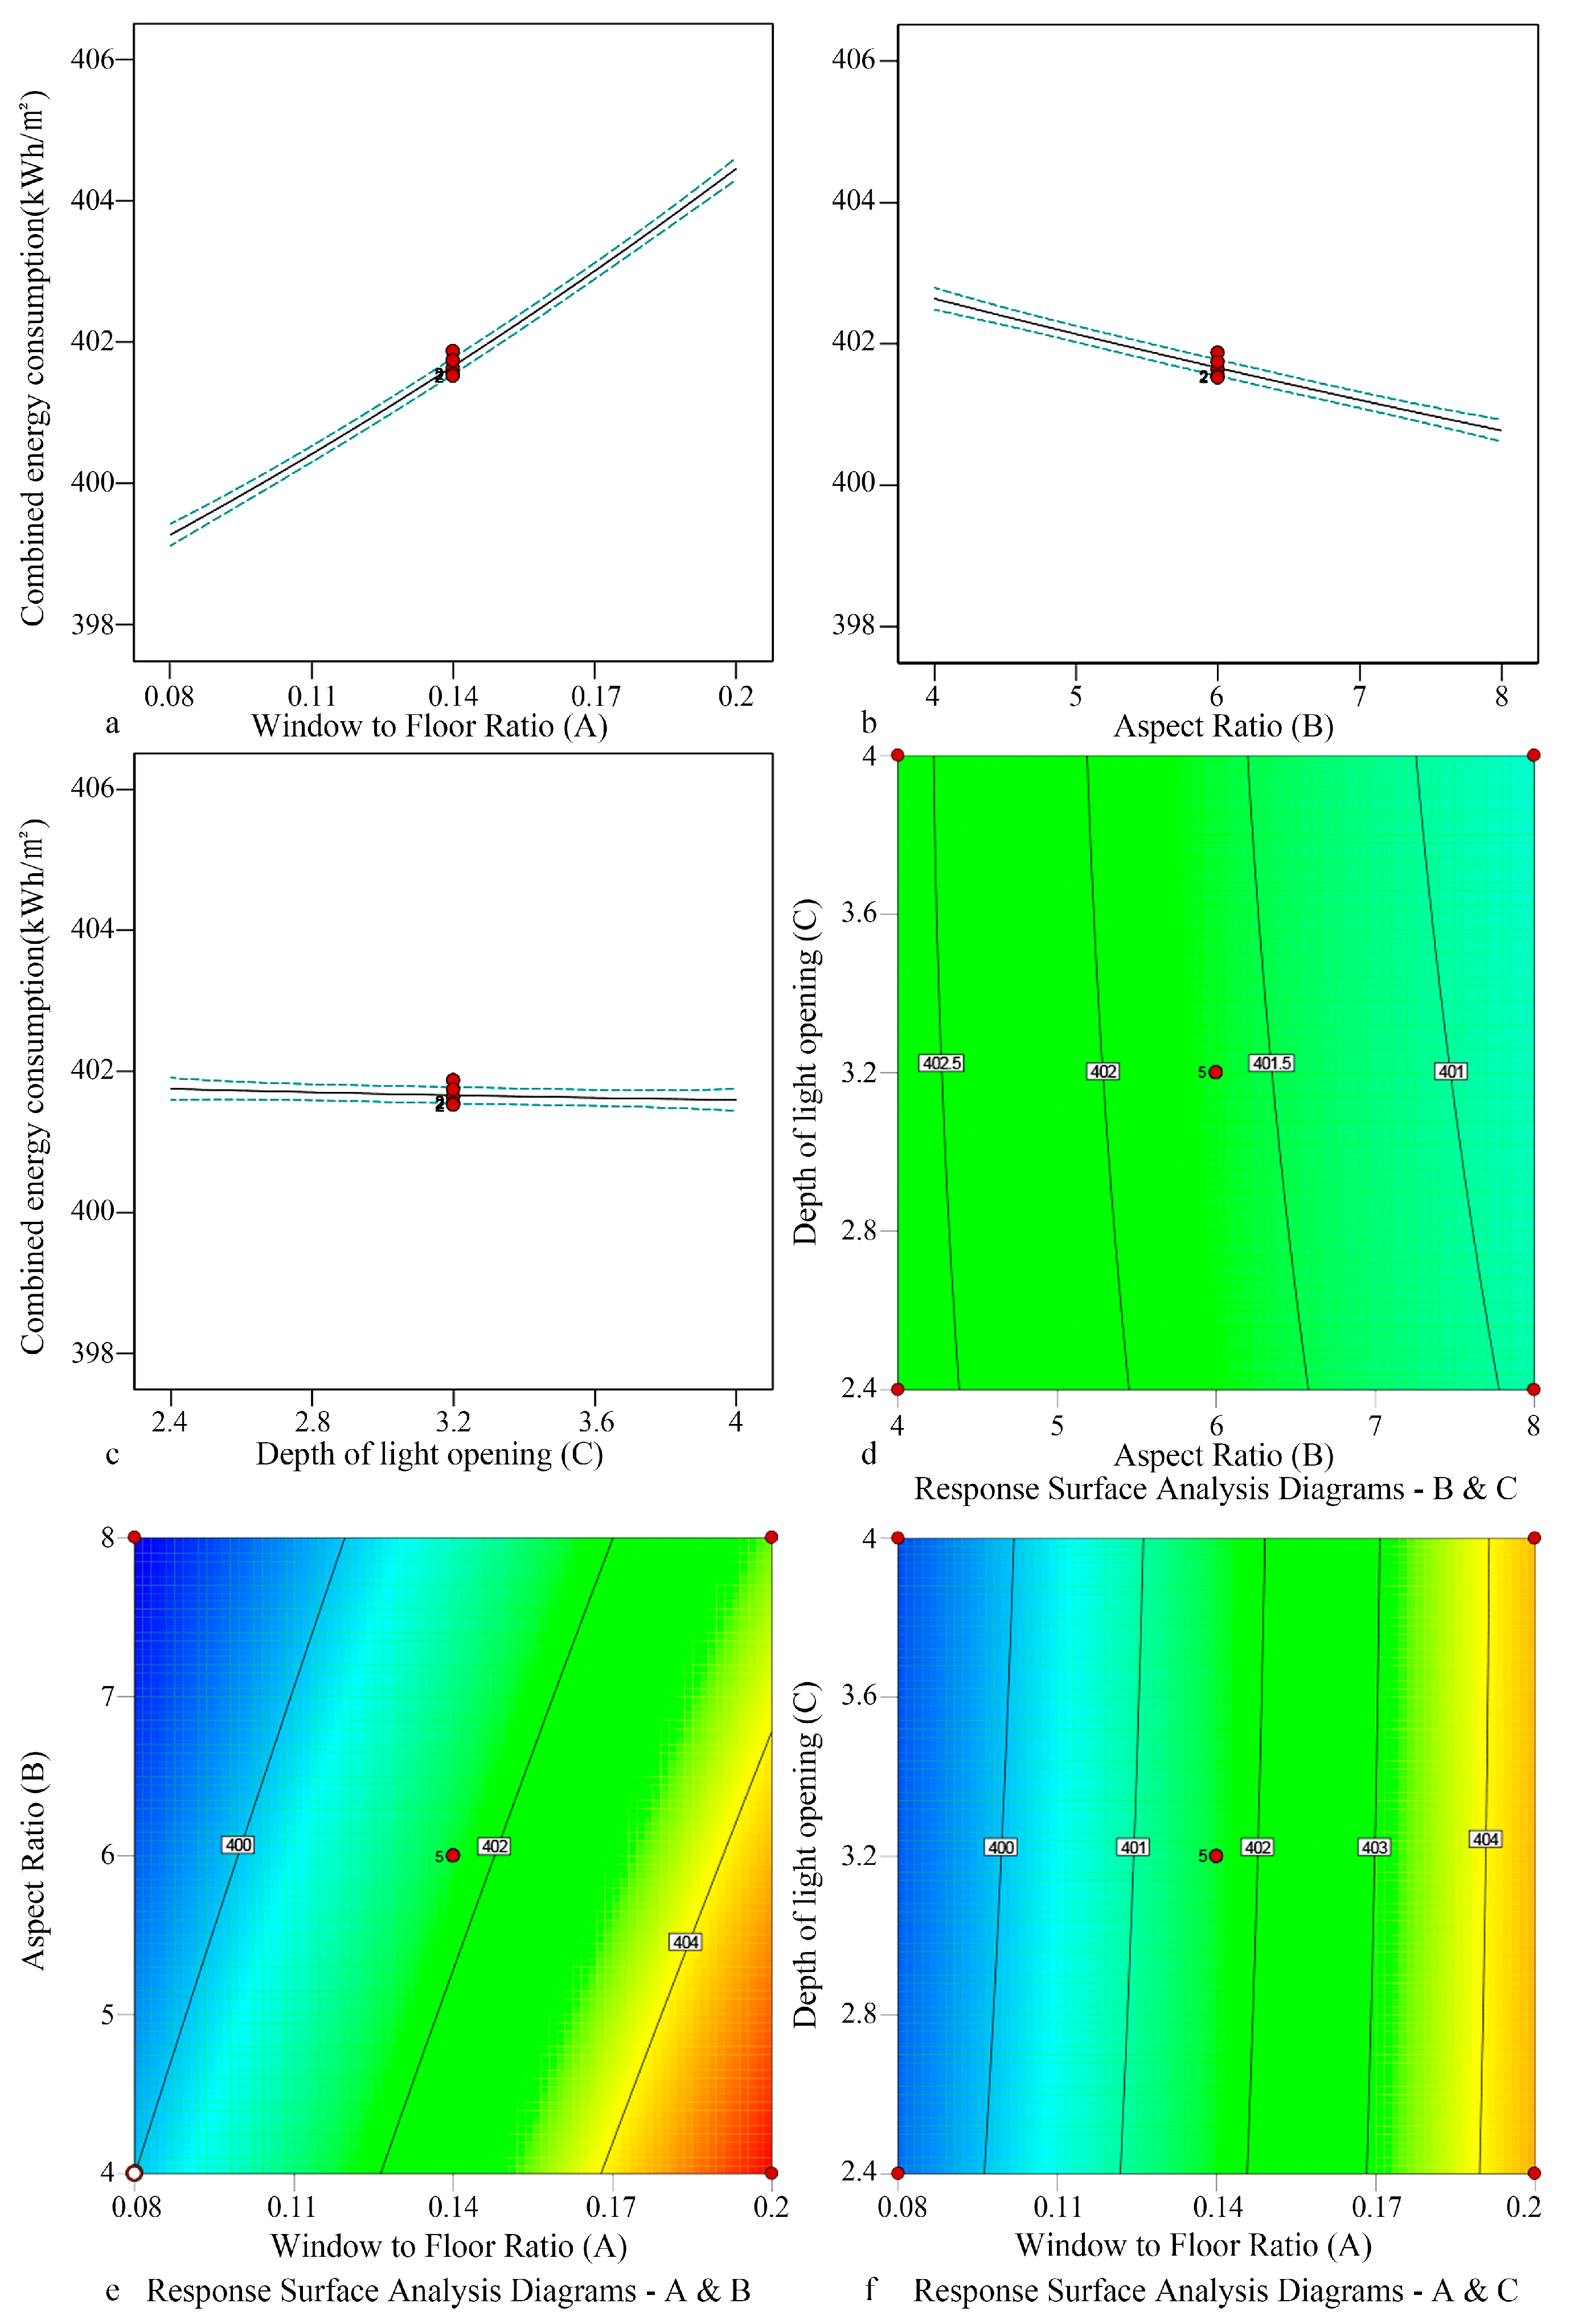
Figure 10.
Fitting relationship of combined energy consumption in the partitioned public area of sample 4.
Figure 10.
Fitting relationship of combined energy consumption in the partitioned public area of sample 4.
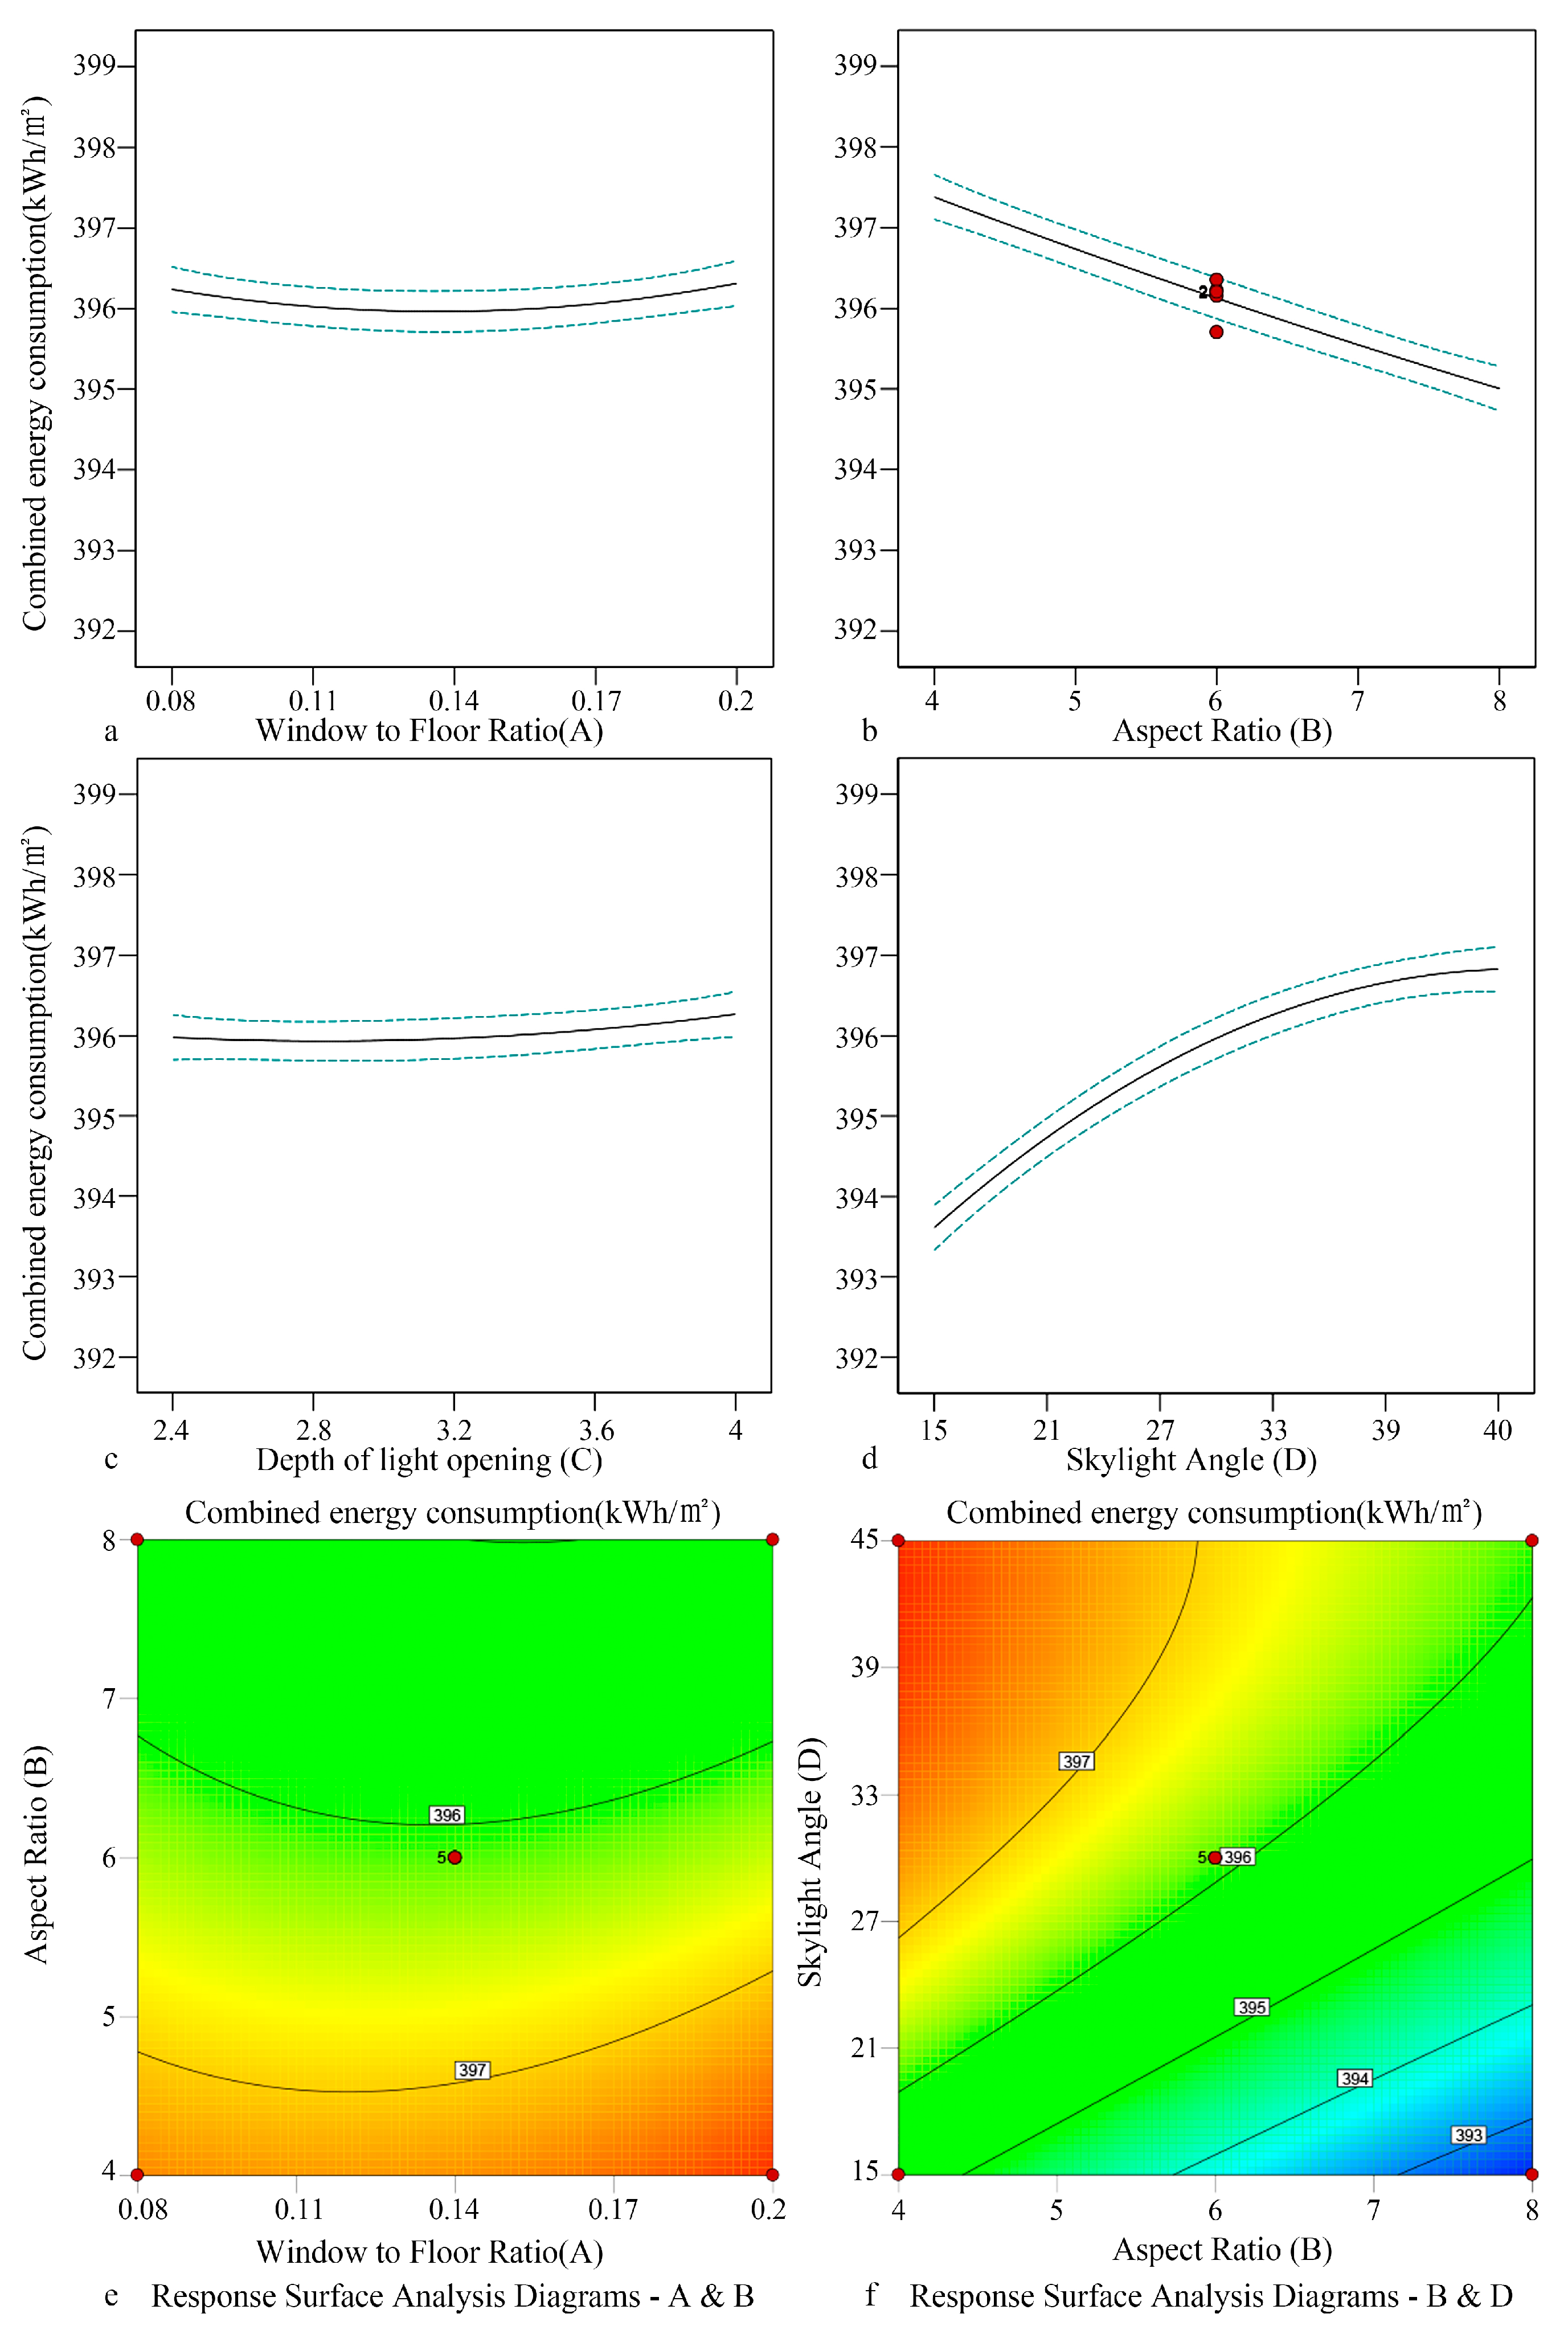
Figure 11.
Fitting relationship of combined energy consumption in the partitioned public area of sample 5.
Figure 11.
Fitting relationship of combined energy consumption in the partitioned public area of sample 5.
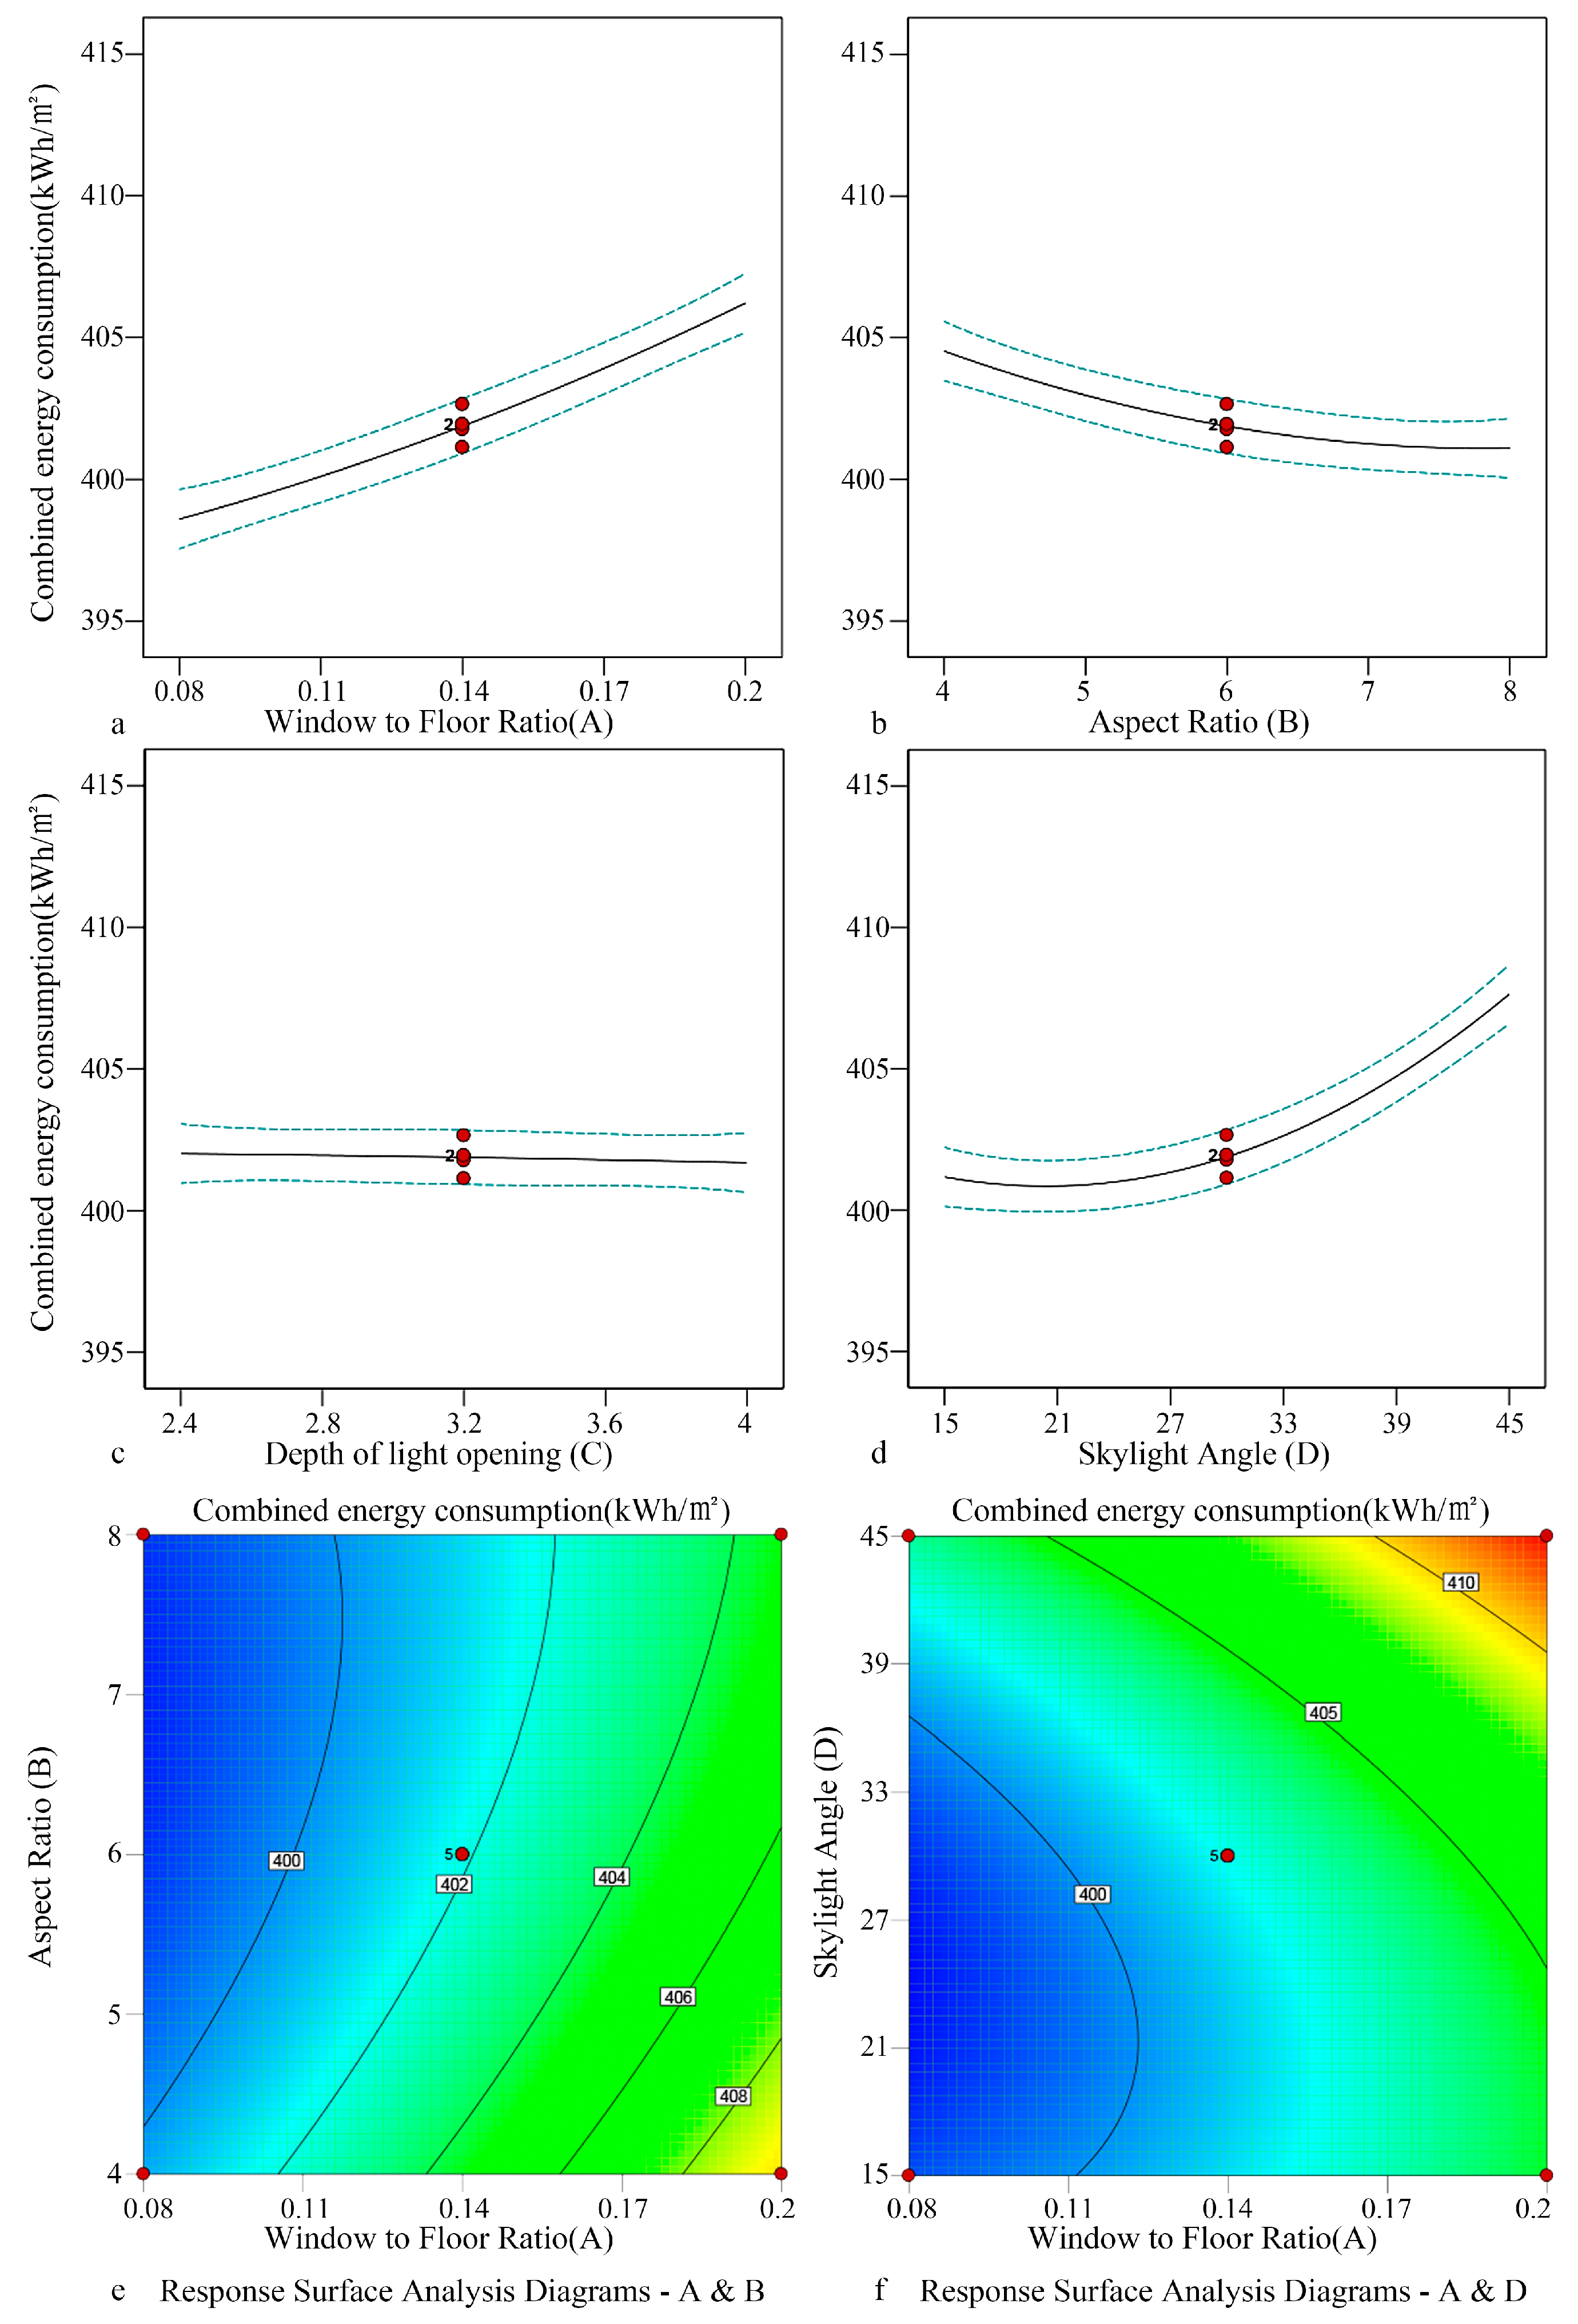
Figure 12.
Fitting relationship of combined energy consumption in the through-atrium public area of sample 1.
Figure 12.
Fitting relationship of combined energy consumption in the through-atrium public area of sample 1.
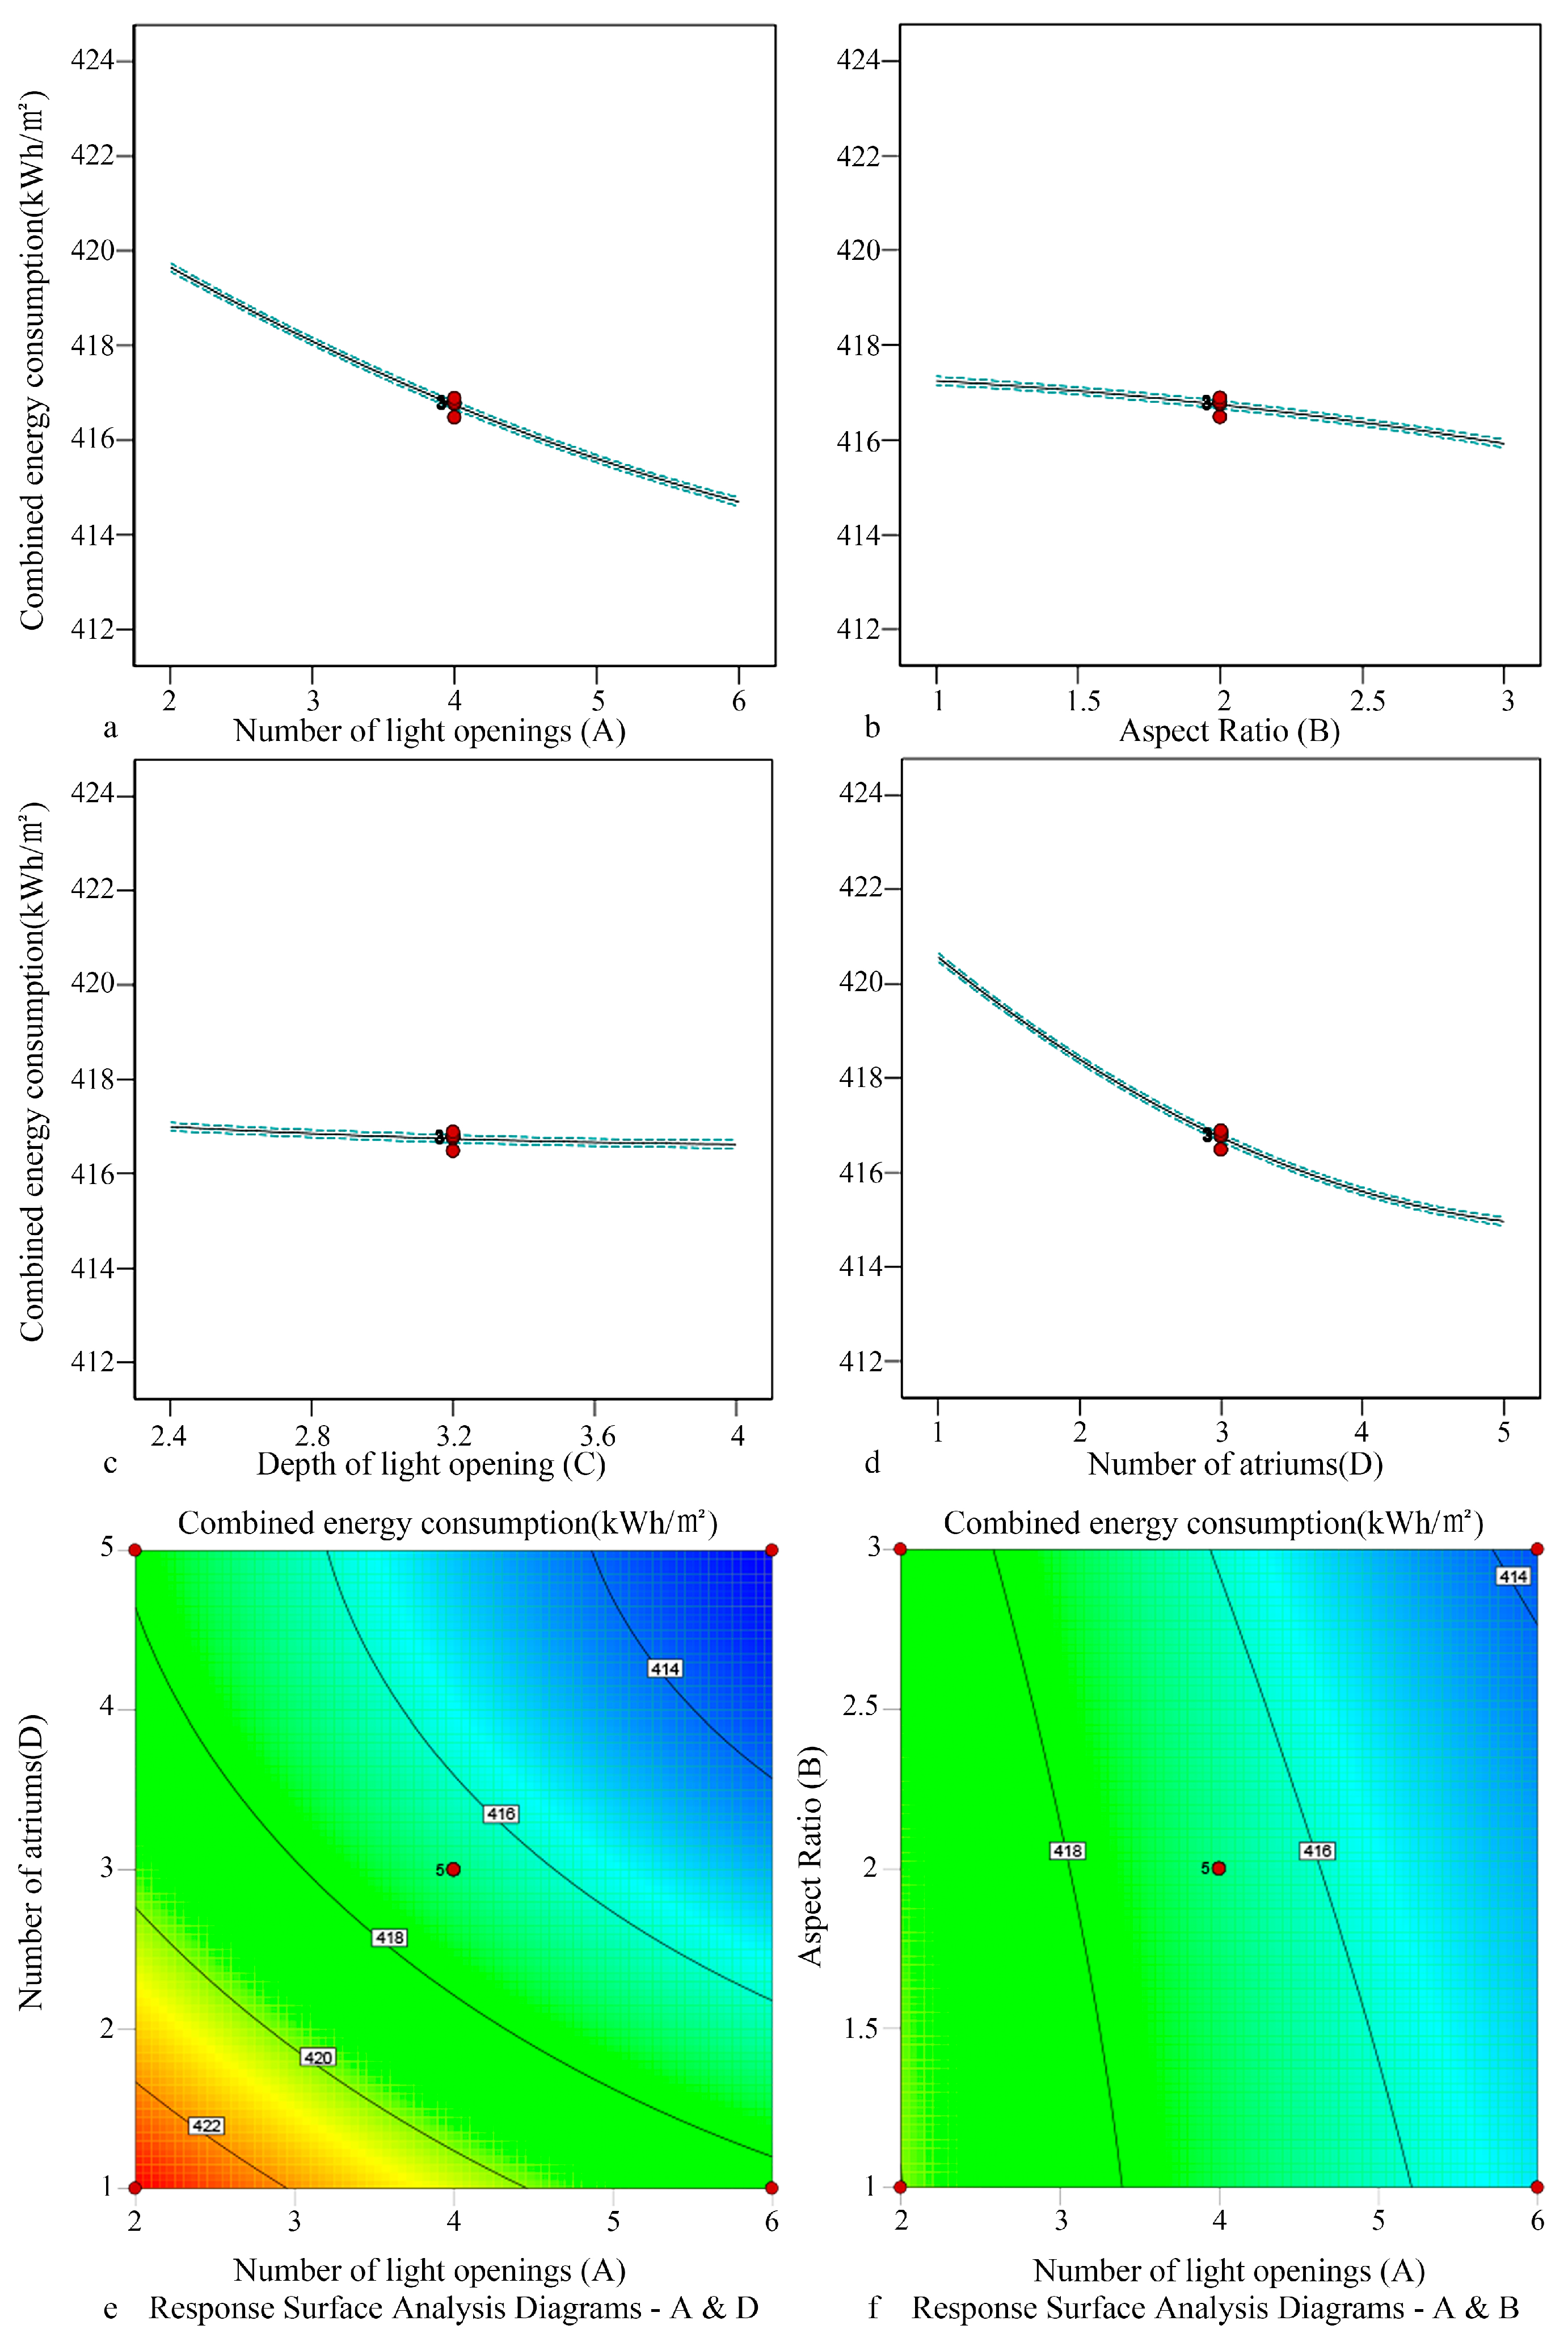
Figure 13.
Fitting relationship of combined energy consumption in the through-atrium public area of sample 2.
Figure 13.
Fitting relationship of combined energy consumption in the through-atrium public area of sample 2.
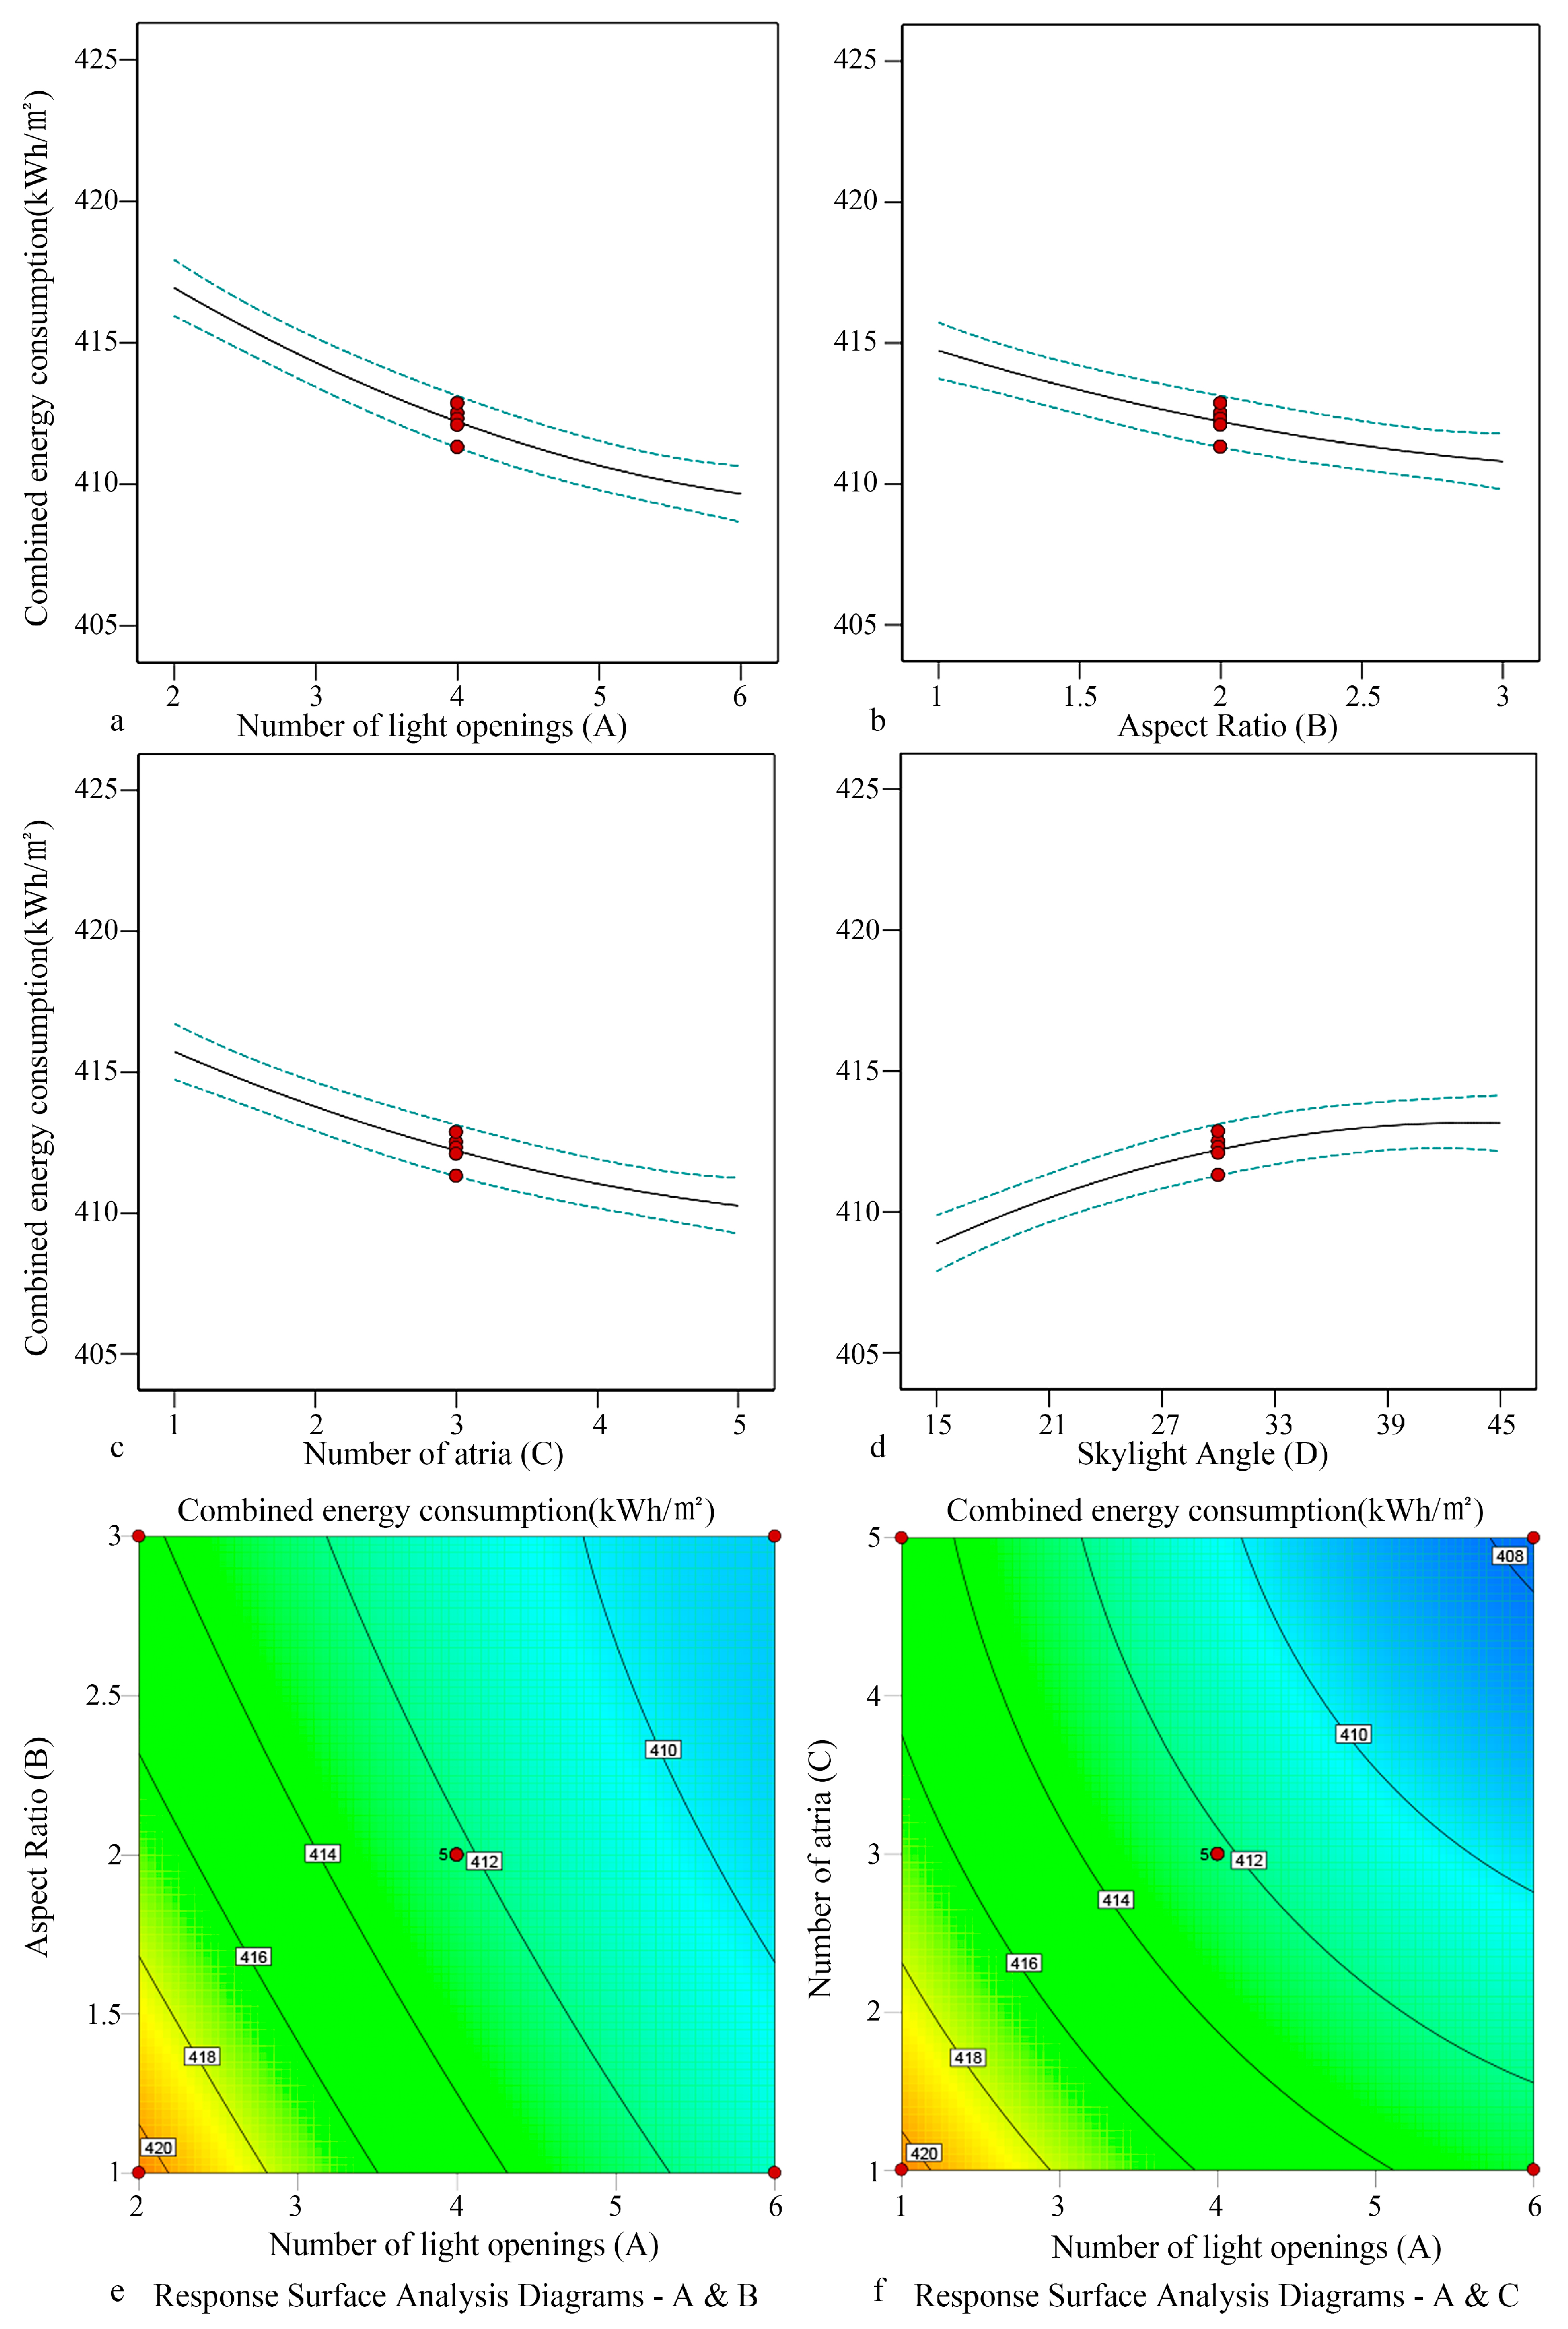
Figure 14.
Fitting relationship of combined energy consumption in the through-atrium public area of sample 3.
Figure 14.
Fitting relationship of combined energy consumption in the through-atrium public area of sample 3.
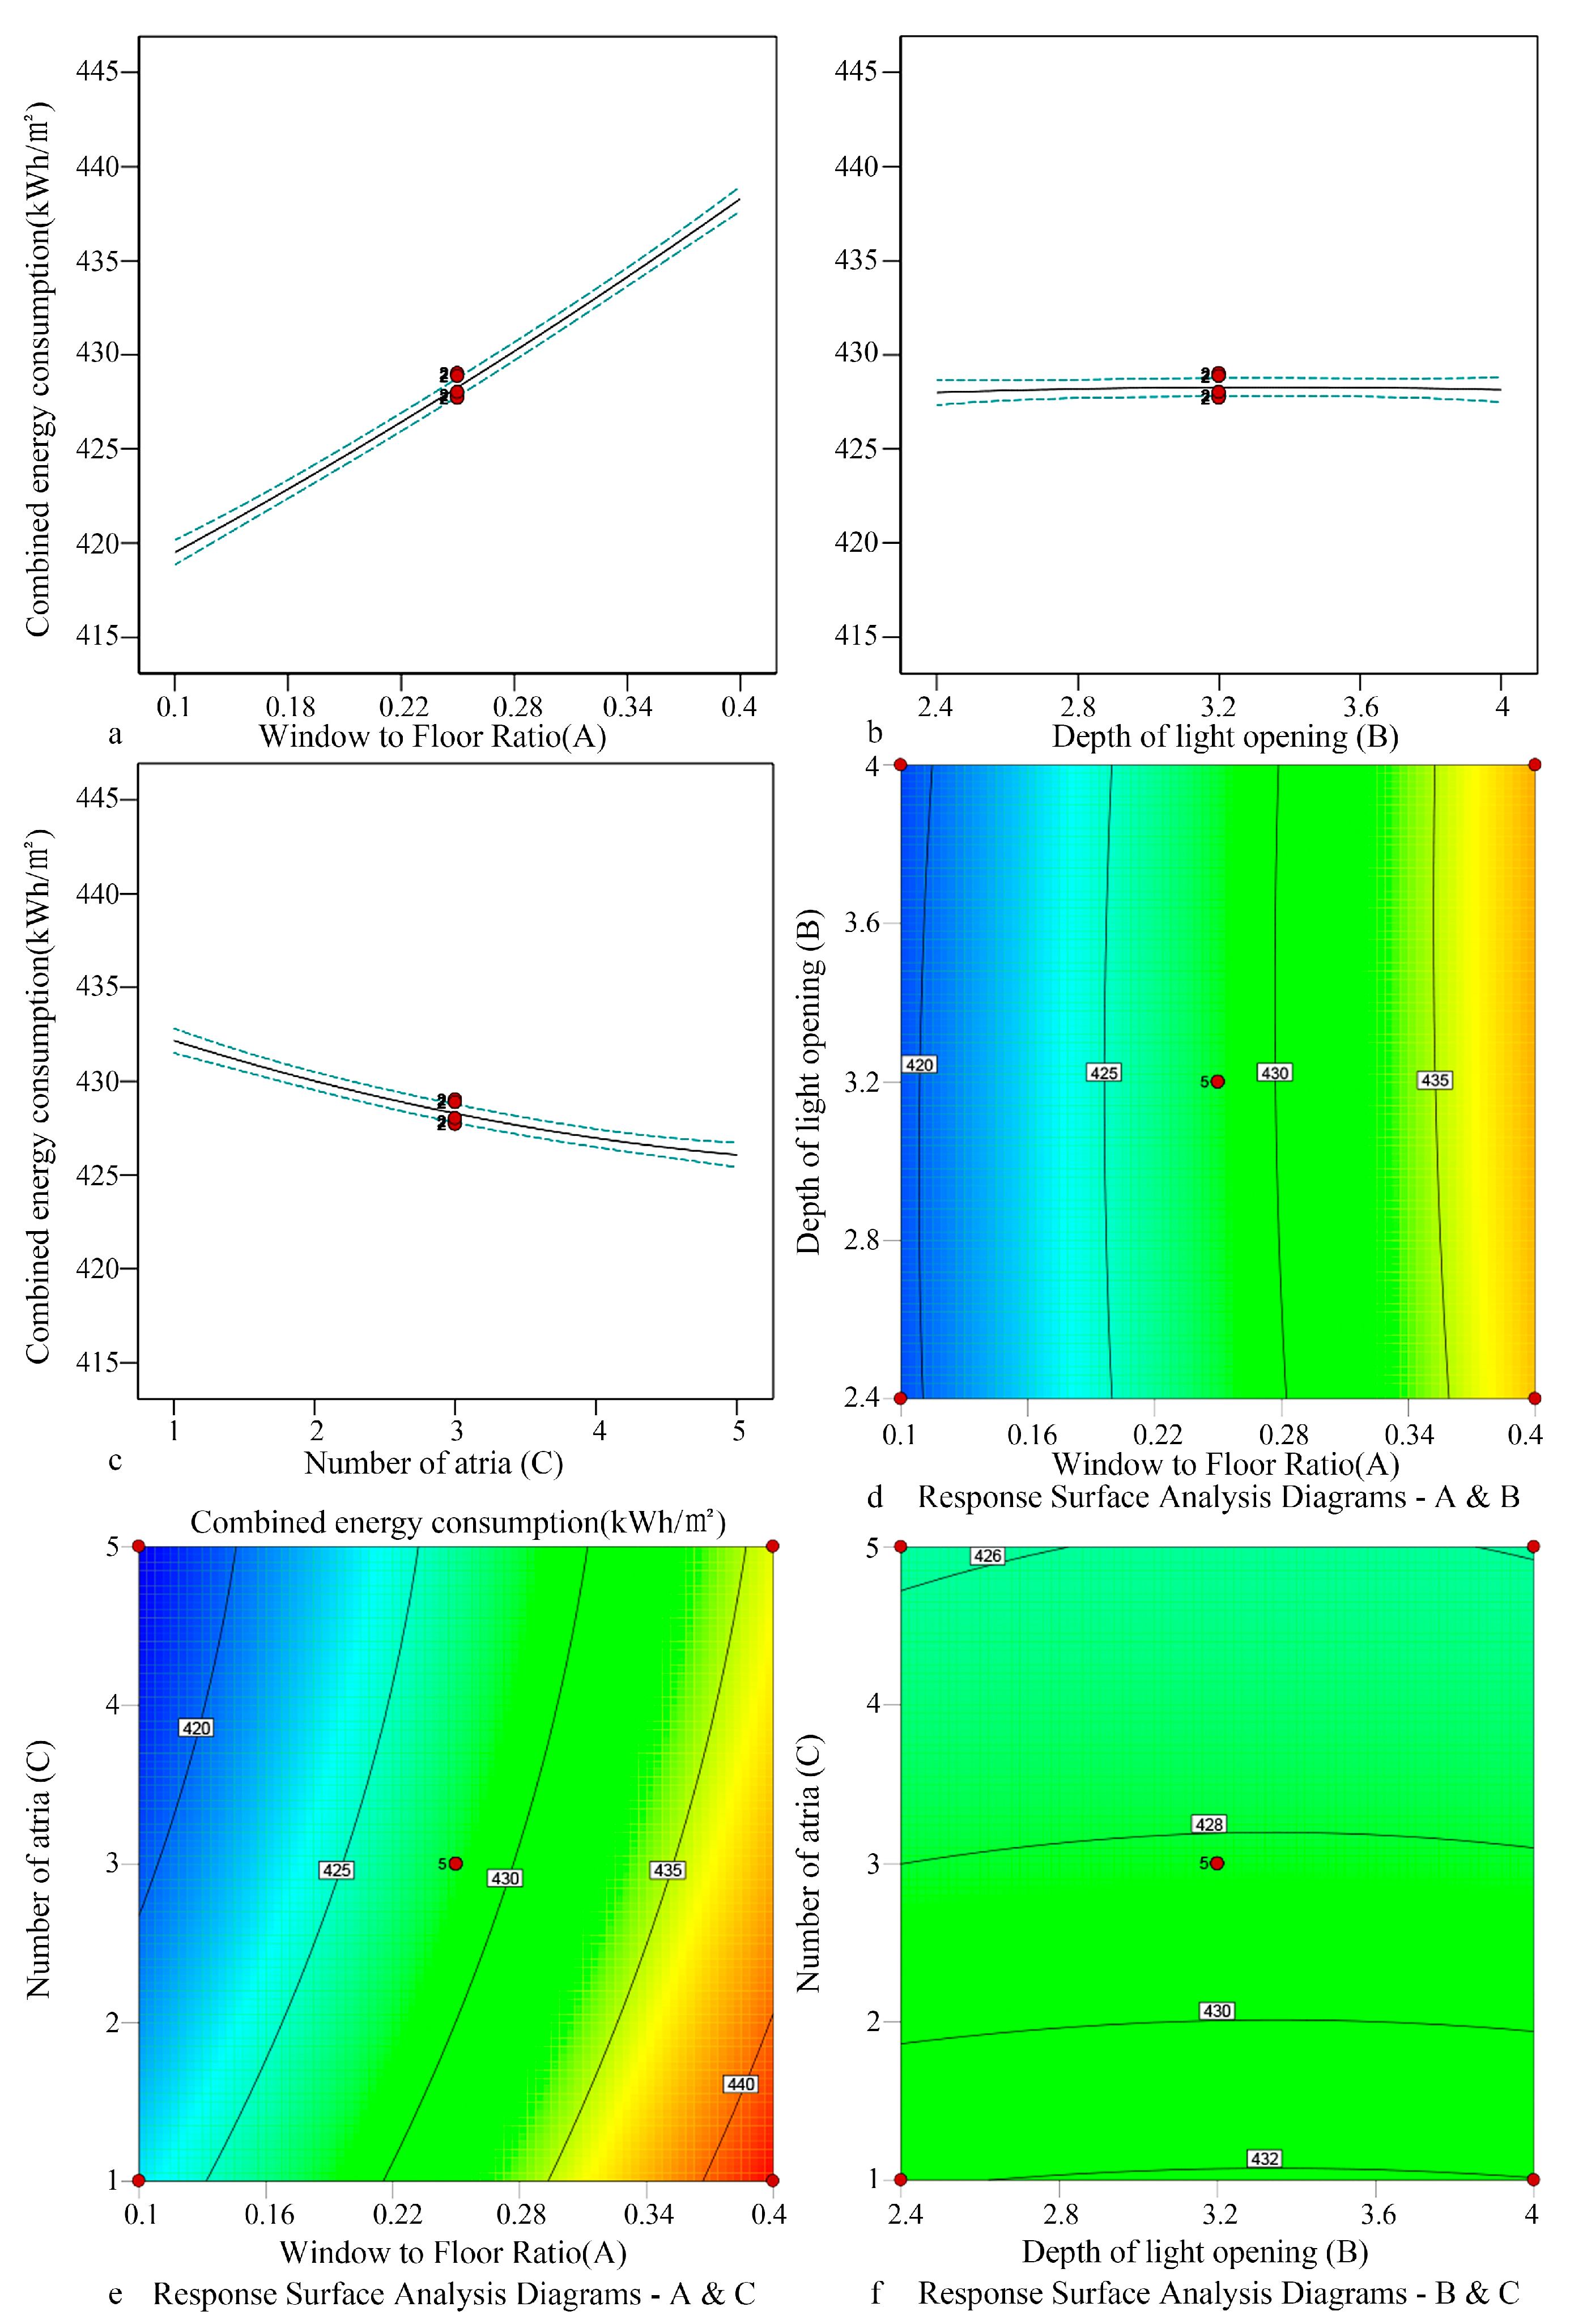
Figure 15.
Fitting relationship of combined energy consumption in the through-atrium public area of sample 4.
Figure 15.
Fitting relationship of combined energy consumption in the through-atrium public area of sample 4.
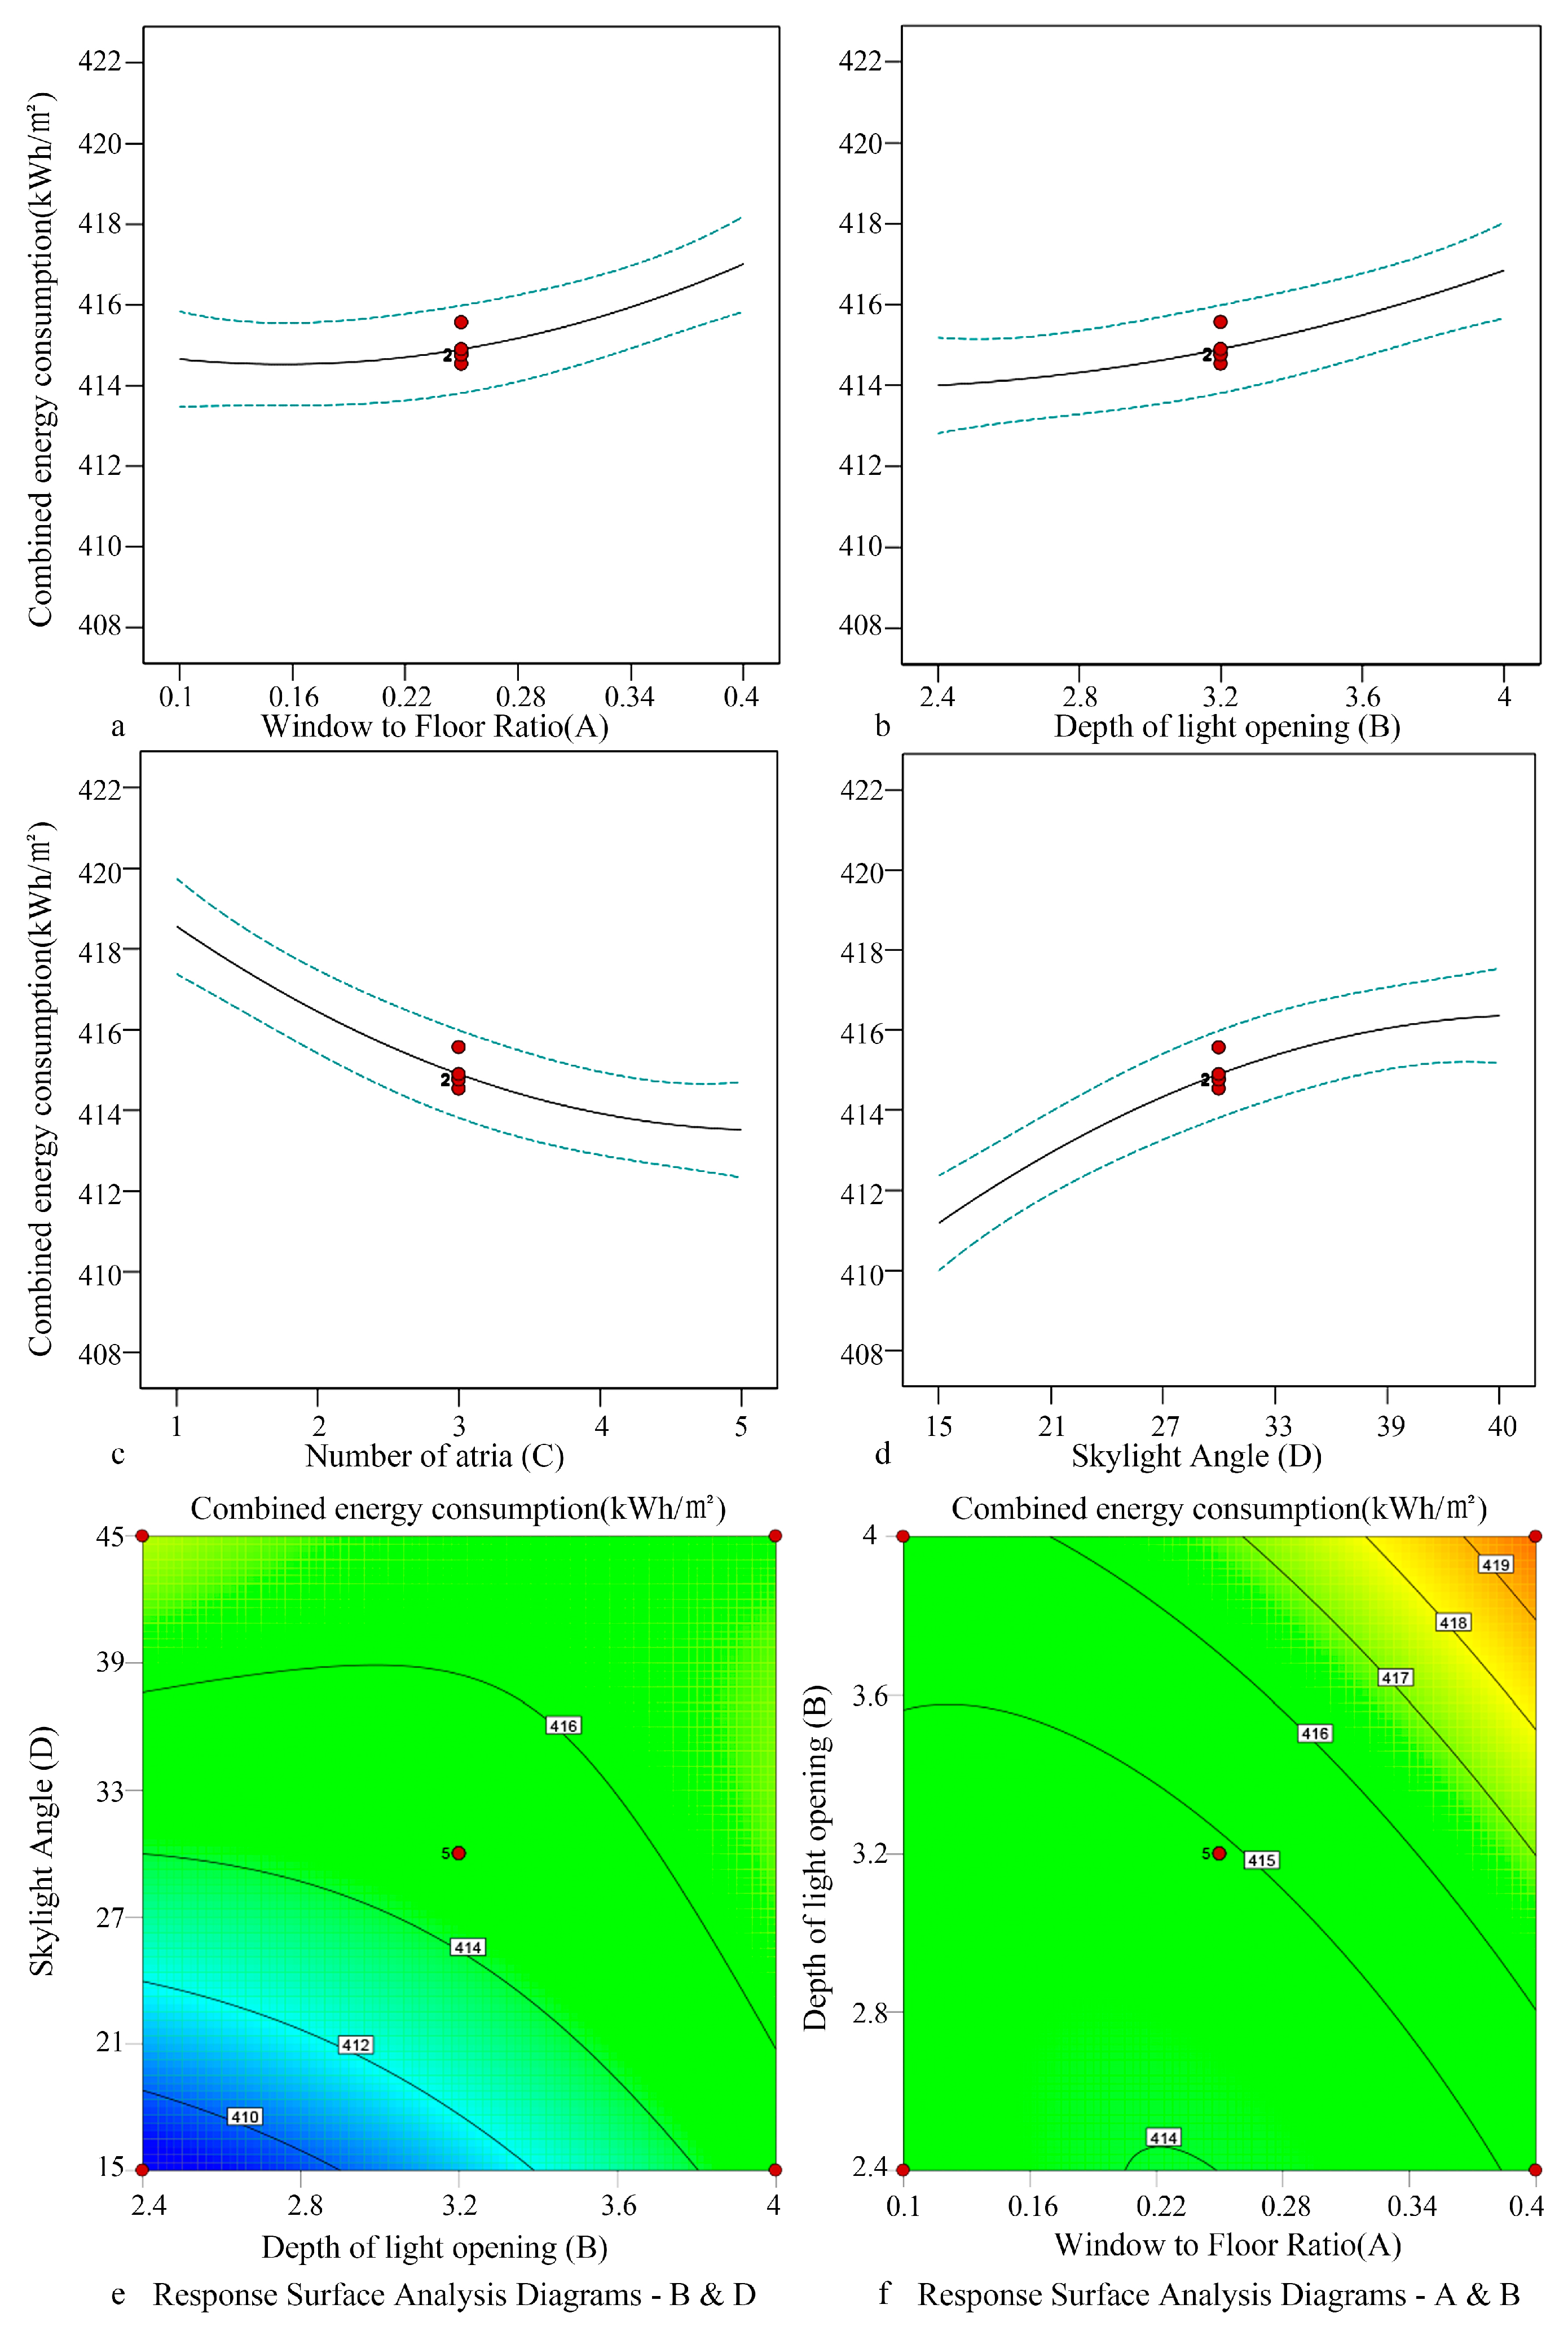
Figure 16.
Fitting relationship of combined energy consumption in the through-atrium public area of sample 5.
Figure 16.
Fitting relationship of combined energy consumption in the through-atrium public area of sample 5.
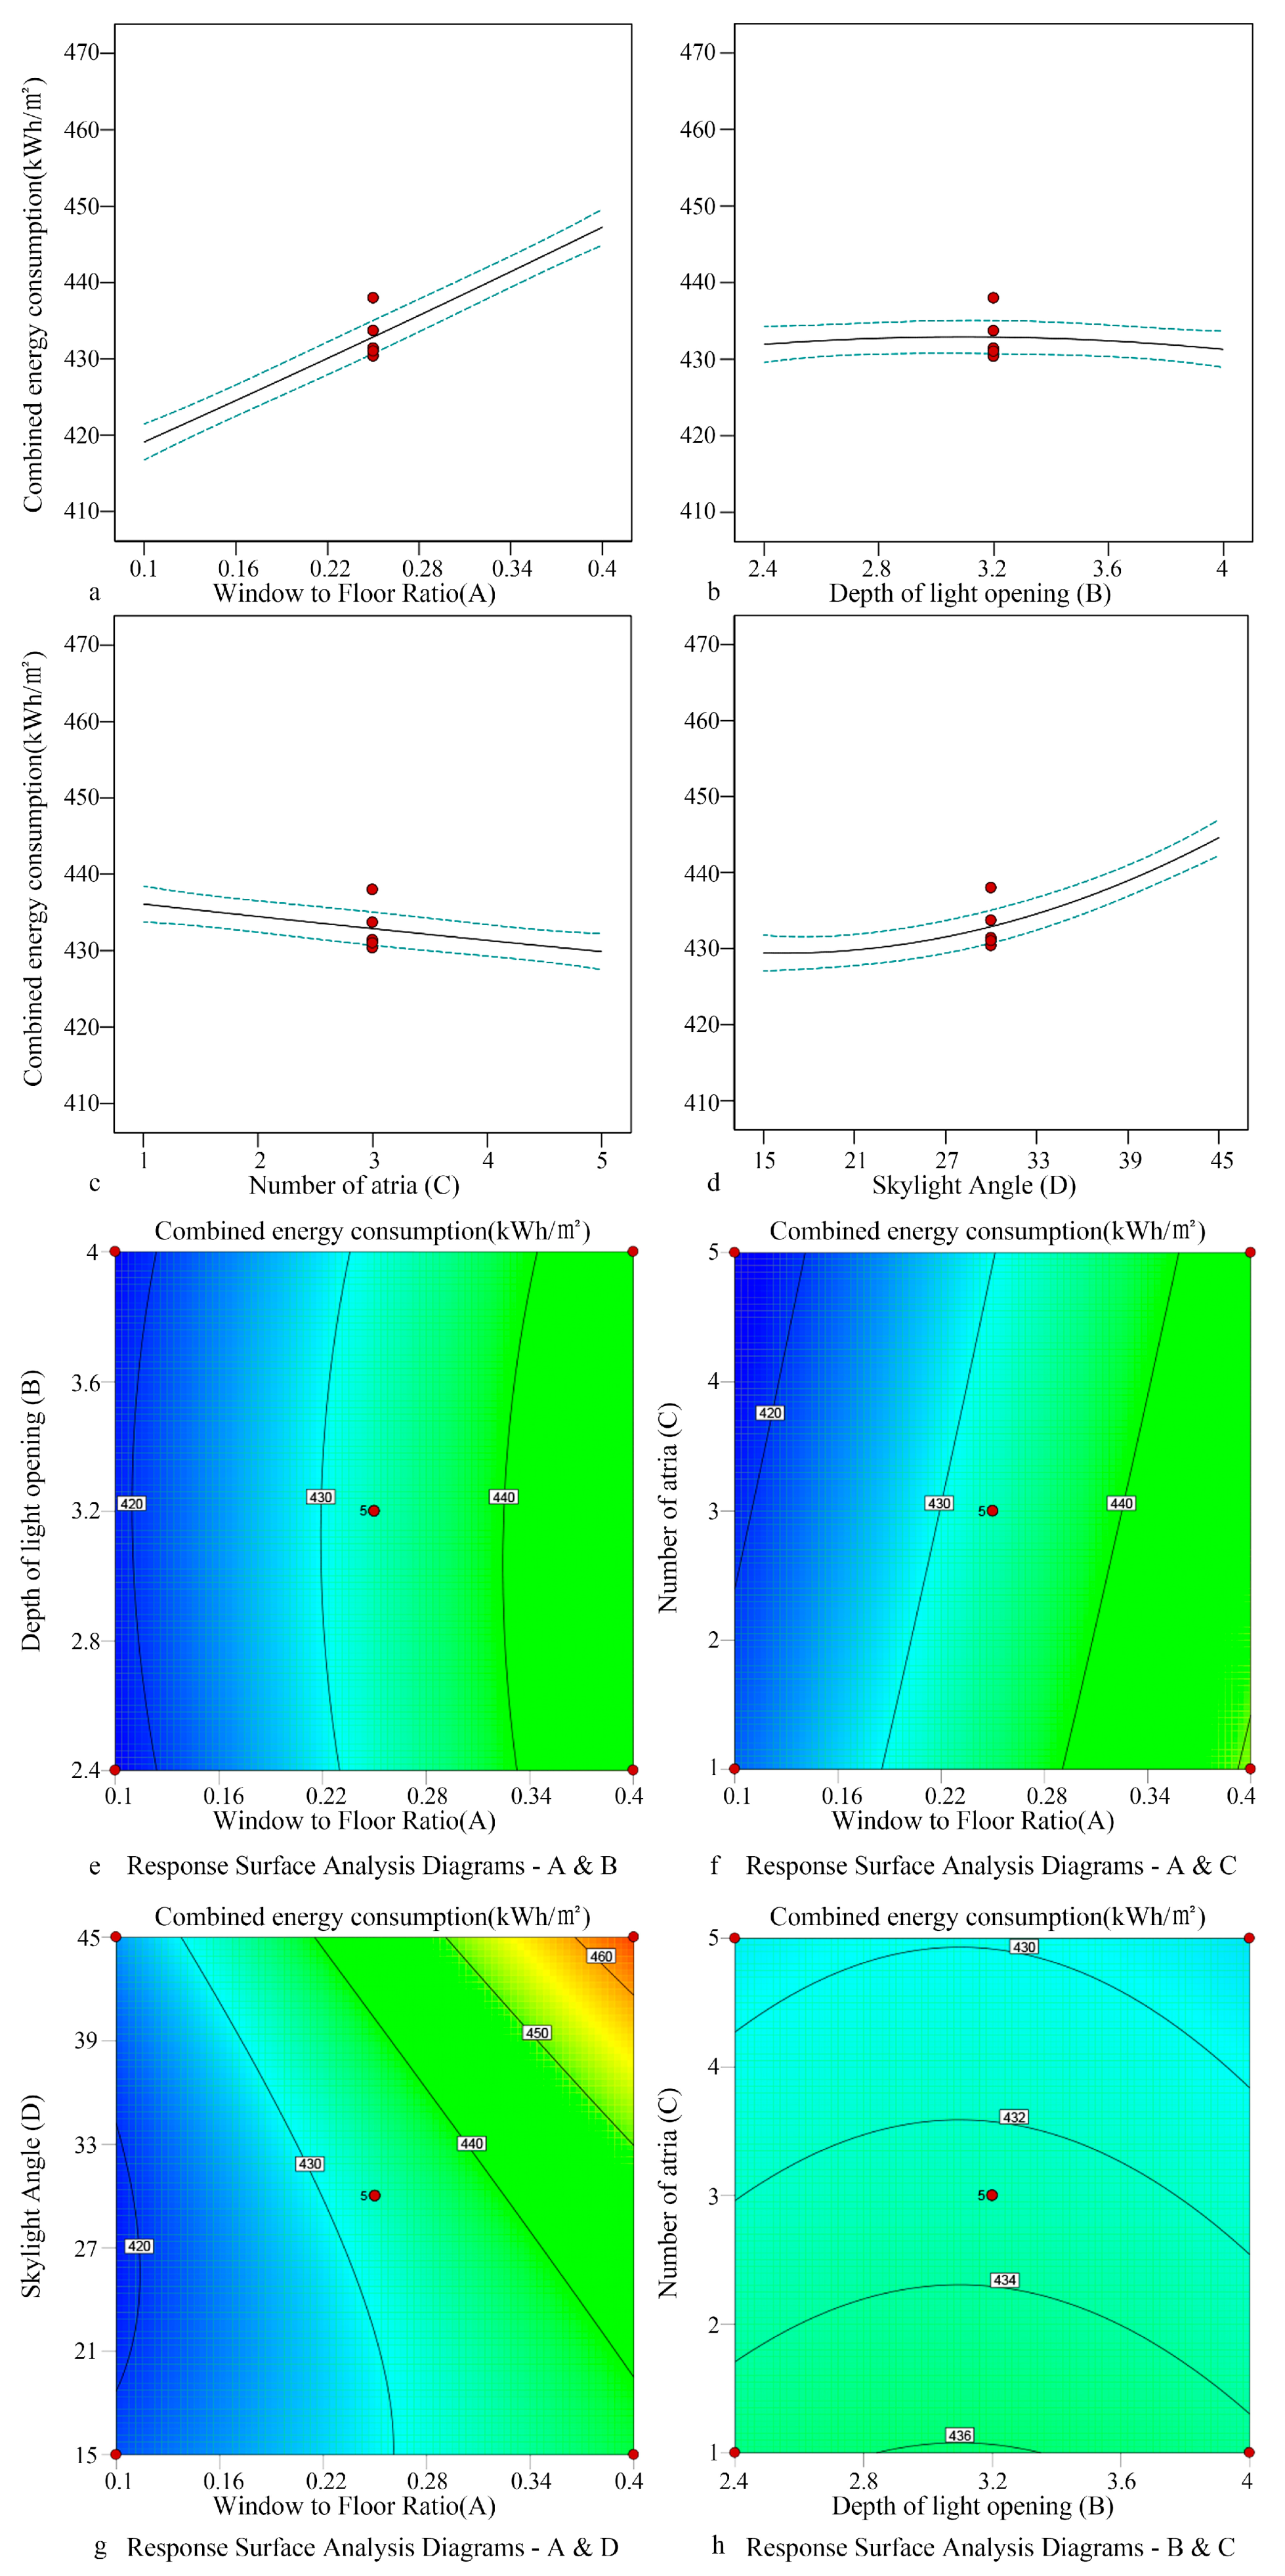
Figure 17.
Comparative analysis of sample models of daylighting space.
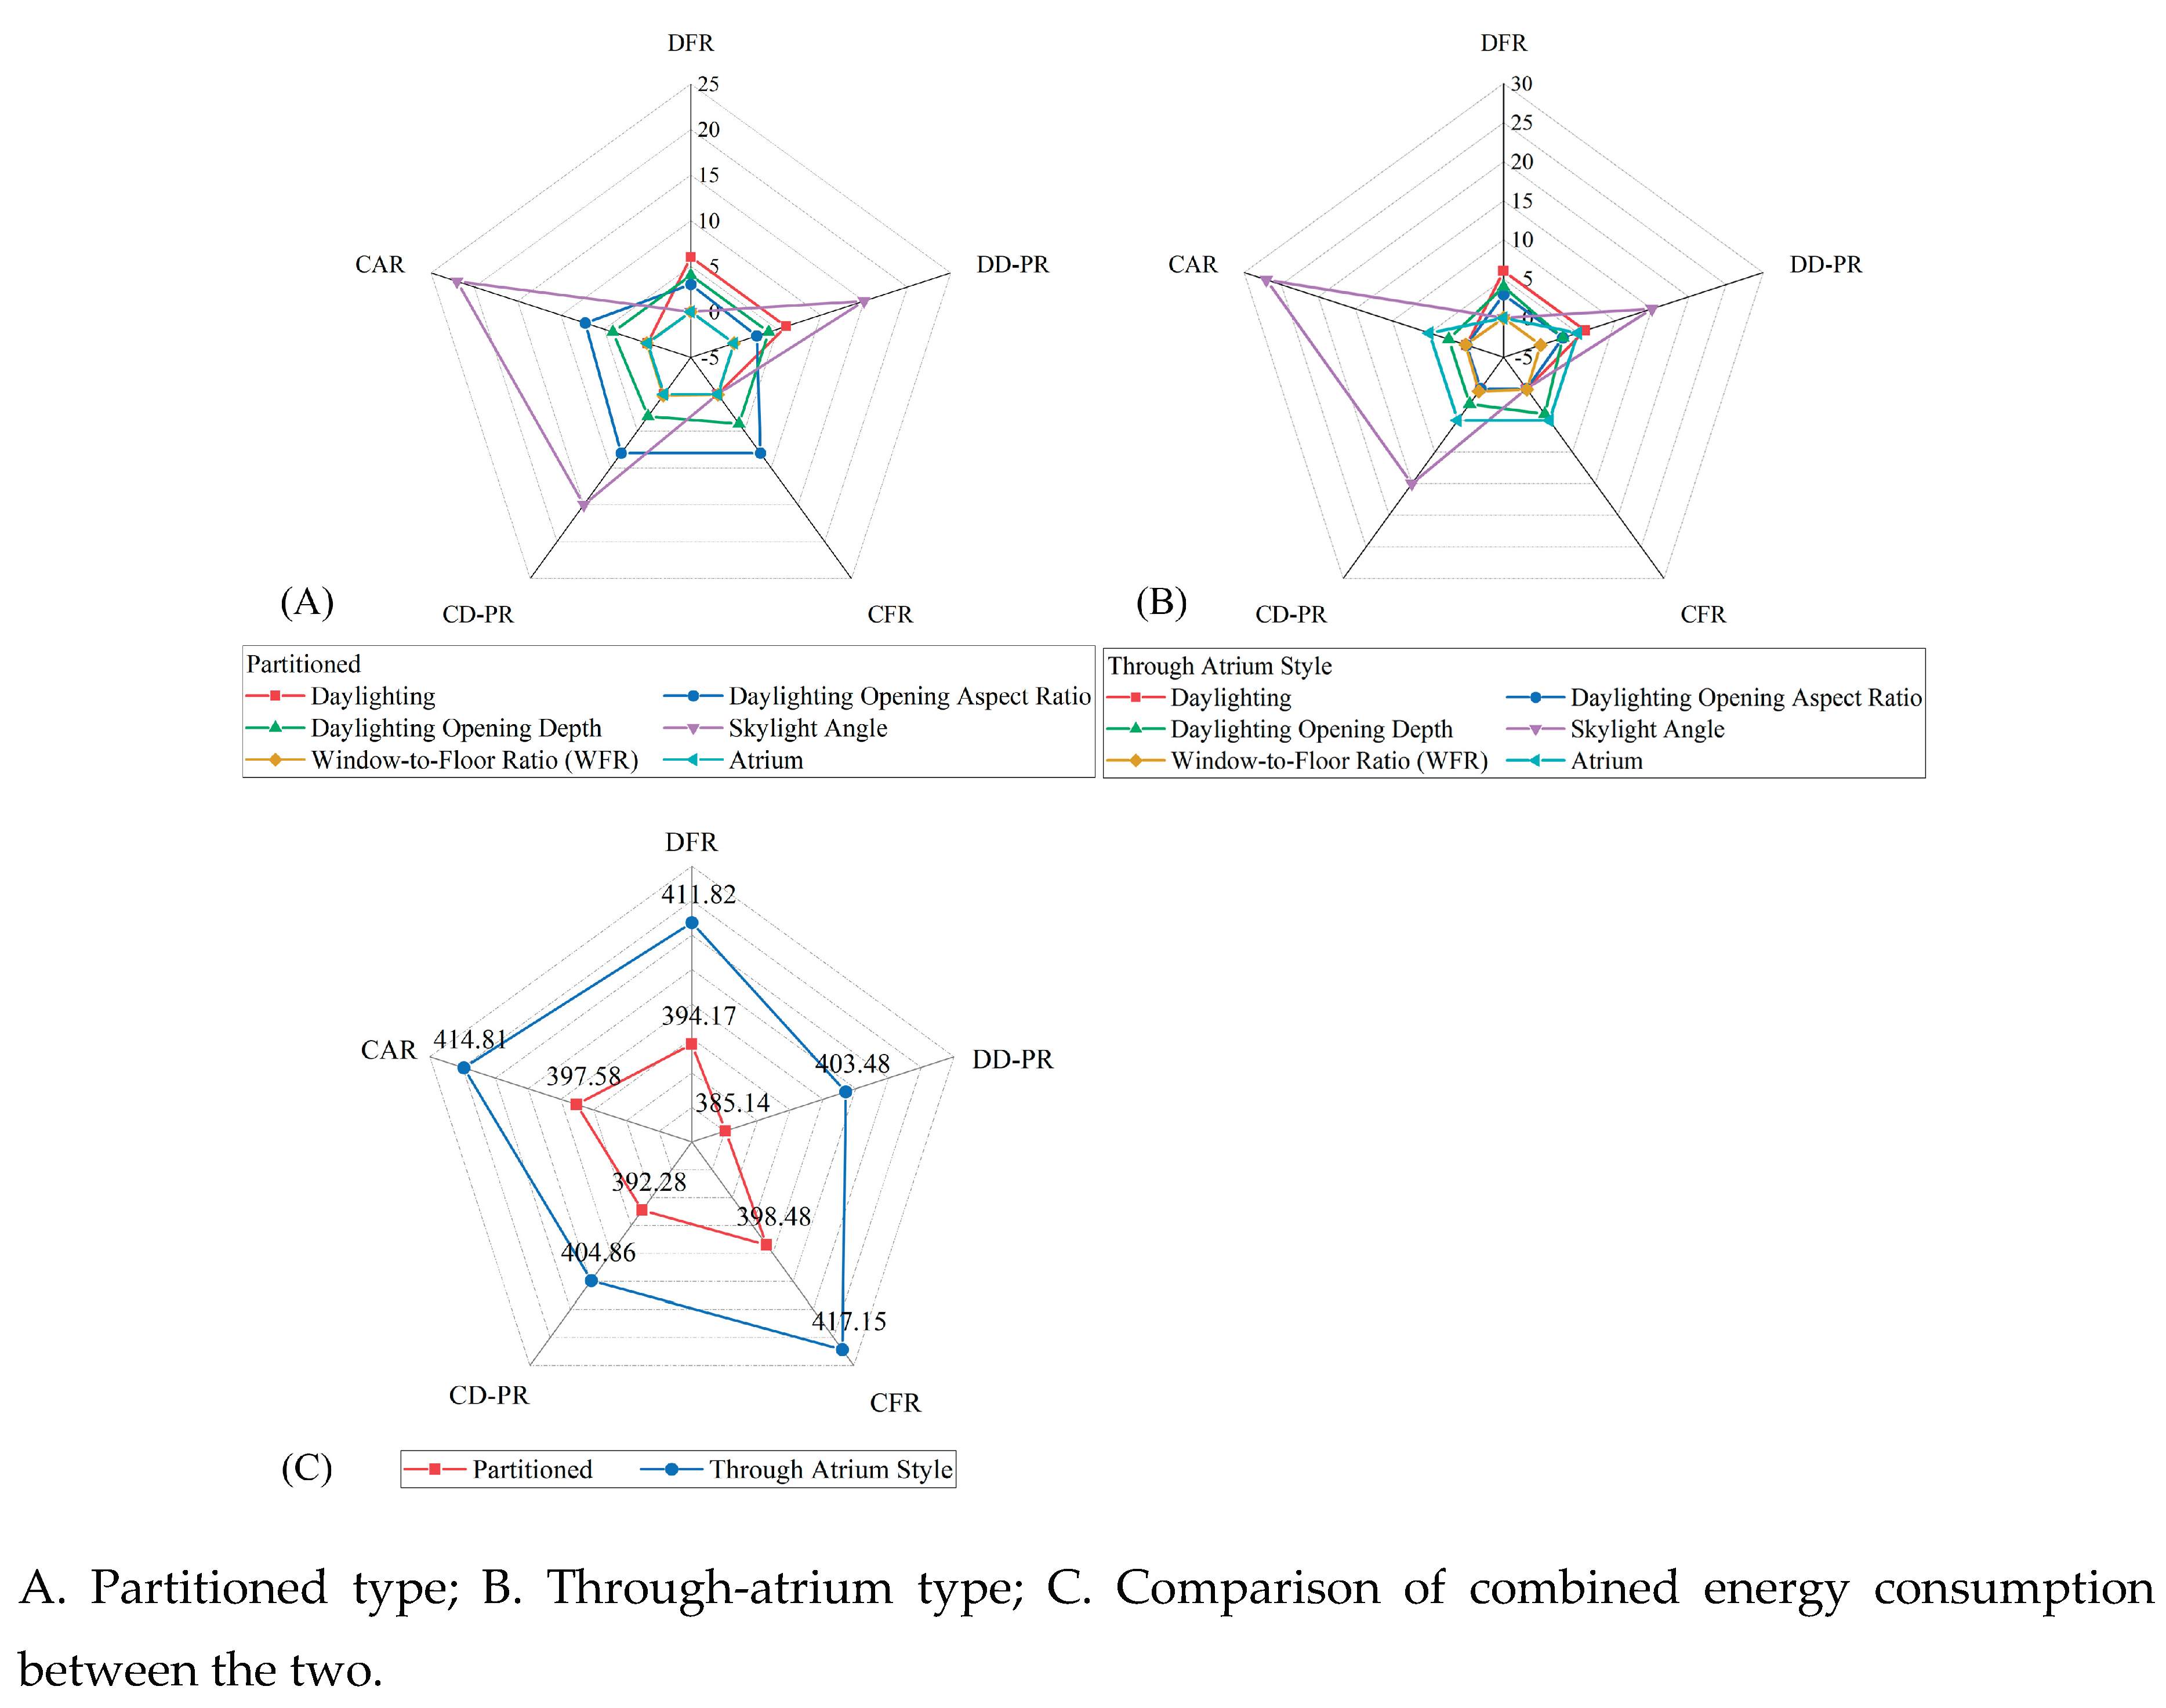

Table 1.
Value ranges of skylight daylighting spatial form parameters.
| Classification | Indicator | Value range | Unit | Data source | Schematic diagram |
| Planar form | Length-to-width ratio of light openings (decentralized) | 1-3 | Actual measurement | 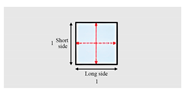 |
|
| Length-to-width ratio of light openings (centralized) | 4-6 | Actual measurement | 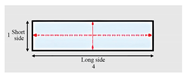 |
||
| Window-to-floor ratio (decentralized) |
0.08-0.2 | Actual measurement |  |
||
| Window-to-floor ratio (centralized) | 0.1-0.4 | Actual measurement |  |
||
| Profile form | Depth of light openings | 2.4-4 | m | Actual measurement | 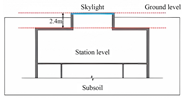 |
| Number of atriums | 1-5 | ° | Actual measurement | 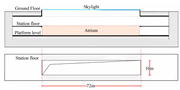 |
|
| Skylight angle (flat roof) | 0 | ° | Actual measurement | / | |
| Skylight angle (double slope and arched roof) | 15-45 | ° | Actual measurement | 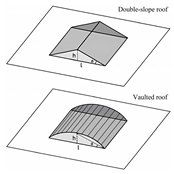 |
|
| Interface form | Number of light openings (decentralized) | 2-6 | Actual measurement |  |
|
| Number of light openings (centralized) |
1 | Actual measurement |  |
Table 2.
Basic information of test instruments.
| Instrument name | Model number | Test objects | Test range | Resolution | Test accuracy |
| Handheld illuminance meter | TES-1332A | Illumination | 0-20000lx | 0.1lx | ±3% |
| Handheld WBGT tester | AZ8778 | Air Temperature | 0-50℃ | 0.1℃ | ±0.6℃ |
| Handheld WBGT tester | AZ8778 | Black sphere temperature | 0-80℃ | 0.1℃ | (15-40℃) ±1℃ |
| Infrared thermometer | DM-5005 | Wall temperature | -50℃-900℃ | 0.1℃ | ±1℃ |
| Total solar radiation sensor | YGC-TBQ | Solar radiation intensity | 0-2000W/m2 | 1W/m2 | ±5% |
Table 3.
Design type of the building envelope.
| Name of envelope | Characteristic | Surface type |
| Skylight | Transparent envelopes | Skylight |
| Ceiling | Non-transparent envelopes | Underground ceiling |
| Wall | Non-transparent envelopes | Underground wall |
| Ground | Non-transparent envelopes | Underground slab |
Disclaimer/Publisher’s Note: The statements, opinions and data contained in all publications are solely those of the individual author(s) and contributor(s) and not of MDPI and/or the editor(s). MDPI and/or the editor(s) disclaim responsibility for any injury to people or property resulting from any ideas, methods, instructions or products referred to in the content. |
© 2025 by the authors. Licensee MDPI, Basel, Switzerland. This article is an open access article distributed under the terms and conditions of the Creative Commons Attribution (CC BY) license (http://creativecommons.org/licenses/by/4.0/).
Copyright: This open access article is published under a Creative Commons CC BY 4.0 license, which permit the free download, distribution, and reuse, provided that the author and preprint are cited in any reuse.


