
Submitted:
08 May 2025
Posted:
09 May 2025
You are already at the latest version
Abstract
Background The atherogenic index of plasma (AIP), a prognostic indicator for cardiovascular disease, has been underexplored in relation to clinical outcomes in patients receiving peritoneal dialysis. This study aims to elucidate the relationship between baseline AIP levels and all-cause mortality, cardiovascular mortality, and peritonitis risk in this population.
Methods This retrospective cohort study included incident peritoneal dialysis patients in our center from 1 January 2006 through 31 December 2021. The end of follow-up time was 31 December 2023. Participants were stratified by baseline AIP levels. Kaplan-Meier curves, Cox regression analysis, and subgroup analysis were used to evaluate associations with clinical outcomes.
Results The average age of the 2,460 participants in this study was 45.9 years, and 1,456 (59.2%) of them were men. Diabetic nephropathy (19.5%) was the second most common kidney disease, after primary glomerulonephritis (60.8%). The higher AIP tertile group was statistically associated with increased risks of all-cause mortality, cardiovascular mortality, and peritonitis compared to the lowest AIP group, as evidenced by Kaplan-Meier curves and multivariate analyses. Continuous AIP levels also showed a positive correlation with all-cause mortality risk, even after controlling for covariates.
Conclusion Our study highlights AIP as a predictive marker for adverse outcomes in PD patients, emphasizing its potential utility in risk stratification and clinical management.
Keywords:
Atherogenic index of plasma
; peritoneal dialysis
; all-cause mortality
; cardiovascular mortality
; peritonitis
; clinical outcomes
1. Introduction
Dyslipidemias, characterized by abnormal serum levels of cholesterol, triglycerides, or both, along with associated lipoprotein abnormalities, represent a significant health concern in peritoneal dialysis (PD) patients. Compared to non-dialysis chronic kidney disease (CKD) and hemodialysis (HD) populations, PD patients exhibit a more atherogenic lipid profile. This distinction is primarily attributed to the unique metabolic challenges associated with PD, including continuous glucose absorption from dialysis solutions and peritoneal protein loss [1,2,3]. Emerging evidence suggests that dyslipidemia in PD patients is not merely a metabolic abnormality but a significant risk factor for various clinical outcomes, including treatment failure in PD-related peritonitis [4], technique failure [5], and accelerated decline in residual renal function [6]. The most frequently reported clinical consequence of dyslipidemia is the increased risk of atherosclerotic cardiovascular disease (CVD), characterized by elevated low-density lipoprotein cholesterol (LDL-C), triglycerides (TG), and lipoprotein(a) (Lp (a)) and decreased high-density lipoprotein cholesterol (HDL-C) [2]. The Atherogenic Index of Plasma (AIP), calculated as log10 (TG/HDL-C), has emerged as a valuable predictive indicator for cardiovascular risk and plaque progression [7,8]. Numerous studies have demonstrated its association with various cardiovascular outcomes, including myocardial infarction [9], ischemic stroke [10], and carotid atherosclerosis [11,12]. The relationship between AIP and mortality has been extensively studied in different populations. A nationwide population-based cohort study identified a significant association between higher AIP and increased diabetes mortality in women over 65 years, while demonstrating a U-shaped relationship with all-cause mortality [13]. Similarly, a longitudinal investigation found that both low and high AIP levels were linked to increased all-cause mortality, with a U-shaped association observed with CVD mortality specifically in hypertensive patients [14]. In the context of dialysis patients, research on AIP remains limited but increasingly significant. Mi Jung Lee et al. identified a U-shaped correlation between AIP and all-cause mortality in both HD and PD patients [15]. This link was further clarified by multicenter cohort research conducted in China, which found a nonlinear U-shaped association with an identified inflection point at 0.63 and an inverse relationship between AIP and all-cause mortality risk in the highest tertile compared to the lowest tertile group [16]. Furthermore, in patients receiving continuous hemodialysis, AIP has been linked to clinical outcomes including intradialytic hypotension and stroke [17,18]. However, significant gaps remain in our understanding, particularly regarding the relationship between AIP and CVD mortality, as well as peritonitis in PD patients.
This research aims to address these critical knowledge gaps by investigating the associations between AIP and clinical outcomes in PD patients, including all-cause mortality, CVD mortality, and peritonitis. By exploring these relationships, we hope to provide valuable insights into the prognostic value of AIP in this vulnerable population and potentially identify new avenues for risk stratification and therapeutic intervention.
2. Methods
2.1. Population
In this retrospective cohort study, we included PD patients who had PD catheter insertions performed at our center between January 1, 2006, and December 31, 2021. Exclusion criteria were (1) individuals who were younger than 18 years old at PD initiation; (2) PD withdrawal within 6 months; (3) transition from maintenance HD to PD; (4) prior kidney transplantation before PD catheter insertion; (5) miss baseline data; (6) unavailable baseline TG and HDL-C levels for AIP calculation. The follow-up period ended on December 31, 2023.
2.2. Demographic and Clinical Characteristics and Baseline Laboratory Data
At the initiation of peritoneal dialysis, we collected comprehensive baseline demographic and clinical characteristics of the enrolled individuals. These included age, gender, body mass index (BMI), primary kidney disease, 24-h urine volume, use of angiotensin-converting enzyme inhibitor (ACEI), angiotensin receptor blocker (ARB), and lipid-lowering drugs, and history of cardiovascular diseases and diabetes. Additionally, baseline laboratory data were obtained during the first 1–3 months following PD initiation, including total cholesterol (TC), triglyceride (TG), high-density lipoprotein cholesterol (HDL-C), low-density lipoprotein cholesterol (LDL-C), hemoglobin (Hb), serum albumin (ALB), serum calcium, serum phosphorus, blood urea nitrogen (BUN), serum creatinine (Scr), blood glucose, uric acid (UA), and intact 80 parathyroid hormone (iPTH). The baseline estimated glomerular filtration rate (eGFR) was calculated using the baseline Scr values and the Chronic Kidney Disease Epidemiology Collaboration (CKD-EPI) equation [19]. The AIP was computed using the formula: log10 (TG/HDL-C) [7]. Based on the baseline AIP tertiles, all individuals were categorized into distinct groups for further analysis.
2.3. Outcomes and Definitions
The primary outcomes of this study were all-cause mortality and CVD mortality, with PD-related peritonitis as the secondary outcome. Cardiovascular diseases (CVD) were defined as angina pectoris, cardiac infarction, stroke, heart failure, angioplasty, and coronary artery bypass. All-cause mortality was defined as death from any cause, regardless of etiology. Death from cardiovascular and cerebrovascular conditions, such as cardiomyopathy, cardiac arrhythmia, atherosclerotic heart disease, acute myocardial infarction, congestive heart failure, cardiac arrest, anoxic encephalopathy, ischemic brain injury, cerebrovascular disease, and peripheral arterial disease, was referred to as CVD mortality [20]. PD-related peritonitis was diagnosed based on established clinical criteria, requiring at least two of the following conditions were present: (1) clinical signs of peritonitis, such as abdominal pain and/or cloudy dialysis effluent; (2) dialysis effluent white cell count > 100/µL or > 0.1×10⁹/L (after a dwell period of at least 2 h), with > 50% polymorphonuclear leukocytes; (3) positive dialysis effluent culture [21]. Censored events included death due to other causes, transferring to other dialysis modalities, loss to follow-up before January 31, 2023, kidney transplantation, and the end of the study phase.
2.4. Statistical Analysis
Participants were stratified into tertiles based on baseline AIP levels: tertile 1 (< -0.05), tertile 2 (-0.05 to 0.20), and tertile 3 (> 0.20). Continuous variables were expressed as mean ± standard deviation for normally distributed data or median (interquartile range) for non-normally distributed data. Categorical variables were presented as frequencies (percentages). Differences between groups were analyzed using the chi-square test, Kruskal-Wallis test, or One-Way analysis of variance, as appropriate. Survival analysis was conducted using Kaplan-Meier curves with log-rank tests for hazard ratio estimation. AIP was used as a continuous and categorical variable in Cox proportional hazards regression models to assess the relationship between AIP and the risk of peritonitis, CVD mortality, and all-cause mortality. The unadjusted data was represented by Model 1. Age, gender, history of cardiovascular disease, history of diabetes mellitus, BMI, ALB, UA, calcium, LDL-C, BUN, iPTH, glucose, and hemoglobin were all taken into account when adjusting the data in Model 2. Model 3 was further adjusted for lipid-lowering medications. The results were expressed as hazard ratios (HRs) and 95% confidence intervals (CIs). We divided patients into subgroups according to age, gender, BMI, history of CVD, and diabetes mellitus to explore the association between AIP and outcomes in our study. All statistical analyses were conducted using SPSS (version 25.0) and R version 4.4.1, with a two-tailed P < 0.05 considered statistically significant.
3. Results
3.1. Study Population and Baseline Characteristics Classified by Baseline AIP
A total of 3,353 patients undergoing continuous ambulatory PD therapy at our center between January 1, 2006, and December 31, 2023, were initially included. After applying exclusion criteria, 893 patients were excluded, resulting in a final cohort of 2,460 patients (Figure 1). The enrolled participants had a mean age of 45.9 ± 14.6 years, with 1,456 (59.2%) being male. Following primary glomerulonephritis (60.8%), diabetic nephropathy (19.5%) ranked as the second most prevalent kidney disease. Baseline demographic and clinical characteristics were summarized in Table 1. Significant differences were observed across the three AIP groups for history of CVD (P = 0.001), use of ARB (P = 0.041), age, BMI, primary kidney diseases, diabetes history, use of lipid-lowering drugs, AIP, and various laboratory parameters, including LDL-C, HDL-C, TG, ALB, calcium, glucose, BUN, UA, and iPTH (all p < 0.001) and Hb (p = 0.041).
3.2. Associations of AIP with All-Cause and CVD Mortality
During a median follow-up of 56.5 months, 655 all-cause mortality events and 344 CVD mortality events were recorded (Figure 1). As illustrated in Figure 2, Kaplan-Meier analysis revealed that patients in the highest AIP tertile had significantly higher cumulative hazards for all-cause mortality (log-rank test, p < 0.0001) and CVD mortality (log-rank test, p < 0.0001) compared to the lower tertiles.
As shown in Table 2, higher AIP levels were significantly associated with increased risk of all-cause mortality (HR: 1.814, 95% CI: 1.402-2.349, p < 0.001) and CVD mortality (HR: 1.892, 95% CI: 1.326-2.699, p < 0.001) in the unadjusted model. After adjusting for potential confounders, the association between continuous AIP and all-cause mortality remained significant, with HRs of 1.419 (95% CI: 1.072-1.878, p = 0.014) in Model 2 and 1.421 (95% CI: 1.075-1.879, p = 0.014) in Model 3. However, the association between AIP and CVD mortality was attenuated in adjusted models. When AIP was presented as a categorical variable, the highest tertile (Tertile 3) was associated with significantly higher risks of all-cause mortality and CVD mortality across all models compared with the referenced group (Tertile 1). For all-cause mortality and CVD mortality, the HRs in model 3 were 1.280 (95% CI: 1.046-1.567, p = 0.017) and 1.430 (95% CI: 1.078–1.899, p = 0.013), respectively. The analysis results were shown in Table 2.
3.3. Associations of AIP and PD-Related Peritonitis in PD Patients
During follow-up, a total of 866 patients developed peritonitis. The incidence rate of peritonitis was 0.075 per person-year. As the Figure 2 presented, no differences in cumulative peritonitis hazards were found among the AIP groups. In unadjusted Cox regression analysis, higher continuous AIP levels were associated with an increased risk of peritonitis (HR: 1.266, 95% CI: 1.007-1.593, p = 0.044). However, this association was no longer significant after adjusting for confounders, including age, gender, CVD history, diabetes history, BMI, ALB, UA, calcium, LDL-C, BUN, iPTH, glucose, and Hb. When AIP was analyzed as a categorical variable, patients in Tertile 2 had a higher risk of peritonitis compared to those in Tertile 1 (HR: 1.191, 95% CI: 1.007-1.409, p = 0.042) in Model 2. The highest AIP tertile (Tertile 3) was associated with a significantly increased risk of peritonitis across all models, with HRs of 1.199 (95% CI: 1.014-1.417, p = 0.034) in the unadjusted model, 1.209 (95% CI: 1.010-1.449, p = 0.039) in Model 2, and 1.204 (95% CI: 1.005-1.442, p = 0.044) in Model 3.
3.4. Subgroup Analysis
Subgroup analyses were performed to further explore the associations between AIP and clinical outcomes, adjusting for confounders such as age, sex, CVD history, diabetes history, BMI, ALB, UA, calcium, LDL-C, BUN, iPTH, glucose, Hb, and lipid-lowering medication use (Figure 3). The interaction test showed that the association of AIP with higher CVD mortality differed significantly between patients with CVD history and without CVD history (p for interaction = 0.006). Elevated AIP was associated with a significantly higher risk of all-cause mortality in subgroups of patients aged ≥ 65 years (HR: 1.88, 95% CI: 1.11-3.19, p = 0.019), males (HR: 1.62, 95% CI: 1.11-2.35, p = 0.012), those with BMI ≤ 24 kg/m² (HR: 1.51, 95% CI: 1.09-2.10, p = 0.014), and those without diabetes (HR: 1.49, 95% CI: 1.00-2.21, p = 0.047) or with CVD history (HR: 1.80, 95% CI: 1.01-3.20, p = 0.046). Among individuals aged ≥ 65 years, higher AIP was linked to a 2.17-fold increased risk of cardiovascular disease-related mortality (95% CI: 1.04-4.51, p = 0.039). Similarly, in patients with BMI ≤ 24 kg/m², elevated AIP was associated with a 1.41 times greater likelihood of developing peritonitis (95% CI: 1.05-1.88, p = 0.021). However, subgroup analyses revealed no significant interaction between AIP and either all-cause mortality or peritonitis incidence.
4. Discussion
Using a retrospective design, we assessed how AIP correlates with survival outcomes (all-cause and cardiovascular mortality) and peritonitis risk in PD patients. Our findings indicate that elevated AIP levels are significantly associated with an increased risk of all-cause mortality, even after adjusting for potential confounders. Furthermore, the highest AIP tertile (Tertile 3) demonstrated a statistically significant increase in the risk of all-cause mortality, CVD mortality, and peritonitis compared to the lowest AIP tertile (Tertile 1). These results underscore the potential role of AIP as a prognostic marker in PD patients.
We demonstrated a more significant association of AIP with all-cause and CVD mortality in PD patients aged >65 years. Notably, all-cause mortality risk was significantly increased in male patients, although no interaction was observed in the gender subgroup analysis. AIP has emerged as a robust predictor of cardiovascular and cerebrovascular disease risk, surpassing traditional lipid risk factors [22,23,24,25]. Numerous studies have highlighted the association between AIP and major adverse cardiovascular events (MACEs) across diverse populations. For instance, a large-scale analysis revealed that the risk of MACEs increased progressively with higher AIP quartiles in the Korean population [8]. Similarly, another study found that AIP was associated with a higher risk of incident MACEs, with the association being particularly pronounced in women under 60 years of age and without hypertension or diabetes [26]. In diabetic populations, AIP has been identified as an independent indicator of lipid profile status, with studies such as the ACCORD trial linking AIP to an increased risk of MACEs in patients with type 2 diabetes mellitus [27,28]. Additionally, research in patients undergoing percutaneous coronary intervention (PCI) has shown that lower AIP values are associated with reduced cardiovascular events post-PCI, further supporting its prognostic value [27,29]. In the research involving PD patients, a non-linear relationship of U-shaped was found between AIP and all-cause mortality [16]. Gender-specific analyses have revealed intriguing differences in the relationship between AIP and clinical outcomes. For example, a case-control study in China demonstrated that AIP was positively associated with the risk and severity of atherosclerotic coronary lesions in elderly male patients [30]. Conversely, in elderly women with arterial hypertension, AIP was linked to a higher risk of all-cause mortality, independent of other risk factors [31]. A study in the Lithuanian population demonstrated that higher AIP levels were associated with increased CVD mortality in men and all-cause mortality in women [32], which differed from the results of our study. However, not all studies have corroborated these findings; for instance, AIP was not found to be an independent risk factor for CVD in Cameroonian postmenopausal women [33]. These discrepancies may be attributed to variations in study populations and ethnicities. Studies have shown that aging alters lipid profiles and impairs the anti-inflammatory and antioxidant functions of HDL, thereby accelerating atherosclerosis [34,35]. Numerous researches have also reported age-dependent associations between AIP and clinical outcomes. A long-term follow-up study of elderly patients (aged >75 years) with acute coronary syndrome demonstrated that AIP was an independent predictor of all-cause mortality in this population [36]. The results of a prospective study of middle-aged and older British adults indicated that sustained high AIP levels were linked to CVD incidence, suggesting that persistently elevated AIP may contribute to CVD development [37]. The heterogeneity in these findings may stem from differences in study populations and age stratification, underscoring the need for larger-scale studies to clarify the prognostic value of AIP across diverse populations.
Mechanisms linking AIP to all-cause and CVD mortality involve atherosclerosis, insulin resistance (IR), oxidative stress, and renin-angiotensin-aldosterone system (RAAS) activation. Atherosclerosis, the most common form of cardiovascular diseases [38], is a central pathway through which an elevated AIP may contribute to increased mortality. A high AIP is often associated with elevated LDL-C and reduced HDL-C levels. Specifically, a raised AIP correlates with an increase in small, dense LDL (sdLDL) particles, which more easily penetrate the arterial wall due to their smaller size. Their high affinity for proteoglycans and low affinity for LDL receptors further promote vascular deposition, accelerating the atherosclerosis [35]. Concurrently, decreased HDL-C levels impair its anti-inflammatory, antioxidant, vasodilatory, and cholesterol reverse transport functions, exacerbating atherosclerotic progression [34]. Supporting this, mass spectrometry and biochemical analyses of HDL in end-stage renal disease (ESRD) patients on hemodialysis revealed altered HDL composition and impaired cholesterol efflux capacity, underscoring HDL’s role in atherosclerosis in this population [39]. Additionally, elevated triglyceride levels drive the release of proinflammatory cytokines, triggering endothelial dysfunction, monocyte-derived reactive oxygen species (ROS) production, and LDL oxidation. These processes foster foam cell formation, smooth muscle cell migration, and plaque development [40]. Insulin resistance represents another critical mechanism linking AIP to CVD mortality. AIP is closely associated with IR, as excess triglycerides compete with glucose for cellular uptake, impairing glucose oxidation and promoting IR. Reduced HDL levels further diminish insulin sensitivity and β-cell function, worsening IR [41]. What’s more, IR-induced adipocyte hypertrophy recruits macrophages and other immune cells to amplify inflammation and lipid metabolic disturbances. Hyperinsulinemia associated with IR also disrupts immune cell function, shifting the balance toward proinflammatory responses and endothelial damage [42,43,44,45]. Notably, AIP has been validated as a marker of IR severity, reinforcing its role in CVD risk assessment [46,47]. A multicenter retrospective study of peritoneal dialysis patients found that IR was prevalent and correlated with an elevated risk of coronary artery disease [48]. What’s more, oxidative stress further mediates AIP-related mortality. AIP related dyslipidemia promotes intracellular lipid accumulation, mitochondrial dysfunction, and excessive ROS production to intensify oxidative stress and systemic inflammation [49,50]. Moreover, elevated LDL-C associated with AIP can activate RAAS and increase angiotensin II (Ang II) activity. Ang II exacerbates endothelial dysfunction and inflammatory responses to compound the CVD risk [51]. In summary, AIP contributes to all-cause and CVD mortality through multiple interconnected mechanisms: accelerating atherosclerosis, exacerbating IR, amplifying oxidative stress, and activating RAAS. These pathways collectively underscore AIP’s value as a prognostic marker and potential therapeutic target in high-risk populations.
PD-related peritonitis is a common complication of peritoneal dialysis, leading to failure of peritoneal dialysis techniques and even death. According to our findings, increased AIP levels were linked to a higher risk of peritonitis among individuals receiving peritoneal dialysis. Elevated AIP may promote peritonitis through multiple mechanisms. Firstly, AIP-related dyslipidemia can induce mitochondrial dysfunction in peritoneal mesothelial cells, exacerbating oxidative stress and systemic inflammatory responses [49,50]. Secondly, elevated AIP may promote the infiltration of inflammatory cells into peritoneal tissues, increasing the release of pro-inflammatory cytokines, impairing peritoneal defense mechanisms, and elevating the risk of infection [5]. Additionally, elevated LDL-C activates the RAAS, leading to endothelial dysfunction in peritoneal vessels, promoting inflammatory cell infiltration and pathogen dissemination, and aggravating oxidative stress and inflammation [51,52]. RAAS activation can also stimulate transforming growth factor-beta (TGF-β1) transcription in peritoneal mesothelial cells, inducing epithelial-mesenchymal transition and impairing mesothelial cell function [52]. The interaction between RAAS activation and dyslipidemia further exacerbates this vicious cycle [51]. Furthermore, insulin resistance (IR) has been linked to peritonitis in PD patients [48]. Moreover, IR can contribute to the development of peritonitis by enhancing the inflammatory responses and diminishing the anti-inflammatory function of HDL [42,43,44,45]. In conclusion, elevated AIP contributes to peritonitis risk in PD patients via various mechanisms, such as modulating oxidative stress and inflammatory responses, stimulating the RAAS pathway, and exacerbating insulin resistance. Deeper studies should further elucidate the specific mechanisms of AIP in peritonitis and evaluate potential strategies for preventing or treating peritonitis by modulating lipid metabolism.
5. Strengths and Limitations
This investigation offers notable strengths, such as a robust sample size and an in-depth assessment of AIP’s relationship with various clinical outcomes in peritoneal dialysis patients. To the best of our understanding, this represents the first study to examine the link between AIP and both cardiovascular mortality and peritonitis in this patient group. Nevertheless, certain limitations must be considered. First, our analysis relied solely on baseline AIP values; future studies should assess longitudinal AIP fluctuations and their clinical implications. Furthermore, since our cohort consisted entirely of Chinese participants, the applicability of our results to other ethnicities may be restricted. Despite these constraints, our findings offer meaningful contributions regarding AIP’s prognostic value in PD patients and emphasize the necessity of further research to clarify its mechanistic pathways and therapeutic relevance.
6. Conclusions
In this extensive PD patient cohort, elevated baseline AIP levels were independently linked to higher risks of all-cause mortality, cardiovascular death, and peritonitis. These results suggest that AIP may serve as a valuable prognostic indicator in PD patients and reinforce the critical role of lipid regulation in this population.
Institutional Review Board Statement
The study was conducted in accordance with the Declaration of Helsinki, and approved by the First Affiliated Hospital of Sun Yat-sen University’s Ethics Committee (Approval no. [2016]215; approval date 13 December 2016).
Informed Consent Statement
Because of the retrospective design and use of de-identified data, informed consent was not required.
Data Availability Statement
The datasets used and analyzed during the current study are available from the corresponding author on reasonable request.
Conflicts of Interest
The authors declare that they have no competing interests.
Funding
This work was supported by the CLINICAL EVIDENCE COUNCIL (CEC) FOR Renal Care from Baxte (22CEC3RCAPAC1002), the Guangdong Basic and Applied Basic Research Foundation (Grant no. 2019A1515011775), the Guangdong Provincial Key Laboratory of Nephrology (Grant no. 2020B1212060028), and the NHC Key Laboratory of Clinical Nephrology (Sun Yat-Sen University).
Author Contributions
CYY and JXL were responsible for patient follow-up and data collection. JYL analyzed and interpreted the patient data and was a major contributor in writing the manuscript. SYT, JG, RHL, HSW, HPM, and WC were responsible for the selection of data analysis methods and interpretation of analysis results. HJY and XY interpreted the data analysis results and revised the manuscript.
Acknowledgments
We thank all doctors and nurses in our PD center for their patient care and data collection.
Abbreviations
- AIP, atherogenic index of plasma;
- PD, peritoneal dialysis;
- CKD, chronic kidney diseases;
- HD, hemodialysis;
- CVD, cardiovascular disease;
- LDL-C, low density lipoprotein cholesterol;
- TG, triglyceride;
- HDL-C, high-density lipoprotein cholesterol;
- BMI, body mass index;
- ACEI, angiotensin-converting enzyme inhibitor;
- ARB, angiotensin receptor blocker;
- TC, total cholesterol;
- Hb, hemoglobin;
- ALB, serum albumin;
- Scr, serum creatinine;
- BUN, blood urea nitrogen;
- UA, uric acid;
- iPTH, intact parathyroid hormone;
- eGFR, estimated glomerular filtration rate;
- MACEs, major adverse cardiovascular events;
- PCI, percutaneous coronary intervention;
- RAAS, Renin-Angiotensin-Aldosterone System;
- SdLDL, small and dense LDL;
- ESRD, end stage renal disease;
- ROS, reactive oxygen species;
- IR, insulin resistance;
- Ang II, angiotensin II;
- TGF-β1, transforming growth factor-beta.
References
- MIKOLASEVIC I, ŽUTELIJA M, MAVRINAC V, et al. Dyslipidemia in patients with chronic kidney disease: etiology and management [J]. Int J Nephrol Renovasc Dis, 2017, 10: 35-45. [CrossRef]
- BERBERICH A J, HEGELE R A. A Modern Approach to Dyslipidemia [J]. Endocr Rev, 2022, 43(4): 611-53. [CrossRef]
- FENG X, ZHAN X, WEN Y, et al. Hyperlipidemia and mortality in patients on peritoneal dialysis [J]. BMC Nephrol, 2022, 23(1): 342. [CrossRef]
- HUANG Y J, JIANG Z P, ZHOU J F, et al. Hypertriglyceridemia is a risk factor for treatment failure in patients with peritoneal dialysis-related peritonitis [J]. Int Urol Nephrol, 2022, 54(7): 1583-9. [CrossRef]
- STEPANOVA N, BURDEYNA O. Association between Dyslipidemia and Peritoneal Dialysis Technique Survival [J]. Open Access Maced J Med Sci, 2019, 7(15): 2467-73. [CrossRef]
- HONDA Y, MARUYAMA Y, NAKAMURA M, et al. Association between lipid profile and residual renal function in incident peritoneal dialysis patients [J]. Ther Apher Dial, 2022, 26(6): 1235-40. [CrossRef]
- WON K B, HEO R, PARK H B, et al. Atherogenic index of plasma and the risk of rapid progression of coronary atherosclerosis beyond traditional risk factors [J]. Atherosclerosis, 2021, 324: 46-51. [CrossRef]
- KIM S H, CHO Y K, KIM Y J, et al. Association of the atherogenic index of plasma with cardiovascular risk beyond the traditional risk factors: a nationwide population-based cohort study [J]. Cardiovasc Diabetol, 2022, 21(1): 81. [CrossRef]
- ZHANG Y, CHEN S, TIAN X, et al. Association between cumulative atherogenic index of plasma exposure and risk of myocardial infarction in the general population [J]. Cardiovasc Diabetol, 2023, 22(1): 210. [CrossRef]
- ZHENG H, WU K, WU W, et al. Relationship between the cumulative exposure to atherogenic index of plasma and ischemic stroke: a retrospective cohort study [J]. Cardiovasc Diabetol, 2023, 22(1): 313. [CrossRef]
- NAM J S, KIM M K, PARK K, et al. The Plasma Atherogenic Index is an Independent Predictor of Arterial Stiffness in Healthy Koreans [J]. Angiology, 2022, 73(6): 514-9. [CrossRef]
- HUANG Q, LIU Z, WEI M, et al. The atherogenic index of plasma and carotid atherosclerosis in a community population: a population-based cohort study in China [J]. Cardiovasc Diabetol, 2023, 22(1): 125. [CrossRef]
- YOU F F, GAO J, GAO Y N, et al. Association between atherogenic index of plasma and all-cause mortality and specific-mortality: a nationwide population-based cohort study [J]. Cardiovasc Diabetol, 2024, 23(1): 276. [CrossRef]
- DUIYIMUHAN G, MAIMAITI N. The association between atherogenic index of plasma and all-cause mortality and cardiovascular disease-specific mortality in hypertension patients: a retrospective cohort study of NHANES [J]. BMC Cardiovasc Disord, 2023, 23(1): 452. [CrossRef]
- LEE M J, PARK J T, HAN S H, et al. The atherogenic index of plasma and the risk of mortality in incident dialysis patients: Results from a nationwide prospective cohort in Korea [J]. PLoS One, 2017, 12(5): e0177499. [CrossRef]
- HU Y, YANG L, SUN Z, et al. The association between the atherogenic index of plasma and all-cause mortality in patients undergoing peritoneal dialysis: a multicenter cohort study [J]. Lipids Health Dis, 2025, 24(1): 91. [CrossRef]
- MA L, SUN F, ZHU K, et al. The Predictive Value of Atherogenic Index of Plasma, Non- High Density Lipoprotein Cholesterol (Non-HDL-C), Non-HDL-C/HDL-C, and Lipoprotein Combine Index for Stroke Incidence and Prognosis in Maintenance Hemodialysis Patients [J]. Clin Interv Aging, 2024, 19: 1235-45. [CrossRef]
- PENG Y, SHUAI D, YANG Y, et al. Higher atherogenic index of plasma is associated with intradialytic hypotension: a multicenter cross-sectional study [J]. Ren Fail, 2024, 46(2): 2407885. [CrossRef]
- LEVEY A S, STEVENS L A. Estimating GFR using the CKD Epidemiology Collaboration (CKD-EPI) creatinine equation: more accurate GFR estimates, lower CKD prevalence estimates, and better risk predictions [J]. Am J Kidney Dis, 2010, 55(4): 622-7. [CrossRef]
- LIU R, PENG Y, WU H, et al. Uric acid to high-density lipoprotein cholesterol ratio predicts cardiovascular mortality in patients on peritoneal dialysis [J]. Nutr Metab Cardiovasc Dis, 2021, 31(2): 561-9. [CrossRef]
- LI P K, CHOW K M, CHO Y, et al. ISPD peritonitis guideline recommendations: 2022 update on prevention and treatment [J]. Perit Dial Int, 2022, 42(2): 110-53. [CrossRef]
- EDWARDS M K, BLAHA M J, LOPRINZI P D. Atherogenic Index of Plasma and Triglyceride/High-Density Lipoprotein Cholesterol Ratio Predict Mortality Risk Better Than Individual Cholesterol Risk Factors, Among an Older Adult Population [J]. Mayo Clin Proc, 2017, 92(4): 680-1. [CrossRef]
- GUO Q, ZHOU S, FENG X, et al. The sensibility of the new blood lipid indicator--atherogenic index of plasma (AIP) in menopausal women with coronary artery disease [J]. Lipids Health Dis, 2020, 19(1): 27. [CrossRef]
- ÇELIK E, ÇORA A R, KARADEM K B. The Effect of Untraditional Lipid Parameters in the Development of Coronary Artery Disease: Atherogenic Index of Plasma, Atherogenic Coefficient and Lipoprotein Combined Index [J]. J Saudi Heart Assoc, 2021, 33(3): 244-50. [CrossRef]
- TAO S, YU L, LI J, et al. Multiple triglyceride-derived metabolic indices and incident cardiovascular outcomes in patients with type 2 diabetes and coronary heart disease [J]. Cardiovasc Diabetol, 2024, 23(1): 359. [CrossRef]
- ZHI Y W, CHEN R G, ZHAO J W, et al. Association Between Atherogenic Index of Plasma and Risk of Incident Major Adverse Cardiovascular Events [J]. Int Heart J, 2024, 65(1): 39-46. [CrossRef]
- QIN Z, ZHOU K, LI Y, et al. The atherogenic index of plasma plays an important role in predicting the prognosis of type 2 diabetic subjects undergoing percutaneous coronary intervention: results from an observational cohort study in China [J]. Cardiovasc Diabetol, 2020, 19(1): 23. [CrossRef]
- FU L, ZHOU Y, SUN J, et al. Atherogenic index of plasma is associated with major adverse cardiovascular events in patients with type 2 diabetes mellitus [J]. Cardiovasc Diabetol, 2021, 20(1): 201. [CrossRef]
- WANG Y, WANG S, SUN S, et al. The predictive value of atherogenic index of plasma for cardiovascular outcomes in patients with acute coronary syndrome undergoing percutaneous coronary intervention with LDL-C below 1.8mmol/L [J]. Cardiovasc Diabetol, 2023, 22(1): 150. [CrossRef]
- FROHLICH J, DOBIáSOVá M. Fractional esterification rate of cholesterol and ratio of triglycerides to HDL-cholesterol are powerful predictors of positive findings on coronary angiography [J]. Clin Chem, 2003, 49(11): 1873-80. [CrossRef]
- BENDZALA M, SABAKA P, CAPRNDA M, et al. Atherogenic index of plasma is positively associated with the risk of all-cause death in elderly women : A 10-year follow-up [J]. Wien Klin Wochenschr, 2017, 129(21-22): 793-8. [CrossRef]
- TAMOSIUNAS A, LUKSIENE D, KRANCIUKAITE-BUTYLKINIENE D, et al. Predictive importance of the visceral adiposity index and atherogenic index of plasma of all-cause and cardiovascular disease mortality in middle-aged and elderly Lithuanian population [J]. Front Public Health, 2023, 11: 1150563. [CrossRef]
- NANSSEU J R, MOOR V J, NOUAGA M E, et al. Atherogenic index of plasma and risk of cardiovascular disease among Cameroonian postmenopausal women [J]. Lipids Health Dis, 2016, 15: 49. [CrossRef]
- HOLZER M, TRIEB M, KONYA V, et al. Aging affects high-density lipoprotein composition and function [J]. Biochim Biophys Acta, 2013, 1831(9): 1442-8. [CrossRef]
- PŁACZKOWSKA S, SOŁKIEWICZ K, BEDNARZ-MISA I, et al. Atherogenic Plasma Index or Non-High-Density Lipoproteins as Markers Best Reflecting Age-Related High Concentrations of Small Dense Low-Density Lipoproteins [J]. Int J Mol Sci, 2022, 23(9). [CrossRef]
- SER Ö S, KESKIN K, ÇETINKAL G, et al. Evaluation of the Atherogenic Index of Plasma to Predict All-Cause Mortality in Elderly With Acute Coronary Syndrome: A Long-Term Follow-Up [J]. Angiology, 2024: 33197241279587. [CrossRef]
- LI X, LU L, CHEN Y, et al. Association of atherogenic index of plasma trajectory with the incidence of cardiovascular disease over a 12-year follow-up: findings from the ELSA cohort study [J]. Cardiovasc Diabetol, 2025, 24(1): 124. [CrossRef]
- BJöRKEGREN J L M, LUSIS A J. Atherosclerosis: Recent developments [J]. Cell, 2022, 185(10): 1630-45. [CrossRef]
- HOLZER M, BIRNER-GRUENBERGER R, STOJAKOVIC T, et al. Uremia alters HDL composition and function [J]. J Am Soc Nephrol, 2011, 22(9): 1631-41. [CrossRef]
- KHATANA C, SAINI N K, CHAKRABARTI S, et al. Mechanistic Insights into the Oxidized Low-Density Lipoprotein-Induced Atherosclerosis [J]. Oxid Med Cell Longev, 2020, 2020: 5245308. [CrossRef]
- LI Y W, KAO T W, CHANG P K, et al. Atherogenic index of plasma as predictors for metabolic syndrome, hypertension and diabetes mellitus in Taiwan citizens: a 9-year longitudinal study [J]. Sci Rep, 2021, 11(1): 9900. [CrossRef]
- PEDERSEN D J, GUILHERME A, DANAI L V, et al. A major role of insulin in promoting obesity-associated adipose tissue inflammation [J]. Mol Metab, 2015, 4(7): 507-18. [CrossRef]
- BJORNSTAD P, ECKEL R H. Pathogenesis of Lipid Disorders in Insulin Resistance: a Brief Review [J]. Curr Diab Rep, 2018, 18(12): 127. [CrossRef]
- DI BARTOLO B A, CARTLAND S P, GENNER S, et al. HDL Improves Cholesterol and Glucose Homeostasis and Reduces Atherosclerosis in Diabetes-Associated Atherosclerosis [J]. J Diabetes Res, 2021, 2021: 6668506. [CrossRef]
- LAMBIE M, BONOMINI M, DAVIES S J, et al. Insulin resistance in cardiovascular disease, uremia, and peritoneal dialysis [J]. Trends Endocrinol Metab, 2021, 32(9): 721-30. [CrossRef]
- TAN M H, JOHNS D, GLAZER N B. Pioglitazone reduces atherogenic index of plasma in patients with type 2 diabetes [J]. Clin Chem, 2004, 50(7): 1184-8. [CrossRef]
- KOU H, DENG J, GAO D, et al. Relationship among adiponectin, insulin resistance and atherosclerosis in non-diabetic hypertensive patients and healthy adults [J]. Clin Exp Hypertens, 2018, 40(7): 656-63. [CrossRef]
- ZHAO G, SHANG S, TIAN N, et al. Associations between different insulin resistance indices and the risk of all-cause mortality in peritoneal dialysis patients [J]. Lipids Health Dis, 2024, 23(1): 287. [CrossRef]
- LIPKE K, KUBIS-KUBIAK A, PIWOWAR A. Molecular Mechanism of Lipotoxicity as an Interesting Aspect in the Development of Pathological States-Current View of Knowledge [J]. Cells, 2022, 11(5). [CrossRef]
- STEPANOVA N. Dyslipidemia in Peritoneal Dialysis: Implications for Peritoneal Membrane Function and Patient Outcomes [J]. Biomedicines, 2024, 12(10). [CrossRef]
- TAIN Y L, HSU C N. The Renin-Angiotensin System and Cardiovascular-Kidney-Metabolic Syndrome: Focus on Early-Life Programming [J]. Int J Mol Sci, 2024, 25(6). [CrossRef]
- MORINELLI T A, LUTTRELL L M, STRUNGS E G, et al. Angiotensin II receptors and peritoneal dialysis-induced peritoneal fibrosis [J]. Int J Biochem Cell Biol, 2016, 77(Pt B): 240-50. [CrossRef]
Figure 1.
Flow chart of the study population. Abbreviations: PD, peritoneal dialysis; HD, hemodialysis; TG, triglyceride; HDL-C, high density lipoprotein cholesterol; CVD, cardiovascular diseases.
Figure 1.
Flow chart of the study population. Abbreviations: PD, peritoneal dialysis; HD, hemodialysis; TG, triglyceride; HDL-C, high density lipoprotein cholesterol; CVD, cardiovascular diseases.
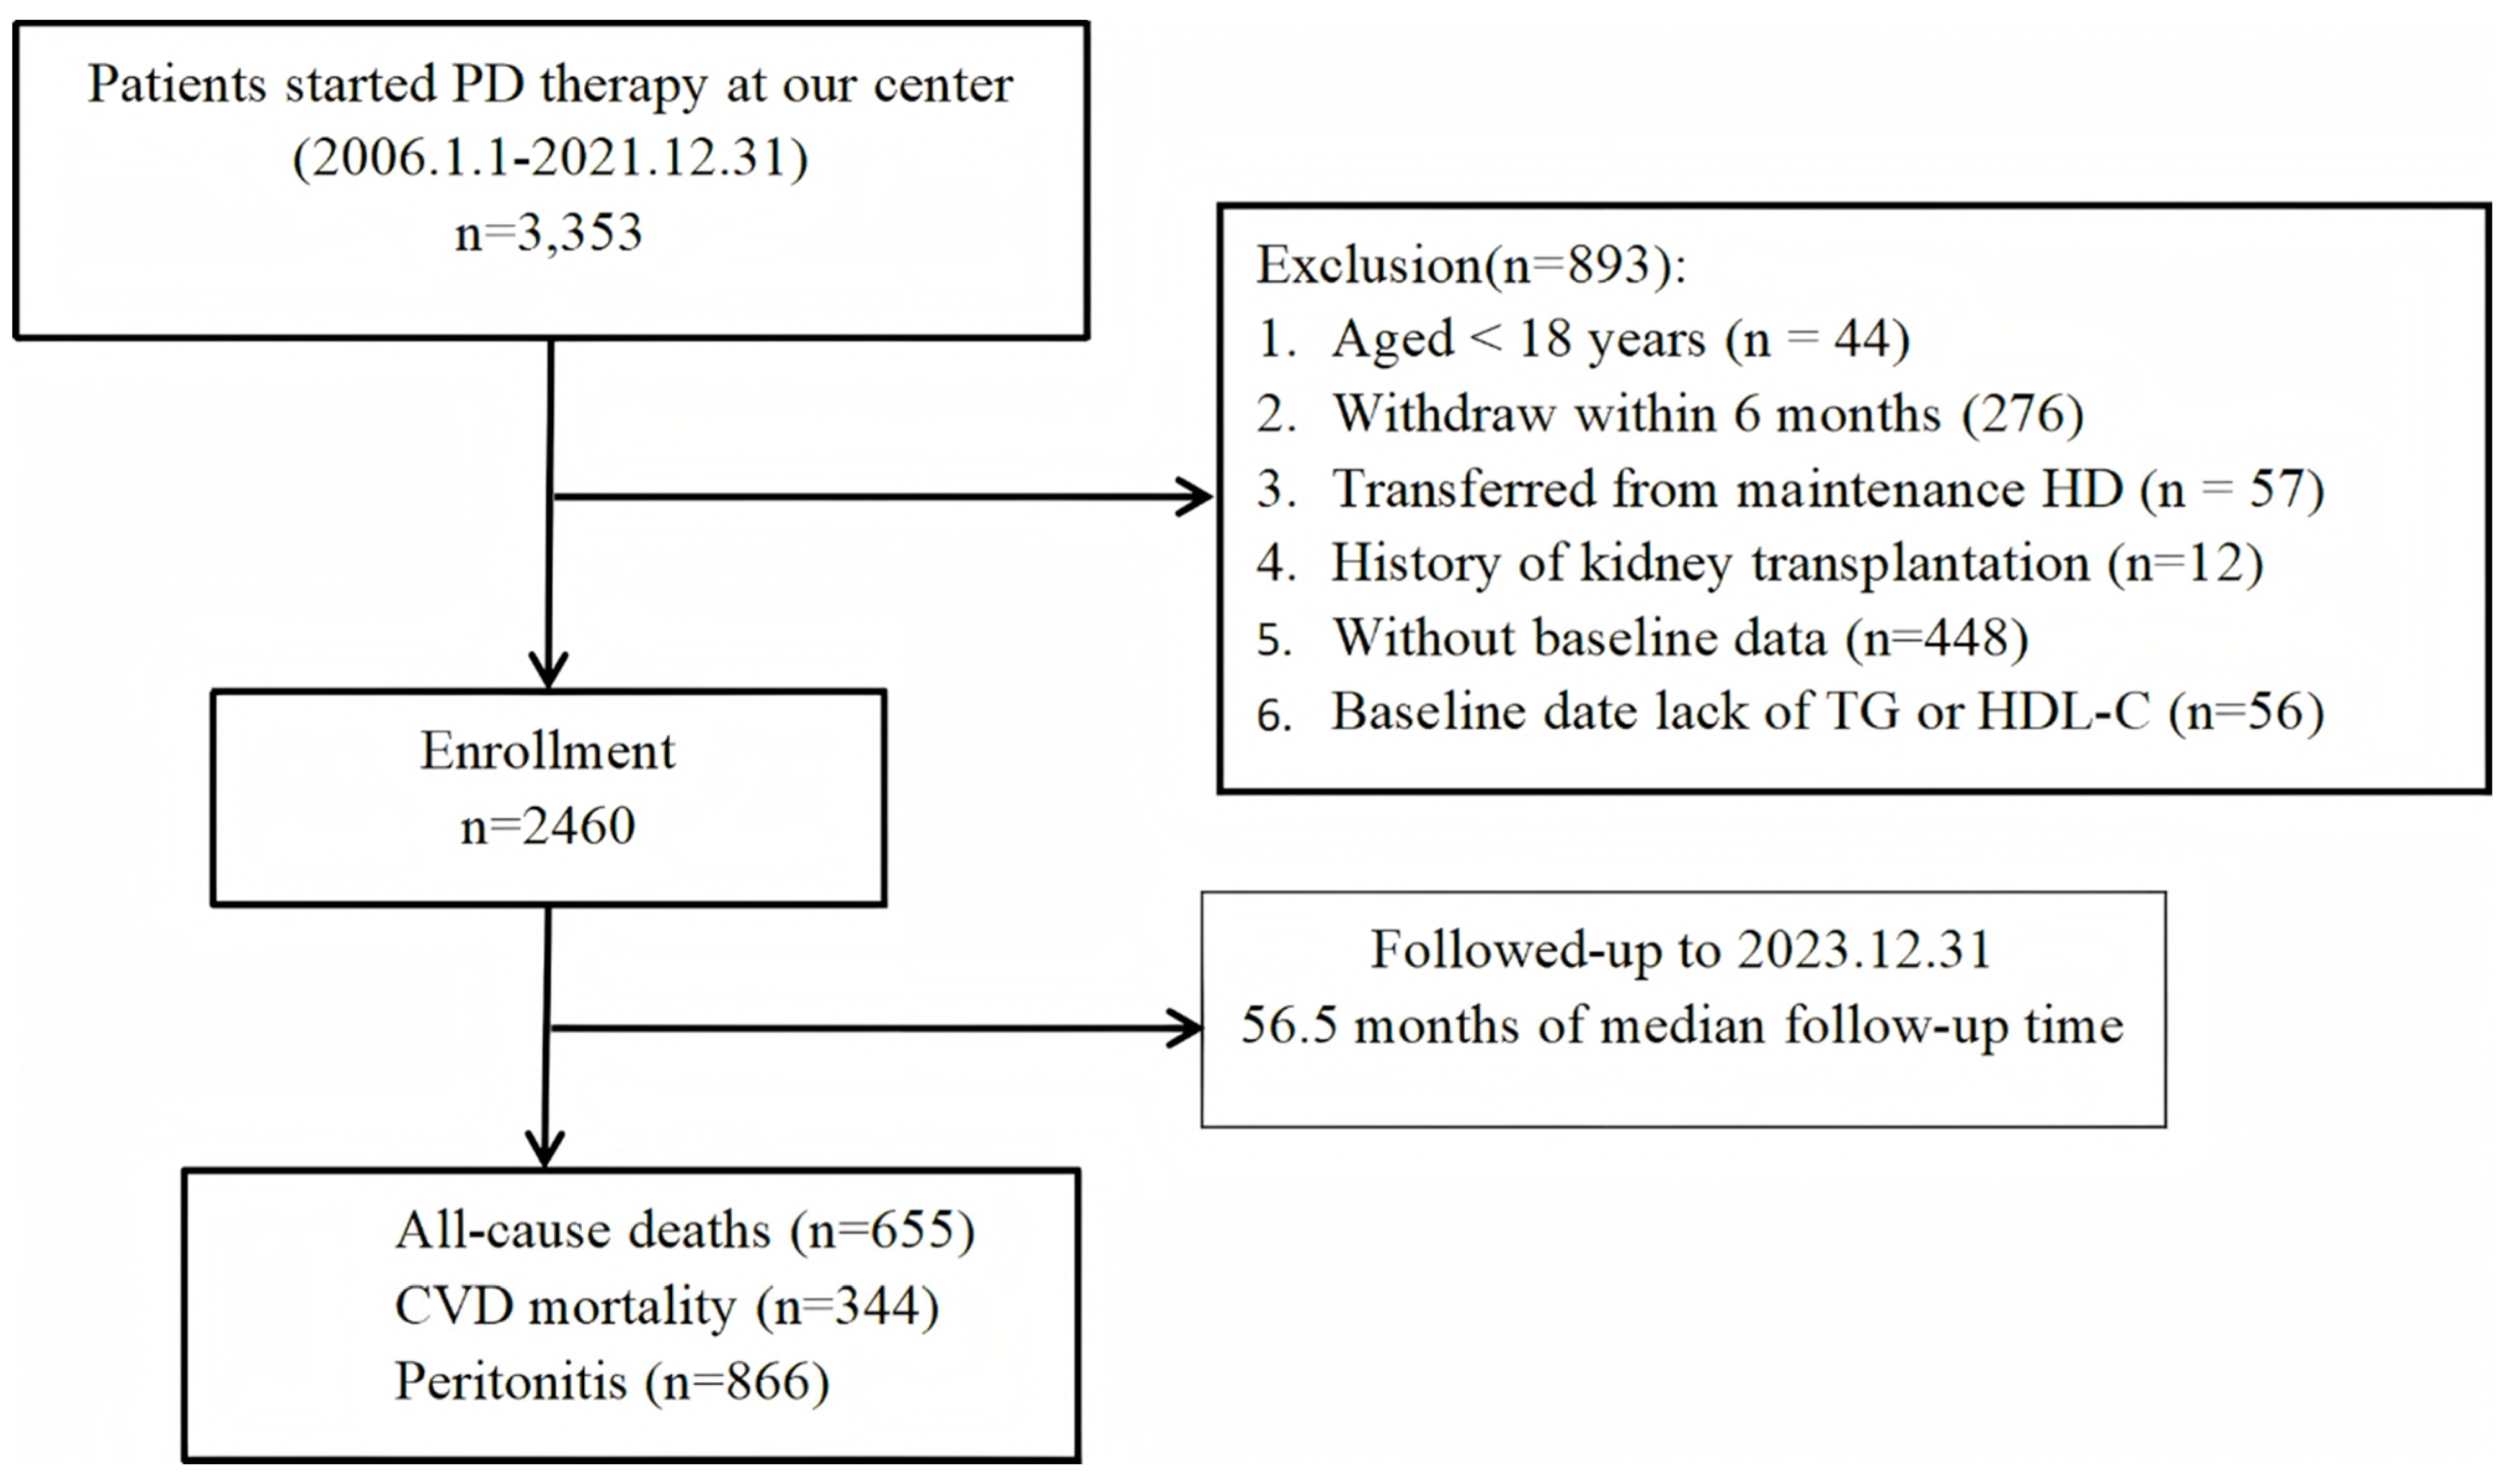
Figure 2.
Kaplan-Meier curves for patients with different levels of AIP: all-cause mortality (A), cardiovascular mortality (B), peritonitis(C).
Figure 2.
Kaplan-Meier curves for patients with different levels of AIP: all-cause mortality (A), cardiovascular mortality (B), peritonitis(C).
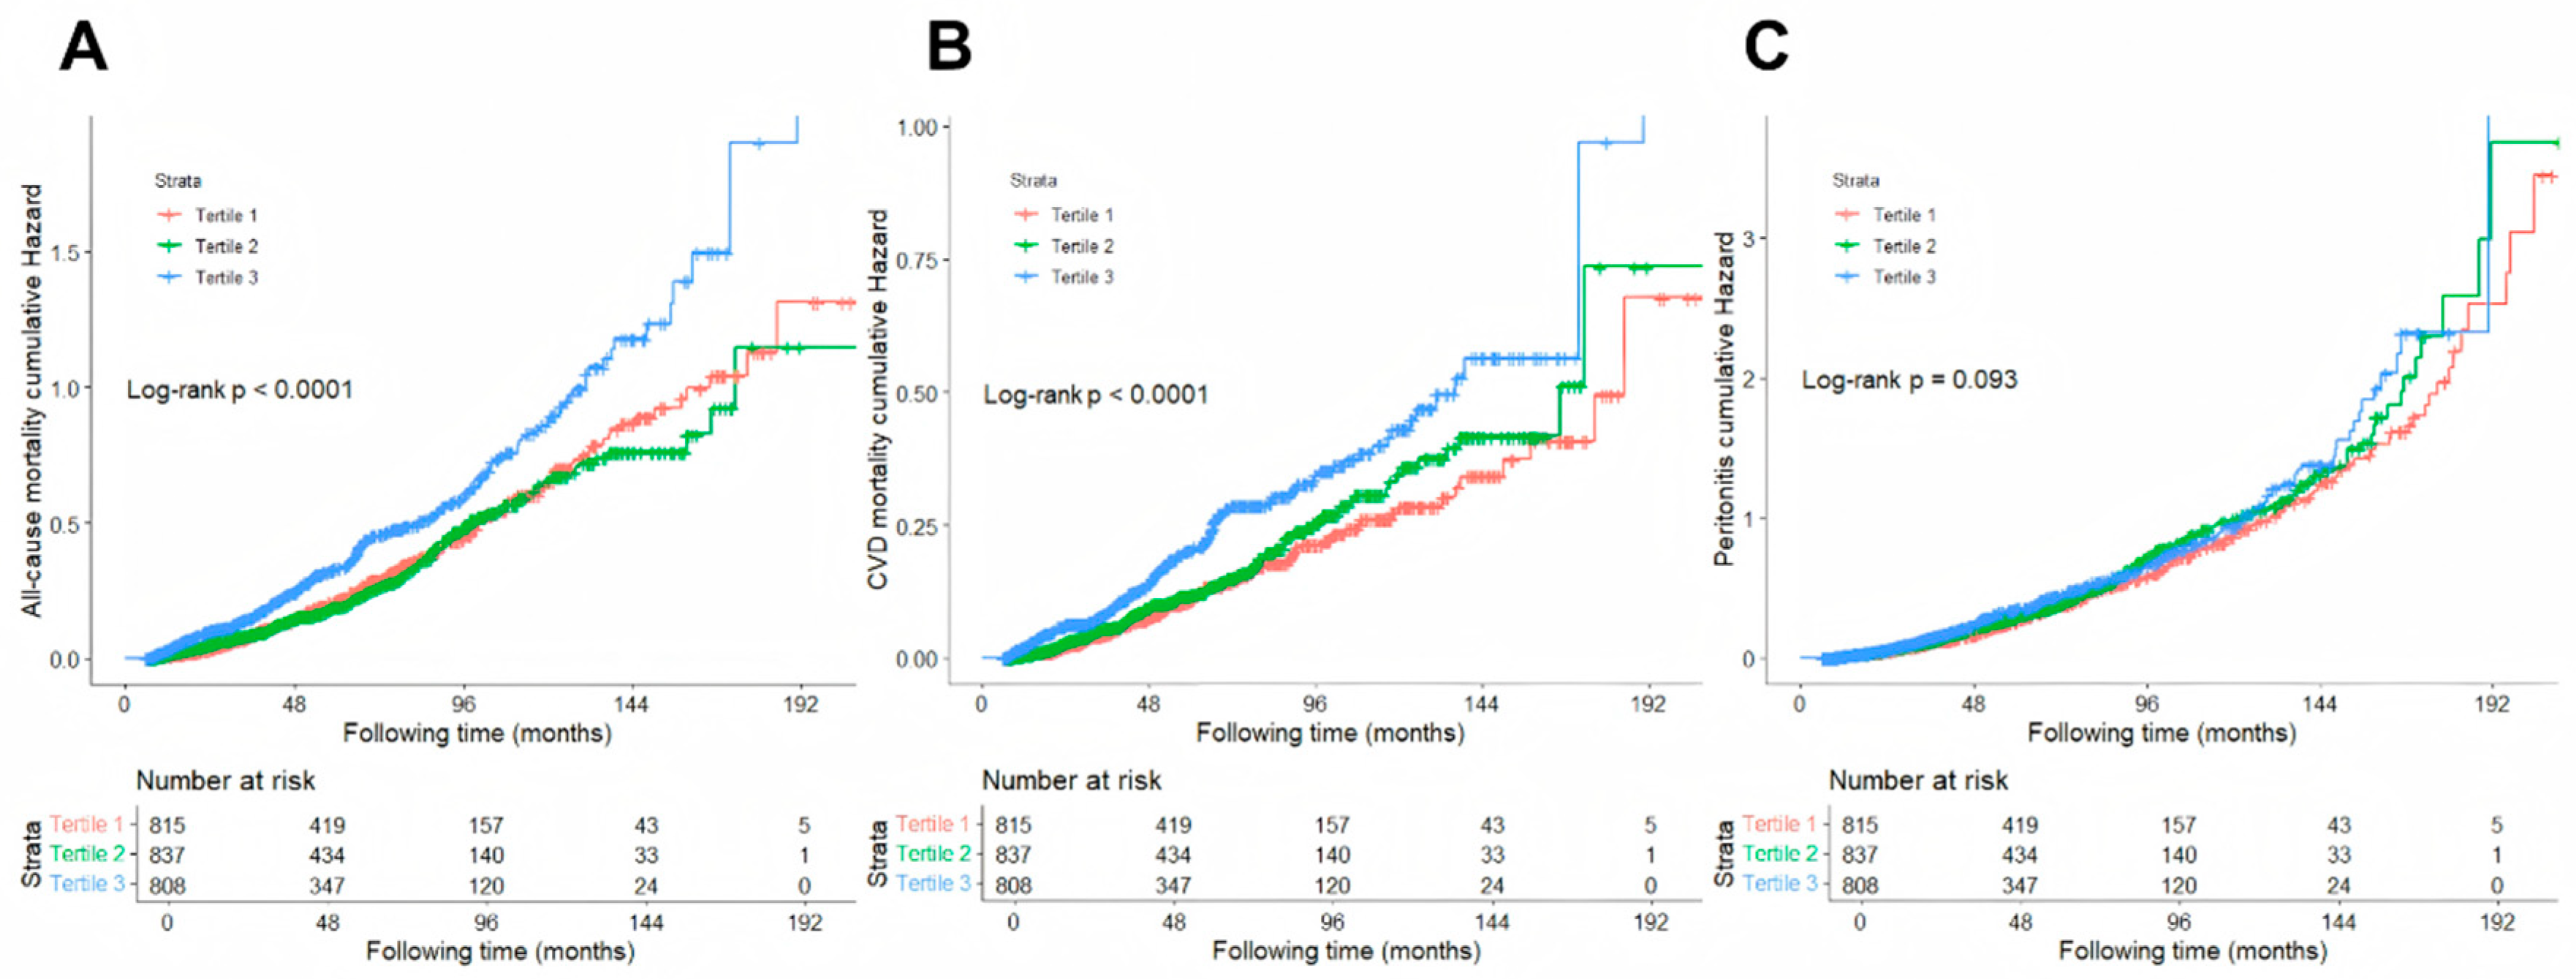
Figure 3.
Subgroup analyses. A comparison of the adjusted hazard ratios of all-cause mortality, cardiovascular mortality, and peritonitis for the subgroups is presented by forest plot. Adjusted for age, gender, body mass index, history of diabetes mellitus, history of cardiovascular disease, serum albumin, uric acid, Calcium, low density lipoprotein cholesterol, blood urea nitrogen, intact parathyroid hormone, glucose, hemoglobin, and lowing-lipid drug.
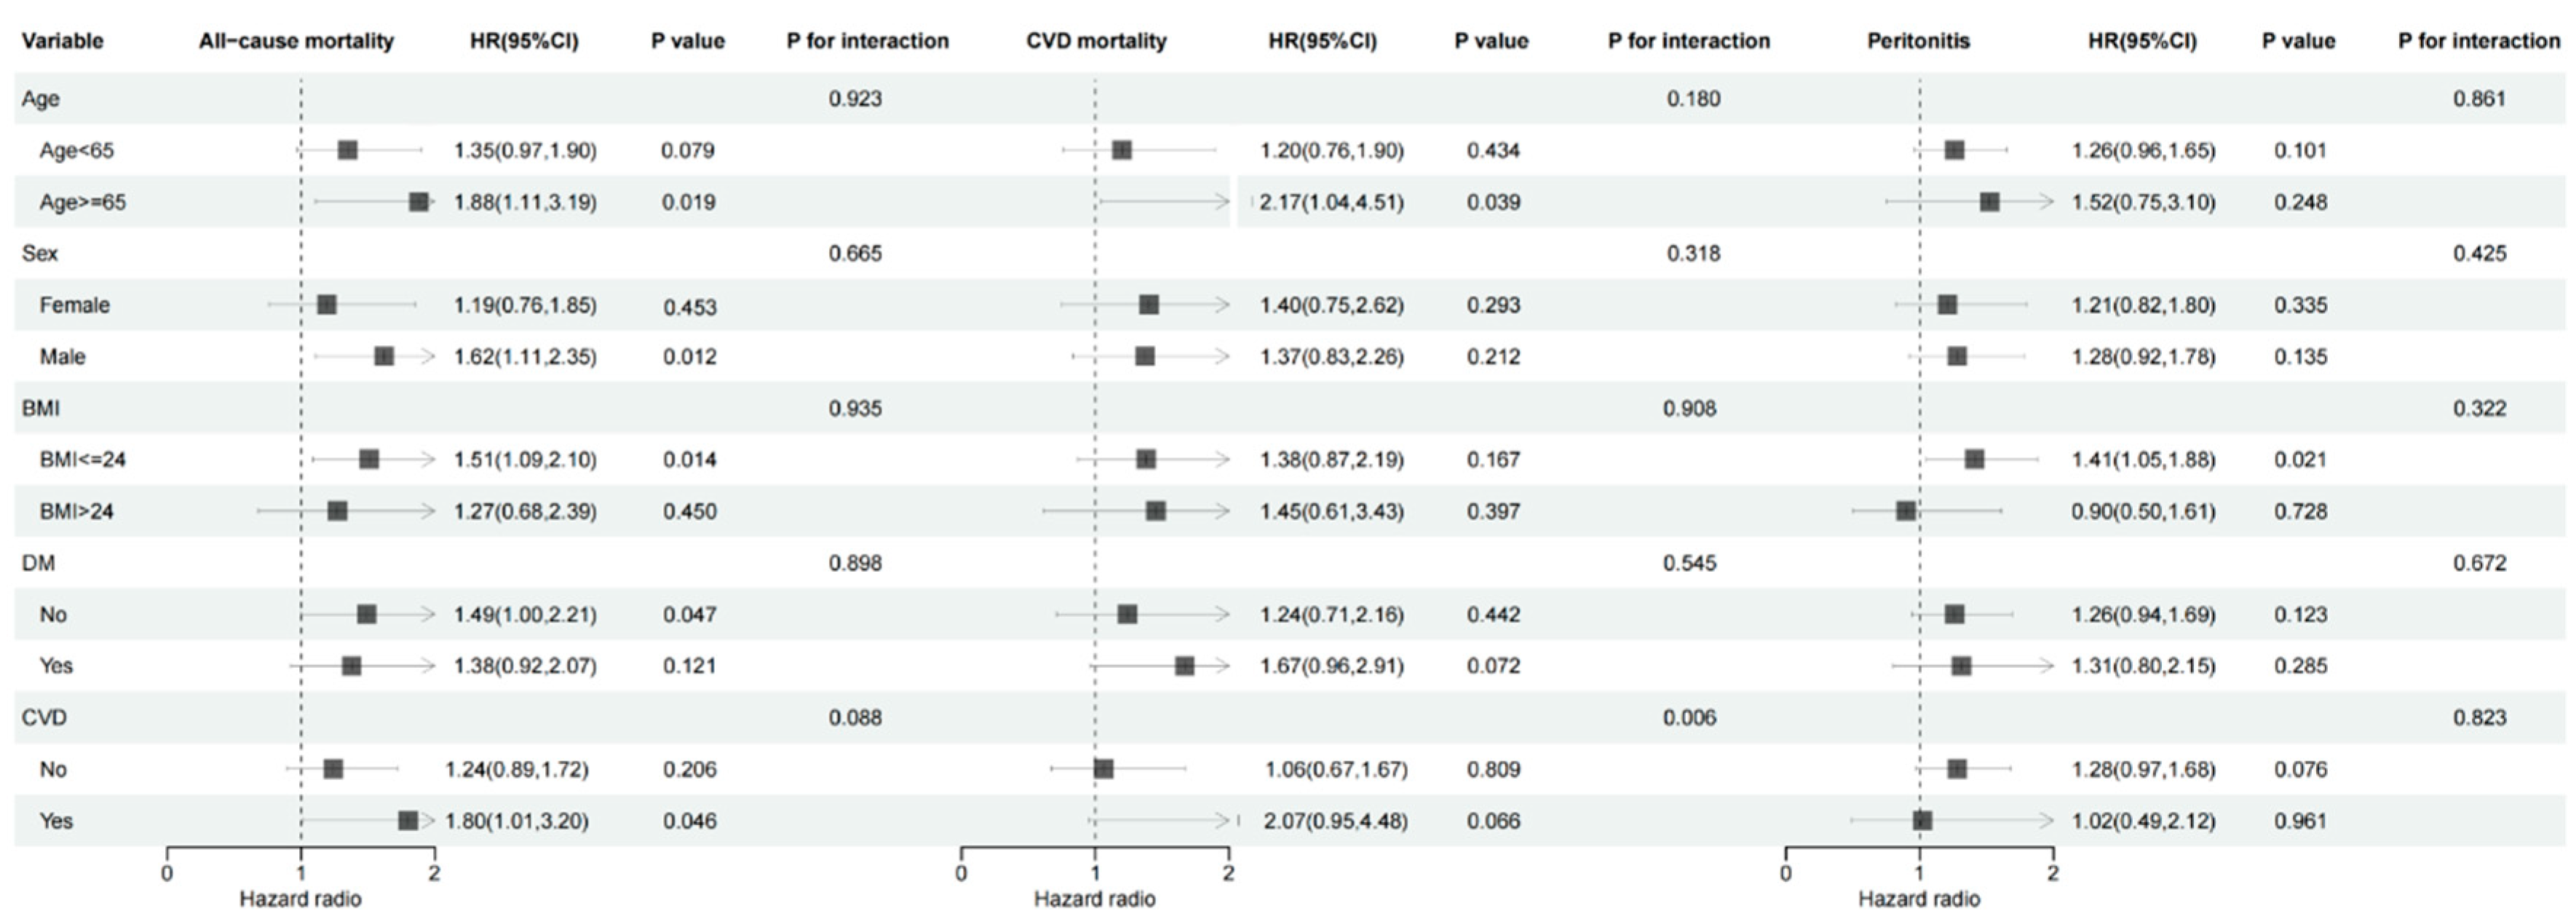

Table 1.
Baseline demographics and clinical characteristics and laboratory data of subjects according to AIP tertile group.
Table 1.
Baseline demographics and clinical characteristics and laboratory data of subjects according to AIP tertile group.
| Variables | Total (n = 2460) | AIP | P | ||
|---|---|---|---|---|---|
| < -0.05 | -0.05-0.2 | > 0.20 | |||
| (n = 815) | (n = 837) | (n = 808) | |||
| Age (yr) | 45.9±14.6 | 45.2±14.3 | 44.4±14.2 | 48.1±14.9 | < 0.001 |
| Male (n, %) | 1456(59.2) | 473 (58.0) | 486 (58.1) | 497 (61.5) | 0.261 |
| BMI (kg/m2) | 21.79±3.92 | 20.98±4.90 | 21.58±3.17 | 22.81±3.29 | < 0.001 |
| Primary kidney disease (n, %) | < 0.001 | ||||
| Glomerulonephritis | 1496(60.8) | 531(65.2) | 528(63.1) | 437(54.1) | |
| Diabetic nephropathy | 479(19.5) | 139(17.1) | 146(17.4) | 194(24.0) | |
| Renal vascular diseases | 204(8.3) | 55(6.7) | 69(8.2) | 80(9.9) | |
| Other | 281(11.4) | 90(11.0) | 94(11.2) | 97(12.0) | |
| Comorbidities | |||||
| Diabetes (n, %) | 498(20.2) | 142(17.4) | 150(17.9) | 206(25.5) | < 0.001 |
| CVD (n, %) | 290(11.8) | 80(9.8) | 87(10.4) | 123(15.2) | 0.001 |
| Medication use | |||||
| ACEI (n, %) | 277(11.3) | 95(11.7) | 81(9.7) | 101(12.5) | 0.176 |
| ARB (n, %) | 1047(42.6) | 376(46.1) | 340(40.6) | 331(41.0) | 0.041 |
| Lowing-lipid drugs | 315(12.8) | 79(9.7) | 104(12.4) | 132(16.3) | < 0.001 |
| AIP | 0.07(-0.11,0.28) | -0.20(-0.31,-0.11) | 0.07(0.01,0.14) | 0.37(0.28,0.52) | < 0.001 |
| HDL-C (mmol/L) | 1.27±0.40 | 1.58±0.42 | 1.24±0.28 | 0.98±0.23 | < 0.001 |
| LDL-C (mmol/L) | 3.00±0.94 | 2.94±0.89 | 3.10±0.95 | 2.96±0.97 | < 0.001 |
| TC (mmol/L) | 5.07±1.31 | 5.03±1.25 | 5.05±1.31 | 5.13±1.36 | 0.306 |
| TG (mmol/L) | 1.43(1.04, 2.02) | 0.92(0.74,1.11) | 1.43(1.25,1.69) | 2.36(1.92,3.18) | < 0.001 |
| Hemoglobin(g/L) | 107±19 | 106±19 | 108±19 | 107±19 | 0.041 |
| ALB(g/L) | 37.0±4.9 | 36.1±4.7 | 37.1±4.9 | 37.6±4.9 | < 0.001 |
| Calcium (mmol/L) | 2.25±0.20 | 2.21±0.20 | 2.25±0.19 | 2.28±0.21 | < 0.001 |
| Phosphorus (mmol/L) | 1.38±0.44 | 1.39±0.39 | 1.38±0.42 | 1.39±0.50 | 0.873 |
| 24-h urine volume (mL) | 1000(500,1500) | 950(500,1400) | 1000(500,1500) | 950(500,1500) | 0.208 |
| Scr (μmol/L) | 739±249 | 737±246 | 740±247 | 739±255 | 0.970 |
| BUN (mmol/L) | 16.2±5.6 | 17.0±5.9 | 16.2±5.3 | 15.5±5.5 | < 0.001 |
| Glucose (mmol/L) | 5.57±2.42 | 5.38±2.39 | 5.48±2.33 | 5.84±2.52 | < 0.001 |
| UA (μmol/L) | 408±93 | 393±88 | 411±91 | 419±99 | < 0.001 |
| iPTH | 243.6(121.7,400.1) | 271.1(133.7,432.1.6) | 246.8(130.4,398.0) | 215.8(108.2,379.4) | < 0.001 |
| eGFR (mL/min/1.73m2) | 7.02±2.76 | 7.00±2.71 | 7.05±2.81 | 7.01±2.75 | 0.935 |
Note: Continuous variables are presented as mean ± standard deviation or median (interquartile range) and categorical variables are presented as frequency (percentage); aOthers: including chronic tubulointerstitial diseases, obstructive nephropathy, lupous nephritis, polycystic kidney diseases, and unknow; Abbreviations: AIP, atherogenic index of plasma; BMI, body mass index; CVD, cardiovascular disease; ACEI, angiotensin-converting enzyme inhibitor; ARB, angiotensin receptor blocker; HDL-C, high-density lipoprotein cholesterol; LDL-C, low density lipoprotein cholesterol; TC, total cholesterol; TG, triglyceride; ALB, serum albumin, Scr, serum creatinine; BUN, blood urea nitrogen; UA, uric acid; iPTH, intact parathyroid hormone; eGFR, estimated glomerular filtration rate.
Table 2.
Uni- and multivariate Cox regression analysis of outcomes and AIP.
| Outcomes | Event | Model1 | Model 2 | Model 3 | ||||||
|---|---|---|---|---|---|---|---|---|---|---|
| HR (95% CI) | P | HR (95% CI) | P | HR (95% CI) | P | |||||
| All-cause mortality | ||||||||||
| Continuous AIP | 655/2460 | 1.814(1.402,2.349) | <0.001 | 1.419(1.072,1.878) | 0.014 | 1.421(1.075,1.879) | 0.014 | |||
| AIP categories | ||||||||||
| Tertile 1 | 206/815 | [Reference] | [Reference] | [Reference] | ||||||
| Tertile 2 | 196/837 | 0.964(0.792,1.173) | 0.715 | 0.953(0.773,1.176) | 0.656 | 0.969(0.785,1.196) | 0.768 | |||
| Tertile 3 | 253/808 | 1.505(1.251,1.810) | <0.001 | 1.271(1.039,1.555) | 0.020 | 1.280(1.046,1.567) | 0.017 | |||
| Cardiovascular mortality | ||||||||||
| Continuous AIP | 344/2460 | 1.892(1.326,2.699) | <0.001 | 1.385(0.944,2.033) | 0.096 | 1.385(0.943,2.033) | 0.096 | |||
| AIP categories | ||||||||||
| Tertile 1 | 96/815 | [Reference] | [Reference] | [Reference] | ||||||
| Tertile 2 | 110/837 | 1.165(0.885,1.533) | 0.275 | 1.153(0.862,1.543) | 0.338 | 1.149(0.858,1.539) | 0.352 | |||
| Tertile 3 | 138/808 | 1.754(1.350,2.278) | <0.001 | 1.433(1.080,1.902) | 0.013 | 1.430(1.078,1.899) | 0.013 | |||
| Peritonitis | ||||||||||
| Continuous AIP | 866/2460 | 1.266(1.007,1.593) | 0.044 | 1.275(0.992,1.637) | 0.057 | 1.272(0.990,1.634) | 0.060 | |||
| AIP categories | ||||||||||
| Tertile 1 | 288/815 | [Reference] | [Reference] | [Reference] | ||||||
| Tertile 2 | 310/837 | 1.130(0.962,1.327) | 0.138 | 1.191(1.007,1.409) | 0.042 | 1.182(0.999,1.399) | 0.052 | |||
| Tertile 3 | 268/808 | 1.199(1.014,1.417) | 0.034 | 1.209(1.010,1.449) | 0.039 | 1.204(1.005,1.442) | 0.044 | |||
Model 1, unadjusted. Model 2, adjusted for age, gender, body mass index, history of diabetes mellitus, history of cardiovascular disease, serum albumin, uric acid, Calcium, low density lipoprotein cholesterol, blood urea nitrogen, intact parathyroid hormone, glucose, hemoglobin. Model 3, adjusted for Model 2 covariates and lowing-lipid drug.
Disclaimer/Publisher’s Note: The statements, opinions and data contained in all publications are solely those of the individual author(s) and contributor(s) and not of MDPI and/or the editor(s). MDPI and/or the editor(s) disclaim responsibility for any injury to people or property resulting from any ideas, methods, instructions or products referred to in the content. |
© 2025 by the authors. Licensee MDPI, Basel, Switzerland. This article is an open access article distributed under the terms and conditions of the Creative Commons Attribution (CC BY) license (http://creativecommons.org/licenses/by/4.0/).
Copyright: This open access article is published under a Creative Commons CC BY 4.0 license, which permit the free download, distribution, and reuse, provided that the author and preprint are cited in any reuse.


