
Submitted:
23 December 2024
Posted:
24 December 2024
You are already at the latest version
Abstract
Background: Chronic kidney disease (CKD) patients have an increased risk of cardiovascular disease (CVD), necessitating effective risk assessment methods. This study evaluates the calcium-phosphorus product (Ca×P) to estimated glomerular filtration rate (Ca×P/eGFR) ratio as a potential biomarker for predicting CV risk in pre-dialysis CKD patients. Methods: Eighty-four CKD patients in stages G1 - G4, according to the KDIGO criteria, were classified into CVD (n = 43) and non-CVD (n = 41) groups. Biochemical parameters, including serum creatinine (SCr), blood urea nitrogen (BUN), calcium (Ca), inorganic phosphate (Pi), parathyroid hormone (PTH), alkaline phosphatase (ALP), Ca×P, eGFR, and the Ca×P/eGFR ratio, were measured and calculated. Statistical analyses were performed to identify predictors of CV risk and evaluate the diagnostic reliability of the Ca×P/eGFR ratio for predicting the risk. Results: Significant differences were observed in SCr, BUN, eGFR (p < 0.001) and the Ca×P/eGFR ratio (p = 0.007) between the groups. Regression analysis indicated the Ca×P/eGFR ratio as a significant CVD risk predictor (p = 0.012, OR = 1.206, 95% CI: 1.042-1.395). Receiver Operating Characteristic (ROC) curve analysis revealed an AUC of 0.751 (p < 0.001, 95% CI: 0.645–0.857), with sensitivity and specificity of the method 74.4% and 70.7%, respectively. Significant correlations were found between the Ca×P/eGFR ratio and SCr, BUN, UA, Ca, Pi, PTH, and ALP. Conclusions: The Ca×P/eGFR ratio is a significant predictor of CVD risk in pre-dialysis CKD patients, suggesting its integration into routine evaluations could improve CV risk stratification and management.
Keywords:
chronic kidney disease
; cardiorenal syndrome type 4
; cardiovascular risk
; biomarkers of kidney function
1. Introduction
Chronic kidney disease (CKD) is a progressive condition affecting over 10% of the global population [1]. Patients with CKD have an increased risk of cardiovascular (CV) events and mortality even in the early stages of the disease (stages G1–G3), which significantly increases in the advanced stages (stages G4 and G5), where about 50% of deaths are related to CV diseases (CVD) [2]. CKD results in a chronic pro-inflammatory state that contributes to vascular and myocardial remodeling, accelerating the aging of the CV system, with hypertension further enhancing this process [3,4]. This is a prerequisite for the development of atherosclerosis, vascular calcification, myocardial fibrosis, and heart valve calcification, which are major factors for CV events and mortality in patients with CKD [5,6,7,8]. Often, the engagement of the CV system in the course of CKD is termed chronic renocardiac syndrome, or cardiorenal syndrome type 4 (CRS type 4) [9,10,11,12]. The management of CRS type 4 should include not only control of renal function but also active assessment and management of CVD risk to reduce mortality and improve the quality of life of patients [13]. In this article, we propose an innovative approach to assess CVD risk in pre-dialysis CKD patients by using the ratio of calcium-phosphorus product (Ca×P) to estimated glomerular filtration rate (Ca×P/eGFR) [14,15]. This method enables the calculation of CV risk using routine indicators, making the assessment more accessible and easier to apply in daily clinical practice.
2. Materials and Methods
2.1. Study Design and Participants
The study involved 84 patients (32 men and 52 women) in predialysis CKD stages (G1 - G4), according to the Kidney Disease: Improving Global Outcomes (KDIGO) criteria [16]. The stage of the disease was determined based on the estimated glomerular filtration rate (eGFR), calculated using the Modification of Diet in Renal Disease (MDRD) equation [17]. The study population was divided into two groups: a group with CVD (CVD group, n = 43) and a group without CVD (non-CVD group, n = 41). The data on CVD, including hypertension (HTN), coronary artery disease (CAD), heart failure (HF), cardiac valve calcification (CVC), peripheral arterial disease (PAD), and arrhythmias, were confirmed through a comprehensive cardiological examination that included blood pressure measurement, electrocardiograms, echocardiography, angiography, and Doppler ultrasound. Patients with acute kidney injury, end-stage kidney disease (stage G5), liver disease, active inflammatory diseases or infections, and those who had undergone kidney transplantation were excluded from the study. The research was conducted in accordance with the ethical principles for medical research as specified in the Declaration of Helsinki and received approval from the Research Ethics Committee of Medical University-Pleven.
2.2. Biochemical Analysis
Blood samples were collected in the morning after overnight fasting and were centrifuged at 2500 rpm for 10 minutes to separate the serum. The concentrations of serum creatinine (SCr), blood urea nitrogen (BUN), uric acid (UA), calcium (Ca), inorganic phosphate (Pi), parathyroid hormone (PTH), and alkaline phosphatase (ALP) were measured using Roche Cobas E 311 and Cobas E 411 analyzers.
2.3. Calculation of Ca×P/eGFR Ratio
Given the small numerical values of the Ca×P/eGFR ratio, expressing it as a percentage enhances the interpretability of the results and provides a better presentation of the data (Table 4).
2.4. Statistical Analysis
Statistical analyses were carried out using SPSS version 23.0 (SPSS, Inc., Chicago, IL, USA). Analysis of variance (ANOVA) was conducted to assess the differences between the means of the groups. Binary logistic regression analysis was used to identify single predictors of CVD risk. After testing for multicollinearity, the statistically significant variables were introduced into the multivariate binary logistic regression to identify the independent risk factors (forward stepwise selection method). The results are presented as the odds ratio (OR), 95% confidence interval (CI), and p-value. The Receiver Operating Characteristic (ROC) curve analysis was used to evaluate the diagnostic performance of the Ca×P/eGFR ratio in predicting the risk of CVD. The results are expressed as the area under the curve (AUC), p-value, and 95% CI. The optimal cut-off value was determined using Youden’s index [18]. Pearson’s correlation coefficient was used to determine significant relationships between the Ca×P/eGFR ratio and the other baseline variables. Statistical significance was considered at p < 0.05.
3. Results
3.1. Baseline Patient Characteristics
Significant differences were observed in eGFR (p < 0.001), SCr (p < 0.001), BUN (p < 0.001), and the Ca×P/eGFR ratio (p = 0.007) between groups with and without CVD. Other variables, including UA, Ca, Pi, Ca×P, PTH, and ALP, did not show significant differences between the two groups (Table 1).
3.2. Ca×P/eGFR Ratio as a Predictor of CVD Risk
The Ca×P/eGFR ratio was statistically significantly higher in patients with CVD compared to those without CVD (p = 0.007). The non-CVD group (n = 41) had a mean ratio of 0.05 ± 0.04 (mmol/L)²/(mL/min/1.73 m²), while the CVD group (n = 43) had a mean ratio of 0.07 ± 0.04 (mmol/L)²/(mL/min/1.73 m²). This suggests that the Ca×P/eGFR ratio is elevated in patients with CVD, indicating a potential association between this ratio and increased CV risk (Figure 1).
The binary logistic regression analysis identified several predictors of CVD risk in pre-dialysis CKD patients. In the univariate analysis, elevated levels of BUN (p = 0.002) and SCr (p = 0.001) were significant predictors of CVD risk, with higher levels associated with increased risk (OR = 1.317, 95% CI: 1.109–1.563 for BUN; OR = 1.018, 95% CI: 1.007–1.029 for SCr). Lower eGFR levels were significantly associated with a higher risk of CVD (p < 0.001, OR = 0.963, 95% CI: 0.944–0.982). Additionally, the Ca×P/eGFR ratio was also identified as a significant predictor of CVD risk (p = 0.012). The odds ratio (OR) for the Ca×P/eGFR ratio was 1.206 (95% CI: 1.042–1.395), indicating that higher values of the Ca×P/eGFR ratio are associated with an increased risk of CVD. Specifically, for each unit increase in the Ca×P/eGFR ratio, the odds of developing CVD increase by approximately 20.6%. This finding suggests that the Ca×P/eGFR ratio could be a valuable marker for assessing CVD risk in CKD patients, as it reflects the combined impact of calcium-phosphorus levels and renal function on CV health. In the multivariate analysis, only eGFR remained a significant predictor of CVD risk (p < 0.001, OR = 0.963, 95% CI: 0.944–0.982). This indicates that lower eGFR levels are independently associated with a higher risk of CVD in the CKD cohort. The Ca×P/eGFR ratio, although not an independent predictor in the multivariate analysis, showed a significant association with CVD risk in the univariate analysis, highlighting its potential as a marker for CV risk assessment in CKD patients. These findings underscore the importance of monitoring eGFR levels and considering the Ca×P/eGFR ratio in the management and risk assessment of CVD in CKD patients (Table 2).
To evaluate the diagnostic performance of the Ca×P/eGFR ratio in predicting the risk of CVD, ROC analysis was used. The ROC curve demonstrated a significant AUC of 0.751 (p < 0.001, 95% CI: 0.645–0.857), indicating a relatively good discriminatory ability to distinguish between patients at high and low risk of CVD. A cut-off value of 0.048 (mmol/L)²/(mL/min/1.73 m²) was identified as optimal, with a sensitivity of 74.4% and a specificity of 70.7%. This means that at this cut-off, the test correctly identifies 74.4% of patients who will develop CVD (true positives) and correctly identifies 70.7% of patients who will not develop CVD (true negatives). Overall, these results support the use of the Ca×P/eGFR ratio as a valuable tool for CVD risk stratification in CKD patients before dialysis (Figure 2).
The Pearson correlation analysis revealed significant correlations between the Ca×P/eGFR ratio and various indicators of renal function. The strongest positive correlation was observed between the Ca×P/eGFR ratio and SCr (r = 0.841, R² = 0.707, p < 0.001). A strong negative correlation was found between the Ca×P/eGFR ratio and eGFR (r = -0.796, R² = 0.633, p < 0.001). Significant positive correlations were also observed between the Ca×P/eGFR ratio and BUN (r = 0.723, R² = 0.523, p < 0.001), Ca (r = 0.491, R² = 0.241, p < 0.001), Pi (r = 0.458, R² = 0.210, p < 0.001), and ALP (r = 0.399, R² = 0.159, p < 0.001). Moderate positive correlations were observed between the Ca×P/eGFR ratio and UA (r = 0.264, R² = 0.070, p = 0.043) and PTH (r = 0.366, R² = 0.134, p = 0.016). The marked correlations between the Ca×P/eGFR ratio and various parameters of renal function highlight the potential of the Ca×P/eGFR ratio as an important indicator for evaluating renal function and its influence on CV health in CKD patients (Table 3).
4. Discussion
The development of CRS type 4 is most often attributed to the following four pathophysiological mechanisms: 1) disturbances in calcium and phosphorus metabolism, resulting in medial vascular calcification and calcification of the heart valves; 2) pro-inflammatory and pro-fibrotic changes associated with CKD, leading to conditions such as atherosclerosis, coronary artery disease, myocardial fibrosis, heart failure, and arrhythmias; 3) complications of renal hypertension affecting the CV system, including myocardial infarction, stroke and heart failure; and 4) other accompanying disorders, such as anemia, volume overload, and electrolyte imbalance, leading to increased cardiac workload and arrhythmogenesis.
The identification of appropriate biomarkers that reflect these mechanisms poses a significant challenge. The biomarkers can be any measurable parameter, such as components of serum or urine, or other variables, which may facilitate diagnosis and monitoring of the progression of chronic renocardiac syndrome [11]. The development of CRS type 4 leads to neurohormonal activation (mainly of the renin-angiotensin-aldosterone system), hemodynamic changes, chronic inflammation, oxidative stress, and endothelial dysfunction, which ultimately result in damage and fibrosis of the heart and vessels [9,19,20,21,22,23]. In this regard, biomarkers can reflect, either alone or in combination, each one of these pathological processes. The biomarkers that have been found to be associated with CRS type 4 to date include brain natriuretic peptide (BNP), N-terminal pro-brain natriuretic peptide (NT-proBNP), cardiac troponins, urotensin II, galectin-3, creatinine, microalbuminuria, uric acid, cystatin C, homocysteine, and aldosterone [22,24,25].
The Ca×P/eGFR ratio we suggest represents a marker that unifies various aspects of the pathophysiological processes associated with CRS type 4. It integrates information about calcium-phosphorus metabolism with information about renal function, expressed through the eGFR. The ratio helps assess mineral metabolism in the body, which is particularly important in patients with CKD, where an imbalance of calcium and phosphate can lead to bone and CV complications [26,27,28,29,30,31]. This imbalance can cause the calcification of soft tissues, including arteries and heart valves, which significantly increases the risk of CVD [6,7,32,33,34,35,36,37,38]. High levels of calcium-phosphate product (Ca×P) are also associated with a greater likelihood of developing vascular calcification and an increased CV risk [39,40,41,42,43,44,45]. On the other hand, a progressive decline in eGFR is associated with an increased likelihood of CV events, such as myocardial infarction, stroke, and heart failure [46,47,48,49,50,51,52]. Patients with reduced eGFR often have secondary hypertension, which is an additional risk factor for CVD [53,54,55].
The results of our study showed significant differences in eGFR (p < 0.001), SCr (p < 0.001), and BUN (p < 0.001) between groups with and without CVD. However, no significant differences were found in other variables such as Ca, Pi, Ca×P, UA, PTH, and ALP between the two groups (Table 1). Multivariate regression analysis revealed that reduced renal function (lower eGFR) is the main independent risk factor for CVD in patients with CKD (p < 0.001, OR = 0.963) (Table 2). Data for the Ca×P/eGFR ratio showed that it was significantly increased in patients with CVD compared to those without CVD (p = 0.007) (Figure 1). The mean ratio in the non-CVD group was 0.05 ± 0.04 (mmol/L)²/(mL/min/1.73 m²), whereas in the CVD group, it was 0.07 ± 0.04 (mmol/L)²/(mL/min/1.73 m²). Univariate regression analysis identified the Ca×P/eGFR ratio as a significant predictor of CVD risk (p = 0.012), with an OR of 1.206, highlighting its potential as a marker for CV risk (Table 2). ROC analysis demonstrated that the Ca×P/eGFR ratio has relatively good discriminatory ability to distinguish between patients at high and low risk of CVD (AUC 0.751, p < 0.001), with a sensitivity of 74.4% and a specificity of 70.7% (Figure 2). Significant correlations were also found between the Ca×P/eGFR ratio and various indicators of renal function, revealing a close association between the Ca×P/eGFR ratio and renal performance (Table 3).
Based on the results obtained for the Ca×P/eGFR ratio, we developed a scale to measure CV risk in pre-dialysis CKD patients. This scale includes six risk categories ranging from “very low risk” to “extremely high risk” (Table 4).
The scale may serve multiple clinical purposes. It allows for the early identification of patients at increased risk of CV complications, leading to more effective risk management and prevention of serious events. Physicians can implement personalized treatment and prevention strategies, including dietary changes, medication, and monitoring. The scale can also be used to monitor disease progression over time, aiding in the assessment of the current treatment's effectiveness and the need for therapeutic adjustments. Additionally, informing patients about their risk classification can increase their awareness and motivate them to follow recommendations for risk reduction.
Notably, our research is the first to utilize the Ca×P/eGFR ratio as a marker for CV risk. Implementing this ratio in clinical practice may optimize CVD management for CKD patients, allowing physicians to identify high-risk individuals for more effective monitoring and targeted interventions.
Despite the significant findings, our study has several limitations. The sample size is relatively small, which limits the generalizability of the conclusions. Additionally, the study design is cross-sectional, which does not allow for causal inferences to be drawn. Future studies with a larger sample size and a prospective design may confirm our findings and provide a deeper understanding of the relationship between the Ca×P/eGFR ratio and CVD risk in patients with CKD.
5. Conclusions
In summary, our study demonstrates that the Ca×P/eGFR ratio is a reliable predictor of CV risk in pre-dialysis CKD patients. By integrating data on calcium-phosphorus metabolism and renal function, this ratio offers a holistic strategy for CV risk assessment. The findings underscore the necessity of monitoring the Ca×P/eGFR ratio in clinical practice, which could substantially improve the early identification and management of high-risk patients. Additionally, the study establishes a foundation for future research aimed at refining and validating this predictive tool in various clinical settings.
Author Contributions
Conceptualization, K.K.; methodology, K.K.; software, K.K.; validation, K.K., formal analysis, K.K.; investigation, T.S., B.I. and T.E.; resources, T.S., B.I. and T.E.; data curation, T.S., B.I. and T.E.; writing—original draft preparation, K.K.; writing—review and editing, K.K.; visualization, K.K.; project administration, K.K. and B.I. All authors have read and agreed to the published version of the manuscript.
Funding
The APC was funded by Medical University-Pleven, Bulgaria.
Institutional Review Board Statement
The study was conducted according to the guidelines of the Declaration of Helsinki, and approved by the Research Ethics Committee of Medical University-Pleven (IRB approval No. 797-REC/21.06.2024).
Informed Consent Statement
Informed consent was obtained from all subjects involved in the study.
Conflicts of Interest
The authors declare no conflict of interest.
References
- Xie, Y., Bowe B., Mokdad, A.H., Xian, H., Yan, Y., Li, T., Maddukuri, G., Tsai, C.Y., Floyd, T., Al-Aly, Z. Analysis of the Global Burden of Disease Study Highlights the Global, Regional, and National Trends of Chronic Kidney Disease Epidemiology from 1990 to 2016. Kidney Int. 2018, 94, 567-581.
- Saeed, D., Reza, T., Shahzad, M.W., Karim Mandokhail, A., Bakht, D., Qizilbash, F.H., Silloca-Cabana, E.O., Ramadhan, A., Bokhari, S.F.H. Navigating the Crossroads: Understanding the Link Between Chronic Kidney Disease and Cardiovascular Health. Cureus 2023, 15, e51362.
- Jankowski, J., Floege, J., Fliser, D., Böhm, M., Marx, N. Cardiovascular Disease in Chronic Kidney Disease: Pathophysiological Insights and Therapeutic Options. Circulation 2021,143, 1157-1172.
- Xu, C., Tsihlis, G., Chau, K., Trinh, K., Rogers, N.M., Julovi, S.M. Novel Perspectives in Chronic Kidney Disease-Specific Cardiovascular Disease. Int. J. Mol. Sci. 2024, 25, 2658.
- Nakano, T. Atherosclerotic Diseases in Chronic Kidney Disease. J. Atheroscler. Thromb. 2024, RV22030.
- Ren, S.C., Mao, N., Yi, S., Ma, X., Zou, J.Q., Tang, X., Fan, J.M. Vascular Calcification in Chronic Kidney Disease: An Update and Perspective. Aging Dis. 2022, 13, 673-697.
- Ureña-Torres, P., D'Marco, L., Raggi, P., García-Moll, X., Brandenburg, V., Mazzaferro, S., Lieber, A., Guirado, L., Bover, J. Valvular heart disease and calcification in CKD: more common than appreciated. Nephrol. Dial. Transplant. 2020, 35, 2046-2053.
- Romero-González, G., González, A., López, B., Ravassa, S., Díez, J. Heart failure in chronic kidney disease: the emerging role of myocardial fibrosis. Nephrol. Dial. Transplant. 2022, 37, 817-824.
- Minciunescu, A., Genovese, L., deFilippi, C. Cardiovascular Alterations and Structural Changes in the Setting of Chronic Kidney Disease: A Review of Cardiorenal Syndrome Type 4. SN Compr. Clin. Med. 2022, 5, 15.
- Rangaswami, J., Bhalla, V., Blair, J.E.A., Chang, T.I., Costa, S., Lentine, K.L., Lerma, E.V., Mezue, K., Molitch, M., Mullens, W., Ronco, C., Tang, W.H.W., McCullough, P.A. American Heart Association Council on the Kidney in Cardiovascular Disease and Council on Clinical Cardiology. Cardiorenal Syndrome: Classification, Pathophysiology, Diagnosis, and Treatment Strategies: A Scientific Statement from the American Heart Association. Circulation. 2019, 139, e840-e878.
- Pinheiro da Silva, A.L., Vaz da Silva, M.J. Type 4 Cardiorenal Syndrome. Rev. Port. Cardiol. 2016, 35, 601-616.
- Ronco, C., Haapio, M., House, A.A., Anavekar, N., Bellomo, R. Cardiorenal Syndrome. J. Am. Coll. Cardiol. 2008, 52, 1527-1539.
- Mitsas, A.C., Elzawawi, M., Mavrogeni, S., Boekels, M., Khan, A., Eldawy, M., Stamatakis, I., Kouris, D., Daboul, B., Gunkel, O., Bigalke, B., van Gisteren, L., Almaghrabi, S., Noutsias, M. Heart Failure and Cardiorenal Syndrome: A Narrative Review on Pathophysiology, Diagnostic and Therapeutic Regimens-From a Cardiologist's View. J. Clin. Med. 2022, 11, 7041.
- Abe, S., Yoshihisa, A., Oohara, H., Sugawara, Y., Sato, Y., Misaka, T., Sato, T., Oikawa, M., Kobayashi, A., Yamaki, T., Nakazato, K., Takeishi, Y. Calcium-Phosphorus Product Is Associated with Adverse Prognosis in Hospitalized Patients with Heart Failure and Chronic Kidney Disease. Int. Heart J. 2024, 65, 84-93.
- Stevens, L.A., Coresh, J., Greene, T., Levey, A.S. Assessing Kidney Function—Measured and Estimated Glomerular Filtration Rate. N. Engl. J. Med. 2006, 354, 2473-2483.
- Kidney Disease: Improving Global Outcomes (KDIGO) CKD Work Group. KDIGO 2012 Clinical Practice Guideline for the Evaluation and Management of Chronic Kidney Disease. Kidney. Int. Suppl. 2013, 3, 1-150.
- Levey, A.S., Coresh, J., Greene, T., Marsh, J., Stevens, L.A., Kusek, J.W., Van Lente, F. Chronic Kidney Disease Epidemiology Collaboration. Expressing the Modification of Diet in Renal Disease Study equation for estimating glomerular filtration rate with standardized serum creatinine values. Clin. Chem. 2007, 53, 766-772.
- Youden, W.J. Index for Rating Diagnostic Tests. Cancer 1950, 3, 32-35.
- Hatamizadeh, P., Fonarow, G.C., Budoff, M.J., Darabian, S., Kovesdy, C.P., Kalantar-Zadeh, K. Cardiorenal Syndrome: Pathophysiology and Potential Targets for Clinical Management. Nat. Rev. Nephrol. 2013, 9, 99-111.
- Ceravolo, G., Macchia, T., Cuppari, C., Dipasquale, V., Gambadauro, A., Casto, C., Ceravolo, M.D., Cutrupi, M., Calabrò, M.P., Borgia, P., Piccolo, G., Mancuso, A., Albiero, R., Chimenz, R. Update on the Classification and Pathophysiological Mechanisms of Pediatric Cardiorenal Syndromes. Children 2021, 8, 528.
- Sárközy, M., Kovács, Z.Z.A., Kovács, M.G., Gáspár, R., Szűcs, G., Dux, L. Mechanisms and Modulation of Oxidative/Nitrative Stress in Type 4 Cardio-Renal Syndrome and Renal Sarcopenia. Front. Physiol. 2018, 9, 1648.
- Buliga-Finis, O.N., Ouatu, A., Badescu, M.C., Dima, N., Tanase, D.M., Richter, P., Rezus, C. Beyond the Cardiorenal Syndrome: Pathophysiological Approaches and Biomarkers for Renal and Cardiac Crosstalk. Diagnostics 2022, 12, 773.
- Granata, A., Clementi, A., Virzì, G.M., Brocca, A., de Cal, M., Scarfia, V.R., Zanoli, L., Ronco, C., Corrao, S., Malatino, L. Cardiorenal Syndrome Type 4: From Chronic Kidney Disease to Cardiovascular Impairment. Eur. J. Intern. Med. 2016, 30, 1-6.
- Fu, S., Zhao, S., Ye, P., Luo, L. Biomarkers in Cardiorenal Syndromes. Biomed. Res. Int. 2018, 9617363.
- Chung, E.Y.M., Trinh, K., Li, J., Hahn, S.H., Endre, Z.H., Rogers, N.M., Alexander, S.I. Biomarkers in Cardiorenal Syndrome and Potential Insights into Novel Therapeutics. Front. Cardiovasc. Med. 2022, 9, 868658.
- Mok, Y., Wang, F., Ballew, S.H., Menez, S., Butler, K.R., Wagenknecht, L., Sedaghat, S., Lutsey, P.L., Coresh, J., Blaha, M.J., Matsushita, K. Kidney Function, Bone-Mineral Metabolism Markers, and Calcification of Coronary Arteries, Aorta, and Cardiac Valves in Older Adults. Atherosclerosis 2023, 368, 35-43.
- Kaur, R., Singh, R. Mechanistic Insights into CKD-MBD-Related Vascular Calcification and Its Clinical Implications. Life Sci. 2022, 311, 121148.
- Foley, R.N. Phosphate Levels and Cardiovascular Disease in the General Population. Clin. J. Am. Soc. Nephrol. 2009, 4, 1136-1139.
- Giachelli, C.M. The Emerging Role of Phosphate in Vascular Calcification. Kidney Int. 2009, 75, 890-897.
- Block, G., Port, F.K. Calcium Phosphate Metabolism and Cardiovascular Disease in Patients with Chronic Kidney Disease. Semin. Dial. 2003, 16, 140-147.
- Ogata, H., Sugawara, H., Yamamoto, M., Ito, H. Phosphate and Coronary Artery Disease in Patients with Chronic Kidney Disease. J. Atheroscler. Thromb. 2024, 31, 1-14.
- Lee, S.J., Lee, I.K., Jeon, J.H. Vascular Calcification—New Insights into Its Mechanism. Int. J. Mol. Sci. 2020, 21, 2685.
- Villa-Bellosta, R. Vascular Calcification: Key Roles of Phosphate and Pyrophosphate. Int. J. Mol. Sci. 2021, 22, 13536.
- Hutcheson, J.D., Goettsch, C. Cardiovascular Calcification Heterogeneity in Chronic Kidney Disease. Circ. Res. 2023, 132, 993-1012.
- Siracusa, C., Carabetta, N., Morano, M. B., Manica, M., Strangio, A., Sabatino, J., Leo, I., Castagna, A., Cianflone, E., Torella, D., Andreucci, M., Zicarelli, M. T., Musolino, M., Bolignano, D., Coppolino, G., De Rosa, S. Understanding Vascular Calcification in Chronic Kidney Disease: Pathogenesis and Therapeutic Implications. Int. J. Mol. Sci. 2024, 25, 13096.
- Kim, J.S., Hwang, H.S. Vascular Calcification in Chronic Kidney Disease: Distinct Features of Pathogenesis and Clinical Implication. Korean Circ. J. 2021, 51, 961-982.
- Dube, P., DeRiso, A., Patel, M., Battepati, D., Khatib-Shahidi, B., Sharma, H., Gupta, R., Malhotra, D., Dworkin, L., Haller, S., Kennedy, D. Vascular Calcification in Chronic Kidney Disease: Diversity in the Vessel Wall. Biomedicines 2021, 9, 404.
- Toussaint, N.D., Kerr, P.G. Vascular Calcification and Arterial Stiffness in Chronic Kidney Disease: Implications and Management. Nephrology 2007, 12, 500-509.
- Cozzolino, M., Dusso, A.S., Slatopolsky, E. Role of Calcium-Phosphate Product and Bone-Associated Proteins on Vascular Calcification in Renal Failure. J. Am. Soc. Nephrol. 2001, 12, 2511-2516.
- Block, G.A., Hulbert-Shearon, T.E., Levin, N.W., Port, F.K. Association of Serum Phosphorus and Calcium X Phosphate Product with Mortality Risk in Chronic Hemodialysis Patients: A National Study. Am. J. Kidney Dis. 1998, 31, 607-617.
- Young, E.W., Albert, J.M., Satayathum, S., Goodkin, D.A., Pisoni, R.L., Akiba, T., Akizawa, T., Kurokawa, K., Bommer, J., Piera, L., Port, F.K. Predictors and Consequences of Altered Mineral Metabolism: The Dialysis Outcomes and Practice Patterns Study. Kidney Int. 2005, 67, 1179-1187.
- Thongprayoon, C., Cheungpasitporn, W., Mao, M.A., Erickson, S.B. Calcium-Phosphate Product and Its Impact on Mortality in Hospitalized Patients. Nephrology 2020, 25, 22-28.
- Cubbon, R.M., Thomas, C.H., Drozd, M., Gierula, J., Jamil, H.A., Byrom, R., Barth, J.H., Kearney, M.T., Witte, K.K. Calcium, Phosphate and Calcium Phosphate Product Are Markers of Outcome in Patients with Chronic Heart Failure. J. Nephrol. 2015, 28, 209-215.
- Menon, V., Greene, T., Pereira, A.A., Wang, X., Beck, G.J., Kusek, J.W., Collins, A.J., Levey, A.S., Sarnak, M.J. Relationship of Phosphorus and Calcium-Phosphorus Product with Mortality in CKD. Am. J. Kidney Dis. 2005, 46, 455-463.
- Cheungpasitporn, W., Thongprayoon, C., Hansrivijit, P., Medaura, J., Chewcharat, A., Bathini, T., Mao, M.A., Erickson, S.B. Impact of Admission Calcium-Phosphate Product on 1-Year Mortality among Hospitalized Patients. Adv. Biomed. Res. 2020, 9, 14.
- Matsushita, K., Ballew, S.H., Wang, A.Y., Kalyesubula, R., Schaeffner, E., Agarwal, R. Epidemiology and Risk of Cardiovascular Disease in Populations with Chronic Kidney Disease. Nat. Rev. Nephrol. 2022, 18, 696-707.
- Cabrera, C.S., Lee, A.S., Olsson, M., Schnecke, V., Westman, K., Lind, M., Greasley, P.J., Skrtic, S. Impact of CKD Progression on Cardiovascular Disease Risk in a Contemporary UK Cohort of Individuals with Diabetes. Kidney Int. Rep. 2020, 5, 1651-1660.
- Matsushita, K., Coresh, J., Sang, Y., Chalmers, J., Fox, C., Guallar, E., Jafar, T., Jassal, S.K., Landman, G.W., Muntner, P., Roderick, P., Sairenchi, T., Schöttker, B., Shankar, A., Shlipak, M., Tonelli, M., Townend, J., van Zuilen, A., Yamagishi, K., Yamashita, K., Gansevoort, R., Sarnak, M., Warnock, D.G., Woodward, M., Ärnlöv, J., CKD Prognosis Consortium. Estimated glomerular filtration rate and albuminuria for prediction of cardiovascular outcomes: a collaborative meta-analysis of individual participant data. Lancet Diabetes Endocrinol. 2015, 3, 514-525.
- van der Velde, M., Matsushita, K., Coresh, J., Astor, B.C., Woodward, M., Levey, A., de Jong, P., Gansevoort, R.T., Chronic Kidney Disease Prognosis Consortium, van der Velde, M., Matsushita, K., Coresh, J., Astor, B.C., Woodward, M., Levey, A.S., de Jong, P.E., Gansevoort, R.T., Levey, A., El-Nahas, M., Eckardt, K.U., Kasiske, B.L., Ninomiya, T., Chalmers, J., Macmahon, S., Tonelli, M., Hemmelgarn, B., Sacks, F., Curhan, G., Collins, A.J., Li, S., Chen, S.C., Hawaii Cohort, K.P., Lee, B.J., Ishani, A., Neaton, J., Svendsen, K., Mann, J.F., Yusuf, S., Teo, K.K., Gao, P., Nelson, R.G., Knowler, W.C., Bilo, H.J., Joosten, H., Kleefstra, N., Groenier, K.H., Auguste, P., Veldhuis, K., Wang, Y., Camarata, L., Thomas, B., Manley, T. Lower Estimated Glomerular Filtration Rate and Higher Albuminuria Are Associated with All-Cause and Cardiovascular Mortality. A Collaborative Meta-Analysis of High-Risk Population Cohorts. Kidney Int. 2011, 79, 1341-1352.
- Bello, A.K., Hemmelgarn, B., Lloyd, A., James, M.T., Manns, B.J., Klarenbach, S., Tonelli, M., Alberta Kidney Disease Network. Associations among Estimated Glomerular Filtration Rate, Proteinuria, and Adverse Cardiovascular Outcomes. Clin. J. Am. Soc Nephrol. 2011, 6, 1418-1426.
- Fox, C.S., Matsushita, K., Woodward, M., Bilo, H.J., Chalmers, J., Heerspink, H.J., Lee, B.J., Perkins, R.M., Rossing, P., Sairenchi, T., Tonelli, M., Vassalotti, J.A., Yamagishi, K., Coresh, J., de Jong, P.E., Wen, C.P., Nelson, R.G., Chronic Kidney Disease Prognosis Consortium. Associations of Kidney Disease Measures with Mortality and End-Stage Renal Disease in Individuals with and without Diabetes: A Meta-Analysis. Lancet 2012, 380, 1662-1673.
- Kottgen, A., Russell, S.D., Loehr, L.R., Crainiceanu, C.M., Rosamond, W.D., Chang, P.P., Chambless, L.E., Coresh, J. Reduced Kidney Function as a Risk Factor for Incident Heart Failure: The Atherosclerosis Risk in Communities (ARIC) Study. J. Am. Soc. Nephrol. 2007, 18, 1307-1315.
- Ku, E., Lee, B.J., Wei, J., Weir, M.R. Hypertension in CKD: Core Curriculum 2019. Am. J. Kidney Dis. 2019, 74, 120-131.
- Nagata, D., Hishida, E., Masuda, T. Practical Strategy for Treating Chronic Kidney Disease (CKD)-Associated with Hypertension. Int. J. Nephrol. Renovasc. Dis. 2020, 13, 171-178.
- Burnier, M., Damianaki, A. Hypertension as Cardiovascular Risk Factor in Chronic Kidney Disease. Circ. Res. 2023, 132, 1050-1063.
Figure 1.
Comparison of the Ca×P/eGFR ratio between patients with and without CVD in the entire CKD cohort. Ca×P/eGFR is presented in (mmol/L)²/(mL/min/1.73 m²). No—non-CVD Group, Yes—CVD Group, p < 0.05, statistically significant.
Figure 1.
Comparison of the Ca×P/eGFR ratio between patients with and without CVD in the entire CKD cohort. Ca×P/eGFR is presented in (mmol/L)²/(mL/min/1.73 m²). No—non-CVD Group, Yes—CVD Group, p < 0.05, statistically significant.
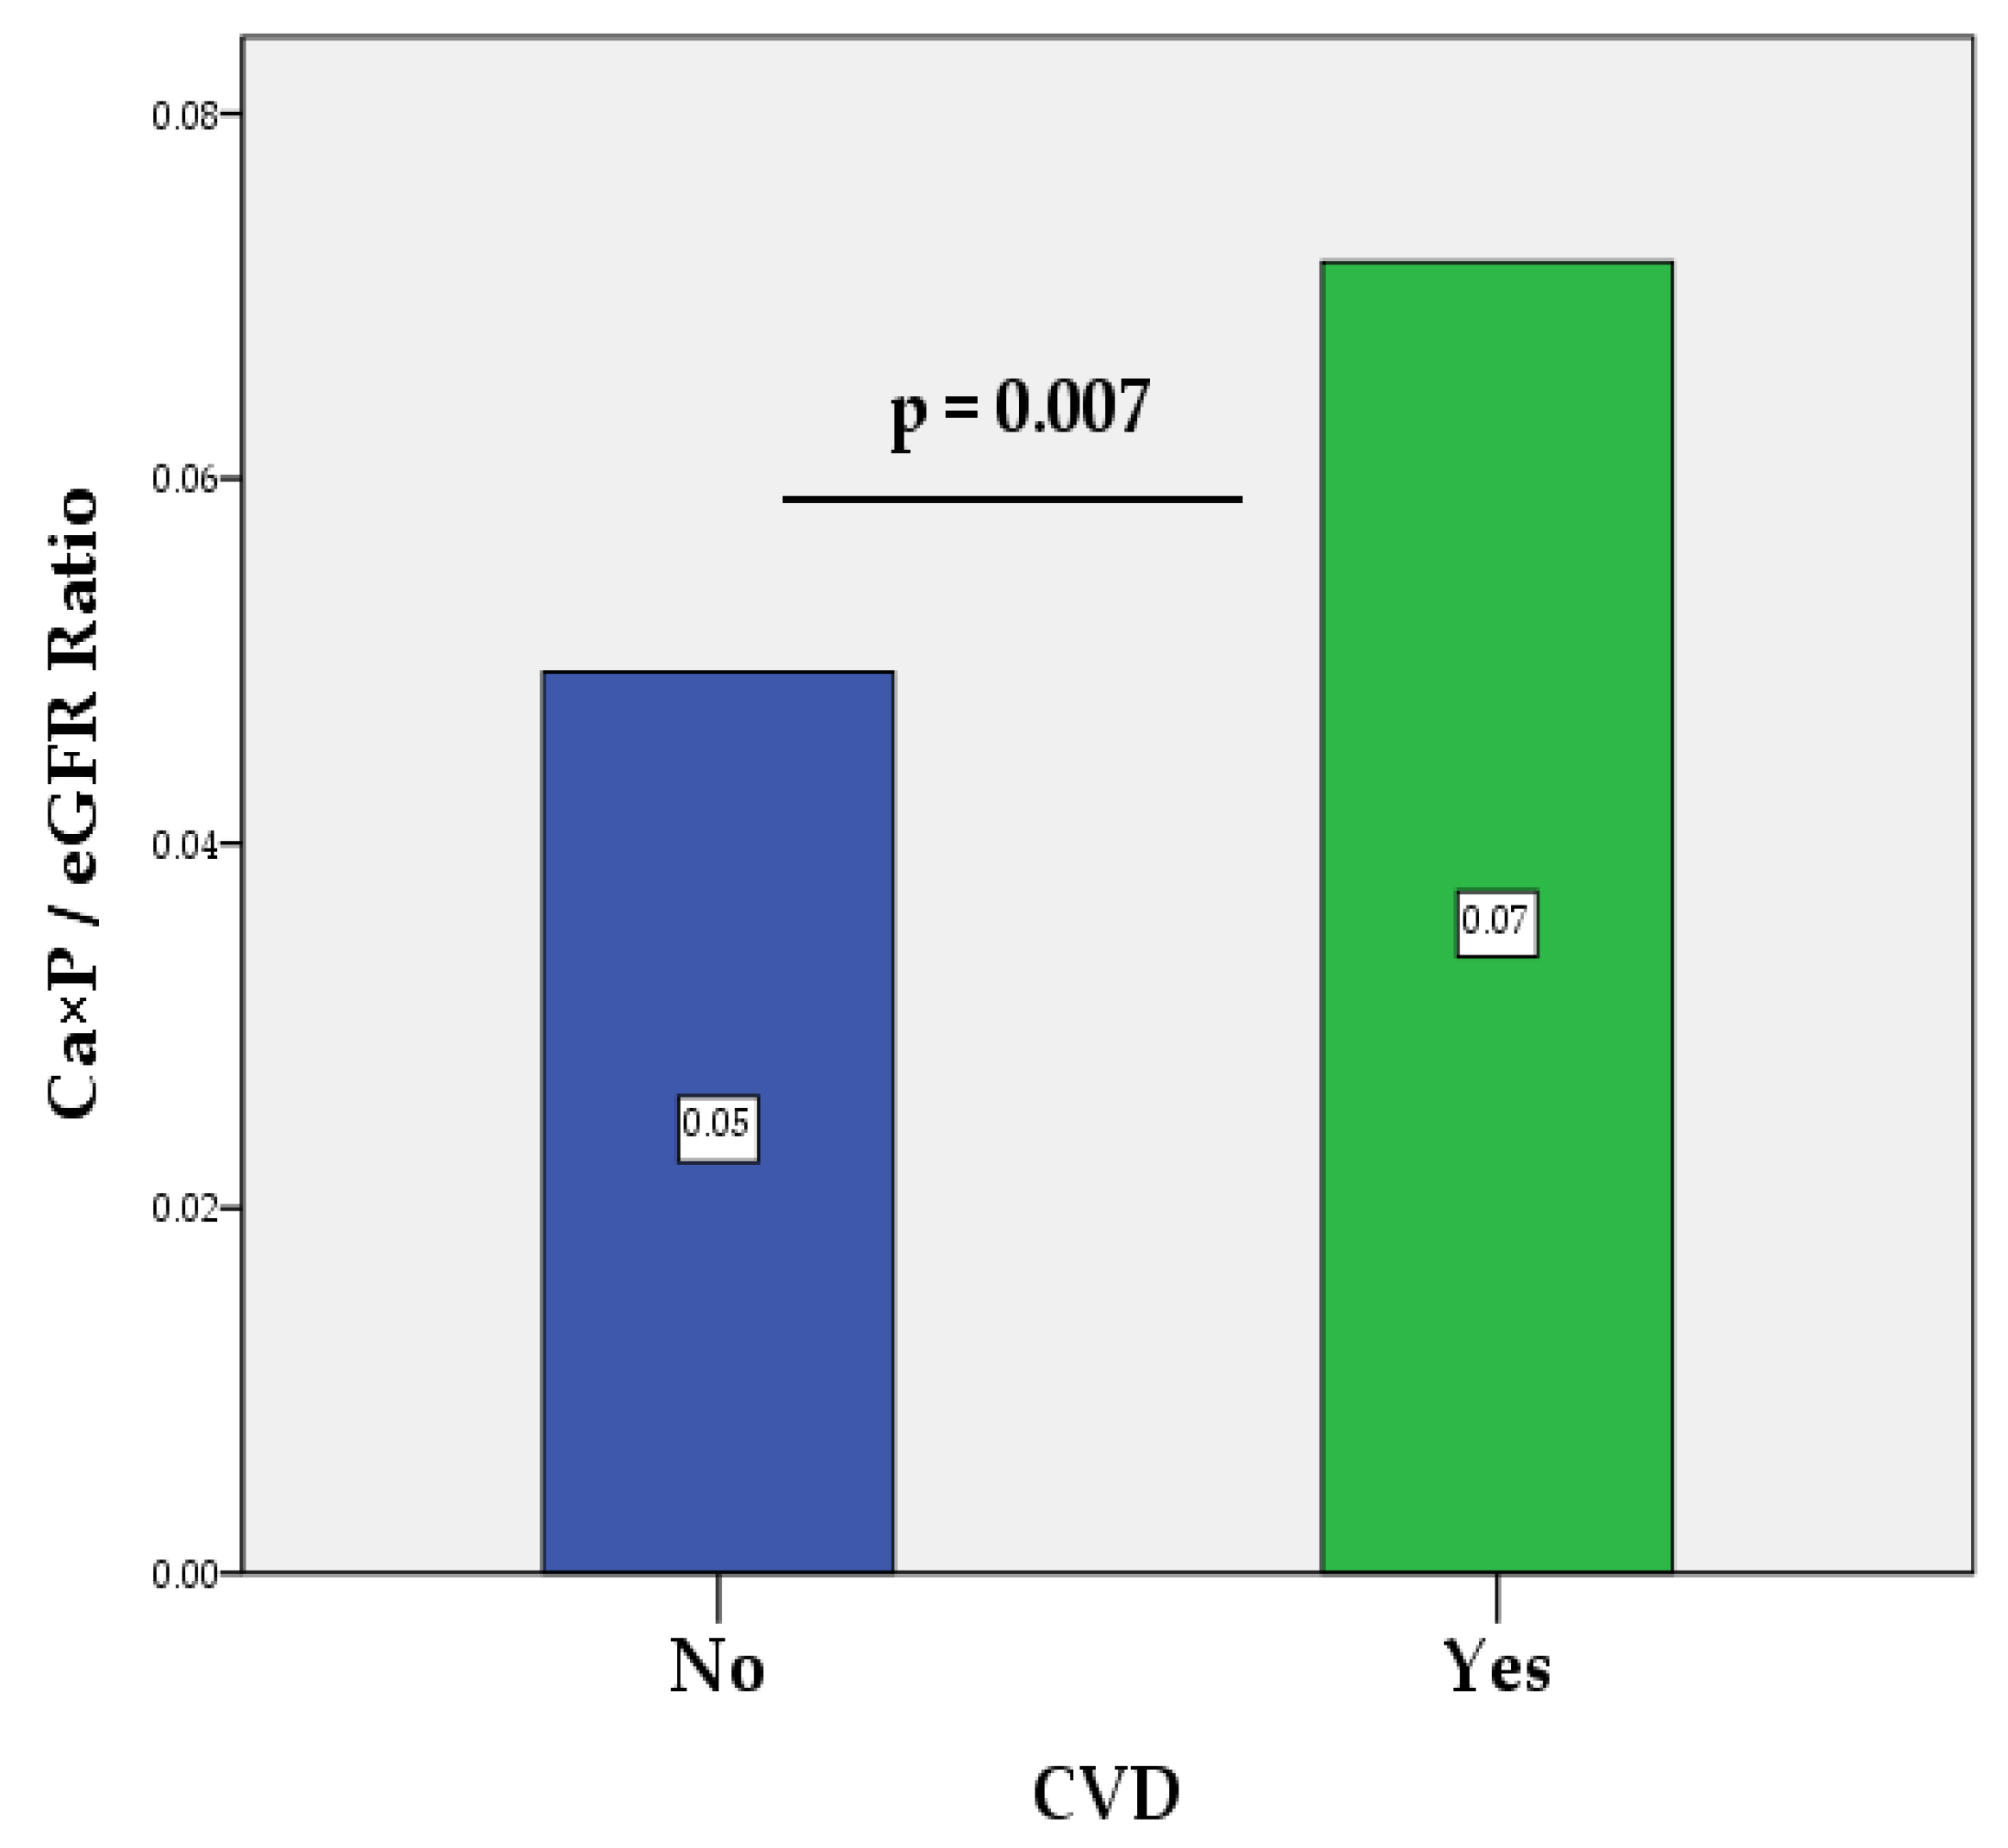
Figure 2.
ROC curve plot illustrating the diagnostic capability of the Ca×P/eGFR ratio to evaluate CV risk in CKD patients before dialysis. Abbreviations: ROC, Receiver Operating Characteristic; AUC, area under the curve; p, probability value.
Figure 2.
ROC curve plot illustrating the diagnostic capability of the Ca×P/eGFR ratio to evaluate CV risk in CKD patients before dialysis. Abbreviations: ROC, Receiver Operating Characteristic; AUC, area under the curve; p, probability value.
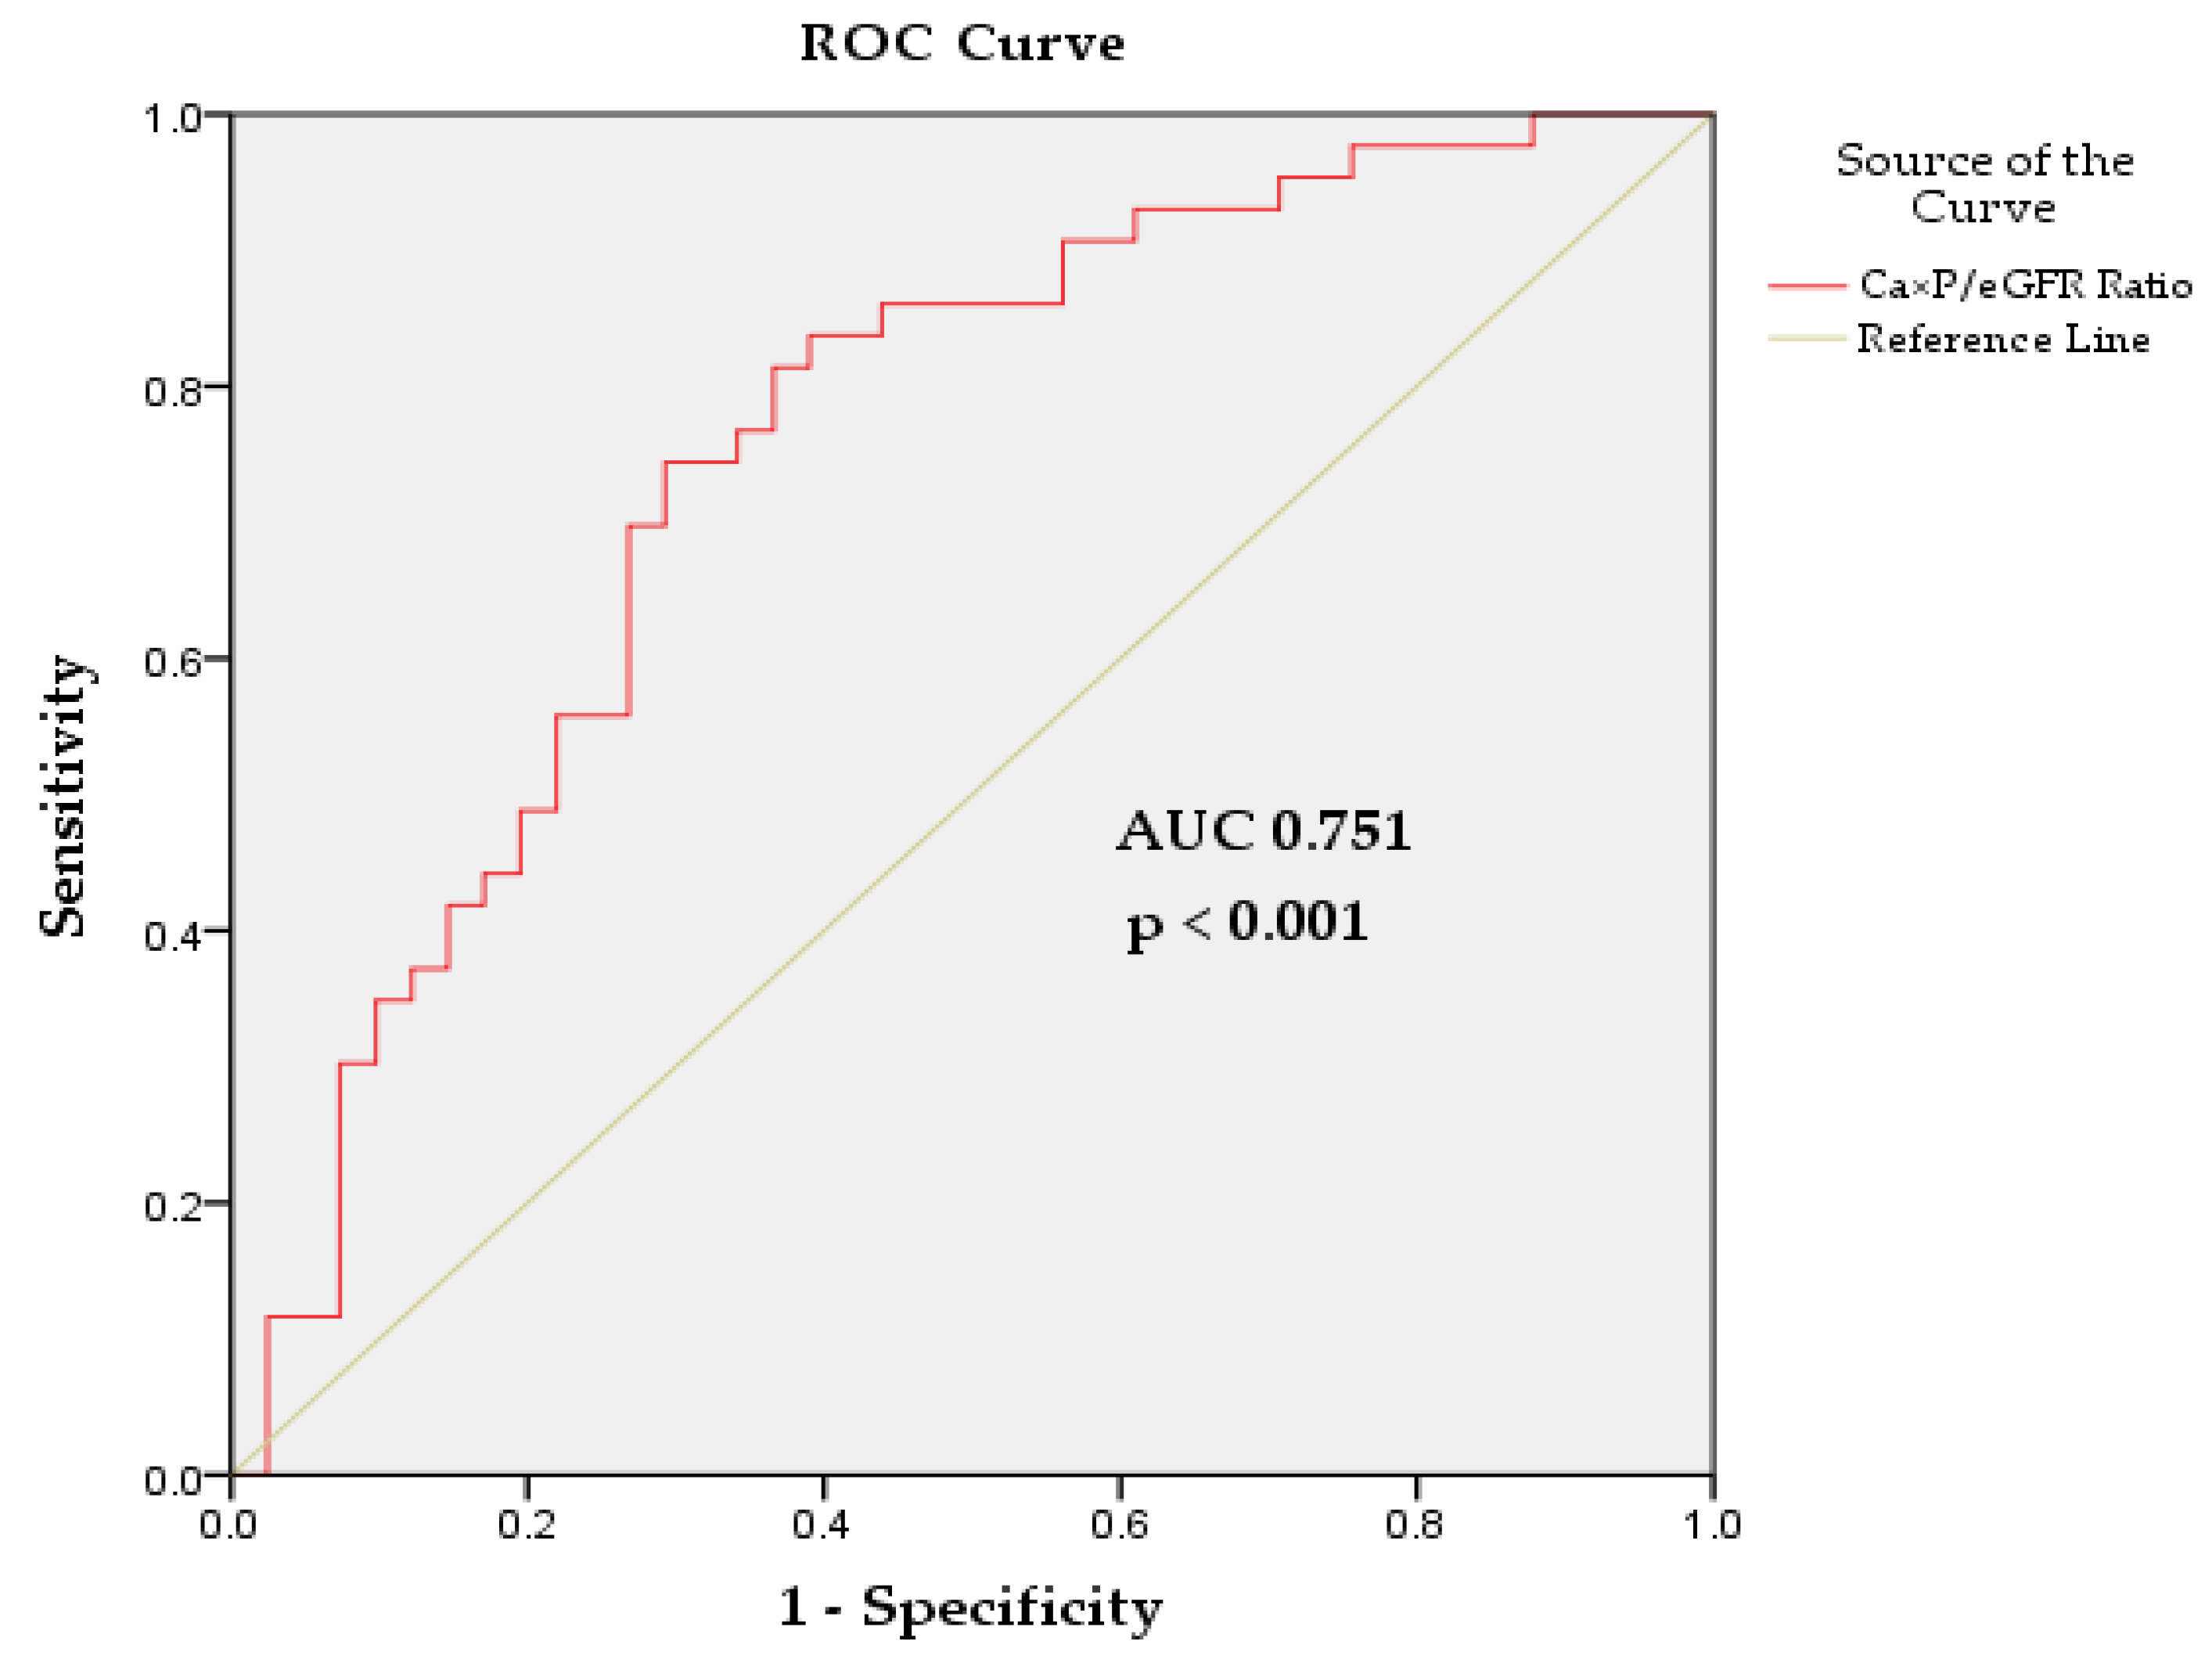

Table 1.
Baseline characteristics of patients in the study groups.
| Variables | All Patients (n=84) |
Non-CVD Group (n=41) |
CVD Group (n=43) | p-Value (ANOVA) |
|---|---|---|---|---|
| Age, years 1 | 64.71±12.95 | 64.70±13.82 | 64.72±12.22 | 0.996 |
| Male/Female, n/n | 32/52 | 11/30 | 21/22 | - |
| SCr, µmol/L 1 | 114.65±52.92 | 93.73±52.03 | 134.60±46.06 | <0.001 |
| BUN, mmol/L 1 | 8.27±3.78 | 6.79±2.79 | 9.69±4.08 | <0.001 |
| UA, µmol/L 1 | 313.22±97.23 | 283.43±87.15 | 332.25±99.68 | 0.059 |
| eGFR, mL/min/1.73 m2 1 | 61.60±27.79 | 74.09±27.42 | 49.69±22.63 | <0.001 |
| CKD 1, n (%) 2 | 15 (18) | 12 (29) | 3 (7) | - |
| CKD 2, n (%) 2 | 25 (30) | 16 (39) | 9 (21) | - |
| CKD 3, n (%) 2 | 32 (38) | 10 (25) | 22 (51) | - |
| CKD 4, n (%) 2 | 12 (14) | 3 (7) | 9 (21) | - |
| HTN, n (%) | 43 (51) | - | 43 (100) | - |
| CAD, n (%) | 19 (23) | - | 19 (44) | - |
| HF, n (%) | 13 (15) | - | 13 (30) | - |
| CVC, n (%) | 18 (21) | - | 18 (42) | - |
| PAD, n (%) | 8 (10) | - | 8 (19) | - |
| Arrhythmias, n (%) | 4 (5) | - | 4 (9) | - |
| Ca, mmol/L 1 | 2.49±0.21 | 2.51±0.29 | 2.48±0.10 | 0.444 |
| Pi, mmol/L 1 | 1.16±0.17 | 1.13±0.15 | 1.18±0.18 | 0.202 |
| Ca×P, mmol 2 /L2 1 | 2.90±0.51 | 2.86±0.53 | 2.94±0.50 | 0.480 |
| PTH, mmol/L 1 | 84.39±50.39 | 89.07±67.41 | 82.13±41.02 | 0.677 |
| ALP, mmol/L 1 | 72.44±19.54 | 70.53±18.98 | 74.25±20.11 | 0.387 |
| Ca×P/eGFR Ratio, (mmol/L)²/(mL/min/1.73 m²) 1 | 0.06±0.04 | 0.05±0.04 | 0.07±0.04 | 0.007 |
1 Mean ± SD; 2 CKD stages. Abbreviations: SCr, serum creatinine; BUN, blood urea nitrogen; UA, uric acid; eGFR, estimated glomerular filtration rate; HTN, hypertension; CAD, coronary artery disease; HF, heart failure; CVC, cardiac valve calcification; PAD, peripheral arterial disease; Ca, calcium; Pi, inorganic phosphate; Ca×P, calcium-phosphorus product; PTH, parathyroid hormone; ALP, alkaline phosphatase. p < 0.05, statistically significant.
Table 2.
Binary logistic regression analysis identifying predictors of CVD risk in the general CKD cohort, based on the presence versus absence of CVD.
Table 2.
Binary logistic regression analysis identifying predictors of CVD risk in the general CKD cohort, based on the presence versus absence of CVD.
| Variables | Univariate Analysis * (Single Predictors) |
Multivariate Analysis ** (Predictors in Model) |
||||
|---|---|---|---|---|---|---|
| Coefficient (B) | OR (95% CI) | p-Value | Coefficient (B) | OR (95% CI) | p-Value | |
| BUN, mmol/L | 0.275 | 1.317 (1.109-1.563) | 0.002 | - | - | - |
| SCr, µmol/L | 0.018 | 1.018 (1.007-1.029) | 0.001 | - | - | - |
| eGFR, mL/min/1.73 m2 | -0.038 | 0.963 (0.944-0.982) | <0.001 | -0.038 | 0.963 (0.944-0.982) | <0.001 |
| Ca×P/eGFR Ratio, (mmol/L)²/(mL/min/1.73 m²) | 0.187 | 1.206 (1.042-1.395) | 0.012 | - | - | - |
* Method = Enter, ** Method = Forward Stepwise (Likelihood Ratio). Abbreviations: OR, odds ratio; CI, confidence interval; BUN, blood urea nitrogen; SCr, serum creatinine; eGFR, estimated glomerular filtration rate; Ca×P, calcium-phosphorus product. p < 0.05, statistically significant.
Table 3.
Correlations between the Ca×P/GFR ratio and various indicators of renal function.
| Correlations | Pearson Correlation Coefficient (r) |
R-Squared (R²) | p-Value |
|---|---|---|---|
| Ca×P/eGFR and SCr | 0.841** | 0.707 | <0.001 |
| Ca×P/eGFR and eGFR | -0.796** | 0.633 | <0.001 |
| Ca×P/eGFR and BUN | 0.723** | 0.523 | <0.001 |
| Ca×P/eGFR and UA | 0.264* | 0.070 | 0.043 |
| Ca×P/eGFR and Ca | 0.491** | 0.241 | <0.001 |
| Ca×P/eGFR and Pi | 0.458** | 0.210 | <0.001 |
| Ca×P/eGFR and PTH | 0.366* | 0.134 | 0.016 |
| Ca×P/eGFR and ALP | 0.399** | 0.159 | <0.001 |
*Correlation is significant at the 0.05 level, **Correlation is significant at the 0.01 level. Abbreviations: Ca×P/eGFR, calcium-phosphorus product to estimated glomerular filtration rate ratio; SCr, serum creatinine; BUN, blood urea nitrogen; UA, uric acid; Ca, calcium; Pi, inorganic phosphate; PTH, parathyroid hormone; ALP, alkaline phosphatase.
Table 4.
Ca×P/eGFR ratio scale for evaluation of CVD risk in pre-dialysis CKD patients.
| Risk Classification |
Ca×P/eGFR Ratio * | Ca×P/eGFR Ratio (%) * | Risk Description |
| Very Low Risk | < 0.03 | < 3 | Very low likelihood of CV complications |
| Low Risk | 0.03 - 0.5 | 3 - 5 | Low likelihood of CV complications |
| Moderate Risk | 0.05 - 0.10 | 5 - 10 | Moderate likelihood of CV complications |
| High Risk | 0.10 - 0.15 | 10 - 15 | Increased likelihood of CV complications |
| Very High Risk | 0.15 - 0.20 | 15 - 20 | Significant likelihood of serious CV events |
| Extremely High Risk | > 0.20 | > 20 | Critical likelihood of severe CV events |
* Ca×P/eGFR Ratio and Ca×P/eGFR Ratio (Percentage) are presented in (mmol/L)²/(mL/min/1.73 m²) and (mmol/L)²×100/(mL/min/1.73 m²), respectively.
Disclaimer/Publisher’s Note: The statements, opinions and data contained in all publications are solely those of the individual author(s) and contributor(s) and not of MDPI and/or the editor(s). MDPI and/or the editor(s) disclaim responsibility for any injury to people or property resulting from any ideas, methods, instructions or products referred to in the content. |
© 2024 by the authors. Licensee MDPI, Basel, Switzerland. This article is an open access article distributed under the terms and conditions of the Creative Commons Attribution (CC BY) license (http://creativecommons.org/licenses/by/4.0/).
Copyright: This open access article is published under a Creative Commons CC BY 4.0 license, which permit the free download, distribution, and reuse, provided that the author and preprint are cited in any reuse.


