Submitted:
07 May 2025
Posted:
08 May 2025
You are already at the latest version
Abstract
This study focuses on issues, possibilities, and challenges surrounding California’s net zero-emission mandate (the Mandate) for all new vehicle sales by 2035. Research methodology involved secondary data analysis of government and automobile industry websites coupled with a literature review, leading to new, original data analyses, with projection models generated by these authors. Considering normal annual new vehicle sales in California of roughly 1.8 million per year for all fuel types, based on data from 2018 to 2024, converting to the Mandate of EV sales only by 2035 indicates only 450,000 annual sales of new EVs by that time per these authors’ projections. This assumes consumers who normally buy a new gasoline-powered or hybrid vehicle convert to purchasing a new EV. Other challenges include insufficient lower-income household demand for EVs, inadequate purchase subsidies, a predictable lack of charging stations, and no evidence of a strategy for enforcing compliance with the Mandate.
Keywords:
climate change
; zero‐emission
; electric vehicles (EVs)
; hybrid electric vehicles (HEVs)
; plug‐in hybrid electric vehicles (PHEVs)
; low‐income
; supply and demand
1. Introduction
This paper is focused solely on California’s ability to implement its 2035 zero emission mandate (the Mandate) that all sales of brand-new vehicles must be zero emission vehicles (primary focus being all-electric) by 2035; and any impactful unintended or intended consequences as a result.
Key to how one determines mandate compliance hinges on how one understands what the mandate requires. The following two understandings, for purposes of illustration, frame how these interpretations differ and drive determinations of mandate success.
Understanding 1—If one reads the mandate literally to mean only all new (brand new) vehicle sales by and after 2035 must be zero emissions, then in the extreme, if new vehicle sales in 2035 equal one new EV vehicle (a zero emissions vehicle), and the rest of the sales are from the secondary market, then the mandate would be deemed a success. This would obviously be antithetical to the car industry and likely presents an unrealistic directive.
Understanding 2—If one reads the mandate to mean all brand-new vehicle sales by 2035 must be zero emission, approximate to current levels of brand-new car sales, then sales per year must be zero emission vehicles from 2035 moving forward and approximating 1.8 million zero emissions vehicles per year, the average number of new California vehicle sales for all fuel types.
A possible success from Understanding 2 would be a gradual replacement of existing on-the-road vehicles (largely fossil fuel powered vehicles) between now and 2035 resulting in a steady ramp up (implied per a schedule created and regulated by CARB.4 [9]) to a total of approximately 12.5 million zero emission vehicles placed in service between 2026 and 2035. Greenhouse gas emissions would likely be impacted/reduced if the rollout occurred in this way. It should be noted that for years 2024 and 2025, combined, there should be approximately 2,450,000 new EV registrations recorded, totaling nearly 15 million cumulative new EV registrations between now and 2035, assuming Mandate expectations will be met.
Further clouding the true meaning of the “Mandate” sales of used gasoline powered vehicles, including hybrids, are still permitted between now and 2035, and used EVs are not covered by the “Mandate” or counted toward meeting “Mandate” expectations. For purposes of this paper and assuming the goal is to truly impact greenhouse gases, “Understanding-2” and its’ “possible success” is the assumed meaning of the “Mandate” and there is no questionable intent to declare victory under “Understanding-1”, and it will not be considered as viable for additional discussions in this paper.
In addition, for clarity, the “Mandate” is taken to relate principally to passenger vehicles and light-duty pickup trucks. Directives related to governmental fleets and heavy-duty equipment, as well as diesel powered semi-trucks, are mentioned only as ancillary information and not included in any calculations or analysis.
This research will focus on historically normal annual, new vehicle sales in California for all fuel types versus projected new EV sales ratios developed by the California Air Resources Board. Another important factor to consider is that gaps/shortfalls between normal annual sales versus projected EV sales only, will likely result in sales tax revenue losses to both the State and local governments and there will logically be losses in ongoing gasoline tax revenues, depending on market conversion from fuel only and hybrid vehicles to EV.
How any gap between normal new car sales (all technologies) versus EV only will be addressed in the marketplace (both consumers and government) is beyond the scope of this research endeavor. For purposes of this paper, the term EV will be used in lieu of BEV and PHEV for readability purposes, unless otherwise specified.
2. Research Methodology, Questions, and Propositions
The method used for this research is mixed, which includes secondary data analysis, a literature review, and some new, original quantitative analysis in producing projection models based on various electric car supply and demand scenarios, including charging stations’ availability. These scenarios are then compared to California’s expectations for cumulative new EV purchases and registrations by 2035.
The research questions guiding this study are:
- Does an analysis of current data and trends suggest California will be able to achieve 100% compliance with the “Mandate” for brand new zero emissions auto sales by 2035?
- Based on current trends and ancillary data, can California develop enough charging stations to facilitate desired purchase demand for brand new zero emissions EV’s?
Propositions include:
- Most likely, California will not be able to achieve 100% compliance with Mandate directives by 2035 and likewise will not realize expectations of new EV auto sales, based on current data and trends.
- California consumers will likely have adequate access to new EV’s to meet related demand.
- Presently, California has failed to adequately address demand (including affordability) of lower-income populations for EVs but could implement policies to better incentivize EV purchases by subsidizing more public and private charging station installations and increasing the financial incentives for EV purchases, including leases and used EV’s.
- California will not be able to develop enough charging stations to meet consumer needs relative to new EV registrations.
- California will have difficulty enforcing the Mandate, resulting from numerous variables affecting such enforceability.
3. Secondary Data and Literature Review
3.1. National (US) Sales and Consumer Demand Data
Currently less than 6% of Americans own electric vehicles. Most Americans still prefer to buy gasoline powered cars or if they are looking for an alternative, they favor hybrids over all-electric (Sherk & Sagert, 13 July 2023 [31]). While the cost to charge is relatively less than a tank of gas, the overall cost to purchase and maintain an electric vehicle is substantially more. One study found that 1/5 of all electric car owners in California returned to gas-powered because of convenience (Sherk & Sagert [31]).
Despite this criticism, as reported in Bloomberg, Randall states all-electric sales in the US were increasing dramatically between 2011 and 2023, taking ten years to reach its first one million in sales (2021) but only two years more (2023) to attain three million (Randall, T., 14 September 2023 [30]). California and Tesla are cited as the primary contributors for national EV sales with California accounting for 39% of all sales and Tesla accounting for 61% through 2023 (Randall [30]).
According to Hickey, US automobile dealers are concerned regarding inventory issues, particularly considering Tesla’s historic dominance, although this company’s market share dropped to 61% in 2023 (Randall [30]) from 80% in 2022 (Hickey, 30 April 2024 [17]). Competition includes new entrants such as the Volkswagen ID.4 at 3.4%, Chevrolet Bolt EUV at 2.8%, and Ford Mustang Mach-E, at 2.9% (Hickey [17]). Hickey further reports a decline in EV sales of 15.2% during the last quarter of 2023, as compared to the last quarter of 2022, and a decline of 2.2%, as compared to the first quarter of 2023. This data may negate a continued positive trend line.
Gallup (Jones, J.M., 8 April 2024 [22]) published poll results on 8 April 2024, that largely substantiate the somewhat flat to downward trend in EV marketplace acceptance as shown in the figures that follow:
Figure 1.
(Jones, J.M., 8 April 2024 [22]). * Note: “Would not buy” increased 7% from 2023 to 2024.
Figure 1.
(Jones, J.M., 8 April 2024 [22]). * Note: “Would not buy” increased 7% from 2023 to 2024.
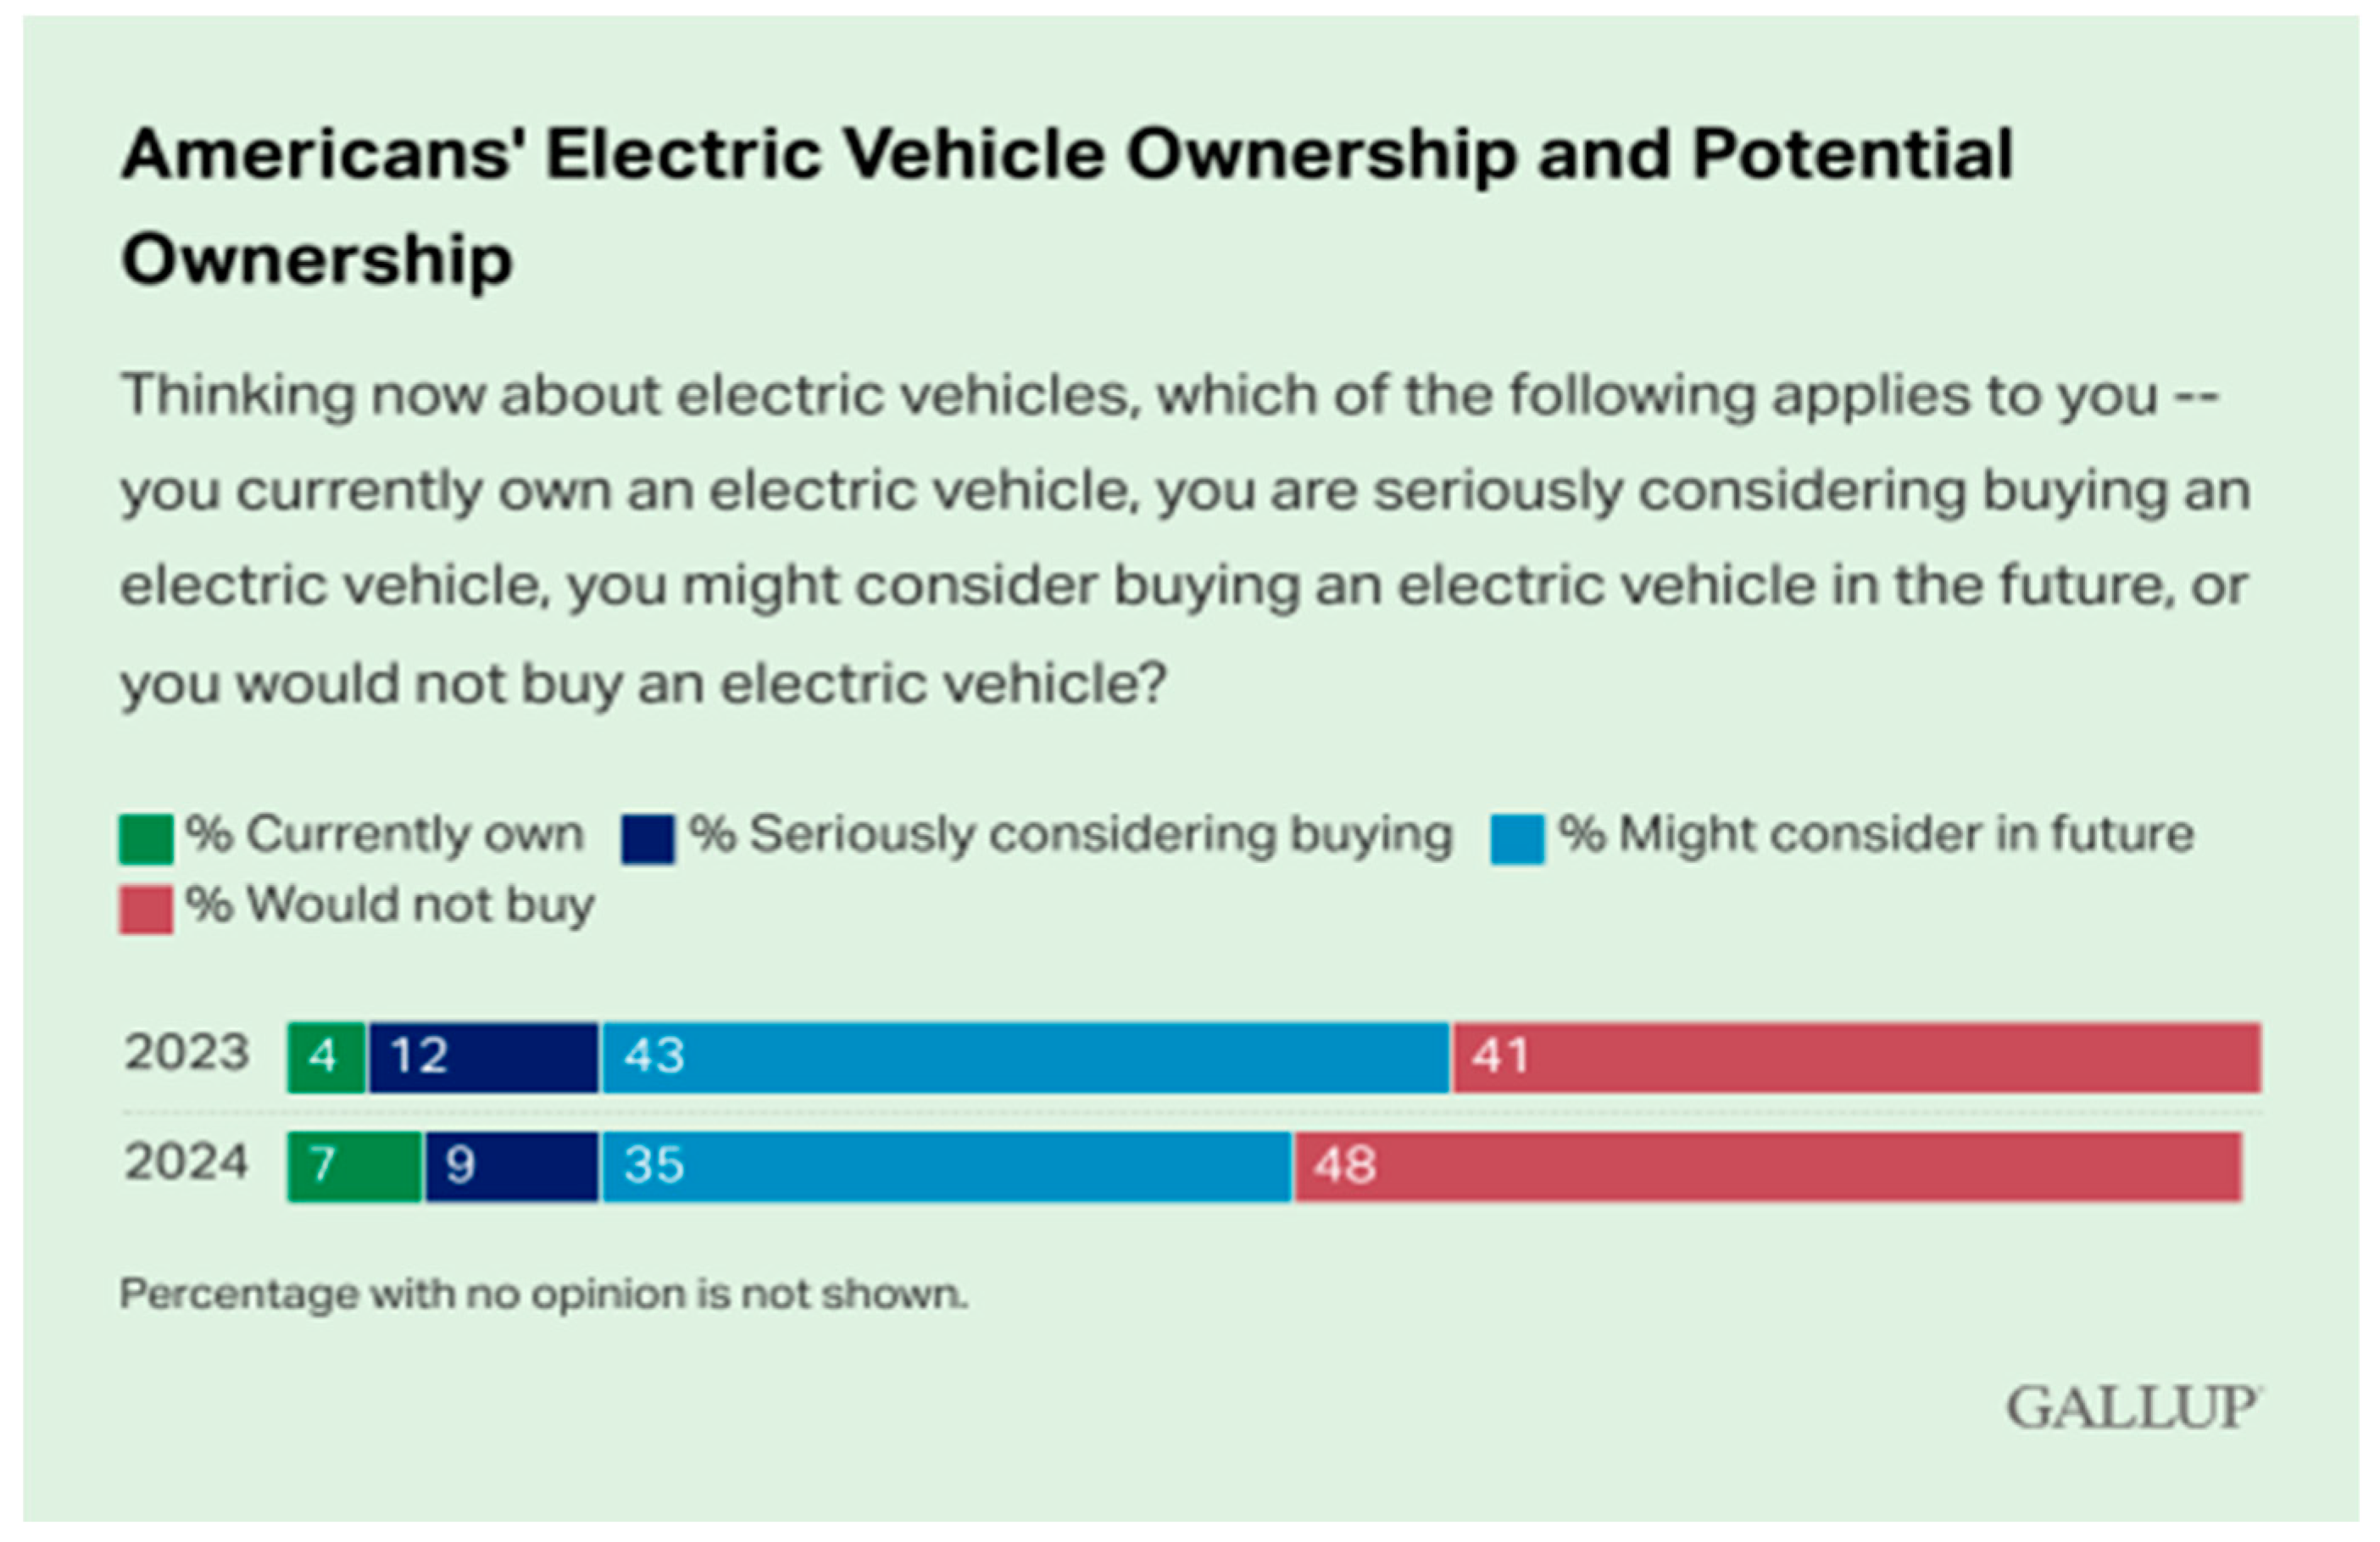
Figure 2.
(Jones, J.M., 8 April 2024 [22]). * Note: Largest percentage of “Would not buy” for “Lower Income” segment.
Figure 2.
(Jones, J.M., 8 April 2024 [22]). * Note: Largest percentage of “Would not buy” for “Lower Income” segment.
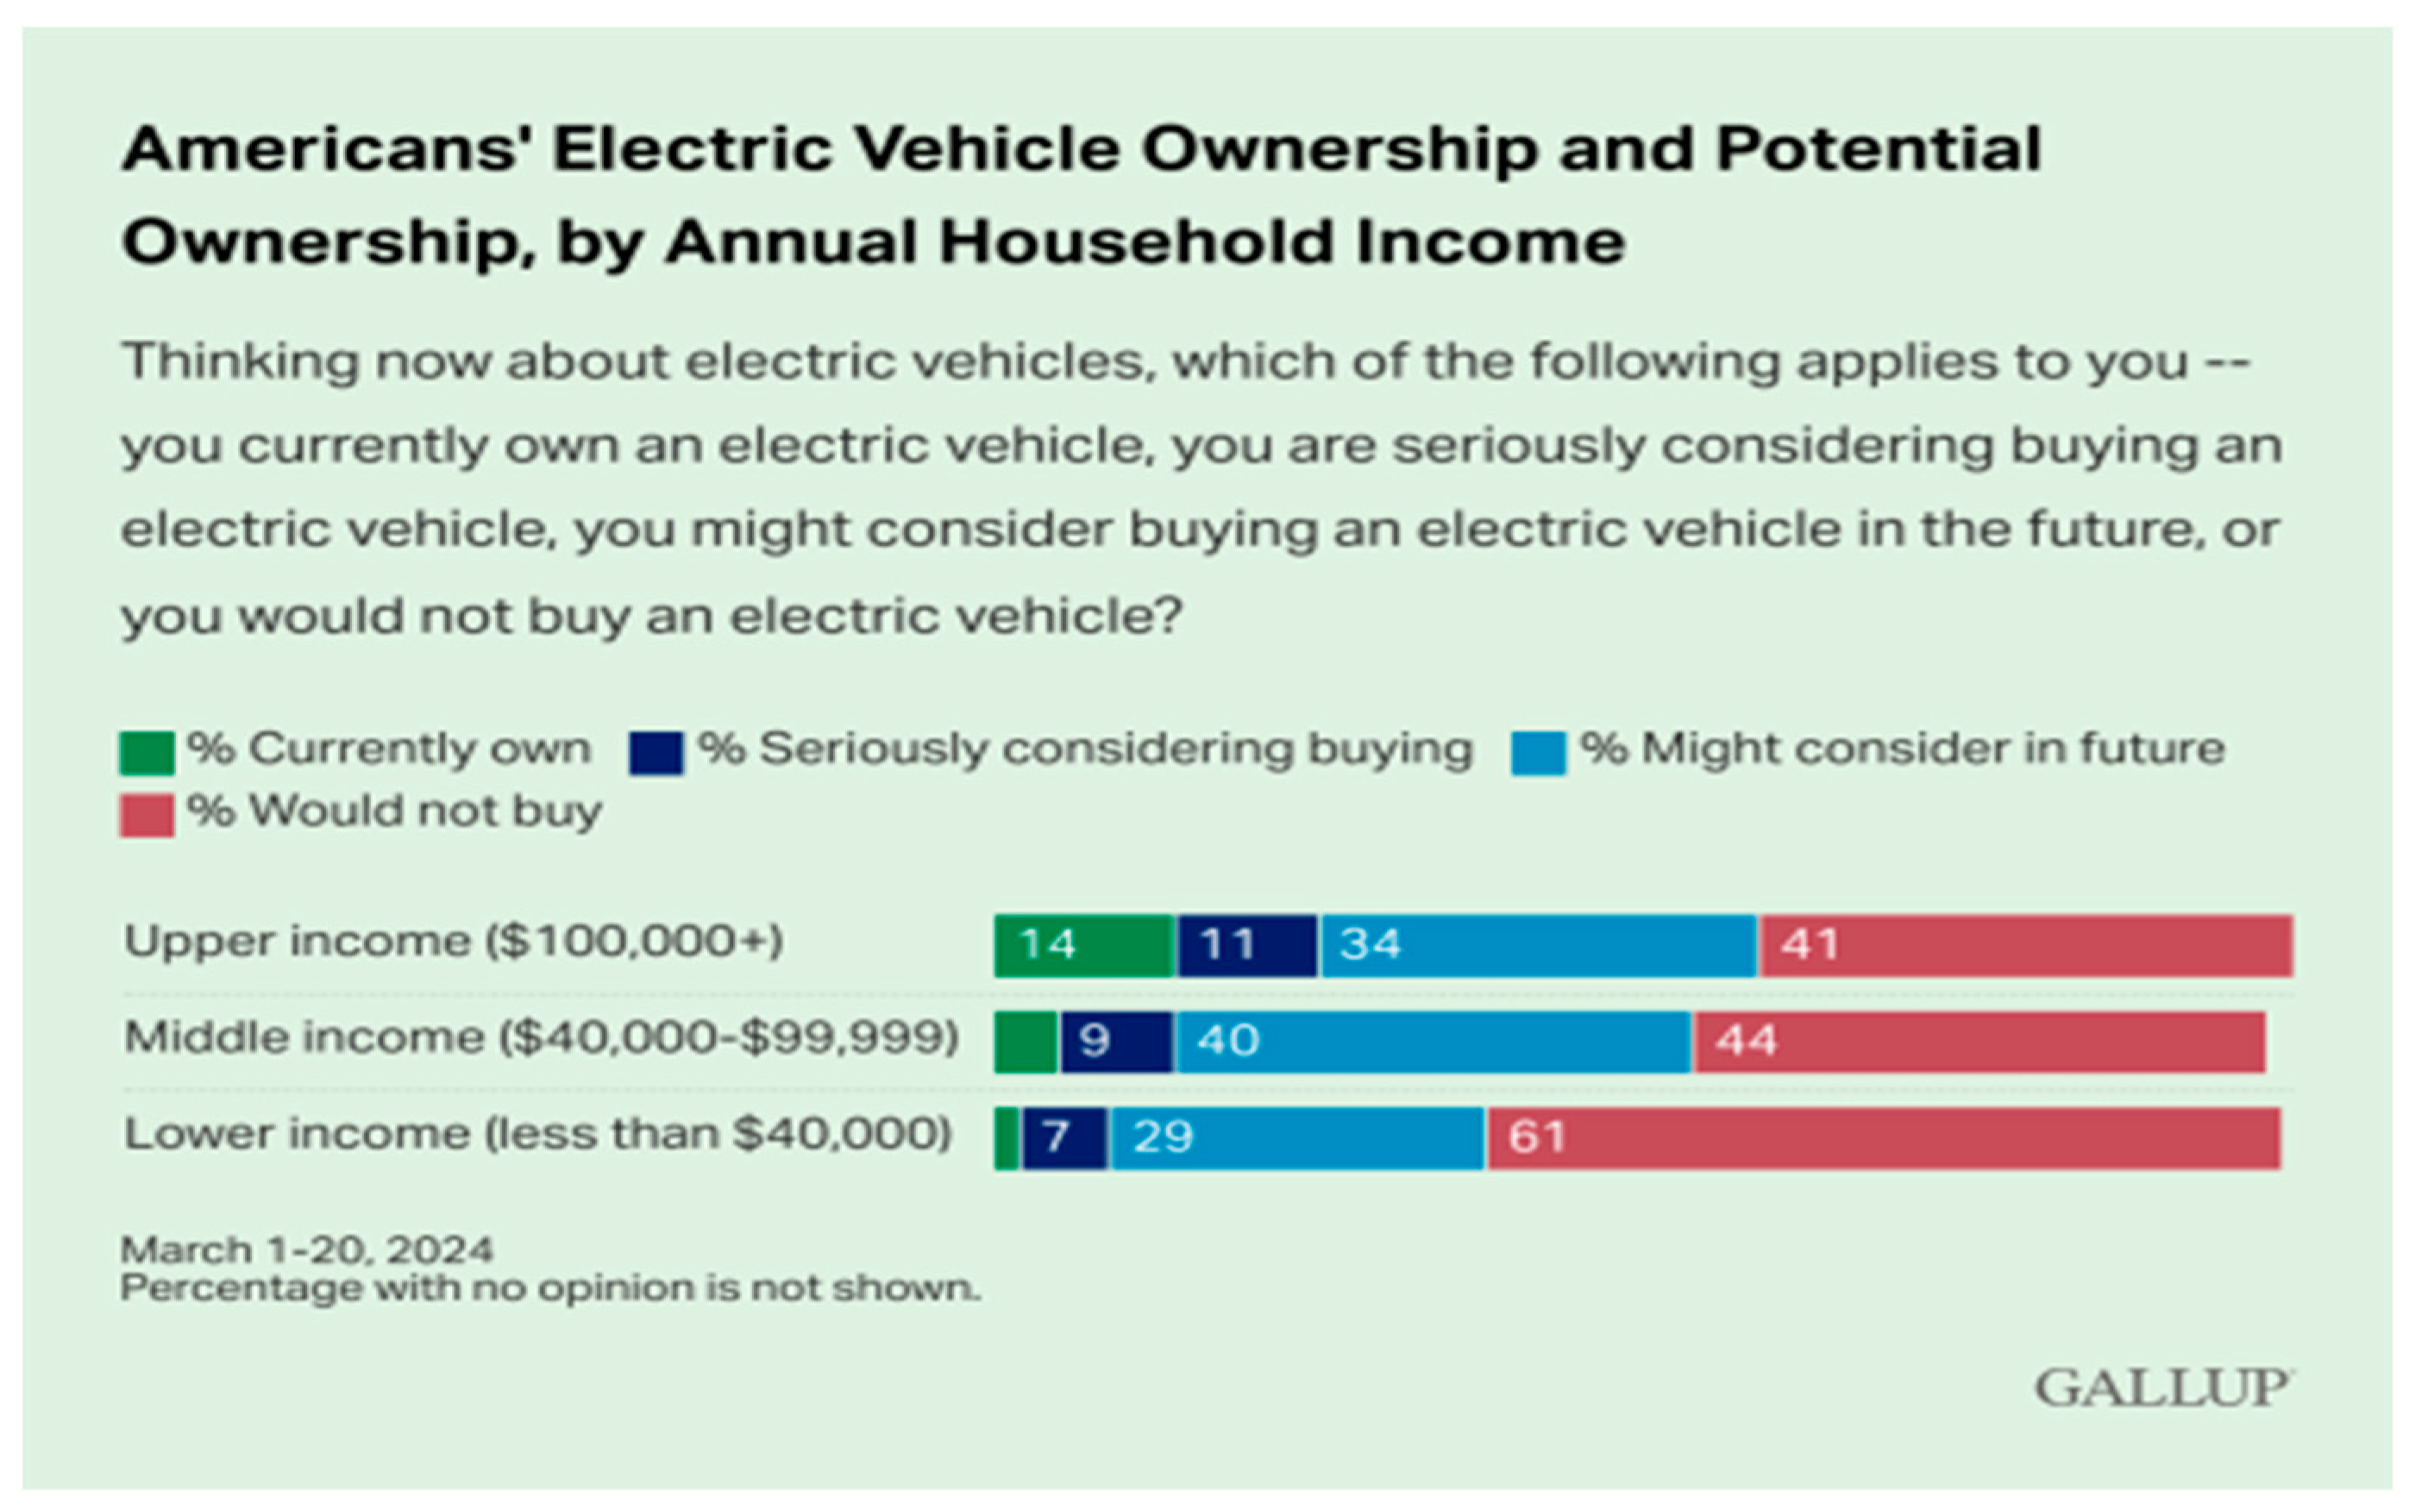
Figure 3.
(Jones, J.M., 8 April 2024 [22]). * Note: Even among those that “Worry a fair amount or a great deal” about climate change more than a third would not buy.
Figure 3.
(Jones, J.M., 8 April 2024 [22]). * Note: Even among those that “Worry a fair amount or a great deal” about climate change more than a third would not buy.
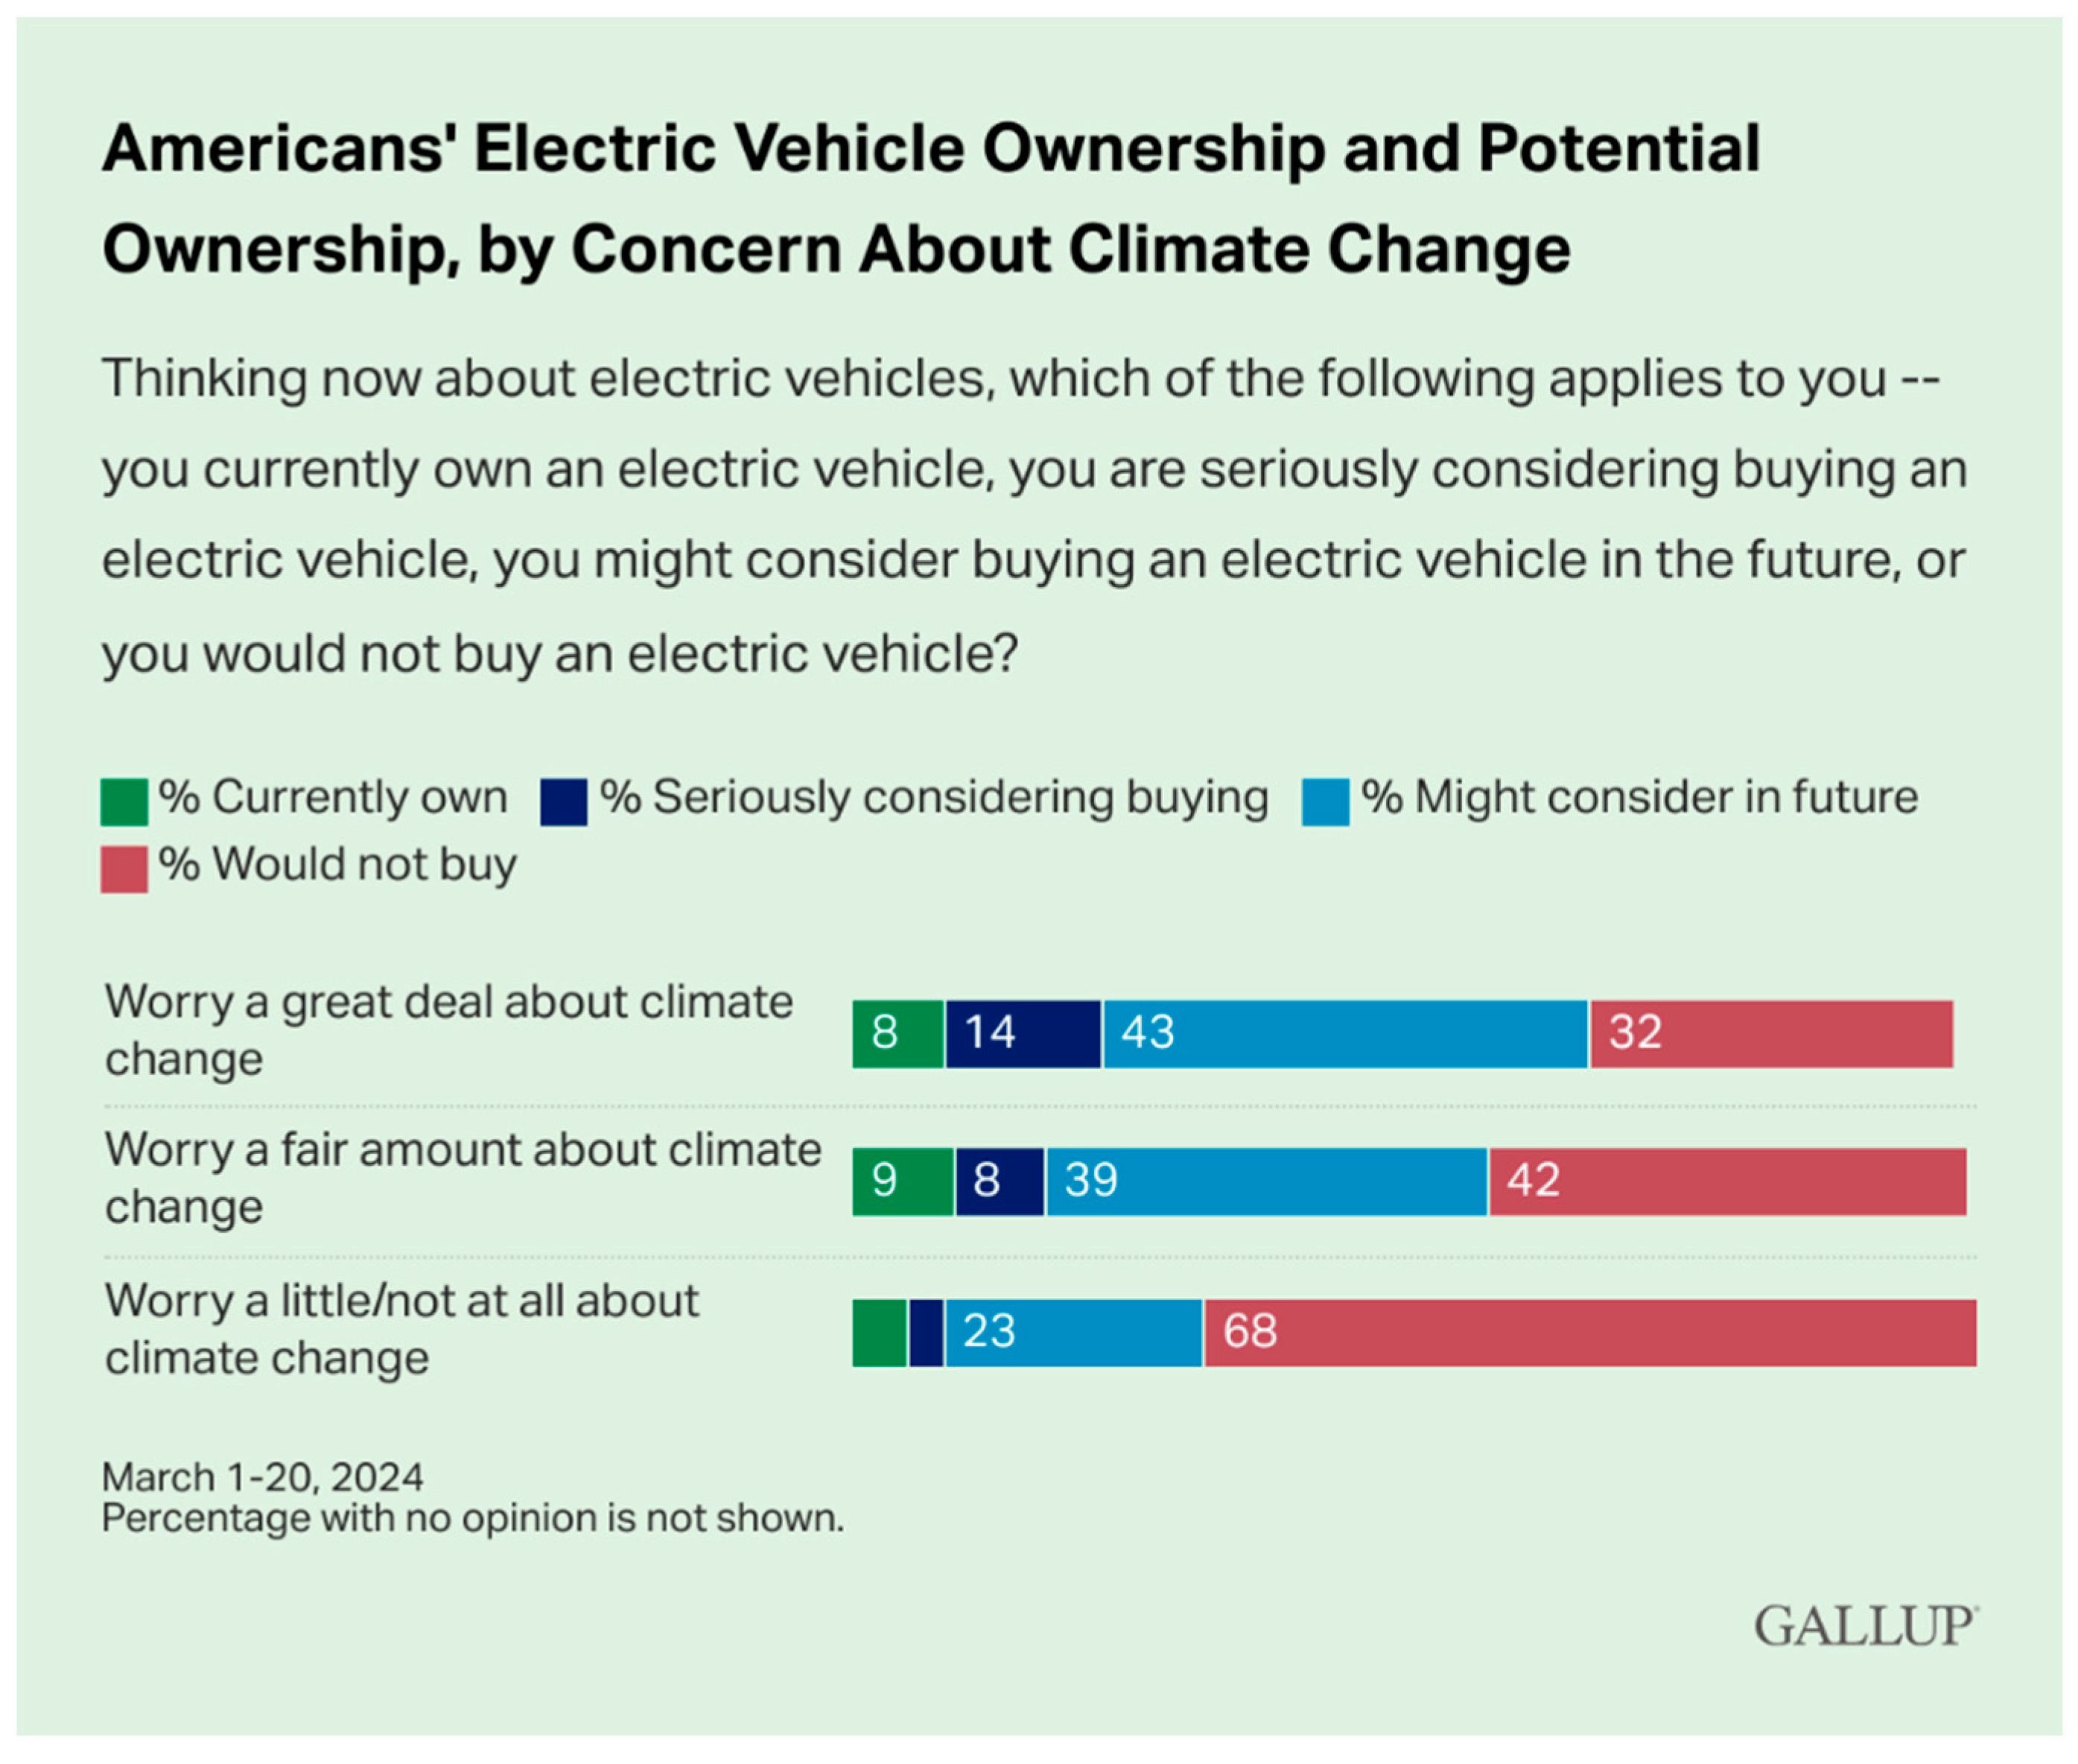
Noteworthy, however, are Gallup’s findings from US residents regarding climate change and how those potential concerns affect future demand for EVs:
It is fair to note that these graphs represent national trends and are not broken out by state, and it would be entirely possible that California would skew more in favor of EV purchases. Furthermore, the preferences among national households (which include California) shift throughout time periods and are likely influenced by government subsidies, EV purchase prices, and both charging time and driving range capacity which appear to be improving due to enhanced technologies.
Shifting to supportive infrastructure and concerns, some industry experts question the ability to support the desired growth in EVs (IER. 23 April 2023). At current rates and even with $7.5 billion in funding from the federal Inflation Reduction Act (IRA), there is still a shortage of millions of available charging stations. If the needed ramp-up of charging stations were to occur the expansion would likely create an increased burden on the current electrical grid so upgrades will have to be made there as well (IER).
The overall takeaway is that the appetite for the adoption of EVs is, in general, not close to unanimity or strong across all socio-economics levels.
The next section focuses on data, programs, and issues generated by California sources or matters generally applicable to California only.
3.2. California Internal Data
The zero-emission vehicle requirement, which is to occur by 2035, is part of the Advanced Clean Cars Regulations (CARB.1, October 2023 [6]), meaning all new passenger cars, trucks, and SUVs sold in California must be zero-emission vehicles (generally all-electric with 20% PHEV). Despite this mandate, gasoline cars can still be driven in California after 2035, provided they are registered with the California Department of Motor Vehicles and sold as a used car to a new owner (CARB.2, n.d. [7]).
Programs enacted by California to facilitate and encourage conversion to clean energy vehicles include(ed):
- Cap-and-trade (the primary funding mechanism)—40% in discretionary allocations.
- Clean Cars 4 All
- Clean Vehicle Rebate Project
- Clean Vehicles Assistance Program
Success of these programs in reducing GHGs is apparently unknown or unquantified, because the Air Resources Board has failed to adequately measure it, according to an audit by the state’s Legislative Analyst’s Office (Lopez, N. 2 August 2022 [25]). Presently, the only programs remaining are Cap-and-Trade and the Clean Cars 4 All which has (OK, singular, only Clean Cars 4 All applies) been combined with the previous Clean Vehicle Rebate Project.
3.3. Criteria for Participation in the New Combined Program
Of critical note is the absence of independent incentives for turning in or scraping an older vehicle and purchasing a hybrid or all-electric vehicle. One must do both. What is left unclear is how, after turning in a gas-guzzling vehicle, one makes do until the purchase of an EV happens (presumably at the same time, but not clear). Data after 30 November 2023, relative to the new combined program, is largely unavailable, likely due to administrative issues/delays and communication to the public (CARB.1 [6]).
Regarding annual income qualifications relative to 300% of the federal poverty level for 2025 (roughly at $15,000 per person), that equates to $46,950 for a single person household, $63,450 for two persons, $79,950 for three persons, and $96,450 for four persons (Health care.gov. (n.d.) [16]).
For purposes of this paper, because the Census data categorizes family households as two plus, the income for three persons will be used, rounded down to $75,000 to match Census categories.

Table 1.
Source: Adapted from (CARB.2, n.d. [7]).
Table 1.
Source: Adapted from (CARB.2, n.d. [7]).
| Income Eligibility | 8 Years Old or Newer Hybrid Electric Vehicle 35+ Miles per Gallon (Combined) | 8 Years Old or Newer Plug-in Hybrid Electric Vehicle | 8 Years Old or Newer Zero-Emission Vehicle |
|---|---|---|---|
| Less than or equal to 300% Federal Poverty Level | $7000 | $9500 (Plus, up to $2000 for charging equipment or pre-loaded charge card) | $10,000 (Plus, up to $2000 for charging equipment or pre-loaded charge card) |
| Less than or equal to 300% Federal Poverty Level in Disadvantaged Communities | $7000 | $11,500 (Plus, up to $2000 for charging equipment or pre-loaded charge card) | $12,000 (Plus, up to $2000 for charging equipment or pre-loaded charge card) |
Table 2.
Adapted from Health Care.gov (2025) [16].
Table 2.
Adapted from Health Care.gov (2025) [16].
| Federal Poverty Level (FPL) | ||
|---|---|---|
| Family Size | Amounts | 300% FPL |
| For individuals (single) | $ 15,650 | $46,950 |
| For a Family of 2 | $ 21,150 | $63,450 |
| For a Family of 3 | $26,650 | $79,950 |
| For a Family of 4 | $32,150 | $96,450 |
| For a Family of 5 | $37,650 | $112,950 |
| For a Family of 6 | $43,150 | $129,450 |
| For a Family of 7 | $48,650 | $145,950 |
| For a Family of 8 | $54,150 | $162,450 |
| For a Family of 9 | + $5500 per Person | + $16,500 per Person |
Note: $79,950 will be rounded down to $75,000 to match census data for use in analysis.
3.4. California’s Implied Sales Ramp-Up to Address the Mandate
Based on data from the California Air Resources Board (Clegern, D. & Young, S. 25 August 2022 [12]) the following sales expectations for EV’s (all technologies) from 2026 to 2035 have been developed. Implied by the “Totals” column are the percent (%) “ramp up” expectations between 2026 and 2035 to meet the “Mandate”.
The data in the following Table 3 is a marriage between new car sales data from the California New Car Dealers Association (California New Car, 2024 [4]), which approximates 1.8 million vehicles each year based on projected sales for 2025 and historical trends, and the previous Table 4 from CARB, page 6 of the 2022 update. It is assumed that total sales will be flat until 2035. Multiplying the annual percentage sales expectations from Table 4 by 1.8 million equals the implied yearly EV sales needs (all technologies) to meet the “ramp-up” for the “Mandate” per Table 3. If aggregate demand/sales are higher or lower than 1.8 million, the EV sales ramp-up per year (all technologies) will change proportionately.
Assumes 1.8MM New Light Vehicle Sales/Registrations per Year—(Understanding-2).
3.5. Affordability of Electric Vehicles—Availing Oneself of the Incentives
Given the new financial incentives in California’s Clean Cars 4 All Program (incorporates and modifies the previous Clean Vehicle Rebate Project), which exclusively includes households less than or equal to 300% of the federal poverty level, demand by this demographic regarding all-electric vehicles appears to be a challenge to the success of the “Mandate”.
Lopez (2 August 2022) [25] discusses affordability, both through data analysis and interviews with some California residents. A California Central Valley coalition of advocacy groups, for cleaner air, created an organization named the EV Equity Program. Maria Lopez, the supervisor of the program, stated markups of vehicle prices on electric vehicles add to an already existing issue of affordability. These markups are usually around $15,000. As of 2022, new electric cars cost anywhere from $25,000 to $180,000. Many popular models were sold out with long waiting lists (Lopez).
Zhao, (5 July 2022) [37] states that 55% of all construction workers in California are Hispanic. Within that ratio, 14% are estimated to be undocumented. Holliman and Collins (2023) [18], assert use of public transportation or electric passenger vehicles by those employed in the construction industry presents obstacles, because pickup trucks are the norm for workers in that industry.
Fisher (2024) [14] released information detailing new light-duty truck prices (starting price—minimal options) which ranged from a low of $49,995 for a Ford F-150 Lightning to a high of $86,645 for a GMC Hummer EV. Full options add an average of $42,000 to these costs.
Clearly, these prices are in the upper-cost strata as noted by Lopez (2 August 2022) [25] and serve to further challenge the affordability of EVs by construction workers.
Since no statewide government sponsored data set exists that delineates car sales along demographic lines, Lopez and Yee (2023) performed a data set analysis of new vehicle registrations as maintained by the Department of Motor Vehicles. A summary of their findings states that “Communities with high concentrations of electric cars are affluent, college-educated and at least 75% white and Asian. In contrast, electric cars are almost nonexistent in Black, Latino, low-income and rural communities—revealing the enormous task that California faces electrifying the entire fleet (Lopez and Yee, n.p.)”.
Consistent with the National Gallup survey (Jones, 8 April 2024 [22]), according to Cal Matters’ analysis as reported by Lopez and Yee (2023) the primary influence for EV purchases in California is income. In the top ten communities in California for EV ownership, most have median incomes exceeding $200,000 versus the statewide average of $84,000, and common home values in those areas exceed $3 million per Zillow estimates. Conversely, “electric cars are nearly non-existent in California’s lowest income communities: only 1.4% of cars in Stockton’s 95,202 are electric, where the median household income is $16,976, and 0.5% in Fresno’s 93,701, where the median is $25,905. Most are plug-in hybrids, which are less expensive (Yee, 22 March 2023 n.p.).
For purposes of this paper, an approximate 1.4% participation rate for low-income consumers will be assumed within the base amount of EV registrations as of 31 December 2025 (2,450,000 total for all consumers × 1.5% = 36,750).
Exploring affordability further, if a household pursues incentives and finances an EV (new or used) they must be able to afford monthly payments. Table 5 provides a commonly accepted maximum monthly car payment amount based on pre-tax income.
Affordability is then a function of household income, subsidies (both State and Federal), and the ability to finance a purchase.
3.6. California Sales and Demand Data
As a general comment, based on sources to follow, California’s EV sales are increasing but not at consistent growth levels. Despite affordability statistics for low-income groups, the California Energy Commission (2024) [3] recently issued a press release reflecting a glowing and optimistic report concerning zero-emission vehicle sales and progress toward meeting state goals. This department asserts California has met its sales goals two years ahead of schedule.
EV cumulative sales as of 30 June 2024 were 1,872,429 but appear to be flattening out at approximately 400,000 per year. These authors project 2024 year-end sales to be 2,000,000, and 2025 sales will be 450,000 as noted in discussions to come.
Of note is the comment by Lopez and Lee (2023) that no official data set is maintained by California regarding the demographics of purchasers of new EV vehicles. The alleged encouraging information in the Energy Commission’s press release does not address the income and related affordability gaps. The information released does not show any breakdowns by income, race, or geographic location.
The following provides some insight into the conflicting views of the current demand environment in California:
- In mid-2024 the California New Car Dealers Association reported the growth rate of all electric vehicles in California dropped by 1.2% in the second quarter of 2024 (Symon, E., 2024 [32]).
- Likewise, the number of electric car registrations decreased from 102,730 in the second quarter of 2023 to 101,443 in the second quarter of 2024.
- Sales of electric cars declined for the first time in ten years in the final quarter of 2023, despite surging in the first six months of 2023.
- Recorded sales of the fourth quarter 2023 were 89,933, a decline of 10.2% (Symon).
Somewhat contrasting the above, a 10 November 2024, report by Brad Anderson of CARSCOOPS, based on data sourced from Experian Automotive, indicated:
- Dramatic increases in market share from 2020 to 2023 year-end for all categories (EV, PHEV, and HEV) but fluctuating market share data from the third quarter of 2023 to the third quarter of 2024.
- Comparison of the third quarter of 2023 to the third quarter 2024 indicates fluctuating data with both slight increases in market share and slight decreases in market share.
Furthermore, based on the 10 November 2024, report by Brad Anderson and more salient for purposes related to this paper, are:
- Average quarterly EV registrations were 111,412 per quarter from the third quarter of 2023 to the third quarter of 2024, or 445,648 registrations per annum.
- A slight increase in the second quarter registrations of 2024, (116,166), and the third quarter of 2024, (116,179).
3.7. Likelihood of Meeting the “Mandate”—EV Purchases
3.7.1. General Mandate Compliance Potential
Comparing and contrasting EV (all technologies) purchases based on annual new vehicle sales of 1.8 million per year with the implied “ramp up” from CARB and contrasting that with calculated projected anticipated new vehicle EV (all technologies) registrations between 2026 and 2035 based on Brad Anderson’s (2024) [1] findings results in the following table.
Table 6.
Anderson, B. (2024) [1].
Table 6.
Anderson, B. (2024) [1].
| Projected New EV Registrations | |||||
|---|---|---|---|---|---|
| Consistent Year on Year Flat Demand per Brad Anderson (2024) | |||||
| A | B | C | D | E | F |
| Year | Current Annual Sales |
CARB Ramp-Up % Required |
CARB Required EV Sales “Ramp Up” |
Based on Flat Demand per Brad Anderson |
Based on Flat Demand Deficit/Surplus to CARB Req (E-D) |
| 2026 | 1,800,000 | 35.00% | 630,000.00 | 450,000 | (180,000.00) |
| 2027 | 1,800,000 | 43.00% | 774,000.00 | 450,000 | (324,000.00) |
| 2028 | 1,800,000 | 49.50% | 891,000.00 | 450,000 | (441,000.00) |
| 2029 | 1,800,000 | 59.00% | 1,062,000.00 | 450,000 | (612,000.00) |
| 2030 | 1,800,000 | 68.10% | 1,225,800.00 | 450,000 | (775,800.00) |
| 2031 | 1,800,000 | 76.00% | 1,368,000.00 | 450,000 | (918,000.00) |
| 2032 | 1,800,000 | 82.00% | 1,476,000.00 | 450,000 | (1,026,000.00) |
| 2033 | 1,800,000 | 88.00% | 1,584,000.00 | 450,000 | (1,134,000.00) |
| 2034 | 1,800,000 | 94.00% | 1,692,000.00 | 450,000 | (1,242,000.00) |
| 2035 | 1,800,000 | 100.00% | 1,800,000.00 | 450,000 | (1,350,000.00) |
| Totals-------> | 12,502,800.00 | 4,500,000.00 | (8,002,800.00) | ||
Clearly 450,000 new vehicle EV registrations each year falls short of the 1.8 million required under the “Mandate” as we have defined it, and the “ramp up” to 4.5 million cumulative new EV sales is less than half of the 12.5 million anticipated by the implied “ramp up” schedule.
3.7.2. Low to Moderate Income Mandate Compliance Potential
Again, annual income qualifications’ incentive structures relative to 300% of the federal poverty level Health care.gov. (n.d.) [16] for 2025 (roughly $15,000 per person) were structured as follows:
- $46,950 for a single person household
- $63,450 for two-person household
- $79,950 for three-person household
- $96,450 for four persons household
For purposes of this paper, and simplicity, because the Census data categorizes family households as two plus, the income for three person households will be used, rounded down to $75,000 to match Census categories.
An internet search (Carvana, March 2025) showed the lowest cost of a new passenger EV was $29,280 for a 2024 Nissan Leaf and $50,000 for light-duty EV trucks. The cost for an in-home charging station ranges between $1000 and $4000. For purposes of this paper, $1900 will be used.
Table 7.
California Households per US Census as of 31 December 2023 by Household Income Levels.
| All Hholds | Family Hholds (2+) | Non-Family Hholds | ||||
|---|---|---|---|---|---|---|
| % of Total | Actual # | % of Total | Actual # | % of Total | Actual # | |
| Per Census | 100.00% | 3,699,816 | 67.36% | 9,227,560 | 32.64% | 4,472,256 |
| Income Levels: | ||||||
| Less than $10,000 | 4.80% | 657,591 | 3.00% | 276,827 | 9.70% | 433,809 |
| $10,000 to $14,999 | 3.00% | 410,994 | 1.60% | 147,641 | 6.30% | 281,752 |
| $15,000 to $24,999 | 5.20% | 712,390 | 3.80% | 350,647 | 8.70% | 389,086 |
| $25,000 to $34,999 | 5.40% | 739,790 | 4.70% | 433,695 | 7.60% | 339,891 |
| Total < $35,000 | 18.40% | 2,520,766 | 13.10% | 1,208,810 | 32.30% | 1,444,539 |
| $35,000 to $49,999 | 8.20% | 1,123,385 | 7.50% | 692,067 | 10.10% | 451,698 |
| $50,000 to $74,999 | 13.50% | 1,849,475 | 13.00% | 1,199,583 | 15.20% | 679,783 |
| Total < $75,000 | 40.10% | 5,493,626 | 33.60% | 3,100,460 | 57.60% | 2,576,019 |
| $75,000 to $99,999 | 11.90% | 1,630,278 | 12.10% | 1,116,535 | 11.40% | 509,837 |
| $100,000 to $149,999 | 17.80% | 2,438,567 | 19.20% | 1,771,692 | 13.90% | 621,644 |
| $150,000 to $199,999 | 11.20% | 1,534,379 | 12.50% | 1,153,445 | 7.20% | 322,002 |
| Total < $200,000 | 81.00% | 11,096,851 | 77.40% | 7,142,131 | 90.10% | 4,029,503 |
| $200,000 or more | 19.00% | 2,602,965 | 22.60% | 2,085,429 | 9.90% | 442,753 |
| Totals | 13,699,816 | 9,227,560 | 4,472,256 | |||
| Median income (dollars) | 95,521 | 109,349 | 61,493 | |||
| Mean income (dollars) | 134,491 | 151,243 | 91,365 | |||
Table 8.
Estimated New Zero Emissions Vehicle and Charger Costs.
| Passenger | Trucks (Light Duty) | |
|---|---|---|
| New (Limited Options) | New (Limited Options) | |
| Vehicle Cost | $29,280 | $50,000 |
| Net Charger Cost | $1900 | $1900 |
| Pre-subsidy Cost | $31,180 | $51,900 |
| California Subsidy | ($10,000) | ($10,000) |
| Federal Subsidy | ($3751) | ($3751) |
| Net Cost | $17,429 | $38,149 |
Subtracting incentives arrives at a total cost of $17,429 for passenger EVs and $38,149 for light-duty trucks.
An internet search for car affordability showed a consensus for no more than 10% of take-home income to be spent on car payments, based on Zebra and Kelly Blue Book.
This serves as the basis for the following table of car payment affordability for California household incomes.
| California Household Income Level Per US Census Data | Car Payment Affordability (10% of Take-home Pay, Annual Income) |
|---|---|
| Income Levels: | |
| Less than $10,000 | $1,000.00 |
| $10,000 to $14,999 | $1,500.00 |
| $15,000 to $24,999 | $2,500.00 |
| $25,000 to $34,999 | $3,500.00 |
| $35,000 to $49,999 | $ 5,000.00 |
| $50,000 to $74,999 | $7,500.00 |
Comparing demographics with subsidized new EV passenger cars and truck costs provides a window into the possibility of purchase for subsidy qualified lower-income groups in California.
Table 10.
Affordability analysis for low income qualifiers for assistance.
| California Household Income Level per US Census Data | Car Payment Affordability (10% of Takehome Income) | Estimated Yearly Max Vehicle Payment Expenditure (72 Months at 6.75%) for Top Affordable Car Price * | Top Affordable Vehicle Price Based on Salary * | Likelihood of Purchasing New Zero Emission EV Passenger Vehicle Cost with Subsidies | Likelihood of Purchasing New Zero Emission EV Light Duty Truck Vehicle Cost with Subsidies | Number of Households | |
|---|---|---|---|---|---|---|---|
| New Passenger Vehicle EV Cost (With Subsidies) $17,429 | New Light Duty Truck EV Vehicle Cost (With Subsidies) $38,149 | ||||||
| Buy/Might Buy/Not Buy | Buy/Might Buy/Not Buy | ||||||
| Income Level: | |||||||
| Less than $10,000 | $1000.00 | $1500.00 | $7384.00 | Not Buy | Not Buy | 657,591 | |
| $10,000 to $14,999 | $1500.00 | $2244 | $11,076 | Not Buy | Not Buy | 410,994 | |
| $15,000 to $24,999 | $2500.00 | $3756 | $18,459 | Not Buy | Not Buy | 712,390 | |
| $25,000 to $34,999 | $3500.00 | $5244 | $25,843 | Might Buy | Not Buy | 739,790 | |
| $35,000 to $49,999 | $5000.00 | $7500 | $36,918 | Might Buy | Not Buy | 1,123,385 | |
| $50,000 to $74,999 | $7500.00 | $11,256 | $75,000 | Might Buy | Might Buy | 1,849,475 | |
| 5,493,625 | 41% of 13,699,816 Households | ||||||
| Not Buy = | 1,780,975 (13% of Total Households) | 3,644,150 (27% of Total Households) | |||||
| Might Buy = | 3,712,650 (27% of Total Households) | 1,849,475 (13% of Total Households) |
Comparing “New Passenger Vehicle EV Costs with Subsidies” (Top Affordable Car Price Based on Salary) provided the Buy/Might Buy/Not Buy determinations shown.
Comparing “New Light Duty Truck EV Costs with Subsidies” (Top Affordable Car Price Based on Salary) provided the Buy/Might Buy/Not Buy determinations shown. Given current incentives the likelihood these lower socio-economic segments of California households will comply with the “Mandate” seem doubtful.
3.8. Electric Vehicle Charging Stations—Concerns Across All Socio-Economic Levels
Another significant issue relative to the 2035 Mandate is, and will likely continue to be, the availability and logistics of electric vehicle charging stations (Lopez (2022) [25]), who determined that for every 10 new EV registrations 1.5 charging stations need to be added.
Using a ratio of 1.5 charging stations per 10 new EV registrations based on calculations by Lopez (2022) [25], if 6,950,000 cumulative new EV sales are projected by 2035, then 1,042,500 charging stations will be needed. Based on straight-line projections of 816,356 charging stations implemented by 2035, charging station needs will fall short by 226,144 (a quarter of a million).
Currently public charging stations are largely located in urban areas, principally along the western area of the State near the coastline. Recent data from the California Energy Commission, as of 26 August 2024, indicates there are 152,356 charging stations in place of which 65,472 are public and 86,884 private (California Energy, 26 August 2024). Comparing the current data to August 2023 indicates an approximate year-over-year increase of 65% (California Energy). Of course, a consistent 65% growth rate is very ambitious, because the basis for calculation is relatively small, 92,000 in August 2023 versus 152,356 in August 2024 (approximate 60,000 increase). For purposes of this paper, the actual numeric increase in charging stations will be utilized, and that number approximates 60,000 per year.
Combining data from Table 6 with Lopez’ (2022) [25] estimate of 1.5 new charging stations for every 10 new EVs registered, along with the approximate 60,000 yearly increase currently experienced, provides the following estimates based on present circumstances:
- Based on the authors’ projected new EV sales from 2026 to 2035 of 450,000 per year there will need to be 675,000 new charging stations in place (4,500,000 × 0.15).
- Based on the CARB ramp-up, if successful, there will need to be 1,875,420 charging stations in place (12,502,800 × 0.15).
- The authors’ assumption of 60,000 new charging stations per year over this ten-year period equates to 600,000 new charging stations in place, falling short of the estimates needed in # 1 and 2 above.
Lusk, Li, and Lu (2023) [27] performed a quantitative study of low-to-moderate income consumer preferences for EVs on a national basis, as related to the availability of charging stations. Their findings indicate upward of 90% of respondents would buy or lease an EV if the government subsidized the installation of charging stations at their residence or place of work (Lusk, Li, & Lu [27]). The timing of any such governmental endeavors and legislative support remains unknown currently.
Building more charging infrastructure in rural areas is also salient as residents tend to drive significantly more miles than commuters in areas with more infill. The types of automobiles likely used by rural drivers will require long-range charging capabilities (Lopez, N., 2022 [25]).
How the state, private residences, and the private sector will fare in reaching the estimated charging stations necessary by 2035 is unknown but will be important to the overall success of the “Mandate”.
4. Summary of Findings and Results
4.1. Research Question 1
Does an analysis of current data and trends suggest California will be able to achieve 100% of the “Mandate” for brand new zero emissions auto sales by 2035?
Based on the analysis provided in this paper it is doubtful California will achieve 100% compliance with the “Mandate”. The secondary data and literature show less than robust demand for zero-emissions vehicles by citizens at both the National level and more importantly at the State level within California.
Digging more deeply into what is likely to be a driver of the shortfall is an analysis showing that California incentives focused on low-income California Households (those making less than $75,000 per year), while well intentioned, are likely not enough to encourage these low-income socio-economic groups to appreciably participate. This demographic makes up 40% of the 13,699,816 households in California and if they do not participate, they will severely attenuate implementation.
It should be noted that even if new EV sales fall short of the goals of the “Mandate” as defined in Understanding 2, greenhouse gas emissions will likely be impacted/reduced.
4.2. Research Question 2
Based on current trends and ancillary data, can California develop enough charging stations to facilitate desired purchase demand for brand new zero emissions EV’s?
The analysis provided in this paper shows that under either of two scenarios, CARB’s (2022) implied pseudo-exponential EV ramp up to a 2035 total of over 12 million new EVs in service, or a straight-line increase in EV’s as posited by data from Anderson (2024) [1], in-service charging stations fall short of needs. As the current distribution of charging stations is very West Coast centric, the lack of charging stations in the inland and more mountainous sections of California likely adds to consumer concerns around range anxiety. In addition, the lower socio-economic households performing more so-called blue collar manual jobs and services will find the lack of charging stations even more problematic.
4.3. Propositions Adherence
- Most likely, California will not be able to achieve 100% compliance with Mandate directives by 2035 and likewise will not realize expectations of new EV auto sales, based on current data and trends. Analyses in this research endeavor support this proposition.
- California consumers will likely have adequate access to new EVs to meet related demand. Due to the flat-to decreasing national demand and political changes, resulting from the November 2024 election which are less supportive of clean energy directives, California should have an adequate supply of new EVs to meet demand as inventory build-ups in other states appear likely.
- Presently, California has failed to adequately address demand (including affordability) of lower-income populations for EVs but could implement policies to better incentivize EV purchases by subsidizing more public and private charging station installations and increasing the financial incentives for EV purchases, including leases and used EVs. This proposition also appears true as there was no evidence obtained in this research endeavor that indicates California has seriously implemented policies to better assure acceptance and affordability of new EVs by this demographic.
- California will not be able to develop enough charging stations to meet consumer needs relative to new EV registrations. Analyses in this paper support this proposition as apparent new development of charging stations will be far short of the quantity needed, based on 1.5 charging stations per every 10 new EVs sold.
- California will have difficulty enforcing the Mandate, resulting from numerous variables affecting such enforceability. These authors did not locate any evidence of California’s strategy for enforcing compliance with the Mandate.
5. Recommendations
- Because the Mandate is an executive order, the California legislature should codify it via legislation to preserve its intentions relative to reducing carbon emissions and extend the policies in the Mandate to 2045. It appears the target date of 2035 for full compliance with the Mandate was/is too ambitious, and the State and consumers need more time to adhere to Mandate expectations.
- The cap-and-trade program does not expire until 2030 so California should designate all future 40% discretionary allocations to EV rebates/incentives, either in modification of existing programs or new ones. To date, the rebate programs have only received 5% of total cap-and-trade funds. Because the California budget is stressed and unpredictable, any rebate program should have its own dedicated funding source, and cap-and-trade presently appears to be the only viable mechanism for achieving this.
6. Areas for Further Research
- Extensive research, quantitative and qualitative, is necessary in low-income communities to assess factors related to their acceptance of EVs, as well as how a government subsidized charging station would influence their decision to buy a new EV.
- In addition, this research needs to determine the affordability of new EVs and what monthly payment is necessary to facilitate EV purchases in these communities.
- Beyond low-income communities, research is needed for all income groups as some evidence suggests EV demand is leveling and even reducing in some groups. There should be an emphasis on “high commuting” areas such as the Inland Empire.
- Per quantitative and qualitative research, given the likely shortfall in new EV sales expectations by CARB, the potential market reaction to any shortfalls in historic annual sales should be explored. In effect, what are car dealers and consumers likely to do?
- Targeted technical research is necessary to evaluate the installation of charging stations in multi-family apartments where many low-income households reside. Further complicating the installations is the well-known common knowledge factor of excessive street parking in these communities. Because of the high cost of rent, apartments often contain more than one household, but most adult occupants typically have a vehicle. The number of parking spaces in the apartment complexes is usually inadequate.
7. Conclusions
California’s Mandate to sell only new EVs by 2035 appears to be unattainable. There are many reasons for this including near-zero demand in low-income populations and less than robust demand in moderate to higher-income groups. Presently, there are no realistic rebate mechanisms in place as the Clean-Cars-4-All program requires the turning-in of a pre-2007 gas guzzler vehicle along with meeting the income requirements. Because of the large population of low-income households living in apartment buildings, it is quite challenging to find a process for installing an adequate number of charging stations to meet any increases in EV purchases. Sales tax revenue from new car sales is very likely to be reduced if the Mandate is able to be enforced, since a new EV only policy demonstrates significantly fewer annual sales, based on all fuel types.
Further complicating EV purchasing progress are changes in the federal government philosophy regarding climate change mitigation, resulting from recent election results. It does not appear likely that additional federal subsidies will occur, but those codified under the Inflation Reduction Act may likely remain.
In order to improve on the outcomes provided by the analysis shown in this paper California would need to challenge thinking and assumptions surrounding enforceability and incentives.
Assessing the enforceability of the Mandate would involve the ability of researchers to quantify and control numerous variables beyond the scope of this paper. However, we can present certain questions surrounding said enforceability and possible impacts, as follows:
- Given the large and diverse population and geographic size of California, how can the State quantify ongoing new vehicle sales among numerous car dealers and regulate the new EV purchase ratios indicated in Table 7?
- Can California legally regulate consumer demand and related sales activity in a free market, particularly if there is little to no federal support in doing so?
- If enforceability is likely and California develops an adequate regulatory process to assure compliance with the new EV sales only regulations, what are the sales tax implications? For example, if total EV sales remain at 450,000 by 2035, per these authors’ projections, versus normal annual new vehicle sales of 1,800,000 for all fuel types, how will the State and local governments react to the likely decrease in sales tax revenue?
- And, somewhat conversely, if California is successful in replacing 1.8 million new vehicle sales (all fuel types) with EV only sales, what are the likely impacts from reduced gasoline tax revenue and how can the State replace that revenue?
References
- Anderson, B. Nearly 1 in 4 New Cars Sold in California Are EVs. CARSCOOPS. 10 November 2024. Available online: https://www.carscoops.com/2024/11/nearly-1-in-4-new-cars-sold-in-california-from-january-to-september-were-evs/#:~:text=By%20the%20end%20of%20the,or%20exceeded%201.89%20million%20units (accessed on).
- Beneficial State Foundation. Celebrating the Impact of Our Clean Vehicle Assistance Program. 7 March 2024. Available online: https://beneficialstate.org/perspectives/celebrating-the-impact-of-our-clean-vehicle-assistance-program/ (accessed on 20 August 2024).
- California Energy Commission. Zero-Emission Vehicle Sales Remain Strong in California. 26 August 2024. Available online: https://www.energy.ca.gov/data-reports/energy-almanac/zero-emission-vehicle-and-infrastructure-statistics-collection/electric (accessed on 13 January 2025).
- California New Car Dealers Association. California New Light Vehicle Registrations Predicted to Increase Slightly in 2025. Volume 20, Number 4. October 2024. Available online: https://www.cncda.org/wp-content/uploads/Cal-Covering-3Q-24.pdf (accessed on).
- California Immigrant Data Portal. Industries and Occupations. 2021. Available online: https://immigrantdataca.org/indicators/industries-and-occupations (accessed on 20 August 2024).
- CARB.1 (California Air Resources Board). Advanced Clean Cars Program. Available online: https://ww2.arb.ca.gov/our-work/programs/advanced-clean-cars-program (accessed on 9 August 2024).
- CARB.2 (California Air Resources Board). Cars and Light Trucks Are Going Zero. Available online: https://ww2.arb.ca.gov/resources/fact-sheets/governor-newsoms-zero-emission-2035-executive-order-n-79-20 (accessed on 9 August 2024).
- CARB.3 (California Air Resources Board). 2024 Climate Investments Annual Report. pp. 66–75. Available online: https://ww2.arb.ca.gov/sites/default/files/auction-proceeds/cci_annual_report_2024.pdf (accessed on 9 August 2024).
- CARB.4 (California Air Resources Board). Table II-5, p. 7, Public Hearing to Consider Advanced Clean Cars II Regulations. 25 August 2022. Available online: EMFAC see p. 6.pdf (accessed on).
- CDFA, California Department of Tax and Fee Administration. California City & County Sales & Use Tax Rates. Available online: https://www.cdtfa.ca.gov/taxes-and-fees/sales-use-tax-rates.htm#:~:text=Tax%20Districts,one%20district%20tax%20in%20effect (accessed on 1 March 2025).
- Census.gov. Quick Facts California. Available online: https://www.census.gov/quickfacts/fact/table/CA/BZA210222 (accessed on 28 February 2025).
- Clegern, D.; Young, S. California Moves to Accelerate to 100% New Zero-Emission Vehicle Sales by 2035. California Air Resources Board. 25 August 2022. Available online: https://ww2.arb.ca.gov/news/california-moves-accelerate-100-new-zero-emission-vehicle-sales-2035/printable/print (accessed on).
- Fact Sheet. Biden-Harris Administration Announces New Private and Public Sector Investments for Affordable Electric Vehicles. Briefing Room, Statements and Releases. The White House, 17 April 2023. Available online: https://www.whitehouse.gov/briefing-room/statements-releases/2023/04/17/fact-sheet-biden-harris-administration-announces-new-private-and-public-sector-investments-for-affordable-electric-vehicles/ (accessed on 27 August 2024).
- Fisher, J. Electric Truck Prices in 2024—Every Electric Pickup’s Pricing, Range, and Availability. CarEdge. 8 February 2024. Available online: https://caredge.com/guides/electric-truck-prices-2024 (accessed on 27 August 2024).
- Fischer, J. New Car Price Trends in 2025: Average Selling Prices Hold Near Record High. 28 February 2025. Available online: https://caredge.com/guides/new-car-price-trends-in-2025 (accessed on 1 March 2025).
- Health care.gov. Federal Poverty Level. n.d. Available online: https://www.healthcare.gov/glossary/federal-poverty-level-fpl/ (accessed on 20 August 2024).
- Hickey. Going Inside Electric Vehicles Growth in 2023, Digital Dealer. 30 April 2024. Available online: https://digitaldealer.com/dealer-gm/going-inside-electric-vehicles-growth-on-2023/ (accessed on 31 August 2024).
- Holliman, A.; Collins, K. California’s Cap-and-Trade Program: Is it effective in advancing social, economic, and environmental equity? Public Adm. Policy 2023, 26, 128–141.
- IEA: International Energy Agency. Global EV Outlook 2024. n.d. Available online: https://iea.blob.core.windows.net/assets/a9e3544b-0b12-4e15-b407-65f5c8ce1b5f/GlobalEVOutlook2024.pdf (accessed on 27 August 2024).
- IER (Institute of Energy Research). Biden Releases New Rules to Force Electric Vehicles on Americans. 23 April 2023. Available online: https://www.instituteforenergyresearch.org/renewable/biden-releases-new-rules-to-force-electric-vehicles-on-americans/ (accessed on 27 August 2024).
- IRS. Credits for New Clean Vehicles Purchased in 2023 or After. 8 August 2024. Available online: https://www.irs.gov/credits-deductions/credits-for-new-clean-vehicles-purchased-in-2023-or-after (accessed on 27 August 2024).
- Jones, J.M. EV Ownership Ticks Up, but Fewer Buyers Want to Own One. Gallup, Social and Policy Issues. 8 April 2024. Available online: Gallup.com (accessed on 22 September 2024).
- Kelly Blue Book, n.d. Available online: https://www.kbb.com/car-affordability-calculator/ (accessed on 16 March 2025).
- LAO, Legislative Analyst Office. 6 September 2024. Available online: https://lao.ca.gov/Publications/Report/4922 (accessed on 1 March 2025).
- Lopez, N. Can Californians Afford Electric Cars? Wait Lists for Rebates are Long and Some Programs Have Shut Down. CalMatters. 2 August 2022. Available online: https://calmatters.org/environment/2022/08/california-electric-cars-rebates/ (accessed on 11 October 2022).
- Lopez, N.; Yee, E. Who Buys Electric Cars in California—And Who Doesn’t? CalMatters. 22 March 2023. Available online: https://calmatters.org/environment/2023/03/california-electric-cars-demographics/ (accessed on 27 August 2024).
- Lusk, A.; Li, X.; Liu, Q. If the Government Pays for Full Home-Charger Installation, Would Affordable-Housing and Middle-Income Residents Buy Electric Vehicles? 1 March 2023. Sustainability, 15, 5. Available online: https://www.mdpi.com/2071-1050/15/5/4436 (accessed on 27 August 2024).
- Meyer, S. How Much Car Can I afford? The Zebra. 13 October 2023. Available online: https://www.thezebra.com/resources/driving/how-much-car-can-i-afford/ (accessed on 28 February 2025).
- Noda, L. Sacramento Policymakers Drive California’s High Gasoline Prices. Stillwater Associates. 1 February 2021. Available online: https://stillwaterassociates.com/sacramento-policymakers-drive-californias-high-gasoline-prices/ (accessed on 5 January 2022).
- Randall, T. US Electric Vehicle Sales Reach Breakthrough Pace. Bloomberg. 14 September 2023. Available online: https://www.bloomberg.com/news/articles/2023-09-14/us-likely-surpassed-crucial-million-per-year-ev-milestone (accessed on 31 August 2024).
- Sherk, J.; Sagert, J. Research Report: Proposed EV Mandate Would Eliminate 117,000 Auto Manufacturing Jobs. 13 July 2023. Available online: https://americafirstpolicy.com/issues/research-report-proposed-ev-mandate-would-eliminate-117000-auto-manufacturing-jobs (accessed on 27 August 2024).
- Symon, E. New Report Shows Electric Car Sales Slipping in California. California Globe. 19 July 2024. Available online: https://californiaglobe.com/fr/new-report-shows-electric-car-sales-slipping-in-california/ (accessed on).
- Taylor, K.R. Want to Lease an EV? There’s a Tax Credit ‘Loophole’ for That. Kiplinger. 14 May 2024. Available online: https://www.kiplinger.com/taxes/ev-lease-tax-credit-loophole (accessed on 3 September 2024).
- U.S. Department of Energy; Energy Efficiency and Renewable Energy. n.d. Available online: https://afdc.energy.gov/vehicles/electric-batteries (accessed on 24 August 2024).
- Lopez, N.; Yee, E. Explore the ZIP Codes with the Highest Share of Electric Cars. CalMatters. 22 March 2023. Available online: https://calmatters.org/environment/2023/03/california-electric-cars-demographics/ (accessed on 27 August 2024).
- Zebra. n.d. Available online: https://www.thezebra.com/resources/driving/how-much-car-can-i-afford/ (accessed on 16 March 2025).
- Zhao, N. Hispanics Comprise 61% of the Construction Workforce in Texas. National Association of Home Builders. 5 July 2022. Available online: https://eyeonhousing.org/2022/07/hispanics-comprise-61-of-the-construction-workforce-in-texas/ (accessed on 27 August 2024).
Table 3.
(Sources: Clegern & Young, 25 August 2022 [12]; California New Car Dealers Association, October 2024 [4]).
| Year | Average Sales Estimates per Year | %/100 Sales Required to Meet Mandate (per Regulation) | BEV and PHEV Sales Needs |
|---|---|---|---|
| 2026 | 1,800,000 | 0.35 | 630,000 |
| 2027 | 1,800,000 | 0.43 | 774,000 |
| 2028 | 1,800,000 | 0.51 | 918,000 |
| 2029 | 1,800,000 | 0.59 | 1,062,000 |
| 2030 | 1,800,000 | 0.68 | 1,224,000 |
| Sub-tot | 4,608,000 | ||
| 2031 | 1,800,000 | 0.76 | 1,368,000 |
| 2032 | 1,800,000 | 0.82 | 1,476,000 |
| 2033 | 1,800,000 | 0.88 | 1,584,000 |
| 2034 | 1,800,000 | 0.94 | 1,692,000 |
| 2035 | 1,800,000 | 1 | 1,800,000 |
| Total BEV & PHEV Required Sold and Registered by 2035 | 12,528,000 |
Note: Under the CARB ramp-up schedule, targeted New EV sales amount to a cumulative amount of 12,528,000 by 2035. However, it is conceivable that California consumer demand and purchases of EVs could accelerate significantly in the later years of the schedule, meeting Mandate expectations by 2035. For information purposes only, and not part of the ramp-up schedule, this table does not include an estimated base amount of new EV registrations amounting to 2,450,000 for 2024 and 2025 combined, which equals an overall estimate of 14,978,000 until 2035.
Table 4.
Adapted from CARB, Table II-5, P. 7, Public Hearing to Consider Advanced Clean. Cars II Regulations. 25 August 2022 (CARB.4 [9]).
Table 4.
Adapted from CARB, Table II-5, P. 7, Public Hearing to Consider Advanced Clean. Cars II Regulations. 25 August 2022 (CARB.4 [9]).
| California Percentage Requirements for New Auto Zero Emission Sales 2026 Through 2035 | |||||
|---|---|---|---|---|---|
| Year | BEV 300 | BEV 400 | PHEV | FCEV | Totals |
| 2026 | 31.40% | 0% | 3.30% | 0.30% | 35.00% |
| 2027 | 39.40% | 0% | 3.30% | 0.30% | 43.00% |
| 2028 | 45.30% | 0% | 3.90% | 0.30% | 49.50% |
| 2029 | 46.80% | 8.00% | 3.90% | 0.30% | 59.00% |
| 2030 | 48.00% | 13.70% | 3.90% | 2.50% | 68.10% |
| 2031 | 48.00% | 21.30% | 3.90% | 2.80% | 76.00% |
| 2032 | 48.00% | 27.30% | 3.90% | 2.80% | 82.00% |
| 2033 | 48.00% | 33.30% | 3.90% | 2.80% | 88.00% |
| 2034 | 48.00% | 38.50% | 4.70% | 2.80% | 94.00% |
| 2035 | 48.00% | 40.00% | 9.20% | 2.80% | 100.00% |
Note: BEV 300 = battery vehicles with up to 300 miles of charging capacity. BEV 400 = up to 400 miles charging capacity; PHEV = plug-in hybrid vehicles; and, FCEV = Fuel cell electric vehicles.
Table 5.
Estimated monthly car payment based on salary (Meyer, 13 October, 2023 [28]).
Table 5.
Estimated monthly car payment based on salary (Meyer, 13 October, 2023 [28]).
| Annual Salary (Pre-Tax) | Estimated Monthly Car Payment Should not Exceed |
|---|---|
| $25,000 | $208 per month |
| $50,000 | $416 per month |
| $75,000 | $625 per month |
| $100,000 | $833 per month |
| $125,000 | $1042 per month |
| $150,000 | $1250 per month |
Note: Annual household incomes below $25,000 (pre-tax) per year are not considered in the table above.
Disclaimer/Publisher’s Note: The statements, opinions and data contained in all publications are solely those of the individual author(s) and contributor(s) and not of MDPI and/or the editor(s). MDPI and/or the editor(s) disclaim responsibility for any injury to people or property resulting from any ideas, methods, instructions or products referred to in the content. |
© 2025 by the authors. Licensee MDPI, Basel, Switzerland. This article is an open access article distributed under the terms and conditions of the Creative Commons Attribution (CC BY) license (http://creativecommons.org/licenses/by/4.0/).
Copyright: This open access article is published under a Creative Commons CC BY 4.0 license, which permit the free download, distribution, and reuse, provided that the author and preprint are cited in any reuse.


