Submitted:
08 May 2025
Posted:
08 May 2025
You are already at the latest version
Abstract
Background/Objectives Variations of the latrophilin-3 (Lphn3) gene have been associated with atten-tion-deficit hyperactivity disorder (ADHD). To explore the functional influence of this gene, Lphn3 knockout (KO) rats were generated and have thus far demonstrated deficits in ADHD-relevant phenotypes, including working memory, impulsivity, and hyperactivity. However, inattention remains unexplored.
Methods: We assessed automatic attention through use of auditory event-related potentials (ERPs) in Lphn3 KO and their control line (Wildtype/WT). We also extended this exploratory study to include one of the most validated animal models of ADHD, the Spontaneously Hypertensive Rat (SHR) by comparing these same ERPs in SHRs relative to their control line (Wistar-Kyoto/WKY). Electroencephalograms (EEG) were recorded using subdermal needle electrodes at frontocentral sites while freely moving rats were presented 5-tone trains (50-ms tones, 400-ms tone onset asynchronies) with varying short (1 s) and long (5 s) inter-train intervals.
Results: KOs did not demonstrate any significant differences in peak amplitudes relative to WT controls, suggesting the null expression of Lphn3 does not result in the development of inefficiencies in automatic at-tention. However, SHRs exhibited significantly reduced peak P1 (and peak-to-peak P1-N1) relative to WKYs. These attenuations likely reflect inefficiencies in bottom-up, arousal networks necessary for efficient automatic processing. These findings are analogous to those found in humans with ADHD, suggesting similar neurobi-ological mechanisms underlie deficits in automatic attention across species.
Conclusions: Distinct findings between these animal models likely reflect differing alterations in dopamine and noradrenaline neurotransmission that may underlie ADHD-relevant phenotypes.
Keywords:
ADHD
; SHR
; Lphn3
; ERPs
; LLAEP
; animal model
; attention
1. Introduction
1.1. ADHD and Lphn3
Attention-deficit hyperactivity disorder (ADHD) is a neurodevelopmental disorder characterized by hyperactivity, disinhibition, and inattention that interferes with an individual’s daily life functioning [1]. The national prevalence of ADHD has been estimated at 11.4% in children and adolescents [2] and 6% in adults [3], with functional impairments persisting into adulthood for upwards of two-thirds of children diagnosed [4]. The Diagnostic and Statistical Manual (DSM-V-TR) recognizes three presentations of ADHD: inattentive, hyperactive/impulsive, or a combination of the two [1]. However, individuals usually present with highly heterogenous and multifaceted symptoms that may change over the course of development and do not necessarily fit within these presentations (for a review, see [5]). This complexity can make the treatment and management of symptoms difficult. Therefore, furthering our understanding of its etiology and pathophysiology may aid in better differentiating subsets of presentations and treating individuals with diverse profiles.
ADHD is highly heritable, with a reported mean heritability of 74% [6]. In addition, it is generally accepted that symptom dysfunction falls along a dimensional continuum, with those with “true” ADHD representing the extreme end of it [7,8]. This is supported by both twin and molecular studies [9]. Thus, the delineation of risk genes contributing to the etiology and pathophysiology of ADHD may prove valuable to understanding the disorder. Variants of the latrophilin 3 (Lphn3), or adhesion G protein-coupled receptor L3 (Adgrl3), gene have been linked through genome-wide linkage studies to the risk of developing ADHD [10,11,12,13]. Further, a recent meta-analysis of the most common single nucleotide polymorphisms (SNPs) of Lphn3 reported significant associations between rs6551665 and rs2345039 SNPs and the susceptibility to developing childhood ADHD [13]. Thus, understanding the functional significance of Lphn3 in ADHD may advance our knowledge of the neurobiology of ADHD.
Notably, substantial genetic overlap exists with other externalizing, internalizing, and neurodevelopmental symptoms (for reviews, see [6,15]). However, this overlap is rarely addressed in part due to the common practice of comparing groups within the conceptual bounds of DSM criteria (i.e., those with “ADHD” versus controls). Therefore, to better delineate the neurobiological underpinnings of dysfunctional phenotypes across and within different disorders, we adhere to the framework outlined by the research domain criteria (RDoC) [16,17]. RDoC shifts the focus away from polythetic conceptualizations inherent in DSM-based categories to dimensional constructs understood to cut across psychiatric disorders (e.g., motivation, disinhibition, inattention, etc.). Furthermore, by moving from modeling complex clusters of human behavior to functional dimensions grounded in neurobiology, animal models can be generated with greater precision [18,19].
1.2. Lphn3 and Animal Models of ADHD Phenotypes
Animal models have utility for exploring ‘downstream’ effects of relevant genes on neurobehavioral mechanisms underlying mental disorders [18]. To understand the function of Lphn3, a growing number of genetic knockdown (KD; i.e., subjects have reduced expression of Lphn3) and knockout (KO; i.e., subjects are null for the expression of Lphn3) models have been produced and studied, including Drosophila KDs [20], zebrafish KDs [21,22,23,24] and mouse KOs [25,26,27]. Although these models have contributed to advancing our understanding of the function of Lphn3, they lack the capacity to assess cognitive domains commonly associated with ADHD (e.g., working memory, impulsivity, learning and memory).
To address this limitation, an Lphn3 KO rat was developed [28]. These rats have been found to be hyperactive in both novel and—unlike KO mice [27]—familiar environments [28]. Additionally, they are impulsive, demonstrate working memory inefficiencies [29,30,31], and have selective deficits in egocentric and allocentric learning and memory [32]. However, despite inattention being a core characteristic of some presentations of ADHD, it has been assessed only indirectly in this model using a noncued alteration task [31]. Thus, it remains an open question whether Lphn3 KOs exhibit deficits in attention.
1.3. Auditory Evoked Potentials and Attention in ADHD
Event-related brain potentials (ERPs), the summation of neural activity time locked to the presentation of a stimulus and recorded using electroencephalography (EEG) [33], have clear genetically determined differences in humans (e.g., [34]), as well as rodent models of psychopathology (e.g., [35]) and neurodevelopment (e.g., [36]). Additionally, rats exhibit relatively homologous patterns in ERP components in response to passive visual and auditory stimuli (e.g., [37,38,39]) to that of humans, making them a viable translational tool.
A subset of ERPs, auditory evoked potentials (AEPs), allows for examining auditory processing at distinct levels of the auditory system from the cochlea to the cortex [40]. AEPs are organized into three categories based on the latency from stimulus onset: brainstem auditory evoked potentials (BAEPs; 1–10 ms), middle latency auditory evoked potentials (MLAEPs, 10–50 ms), and long latency auditory evoked potentials (LLAEPs, 50–300 ms). LLAEPs are primarily measured from the scalp/dorsal cephalic position (referenced to post-auricular positions) and are colloquially referred to as ERPs. They consist of two obligatory components, the positive P1 and negative N1, followed by alternating positive and negative peaks that reflect activity beyond primary auditory processing and are not specific to the stimulus (for a review, see [40]).
Of these components, the auditory N1 (or N100) is primarily exogenous, being influenced predominantly by the characteristics of the presented stimulus (e.g., intensity, saliency). However, it also has endogenous properties (i.e., related to the characteristics of the subject). Specifically, the N1 is modulated by both arousal (i.e., sensitivity to detect environmental stimuli) and attention (i.e., allocation of cortical resources to stimuli), with a more robust N1 observed when individuals are physiologically alert and actively attending to a stimulus (for reviews, see [41,42]). In short, the N1 may function as a neural correlate of sensory processing of an eliciting stimulus that is further modulated by one’s selective attention (i.e., top-down, voluntary processes) and arousal (i.e., bottom-up, automatic processes).
Given attention may modulate the auditory N1, it is reasonable to predict its presentation may be altered in those with ADHD; however, findings have so far been mixed. While some have reported the N1 to be generally attenuated in those with ADHD (for reviews, see [43,44]), a more recent meta-analysis reported no significant differences between ADHD and non-ADHD participants [45]. That said, these inconsistencies may be explained by several limitations, including an inability to account for several relevant moderators (e.g., specific ADHD presentation, comorbidities, symptom severity), focusing solely on males, and most of the reviewed studies consisting of children ages 6-11 years old. Additionally, this meta-analysis focused primarily on ERPs with prominent cognitive components elicited by active tasks (e.g., selective attention, inhibitory control, error monitoring) [45]. This is notable given effortful attention may produce larger increases in the N1 in those with ADHD [46,47] while the N1 is reduced in the context of automatic, non-effortful attention [48].
Sable et al. [48] examined the association between automatic attention and the N1 in young adults with and without ADHD (based on self-reported diagnosis from a physician) using a passive auditory paradigm. Participants were asked to ignore auditory tone trains separated by either a short (1-s) or long (5-s) inter-train interval (ITI) while watching a silent video. As anticipated, the control group demonstrated a more robust N1 following the longer, more salient, ITI, however, this difference was absent in adults with ADHD. This attenuation of the N1 was understood to reflect deficits in automatic attention in those with ADHD, with this being primarily driven by lack of bottom-up gain from subcortical structures [48].
1.4. The Current Study
To understand the influence of Lphn3 on inattention, we examined the auditory-evoked P1 and N1 and other auditory ERPs (P2 and N2) between Lphn3 KO rats and their wildtype (WT) control line [28]. As it is not fully understood whether the P1 or N1 is more analogous with the human N1 [49], we focused on changes in both components. To accomplish this, we utilized a modified version of the auditory paradigm previously implemented in humans to explore automatic attention [48]. This passive auditory paradigm uses trains of 5 tones with inter-tone intervals (onset to onset) of 400 ms, each separated by either a 1-s (short) or 5-s (long) ITI. By varying the period of silence between each train, it is possible to examine both attenuation of AEPs across tones (i.e., reduction in response across repeated tones in train) and recovery of the response (i.e., greater response following the 5-s ITI than 1-s ITI), which can take as long as ~5 s in rats [50]. Therefore, this paradigm allows the examination of not only the absolute P1 and N1 amplitudes, respectively, but also the interaction between attenuation (i.e., inhibition) and recovery (i.e., release from inhibition; see [51], for support of the distinction between these processes).
We also assessed these auditory ERPs in a more established animal model of ADHD, the Spontaneously Hypertensive Rat (SHR). The SHR line was created by selectively breeding Wistar-Kyoto (WKY) rats from disparate lines for high cytosolic blood pressure [52]. SHRs have demonstrated good face validity, with evidence of hyperactivity, impulsivity, and inattention (for a recent review, see [53]). Notably, however, only sustained attention has been evaluated in this model [54,55]. While a single study was found that noted altered sensory gating based on ERP changes in SHRs [56], automatic attention processes have remained broadly unexplored.
In summary, we aimed to address whether Lphn3 KO and SHRs demonstrate deficits in automatic attention as indexed by reductions in P1 and/or N1 amplitudes to the first tone following the 5-s ITI. By doing this, we sought to answer whether the null expression of Lphn3produced deficits in automatic attention, as well as add to the construct validity of the SHRs.
2. Materials and Methods
2.1. Animals
All procedures were sanctioned by The University of Memphis Institutional Animal Care and Use Committee (IACUC) and conducted in accordance with the Public Health Service Policy on Humane Care and Use of Laboratory Animals [57]. Twenty-one SHRs (9 F, 12 M), and 24 WKYs (12 F, 12 M) were obtained from Charles River Laboratories (Kingston, NY) and arrived at the University of Memphis at approximately post-natal day (P) 45. Twenty-two Lphn3 KOs (11 M, 11 F) and 24 WTs (14 F, 10 M), from a Sprague Dawley background (SD-IGS, strain 001, Charles River Laboratories, Charleston, NC) were acquired from the Cincinnati Children’s Research Foundation at approximately P30. KOs were generated at the Cincinnati Children’s Transgenic Animal and Genome Editing Core utilizing CRISPR/Cas9 to delete exon 3 (see [28], for details regarding this process and the confirmation of successful deletion of Lphn3). One rat per genotype per sex per litter was randomly selected with the use of a random number table for this experiment.
Upon delivery, same-sex and same-strain rats were pair housed in standard plastic cages (45 cm x 24 cm x 30 cm) with corn cob bedding. They were then housed in a temperature- (23±2ºC) and humidity- (30-70%) controlled room with a 12-hr reverse light/dark cycle (lights off at 0700 hr). Rats had ad lib access to feed (Teklad, 2018) and water until P60 at which time they were placed on a food restriction schedule and maintained at 85-90% of free-feeding weight, which was adjusted bi-weekly to account for any growth. Behavioral testing began at P70 (see [31] for details). At the conclusion of behavioral testing, rats remained pair housed and were transitioned to free feed for the duration of this study. The average postnatal (P) age of KO rats was P182.33 (SD = 19.79) and WTs P182.25 (SD = 22.79) at the time of EEG data acquisition, while that of SHRs was P196.32 (SD = 5.24) and WKYs P195.63 (SD = 5.36).
2.2. Electrode Placement
ERPs were recorded in awake rats utilizing a method we adopted for use in both awake and anesthetized rats [58]. Each rat was initially placed in an induction box and anesthetized with 3-4% isoflurane in oxygen until sedated, as confirmed by the absence of tail and toe (pedal) pinch reflexes. It was then transported to the operating table and placed on an electric heating pad where anesthesia depth was maintained on 1-2% isoflurane in oxygen via a nose cone. The fur from the scalp to the base of the neck was shaved using an electric razor and any remaining stubble was removed using a depilatory of potassium thioglycolate. The exposed skin was thoroughly rinsed with water and soaked gauze, swabbed with betadine, and cleaned with a 70% isopropyl alcohol pad.
Three 7-mm disposable subdermal needle electrodes (Rhythmlink; Columbia, SC) were inserted into the scalp. The recording electrode was placed ~3 mm anterior to bregma, terminating directly above the frontal cortical region (roughly homologous to Fz in humans). The reference electrode was caudal to the right ear, while the ground was symmetrically placed caudal to the left ear. Impedance was checked using Biopac MP36 and BSL software (Biopac System Inc; Goleta, CA, USA), with below 15 kΩ, considered acceptable. An initial administration of cyanoacrylate adhesive (i.e., super glue) was used to secure the electrodes and then supplemented by a generous application of Collodion-soaked gauze. Tegaderm HP (3M; St. Paul, MN) transparent dressing was then placed over the electrodes once the collodion had dried. The rat was then outfitted with a jacket (Instech Laboratories Incorporated; Plymouth Meeting, PA) connected to a flexible stainless-steel spring to cover and secure the lead wire. Once the jacket was confirmed to be secured, but not excessively tight to impede movement or cause discomfort, isoflurane flow was discontinued so the rat was only on pure oxygen through the nose cone. Upon the rat voluntarily removing its nose from the nose cone, it was placed in a recovery chamber for an additional 30 min. Once fully recovered, it was moved to a 50 cm x 50 cm x 25 cm sound-attenuated chamber for ERP recordings. This entire process took approximately 35 to 40 min to complete for each rat.
2.3. ERP Recordings and Auditory Stimuli
Once the rat was in the testing chamber, the lead wires were fed through the top and connected to a swivel to permit the rat to freely move throughout the chamber. Each rat was given ~5 min prior to EEG acquisition to acclimate to the chamber. The lead wires were connected to an integrated ERP recording system utilizing a Biopac MP36 and BSL software (Biopac System Inc; Goleta, CA, USA). EEG data were sampled at 500 Hz with a DC to 100-Hz band pass filter and a 60-Hz notch filter. Data were further filtered offline using an FIR filter with a 0.01-30 Hz bandpass (for further information regarding data collection setup, [58]).
Following 2 min of resting EEG recording, the rat was presented with a series of tone trains, each preceded in randomized order by either a 1- or 5-s ITI, for a total of 320 trains/ITIs (160 long and 160 short). The trains consisted of ~90-dB complex tones with a 500-Hz fundamental frequency and harmonics at 1000 and 1500 Hz (-3 dB and -6 dB, respectively, relative to the fundamental). All tones were 50 ms in duration with 5-ms Gaussian onset and offset periods and 400-ms stimulus onset asynchronies (SOAs) within tone trains. Tones were calibrated prior to each recording session using an ambient sound meter. Tone trains played through a speaker centered near the top-back of the testing chamber and were presented by SuperLab version 4.5 (Cedrus Corp., San Pedro, CA). The onset of each ITI was recorded and marked in the EEG data file using a StimTracker (Cedrus, San Pedro, CA).
Rats with ≥ 60 accepted trials were considered to have a valid number of trials to be included in the analyses. KOs had an average of 121 short- and long-ITI trials accepted (minimum short and long ITI was 90 and 91, respectively), and WTs had an average number of 125 short and 126 long ITI trials accepted (minimum 74 and 76 long and short ITI, respectively). No significant difference was found in the number of accepted trials between KOs and WTs for short [t (37) = -.515, p = .609] or long ITIs [t (37) = -.670, p = .507]. SHRs demonstrated a significantly greater number of rejected trials than WKYs for both short [t (34) = -8.537, p < .001] and long ITIs [t (34) = -7.764, p <.001]. This was predominantly related to a high number of movement artifacts observed in SHRs, likely due to their more hyperactive nature. Given this, a select number of SHRs completed ~1-3 additional recording sessions to obtain a sufficient number of usable trials. This was also done with the remaining WKYs to be consistent across both strains. For each rat, two sessions were selected to maximize the number of usable trials and after visual inspection of the quality of the waveforms. Weighted averages were then calculated from the selected sessions. SHRs had a combined weighted (n = 18) and non-weighted (n = 3) average of 91 short- and 93 long-ITI accepted trials (minimum 55 and 62 long- and short-ITI, respectively) and WKYs had a combined weighted (n = 14) and non-weighted (n = 10) average of 136 for both short- and long-ITI accepted trials (minimum 95 and 94 long and short ITI, respectively).
2.4. EEG Processing and ERP Analyses
A custom MATLAB script was used to generate ERPs. The EEG was separated into epochs consisting of 200 ms before to 2000 ms post tone train onset, with the 200-ms prestimulus baseline mean subtracted from each point in the epoch. Epochs with voltage peaks exceeding ±100 μVs were excluded from further analyses, while remaining epochs were averaged separately for each genotype (KO, WT, SHR, and WKY) and ITI (1 s and 5 s). ERP peaks were identified based on visual inspection of the grand average ERP waveform for the 5-s ITI across control lines (based on the assumption that the responses would be largest to the first tone in this condition), as well as from previous conventions in rodents and humans (e.g., [38,39]). The following ERP peaks were defined: the most positive point 0–100 ms for P1, most negative point 50–150 ms for N1, most positive point 100–300 ms for P2, and most negative point 200–350 ms for N2. The latency range used was wider than previous conventions to better capture each ERP peak across rats as peaks were more delayed in response to the tone trains than what we observed for tone pairs [58].
Prior to analyses, individual subjects judged to have a poor signal quality based on visual inspection, an insufficient number of usable trials (≤60), or the presence of significant outliers (i.e., ±3 SD) across several ERP components and measures were removed. This resulted in the exclusion of 3 KOs (2 males, 1 female), 4 WTs (4 females), 5 SHRs (3 males, 2 females), and 4 WKYs (2 males, 2 females), leaving 19 KO rats (9 males, 10 females), 20 WT rats (10 females, 10 males), 16 SHRs (7 females, 9 males), and 20 WKY rats (10 females, 10 males). Due to the high number of variables a select number of outliers that appeared in 1-2 measures were retained and adjusted using 2 SD imputation with matched between-subject variables (i.e., genotype/strain and sex). This was done to maximize power by limiting the removal of rats due to outliers from random error in the later tones (e.g., tones 3-5) given the large number of variables.
Peak amplitudes and latencies were analyzed for P1, N1, P2, and N2. Special interest was given to the P1 and N1 peaks, since it is unclear which component is homologous to the human N1 [49], and these components have been observed to most reflect physiological changes in response to a similar tone-pair paradigm [58]. Peak amplitudes and latencies were analyzed using separate 2 (genotype or strain) x 2 (Sex: Male/Female) x 2 (ITI: 1 s/5 s) x 5 (tone: 1-5) mixed GLM ANOVAs for KO and SHRs, respectively, and their respective control lines (i.e., WTs and WKYs). In addition, peak-to-peak amplitudes were analyzed as the latter provides an alternative measure of peak amplitude that is not confounded by residual noise or artifacts contained in the pre-stimulus baseline [33]. Peak-to-peak measures were calculated by subtracting the first peak amplitude (e.g., P1) from the second, adjacent peak (e.g., N1) and recording the absolute value. This generated three peak-to-peak measures: P1-N1, N1-P2, and P2-N2. Significant or approaching omnibus findings (p ≤ .05) were followed up using simple pairwise comparisons with Bonferroni adjustments to determine the nature of the significant interactions across conditions. A Greenhouse-Geisser correction was used for omnibus findings when appropriate to account for violations of sphericity. Given no clear sex differences emerged and for brevity, we have opted to limit the reported results to peak amplitudes and latencies collapsed across sex [see Appendix A for significant peak-to-peak and sex statistical findings, and supplementary materials of inferential statistics for Lphn3 KO versus WT (Supplementary Tables S1–S7) and SHRs versus WKYs (Supplementary Tables S8–S14)].
3. Results
3.1. Lphn3 KO Rat
Grand average waveforms for KOs and WTs are shown in Figure 1. Separate waveforms are presented for each genotype and ITI collapsed across sex. The waveform demonstrated the anticipated pattern of a larger response to the initial tones of the trains, with this response being most prominent following the longer ITI. This pattern resembled those found when using a similar tone pair paradigm in awake Wistar rats [58], as well as what has been previously demonstrated in humans using this paradigm [e.g., 48, 59, 60]. However, the P2 and the N2 were notably not as robust, with both being almost absent following the shorter ITI.
3.1.1. Peak Amplitudes and Latencies KO versus WT
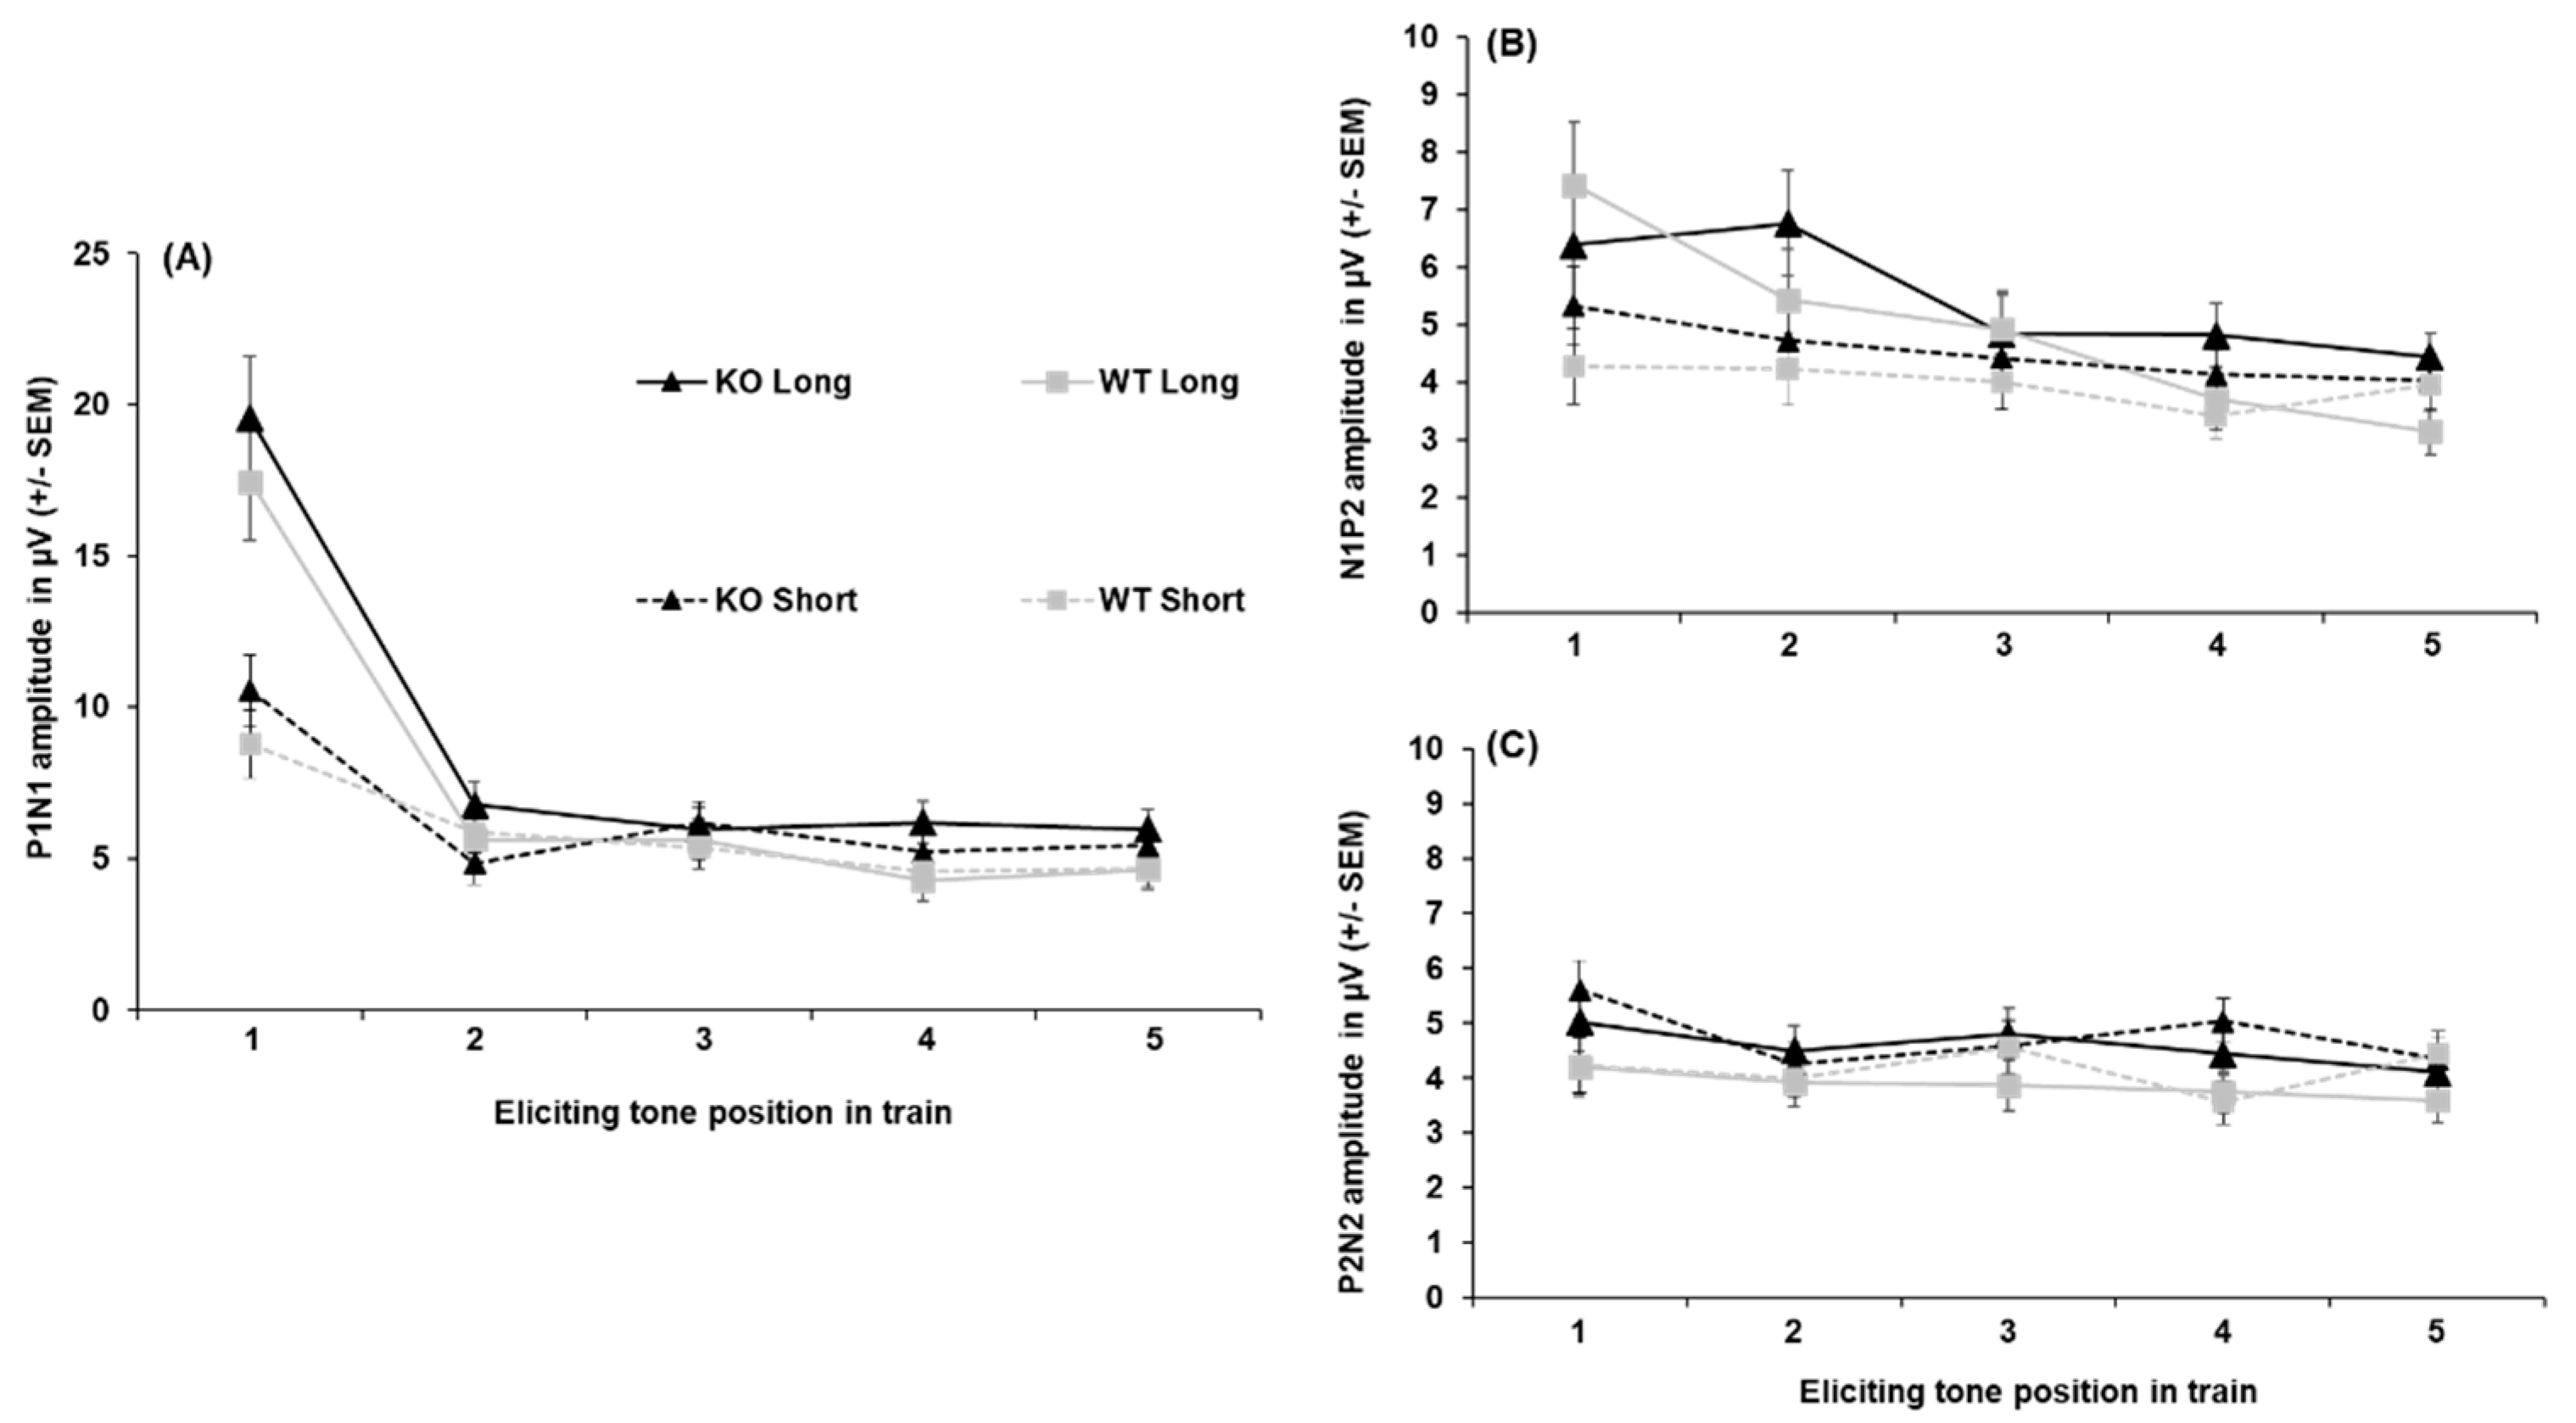
All peak amplitude and latency inferential statics for KOs and WTs are provided in Supplementary Tables S1–S7. Peak amplitudes for each ERP component collapsed across sex are depicted in Figure 2. The P1 amplitude (shown in Figure 2-A) was substantially greater following the first tone than the second tone [main effect of tone, F(2.64, 92.25) = 35.48, p < .001, = 0.198). The P1 was larger to the first tone following the 5-s ITI than the 1-s ITI (3.10 µV difference), as well as for the second tone (2.14 µV difference; ITI x Tone, F(3.069, 107.405) = 18.372, p < .001, = 0.344). No effects of genotype on P1 peak amplitude were found. For peak latency, the P1 peaked earlier following the 5-s (52. 48 ± 2.35 ms) than the 1-s ITI (60.73 ± 2.68 ms; ITI, F(1, 35) = 14.956, p <.001, = 0.299), but no significant effects of genotype were seen.
N1 amplitudes are shown in Figure 2-B. Like the P1, the N1 was largest to the first tone followed by a significant decrease across subsequent tones in the train, with this being more prominent following the longer ITI. The N1 was greater to the first tone when followed by the 5-s ITI (-11.87 ± 1.06 µV) than the 1-s ITI (-5.43 ± 0.66 µV), with this effect persisting to the second tone in the train (-2.98 µV difference; ITI x Tone, F (1.976, 69.165) = 26.924, p < .001, = 0.435). However, no genotype differences were seen in N1 peak amplitude. Analysis of N1 peak latency revealed a significant Sex x Tone interaction (Supplemental Table S2), but no effects of genotype or ITI emerged.
P2 amplitudes (see Figure 2-C) to the initial tone were less robust than for N1 amplitudes and did not return to baseline (refer to Figure 2-B), which resulted in negative values to the first and second tone. The P2 was larger to the first tone following the 5-s ITI than the 1-s ITI in both KOs (-4.66 ± 1.08 µV vs. -0.82 ± 0.76 µV) and WTs (-2.70 ± 1.05 µV vs. -0.42 ± 0.73 µV), with this effect persisting to the second tone only in the WTs (-1.53 µV difference). In addition, the P2 significantly decreased from the first to second tone only after the 5-s ITI in KOs (3.09 µV difference) and not the WTs [Genotype x ITI x Tone, F(2.486, 87.013) = 3.919, p < 0.016, = 0.101]. The P2 generally peaked earlier following the 1-s ITI (182.90 ± 9.09 ms) than the 5-s ITI (200.99 ± 8.01 ms; main effect of ITI, F(1, 35) = 10.958, p = .002, = 0.283). It also peaked earliest to the first tone of the train (175.44 ± 9.30 ms), which was significantly earlier than the second tone (35.10 ms difference; main effect of tone, F(1, 35) = 3.635, p = .008, = 0.094), No genotype-related differences were seen in P2 latency.
Like the P1 and N1, N2 amplitudes (shown in Figure 3-D) were larger to the first and second tone following the 5-s ITI (-8.79 ± 1.04 µV and -5.351 ± 0.59 µV) than the 1-s ITI (-5.79 ± 0.56 µV and -3.89 ± 0.43 µV) followed by a decrease in amplitude across subsequent tones, particularly after the 5-s ITI [ITI x Tone, F(2.464, 86.234) = 14.131, p < .001, = 0.288]. In addition, when collapsed across ITIs, the N2 significantly decreased from the first to second tone in KOs (-3.46 µV difference; Genotype x Tone, F(1.590, 55.662) = 3.538, p = .046, = 0.092), while this reduction was absent in WTs. However, the difference between KOs and WTs in N2 amplitude to the first tone did not reach the criterion for significance (p = .054). For N2 peak latency, while a significant main effect of tone was found [F(4, 140) = 3.411, p = .011, = 0.092], no differences between tones in the train were detected following pairwise comparisons (p > .05). Likewise, No genotype differences nor other notable effects emerged for N2 peak latency.
3.2. Spontaneously Hypertensive Rat
Grand average waveforms for the SHRs and WKYs, for each strain and ITI, are shown in Figure 3. The waveform for the WKY controls demonstrated a similar pattern as that for the KOs and WTs, with a clear P1 and N1 and less robust P2 and N2. Notably, however, the P1 and N1 were substantially attenuated in the SHRs, with these rats also having a more pronounced N2.
3.2.1. Peak Amplitudes and Latencies SHR versus WKY
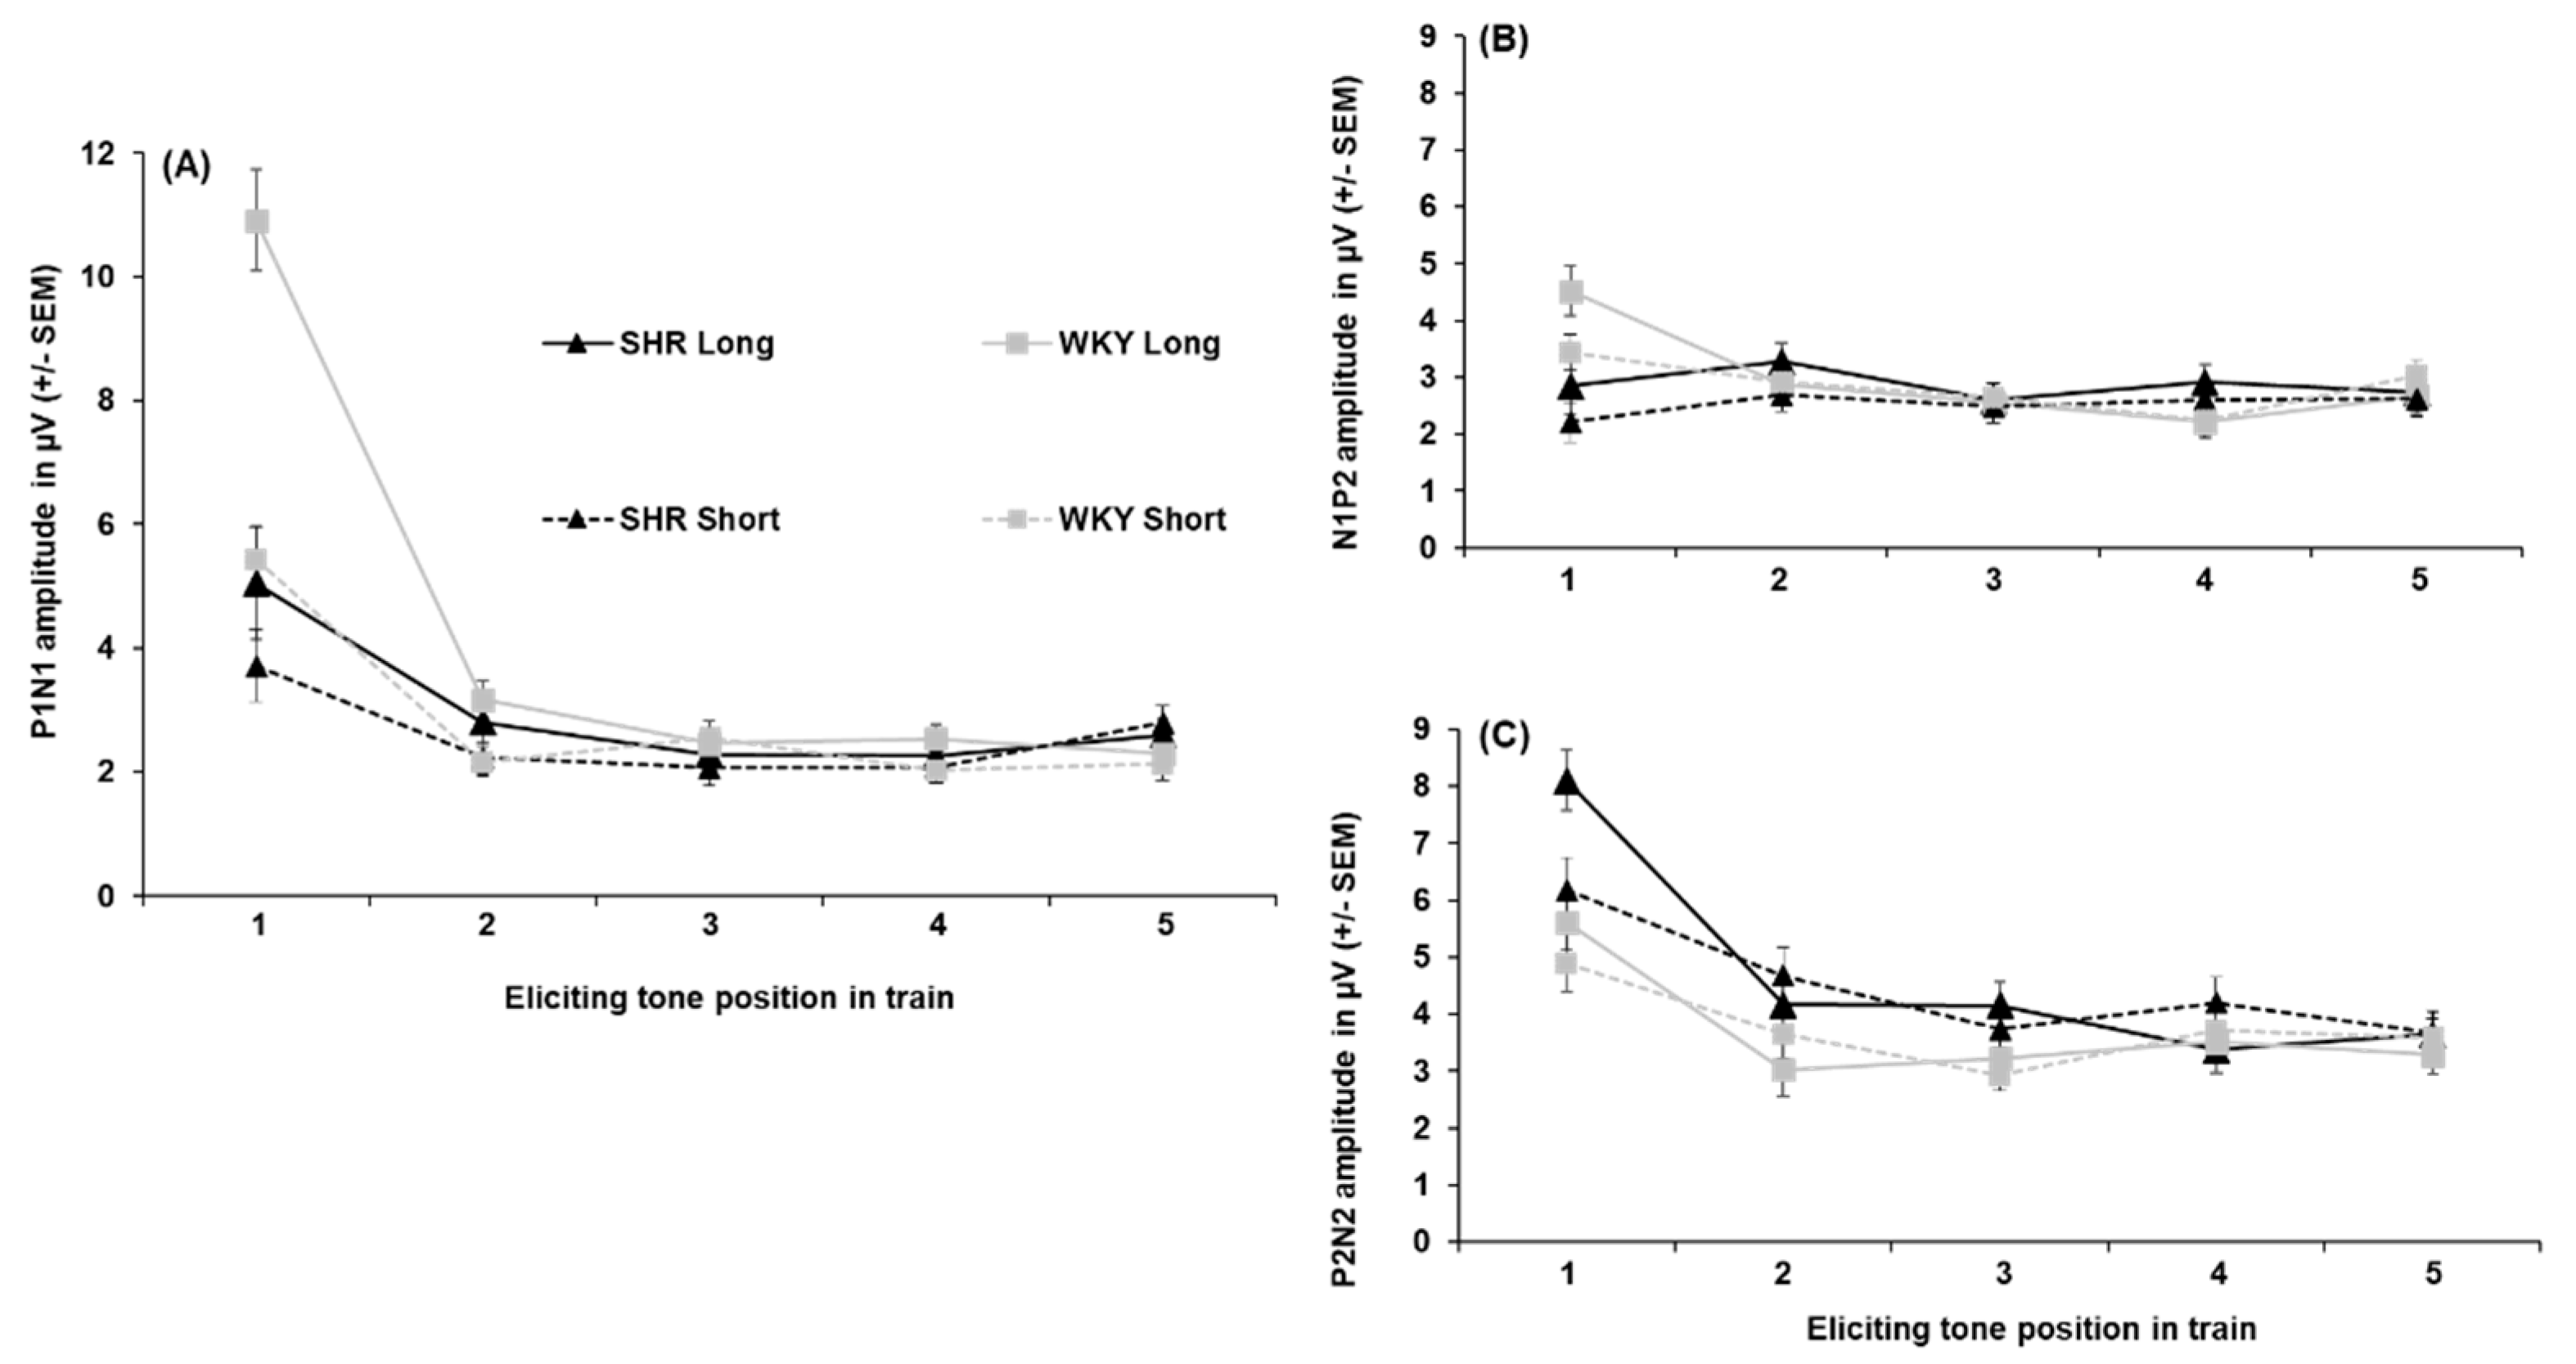
All peak amplitude and latency inferential statics for SHRs and WKYs are provided in Supplementary Tables S8–S14. Peak amplitudes for each individual ERP component collapsed across sex are depicted in Figure 4. P1 amplitudes are shown in Figure 4-A. The P1 to the first tone in the train was significantly smaller in the SHRs than in the WKYs, with this reduction being prominent following the 5-s ITI (4.57 µV difference; Strain x ITI x Tone, F(2.824, 90.382) = 2.996, p = .038, = 0.086). For peak latency, the P1 peaked earliest to the first tone of the train (50.56 ± 2.89 ms) relative to the second (17.19 ms difference) and third (11.66 ms difference; main effect of Tone, F(4, 128) = 5.365, p < .001, = 0.144), but no difference in strain was detected.
N1 amplitudes are shown in Figure 4-B The N1 was larger to the first tone following the 5-s ITI (-4.20 ± 0.61 µV) than 1-s ITI (-1.94 ± 0.41 µV) in the WKYs, while this difference was absent in SHRs (-0.05 µV difference; Strain x ITI x Tone interaction, F(3.052, 97.670) = 3.591, p = .016, = 0.101)). In addition, the N1 was larger to the fifth tone following the 1-s ITI in the SHRs than WKYs (-2.91 ± 0.56 µV vs. -1.94 ± 0.42, respectively). Regarding peak latency, the N1 peaked significantly later to the first tone (116.20 ± 4.58 ms) than to the third (84.27 ± 5.95 ms), fourth (89.43 ± 4.49 ms), or fifth tone (88.71 ± 4.10 ms), but not the second tone (94.38 ± 5.95 ms; main effect of Tone, F(4, 128) = 9.856, p < .001, = 0.235). Further, the N1 peaked earlier in the WKYs (87.19 ± 4.07 ms) than the SHRs (101.99 ± 4.55 ms; main effect of Strain, F(1, 32) = 5.868, p = .021, = 0.155).
P2 amplitudes are shown in Figure 4-C. The P2 was not as robust as the prior N1 peak for both WKYs and SHRs (refer to Figure 4-B), This appears to be due to the temporal overlap of the N1 and P2 components (i.e., larger N1 following the first tone and signal regression to the mean), which appeared to be driven predominantly by females across strains (refer to Appendix A, Section 2.2). No effects of strain were detected on P2 amplitude. For P2 latency, it peaked earlier to the first tone (129.61 ± 4.13 ms) than to any subsequent tones in the train (main effect of tone, F(3.115, 99.669) = 7.005, p < .001, = 0.180). No other effects were found for P2 peak latency.
N2 amplitudes are shown in Figure 4-D. The N2 was greater to the first tone when followed by the 5-s ITI (-6.73 ± 0.48 µV) than the 1-s ITI (-5.16 ± 0.33 µV), and attenuated across subsequent tones (ITI x Tone, F(2.252, 72.076) = 7.710, p < .001, = 0.194). Notably, the N2 was larger in the SHRs than the WKYs for the first (-3.19 µV difference), second (-2.03 µV difference), third (-2.11 µV difference), and fifth tone (-1.69 µV difference; Strain x Tone, F(2.694, 86.195) = 4.551, p = .006, = 0.127). The N2 peak latency to the first tone occurred earlier when preceded by the 5-s ITI (255.70. ± 6.21 ms) than the 1-s ITI (281.61 ± 8.2 ms; ITI x Tone, F(3.440, 110.073) = 2.689, p = .034, = 0.078), but no significant effect of strain was detected.
4. Discussion
The overall ERP waveform demonstrated the anticipated pattern. Excluding the SHRs, the first tone of the tone train following the 5-s ITI elicited a robust P1-N1 complex, followed by attenuation of responses to the subsequent tones across both KO, WT (see Figure 2), and WKY rats (see Figure 4). Several processes may explain this: (1) the greater salience of the first tone of the train following the longer ITI elicited greater neural activation of perceptual and attentional networks, (2) latent inhibition from frontal inhibitory networks reduced subsequent responses in the train [60], or (3) a combination of these two processes. Notably, this pattern was similar to what has been observed in human controls using this paradigm [48,59], which suggests that the neurophysiological mechanisms are being activated in a similar manner in both humans and rats.
Additionally, differential effects were seen across these two rat models. While no meaningful effect of genotype was observed for any of the assessed ERPs between Lphn3 KOs and their WT controls, SHRs had a very clear attenuation of P1 (see Figure 2) and P1-N1 (see Figure A2) relative to WKYs (Figure 4). Further, the N2 was more pronounced in SHRs than WKY rats. While source localization could not be delineated given the use of a single channel, this suggests that inputs from more cortical areas increase as the signal propagates from subcortical to cortical areas, which may function as a compensatory mechanism in SHRs. Together, these differences in ERP peaks suggest that SHRs exhibit deficits in automatic attention, whereas Lphn3 KOs do not. This likely reflects differences in the underlying neurobiology of the attentional networks in these two rat models.
4.1. SHRs and the Locus Coeruleus
Attention encompasses a range of neural networks that engage both sensory and cognitive processes. One theory proposed by Posner and Petersen ([61]; also see [62]), divides attention into three relatively distinct networks: (1) alerting (acquiring and maintaining a level of tonic arousal needed for sustaining vigilance), (2) orientating (prioritizing and directing attention to sensory stimuli), and (3) executive functioning/focal attention (e.g., top-down control of sensory stimuli). Within this framework, attentional issues in ADHD have been suggested to result from dysfunction in both executive and alerting networks [63]. Automatic attention is under the influence of both frontal cortical (executive) and subcortical (alerting) networks, with the former functioning to inhibit irrelevant stimuli and the latter sustaining optimal arousal/alertness to detect salience and changes in the environment [64].
It has been suggested that N1 attenuation to repeated stimuli in humans is a consequence of top-down, inhibitory mechanisms exerting habituating effects on increasingly irrelevant sensory stimuli [60]. This is supported by reduced N1 attenuation in older adults, given decreased activity in these frontal inhibitory networks occurs with aging [59]. However, the reduced amplitude of the P1/P1-N1 in SHRs was primarily driven by a substantial attenuation to the first tone of the tone-train, particularly after the 5-s ITI. This suggests inefficiencies in bottom-up, subcortical arousal networks, rather than in frontal, top-down inhibitory networks account for this reduction in N1 amplitude, a pattern similar to what was observed in young adults with ADHD using a similar version of this paradigm [48].
Halperin and Schulz [65] proposed that ADHD is a condition reflecting dysfunction of relatively developmentally static subcortical structures, with the maturation of the prefrontal cortex and white matter tracts leading to reductions in ADHD symptoms with age [4]. This proposal implicates several systems and regions, including possibly the basal ganglia/midbrain dopamine (DA) system, hindbrain norepinephrine (NE) system, and the cerebellum [65]. Of these, the NE system originating from the locus coeruleus (LC) is a likely candidate underlying the attenuation of the P1 and P1-N1 complex in the SHRs. The LC, as well as sub-coeruleus α1 and α2 brain stem nuclei, serve as the primary neural substrates of NE [66,67]. Although the LC-NE system has been implicated across an array of cognitive processes (for reviews, [64,68,69,70,71]), one function it serves is the maintenance of an organism’s level of arousal (i.e., ability to receive information) and activation (i.e., ability to react to information) to effectively respond to a given stimulus [72]. This occurs through two broad processes: (1) longer, slower tonic shifts that function to adjust or maintain a level of arousal best suited for responding to a particular context, such as during sleep versus scanning for threats [66], and (2) shorter, faster phasic firing in response to a stimulus, particularly task- or goal-related stimuli [72], with salient stimuli eliciting a more pronounced phasic response [73]. For most individuals, tonic firing can efficiently adjust to address the need for focused or flexible attention, while these dynamic shifts may be impaired in those with ADHD or ADHD symptoms [74].
Aboitiz et al. [75] proposed that an imbalance in tonic catecholaminergic signaling, particularly DA and NE, leads the attentional network in those with ADHD to be less effective at adjusting to meet environmental demands. Specifically, dysfunctions in these tonic shifts are believed to contribute to dysregulated phasic activation, with supra-optimal tonic levels leading to a poorer “signal-noise ratio” for salient information and bursts of impulsive responding, and super-optimal levels leading to oversensitive phasic threshold activation and distractibility. This proposal aligns with the cognitive-energetic model of ADHD, which views ADHD as stemming from a deficit of response readiness and inhibition due to impairments in these energetic pools from bottom-up subcortical areas [76,77] (also see [78], for an introduction to the cognitive-energetic model).
SHRs have higher concentrations of NE in both the prefrontal cortex and LC [79,80], as well as hypernoradrenergic and hypodopaminergic activity in the prefrontal cortex (PFC) compared with controls [80]. Additionally, unlike Wistar rats, functional α1 adrenergic receptors involved in increasing the release of NE remain active in the LC neurons of SHRs throughout development, which may weaken α2 signaling and impair LC function [81]. These findings jointly suggest that SHRs possess an imbalance in DA and NE similar to that seen in some individuals with ADHD. This implies SHRs have inefficient tonic and phasic LC activation, a notion supported by evidence that sensory gating of auditory ERPs is selectively influenced by arousal in frontal and parietal areas in the rat brain [82], with high [83] and low tonic levels contributing to attenuation of these ERPs [84]. In addition, the increased N2 in SHRs may reflect a compensatory mechanism in cortical activation to compensate for this reduced bottom-up input due to this imbalance in LC signaling, but this requires further investigation.
4.2. Lphn3 KOs and Dopamine Dysfunction
Lphn3 KO rats had similar ERP peaks as their WT counterparts (Figure 1). This appears to reflect the preservation of automatic attention and possibly the alerting attentional network in this model, unlike in the SHRs. Subsequently, this null finding in the context of the noted deficits in other ADHD-relevant behaviors [27,28,29,30,31] suggests relevant differences in neurobiology between these two ADHD animal models.
LPHN3 is expressed predominantly in the brain [85,86], with the highest levels found in the PFC, caudate nucleus, amygdala, and cerebellum [11]. It is believed to play a role in synaptogenesis and synaptic connectivity [87,88,89], and its expression decreases throughout development [11]. Lphn3 KO rats had no differences in the levels of DA, NE, serotonin, or other major metabolites in the striatum, hippocampus, or PFC, compared with WT rats. However, tyrosine hydroxylase (TH) and aromatic L-amino acid decarboxylase were elevated. This was understood to indicate a higher availability of DA and/or NE in the striatum [28]. Additionally, KOs had increased striatal DA transporter (DAT) density [28], as well as saturated phasic DA neurotransmission in the neostriatum (caudate-putamen; [90]) relative to WTs, which was suggested to partially account for the downregulation of D1 receptors [28]. More recently, Sable et al. [91] reported somewhat discrepant findings with KOs having reduced sum phasic DA release and DAT in the nucleus accumbens (NAcc) core and medial prefrontal cortex (mPFC). However, while these differences may be related to methodology, it is also possible that the null expression of Lphn3 produced differential changes in two separate pathways. Specifically, it is possible Lphn3 KO rats possess hyperdopaminergic signaling in the dorsal stream related to stimulus-response [90] and hypodopaminergic signaling in the NAcc-mPFC ventral stream associated with motivation and goal-directed behavior [91].
These alterations in DA signaling pathways provide support for the behavioral phenotypes of KO rats. Specifically, increased transient DA release in the neostriatum may contribute to KO rats hyperactive behavior, while phasic decreases of DA in the NAcc [91] may underlie their deficit in impulsive action relative to WTs [30,31]. Similarly, it is likely that differences in mesocorticolimbic pathways between Lphn3 KO and SHRs can explain the present null ERP findings between KO and WT rats relative to profound differences seen for SHRs. For instance, lower NAcc to mPFC DA ratio in SHRs relative to WKYs imply SHRs have more pronounced deficits in coherence between mesolimbic and mesocortical pathways than KOs when compared with their WT counterpart [91]. These differences are further reflected by the presence of inefficiencies in impulsive choice in SHRs but not KOs [29]. Although it is currently uncertain whether DA/NE imbalance is present or at least functionally similar in Lphn3 KOs relative to SHRs, these differences in DA signaling and the present findings appear to implicate differences in the mesocorticolimbic pathways between these models. We suggest that tonic catecholaminergic signaling, at least in the alerting network, are likely relatively spared in Lphn3 KOs versus SHRs.
4.3. Considerations and Limits
Although the present findings are promising, some factors merit consideration when interpreting them. First, it is worth underscoring that the Lphn3 KO rat reflects the null expression of Lphn3; therefore, it does not provide a direct model of risk variants of Lphn3 associated in humans with ADHD [11]. However, the Lphn3 KO rat still provides insights into relevant neurobiological systems that may be implicated (or, in the case of our findings, not implicated) in those with risk variants of the gene that could not be explored otherwise.
Second, although the SHR is a well-validated and supported animal model for examining ADHD-relevant phenotypes, it has limitations. One concern is that SHRs are foremost a model of hypertension. Hypertension typically emerges in SHRs as early as 10 weeks [52] and remains stable at 7 months [92]. This can be problematic for auditory studies, given that hypertension can exacerbate age-related hearing loss [93,94], with changes occurring as early as 3 months [92]. This raises validity concerns, as the reductions in auditory ERPs observed in the SHRs could be argued to reflect reduced inputs from the auditory cortex due to cumulative cochlear damage [94]. Although we did not directly assess hearing loss, the likelihood the results simply reflect a loss of hearing is unlikely given several factors. First, researchers have found that the rat dorsal-recorded ERPs receive contributions from both medial and subcortical structures and are not entirely dependent on the auditory cortex [95]. Second, the intensity of the tones used in the experiment was great enough to likely compensate for any loss of hearing based on reported auditory thresholds in this model [92]. Finally, the results are based on the interactions among ERP amplitudes, not on simple main effects between the groups. These considerations help affirm that our findings represent true neurobiological effects that are not confounded by hearing loss. Even so, it is important to remain mindful of and guard against the potential untoward effects of hypertension when investigating this model.
Third, given the hyperactive nature of the SHRs, adjustments had to be made to ensure an adequate number of trials were obtained to generate reliable ERPs. Our decision to use weighted averaging may have contributed to some artificial reduction of the waveform due to regression to the mean. However, weighted averages were also used to generate ERPs for the majority of WKYs. In addition, the attenuation of the P1 and P1-N1 in SHRs was so pronounced that it seems unlikely that it simply reflects an artifact from post-processing. While the use of anesthetized versus awake rats may have addressed the issue of movement artifacts, low levels of anesthesia can have a profound effect on auditory-evoked activity from the cortex and lower brain areas [95], with general anesthesia producing a substantial decrease in these ERPs [58]. In the future, SHRs may benefit from extended time to habituate to the testing chamber, as we observed reduced locomotor activity and a greater number of accepted trials for subsequent recordings.
Last, it should be noted we used a less typical, semi-invasive EEG acquisition method, with subdermal needle electrodes. A more invasive method, such as epidural screw electrodes, could have provided an improved signal quality relative to the subdermal needle electrodes used. However, our prior work with these subdermal needle electrodes demonstrated that they can be used to acquire valid auditory ERP peaks from awake rats [58]. This less invasive method is important as it strikes a balance between minimizing harm to the rat and producing reliable data, in accordance with the “Three R’s” of animal research [96].
5. Conclusions
The purpose of this study was to assess whether two animal models of ADHD, the Lphn3 KO rat and SHR, demonstrate deficits in automatic attention as indexed by alterations in auditory ERPs, particularly the P1 and N1. SHRs had significantly reduced P1s and P1-N1 complexes relative to WKYs in response to tone trains, indicating deficits in automatic attention. The attenuation of the ERPs was driven primarily by the reduced P1/P1-N1 to the first tone of the train, especially following a longer interval, which suggests that this reduction is driven by inadequate amplification of subcortical inputs that comprise the alerting network rather than insufficient top-down inhibition. This finding was similar to what was found in young adults with ADHD [48], implicating similar alterations in DA/NE imbalance in both SHRs and those with ADHD. In contrast, we found no evidence of inefficiencies in automatic attention in Lphn3 KO rats, with KOs demonstrating similar P1 and N1 peaks relative to WTs. This suggests the preservation of subcortical inputs involved in the alerting network and possibly less disrupted tonic DA and NE signaling in Lphn3 KO rats than in SHRs. Overall, our findings suggest Lphn3 does not contribute to deficits in automatic attention and provide further evidence to the important distinctions in the mesocorticolimbic pathways between SHRs and Lphn3 KOs.
In the context of the existing behavioral profile of SHRs, the present findings suggest that this rat model can be understood as reflecting the extreme of the continuum of ADHD-relevant phenotypes. In short, the SHRs can be viewed as the animal model equivalent of humans with more severe ADHD presentations [7,8] or a combined ADHD presentation based on DSM categorization. Meanwhile, the Lphn3 KO model falls on the lesser extreme of the functional continuum, reflecting a more impulsive presentation as reflected by the ADHD-relevant phenotypes of hyperactivity [28] and selective aspects of impulsivity [29,31], with preserved automatic attention. Future studies should assess other dimensions of attention (e.g., sustained attention) to fully characterize this genetic rat model.
Supplementary Materials
The following supporting information can be downloaded at the website of this paper posted on Preprints.org. Summary tables for all inferential statistics comparing Lphn3 KO to WT are presented in Supplementary Tables S1–S7. Summary tables for all inferential statistics comparing SHRs to WKYs are presented in Supplementary Tables S8–S14.
Author Contributions
Conceptualization, Logan Brewer, Jeffrey Sable, and Helen Sable; methodology, Logan Brewer, Jeffrey Sable, Michael Williams, Charles Vorhees, and Helen Sable.; software, Jeffrey Sable; validation, Jeffrey Sable., Logan Brewer, and Frank Andrasik.; formal analysis, Logan Brewer; investigation, Jankiben Patel, Logan Brewer, Jeffrey Sable, and Helen Sable; resources, Frank Andrasik, Michael Williams, Charles Vorhees, and Helen Sable; data curation, Jankiben Patel and Logan Brewer.; writing—original draft preparation, Logan Brewer.; writing—review and editing, Logan Brewer, Jeffrey Sable, Helen Sable, Frank Andrasik, Michael Williams, and Charles Vorhees.; visualization, Logan Brewer.; supervision, Helen Sable, Jeffrey Sable, & Frank Andrasik.; funding acquisition, Helen Sable, Frank Andrasik, Michael Williams, and Charles Vorhees. All authors have read and agreed to the published version of the manuscript.
Funding
This research was funded by the National Institute of Environmental Health Sciences, grant number R01ES032270.
Animal Care and Use Statement
All procedures were approved by Institutional Animal Care and Use Committee (IACUC) at the University of Memphis (protocol #0816) and conducted in accordance with the Public Health Service Policy on Humane Care and Use of Laboratory Animals [56].
Data Availability Statement
The data sets generated during and/or analyzed during the current study are available from the corresponding author on reasonable request.
Acknowledgments
Appreciation is extended to Donny Ray for assistance with lab animal care and Dr. Timothy Mandrell for his veterinary support.
Conflicts of Interest
The authors declare no conflicts of interest.
Abbreviations
The following abbreviations are used in this manuscript:
| Adgrl3 | Adhesion G protein-coupled receptor L3 |
| ADHD | Attention-deficit hyperactivity disorder |
| DA | Dopamine |
| DAT | Dopamine transporter |
| EEG | Electroencephalography/electroencephalogram |
| ERP | Event-related potential |
| ITI | Inter-train interval |
| KO | Knockout |
| LC | Locus coeruleus |
| LLAEP | Long latency auditory evoked potential |
| Lphn3 | Latrophilin-3 |
| mPFC | Medial prefrontal cortex |
| NAcc | Nucleus accumbens |
| NE | Norepinephrine |
| WT | Wildtype |
| RDoC | Research Domain Criteria |
| SHR | Spontaneously hypertensive rat |
| WKY | Wistar-Kyoto |
Appendix A
Appendix A.1. Lphn3 Knockout Rats - Peak-to-Peak Amplitudes
Peak-to-peak amplitudes for each ERP complex collapsed across sex are depicted in Figure A1. The P1-N1 peak-to-peak (shown in Figure A1-A) demonstrated the anticipated pattern of a larger response to the first tone when preceded by the 5-s ITI (18.50 ± 1.42 µV) than the 1-s ITI (9.66 ± 0.81 µV) followed by a decrease in amplitude across tones. A larger P1-N1 was also seen to the second tone following the 5-s ITI than the 1-s ITI (p = .045) but this difference was less pronounced (0.84 µV difference; ITI x tone, F(2.419, 84.649) = 64.191, p < .001, = 0.647). Although a significant interaction of genotype was found (Genotype x ITI, F(1, 35) = 4.410, p = .043, = .112), pairwise comparisons did not reveal a significant difference in the P1-N1 between KOs and WTs (p > .05). Rather, this effect was driven by the previously robust effect of ITI across both the KO and WT rats previously described (p < .001). No significant interactions for genotype or sex were detected.
N1-P2 peak-to-peak amplitudes (shown in Figure A1-B) demonstrated similarities to the P1-N1, wherein amplitude to the first and second tone was larger after the 5s ITI (6.92 ± 0.78 µV and 6.10 ± 0.64 µV) than the 1-s ITI (4.81 ± 0.48 µV and 4.49 ± 0.46 µV) followed by a gradual reduction across tones. A significant reduction from the first to the third tone only following the longer ITI (2.03 µV difference; ITI x tone, F(2.876, 94.914) = 5.676, p = .001, = 0.147). Again, no significant effects emerged for genotype or sex.
As shown in Figure A1-C, no significant omnibus effects were found for the P2-N2 peak-to-peak amplitudes. The failure to find significant differences in the P2-N2 may have been the result of the pronounced N1 contributing to a reduced P2 in conjunction with a subsequently attenuated N2 peak decreasing any substantial variation in this response (refer back to Figure 1 in the main text). All peak-to-peak inferential statistics for KOs and WTs are summarized in Supplementary Tables S5–S7.
Figure A1.
Peak-to-peak P1-N1 (A), N1-P2 (B), and P2-N2 (c) amplitudes in both Lphn3 KOs and WT controls not separated by sex. Black lines represent the KOs, while gray lines represent the WTs. Solid lines show the 5-s ITI, and the dashed lines show the 1-s ITI. Error bars represent standard errors of the means (SEM).
Appendix A.2. Lphn3 Knockout Rats – Effect of Sex on Peak Amplitude and Latency
An overall reduced P1 was seen in WT males than females (2.01 ± 0.56 µV vs. 3.27 ± 0.62 µV; Genotype x Sex interaction, F(1, 35) = 5.112, p = .030, = 0.127). However, this effect did not hold up to pairwise comparisons (p = .068), and no other group differences were observed. It also generally peaked earlier in males (51.83 ± 3.28 ms) than females (61.37 ± 3.17 ms; main effect of sex, F(1, 35) = 4.369, p = .044, = 0.111). The N1 peak was significantly earlier to the first tone in males (114.98 ± 4.75 ms) than females (129.78 ± 4.60 ms; Sex x Tone, F (4, 140) = 2.767, p = .030, = 0.073, but no effect of sex was detected for N1 peak latency. Similarly, while the P2 peaked earlier in females (172.73 ± 11.29 ms) than males (211.17 ± 11.67 ms; main effect of sex, F(1, 35) = 5.607, p = .024, = 0.138), no effect of sex was seen on the amplitude of the P2. Lastly, larger N2s were generally observed in KO females than WT females (-5.58 ± 0.69 µV vs. -3.04 ± 0.76 µV; Genotype x Sex, F(1, 35) = 4.552, p = .040, = 0.115. No effects of sex were observed for the peak latency of the N2.
Appendix A.3. Spontaneously Hypertensive Rat - Peak-to-Peak Amplitudes
Peak-to-peak amplitudes for each ERP complex collapsed across sex are depicted in Figure A2. The P1-N1 peak-to-peak amplitudes are shown in Figure A2-A. The P1-N1 to the first tone was significantly reduced in the SHRs compared to the WKYs following both the 5-s ITI (5.05 ± 0.92 µV vs. 10.91 ± 0.82 µV, respectively) and 1-s ITI (5.05 ± 0.92 µV vs. 10.91 ± 0.82 µV; Strain x ITI x Tone, F(2.620, 83.829) = 13.067, p < .001, = 0.290). Regarding sex, the P1-N1 to the first tone was larger in males than females following the 5-s ITI (9.52 ± 0.87 µV vs. 6.45 ± 0.87 µV, respectively), with no significant difference seen following the 1-s ITI (4.96 ± 0.55 µV vs. 4.18 ± 0.55 µV, respectively; Sex x ITI x Tone, F(2.620, 83.829) = 4.781, p = .006, = 0.130). No significant interactions were detected for strain or sex.
N1-P2 peak-to-peak amplitudes are shown in Figure A2-B. Similarly to the P1-N1, The N1-P2 was larger to the first tone following the 5-s ITI (3.68 ± 0.33 µV) than the 1-s ITI (2.82 ± 0.23 µV; ITI x tone, F(3.371, 107.882) = 2.927, p = .032, = .084. Regarding strain, the N1-P2 was larger to the first tone in the WKYs compared to SHRs (3.973 ± 0.35 µV vs. 2.53 ± 0.39 µV, respectively). Further, a reduction in N1-P2 was observed to the third (1.38 µV difference) and fourth tone (1.75 µV difference) in the WKYs, while this was absent in the SHRs; Strain x Tone, F(2.375, 75.993) = 5.587, p = .003, = 0.149. No significant effect was observed for sex.
P2-N2 peak-to-peak amplitudes are shown in Figure A2-C. The P2-N2 also demonstrated the expected pattern of the larger response to the first tone following the 5-s ITI (6.86 ± 0.36 µV) than the 1-s ITI (5.54 ± 0.38 µV; ITI x tone, F(4, 128) = 5.988, p < .001, = 0.158. The P2-N2 to the first tone was larger in the SHRs (7.14 ± 0.47 µV) than the WKYs (5.26 ± 0.42 µV), as well to the third tone (3.95 ± 0.28 µV vs. 3.34 ± 0.40 µV, respectively; Strain x Tone, F(4, 128) = 3.601, p = .008, = 0.101). Further, despite the notable difference in P2-N2 amplitude in SHRs to the first tone following the 5-s ITI relative to the 1-s ITI (1.92 µV difference, see Figure A2-C), no significant interaction was detected; Strain x ITI x Tone, F(4, 128) = 1.064, p = .377, = 0.032. No differences were detected with respect to sex. All peak-to-peak inferential statistics for SHRs and WKYs are summarized in Supplemental Tables S12–S14.
Figure A2.
Peak-to-peak P1-N1 (A), N1-P2 (B), and P2-N2 (c) amplitudes in both SHRs and WKYs controls not separated by sex. Black lines represent the KOs, while gray lines represent the WT controls. Solid lines show the 5-s ITI, and the dashed lines show the 1-s ITI across the tone train. Error bars represent standard errors of the means (SEM).
Appendix A.4. Spontaneously Hypertensive Rat - Effect of Sex on Peak Amplitude and Latency
The P1 to the first tone was larger for males (5.61 ± 0.57 µV) than females (3.25 ± 0.57 µV) when preceded by the 5-s ITI (Sex x ITI x Tone, F(2.824, 90.382) = 3.147, p = .032, = 0.090), In addition, while generally females had an earlier-peaking P1 following the 1-s ITI (54.85 ± 5.50 ms ) than 5-s ITI (64.60 ± 5.13 ms, Sex x ITI interaction, F(1, 32) = 4.525, p = .041, = 0.124), this effect did not hold in pairwise comparisons (p = .070). For the N1, although there was a significant Strain x Sex x Tone interaction [F(3.058, 97.855) = 3.405, p = .020, = 0.096] on peak amplitude, no meaningful effects or interactions were detected following pairwise comparisons. No significant effect of sex was observed for N1 peak latency. A significant increase in the P2 from the first to the fourth and fifth tone (1.97 µV and 1.65 µV difference respectively) and from the second to the fourth tone (1.39 µV difference) in the females was observed, while no significant changes were observed in the males across tones (Sex x Tone, F(3.115, 99.669) = 2.654, p = .048, = 0.077). No effect of sex on P2 peak latency N2 peak amplitude or latency was observed.
References
- American Psychiatric Association. (2022). Diagnostic and statistical manual of mental disorders (5th, text rev. ed.). Washington, DC: American Psychiatric Publishing. [CrossRef]
- Danielson, M. L., Claussen, A. H., Bitsko, R. H., Katz, S. M, Newsome, K., Blumberg, S. J., Kogan, M. D., & Reem, G. (2024). ADHD prevalence among US children and adolescents in 2022: diagnosis, severity, co-occurring disorders, and treatment. Journal of Clinical Child & Adolescent Psychology, 53(3), 343-360. [CrossRef]
- Staley, B. S., Robinson, L. R., Claussen, A. H., Katz, S M., B., Danielson, M. L., Summers, A. D., Farr, S. L., Blumberg, S. J., & Tinker, S. C. (2014). Attention-deficit/hyperactivity disorder diagnosis, Treatment, and telehealth use in adults – National center for health statistics rapid surveys system, United States, October-November 2023. Morbidity and Mortality Weekly Report, 73(40), 890-895. [CrossRef]
- Faraone, S. V., Biederman, J., & Mick, E. (2006). The age-dependent decline of attention deficit hyperactivity disorder: A meta-analysis of follow-up studies. Psychological Medicine, 36(2), 159-165. [CrossRef]
- Luo, Y., Weibman, D., Halperin, J. M., & Li, X. (2019). A review of heterogeneity in attention deficit/hyperactivity disorder. Frontiers in Human Neuroscience, 13, 42. [CrossRef]
- Faraone, S. V., & Larsson, H. (2019). Genetics of attention deficit hyperactivity disorder. Molecular Psychiatry, 24, 562-575. [CrossRef]
- Faraone, S. V., Asherson, P., Banaschewski, T., Biederman, J., Buitelaar, J. K., Ramos-Quiroga, J. A., Rhode, L. A., Sonuga-Barke, E. J. S., Tannock, R., & Franke, B. (2015). Attention-deficit/hyperactivity disorder. Nature Reviews Disease Primers, 1, 15020. [CrossRef]
- Faraone, S. V., & Biederman, J. (2016). Can attention-deficit/hyperactivity disorder onset occur in adulthood? JAMA Psychiatry, 73(7), 655-656. [CrossRef]
- Larsson, H., Anckarsater, H., Råstam, M., Chang, Z., & Lichtenstein, P. (2012). Childhood attention-deficit hyperactivity disorder as an extreme of a continuous trait: A quantitative genetic study of 8,500 twin pairs. Journal of Child Psychology and Psychiatry, 53(1), 73-80. [CrossRef]
- Arcos-Burgos, M., Castellanos, F. X., Pineda, D., Lopera, F., Palacio, J. D., Palacio, L. G., Rapoport, J. L., Berg, K., Bailey-Wilson, J. E., & Muenke, M. (2004). Attention-deficit/hyperactivity disorder in a population isolate: Linkage to loci at 4q13. 2, 5q33. 3, 11q22, and 17p11. The American Journal of Human Genetics, 75(6), 998-1014. [CrossRef]
- Arcos-Burgos, M., Jain, M., Acosta, M. T., Shively, S., Stanescu, H., Wallis, D., Domen, S., Vélez, J. I., Karkera, J. D., Balog, J., Berg, K., Kleta, R., Gahl, W., A., Roessler, E., Long, R., Lie, J., Pineda, D., Londoño, A. C., Palacio, J. D., Arbelaez, A., Lopera, F., . . . & Muenke, M. (2010). A common variant of the latrophilin 3 gene, LPHN3, confers susceptibility to ADHD and predicts effectiveness of stimulant medication. Molecular Psychiatry, 15(11), 1053-1066. [CrossRef]
- Jain, M., Palacio, L. G., Castellanos, F. X., Palacio, J. D., Pineda, D., Restrepo, M. I., Muñoz, J. F., Lopera, F., Wallis, D., Berg, K. Bailey-Wilson, J. E., Arcos-Burgos, M., & Muenke, M. (2007). Attention-deficit/hyperactivity disorder and comorbid disruptive behavior disorders: Evidence of pleiotropy and new susceptibility loci. Biological Psychiatry, 61(12), 1329-1339. [CrossRef]
- Ribasés, M., Ramos-Quiroga, J. A., Sanchez-Mora, C., Bosch, R., Richarte, V., Palomar, G., Gastaminza, X., Bielsa, A., Arcos-Burgos, M., Muenke, M., Castellanos, F. X., Cormand, B., Bayés, M., & Casas, M. (2011). Contribution of LPHN3 to the genetic susceptibility to ADHD in adulthood: A replication study. Genes, Brain and Behavior, 10(2), 149-157. [CrossRef]
- Bruxel, E. M., Moreira-Maia, C. R., Akutagava-Martins, G. C., Quinn, T. P., Klein, M., Franke, B., Ribasés, Rovira, P., Sánchez-Mora, C., Kappel, D. B., Mota, N. R., Grevet, E. H., Bau, C. H. D., Arcos-Burgos, M., Rohde, L. A., & Hutz, M. H. (2021). Meta-analysis and systematic review of ADGRL3 (LPHN3) polymorphisms in ADHD susceptibility. Molecular Psychiatry, 26(6), 2277-2285. [CrossRef]
- Andersson, A., Tuvblad, C., Chen, Q., Du Rietz, E., Cortese, S., Kuja-Halkola, R., & Larsson, H. (2020). Research Review: The strength of the genetic overlap between ADHD and other psychiatric symptoms – A systematic review and meta-analysis. Journal of Child Psychology and Psychiatry, 61(11), 1173-1183. [CrossRef]
- Cuthbert, B. N. (2022). Research domain criteria (RDoC): Progress and potential. Current Directions in Psychological Science, 31(2), 107-114. [CrossRef]
- Cuthbert, B. N., & Insel, T. R. (2013). Toward the future of psychiatric diagnosis: The seven pillars of RDoC. BMC Medicine, 11(1), 1-8. [CrossRef]
- Iacono, W. G., Malone, S. M., & Vrieze, S. I. (2017). Endophenotype best practices. International Journal of Psychophysiology, 111, 115-144. [CrossRef]
- Miller, G. A., & Rockstroh, B. (2013). Endophenotypes in psychopathology research: Where do we stand? Annual Review of Clinical Psychology, 9, 177-213. [CrossRef]
- van der Voet, Á., Harich, Á., Franke, Á., & Schenck, A. (2016). ADHD-associated dopamine transporter, latrophilin and neurofibromin share a dopamine-related locomotor signature in Drosophila. Molecular Psychiatry, 21(4), 565-573. [CrossRef]
- Fontana, B. D., Reichmann, F., Tilley, C. A., Lavlou, P., Shkumatava, A., Alnassar, N., Hillman, C., Karlsson, K. A., Norton, W. H. J., & Parker, M. O. (2023). Adgrl3. 1-deficient zebrafish show noradrenaline-mediated externalizing behaviors, and altered expression of externalizing disorder-candidate genes, suggesting functional targets for treatment. Translational Psychiatry, 13, 304. [CrossRef]
- Lange, M., Norton, W., Coolen, M., Chaminade, M., Merker, S., Proft, F., Schmitt, A., Vernier, P., Lesch, K-P., & Bally-Cuif, L. (2012). The ADHD-susceptibility gene lphn3.1 modulates dopaminergic neuron formation and locomotor activity during zebrafish development. Molecular Psychiatry, 17(9), 946-954.
- Lange, M., Froc, C., Grunwald, H., Norton, W. H., & Bally-Cuif, L. (2018). Pharmacological analysis of zebrafish lphn3. 1 morphant larvae suggests that saturated dopaminergic signaling could underlie the ADHD-like locomotor hyperactivity. Progress in Neuro-Psychopharmacology and Biological Psychiatry, 84, 181-189. [CrossRef]
- Sveinsdóttir, H. S., Christensen, C., Þorsteinsson, H., Lavalou, P., Parker, M. O., Shkumatava, A., Norton, W. H. J., Andriambeloson, E., Wagner, S., & Karlsson, K. A. (2023). Novel non-stimulants rescue hyperactive phenotype in an adgrl3. 1 mutant zebrafish model of ADHD. Neuropsychopharmacology, 48(8), 1155-1163. [CrossRef]
- Mortimer, N., Ganster, T., O’Leary, A., Popp, S., Freudenberg, F., Reif, A., Artigas, M. A., Ribasés, M., Ramos-Quiroga, J. A. R., Lesch, K., & Rivero, K. P. (2019). Dissociation of impulsivity and aggression in mice deficient for the ADHD risk gene Adgrl3: Evidence for dopamine transporter dysregulation. Neuropharmacology, 156, 107557. [CrossRef]
- Orsini, C. A., Setlow, B., DeJesus, M., Galaviz, S., Loesch, K., Ioerger, T., & Wallis, D. (2016). Behavioral and transcriptomic profiling of mice null for Lphn3, a gene implicated in ADHD and addiction. Molecular Genetics & Gnomic Medicine, 4(3), 322-343. [CrossRef]
- Wallis, D., H. D., Mendez, I. A., Abbott, L. C., Finnell, R. H., Wellman, P. J., & Setlow, B. (2012). Initial characterization of mice null for Lphn3, a gene implicated in ADHD and addiction. Brain Research, 1463, 85-92. [CrossRef]
- Regan, S. L., Hufgard, J. R., Pitzer, E. M., Sugimoto, C., Hu, Y. C., Williams, M. T., & Vorhees, C. V. (2019). Knockout of latrophilin-3 in Sprague-Dawley rats causes hyperactivity, hyper-reactivity, under-response to amphetamine, and disrupted dopamine markers. Neurobiology of Disease, 130, 104494. [CrossRef]
- Carbajal, M. S., Bounmy, A. J., Harrison, O. B., Nolen, H. G., Regan, S. L., W. M., Williams, M. T., Vorhees, C. V., & Sable, H. J. K. (2023). Impulsive choice in two different rat models of ADHD—Spontaneously hypertensive and Lphn3 knockout rats. Frontiers in Neuroscience, 17, 1084218. [CrossRef]
- González-Barriga, F., & V, O. (2022). Spontaneously hypertensive rats show higher impulsive action, but equal impulsive choice with both positive and aversive consequences. Behavioural Brain Research, 427, 113858. [CrossRef]
- Sable, H. J., Lester, D. B., Potter, J. L., Nolen, H. G., Cruthird, D. M., Estes, L. M., Johnson, A. D., Regan, S. L., & Vorhees, C. V. (2021). An assessment of executive function in two different rat models of attention-deficit hyperactivity disorder: Spontaneously hypertensive versus Lphn3 knockout rats. Genes, Brain and Behavior, 20(8), e12767. [CrossRef]
- Regan, S. L., Pitzer, E. M., Hufgard, J. R., Sugimoto, C., Williams, M. T., & Vorhees, C. V. (2021). A novel role for the ADHD risk gene latrophilin-3 in learning and memory in Lphn3 knockout rats. Neurobiology of Disease, 158, 105456. [CrossRef]
- Picton, T. W., Bentin, S., Berg, P., Donchin, E., Hillyard, S. A., Johnson, R., Miller, G. A., Ritter, W., Ruchkin, D. S., Rugg, M. D., & Taylor, M. J. (2000). Guidelines for using human event-related potentials to study cognition: Recording standards and publication criteria. Psychophysiology, 37(2), 127-152. [CrossRef]
- van Beijsterveldt, C. E. M., & Boomsma, D. I. (1994). Genetics of the human electroencephalogram (EEG) and event-related brain potentials (ERPs): A review. Human Genetics, 94, 319-330. [CrossRef]
- Rosen, A. M., Spellman, T., & Gordon, J. A. (2015). Electrophysiological endophenotypes in rodent models of schizophrenia and psychosis. Biological Psychiatry, 77(12), 1041-1049. [CrossRef]
- Modi, M. E., & Sahin, M. (2017). Translational use of event-related potentials to assess circuit integrity in ASD. Nature Reviews Neurology, 13(3), 160-170. [CrossRef]
- Hauser, M. F., Wiescholleck, V., Colitti-Klausnitzer, J., Bellebaum, C., & Manahan-Vaughan, D. (2019). Event-related potentials evoked by passive visuospatial perception in rats and humans reveal common denominators in information processing. Brain Structure and Functioning, 224, 1583-1597. [CrossRef]
- Sambeth, A., Maes, J. H., Luijtelaar, G. V., Molenkamp, I. B., Jongsma, M. L., & Rijn, C. M. (2003). Auditory event-related potentials in humans and rats: Effects of task manipulation. Psychophysiology, 40(1), 60–68. [CrossRef]
- Sambeth, A., Maes, J. H., Quiroga, R. Q., & Coenen, A. M. (2004). Effects of stimulus repetitions on the event-related potential of hummans and rats. International Journal of Psychophysiology, 53(3), 197–205. [CrossRef]
- Pratt, H. (2012). Sensory ERP components. In S. J. Luck, & E. Kappenman (Eds.), The Oxford Handbook of ERP Components (pp. 98–114). New York: Oxford University Press.
- Näätänen, R., & Picton, T. (1987). The N1 wave of the human electric and magnetic response to sound: A review and an analysis of the component structure. Psychophysiology, 24(4), 375-425. [CrossRef]
- Näätänen, R., Kujala, T., & Winkler, I. (2011). Auditory processing that leads to conscious perception: A unique window to central auditory processing opened by the mismatch negativity and related responses. Psychophysiology, 48(1), 4-22. [CrossRef]
- Barry, R. J., Johnstone, S. J., & Clarke, A. R. (2003). A review of electrophysiology in attention-deficit/hyperactivity disorder: II. Event-related potentials. Clinical Neurophysiology, 114(2), 184-198. [CrossRef]
- Johnstone, S. J., Barry, R. J., & Clarke, A. R. (2013). Ten years on: A follow-up review of ERP research in attention-deficit/hyperactivity disorder. Clinical Neurophysiology, 124(4), 644-657. [CrossRef]
- Kaiser, A., Aggensteiner, P. M., Baumeister, S., Holz, N. E., Banaschewski, T., & Brandeis, D. (2020). Earlier versus later cognitive event-related potentials (ERPs) in attention-deficit/hyperactivity disorder (ADHD): A meta-analysis. Neuroscience & Biobehavioral Reviews, 112, 117-134. [CrossRef]
- Barry, R. J., Clarke, A. R., McCarthy, R., Selikowitz, M., Brown, C. R., & Heaven, P. C. (2009). Event-related potentials in adults with Attention-Deficit/Hyperactivity Disorder: An investigation using an inter-modal auditory/visual oddball task. International Journal of Psychophysiology, 71(2), 124-131. [CrossRef]
- Prox, V., Dietrich, D. E., Zhang, Y., Emrich, H. M., & Ohlmeier, M. D. (2007). Attentional processing in adults with ADHD as reflected by event-related potentials. Neuroscience Letters, 419(3), 236-241. [CrossRef]
- Sable, J. J., Knopf, K. L., Kyle, M. R., Schully, L. T., Brooks, M. M., Parry, K. H., Thompson, I. A., Suna, E. B., Stowe, R., Flink, L. A., & Diamond, R. E. (2013). Attention-deficit hyperactivity disorder reduces automatic attention in young adults. Psychophysiology, 50(3), 308-313. [CrossRef]
- Budd, T. W., Nakamura, T., Fulham, W. R., Todd, J., Schall, U., Hunter, M., Hodgson, D. M., & Michie, P. T. (2013). Repetition suppression of the rat auditory evoked potential at brief stimulus intervals. Brain Research, 1498, 59–68. [CrossRef]
- de Bruin, N. M., Ellenbroek, B. A., Van Schaijk, W. J., Cools, A. R., Coenen, A. M., & Van Luijtelaar, E. L. (2001). Sensory gating of auditory evoked potentials in rats: Effects of repetitive stimulation and the interstimulus interval. Biological Psychology, 55(3), 195–213. [CrossRef]
- Boutros, N. N., Gjini, K., Urbach, H., & Pflieger, M. E. (2011). Mapping repetition suppression of the N100 evoked response to the human cerebral cortex. Biological Psychiatry, 69(9), 883-889. [CrossRef]
- Okamoto, K. A. (1963). Development of a strain of spontaneously hypertensive rats. Japanese Circulation Journal, 27(3), 282-293. [CrossRef]
- Regan, S. L., Williams, M. T., & Vorhees, C. V. (2022). Review of rodent models of attention deficit hyperactivity disorder. Neuroscience & Biobehavioral Reviews, 132, 621-637. [CrossRef]
- Sagvolden, T. (2000). Behavioral validation of the spontaneously hypertensive rat (SHR) as an animal model of attention-deficit/hyperactivity disorder (AD/HD). Neuroscience & Biobehavioral Reviews, 24(1), 31-39. [CrossRef]
- Sagvolden, T., Johansen, E. B., Wøien, G., Walaas, S. I., Storm-Mathisen, J., Bergersen, L. H., Hvalby, O., Jensen, V., Aase, H., Russell, V. A., Killeen, P. R., DasBanerjee, T., Middleton,, F. A., & Faraone, S. V. (2009). The spontaneously hypertensive rat model of ADHD–The importance of selecting the approprite reference strain. Neuropharmacology, 57(7-8), 619-626. [CrossRef]
- Moridera, A., Shinba, T., Yoshi, M., Inoue, M., Azuma, K., Saka, N., Kubo, H., & Mugishima, G. (2020). Auditory event-related potentials to paired stimulation in spontaneously hypertensive rat (SHR) show difference of undulation: Relation to dysfunction of sensory gating in an animal model of attention deficit hyperactivity disorder (ADHD). Japanese Journal of Physiological Psychology and Psychophysiology, 38(1), 4-11. [CrossRef]
- .
- Brewer, L. M., Holdford, M. M., Holloway, Z. R., Sable, J. J., Andrasik, F., & Sable, H. J. K. (2021). Isoflurane effects on the N1 and other long-latency auditory evoked potentials in Wistar rats. Neuroscience Research, 173, 71–79. [CrossRef]
- Fabiani, M., Low, K. A., Wee, E., Sable, J. J., & Gratton, G. (2006). Reduced suppression or labile memory? Mechanisms of inefficient filtering of irrelevant information in older adults. Journal of Cognitive Neuroscience, 18(4), 637-650. [CrossRef]
- Sable, J. J., Low, K. A., Maclin, E. L., & Fabiani, M. (2004). Latent inhibition mediates N1 attenuation to repeating sounds. Psychophysiology, 41(4), 636-642. [CrossRef]
- Posner, M. I., & Petersen, S. E. (1990). The attention system of the human brain. Annual Review of Neuroscience, 13, 25-42. [CrossRef]
- Petersen, S. E., & Posner, M. I. (2012). The attention system of the human brain: 20 years after. Annual Review of Neuroscience, 35, 73-89. [CrossRef]
- Johnson, K. A., Robertson, I. H., Barry, E., Mulligan, A., Dáibhis, A., Daly, M., Watchorn, A., Gill, M., & Bellgrove, M. A. (2008). Impaired conflict resolution and alerting in children with ADHD: Evidence from the Attention Network Task (ANT). Journal of Child Psychology and Psychiatry, 49(12), 1339-1347. [CrossRef]
- Maness, E. B., Burk, J. A., McKenna, J. T., Schiffino, F. L., Strecker, R. E., & McCoy, J. G. (2022). Role of the locus coeruleus and basal forebrain in arousal and attention. Brain Research Bulletin, 188, 47-58. [CrossRef]
- Halperin, J. M., & Schulz, K. P. (2006). Revisiting the role of the prefrontal cortex in the pathophysiology of attention-deficit/hyperactivity disorder. Psychological Bulletin, 132(4), 560. [CrossRef]
- Aston-Jones, G., Rajkowski, J., & Cohen, J. (2000). Locus coeruleus and regulation of behavioral flexibility and attention. Progress in Brain Research, 126, 165-182. [CrossRef]
- Chandler, D. J., Gao, W. J., & Waterhouse, B. D. (2014). Heterogeneous organization of the locus coeruleus projections to prefrontal and motor cortices. Proceedings of the National Academy of Sciences, 111(18), 6816-6821. [CrossRef]
- Berridge, C. W., & Waterhouse, B. D. (2003). The locus coeruleus–noradrenergic system: modulation of behavioral state and state-dependent cognitive processes. Brain Research Reviews, 42(1), 33-84. [CrossRef]
- Sara, S. J. (2009). The locus coeruleus and noradrenergic modulation of cognition. Nature Reviews Neuroscience, 10(3), 211-223. [CrossRef]
- Sara, S. J., & Bouret, S. (2012). Orienting and reorienting: The locus coeruleus mediates cognition through arousal. Neuron, 76(1), 130-141. [CrossRef]
- Waterhouse, B. D., & Navarra, R. L. (2019). The locus coeruleus-norepinephrine system and sensory signal processing: A historical review and current perspectives. Brain Research, 1709, 1-15. [CrossRef]
- Aston-Jones, G., & Cohen, J. D. (2005). Adaptive gain and the role of the locus coeruleus–norepinephrine system in optimal performance. Journal of Comparative Neurology, 493(1), 99-110. [CrossRef]
- Vazey, E. M., Moorman, D. E., & Aston-Jones, G. (2018). Phasic locus coeruleus activity regulates cortical encoding of salience information. Proceedings of the National Academy of Sciences, 115(40), E9439-E9448. [CrossRef]
- Aston-Jones, G., Iba, M., Clayton, E., Rajkowski, J., & Cohen, J. (2007). The locus coeruleus and regulation of behavioral flexibility and attention: Clinical implications. In G. A. Ordway, M. A. Schwartz, & A. Frazer (Eds.), Brain Norepinephrine: Neurobiology and Therapeutics (pp. 196-235). Cambridge University Press. [CrossRef]
- Aboitiz, F., Ossandón, T., Zamorano, F., Palma, B., & Carrasco, X. (2014). Irrelevant stimulus processing in ADHD: Catecholamine dynamics and attentional networks. Frontiers in Psychology, 5(183), 60632. [CrossRef]
- Sergeant, J. (2000). The cognitive-energetic model: an empirical approach to attention-deficit hyperactivity disorder. Neuroscience & Biobehavioral Reviews, 24(1), 7-12. [CrossRef]
- Sergeant, J. (2005). Modeling attention-deficit/hyperactivity disorder: a critical appraisal of the cognitive-energetic model. Biological Psychiatry, 57(11), 1248-1255. [CrossRef]
- Sanders, A. (1983). Towards a model of stress and human performance. Acta Psychologica, 53(1), 61-97. [CrossRef]
- de Villiers, A. S., Russell, V. A., Sagvolden, T., Searson, A., Jaffer, A., & Taljaard, J. J. (1995). β 2 Mediated inhibition of [3 H] dopamine release from nucleus accumbens slices and monoamine levels in a rat model for attention-deficit hyperactivity disorder. Neurochemical Research, 20, 427-433. [CrossRef]
- Russell, V. A. (2002). Hypodopaminergic and hypernoradrenergic activity in prefrontal cortex slices of an animal model for attention-deficit hyperactivity disorder—The spontaneously hypertensive rat. Behavioural Brain Research, 130(1-2), 191-196. [CrossRef]
- Igata, S., Hayashi, T., Itoh, M., Akasu, T., Takano, M., & Ishimatsu, M. (2014). Persistent α1-adrenergic receptor function in the nucleus locus coeruleus causes hyperexcitability in AD/HD model rats. Journal of Neurophysiology, 111(4), 777-786. [CrossRef]
- Qi, R. Li, M., Ma, Y., & Chen, N. (2015). State-dependent changes in auditory sensory gating in different cortical areas in rats. PLoS One, 10(4), e0126684. [CrossRef]
- Rajkowski, J., Kubiak, P., & Aston-Jones, G. (1994). Locus coeruleus activity in monkey: phasic and tonic changes are associated with altered vigilance. Brain Research Bulletin, 35(5-6), 607-616. [CrossRef]
- Yang, M., Logothetis, N. K., & Eschenko, O. (2021). Phasic activation of the locus coeruleus attenuates the acoustic startle response by increasing cortical arousal. Scientific Reports, 11(1), 1409. [CrossRef]
- Ichtchenko, K., Bittner, M. A., Krasnoperov, V., Little, A. R., Chepurny, O., Holz, R. W., & Petrenko, A. G. (1999). A novel ubiquitously expressed α-latrotoxin receptor is a member of the CIRL family of G-protein-coupled receptors. Journal of Biological Chemistry, 274(9), 5491-5498. [CrossRef]
- Sugita, S., Ichtchenko, K., Khvotchev, M., & Südhof, T. C. (1998). α-Latrotoxin receptor CIRL/latrophilin 1 (CL1) defines an unusual family of ubiquitous G-protein-linked receptors: G-protein coupling not required for triggering exocytosis. Journal of Biological Chemistry, 273(49), 32715-32724. [CrossRef]
- Martinez, A. F., Muenke, M., & Arcos-Burgos, M. (2010). From the black widow spider to human behavior: Latrophilins, a relatively unknown class of G protein-coupled receptors, are implicated in psychiatric disorders. American Journal of Medical Genetics Part B: Neuropsychiatric Genetics, 156(1), 1-10. [CrossRef]
- Moreno-Salinas, A. L., Avila-Zozaya, M., Ugalde-Silva, P., Hernández-Guzmán, D. A., Missirlis, F., & Boucard, A. A. (2019). Latrophilins: A neuro-centric view of an evolutionary conserved adhesion G protein-coupled receptor subfamily. Frontiers in Neuroscience, 13, 465743. [CrossRef]
- Sando, R., Jiang, X., & Südhof, T. C. (2019). Latrophilin GPCRs direct synapse specificity by coincident binding of FLRTs and teneurins. Science, 363(6429), eaav7969. [CrossRef]
- Regan, S. L., Cryan, M. T., Williams, M. T., Vorhees, C. V., & Ross, A. E. (2020). Enhanced transient striatal dopamine release and reuptake in Lphn3 knockout rats. ACS Chemical Neuroscience, 11(8), 1171-1177. [CrossRef]
- Sable, H. J., Paige, N. B., Nalan, P. A., Pace, R. L., Hicks, C. B., Regan, S. L., Williams, M. T., Vorhees, C. V., & Lester, D. B. (2025). Phasic dopamine release in two different rat models of attention-deficit/hyperactivity disorder: Spontaneously hypertensive rats (SHR) versus Lphn3 knockout rats. Neuroscience, 567, 150-162. [CrossRef]
- Tachibana, M., Yamamichi, I., Nakae, S., Hirasugi, Y. M., & Mizukoshi, O. (1984). The site of involvement of hypertension within the cochlea: A comparative study of normotensive and spontaneously hypertensive rats. Acta oto-laryngologica, 97(3-4), 257-265. [CrossRef]
- Sui, L., Shusheng, G., Yanzhen, Y., & Qingsong, Y. (2003). Effect of hypertension on hearing function, LDH and ChE of the cochlea in older rats. Current Medical Science, 23, 306-309. [CrossRef]
- Brace, L. R., Kraev, I., Rostron, C. L., Stewart, M. G., Overton, P. G., & Dommett, E. J. (2015). Auditory responses in a rodent model of attention deficit hyperactivity disorder. Brain Research, 1629, 10-25. [CrossRef]
- Simpson, G. V., & Knight, R. T. (1993). Multiple brain systems generating the rat auditory evoked potential. II. Dissociation of auditory cortex and non-lemniscal generator systems. Brain Research, 602(2), 251–262. [CrossRef]
- Russell, W. M., & Burch, R. L. (1959). The Principles of Humane Experimental Technique. Universities Federation for Animal Welfare.
Figure 1.
Average ERP waveforms for KOs and WTs to 5-tone trains following both a 5-s (i.e., long) and 1-s (i.e., short) ITI. Black hollow rectangles indicate the presentation of each 50 ms tone in the train. Black lines show the ERP for the Lphn3 KO rats, while gray lines show the ERP for their WT controls. Solid lines show the 5-s ITI, and the dashed lines show the 1-s ITI. .
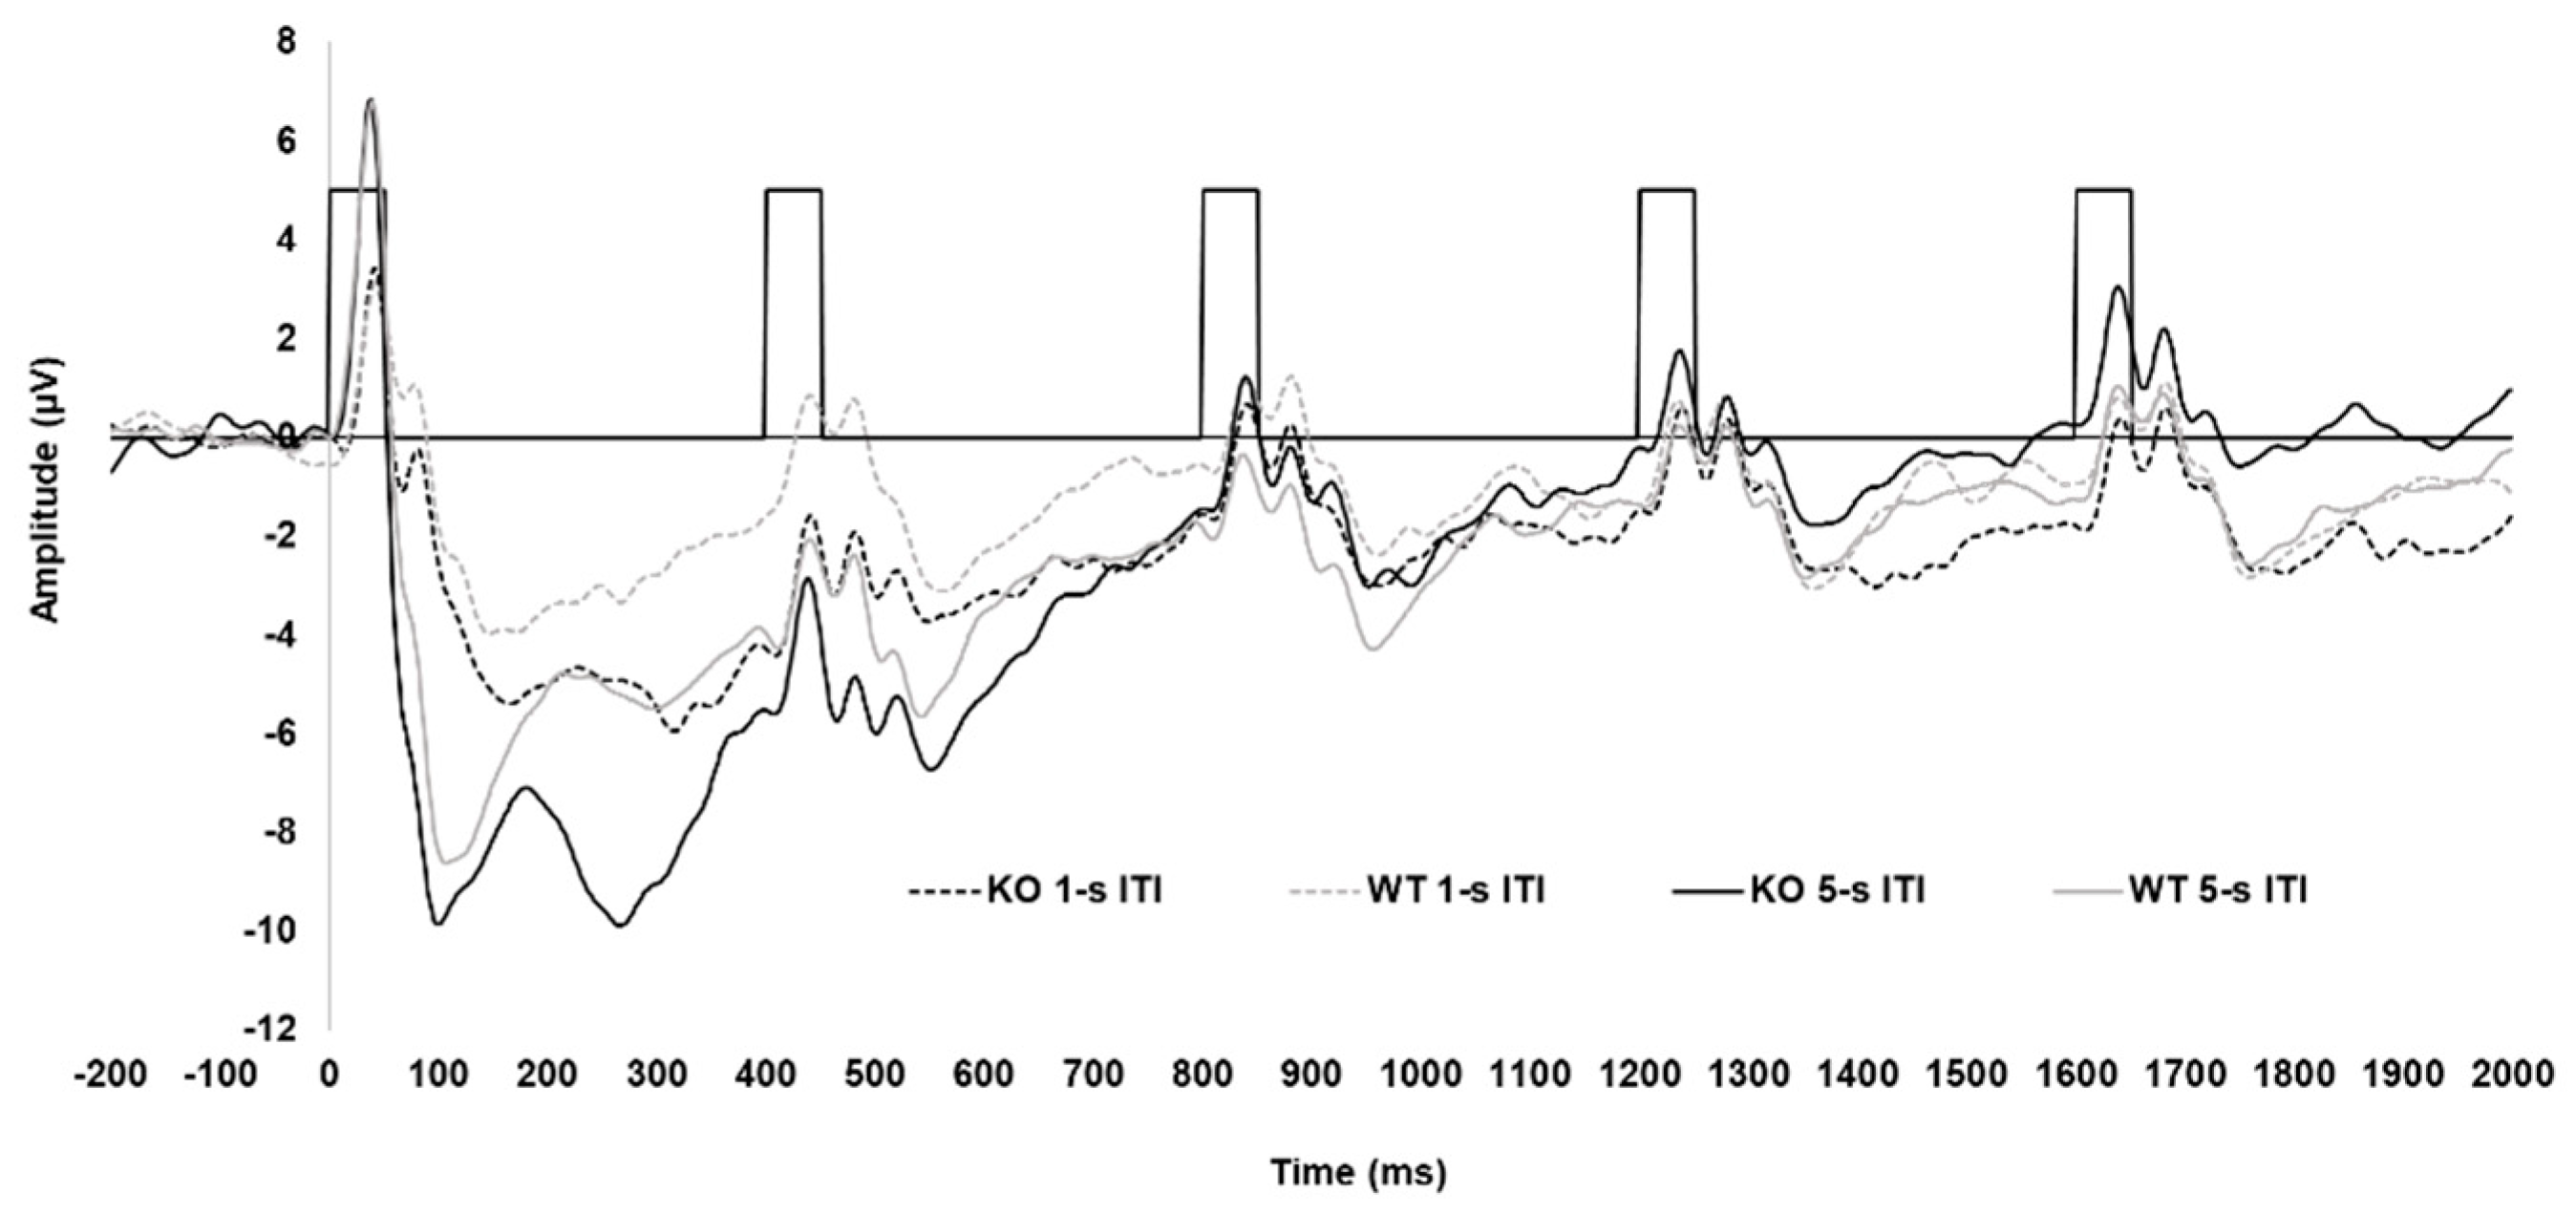
Figure 2.
Peak amplitudes of P1 (A), N1 (B), P2 (C), and N2 (D) for both Lphn3 KOs and WT controls not separated by sex. Black lines represent the KOs, while gray lines represent the WTs. Solid lines show the 5-s ITI, and the dashed lines show the 1-s ITI. Error bars represent standard error of the mean (SEM).
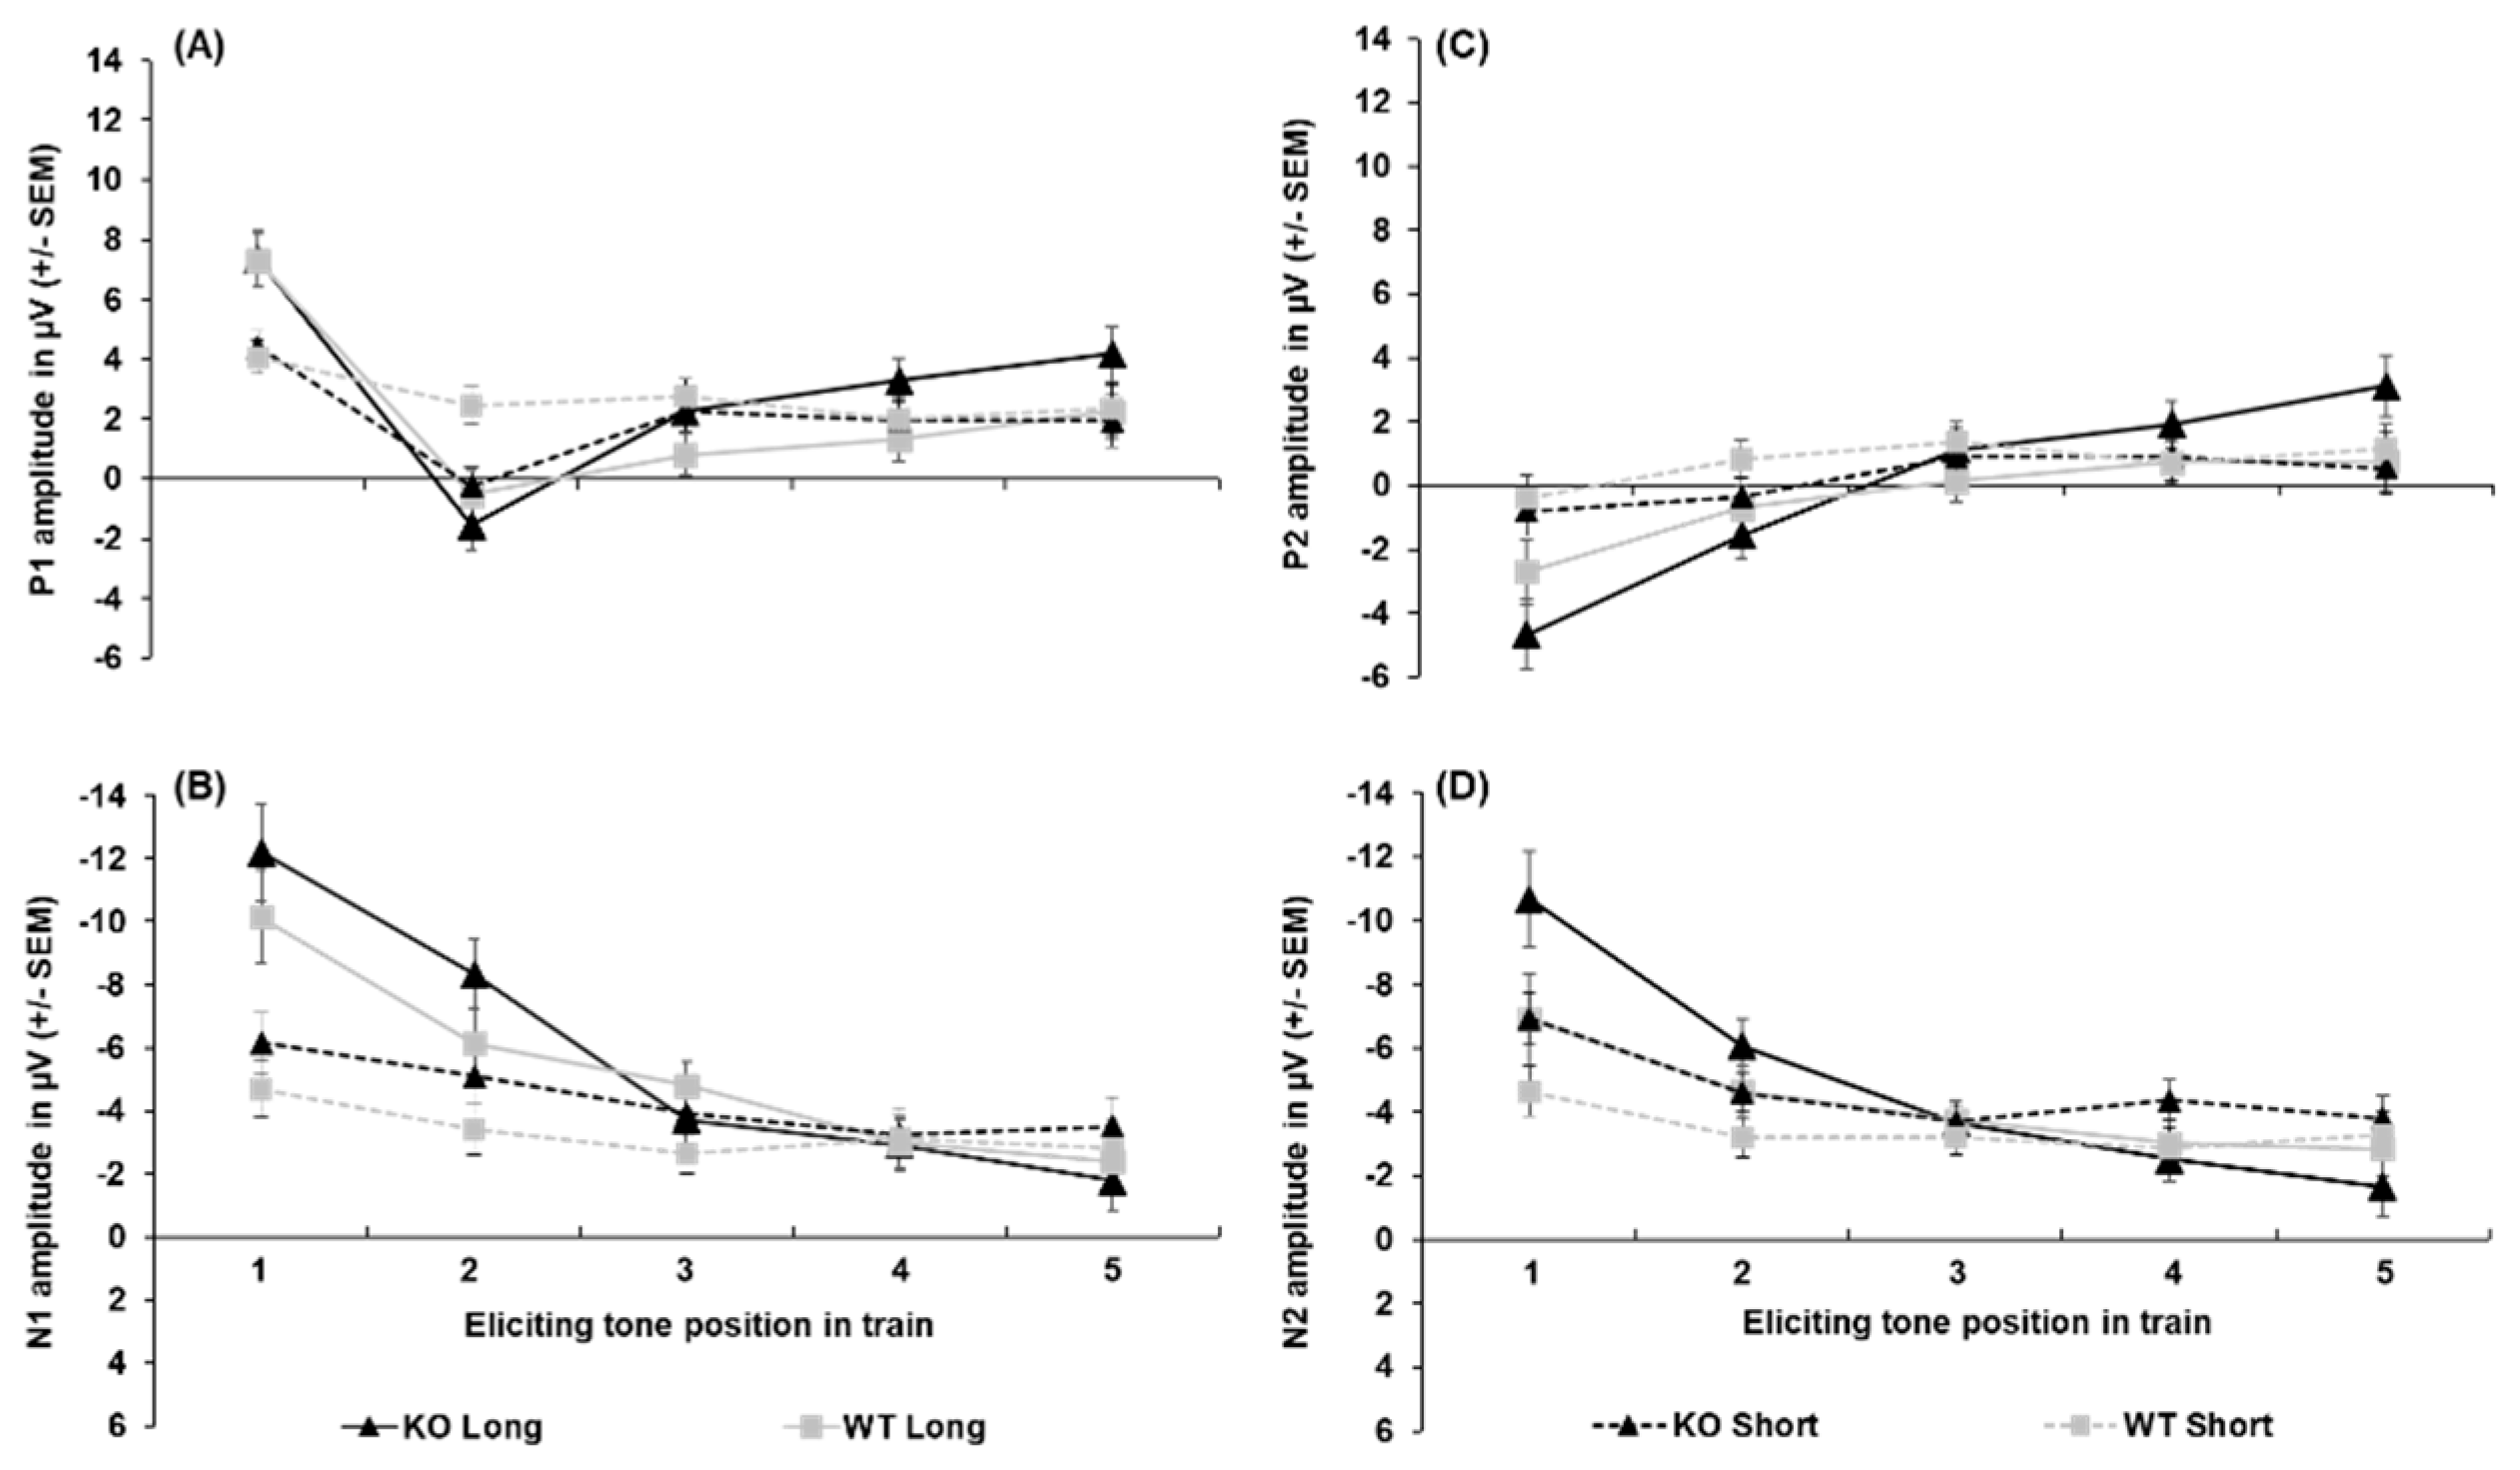
Figure 3.
Average ERP waveforms for SHRs and WKYs to a 5-tone train following both a 5-s (i.e., long) and 1-s (i.e., short) ITI. Black hollow rectangles indicate the presentation of each 50-ms tone in the tone train. Black lines show the ERPs for the SHRs, while gray lines show the ERPs for their WKY controls. Solid lines show the 5-s ITI, and the dashed lines show the 1-s ITI.
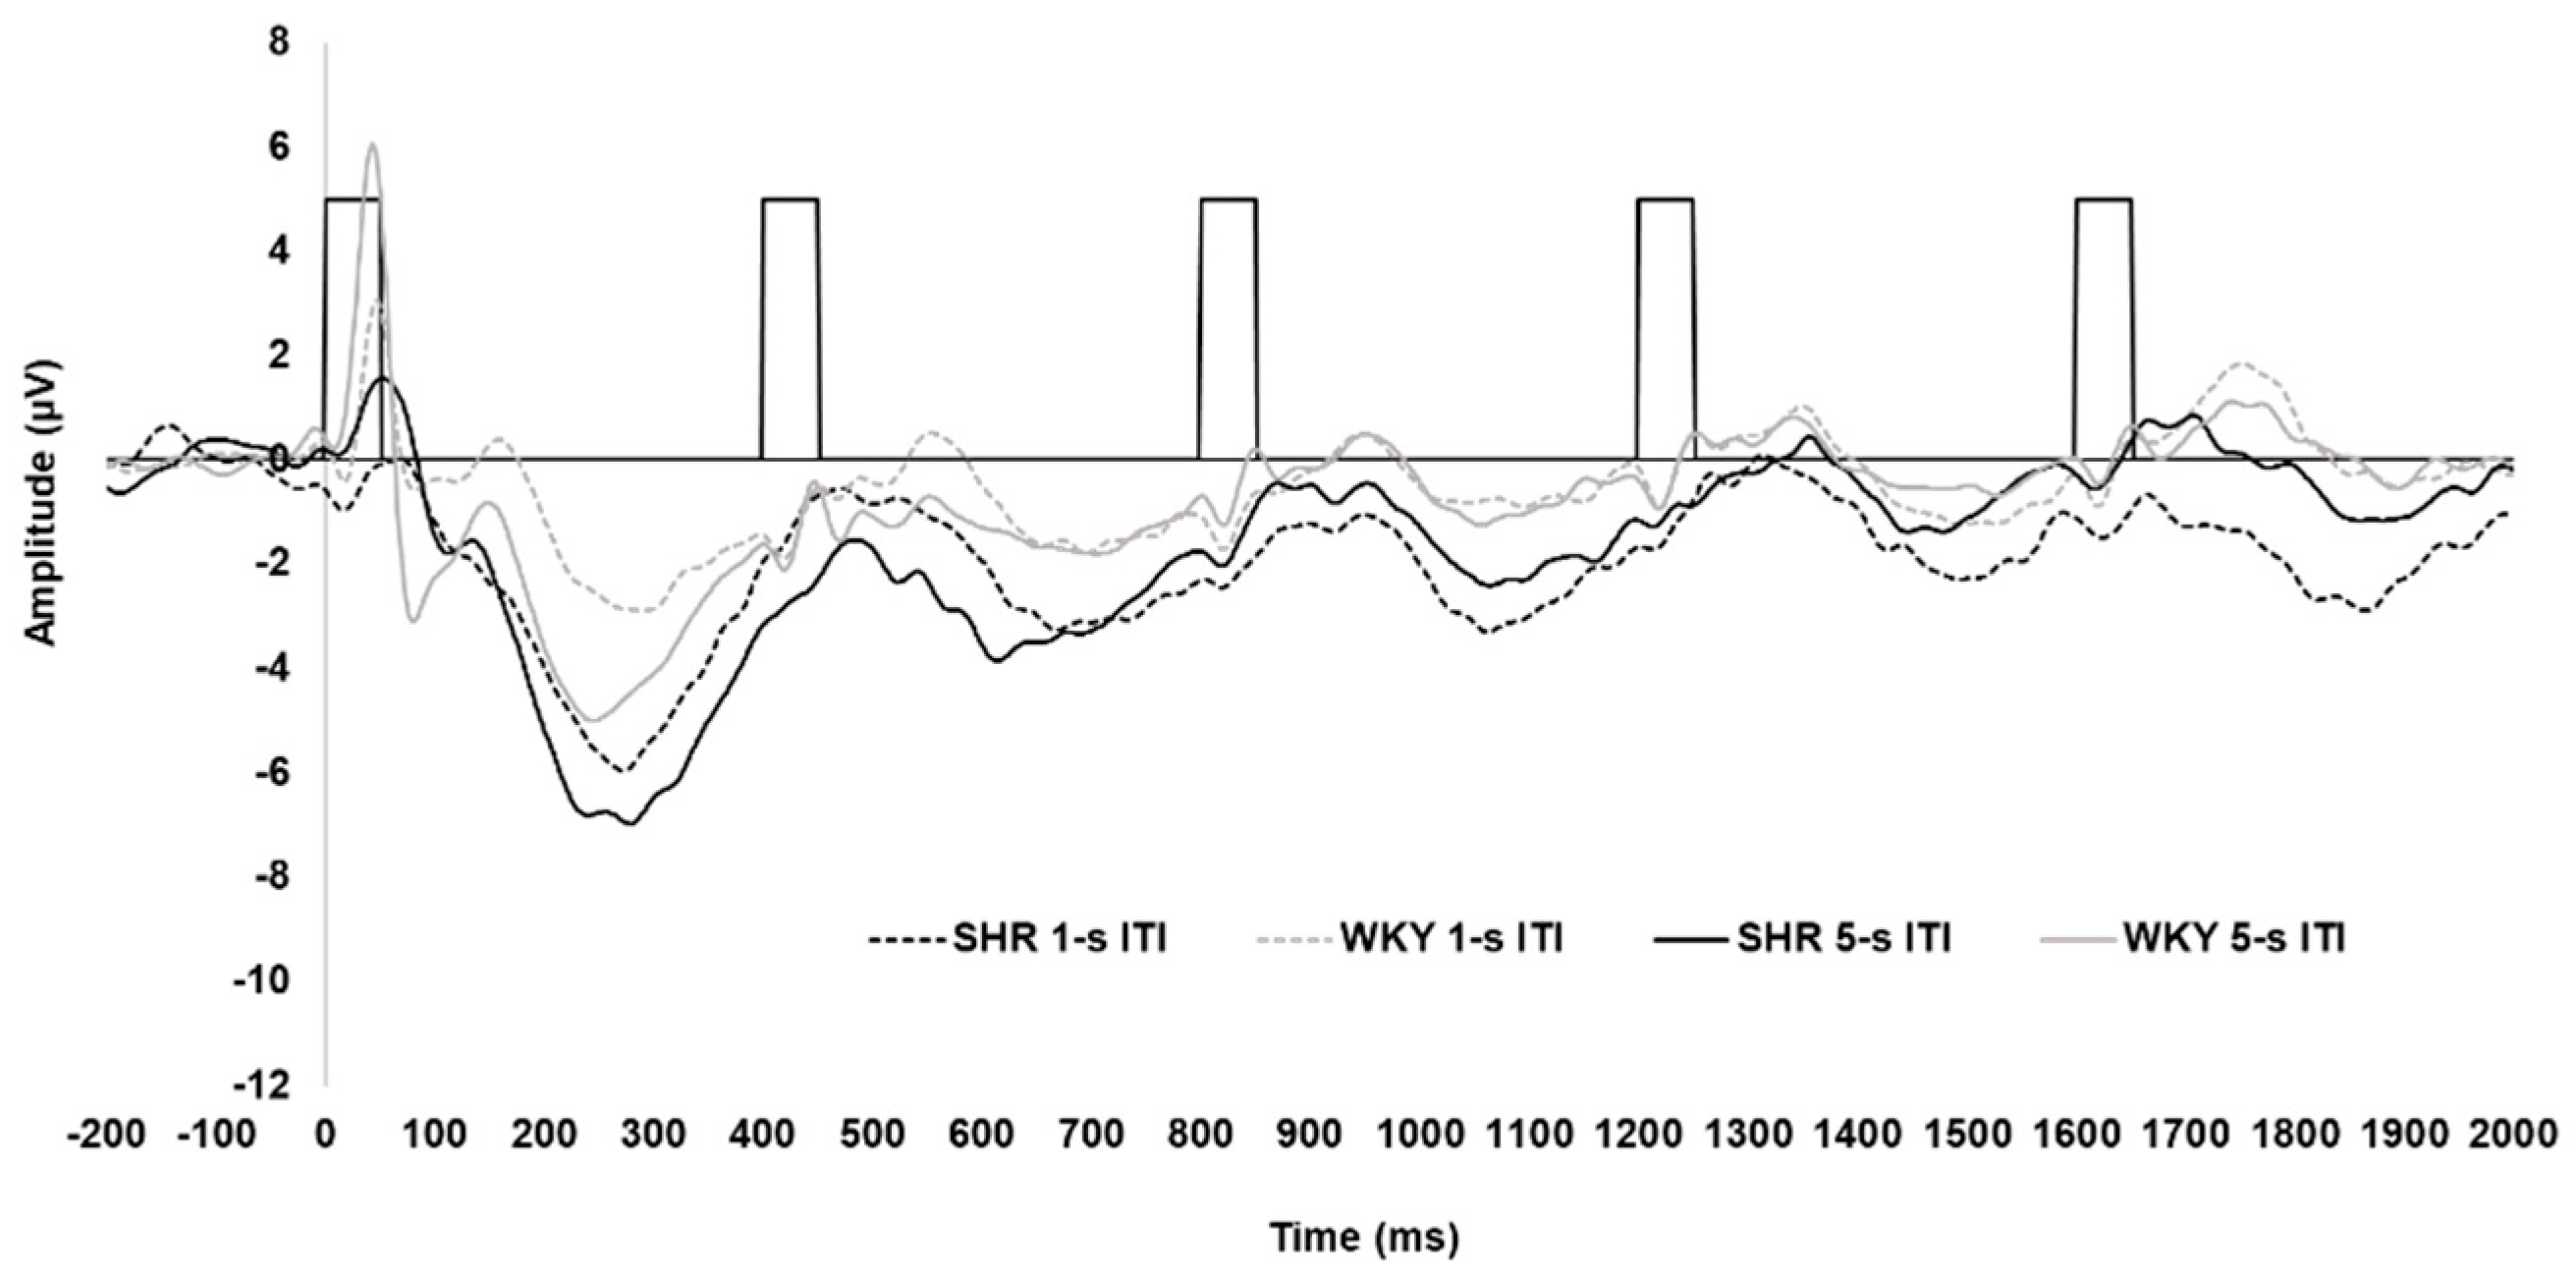
Figure 4.
Peak amplitudes of P1 (A), N1 (B), P2 (C), and N2 (D) for both SHRs and WKY controls not separated by sex. Black lines represent the SHRs, while gray lines represent the WKYs. Solid lines show the 5-s ITI, and the dashed lines show the 1-s ITI across the tone train. Error bars represent standard error of the mean (SEM).
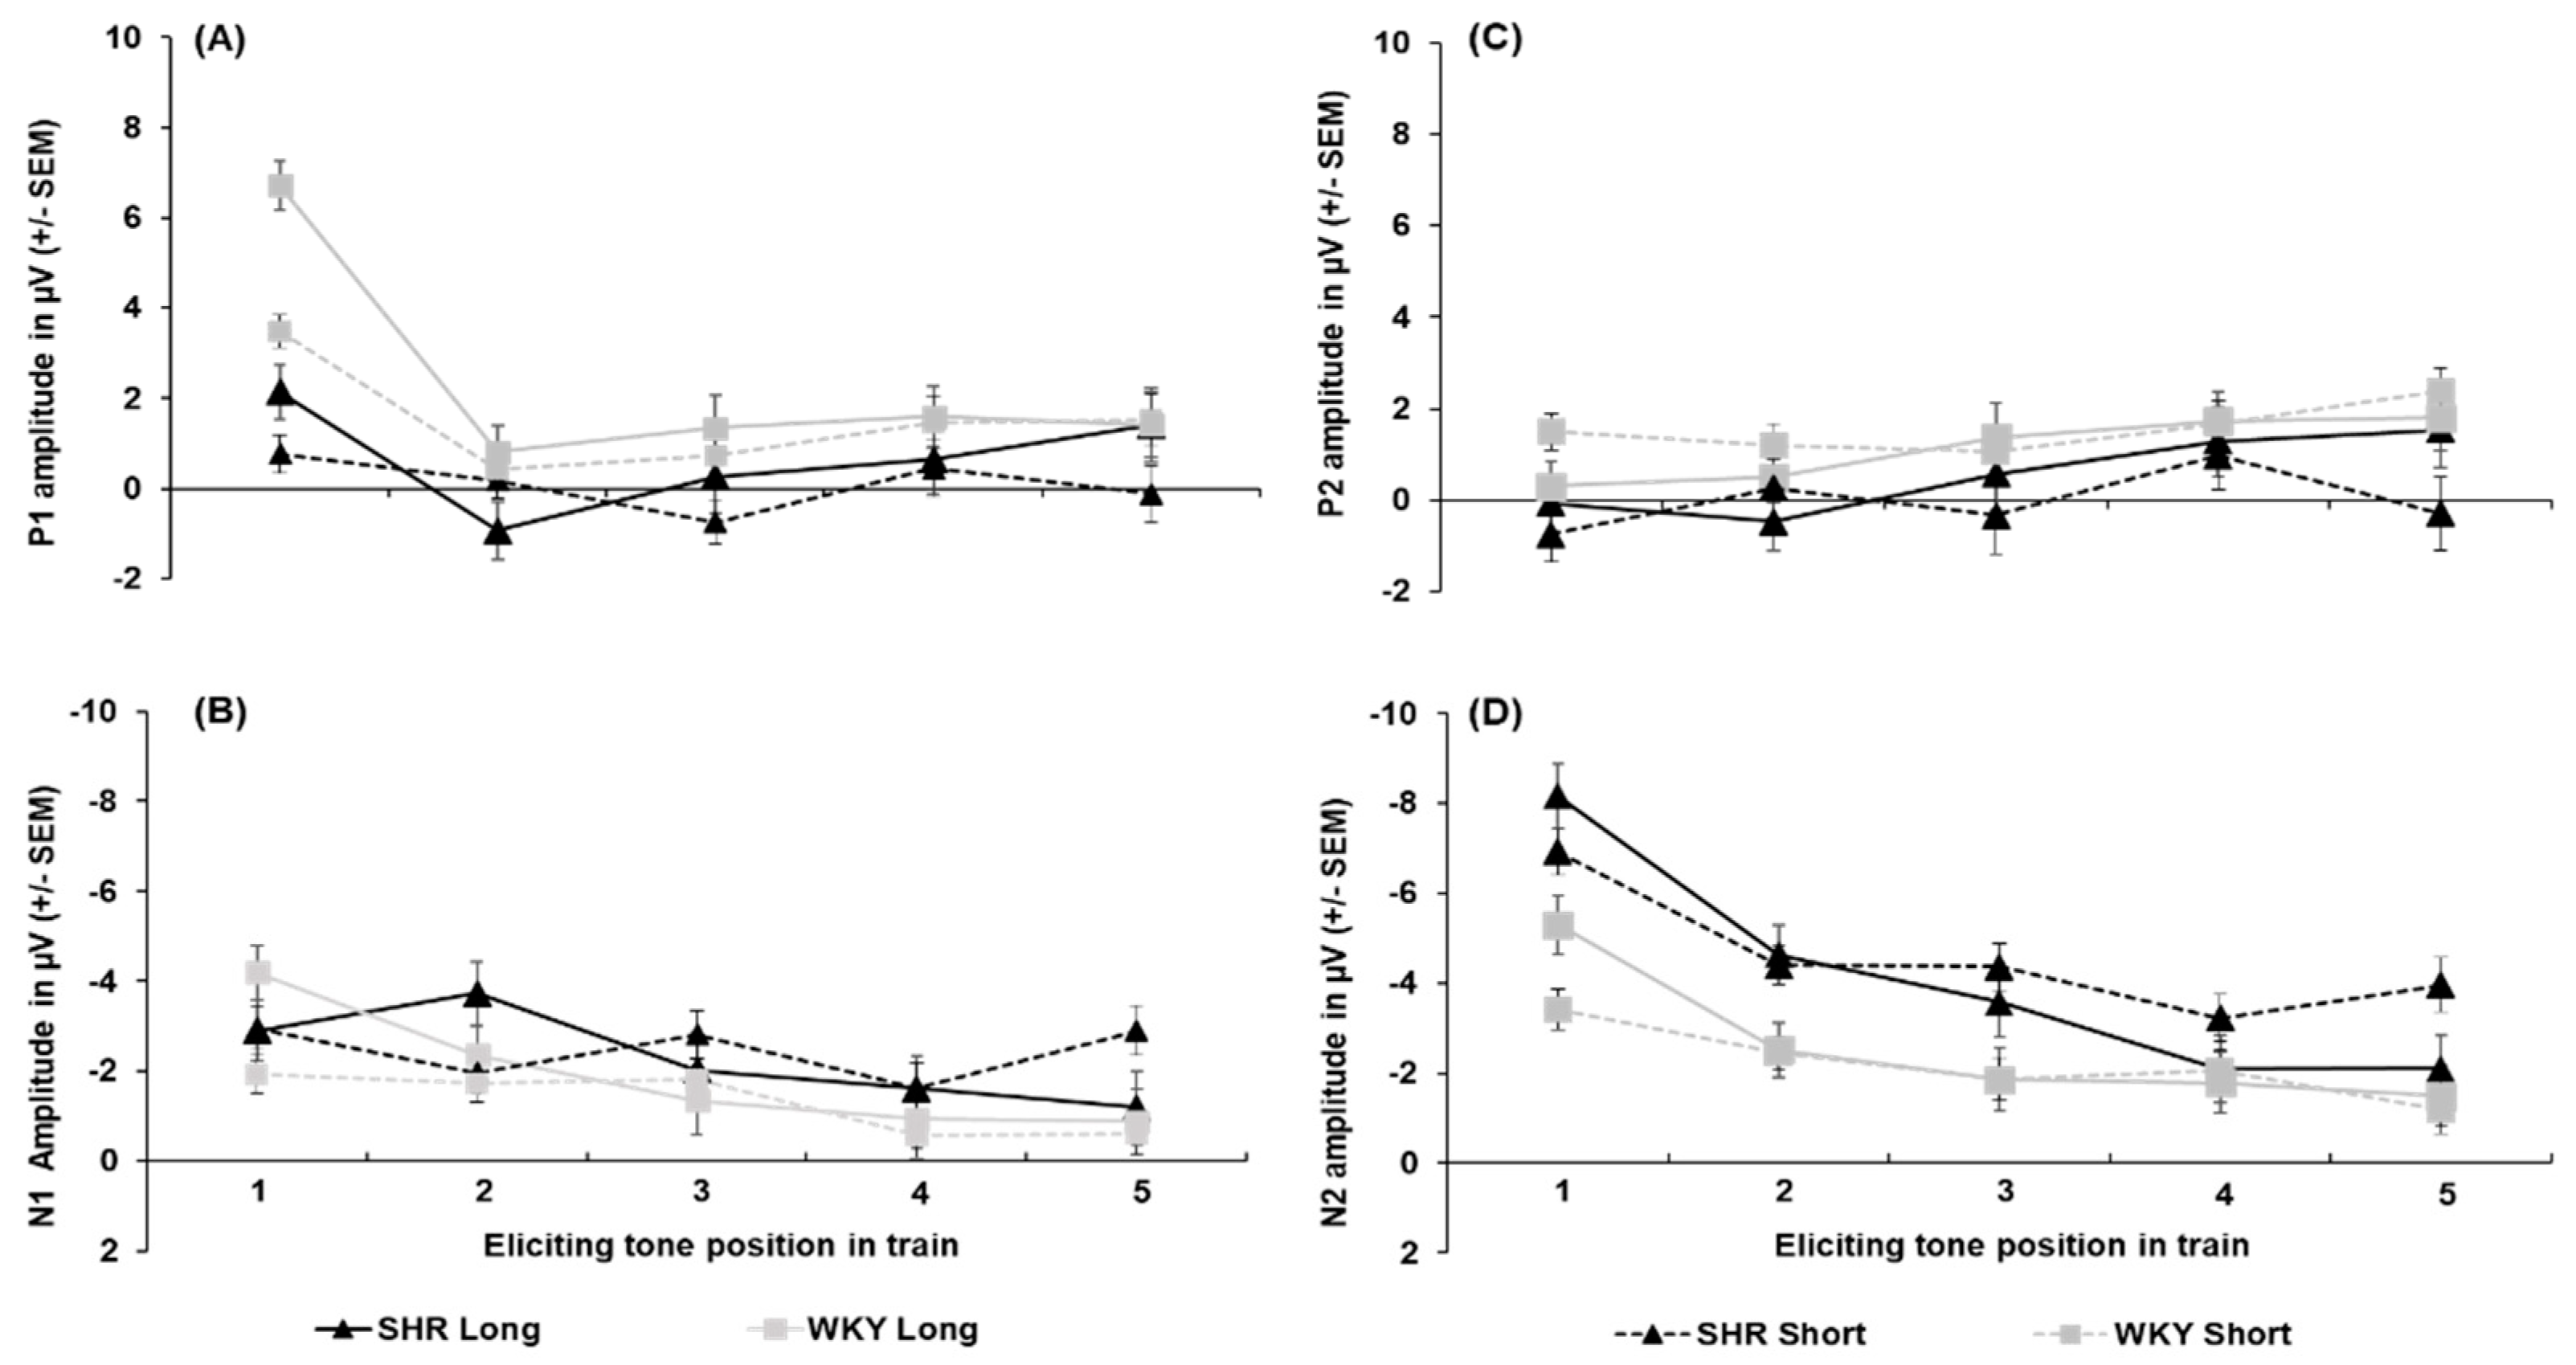
Disclaimer/Publisher’s Note: The statements, opinions and data contained in all publications are solely those of the individual author(s) and contributor(s) and not of MDPI and/or the editor(s). MDPI and/or the editor(s) disclaim responsibility for any injury to people or property resulting from any ideas, methods, instructions or products referred to in the content. |
© 2025 by the authors. Licensee MDPI, Basel, Switzerland. This article is an open access article distributed under the terms and conditions of the Creative Commons Attribution (CC BY) license (http://creativecommons.org/licenses/by/4.0/).
Copyright: This open access article is published under a Creative Commons CC BY 4.0 license, which permit the free download, distribution, and reuse, provided that the author and preprint are cited in any reuse.


